Embed Size (px)
Citation preview
0
Millers River
Watershed Council, Inc. 100 Main Street, Athol, MA 01331
978-248-9491 [email protected]
MRWC Stream Temperature Monitoring Program
2013-14 Data-Logger Report
Prepared by:
Keith Davies, Projects Coordinator
with
Ivan Ussach, MRWC Coordinator
1/22/15
1
Table of Contents:
1. Executive Summary 2
2. Introduction, Purpose 3
3. Approach 4
4. Procedures, QC, Equipment 5
5. Sampling sites 6
6. Results: Stream Temperature Profiles 8
7. Data interpretation 17
8. Evaluation and Future efforts 18
Appendices
1. Summer Weather notes 19
2
Executive Summary
Tributary streams are critical to the health of rivers and their watersheds. In the fall of 2013, MRWC deployed 18 data loggers that record stream temperatures at set intervals as a means to begin to generate a long-term broad based record of stream temperatures across the basin. Such detailed water quality data is useful in assessing stream health, especially in an era of acknowledged climate change. This effort broadens the work done in MRWC’s monitoring program: TribWatch, which has the goal of collecting stream data from all named streams in the watershed. Having stream data at this level of detail offers a scope of information quite useful to scientists who model climate change and watershed managers who work at regional scales. TribWatch started with volunteer temperature sampling and sees data logging as an added step, not a replacement. Regular, on site visits by volunteers provides a beneficial eyes and ears network that probes do not. In the fall of 2014, MRWC retrieved and downloaded data from these 18 data loggers. Though temperatures varied somewhat from stream to stream, similar seasonal temperature profiles were noted. July was the warmest month, with a number of the sampled streams tipping above 20 degree C (68 F), the cold water fishery threshold. A few streams did hold under this level. MRWC plans to provide our data to the NorEast Climate Change Monitoring Network for detailed review. MRWC redeployed 8 probes for another year of stream temperature data logging. Deployment and retrieval went well, MRWC rates this first season as a success.
3
Introduction/Purpose
“Aquatic ecosystems are vulnerable to climate change. Predicted changes in timing, frequency, and duration of precipitation events, more intense storms, a shift from winter snow to rain, more frequent and longer summer droughts, and increases in temperature trends and extreme high temperatures will affect both lotic (flowing water) and lentic (still water) habitats. Water quality and quantity are expected to be adversely affected by predicted increased temperature, drought, an increase in the number of extreme heat days, and a decrease in summer precipitation.”
Source: Massachusetts Climate Change Adaptation Report, Sept. 2011, MA Executive Office of Energy and Environmental Affairs, p. 42
One of MRWC’s major roles of watershed stewardship is monitoring the health of rivers and streams in the basin. Long term monitoring provides key trending information which is most useful in climate modeling and stewardship planning. MRWC’s TribWatch program hopes to provide such information to scientists. One long term issue this data will help evaluate is the effects of climate change. Climate change is a complex issue that requires careful and long-term study. The use of data loggers distributed across the basin offers additional tools to expand the study of stream temperatures. Climate change has the potential to affect the nearly 400 square-mile Millers River watershed. Whatever its causes, long-term monitoring is needed to identify budding impacts and inform stewardship of sensitive areas and species that may need attention. Baseline data, collected over many years, is needed to inform watershed managers and stakeholders of changing stream conditions of concern. In the fall of 2013 MRWC deployed hobo pendant data loggers for long-term stream temperature monitoring. Eleven (11) months later, MRWC retrieved data for review. MRWC has determined that a mix of approaches best serves our mission and will continue to use both weekly volunteer and data logger monitoring. This report focuses on the data logger results which can be referenced by our second season of volunteer efforts in 2014. A separate report for our 2014 summer volunteer monitoring is available which cover many other streams.
4
Approach
MRWC reviewed a MassDEP list of all streams in the watershed and the available data for each to determine the distribution of temperature monitoring sites. The size/area, length, flow, nearby USGS flow gages, and access to a stream were considered. For climate modeling a wide distribution of probes seemed prudent. It would be useful to have temperature data from most of the named streams in the basin, but this may not be possible on a yearly basis without large numbers of data loggers and the man power to care for them. Data loggers are often deployed by MassDEP in spring through fall, but for climate change modeling they need to be deployed year round. Data can show when ice over and ice out times happen over the calendar year, year to year, which is most useful. MRWC began the project in the fall of 2013 with 18 probes at 17 streams. A wide distribution of sites, across the entire basin was achieved. Probes were checked prior to deployment, installed, checked after the winter, and retrieved/downloaded 11 months later. MRWC used NIST traceable digital thermometers to QC them prior to deployment. MRWC determined that this approach would provide a reliable dataset from which to identify basic temperature issues and trends over time. The data collected should provide good data for regional scientists and public review.
5
Procedures/QC/Equipment
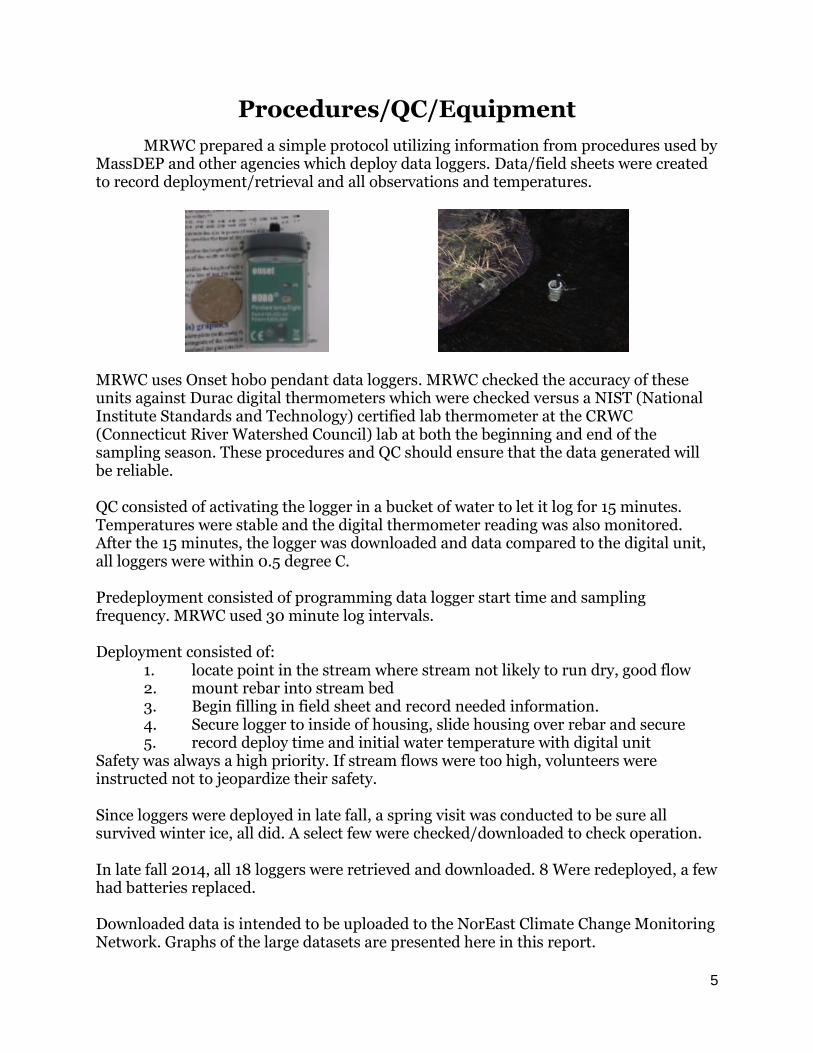
MRWC prepared a simple protocol utilizing information from procedures used by MassDEP and other agencies which deploy data loggers. Data/field sheets were created to record deployment/retrieval and all observations and temperatures.
MRWC uses Onset hobo pendant data loggers. MRWC checked the accuracy of these units against Durac digital thermometers which were checked versus a NIST (National Institute Standards and Technology) certified lab thermometer at the CRWC (Connecticut River Watershed Council) lab at both the beginning and end of the sampling season. These procedures and QC should ensure that the data generated will be reliable. QC consisted of activating the logger in a bucket of water to let it log for 15 minutes. Temperatures were stable and the digital thermometer reading was also monitored. After the 15 minutes, the logger was downloaded and data compared to the digital unit, all loggers were within 0.5 degree C. Predeployment consisted of programming data logger start time and sampling frequency. MRWC used 30 minute log intervals. Deployment consisted of:
1. locate point in the stream where stream not likely to run dry, good flow 2. mount rebar into stream bed 3. Begin filling in field sheet and record needed information. 4. Secure logger to inside of housing, slide housing over rebar and secure 5. record deploy time and initial water temperature with digital unit
Safety was always a high priority. If stream flows were too high, volunteers were instructed not to jeopardize their safety. Since loggers were deployed in late fall, a spring visit was conducted to be sure all survived winter ice, all did. A select few were checked/downloaded to check operation. In late fall 2014, all 18 loggers were retrieved and downloaded. 8 Were redeployed, a few had batteries replaced. Downloaded data is intended to be uploaded to the NorEast Climate Change Monitoring Network. Graphs of the large datasets are presented here in this report.
6
2014 Sampling Sites
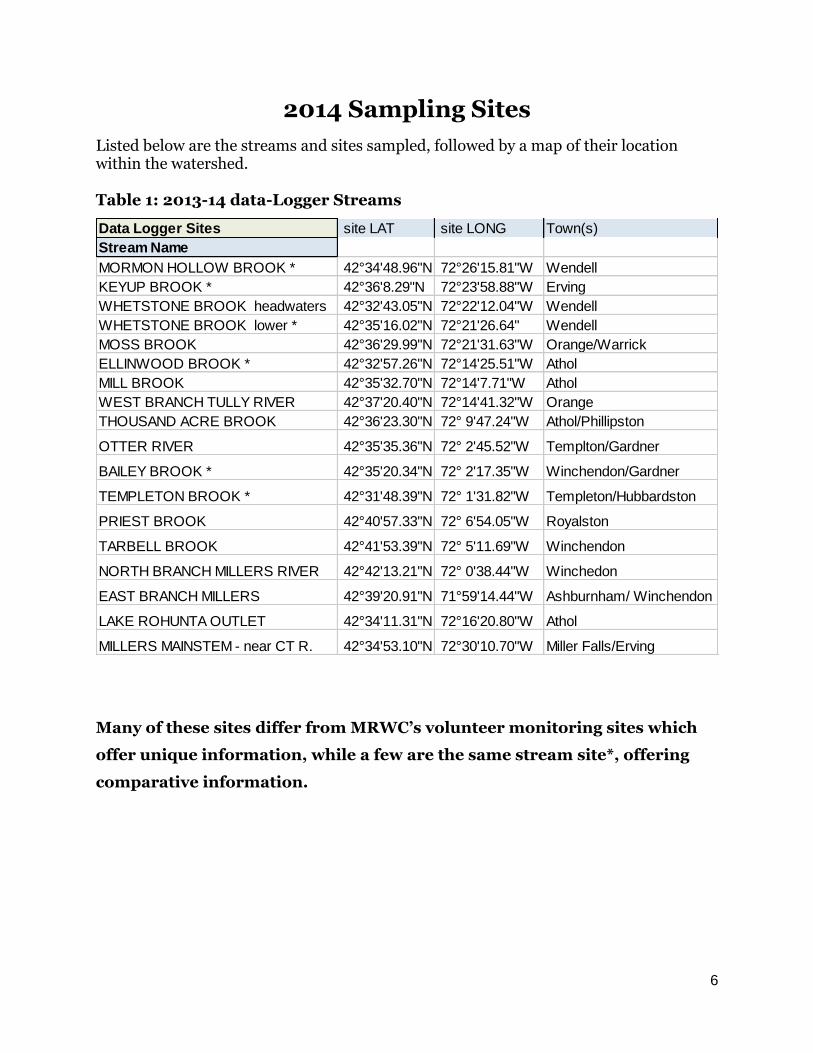
Listed below are the streams and sites sampled, followed by a map of their location within the watershed. Table 1: 2013-14 data-Logger Streams
Many of these sites differ from MRWC’s volunteer monitoring sites which
offer unique information, while a few are the same stream site*, offering
comparative information.
Data Logger Sites site LAT site LONG Town(s)
Stream Name
MORMON HOLLOW BROOK * 42°34'48.96"N 72°26'15.81"W Wendell
KEYUP BROOK * 42°36'8.29"N 72°23'58.88"W Erving
WHETSTONE BROOK headwaters 42°32'43.05"N 72°22'12.04"W Wendell
WHETSTONE BROOK lower * 42°35'16.02"N 72°21'26.64" Wendell
MOSS BROOK 42°36'29.99"N 72°21'31.63"W Orange/Warrick
ELLINWOOD BROOK * 42°32'57.26"N 72°14'25.51"W Athol
MILL BROOK 42°35'32.70"N 72°14'7.71"W Athol
WEST BRANCH TULLY RIVER 42°37'20.40"N 72°14'41.32"W Orange
THOUSAND ACRE BROOK 42°36'23.30"N 72° 9'47.24"W Athol/Phillipston
OTTER RIVER 42°35'35.36"N 72° 2'45.52"W Templton/Gardner
BAILEY BROOK * 42°35'20.34"N 72° 2'17.35"W Winchendon/Gardner
TEMPLETON BROOK * 42°31'48.39"N 72° 1'31.82"W Templeton/Hubbardston
PRIEST BROOK 42°40'57.33"N 72° 6'54.05"W Royalston
TARBELL BROOK 42°41'53.39"N 72° 5'11.69"W Winchendon
NORTH BRANCH MILLERS RIVER 42°42'13.21"N 72° 0'38.44"W Winchedon
EAST BRANCH MILLERS 42°39'20.91"N 71°59'14.44"W Ashburnham/ Winchendon
LAKE ROHUNTA OUTLET 42°34'11.31"N 72°16'20.80"W Athol
MILLERS MAINSTEM - near CT R. 42°34'53.10"N 72°30'10.70"W Miller Falls/Erving
7
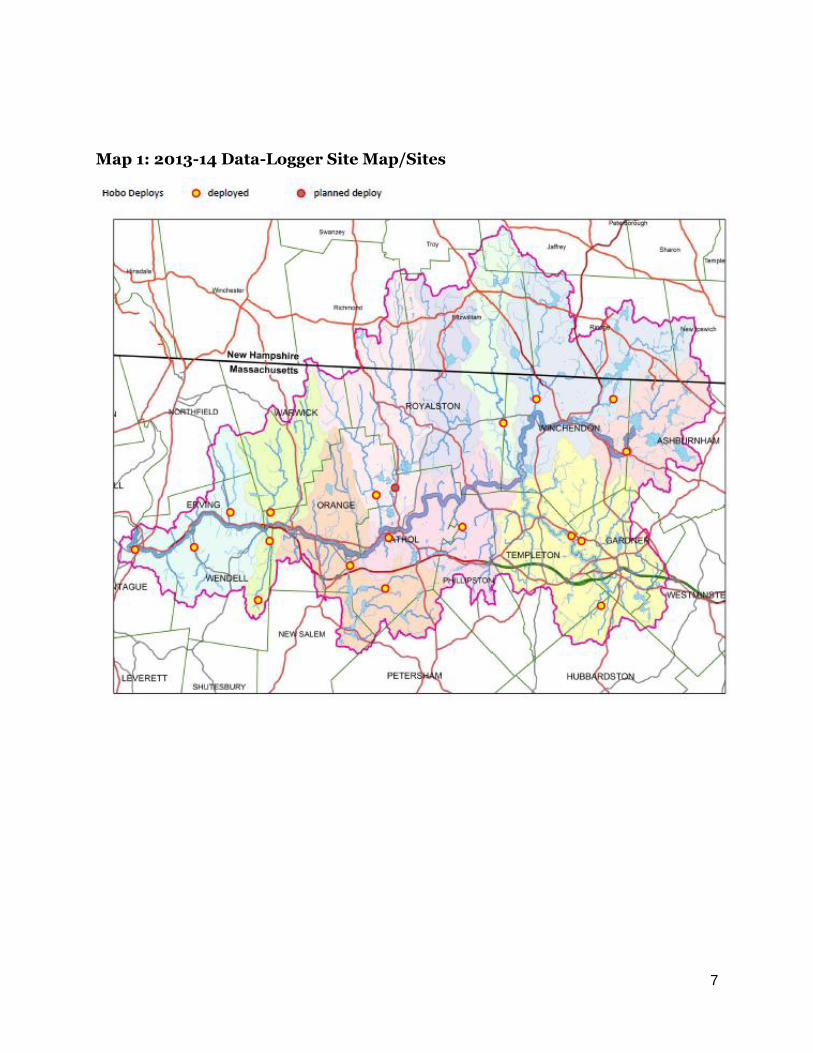
Map 1: 2013-14 Data-Logger Site Map/Sites
8
Results: Stream Temperature Profiles
Data for streams are presented for individual streams. All temperatures are in
Centigrade. Note the similar curve profiles for the stream data. This indicates data
comparability and consistency.
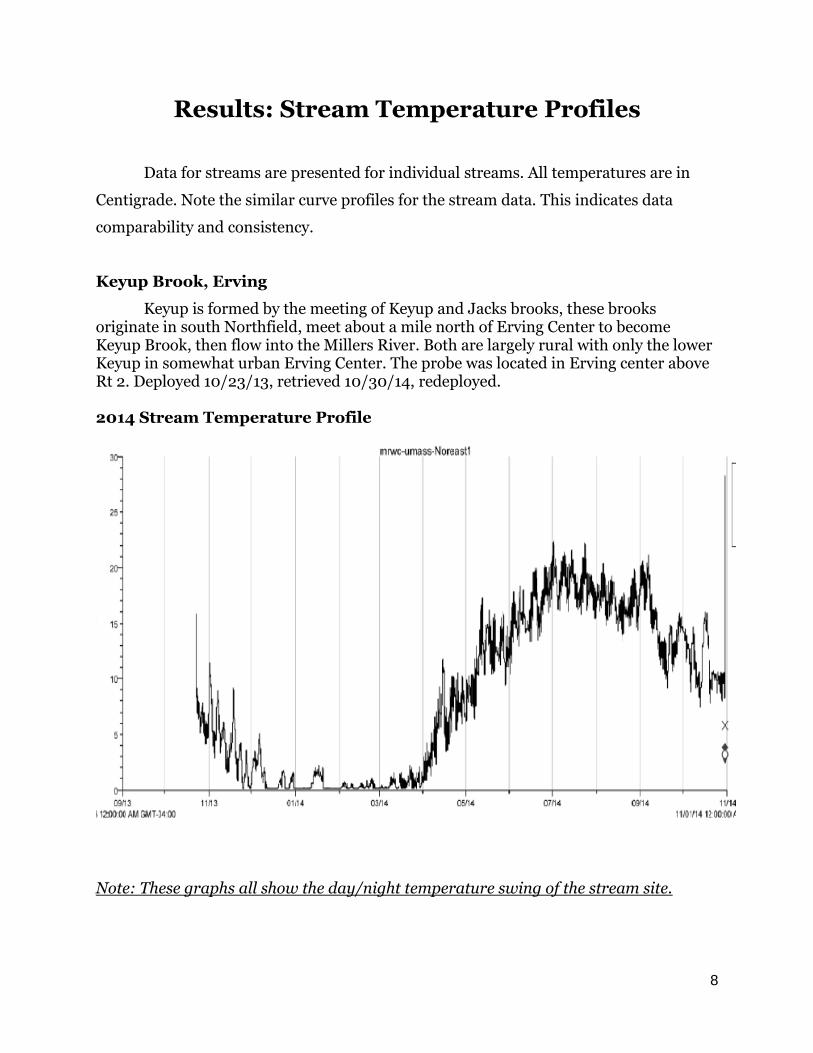
Keyup Brook, Erving
Keyup is formed by the meeting of Keyup and Jacks brooks, these brooks originate in south Northfield, meet about a mile north of Erving Center to become Keyup Brook, then flow into the Millers River. Both are largely rural with only the lower Keyup in somewhat urban Erving Center. The probe was located in Erving center above Rt 2. Deployed 10/23/13, retrieved 10/30/14, redeployed. 2014 Stream Temperature Profile
Note: These graphs all show the day/night temperature swing of the stream site.
9
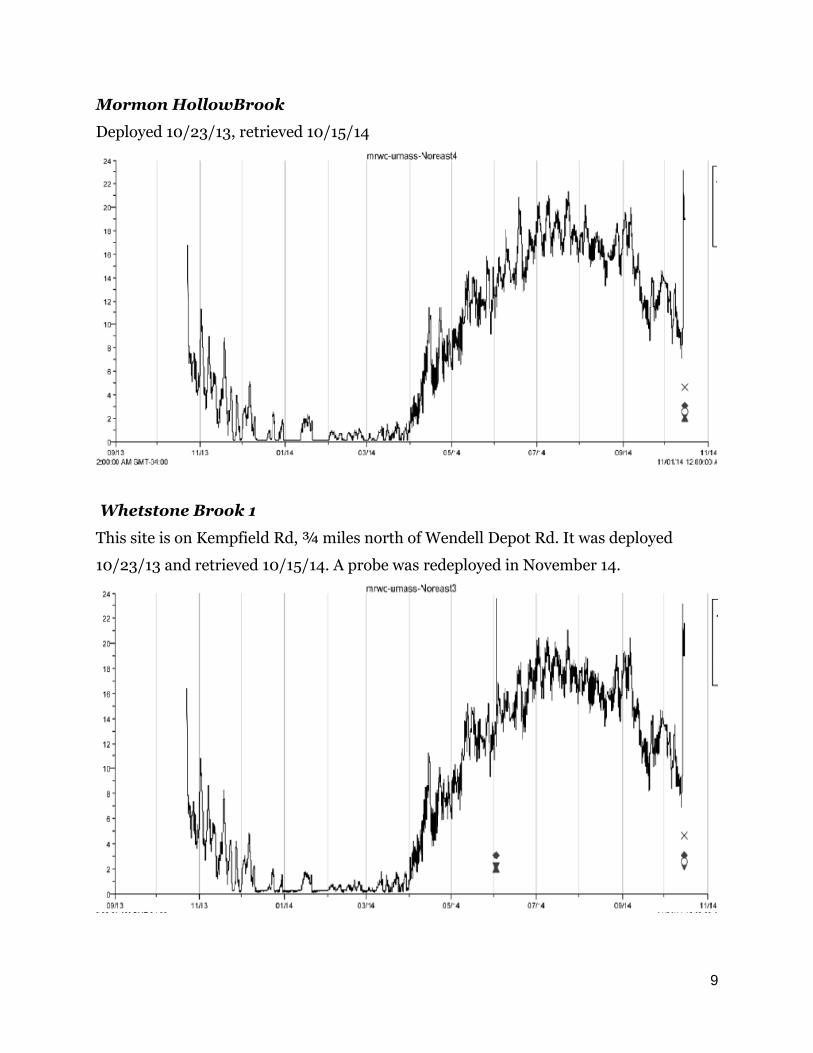
Mormon HollowBrook
Deployed 10/23/13, retrieved 10/15/14
Whetstone Brook 1
This site is on Kempfield Rd, ¾ miles north of Wendell Depot Rd. It was deployed
10/23/13 and retrieved 10/15/14. A probe was redeployed in November 14.
10
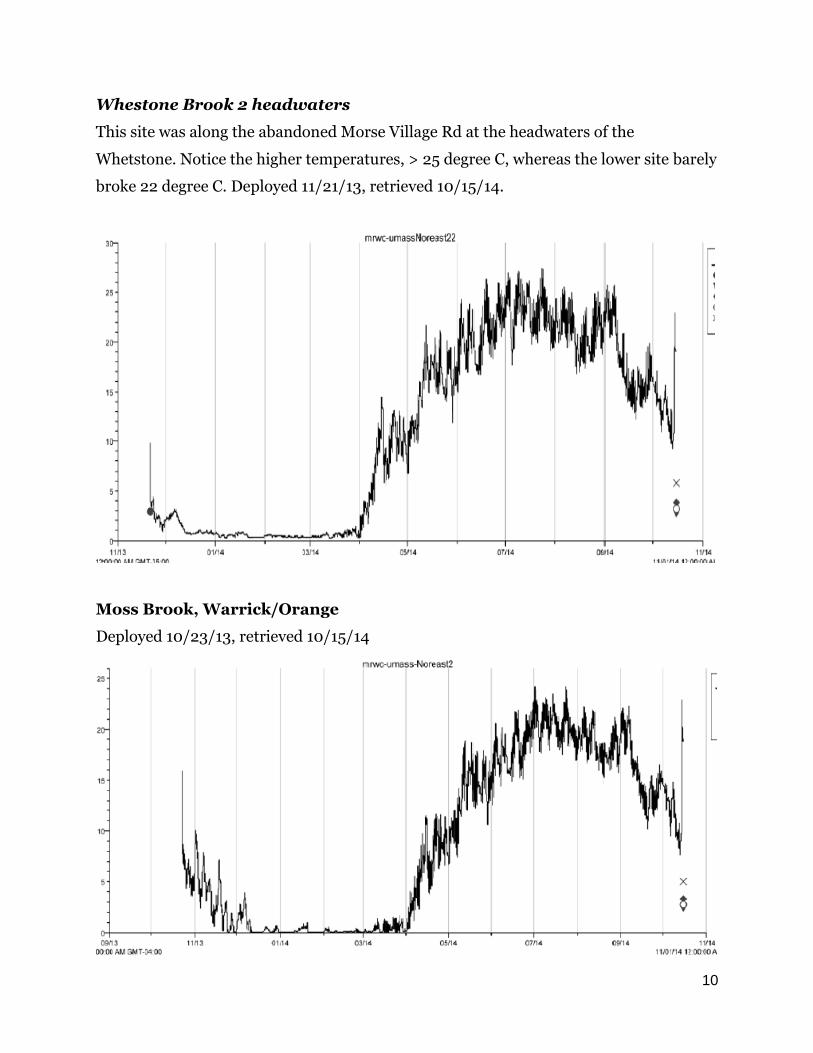
Whestone Brook 2 headwaters
This site was along the abandoned Morse Village Rd at the headwaters of the
Whetstone. Notice the higher temperatures, > 25 degree C, whereas the lower site barely
broke 22 degree C. Deployed 11/21/13, retrieved 10/15/14.
Moss Brook, Warrick/Orange
Deployed 10/23/13, retrieved 10/15/14
11
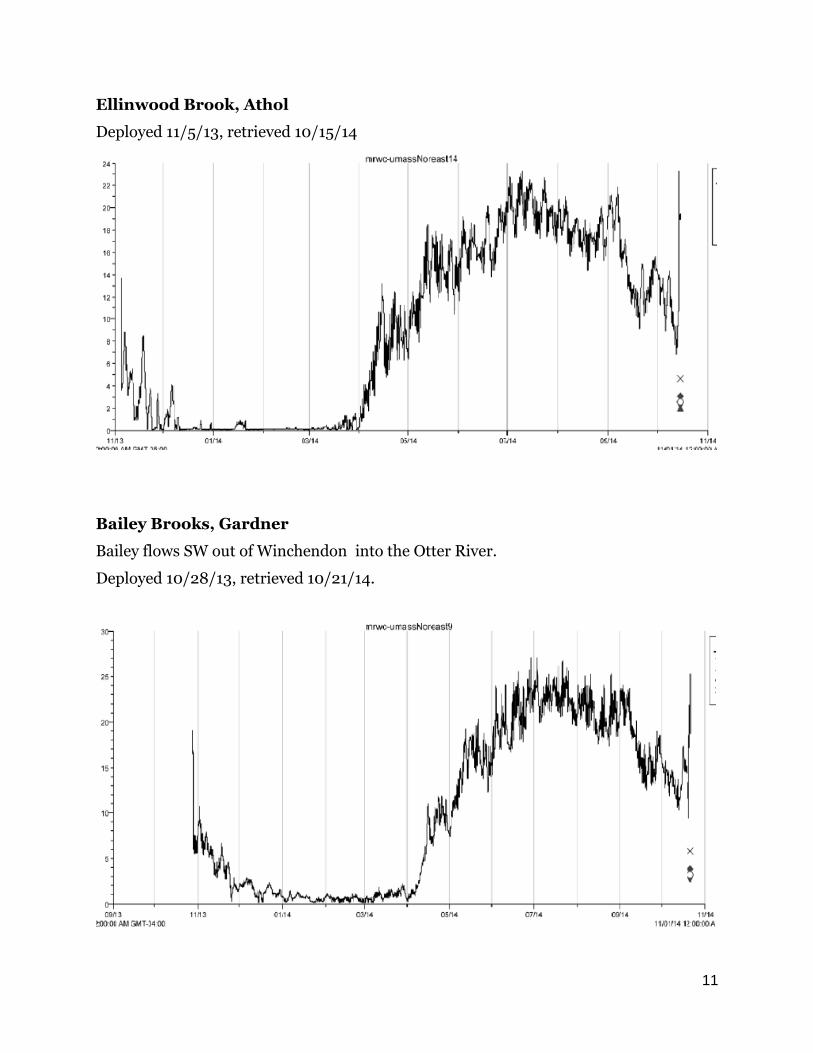
Ellinwood Brook, Athol
Deployed 11/5/13, retrieved 10/15/14
Bailey Brooks, Gardner
Bailey flows SW out of Winchendon into the Otter River.
Deployed 10/28/13, retrieved 10/21/14.
12
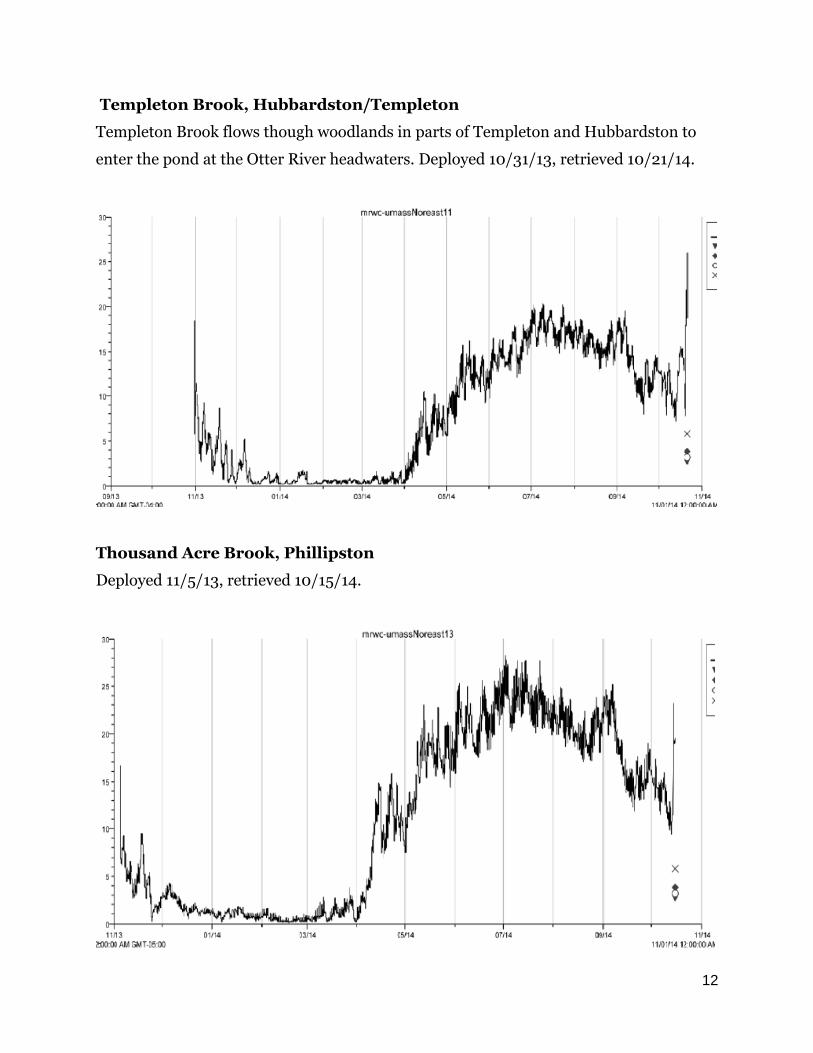
Templeton Brook, Hubbardston/Templeton
Templeton Brook flows though woodlands in parts of Templeton and Hubbardston to
enter the pond at the Otter River headwaters. Deployed 10/31/13, retrieved 10/21/14.
Thousand Acre Brook, Phillipston
Deployed 11/5/13, retrieved 10/15/14.
13
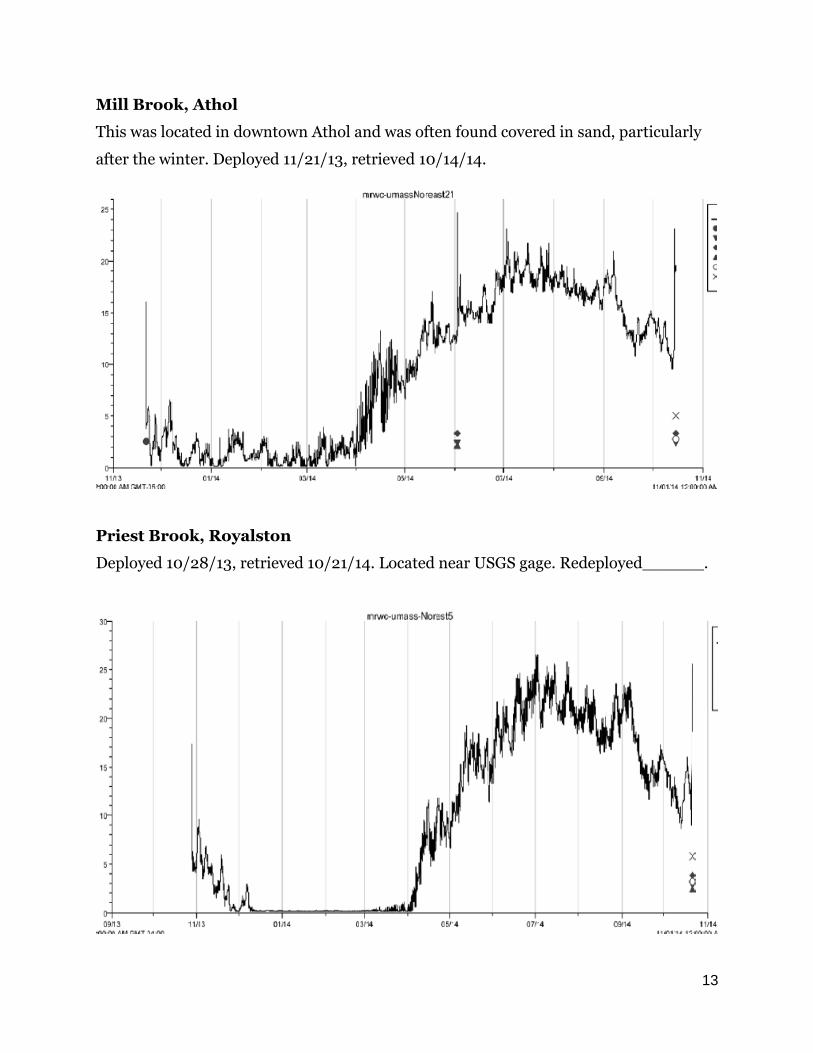
Mill Brook, Athol
This was located in downtown Athol and was often found covered in sand, particularly
after the winter. Deployed 11/21/13, retrieved 10/14/14.
Priest Brook, Royalston
Deployed 10/28/13, retrieved 10/21/14. Located near USGS gage. Redeployed______.
14
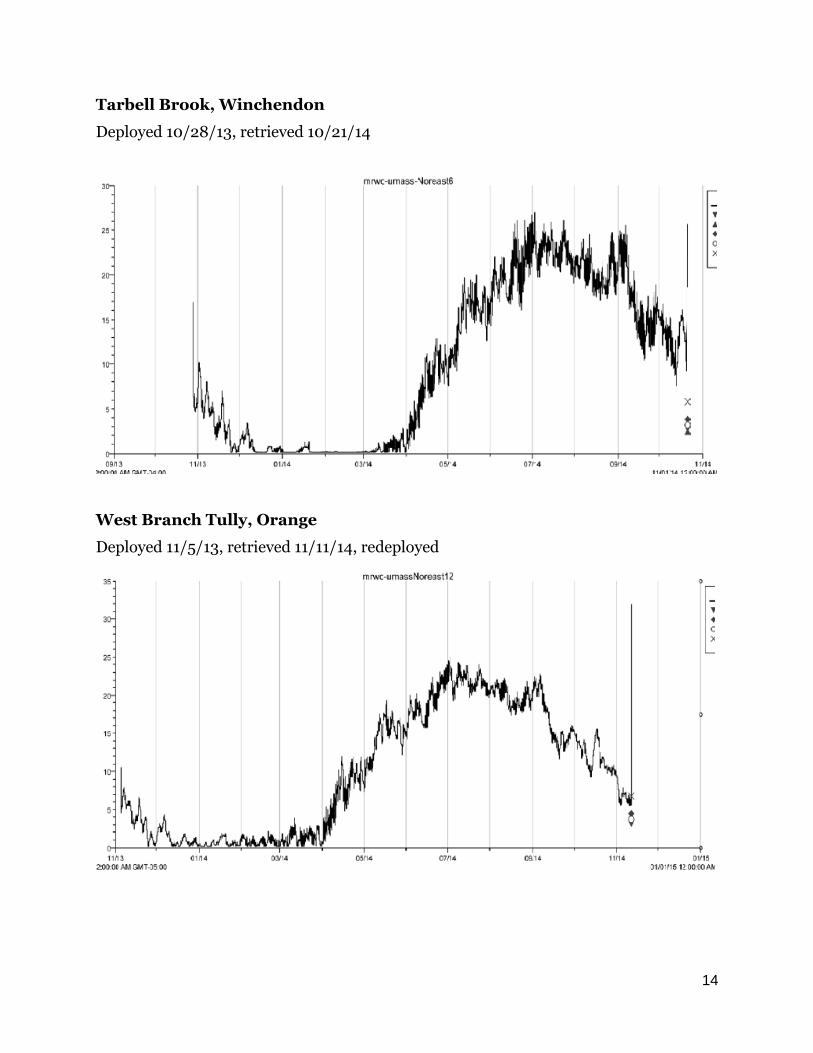
Tarbell Brook, Winchendon
Deployed 10/28/13, retrieved 10/21/14
West Branch Tully, Orange
Deployed 11/5/13, retrieved 11/11/14, redeployed
15
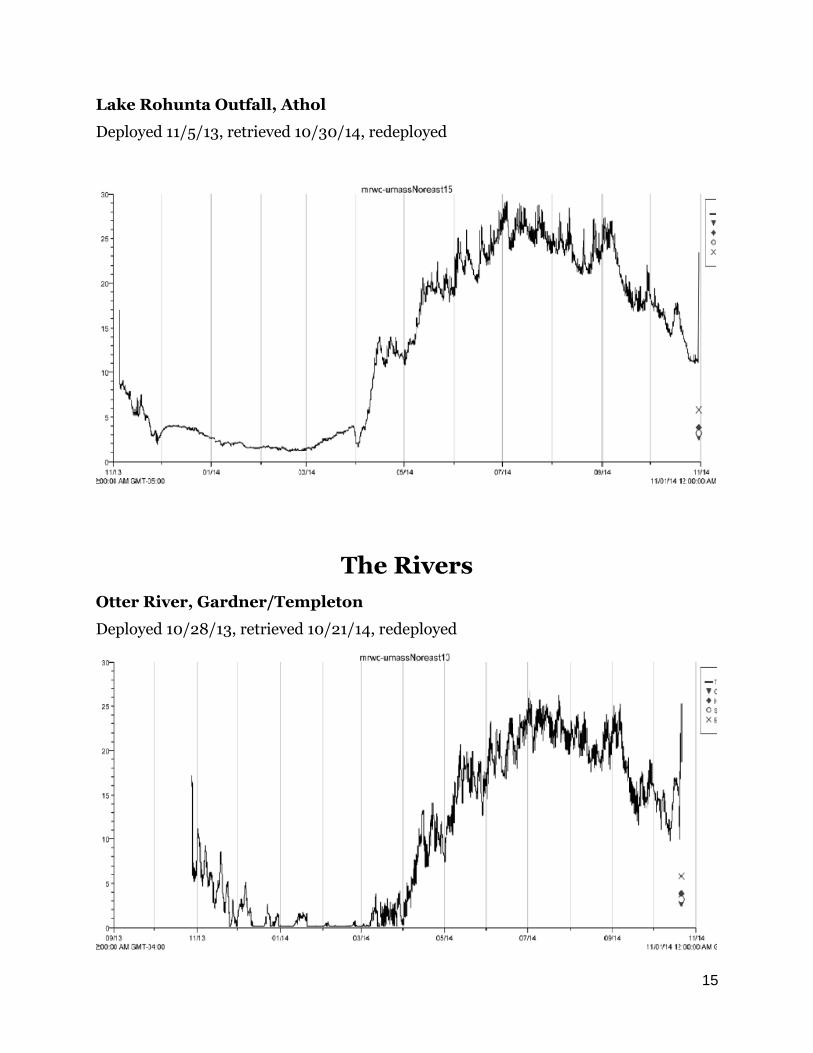
Lake Rohunta Outfall, Athol
Deployed 11/5/13, retrieved 10/30/14, redeployed
The Rivers
Otter River, Gardner/Templeton
Deployed 10/28/13, retrieved 10/21/14, redeployed
16
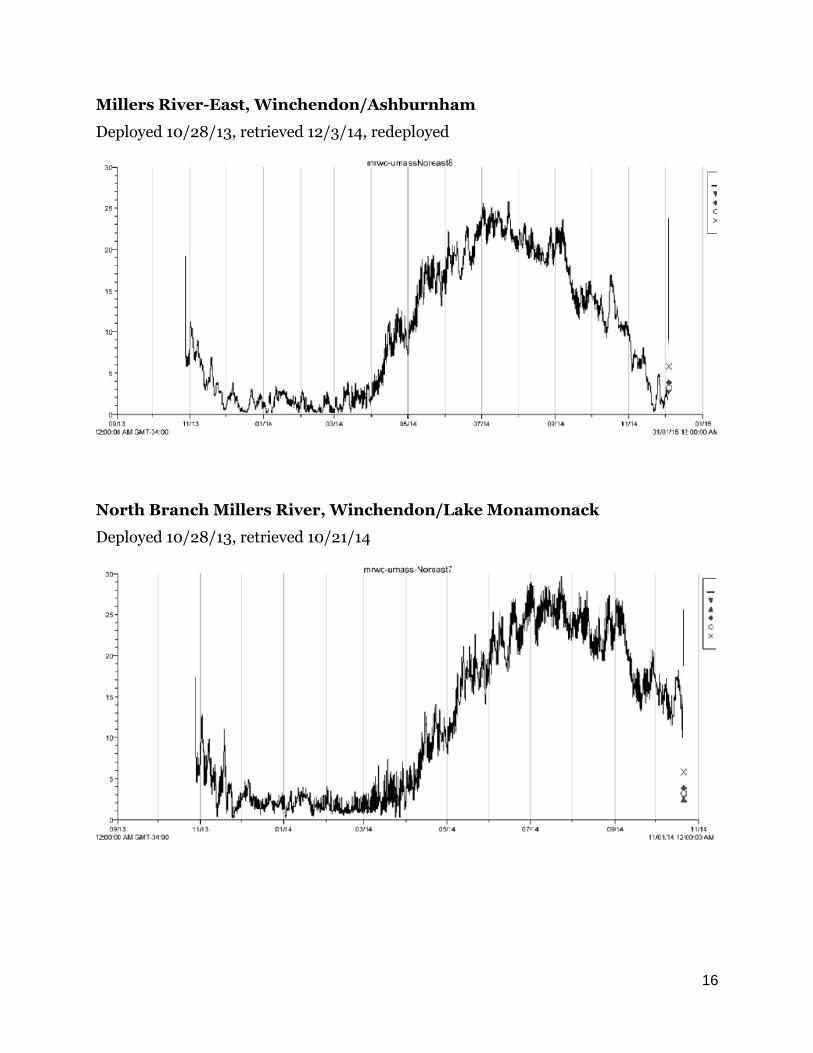
Millers River-East, Winchendon/Ashburnham
Deployed 10/28/13, retrieved 12/3/14, redeployed
North Branch Millers River, Winchendon/Lake Monamonack
Deployed 10/28/13, retrieved 10/21/14
17
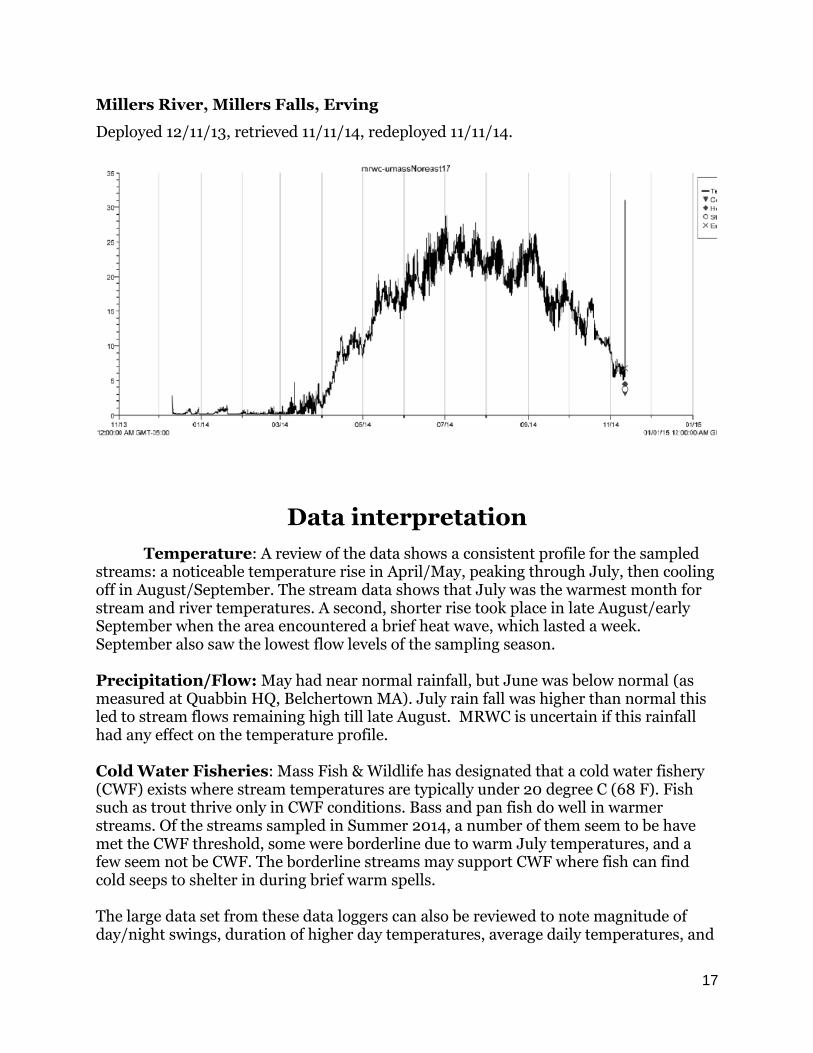
Millers River, Millers Falls, Erving
Deployed 12/11/13, retrieved 11/11/14, redeployed 11/11/14.
Data interpretation
Temperature: A review of the data shows a consistent profile for the sampled streams: a noticeable temperature rise in April/May, peaking through July, then cooling off in August/September. The stream data shows that July was the warmest month for stream and river temperatures. A second, shorter rise took place in late August/early September when the area encountered a brief heat wave, which lasted a week. September also saw the lowest flow levels of the sampling season. Precipitation/Flow: May had near normal rainfall, but June was below normal (as measured at Quabbin HQ, Belchertown MA). July rain fall was higher than normal this led to stream flows remaining high till late August. MRWC is uncertain if this rainfall had any effect on the temperature profile. Cold Water Fisheries: Mass Fish & Wildlife has designated that a cold water fishery (CWF) exists where stream temperatures are typically under 20 degree C (68 F). Fish such as trout thrive only in CWF conditions. Bass and pan fish do well in warmer streams. Of the streams sampled in Summer 2014, a number of them seem to be have met the CWF threshold, some were borderline due to warm July temperatures, and a few seem not be CWF. The borderline streams may support CWF where fish can find cold seeps to shelter in during brief warm spells. The large data set from these data loggers can also be reviewed to note magnitude of day/night swings, duration of higher day temperatures, average daily temperatures, and
18
so on. Large datasets can be used for temperature modeling and climate modeling. This is a more in depth analysis, whereas this report provides only general profiles. MRWC will be sharing this data with scientists for further review.
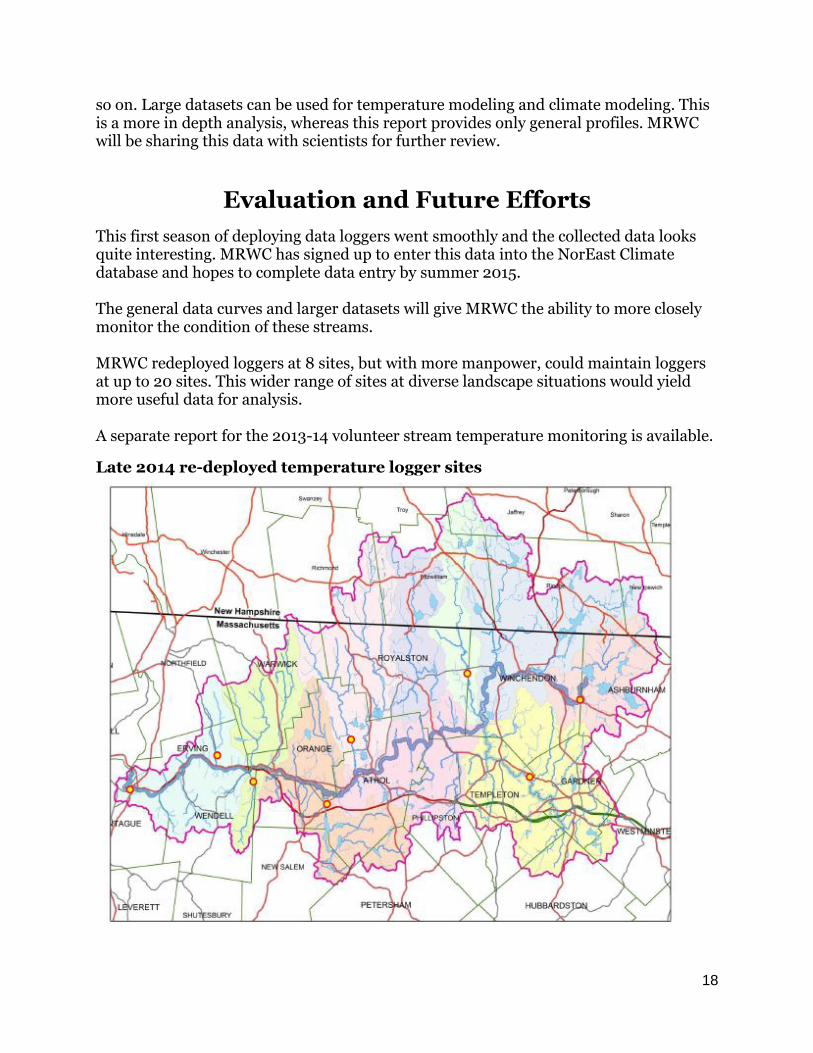
Evaluation and Future Efforts
This first season of deploying data loggers went smoothly and the collected data looks quite interesting. MRWC has signed up to enter this data into the NorEast Climate database and hopes to complete data entry by summer 2015. The general data curves and larger datasets will give MRWC the ability to more closely monitor the condition of these streams. MRWC redeployed loggers at 8 sites, but with more manpower, could maintain loggers at up to 20 sites. This wider range of sites at diverse landscape situations would yield more useful data for analysis. A separate report for the 2013-14 volunteer stream temperature monitoring is available.
Late 2014 re-deployed temperature logger sites
19
Appendix 1
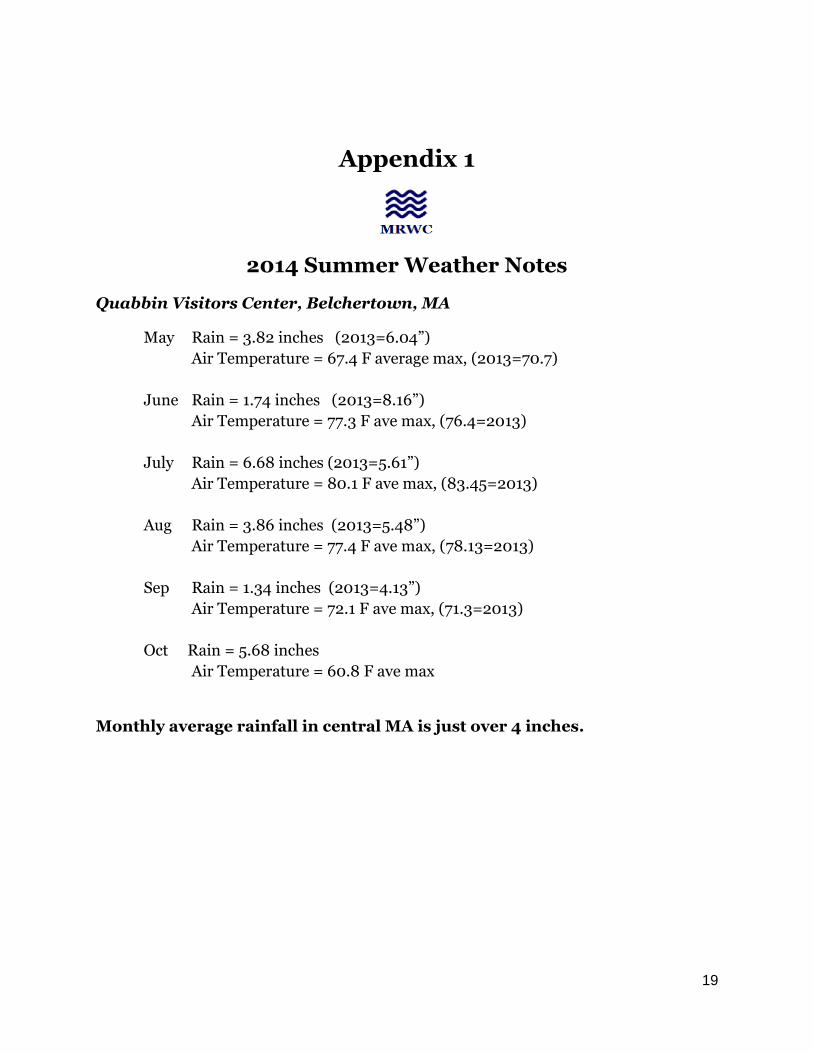
2014 Summer Weather Notes
Quabbin Visitors Center, Belchertown, MA
May Rain = 3.82 inches (2013=6.04”)
Air Temperature = 67.4 F average max, (2013=70.7)
June Rain = 1.74 inches (2013=8.16”)
Air Temperature = 77.3 F ave max, (76.4=2013)
July Rain = 6.68 inches (2013=5.61”)
Air Temperature = 80.1 F ave max, (83.45=2013)
Aug Rain = 3.86 inches (2013=5.48”)
Air Temperature = 77.4 F ave max, (78.13=2013)
Sep Rain = 1.34 inches (2013=4.13”)
Air Temperature = 72.1 F ave max, (71.3=2013)
Oct Rain = 5.68 inches
Air Temperature = 60.8 F ave max
Monthly average rainfall in central MA is just over 4 inches.


![Single Chip Temperature Data Logger - Electronics-Lab · Single Chip Temperature Data Logger Rajendra Bhatt Williamsburg, VA rajbex [@] yahoo.com Introduction A data logger is a device](https://img.pdfslide.us/doc/110x75/5f0890e87e708231d422a4b4/single-chip-temperature-data-logger-electronics-lab-single-chip-temperature-data.jpg)