Embed Size (px)
Citation preview

MRPO Data Analysis
Donna Kenski
National RPO Technical Meeting
December 3-4, 2002

Data Analysis Team Approach• Initiated Spring 2002• State participants: IL, WI, MI, OH• Federal participants: USEPA-R5• Academic participants: UIC• Stakeholder participants: MOG, Eli Lilly• Goals: Meet monthly, share analysis results and
techniques, become a ‘team’• Difficulties to overcome: competing priorities, varying
levels of expertise, no universal platform or toolbox
Data analysis needs
• Data available: – 3 full years of PM2.5 FRM data– Historic IMPROVE & Castnet, plus new IMPROVE sites– Speciation network: >=1 year of data from urban sites, <= 1 year from
rural sites– PM2.5 data still too limited for many analyses (trends, PMF, CART)
• Analyses needed:– Contribution assessment– Conceptual model
• Response: – Drew up list of questions that could be answered with available data, enlisted
volunteers
Q: How similar are PM2.5 mass and chemical composition in the rural Midwest?• Task: Assess the similarity of PM2.5
concentrations at rural IMPROVE and speciation sites in MI, WI, and MN (Houghton Lake, Seney, Perkinstown, Mayville, Boundary Waters, Isle Royale, Voyageurs)
• Approach: Examine time series, correlations, and scatterplots to show similarities and differences
• Assigned to: Gina Williams, Eli Lilly
• Status: Underway
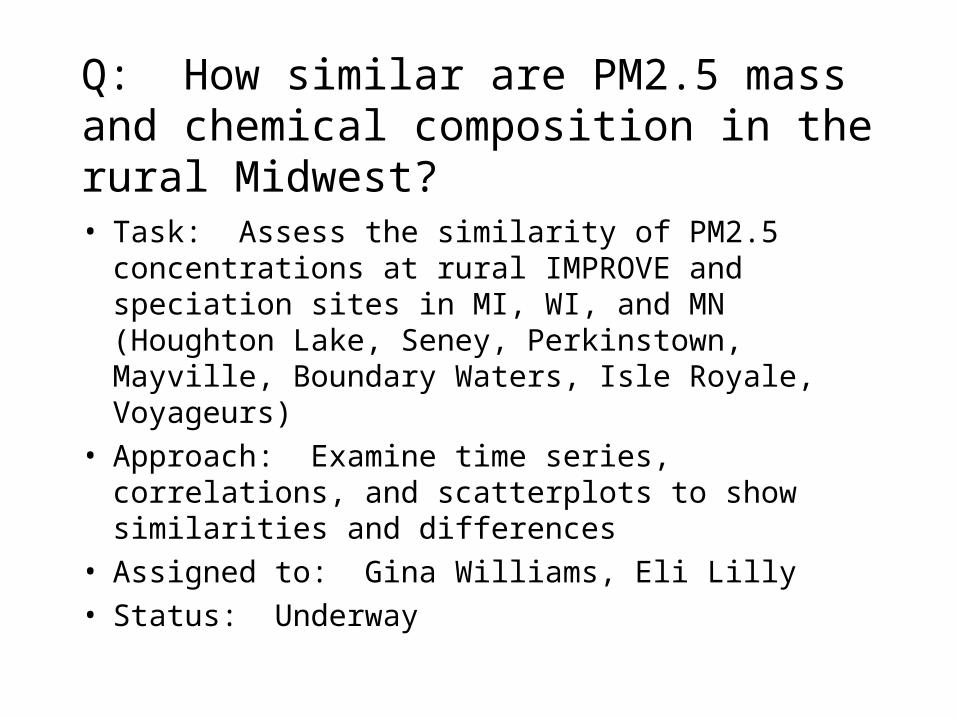
Chemical Composition - Rural Sites IMPROVE/CASTNet Data (1997 - 1999)
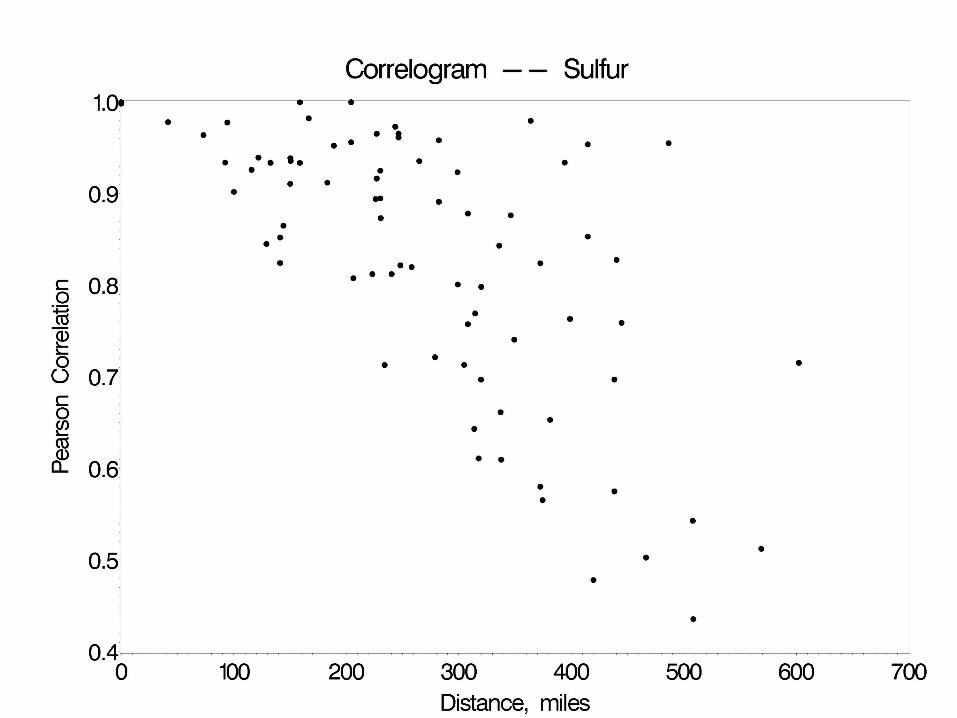
Q: What is the temporal variability of PM2.5 mass and chemical composition in the rural upper Midwest?
• Task: Determine appropriate sampling frequency for rural speciation sites in the upper Midwest
• Approach: Examine confidence intervals for various %iles calculated from 1/3, 1/6, and 1/12 day sampling periods
• Assigned to: Peter Scheff, UIC/EPA• Status: Underway
Q: How do optical measurements compare to TEOM, FRM, and speciation sampler mass and reconstructed light scattering?
• Task: Evaluate observed light scattering (neph. data) v. reconstructed light scattering (filter data).
• Approach: Using data from Bondville, Mayville, Seney and Quaker City, construct scatterplots and calculate regressions for these relationships; examine seasonal differences and effect of humidity
• Assigned to: ARS
• Status: Initial report due Dec. 2003

Reconstructing Mass
Q: How do IMPROVE and CASTNET measurements compare?
• Task: Evaluate speciated measurements from collocated IMPROVE and CASTNET monitors at Bondville (3/01-12/01)
• Approach: Scatterplots of each measured species (mass, major ions, EC, OC, and elements) and fitted regression lines, time series of each element to discern possible seasonal differences
• Assigned to: Mike Koerber• Status: Underway
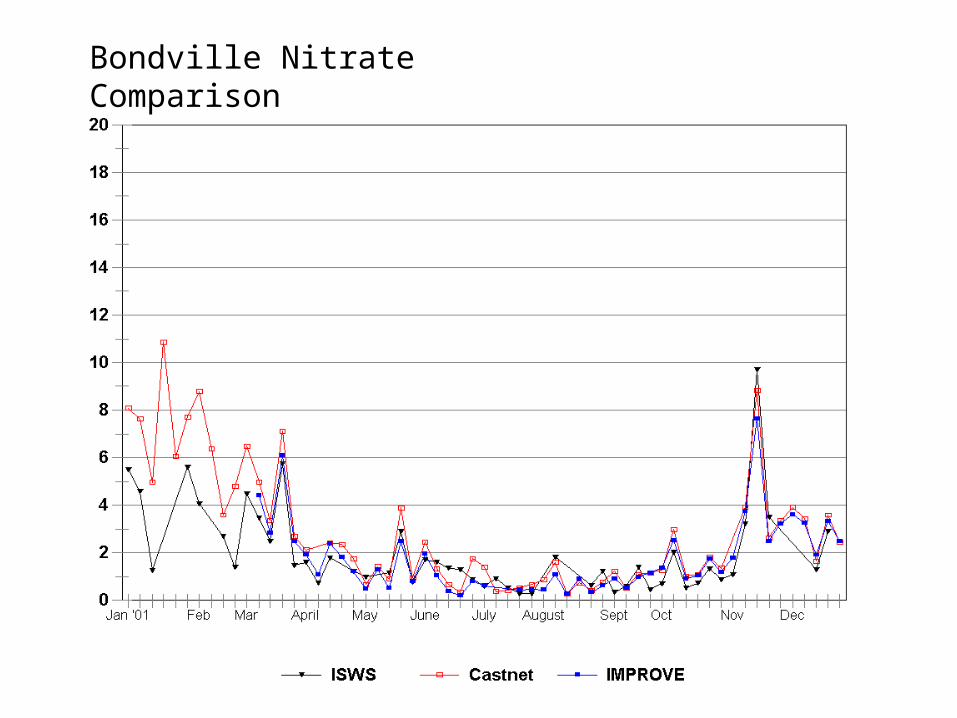
Bondville Nitrate Comparison
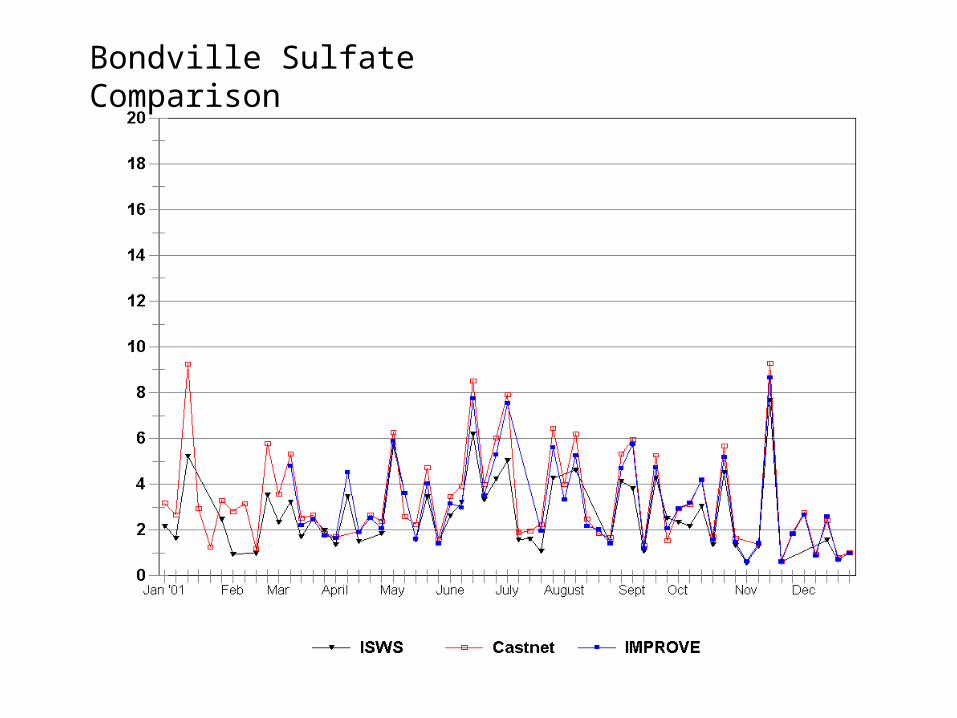
Bondville Sulfate Comparison
Q: What meteorological conditions are associated with high and low PM2.5 days? (Part 1)
• Task: Identify synoptic surface and aloft conditions on high PM days
• Approach: Identify days and episodes with high/low concentrations, characterize associated met conditions (regional scale)
• Assigned to: Bob Swinford, IEPA• Status: Regional episodes identified
Q: What meteorological conditions are associated with high and low PM2.5 days? (Part 2)
• Task: Determine what surface and aloft met and aq conditions are associated with high and low PM days in urban areas
• Approach: Assemble database of met and aq information, perform CART analysis
• Assigned to: Donna Kenski• Status: preliminary CART for surface, 4 urban
areas--need to expand, add upper air
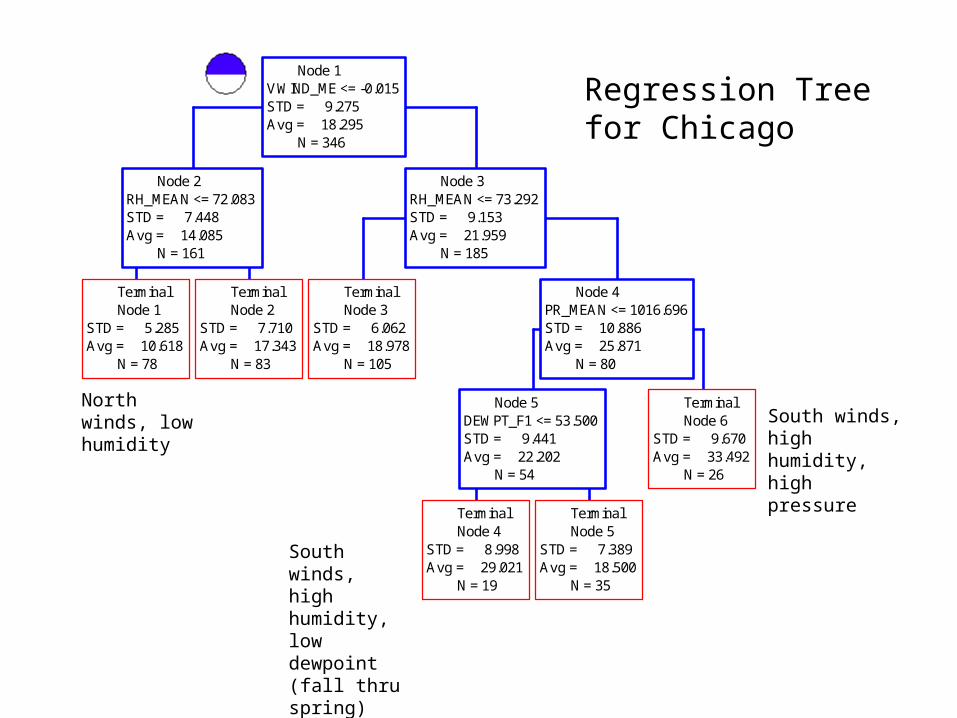
TerminalNode 1
STD = 5.285Avg = 10.618
N = 78
TerminalNode 2
STD = 7.710Avg = 17.343
N = 83
Node 2RH_MEAN <= 72.083STD = 7.448Avg = 14.085
N = 161
TerminalNode 3
STD = 6.062Avg = 18.978
N = 105
TerminalNode 4
STD = 8.998Avg = 29.021
N = 19
TerminalNode 5
STD = 7.389Avg = 18.500
N = 35
Node 5DEWPT_F1 <= 53.500STD = 9.441Avg = 22.202
N = 54
TerminalNode 6
STD = 9.670Avg = 33.492
N = 26
Node 4PR_MEAN <= 1016.696STD = 10.886Avg = 25.871
N = 80
Node 3RH_MEAN <= 73.292STD = 9.153Avg = 21.959
N = 185
Node 1VWIND_ME <= -0.015STD = 9.275Avg = 18.295
N = 346
South winds, high humidity, high pressure
North winds, low humidity
South winds, high humidity, low dewpoint (fall thru spring)
Regression Tree for Chicago
Q: How representative is the meteorology for 2001-2003 base period?
• Task: Determine whether the 2001-2003 base period is appropriate for SIP planning
• Approach: Compare 2001 meteorology (and future years when data become available) with past years and assess similarities and differences
• Assigned to: Matt Harrell, IEPA• Status: Underway
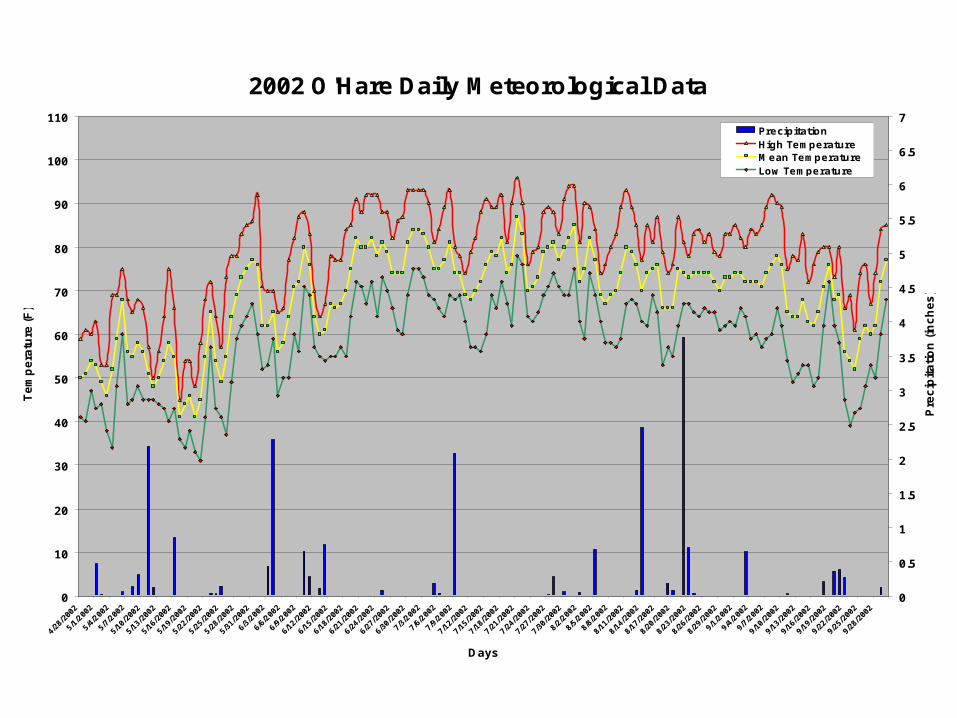
2002 O'Hare Daily Meteorological Data
0
10
20
30
40
50
60
70
80
90
100
110
Days
Te
mp
era
ture
(F
)
0
0.5
1
1.5
2
2.5
3
3.5
4
4.5
5
5.5
6
6.5
7
Pre
cip
ita
tio
n (
inc
he
s)
PrecipitationHigh TemperatureM ean TemperatureLow Temperature
Q: How representative is the meteorology for the June 19-24, 2002, ozone episode?
• Task: Characterize the meteorological conditions during the recent June ozone episode
• Approach: (1) Describe synoptic weather patterns (2) Apply CART tree to see what ‘branch’ fits best
• Assigned to: Matt Harrell (IEPA), Bill Adamski (WDNR), Donna Kenski
• Status: Underway
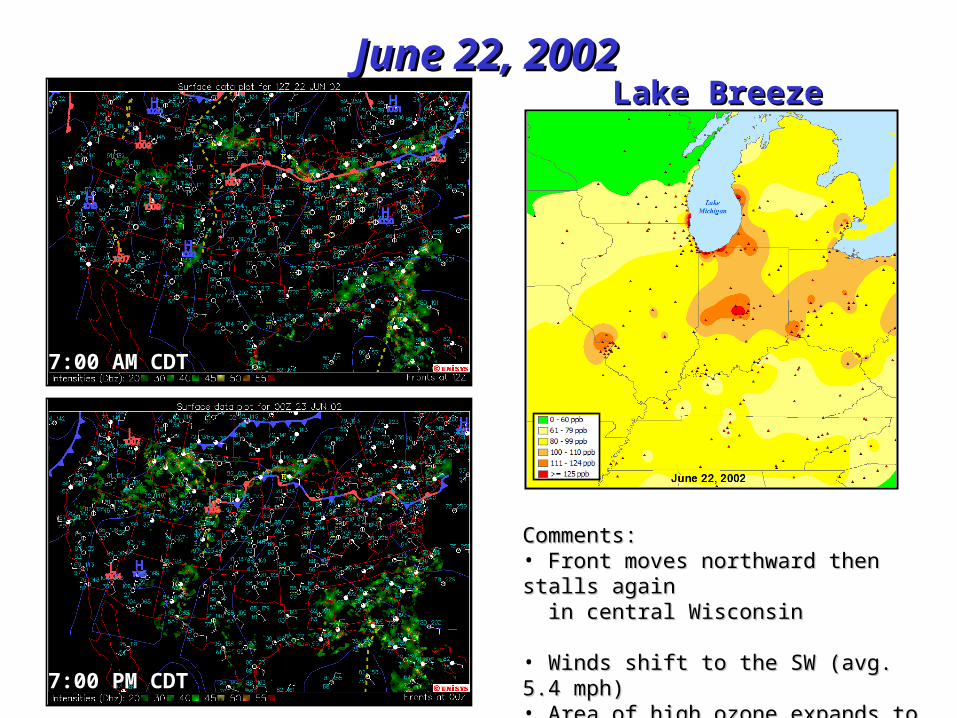
June 22, 2002June 22, 2002
Comments: Comments: • Front moves northward then stalls Front moves northward then stalls again again in central Wisconsin in central Wisconsin • Winds shift to the SW (avg. 5.4 Winds shift to the SW (avg. 5.4 mph)mph)• Area of high ozone expands to the Area of high ozone expands to the northnorth• Background remains high Background remains high
7:00 AM CDT
7:00 PM CDT
Lake BreezeLake Breeze
Q: How have Title IV reductions in SO2 emissions affected SO2, SO4, and NO3 concentrations?
• Task: Examine trends in sulfate and nitrate in eastern US since 1990
• Approach: Use Theil trend (all pairwise comparisons, nonparametric) on IMPROVE, CASTNET, AIRS data
• Assigned to: Maria Witmer-Rich, MOG• Status: Underway
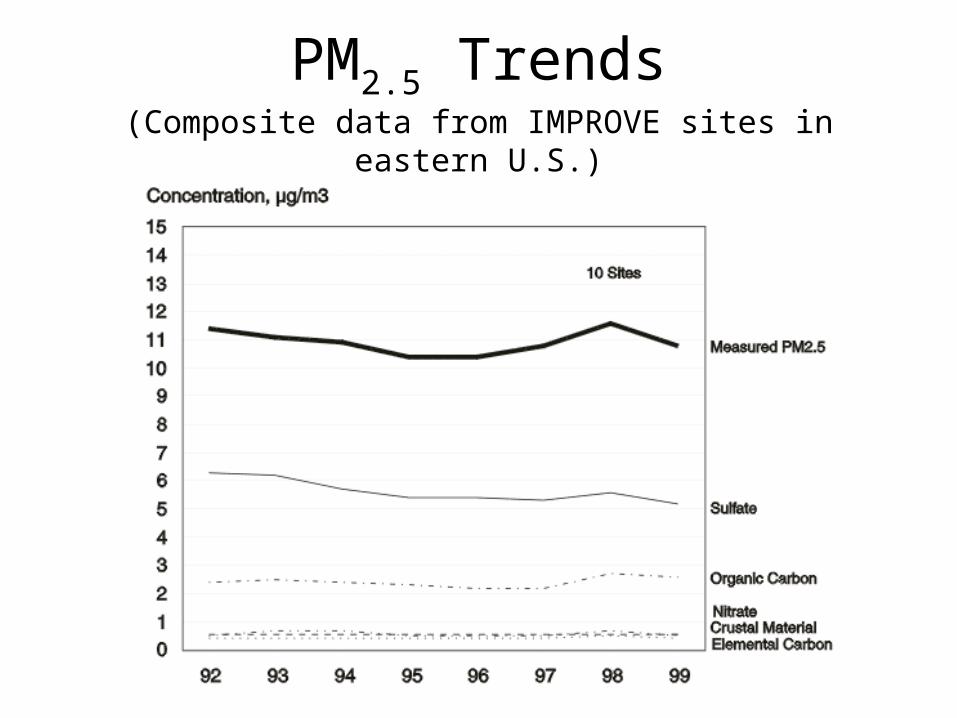
PM2.5 Trends(Composite data from IMPROVE sites in eastern U.S.)
Q: What can we say about PM-coarse across the region?
• Task: Describe PM-coarse concentrations• Approach: Calculate PM-coarse
concentrations, summarize daily and annual average concentrations, compare urban/rural/geographic variations
• Assigned to: unassigned• Status: awaiting analyst
Q: How are PM2.5 and O3 related in our metro regions?
• Task: Assess the relationship between PM2.5 and ozone
• Approach: Time series analysis describing PM2.5 as function of lagged PM, O3, and other AQ variables
• Assigned to: Mike Rizzo, USEPA R5• Status: Underway (PM10 results published)
Q: What wind directions are associated with high and low PM2.5 concentrations?
• Task: Use wind roses to assess the local component of PM2.5 (in conjunction with back trajectories)
• Approach: Construct wind roses from collocated or nearby met data for Midwest metropolitan regions
• Assigned to: Mike Rizzo• Status: Underway
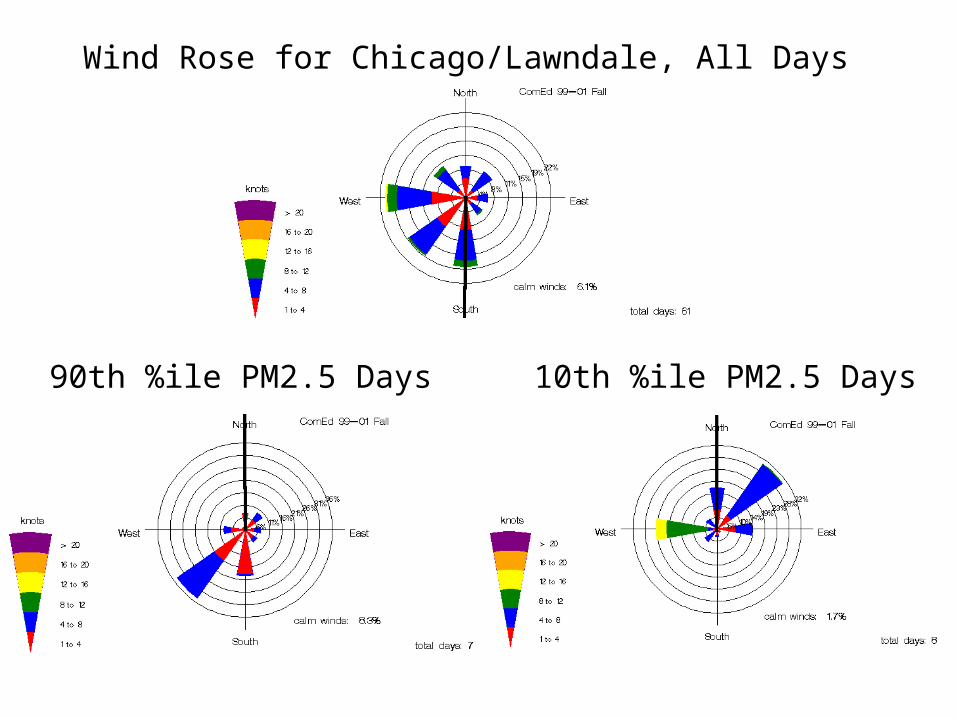
90th %ile PM2.5 Days 10th %ile PM2.5 Days
Wind Rose for Chicago/Lawndale, All Days
Q: What areas are most likely to contribute to visibility impairment in Class 1 areas?
• Task: Evaluate potential source areas with ensemble back trajectory analysis
• Approach: Prepare back trajectory plots for Class 1 areas for 20% best/worst days, high sulfate, nitrate, EC, OC, etc., for 1997-2000
• Assigned to: Donna Kenski• Status: Underway
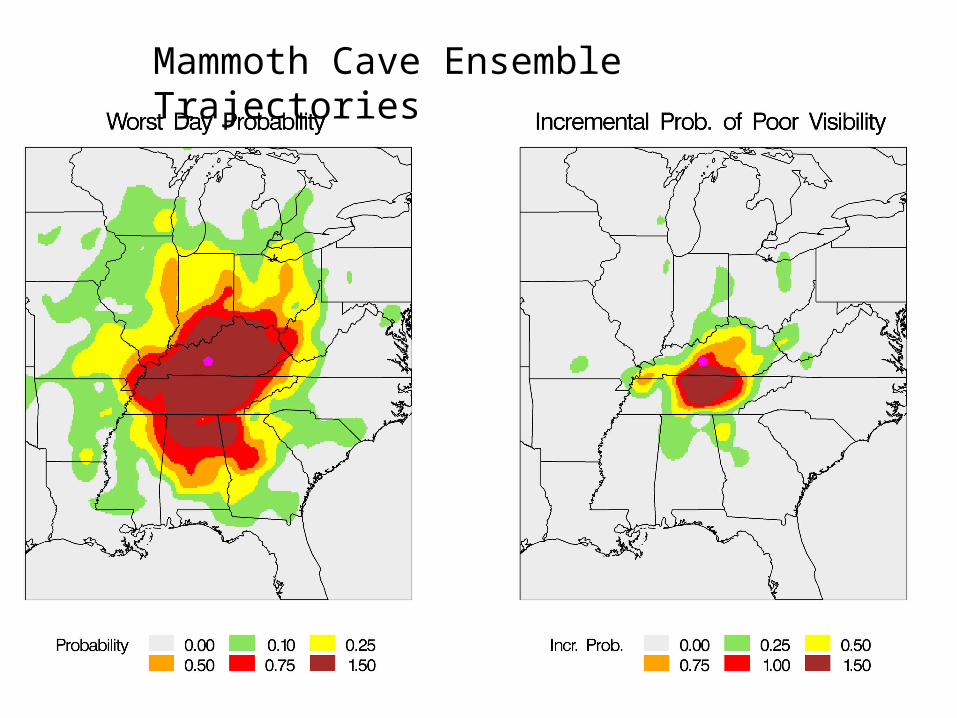
Mammoth Cave Ensemble Trajectories
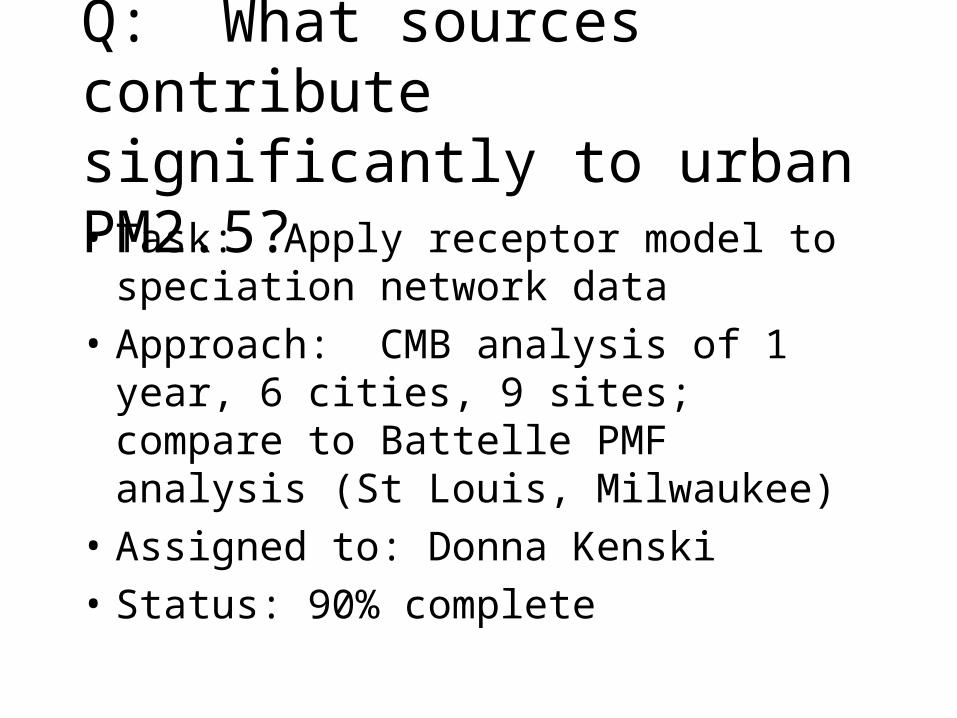
Q: What sources contribute significantly to urban PM2.5?• Task: Apply receptor model to
speciation network data
• Approach: CMB analysis of 1 year, 6 cities, 9 sites; compare to Battelle PMF analysis (St Louis, Milwaukee)
• Assigned to: Donna Kenski
• Status: 90% complete
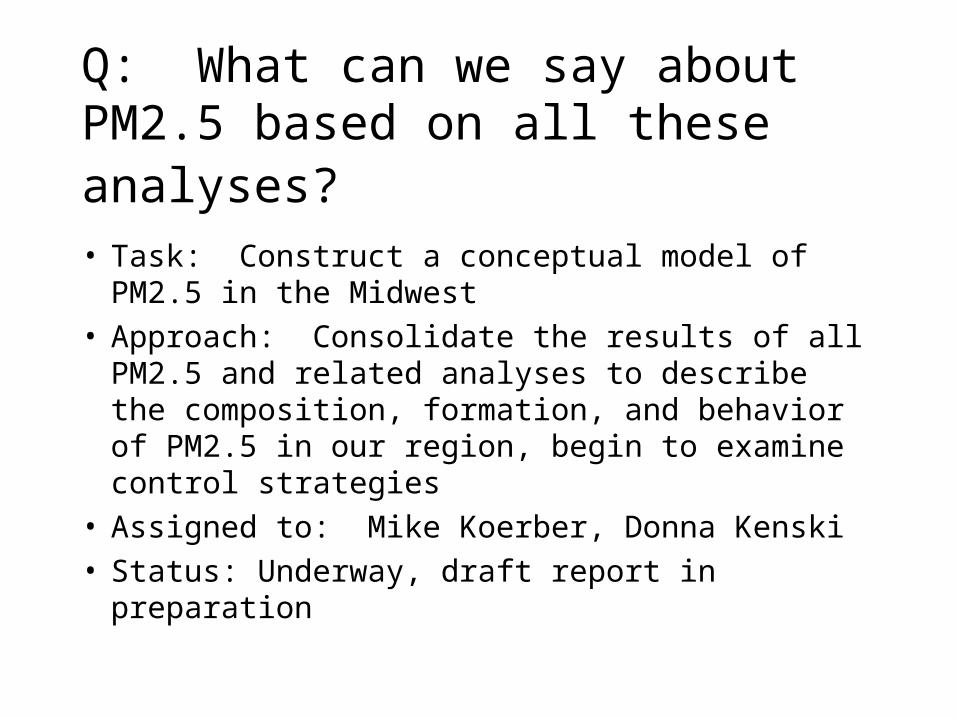
Q: What can we say about PM2.5 based on all these analyses?
• Task: Construct a conceptual model of PM2.5 in the Midwest
• Approach: Consolidate the results of all PM2.5 and related analyses to describe the composition, formation, and behavior of PM2.5 in our region, begin to examine control strategies
• Assigned to: Mike Koerber, Donna Kenski• Status: Underway, draft report in preparation
And just in case we need more data analysis...
• Aircraft data
• Drum sampling data from Detroit
• Special study data: Nitrogen speciation, organic speciation
• Source apportionment of IMPROVE/Castnet continuing through DRI, Capita