Embed Size (px)
Citation preview
mRNA structure regulates protein expression throughchanges in functional half-lifeDavid M. Maugera, B. Joseph Cabrala,1, Vladimir Presnyaka, Stephen V. Sua,2, David W. Reida, Brooke Goodmana,Kristian Linka, Nikhil Khatwania,3, John Reyndersa,4, Melissa J. Moorea,5, and Iain J. McFadyena,6
aPlatform Research, Moderna, Inc., Cambridge, MA 02139
Edited by Joseph D. Puglisi, Stanford University School of Medicine, Stanford, CA, and approved October 8, 2019 (received for review May 9, 2019)
Messenger RNAs (mRNAs) encode information in both their primarysequence and their higher order structure. The independent contri-butions of factors like codon usage and secondary structure toregulating protein expression are difficult to establish as they areoften highly correlated in endogenous sequences. Here, we used2 approaches, global inclusion of modified nucleotides and rationalsequence design of exogenously delivered constructs, to under-stand the role of mRNA secondary structure independent fromcodon usage. Unexpectedly, highly expressed mRNAs contained ahighly structured coding sequence (CDS). Modified nucleotides thatstabilize mRNA secondary structure enabled high expression acrossa wide variety of primary sequences. Using a set of eGFP mRNAswith independently altered codon usage and CDS structure, we findthat the structure of the CDS regulates protein expression throughchanges in functional mRNA half-life (i.e., mRNA being activelytranslated). This work highlights an underappreciated role of mRNAsecondary structure in the regulation of mRNA stability.
mRNA therapuetics | modified nucleotides | translation |RNA structure | SHAPE
Messenger RNAs (mRNAs) direct cytoplasmic protein ex-pression. How much protein is produced per mRNA
molecule is a function of how well the translational machineryinitiates and elongates on the coding sequence (CDS) and themRNA’s functional half-life. Both translational efficiency andfunctional half-life are driven by features encoded in the primarymRNA sequence. Synonymous codon choice directly impactstranslation, with highly expressed genes tending to include more“optimal” codons (1, 2). Conversely, “nonoptimal” codons canincrease ribosomal pausing and decrease mRNA half-life (3, 4).Other mRNA sequence features that reportedly correlate withprotein output are dinucleotide frequency in the CDS (5) andthe effect of codon order on locally accessible charged tRNApools (6). Because these effects are interdependent on mRNAsequence, teasing apart their individual contributions to proteinoutput is difficult and often controversial (7, 8).In addition to dictating encoded protein identity, its primary
sequence also determines an mRNA’s propensity to form sec-ondary and tertiary structure (9). Transcriptome-wide RNAstructure characterization is beginning to reveal global relation-ships between the structure content in different mRNA regionsand protein expression (10, 11). Multiple studies have shown thatsecondary structure in the 5′ untranslated region (5′ UTR)generally reduces translation initiation efficiency and thereforeoverall protein output (10–13). But, the extent to which CDS and3′ untranslated region (3′ UTR) secondary structure impacts pro-tein output, however, is much less understood.One way to alter RNA secondary structure is to change the
primary sequence. In the CDS, however, primary sequence changesnecessarily alter codon usage, confounding any effects that mightbe attributable to changes in mRNA structure alone. An alternatemeans to affect secondary structure without changing codons isto incorporate modified nucleotides (nt) that maintain the sameWatson–Crick base-pairing relationships (e.g., pseudouridine [Ψ]for U) but have small effects on local secondary structure. Such
modified nucleotides can either stabilize (14) or destabilize (15)base pairs and hence overall mRNA structure.Here, we combined computational sequence design with global
modified nucleotide substitution as tools to investigate the separateimpacts of mRNA primary sequence and structural stability onprotein output. We find that differences in the innate thermody-namic base pair stability of 2 modified uridine nucleotides, N1-methyl-pseudouridine and 5-methoxy-uridine, induce global changesin mRNA secondary structure. These structural changes in turndrive changes in protein expression. As expected, our data confirmthat reduced secondary structure within a 5′ leader region (the 5′UTR and first ∼10 codons of the CDS) correlates with high proteinexpression. Surprisingly, we also find that high protein expressioncorrelates with increased secondary structure in the remainder ofthe mRNA (the rest of the CDS and the 3′ UTR). We validatedthis finding by designing an enhanced gene fluorescent protein
Significance
Despite widespread recognition that RNA is inherently struc-tured, the interplay between local and global mRNA secondarystructure (particularly in the coding region) and overall proteinexpression has not been thoroughly explored. Our work uses 2approaches to disentangle the regulatory roles of mRNA pri-mary sequence and secondary structure: global substitutionwith modified nucleotides and computational sequence design.By fitting detailed kinetic expression data to mathematicalmodels, we show that secondary structure can increase mRNAhalf-life independent of codon usage. These findings have sig-nificant implications for both translational regulation of endog-enous mRNAs and the emerging field of mRNA therapeutics.
Author contributions: D.M.M., B.J.C., V.P., K.L., J.R., M.J.M., and I.J.M. designed research;D.M.M., B.J.C., V.P., S.V.S., D.W.R., B.G., and N.K. performed research; V.P., S.V.S., B.G.,K.L., and N.K. contributed new reagents/analytic tools; D.M.M., B.J.C., V.P., S.V.S., D.W.R.,B.G., and N.K. analyzed data; and D.M.M., B.J.C., V.P., M.J.M., and I.J.M. wrote the paper.
Competing interest statement: All authors are employees (or ex-employees in the case ofS.V.S., J.R., and B.J.C.) of Moderna, Inc.
This article is a PNAS Direct Submission.
This open access article is distributed under Creative Commons Attribution License 4.0(CC BY).
Data deposition: The data reported in this paper have been deposited in the Gene Ex-pression Omnibus (GEO) database, https://www.ncbi.nlm.nih.gov/geo (accession no.GSE139176).1Present address: Venture Labs, Flagship Pioneering, Cambridge, MA 02142.2Present address: Department of Cell and Molecular Biology, Korro Bio, Cambridge, MA02139.
3Present address: Microbiology and Immunology Department, Dartmouth College, Han-over, NH 03756.
4Present address: Data Sciences, Genomics, and Bioinformatics Department, Alexion Phar-maceuticals, Boston, MA 02210.
5To whom correspondence may be addressed. Email: [email protected] address: Computational Sciences Department, LifeMine Therapeutics, Cam-bridge, MA 02140.
This article contains supporting information online at www.pnas.org/lookup/suppl/doi:10.1073/pnas.1908052116/-/DCSupplemental.
First published November 11, 2019.
www.pnas.org/cgi/doi/10.1073/pnas.1908052116 PNAS | November 26, 2019 | vol. 116 | no. 48 | 24075–24083
BIOPH
YSICSAND
COMPU
TATIONALBIOLO
GY
Dow
nloa
ded
by g
uest
on
Apr
il 9,
202
0

(eGFP) mRNA panel wherein the effects of codon usage andsecondary structure could be examined separately. Our data reveala relationship wherein codon optimality and greater CDS sec-ondary structure synergize to increase mRNA functional half-life.
ResultsRNA Sequence and Nucleotide Modifications Combine to DetermineProtein Expression. For this study, we created diverse synony-mous CDS sets encoding eGFP (4 variants), human erythropoie-tin (hEpo, 9 variants) and firefly Luciferase (Luc, 39 variants)transcribed in vitro with ATP, CTP, GTP, and either UTP, pseu-douridine triphosphate (ΨTP), N1-methyl-pseudouridine triphos-phate (m1ΨTP), or 5-methyoxy-uridine triphosphate (mo5UTP)(Fig. 1A). For comparison with a previous study documenting theeffects of modified nucleotides on RNA immunogenicity (16), wealso made eGFP mRNA wherein both U and C were substitutedwith Ψ and 5-methyl-cytidine (m5C), respectively. We designed
the sequence sets with bias toward optimal codons (for hEPOand eGFP mRNAs) or designed to sample a larger sequence space,including nonoptimal codons (for Luc mRNA). All mRNAs carriedcap1, identical 5′ and 3′ UTRs, and a 100-nucleotide poly(A) tail.First, we analyzed the impact of primary CDS sequence on
protein expression of mRNAs containing no modified nucleotides(eGFP/hEPO, Fig. 1; Luc, Fig. 2). Cellular protein expressionranged between >2.5-fold for eGFP (Fig. 1B, gray) and >4-fold forhEpo (Fig. 1C, gray), despite all sequences containing only fre-quently used codons. Expression of 39 unmodified Luc variantscontaining codons with a greater optimality range varied >10-fold(Fig. 2A, gray). Highly expressed mRNAs tended to have in-creased GC content, consistent with previous reports (17), but notall high GC sequences were high expressers (SI Appendix, Figs. S1A and B and S2A, gray). Unmodified Luc expression moderatelycorrelated with both GC content and codon adaptation index(CAI) (Pearson correlations r = 0.63 and 0.64, respectively; see
A
B
D
C
Fig. 1. Inclusion of modified nucleotides in mRNA alters eGFP and hEPO expression. (A) Chemical structure of uridine and 4 modified nucleosides: (Ψ, m1Ψ,mo5U, and m5C. (B) Fluorescence intensity (normalized intensity units, y axis) of HeLa cells following transfection with lipofectamine alone (−) or 4 differenteGFP sequence variants (G1–G4, x axis) containing uridine (gray), m1Ψ (orange), Ψ (yellow), m5C/Ψ (lavender), or mo5U (dark purple). (C, Top) Schematic of thehEpo mRNA sequence variants. Eight hEpo sequences combined 1 of 2 “head” regions (dark gray box, HA or HB) encoding the first 30 amino acids (90 nu-cleotides) and 1 of 4 “body” regions (light gray box, E1–E4) encoding the remainder of the hEpo CDS. (C, Bottom) Levels of secreted hEpo protein measured byELISA (ng/mL, y axis) following transfection of cells with 8 sequence variants (described in B above, x axis) plus 1 “codon optimized” variant (ECO) (44)containing uridine (gray bars), m1Ψ (orange), or mo5U (dark purple). (D) Serum concentrations of hEpo protein measured by ELISA (ng/mL, y axis) in BALB-cmice (5 per group) following IV injection of LNP-formulated mRNA of 6 sequence variants (described in B above, x axis) plus 1 codon optimized variant (ECO)(44) containing m1Ψ (orange) or mo5U (dark purple). Individual animals (dots) with mean and SE (black lines).
24076 | www.pnas.org/cgi/doi/10.1073/pnas.1908052116 Mauger et al.
Dow
nloa
ded
by g
uest
on
Apr
il 9,
202
0

SI Appendix, Fig. S2A, gray). Each Luc variant globally used thesame single codon for all instances of a given amino acid. Thisallowed us to look at the impact of individual codons on proteinexpression. Only 4 of 87 pairwise synonymous codon com-parisons exhibited statistically significant differences (P < 0.05;see SI Appendix, Fig. S3, gray). For example, inclusion ofPheUUU was associated with a slight increase in expression overPheUUC (Fig. 2B, gray). Surprisingly, even global inclusion ofextremely nonoptimal codons such as SerUCG, LeuCUA, AlaGCG,and ProCCG had no statistically significant impact on Luc ex-pression in unmodified RNA (Fig. 2B, gray; see SI Appendix, Fig.S3A, gray). Thus, codon usage, as measured by metrics such asCAI, cannot adequately explain these data.Next, we examined how protein expression was affected by
global substitution with modified nucleotides in the same se-quences. For eGFP mRNAs in HeLa cells, modified nucleotideschanged the expression of both individual variants and theoverall expression mean and range of the entire sequence set.Compared to unmodified mRNA, mean expression was similarfor eGFP mRNAs containing Ψ and m1Ψ, but lower for mo5Uand Ψ/m5C (3-fold and 1.5-fold lower, respectively, Fig. 1B). Of
note, the identities of the best and worst expressing sequenceswere not consistent across the different modified nucleotides.For example, eGFP sequence G2 expressed highly with Ψ and m1Ψ,moderately with U and Ψ/m5C, but poorly with mo5U (Fig.1B). Similar trends were observed for hEpo mRNA in HeLacells, with m1Ψ yielding a 1.5-fold greater mean expression thanU, which was in turn 2-fold higher than mo5U (Fig. 1C). As witheGFP and Luc, we observed hEpo variants (e.g., ECO and HAE2)that expressed well with m1Ψ, but not U or mo5U-containingmRNA (Fig. 1C). Although we observed some variation in theexpression levels of individual RNAs in hepatocytes versus HeLacells, the general expression trends were remarkably similar (Fig.1C and SI Appendix, Fig. S1C).To extend this analysis, we next examined 39 synonymous Luc
sequences containing U, m1Ψ, or mo5U mRNA in HeLa, AML12,and primary hepatocyte cells. Mean expression increased 1.5-foldfor m1Ψ mRNA but decreased 5-fold for mo5U compared tounmodified mRNA in HeLa cells (Fig. 2A). This trend held inAML12 cells and primary hepatocytes cells as well as across de-livery methods, including electroporation and transfection of lipidnanoparticles (LNPs) (although some individual differences were
A
B C
Fig. 2. Inclusion of modified nucleotides in mRNA alters Luc expression. (A, Left) Expression in HeLa cells (relative light units [RLU], y axis) for 39 fireflyLuciferase sequence variants (L1–L39, x axis) containing uridine (gray, Top), m1Ψ (orange, Middle), or mo5U (dark purple, Bottom). (A, Right) Distribution ofexpression levels (RLU, y axis) for variants (black dots) containing uridine (gray), m1Ψ (orange), and mo5U (dark purple) as a violin plot. (B) Expression in HeLacells (RLU, y axis) of 39 firefly Luciferase variants grouped by the codon used (x axis) for all instances of serine (Top), phenylalanine (Middle), and threonine(Bottom) in mRNAs containing uridine (Left), m1Ψ (Middle), or mo5U (Right). Codons are shown in order of frequency of occurrence in the human tran-scriptome. Individual values (dots) are the same as in A with mean and SEs (black lines). Significant differences by 2-way ANOVA comparisons are indicated bylines above, and P values are noted by asterisks (*P ≤ 0.05, **P ≤ 0.01, ***P ≤ 0.001, and ****P ≤ 0.0001). (C) Total luminescence of in vivo firefly Luciferaseexpression (RLU, y axis) in CD-1 mice (5 per group) following IV injection of 0.15 mg/kg LNP-formulated mRNA for 10 sequence variants (x axis) containing m1Ψ(Top) or mo5U (Bottom). Individual animals (dots) with median.
Mauger et al. PNAS | November 26, 2019 | vol. 116 | no. 48 | 24077
BIOPH
YSICSAND
COMPU
TATIONALBIOLO
GY
Dow
nloa
ded
by g
uest
on
Apr
il 9,
202
0

noted (Fig. 2A and SI Appendix, Figs. S2B and S3B). For severalmRNA sequences, inclusion of modified nucleotides substantiallyimpacted protein expression (Fig. 2A and SI Appendix, Fig. S2C).Several sequences (e.g., L24, and L22) universally produced lowlevels of protein across all modified nucleotides, but many vari-ants (e.g., L18, L7, L2, L8, and L29) favored specific modifiednucleotides over others. Taken together, these data indicate thatsequence and nucleotide modifications make distinct contributionsto the overall level of protein expression.A simple explanation for the observed modified nucleotide-
specific expression differences would be a direct effect on decod-ing by the ribosome. If so, expression should correlate with overallmodified nucleotide content, or alternatively with the use of spe-cific codons containing modified nucleotides. However, there is noclear relationship between % U content and expression (SI Ap-pendix, Fig. S2A) and only a few m1Ψ- and mo5U-containing codonshad any statistically significant impact on protein output (6 and 4,respectively, of 87 synonymous pairwise comparisons P < 0.05, Fig.2B and see SI Appendix, Fig. S3A). A notable exception is anunexpected and unexplained 2-fold increase in protein produc-tion with inclusion of the nonoptimal codon SerUCG in m1ΨmRNA (P < 0.05, Fig. 2B and see SI Appendix, Fig. S3A). Thus,mRNAs containing modified nucleotides (Ψ, m1Ψ, or mo5U)can support high levels of protein expression, but in a verycontext-specific manner.To assess the degree to which the above conclusions from cell
lines translated to animals, we examined protein expression inmice from formulated hEpo and Luc mRNA variants containing2 nucleotide modifications shown to have reduced immunoge-nicity (m1Ψ and mo5U) (16). Unmodified mRNAs were not in-cluded because in vivo protein expression can be obscured bystrong activation of innate immunity (18). For some hEpomRNAs, such as m1Ψ HBE3, we noted expression differencesbetween the cell lines and mice (Fig. 1 C andD). These differenceswere larger than the differences observed between cell lines, andmore pronounced for m1Ψ hEPO mRNA than for mo5U hEPOmRNA (SI Appendix, Fig. S1D). However, general expressiontrends were maintained in vivo (Fig. 1D). All 6 sequence variantscontaining m1Ψ expressed well (Fig. 1D, orange), but only 2 con-taining mo5U mRNA expressed at detectable levels (Fig. 1D,purple). Further, the codon optimized variant ECO expressed wellwith m1Ψ but not at all in mo5U. Even so, the best expressioncame from sequence variants containing mo5U (HAE4 and HAE3).The mo5U HAE4 variant produced >1.5-fold more protein thanthe best expressing m1Ψ variant (HAE3, Fig. 1D).The 10 Luc variants tested in vivo were chosen to represent
the widest possible range of protein expression observed in cellculture. As expected from the known biodistribution of mRNA-containing lipid nanoparticles (19), the liver was the main site ofprotein expression (SI Appendix, Fig. S2E). Luc mRNAs con-taining m1Ψ were highly expressed in vivo, particularly L18 andL7 (Fig. 2 C, Top). Variability in protein expression with mo5Uwas more exaggerated in vivo, as 7 of the 10 variants producedlittle to no protein (Fig. 2 C, Bottom). L18 was an exception, butstill produced >10-fold less Luc than the same sequence with m1Ψ.Notably, L7 produced large amounts of protein with m1Ψ butbarely detectable levels with mo5U (Fig. 2 C, Top versus Fig. 2 C,Bottom; note the y axis scales). These data suggest that expres-sion differences observed in cell culture persist and can be morepronounced for exogenous RNAs delivered in vivo (SI Appendix,Fig. S2D).
Protein Expression Differences Trends with mRNA ThermodynamicStability. Since codon usage alone could not fully explainsequence-dependent expression differences in mRNAs containingmodified nucleotides, we examined how modified nucleotidesmight affect mRNA secondary structure. We determined UVabsorbance melting curves for mRNAs across a range of expression
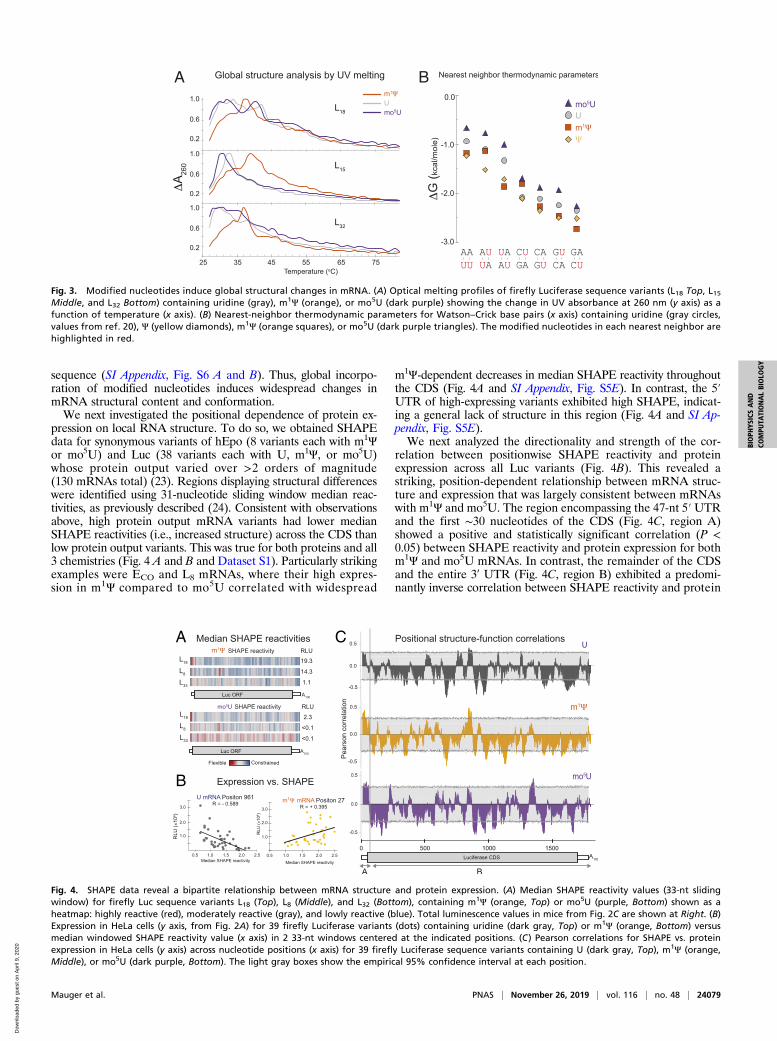
levels containing different uridine analogs (U, m1Ψ, and mo5U) asan overall measure of secondary structure. Highly expressingmRNAs underwent substantial melting transitions, detected assharp peaks in the melting curves, above 35 °C (e.g., variant L18with all 3 uridine analogs and L15 with m1Ψ only; Fig. 3A). Forsome variants (e.g., L15), inclusion of m1Ψ but not mo5U induceda shift to higher melting temperatures, suggesting global stabili-zation of structural features within the mRNA (Fig. 3A). Notably,L15 expression was much higher with m1Ψ than mo5U (Fig. 2A).Similar trends were observed in most, but not all, sequences tested(SI Appendix, Fig. S4A). Although these initial results suggested alink between RNA structural stability and modification-dependentprotein expression in vivo, higher resolution structural informationwas required.The RNA base-pairing thermodynamics is commonly un-
derstood in nearest-neighbor energy terms (20). Whereas theseparameters were previously reported for unmodified RNA andRNA containing Ψ, to our knowledge they have not yet beenestablished for m1Ψ or mo5U. To establish these parameters forΨ, m1Ψ, and mo5U, we performed optical melting experimentson 35 synthetic short RNA duplexes containing global substitu-tions of uridine with Ψ, m1Ψ, and mo5U (20). Nearest neighborscontaining Ψ (Fig. 3B, diamonds) and m1Ψ (Fig. 3B, squares)form substantially more stable base pairs than uridine (by0.25 and 0.18 kcal/mol on average, respectively; Fig. 3B, circles;SI Appendix, Table S1). In contrast, nearest neighbors containingmo5U (Fig. 3B, triangles) are destabilized by 0.28 kcal/mol rel-ative to uridine (Fig. 3B and SI Appendix, Table S1). The averagedifference for mo5U versus Ψ is −0.5 kcal/mol per nearest neigh-bor, or −1.0 kcal/mol per base pair. The impact of each nucleotidemodification on RNA is consistent across the nearest-neighborbase pairs when compared to U. This differs from a previousstudy (21) that found large context-dependent differences in en-ergies of single A-Ψ pairs, depending on the flanking A-U andG-C pairs (SI Appendix, Fig. S4B), suggesting that introduction ofsingle modified nucleotides can have complex, context-dependentimpacts on folding energies. The global differences in pairingenergies that we measured, summed over all base pairs, includinga modified nucleotide in a full-length mRNA, readily explain theobserved differences in the UV melting curves caused by inclusionof different modified nucleotides.
Position-Dependent Structure Correlates with High Expression. Toinvestigate how modified nucleotides impact mRNA structure atsingle nucleotide resolution, we used selective 2’-hydroxyl acyla-tion analyzed by primer-extension - mutational profiling (SHAPE-MaP) to probe RNA structure (22). We first verified that themethodology would produce high-quality data with m1Ψ andmo5U containing mRNAs (SI Appendix, Fig. S5A). In the absenceof the SHAPE reagent (1-methyl-6-nitroisatoic anhydride [1M6]),there was no evidence of increased background error rates bynext-generation sequencing (NGS) with either m1Ψ or mo5U (SIAppendix, Fig. S5B). The 1M6 treatment increased the mutationrates for RNAs containing either m1Ψ or mo5U to a similar extentas observed for uridine (SI Appendix, Fig. S5C). A comparison ofSHAPE-induced mutation rates at U bases revealed a trend withm1Ψ < U < mo5U, which is consistent with the expected pairingfrequency from the thermodynamic pairing energies (SI Appendix,Fig. S5D). Next, we measured RNA structure across the experi-mentally tested variants of hEpo containing U, m1Ψ, or mo5U(Dataset S1). Data for a representative sequence, hEpo HAE3,revealed local structure that differed dramatically by modifiednucleotide (SI Appendix, Fig. S5 A and D). Consistent with thethermodynamic melting data in many RNAs, m1Ψ stabilizedand mo5U destabilized structure (hEpo HAE3; see SI Appendix,Fig. S5 D and E). SHAPE-directed modeling of secondary struc-ture suggested that modified nucleotides can induce widespreadchanges to the secondary structure ensemble for the same
24078 | www.pnas.org/cgi/doi/10.1073/pnas.1908052116 Mauger et al.
Dow
nloa
ded
by g
uest
on
Apr
il 9,
202
0
sequence (SI Appendix, Fig. S6 A and B). Thus, global incorpo-ration of modified nucleotides induces widespread changes inmRNA structural content and conformation.We next investigated the positional dependence of protein ex-
pression on local RNA structure. To do so, we obtained SHAPEdata for synonymous variants of hEpo (8 variants each with m1Ψor mo5U) and Luc (38 variants each with U, m1Ψ, or mo5U)whose protein output varied over >2 orders of magnitude(130 mRNAs total) (23). Regions displaying structural differenceswere identified using 31-nucleotide sliding window median reac-tivities, as previously described (24). Consistent with observationsabove, high protein output mRNA variants had lower medianSHAPE reactivities (i.e., increased structure) across the CDS thanlow protein output variants. This was true for both proteins and all3 chemistries (Fig. 4 A and B and Dataset S1). Particularly strikingexamples were ECO and L8 mRNAs, where their high expres-sion in m1Ψ compared to mo5U correlated with widespread
m1Ψ-dependent decreases in median SHAPE reactivity throughoutthe CDS (Fig. 4A and SI Appendix, Fig. S5E). In contrast, the 5′UTR of high-expressing variants exhibited high SHAPE, indicat-ing a general lack of structure in this region (Fig. 4A and SI Ap-pendix, Fig. S5E).We next analyzed the directionality and strength of the cor-
relation between positionwise SHAPE reactivity and proteinexpression across all Luc variants (Fig. 4B). This revealed astriking, position-dependent relationship between mRNA struc-ture and expression that was largely consistent between mRNAswith m1Ψ and mo5U. The region encompassing the 47-nt 5′UTRand the first ∼30 nucleotides of the CDS (Fig. 4C, region A)showed a positive and statistically significant correlation (P <0.05) between SHAPE reactivity and protein expression for bothm1Ψ and mo5U mRNAs. In contrast, the remainder of the CDSand the entire 3ʹ UTR (Fig. 4C, region B) exhibited a predomi-nantly inverse correlation between SHAPE reactivity and protein
A B
Fig. 3. Modified nucleotides induce global structural changes in mRNA. (A) Optical melting profiles of firefly Luciferase sequence variants (L18 Top, L15Middle, and L32 Bottom) containing uridine (gray), m1Ψ (orange), or mo5U (dark purple) showing the change in UV absorbance at 260 nm (y axis) as afunction of temperature (x axis). (B) Nearest-neighbor thermodynamic parameters for Watson–Crick base pairs (x axis) containing uridine (gray circles,values from ref. 20), Ψ (yellow diamonds), m1Ψ (orange squares), or mo5U (dark purple triangles). The modified nucleotides in each nearest neighbor arehighlighted in red.
B
A C
Fig. 4. SHAPE data reveal a bipartite relationship between mRNA structure and protein expression. (A) Median SHAPE reactivity values (33-nt slidingwindow) for firefly Luc sequence variants L18 (Top), L8 (Middle), and L32 (Bottom), containing m1Ψ (orange, Top) or mo5U (purple, Bottom) shown as aheatmap: highly reactive (red), moderately reactive (gray), and lowly reactive (blue). Total luminescence values in mice from Fig. 2C are shown at Right. (B)Expression in HeLa cells (y axis, from Fig. 2A) for 39 firefly Luciferase variants (dots) containing uridine (dark gray, Top) or m1Ψ (orange, Bottom) versusmedian windowed SHAPE reactivity value (x axis) in 2 33-nt windows centered at the indicated positions. (C) Pearson correlations for SHAPE vs. proteinexpression in HeLa cells (y axis) across nucleotide positions (x axis) for 39 firefly Luciferase sequence variants containing U (dark gray, Top), m1Ψ (orange,Middle), or mo5U (dark purple, Bottom). The light gray boxes show the empirical 95% confidence interval at each position.
Mauger et al. PNAS | November 26, 2019 | vol. 116 | no. 48 | 24079
BIOPH
YSICSAND
COMPU
TATIONALBIOLO
GY
Dow
nloa
ded
by g
uest
on
Apr
il 9,
202
0

expression for U, m1Ψ, and mo5U. For all modified nucleotides,the percent of nucleotides with negative correlations far out-number those positions with positive correlations (U: 78.6%; m1Ψ:78.7%; and mo5U: 72.9%) (Fig. 4C). In other words, increasedsecondary structure in these regions correlated with improvedprotein expression, consistent with the global structural propertiesmeasured by optical melting. Although statistically underpowered,a similar trend of higher protein expression from structured codingsequences was evident in the hEPO data (SI Appendix, Fig. S7).Notably, however, the strength of the structure–function correla-tion varied across the metasequence. Specific regions of the CDSexhibited statistically significant correlations between SHAPEreactivity and protein expression correlations of which the vastmajority were negative rather than positive (U: 1 positive,15 negative; m1Ψ: 1 positive, 18 negative; and mo5U: 2 positive,17 negative) (Fig. 4C).The observed structure–function relationships were evalu-
ated further using targeted mutations. We examined the role offlexibility in region A (47-nt 5′ UTR and the first 30 nucleotidesof the CDS) by creating chimeras combining variants with dif-ferent structural signatures. Luc variants L7 and L27 (Fig. 2A)both exhibited lower than average protein expression in m1Ψ.Both also exhibited low SHAPE reactivity (high structure)throughout both regions A and B (Dataset S1). However, whenwe replaced region A with the relatively unstructured corre-sponding region A from the high expresser L18 (Fig. 4A) to pro-duce fusion mRNAs FL18/7 and FL18/27, both region A SHAPEreactivity and Luc expression increased (SI Appendix, Fig. S8A andFig. 5B). The FL18/7 and FL18/27 chimeras only differed by2 and 4 individual bases from their respective parents (note thatthe 47-nucleotide 5′UTR is common to all sequences). Consistentwith the structure–function correlations within region B (the restof the CDS and the 3′ UTR), a Luciferase variant (LHS) pre-dicted to have more stable secondary structure in CDS (LHS forhigh structure) yielded 1.5-fold greater protein expression than L18in mo5U (SI Appendix, Fig. S8C). The expression of LHS in m1Ψwas slightly lower than L18 (SI Appendix, Fig. S8C), likely due tomore stable secondary structure near the start codon (SI Appendix,Fig. S8D). While this is consistent with our observation that stableCDS structure correlates with increased protein expression, amore rigorous approach was needed to disentangle the role ofstructure from codon optimality.
Codon Usage and mRNA Structure Synergize to Determine RibosomeLoading and mRNA Half-Life. The redundancy of the genetic codemeans that it is impossible to completely enumerate the rela-tionships between codon usage, mRNA secondary structure, andprotein expression. Instead we computationally generated sets of150,000 synonymous CDSs encoding eGFP-degron with 3 differ-ent algorithms. For each sequence, we calculated relative synon-ymous codon usage (RSCU, ref. 25) and the predicted minimumfree energy (MFE) structure (26). Randomly choosing synon-ymous codons with equal probability generates sequences thatcluster around 0.75 ± 0.05 RSCU and −325 ± 40 kcal/mol MFE(Fig. 5A, red). Using probabilities weighted by frequency in thehuman transcriptome (27) generates a similar-shaped distribution,but shifted to both significantly higher RSCU (0.825 ± 0.05, P <0.05) and greater structure (−340 ± 40 kcal/mol, P < 0.05) (Fig.5A, blue). Next, we developed an algorithm that varied the indi-vidual codon choice probabilities dynamically so that RCSU andMFE were both driven to their accessible extremes (Fig. 5A, gray).The space covered is far greater than for random or frequency-weighted sequences, but has well-defined limits. Notably, becauseoptimal codons tend to be GC rich the structure of the geneticcode inherently disallows sequences with both highly optimal co-dons and low structure (Fig. 5 A, Top Left corner) or rare codonsand high structure (Fig. 5 A, Bottom Right corner).
To investigate how the limits of codon optimality and allowablestructure affect protein expression, we selected 6 regions collec-tively spanning the range of accessible space (Fig. 5A, boxes).From each of these 6 selected regions, we synthesized 5 synony-mous sequences (30 in total) and followed the production anddecay of GFP fluorescence over a 20-h timecourse in HeLa cells.This enabled us to directly compare the effects changing eachfactor independently, for example changes in MFE at constantRSCU (Fig. 5A, yellow vs. orange or purple vs. green) or theconverse (Fig. 5A, yellow vs. purple or orange vs. green). Thecalculated folding energies of a subset of the eGFP mRNAs werevalidated by obtaining both SHAPE data and data-directed fold-ing models (SI Appendix, Fig. S9 A and B). As expected, eGFP-degron mRNAs containing rare codons and very little secondarystructure produced minimal protein (Fig. 5B, brown). Low proteinexpression was also observed for mRNAs with middling scores inboth relative synonymous codon usage and structure (Fig. 5B,yellow). Notably, increasing either the codon optimality or sec-ondary structure while holding the other feature constant bothincreased median protein expression (Fig. 5B, orange and purple,respectively, P value < 0.01). The set of mRNAs with the highestcodon optimality and most structure, however, showed no addi-tional increase in median protein expression (Fig. 5B, green, Pvalue = 0.55). Local percentages of both U and A gave similarnegative correlation across the entire CDS (SI Appendix, Fig. S10).Similar effects were observed in AML12 cells (SI Appendix, Fig.S11A). Combined, these data indicate that codon usage and sec-ondary structure are both important, but distinct regulators ofoverall protein expression.Next, we analyzed the kinetics of protein production. Real-
time, continuous expression data were fit by a model includingrate constants for mRNA translation, mRNA functional half-life,maturation of eGFP protein into its fluorescent form (28), andeGFP protein degradation (Fig. 5C). Functional half-life reflects theproductive life of the mRNA in generating protein and is not nec-essarily the same as physical half-life ending with degradation—itcould also reflect intracellular trafficking or sequestrationaway from the ribosomal machinery. Since all mRNA sequencesexpressed the same eGFP protein sequence and we measuredfluorescent (i.e., mature functional) protein, we could assumeconstant rates of protein maturation (kMat) and protein degrada-tion (λFluor, Fig. 5C). Fitting this model to the experimental dataallowed us to calculate the rate of translation (kTrans) and func-tional half-life (t1/2 RNA) individually for each mRNA variant (Fig.5D and SI Appendix, Table S2). Surprisingly, whereas overallprotein expression correlated poorly with mRNA translation rate(r = 0.45), it correlated remarkably well with functional mRNAhalf-life (r = 0.90, Fig. 5E). Although the model was necessarilysimplistic, these results were consistent across multiple computa-tional models including models containing a delivery rate (SI Ap-pendix, Fig. S11 B and C). Highly structured mRNAs had a >2-foldincrease in functional mRNA half-life relative to those with mid-dling degrees of secondary structure, regardless of whether theircodon usage was middling or optimal (Fig. 5F). Thus, secondarystructure increases protein output by extending mRNA functionalhalf-life in a previously unrecognized regulatory mechanism in-dependent of codon optimality.
DiscussionThe amount of protein produced from any given mRNA (i.e., thetranslational output) is influenced by multiple factors specifiedby the primary nucleotide sequence. These factors include GCcontent, codon usage, codon pairs, and secondary structure.Disentangling the individual roles played by each of these factorsin translational output of endogenous mRNAs, however, hasproven difficult because of their high covariance. To separate theseconfounding relationships, we directly manipulated the second-ary structure of exogenously delivered mRNAs using 2 distinct
24080 | www.pnas.org/cgi/doi/10.1073/pnas.1908052116 Mauger et al.
Dow
nloa
ded
by g
uest
on
Apr
il 9,
202
0

approaches. First, we globally replaced uridine with modified an-alogs having markedly different base-pairing thermodynamics—this led to global secondary structure changes without altering themRNA sequence. Second, we used computational design to iden-tify sets of mRNAs whose coding sequences explored the limits ofcodon usage and secondary structure.Global incorporation of different modified nucleotides often
(but not always) markedly changed mRNA expression. This ef-fect was seen across numerous synonymous coding variants ofmultiple proteins, in several different cell lines, and in vivo (Figs.1 and 2). m1Ψ generally gave higher expression than U or mo5Ufor the same sequence. Biophysical studies revealed that m1Ψ
and mo5U have dramatically different and opposite effectscompared to U (stabilizing and destabilizing, respectively) onoverall mRNA folding, nearest-neighbor base-pairing thermo-dynamics, and secondary structure pattern as mapped by SHAPE(Figs. 3 and 4). We also found that secondary structure corre-lates with protein expression in a position-specific manner (Fig. 4).Consistent with previous reports (10–13), highly expressedmRNAs had low structure in the entire 5′ UTR and the first ∼30CDS nucleotides. Notably, even though the constant, 47-nucleotide5′UTR was chosen to support high expression across many codingsequences, we still observed a clear structure–expression rela-tionship in this region. Unexpectedly, however, we found that a
A B
D
F
C
E
Fig. 5. Half-life of computationally designed eGFP-degron mRNAs is determined by codon usage and mRNA structure. (A) Codon optimality (relative syn-onymous codon usage, y axis) versus secondary structure (energy of the predicted MFE structure, x axis) for sets of 150,000 generated eGFP sequence variantsgenerated using codons chosen randomly (red), weighted in proportion to the human genome(blue), and using our algorithm (gray). Colored boxes showregions from which sequences were selected for further testing. (B) Total integrated eGFP fluorescence measured every 2 h for 86 h in HeLa cells (relativefluorescence unit [RFU], y axis) for 6 sets of 5 mRNAs containing m1Ψ (dots, with median as black line) with differing degrees of codon optimality and/orsecondary structure (x axis, as in A). Significant differences by 2-way ANOVA comparisons are indicated by lines above, and P values are noted by asterisks(**P ≤ 0.01). (C) Model of eGFP expression kinetics. Simulated curves based on equations for changes in levels of mRNA (mRNA, orange), immature non-fluorescent protein (inactive protein, gray), and mature fluorescent protein (fluor, green) over time using exponential decay rates for mRNA (λRNA) and eGFPprotein (λFluor), and rates of translation (kTrans) and protein maturation (kMAT). mRNA half-lives (t1/2 RNA) were calculated from the observed mRNA decay rates.(D) eGFP-degron fluorescence in HeLa cells (RFU, y axis) versus time (x axis) as measured experimentally (solid colored lines as in A) and fitted according to themodel in C (dashed black lines) for representative sequence variants with differing degrees of codon optimality and/or secondary structure (as in A).Translation rate constants (kTrans) and mRNA half-lives (t1/2 RNA) as derived from the model described in C are shown. (E) Total eGFP-degron fluorescence inHeLa cells (RFU, y axis) versus the modeled rate constants for translation (kTrans, Left) or mRNA functional half-life (λRNA, Right) for 20 sequence variantscontaining m1Ψ as in D. Linear regression (black line) and Pearson correlation are shown. (F) Modeled functional mRNA half-lives (λRNA, y axis) for 4 sets of5 eGFP-degron sequence variants with differing degrees of codon optimality and/or secondary structure (x axis, as in A and B).
Mauger et al. PNAS | November 26, 2019 | vol. 116 | no. 48 | 24081
BIOPH
YSICSAND
COMPU
TATIONALBIOLO
GY
Dow
nloa
ded
by g
uest
on
Apr
il 9,
202
0
highly structured CDS region downstream of the first 30 nucleo-tides also correlates with increased protein expression. By ratio-nally designing sequences to contain more CDS structure, wecould rescue low-expressing mo5U-containing mRNA variants (SIAppendix, Fig. S8A). Protein expression from sequences selectedto vary the degree of secondary structure independent of codonusage, and vice versa, revealed that secondary structure and codonusage each have distinct and roughly equivalent impacts on pro-tein output (Fig. 5). For this set of mRNAs, total protein outputwas driven primarily by changes in functional mRNA half-life.There are several possible mechanisms for the observed rela-
tionship between CDS secondary structure and functional mRNAhalf-life. It is possible that higher mRNA structure improves in-teraction with RNA binding proteins (RBPs) that positively im-pact translation, such as double-stranded RNA binding proteinStaufen (29) or reduces accessibility to single strand-specific en-donucleases, although endonucleolytic cleavage is thought to belimited to specific cases (30). Another possibility is that ribosomequeuing near the start codon may facilitate translation initiation(31). This could explain the structural signature in the beginning ofthe CDS, but it is worth noting that our data suggest a beneficialeffect for structure throughout the CDS (Fig. 4C). Another pos-sibility is that structure leads to ribosome pausing at specific lo-cations in the peptide, crucial for proper protein folding, andtherefore activity, of certain multidomain proteins (32, 33).Yet another possibility is that mRNA structure slows ribosome
movement, leading to enhanced functional protein output andextended mRNA half-life. Biophysical experiments have shownthat secondary structure can slow ribosome processivity (34).While counterintuitive, the increase in protein output is consis-tent with previous work in cell-free lysates, showing that mRNAscontaining m1Ψ slow ribosome elongation, increase total proteinoutput, and improve initiation through decreased phosphoryla-tion of the initiation factor, eIF2α (35). Our data help explain thefirst 2 observations, in that m1Ψ stabilizes mRNA secondarystructure leading to greater protein output. If eIF2α dephos-phorylation were the primary driver of the change in translation,we would have expected to see a strong correlation betweentranslation efficiency and total protein output. However, wefound very little correlation between translation efficiency, whichshould closely correlate to initiation rate and total protein output(Fig. 5E). Our use of a standardized 5′ UTR lacking strongtranslational modulators found in many endogenous genes, suchas upstream ORFs and specific regulatory structures, likely ruleout effects of those elements. Interestingly, a recent study inmammalian neurons links codon-specific ribosome stalling di-rectly to eIF2α phosphorylation through the kinase GCN2 (36),suggesting that translation initiation and elongation may behighly interconnected (37).Further, ribosomal pauses induced by rare codons have re-
cently been directly linked to ribosomal frame shifting (38) andmRNA degradation (4, 39). An mRNA degradation-based mech-
anism is consistent with our data showing a tight correlation be-tween mRNA half-life and total protein output (Fig. 5E). Notably,ribosome collisions were demonstrated to activate the mRNAdegradation through the no-go decay (NGD) pathway and de-crease mRNA half-life (40, 41). One suggested mechanism for thisregulation is the action of the ubiquitin ligase, ZNF598, on thesmall subunit proteins of collided diribosomes (42). An aspect ofthis regulation that remains poorly understood is the relationshipbetween ribosomal pausing/collision and secondary structure. Al-though secondary structure likely slows ribosome progression, theribosome is an inherently powerful helicase that necessarily un-winds mRNA structure during elongation (43). We propose thatlocal secondary structure elements unwound by each advancingribosome should quickly reform after that ribosome has moved onand may thus act as buffers to prevent collisions between adjacentribosomes on the same message. If ribosome collisions play a cen-tral role in translational quality control, local secondary structuremay be a key regulator of functional mRNA half-life by enforcingspacing between ribosomes and thereby decreasing collisions.
MethodsAnimal Research. All animal studies were approved by and performed inaccordance with the Institutional Animal Care and Use Committee ofModerna, Inc.
Sequence Design. eGFP variants were stochastically generated using onlyfrequently used codons. For hEpo regions and Luc, variants were deter-ministically encoded with one codon per amino acid.
mRNA Preparation. mRNAs for hEpo, eGFP, and Luc were synthesized in vitrousing all unmodified nucleotides or global substitutions of uridine (U) for themodified uridine analogs pseudouridine (Ψ), N1-methyl-pseudouridine (m1Ψ), 5-methyoxy-urdine (mo5U), or a combination of Ψ and 5-methyl-cytidine (m5C).
Determination of Nearest-Neighbor Thermodynamic Parameters. UV-meltingexperiments were performed on 39 synthetic RNA duplexes with Ψ, m1Ψ,and mo5U instead of uridine, and the nearest-neighbor free energy contri-butions for each modified nucleotide to be determined using establishedmethods (20).
Computational Modeling of eGFP Expression Data. Timecourse data werecollected from HeLa and AML12 cells transfected with the designed eGFP-degron mRNAs. These data were used to fit the computational model ofactive protein production and degradation in which rate terms for proteinmaturation and degradation were held constant and the translation effi-ciency and rate of RNA degradation were allowed to vary to find the best fitto the experimental data.
ACKNOWLEDGMENTS. We thank DNA Software for expert work in theexperimental determination of the nearest-neighbor parameters for mod-ified nucleotides; Katie Hughes, Chris Pepin, and Wei Zheng for statisticsadvice and support; and Paul Yourik, Mihir Metkar, Alicia Bicknell, RuchiJain, and Caroline Köhrer for critical reading of the manuscript. This workwas supported by Moderna, Inc.
1. C. Gustafsson, S. Govindarajan, J. Minshull, Codon bias and heterologous protein
expression. Trends Biotechnol. 22, 346–353 (2004).2. E. J. Horstick et al., Increased functional protein expression using nucleotide sequence
features enriched in highly expressed genes in zebrafish. Nucleic Acids Res. 43, e48 (2015).3. D. E. Weinberg et al., Improved ribosome-footprint and mRNAmeasurements provide
insights into dynamics and regulation of yeast translation. Cell Rep. 14, 1787–1799
(2016).4. V. Presnyak et al., Codon optimality is a major determinant of mRNA stability. Cell
160, 1111–1124 (2015).5. F. Tulloch, N. J. Atkinson, D. J. Evans, M. D. Ryan, P. Simmonds, RNA virus attenuation
by codon pair deoptimisation is an artefact of increases in CpG/UpA dinucleotide
frequencies. eLife 3, e04531 (2014).6. T. Tuller et al., An evolutionarily conserved mechanism for controlling the efficiency
of protein translation. Cell 141, 344–354 (2010).7. P. Simmonds, F. Tulloch, D. J. Evans, M. D. Ryan, Attenuation of dengue (and other
RNA viruses) with codon pair recoding can be explained by increased CpG/UpA di-
nucleotide frequencies. Proc. Natl. Acad. Sci. U.S.A. 112, E3633–E3634 (2015).
8. B. Futcher et al., Reply to Simmonds et al.: Codon pair and dinucleotide bias have notbeen functionally distinguished. Proc. Natl. Acad. Sci. U.S.A. 112, E3635–E3636 (2015).
9. S. A. Mortimer, M. A. Kidwell, J. A. Doudna, Insights into RNA structure and functionfrom genome-wide studies. Nat. Rev. Genet. 15, 469–479 (2014).
10. Y. Ding et al., In vivo genome-wide profiling of RNA secondary structure reveals novelregulatory features. Nature 505, 696–700 (2014).
11. Y. Wan et al., Landscape and variation of RNA secondary structure across the humantranscriptome. Nature 505, 706–709 (2014).
12. P. Shah, Y. Ding, M. Niemczyk, G. Kudla, J. B. Plotkin, Rate-limiting steps in yeastprotein translation. Cell 153, 1589–1601 (2013).
13. T. Tuller, H. Zur, Multiple roles of the coding sequence 5′ end in gene expressionregulation. Nucleic Acids Res. 43, 13–28 (2015).
14. M. I. Newby, N. L. Greenbaum, A conserved pseudouridine modification in eu-karyotic U2 snRNA induces a change in branch-site architecture. RNA 7, 833–845(2001).
15. E. Kierzek, R. Kierzek, The thermodynamic stability of RNA duplexes and hairpinscontaining N6-alkyladenosines and 2-methylthio-N6-alkyladenosines. Nucleic AcidsRes. 31, 4472–4480 (2003).
24082 | www.pnas.org/cgi/doi/10.1073/pnas.1908052116 Mauger et al.
Dow
nloa
ded
by g
uest
on
Apr
il 9,
202
0

16. K. Karikó et al., Incorporation of pseudouridine into mRNA yields superior non-immunogenic vector with increased translational capacity and biological stability.Mol. Ther. 16, 1833–1840 (2008).
17. J. B. Plotkin, G. Kudla, Synonymous but not the same: The causes and consequences ofcodon bias. Nat. Rev. Genet. 12, 32–42 (2011).
18. M. S. Kormann et al., Expression of therapeutic proteins after delivery of chemicallymodified mRNA in mice. Nat. Biotechnol. 29, 154–157 (2011).
19. S. Sabnis et al., A novel amino lipid series for mRNA delivery: Improved endosomalescape and sustained pharmacology and safety in non-human primates. Mol. Ther.26, 1509–1519 (2018).
20. T. Xia et al., Thermodynamic parameters for an expanded nearest-neighbor model forformation of RNA duplexes with Watson-Crick base pairs. Biochemistry 37, 14719–14735 (1998).
21. G. A. Hudson, R. J. Bloomingdale, B. M. Znosko, Thermodynamic contribution andnearest-neighbor parameters of pseudouridine-adenosine base pairs in oligoribonucleotides.RNA 19, 1474–1482 (2013).
22. N. A. Siegfried, S. Busan, G. M. Rice, J. A. Nelson, K. M. Weeks, RNA motif discovery bySHAPE and mutational profiling (SHAPE-MaP). Nat. Methods 11, 959–965 (2014).
23. D. M. Mauger, B. J. Cabral, V. Presnyak, M. J. Moore, mRNA structure regulatesprotein expression through changes in functional half-life. Gene Expression Omnibus(GEO) database. https://www.ncbi.nlm.nih.gov/geo/query/acc.cgi?acc=GSE139176. Deposited21 October 2019.
24. J. M. Watts et al., Architecture and secondary structure of an entire HIV-1 RNA genome.Nature 460, 711–716 (2009).
25. S. Scherer, Guide to the Human Genome (Cold Spring Harbor Laboratory Press, ColdSpring Harbor, NY, 2010) p. xiv, 1008 p.
26. Z. J. Lu, D. H. Turner, D. H. Mathews, A set of nearest neighbor parameters for pre-dicting the enthalpy change of RNA secondary structure formation. Nucleic Acids Res.34, 4912–4924 (2006).
27. Y. Nakamura, T. Gojobori, T. Ikemura, Codon usage tabulated from internationalDNA sequence databases: Status for the year 2000. Nucleic Acids Res. 28, 292 (2000).
28. A. Crameri, E. A. Whitehorn, E. Tate, W. P. Stemmer, Improved green fluorescentprotein by molecular evolution using DNA shuffling. Nat. Biotechnol. 14, 315–319(1996).
29. J. Jungfleisch et al., A novel translational control mechanism involving RNA structureswithin coding sequences. Genome Res. 27, 95–106 (2017).
30. D. R. Schoenberg,Mechanisms of endonuclease-mediatedmRNA decay.Wiley Interdiscip.Rev. RNA 2, 582–600 (2011).
31. M. G. Kearse et al., Ribosome queuing enables non-AUG translation to be resistant tomultiple protein synthesis inhibitors. Genes Dev. 33, 871–885 (2019).
32. C. Kimchi-Sarfaty et al., A “silent” polymorphism in the MDR1 gene changes substratespecificity. Science 315, 525–528 (2007).
33. R. Rauscher, Z. Ignatova, Timing during translation matters: Synonymous mutations inhuman pathologies influence protein folding and function. Biochem. Soc. Trans. 46,937–944 (2018).
34. J. D. Wen et al., Following translation by single ribosomes one codon at a time. Nature452, 598–603 (2008).
35. Y. V. Svitkin et al., N1-methyl-pseudouridine in mRNA enhances translation througheIF2α-dependent and independent mechanisms by increasing ribosome density. NucleicAcids Res. 45, 6023–6036 (2017).
36. R. Ishimura, G. Nagy, I. Dotu, J. H. Chuang, S. L. Ackerman, Activation of GCN2 kinaseby ribosome stalling links translation elongation with translation initiation. eLife 5,e14295 (2016).
37. D. Chu et al., Translation elongation can control translation initiation on eukaryoticmRNAs. EMBO J. 33, 21–34 (2014).
38. C. L. Simms, L. L. Yan, J. K. Qiu, H. S. Zaher, Ribosome collisions result in +1frameshifting in the absence of no-go decay. Cell Rep. 28, 1679–1689.e4 (2019).
39. A. Radhakrishnan et al., The DEAD-box protein Dhh1p couples mRNA decay andtranslation by monitoring codon optimality. Cell 167, 122–132.e9 (2016).
40. C. L. Simms, L. L. Yan, H. S. Zaher, Ribosome collision is critical for quality controlduring no-go decay. Mol. Cell 68, 361–373.e5 (2017).
41. K. N. D’Orazio et al., The endonuclease Cue2 cleaves mRNAs at stalled ribosomesduring no go decay. eLife 8, e49117 (2019).
42. S. Juszkiewicz et al., ZNF598 is a quality control sensor of collided ribosomes.Mol. Cell72, 469–481.e7 (2018).
43. A. M. Mustoe et al., Pervasive regulatory functions of mRNA structure revealed byhigh-resolution SHAPE probing. Cell 173, 181–195.e18 (2018).
44. M. Welch et al., Design parameters to control synthetic gene expression in Escherichiacoli. PLoS One 4, e7002 (2009).
Mauger et al. PNAS | November 26, 2019 | vol. 116 | no. 48 | 24083
BIOPH
YSICSAND
COMPU
TATIONALBIOLO
GY
Dow
nloa
ded
by g
uest
on
Apr
il 9,
202
0