Embed Size (px)
Citation preview

MRN fMRI CourseMRN fMRI Course Lecture 3.4 (1h): Group ICALecture 3.4 (1h): Group ICA
Vince D. Calhoun, Ph.D.Vince D. Calhoun, Ph.D.Chief Technology Officer & Chief Technology Officer &
Director, Image Analysis & MR ResearchDirector, Image Analysis & MR ResearchThe Mind Research NetworkThe Mind Research Network
Associate Professor, Electrical and Computer Engineering,Associate Professor, Electrical and Computer Engineering,Neurosciences, and Computer ScienceNeurosciences, and Computer Science
The University of New MexicoThe University of New Mexico

2010 MRN fMRI Course 2010 MRN fMRI Course 2

2010 MRN fMRI Course 2010 MRN fMRI Course 3
• Using ICA to analyze fMRI data of multiple subjects Using ICA to analyze fMRI data of multiple subjects raises some questions:raises some questions:• How are components to be combined across subjects?How are components to be combined across subjects?
• How should the final results be thresholded and/or presented? How should the final results be thresholded and/or presented?

2010 MRN fMRI Course 2010 MRN fMRI Course 4
Group ICAGroup ICA
Sub 1Sub 1 Sub NSub N
ICAICA ICAICA
??
2010 MRN fMRI Course 2010 MRN fMRI Course 5
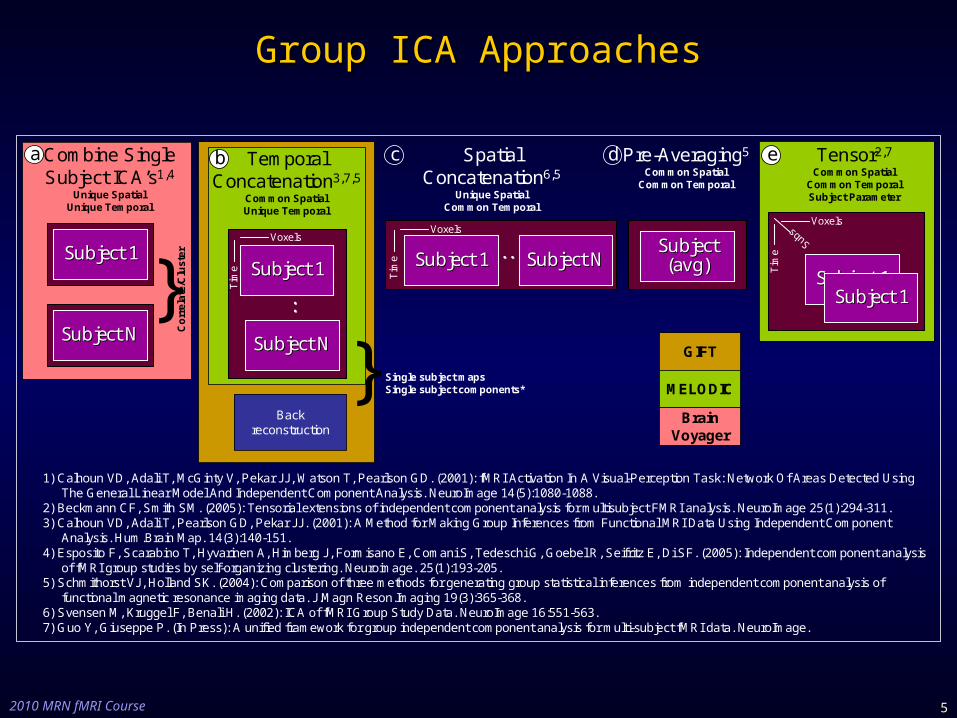
Group ICA ApproachesGroup ICA Approaches
Subject 1Subject 1
Subject NSubject N
Subject 1Subject 1 Subject NSubject N
TemporalConcatenation3,7,5
Common SpatialUnique Temporal
SpatialConcatenation6,5
Unique SpatialCommon Temporal
Pre-Averaging5
Common SpatialCommon Temporal
Subject Subject (avg)(avg)
Tensor2,7
Common SpatialCommon TemporalSubject Parameter
Subject 1Subject 1Subject 1Subject 1
Tim
eVoxels
::
::
Subs
Tim
e
Voxels
Tim
e
Voxels
Backreconstruction
} Single subject mapsSingle subject components*
GIFT
MELODIC
Subject 1Subject 1
Subject NSubject N
Combine Single Subject ICA’s1,4
Unique SpatialUnique Temporal
}
Co
rrel
ate/
Clu
ster
BrainVoyager
1) Calhoun VD, Adali T, McGinty V, Pekar JJ, Watson T, Pearlson GD. (2001): fMRI Activation In A Visual-Perception Task: Network Of Areas Detected Using The General Linear Model And Independent Component Analysis. NeuroImage 14(5):1080-1088.
2) Beckmann CF, Smith SM. (2005): Tensorial extensions of independent component analysis for multisubject FMRI analysis. NeuroImage 25(1):294-311.3) Calhoun VD, Adali T, Pearlson GD, Pekar JJ. (2001): A Method for Making Group Inferences from Functional MRI Data Using Independent Component
Analysis. Hum.Brain Map. 14(3):140-151.4) Esposito F, Scarabino T, Hyvarinen A, Himberg J, Formisano E, Comani S, Tedeschi G, Goebel R, Seifritz E, Di SF. (2005): Independent component analysis
of fMRI group studies by self-organizing clustering. Neuroimage. 25(1):193-205.5) Schmithorst VJ, Holland SK. (2004): Comparison of three methods for generating group statistical inferences from independent component analysis of
functional magnetic resonance imaging data. J.Magn Reson.Imaging 19(3):365-368.6) Svensen M, Kruggel F, Benali H. (2002): ICA of fMRI Group Study Data. NeuroImage 16:551-563.7) Guo Y, Giuseppe P. (In Press): A unified framework for group independent component analysis for multi-subject fMRI data. NeuroImage.
a b c d e

2010 MRN fMRI Course 2010 MRN fMRI Course 6
Approach 1Approach 1• Separate ICA analysis for each subject Separate ICA analysis for each subject [V. D. Calhoun, T. [V. D. Calhoun, T.
Adali, V. McGinty, J. J. Pekar, T. Watson, and G. D. Pearlson, "FMRI Activation In A Visual-Adali, V. McGinty, J. J. Pekar, T. Watson, and G. D. Pearlson, "FMRI Activation In A Visual-Perception Task: Network Of Areas Detected Using The General Linear Model And Independent Perception Task: Network Of Areas Detected Using The General Linear Model And Independent Components Analysis," Components Analysis," NeuroImageNeuroImage, vol. 14, pp. 1080-1088, 2001.], vol. 14, pp. 1080-1088, 2001.]
• Must select which components to compare between the Must select which components to compare between the individualsindividuals
Sub 1Sub 1 Sub NSub N
ICAICA ICAICA
??

2010 MRN fMRI Course 2010 MRN fMRI Course 7
ExampleExample
……15 “events”15 “events”
Press buttons (1-Press buttons (1-4) to indicate 4) to indicate
choicechoice
11 22 33 44
Time (seconds)Time (seconds)
00 15.4 15.4 31.531.5 47.047.0 300 300

2010 MRN fMRI Course 2010 MRN fMRI Course 8
SPM ResultsSPM ResultsN=10N=10
P<0.05 correctedP<0.05 corrected
SPM revealed a large SPM revealed a large network of areas including: network of areas including: •frontal eye fieldsfrontal eye fields•supplementary motor areas supplementary motor areas •primary visualprimary visual•visual association visual association •basal gangliabasal ganglia•thalamic, and anthalamic, and an•(unexpectedly) large (unexpectedly) large cerebellar activationcerebellar activation•bilateral inferior parietal bilateral inferior parietal regions were regions were deactivateddeactivated (not shown)(not shown)

2010 MRN fMRI Course 2010 MRN fMRI Course 9
ICA ResultsICA ResultsN=10N=10Z>3.1Z>3.1
ICA revealed a large network of ICA revealed a large network of similar areas including: similar areas including: •frontal eye fields (blue) frontal eye fields (blue) •supplementary motor areas supplementary motor areas (green w/ outline)(green w/ outline)•primary visual (red)primary visual (red)•visual association (red)visual association (red)•thalamic (red)thalamic (red)•basal ganglia (green w/ outline)basal ganglia (green w/ outline)•a large cerebellar activation a large cerebellar activation (red)(red)•bilateral inferior parietal bilateral inferior parietal deactivationsdeactivations (not shown) (not shown)
ICA also revealed areas not ICA also revealed areas not identified by SPM including:identified by SPM including:•primary motor (green)primary motor (green)•frontal regions anterior to the frontal regions anterior to the frontal eye fields (blue)frontal eye fields (blue)•superior parietal regions (blue)superior parietal regions (blue)

2010 MRN fMRI Course 2010 MRN fMRI Course 10
ICA: Single SubjectICA: Single Subject
The ICA maps The ICA maps from one subject from one subject for the visual and for the visual and
basal ganglia basal ganglia components are components are depicted along depicted along with their time with their time courses (basal courses (basal
ganglia in green ganglia in green and visual in pink)and visual in pink)
Note that the Note that the visual time course visual time course
precedes the precedes the motor time coursemotor time course

2010 MRN fMRI Course 2010 MRN fMRI Course 11
Event-Averaged Time CoursesEvent-Averaged Time Courses•Time courses from Time courses from selected voxels in the raw selected voxels in the raw data (a) and time courses data (a) and time courses produced by the ICA produced by the ICA method (b).method (b).•In all cases the time In all cases the time courses are event-averaged courses are event-averaged (according to when the (according to when the figure was presented) figure was presented) within each participant and within each participant and then averaged across all then averaged across all ten participants.ten participants.•Voxels from the raw data Voxels from the raw data were selected by choosing were selected by choosing a local maximum in the a local maximum in the activation map and activation map and averaging the two averaging the two surrounding voxels in each surrounding voxels in each direction.direction.•Dashed lines indicate the Dashed lines indicate the standard error of the mean.standard error of the mean.

2010 MRN fMRI Course 2010 MRN fMRI Course 12
Approach 2Approach 2• Group ICA (stacking images)Group ICA (stacking images)• [V. D. Calhoun, T. Adali, G. D. Pearlson, and J. J. Pekar, "A Method for Making Group Inferences [V. D. Calhoun, T. Adali, G. D. Pearlson, and J. J. Pekar, "A Method for Making Group Inferences
From Functional MRI Data Using Independent Component Analysis," From Functional MRI Data Using Independent Component Analysis," Hum. Brain Map.Hum. Brain Map., vol. 14, pp. , vol. 14, pp. 140-151, 2001.]140-151, 2001.]
• [V. J. Schmithorst and S. K. Holland, "Comparison of Three Methods for Generating Group [V. J. Schmithorst and S. K. Holland, "Comparison of Three Methods for Generating Group Statistical Inferences From Independent Component Analysis of Functional Magnetic Resonance Statistical Inferences From Independent Component Analysis of Functional Magnetic Resonance Imaging Data," Imaging Data," J. Magn Reson. ImagingJ. Magn Reson. Imaging, vol. 19, pp. 365-368, 2004.], vol. 19, pp. 365-368, 2004.]
• Components and time courses can be directly comparedComponents and time courses can be directly compared
Sub 1Sub 1
Sub NSub N
ICAICA
Sub 1Sub 1 Sub NSub N

2010 MRN fMRI Course 2010 MRN fMRI Course 13
Group ICAGroup ICA
XX
Subject 1Subject 1
Subject NSubject N
DataData
AA S_aggS_agg
ICAICA
AA11
AANN
Subject iSubject i
Back-reconstructionBack-reconstruction
1
AAii SSii

2010 MRN fMRI Course 2010 MRN fMRI Course 14
SimulationSimulation
Nine simulated source maps and Nine simulated source maps and time courses were generated, time courses were generated, followed by an ICA estimation. followed by an ICA estimation. The red lines indicate the The red lines indicate the tt<4.5 <4.5 boundariesboundaries

2010 MRN fMRI Course 2010 MRN fMRI Course 15
Are the data separable? (Simulation)Are the data separable? (Simulation)•A natural concern is A natural concern is whether the back-whether the back-reconstructed maps from reconstructed maps from individual subjects will be individual subjects will be influenced by the other influenced by the other subjects in the group subjects in the group analysisanalysis•This simulation was This simulation was performed in which one of performed in which one of the nine “subjects” had a the nine “subjects” had a structured, source #2 map structured, source #2 map (whereas all of the nine (whereas all of the nine “subjects” had a similar, “subjects” had a similar, source #1 map).source #1 map).•As one can see, in this As one can see, in this example, the back-example, the back-reconstructed ICA maps are reconstructed ICA maps are very close to the individual very close to the individual maps and there appears to maps and there appears to be little to no influence be little to no influence between subjectsbetween subjects

2010 MRN fMRI Course 2010 MRN fMRI Course 16
The Stationarity AssumptionThe Stationarity Assumption
•The ICA estimation requires The ICA estimation requires the data to be stationary across the data to be stationary across subjectssubjects•Some signals in the data (e.g. Some signals in the data (e.g. physiologic noise) will most physiologic noise) will most likely *not* be stationarylikely *not* be stationary•However it is reasonable to However it is reasonable to assume the signal of interest assume the signal of interest (fMRI activation) will be (fMRI activation) will be stationarystationary•A simulation was performed to A simulation was performed to examine how non-stationary examine how non-stationary sources would affect the resultssources would affect the results•One stationary signal (fMRI One stationary signal (fMRI activation) and one non-activation) and one non-stationary signal were stationary signal were simulated for a five-subject simulated for a five-subject analysisanalysis•The ICA results reveal that the The ICA results reveal that the fMRI activation is preservedfMRI activation is preserved
ICA resultsICA results
Stationary source S Stationary source S common to all five common to all five
“subjects”“subjects”
source source #2#2
source source #1#1
Sources S1-S5 Sources S1-S5 differing across the differing across the
five “subjects”five “subjects”
S1S1 S2S2
S3S3 S4S4 S5S5
SS

2010 MRN fMRI Course 2010 MRN fMRI Course
Evaluation of Group ICA MethodsEvaluation of Group ICA Methods
17E. Erhardt, S. Rachakonda, E. Bedrick, T. Adali, and V. D. Calhoun, "Comparison of multi-subject E. Erhardt, S. Rachakonda, E. Bedrick, T. Adali, and V. D. Calhoun, "Comparison of multi-subject ICA methods for analysis of fMRI data," in ICA methods for analysis of fMRI data," in Proc. HBM, Barcelona, Spain, 2010.Proc. HBM, Barcelona, Spain, 2010.

2010 MRN fMRI Course 2010 MRN fMRI Course
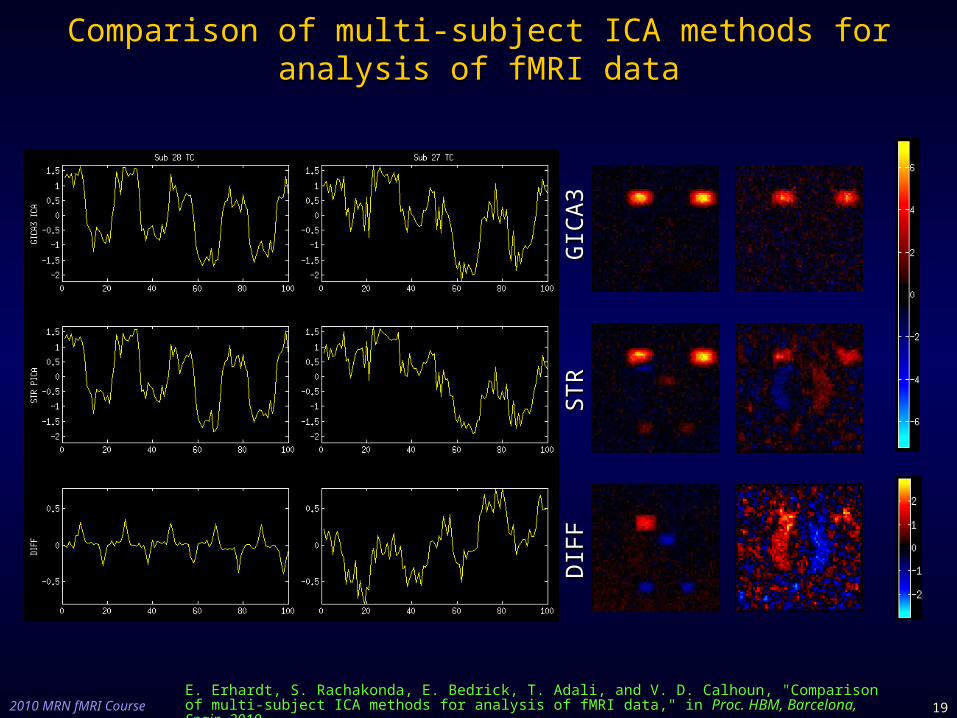
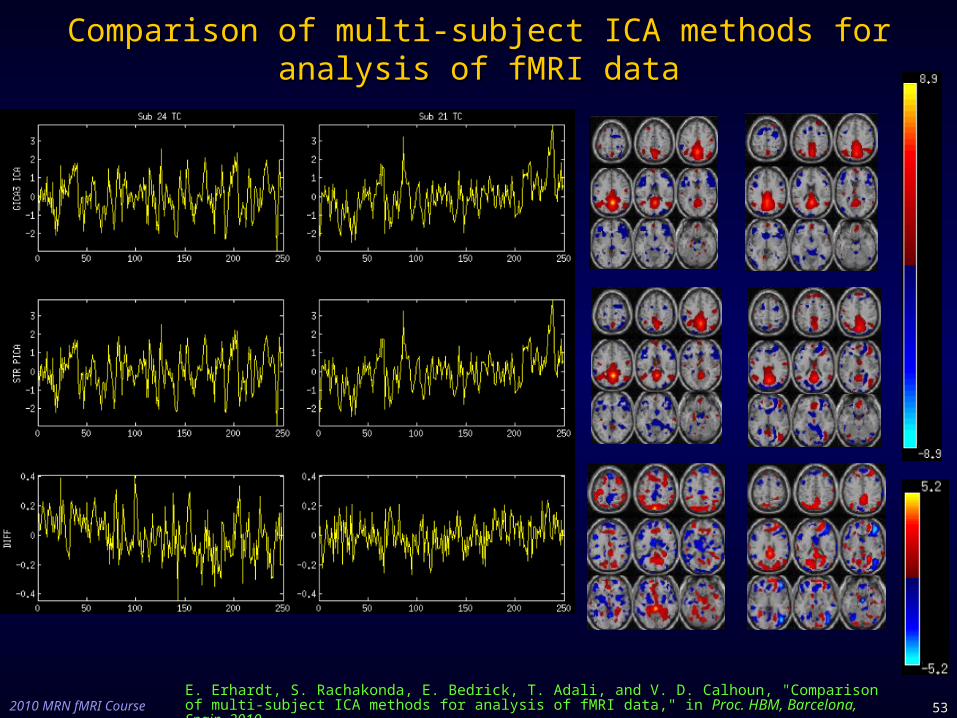
Comparison of multi-subject ICA methods for analysis of fMRI dataComparison of multi-subject ICA methods for analysis of fMRI data
18E. Erhardt, S. Rachakonda, E. Bedrick, T. Adali, and V. D. Calhoun, "Comparison of multi-subject E. Erhardt, S. Rachakonda, E. Bedrick, T. Adali, and V. D. Calhoun, "Comparison of multi-subject ICA methods for analysis of fMRI data," in ICA methods for analysis of fMRI data," in Proc. HBM, Barcelona, Spain, 2010.Proc. HBM, Barcelona, Spain, 2010.
2010 MRN fMRI Course 2010 MRN fMRI Course
Comparison of multi-subject ICA methods for analysis of fMRI dataComparison of multi-subject ICA methods for analysis of fMRI data
19E. Erhardt, S. Rachakonda, E. Bedrick, T. Adali, and V. D. Calhoun, "Comparison of multi-subject E. Erhardt, S. Rachakonda, E. Bedrick, T. Adali, and V. D. Calhoun, "Comparison of multi-subject ICA methods for analysis of fMRI data," in ICA methods for analysis of fMRI data," in Proc. HBM, Barcelona, Spain, 2010.Proc. HBM, Barcelona, Spain, 2010.
GIC
A3
GIC
A3
STR
STR
DIF
FD
IFF

2010 MRN fMRI Course 2010 MRN fMRI Course
Default Mode Group MapsDefault Mode Group Maps
20E. Erhardt, S. Rachakonda, E. Bedrick, T. Adali, and V. D. Calhoun, "Comparison of multi-subject E. Erhardt, S. Rachakonda, E. Bedrick, T. Adali, and V. D. Calhoun, "Comparison of multi-subject ICA methods for analysis of fMRI data," in ICA methods for analysis of fMRI data," in Proc. HBM, Barcelona, Spain, 2010.Proc. HBM, Barcelona, Spain, 2010.
GICA3GICA3 STRSTR

2010 MRN fMRI Course 2010 MRN fMRI Course 21
MethodsMethods• Scan Parameters
• 9 slice Single-shot EPI• FOV = 24cm, 64x64• TR=1s, TE=40ms• Thickness = 5/.5 mm• 360 volumes acquired
• Preprocessing• Timing correction• Motion correction• Normalization• Smoothing
• ICA• An ICA estimation was performed on each of the nine subjects• Data were first reduced from 360 to 25 using PCA, the data were
concatenated and reduced a second time from 225 to 20 using PCA• An ICA estimation was performed after which single subject maps and
time courses were calculated• Group averaged maps were thresholded at t<4.5, colorized, and overlaid
onto an EPI scan for visualization
0 90 180 270 360
Left
Right
t (secs)

2010 MRN fMRI Course 2010 MRN fMRI Course 22
Are the data separable? (fMRI experiment)Are the data separable? (fMRI experiment)
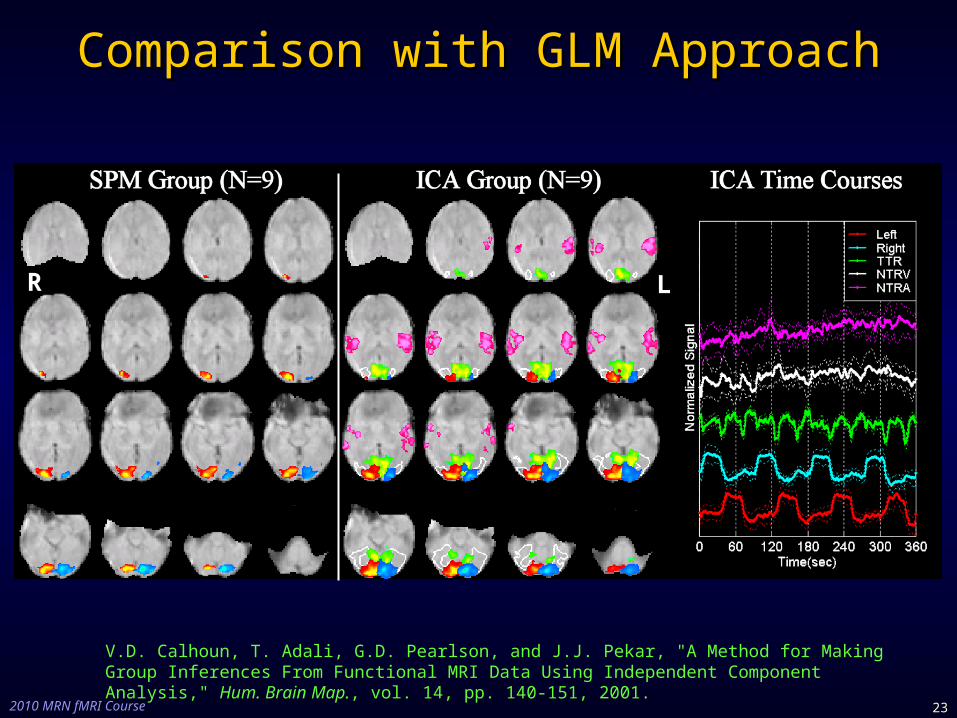
•The same slice from nine subjects when the right (red) and left (blue) The same slice from nine subjects when the right (red) and left (blue) visual fields were stimulated, (a) analyzed via linear modeling (LM), (b) visual fields were stimulated, (a) analyzed via linear modeling (LM), (b) back-reconstructed from a group ICA analysis, or (c) calculated from an ICA back-reconstructed from a group ICA analysis, or (c) calculated from an ICA analysis performed on each subject separately. A transiently task-related analysis performed on each subject separately. A transiently task-related component is depicted in green.component is depicted in green.•The results between the two ICA methods appear quite similar and match The results between the two ICA methods appear quite similar and match well with the LM results as well (note that there may be small differences well with the LM results as well (note that there may be small differences due to different initial conditions for the ICA estimation) due to different initial conditions for the ICA estimation)
2010 MRN fMRI Course 2010 MRN fMRI Course 23
Comparison with GLM ApproachComparison with GLM Approach
RR LL
V.D. Calhoun, T. Adali, G.D. Pearlson, and J.J. Pekar, "A Method for Making Group Inferences From Functional MRI Data Using Independent Component Analysis," Hum. Brain Map., vol. 14, pp. 140-151, 2001.
2010 MRN fMRI Course 2010 MRN fMRI Course 24
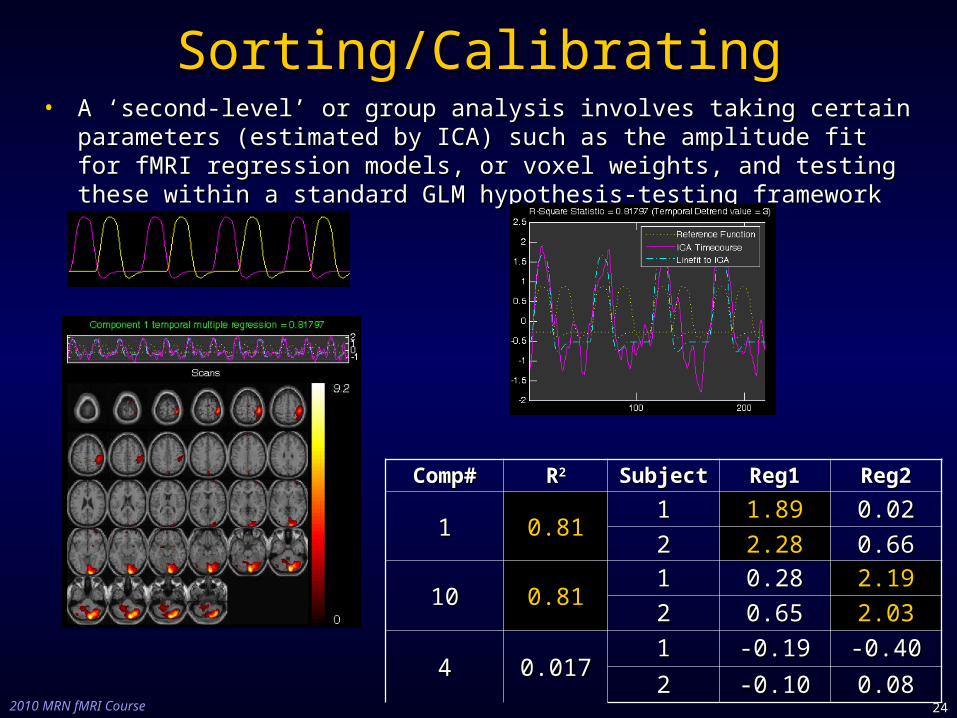
Sorting/CalibratingSorting/Calibrating• A ‘second-level’ or group analysis involves taking certain parameters (estimated by A ‘second-level’ or group analysis involves taking certain parameters (estimated by
ICA) such as the amplitude fit for fMRI regression models, or voxel weights, and ICA) such as the amplitude fit for fMRI regression models, or voxel weights, and testing these within a standard GLM hypothesis-testing frameworktesting these within a standard GLM hypothesis-testing framework
Comp#Comp# RR22 SubjectSubject Reg1Reg1 Reg2Reg2
11 0.8111 1.89 0.020.02
22 2.28 0.660.66
1010 0.8111 0.280.28 2.19
22 0.650.65 2.03
44 0.0170.01711 -0.19-0.19 -0.40-0.40
22 -0.10-0.10 0.080.08

2010 MRN fMRI Course 2010 MRN fMRI Course
PrenormalizationPrenormalization
25
E. Allen, E. Erhardt, T. Eichele, A. R. Mayer, and V. D. Calhoun, "Comparison of pre-normalization methods on the E. Allen, E. Erhardt, T. Eichele, A. R. Mayer, and V. D. Calhoun, "Comparison of pre-normalization methods on the accuracy of group ICA results," in accuracy of group ICA results," in Proc. HBM, Barcelona, Spain, 2010.Proc. HBM, Barcelona, Spain, 2010.
1) No Normalization 1) No Normalization (NN), where data is left (NN), where data is left in itsin itsraw intensity units raw intensity units (Calhoun, 2001)(Calhoun, 2001)
2) Intensity 2) Intensity Normalization (IN), Normalization (IN), which involves voxel-which involves voxel-wise division of the time wise division of the time series meanseries mean
3) Variance 3) Variance Normalization (VN), Normalization (VN), voxel-wise z-scoring of voxel-wise z-scoring of the time series the time series (Beckmann, 2004).(Beckmann, 2004).

2010 MRN fMRI Course 2010 MRN fMRI Course 26
Comp# Comp#
Description Corr
Oddball
Rest
16 19 A: Default mode 0.9577
11 9 B: Motor 0.9156
13 12 C: Sup parietal 0.9142
10 6 D: Medial visual 0.8628
12 7 E: Left lateral frontoparietal 0.8557
14 2 F: Lateral Visual 0.8170
17 13 G: Temporal2 0.8135
8 11 H: Cerebellum 0.8059
1 15 I: Temporal1 0.8048
4 16 J: Frontal 0.7838
2 4 K: Right lateral frontoparietal 0.8170
5 L: Anterior cingulate 0.035
Result 1: AOD and rest data Result 1: AOD and rest data produced highly similar produced highly similar
networksnetworks
V. D. Calhoun, K. A. Kiehl, and G. D. Pearlson, "Modulation of V. D. Calhoun, K. A. Kiehl, and G. D. Pearlson, "Modulation of Temporally Coherent Brain Networks Estimated using ICA at Temporally Coherent Brain Networks Estimated using ICA at
Rest and During Cognitive Tasks," Rest and During Cognitive Tasks," Hum Brain Mapp, Hum Brain Mapp, vol. 29, pp. vol. 29, pp. 828-838, 2008.828-838, 2008.
2010 MRN fMRI Course 2010 MRN fMRI Course 27
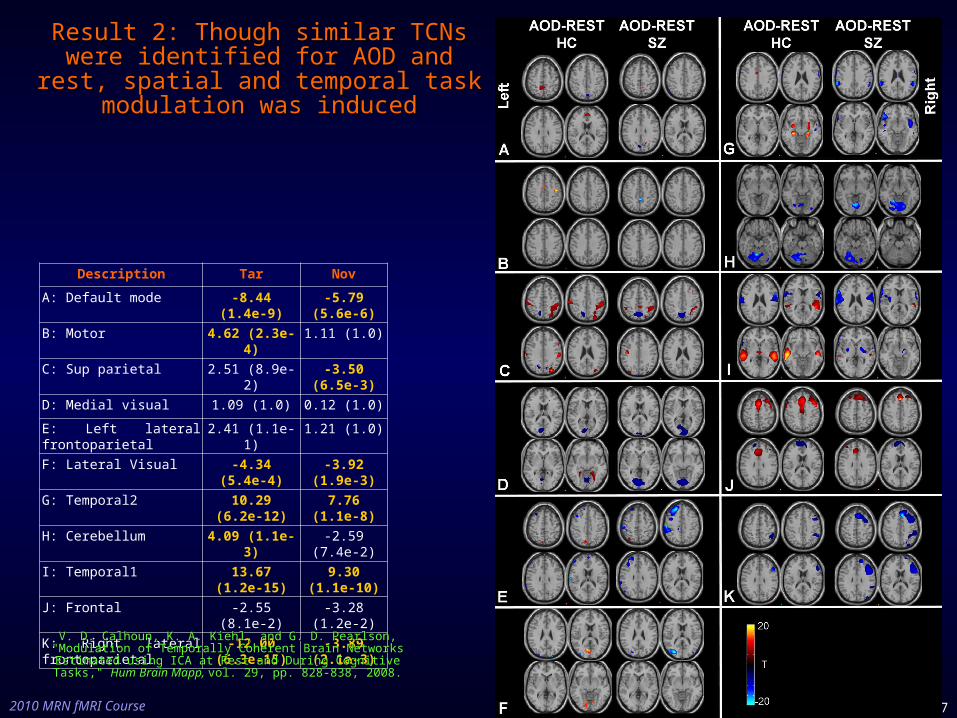
Description Tar Nov
A: Default mode -8.44 (1.4e-9) -5.79 (5.6e-6)
B: Motor 4.62 (2.3e-4) 1.11 (1.0)
C: Sup parietal 2.51 (8.9e-2) -3.50 (6.5e-3)
D: Medial visual 1.09 (1.0) 0.12 (1.0)
E: Left lateral frontoparietal 2.41 (1.1e-1) 1.21 (1.0)
F: Lateral Visual -4.34 (5.4e-4) -3.92 (1.9e-3)
G: Temporal2 10.29 (6.2e-12) 7.76 (1.1e-8)
H: Cerebellum 4.09 (1.1e-3) -2.59 (7.4e-2)
I: Temporal1 13.67 (1.2e-15) 9.30 (1.1e-10)
J: Frontal -2.55 (8.1e-2) -3.28 (1.2e-2)
K: Right lateral frontoparietal -12.00 (6.3e-15) -3.89 (2.1e-3)
Result 2: Though similar TCNs were Result 2: Though similar TCNs were identified for AOD and rest, spatial identified for AOD and rest, spatial and temporal task modulation was and temporal task modulation was
inducedinduced
V. D. Calhoun, K. A. Kiehl, and G. D. Pearlson, "Modulation of V. D. Calhoun, K. A. Kiehl, and G. D. Pearlson, "Modulation of Temporally Coherent Brain Networks Estimated using ICA at Temporally Coherent Brain Networks Estimated using ICA at
Rest and During Cognitive Tasks," Rest and During Cognitive Tasks," Hum Brain Mapp, Hum Brain Mapp, vol. 29, pp. vol. 29, pp. 828-838, 2008.828-838, 2008.

2010 MRN fMRI Course 2010 MRN fMRI Course 28
Example of spatial sortingExample of spatial sorting

2010 MRN fMRI Course 2010 MRN fMRI Course 29
Example 1: ‘Default Mode’ MaskExample 1: ‘Default Mode’ Mask• Using wfu pickatlas to define mask using regions Using wfu pickatlas to define mask using regions
reported in Rachle 2001 paperreported in Rachle 2001 paper• Posterior parietal cortex BA7Posterior parietal cortex BA7
• Occipitoparietal junction BA 39Occipitoparietal junction BA 39
• Precuneus Precuneus
• Posterior cingulatePosterior cingulate
• Frontal Pole BA 10Frontal Pole BA 10
• Smooth in SPM with same Smooth in SPM with same kernel used on fMRI datakernel used on fMRI data
• Sort in GIFT using Sort in GIFT using spatial sortingspatial sorting
A.Garrity, G.D.Pearlson, K.McKiernan, D.Lloyd, K.A.Kiehl, and V.D.Calhoun, "Aberrant 'Default Mode' Functional Connectivity in Schizophrenia," to appear Am. J. Psychiatry, 2006.

2010 MRN fMRI Course 2010 MRN fMRI Course 30
ICA to identify ‘Default Mode’ NetworkICA to identify ‘Default Mode’ NetworkHealthyHealthy SchizoSchizo
Healthy vsHealthy vsSchizo (N=26/26)Schizo (N=26/26)
+Symptoms+Symptoms
A.Garrity, G.D.Pearlson, K.McKiernan, D.Lloyd, K.A.Kiehl, and V.D.Calhoun, "Aberrant 'Default Mode' Functional Connectivity in Schizophrenia," to appear Am. J. Psychiatry, 2006.

2010 MRN fMRI Course 2010 MRN fMRI Course 31
Spatial Sorting: Example 2Spatial Sorting: Example 2• Classification of SchizophreniaClassification of Schizophrenia
• Mapping the brain via intrinsic connectivityMapping the brain via intrinsic connectivity
PatientsPatients
ControlsControls

2010 MRN fMRI Course 2010 MRN fMRI Course 32
Robustness of ‘modes’Robustness of ‘modes’
TargetTarget NovelNovelStandardStandardStandardStandard StandardStandardStandardStandard
1 kHz
tone, sweep,whistle
StandardStandard
.5 kHz
StandardStandard

2010 MRN fMRI Course 2010 MRN fMRI Course 33
The ChallengeThe Challenge
• Accurate classification requires single-subject Accurate classification requires single-subject accuracy -> very stringent requirement!accuracy -> very stringent requirement!
• We cannot use knowledge of the diagnosis in the We cannot use knowledge of the diagnosis in the development of the classification algorithmdevelopment of the classification algorithm

2010 MRN fMRI Course 2010 MRN fMRI Course 34
Temporal Lobe SynchronyTemporal Lobe Synchrony• Supervised ClassificationSupervised Classification
• Step 1: Select Training GroupStep 1: Select Training Group
• Step 2: Use ICA to extract temporal lobe mapsStep 2: Use ICA to extract temporal lobe maps
• Step 3: Compute within-group mean imagesStep 3: Compute within-group mean images
• Step 4: Subtract the mean imagesStep 4: Subtract the mean images
• Step 5: Set a positive and negative thresholdStep 5: Set a positive and negative threshold
HCHC11 HCHCNN
ICAICA
SzSz11 SzSzNN
……
……
t
t
Calhoun VD, Kiehl KA, Liddle PF, Pearlson GD: “Aberrant Localization of Synchronous Hemodynamic Activity in Auditory Cortex Reliably Characterizes Schizophrenia”. Biol Psychiatry 2004; 55842-849

2010 MRN fMRI Course 2010 MRN fMRI Course 35
Temporal Lobe Synchrony in SchizophreniaTemporal Lobe Synchrony in Schizophrenia
t
t

2010 MRN fMRI Course 2010 MRN fMRI Course 36
Temporal Lobe Synchrony in SchizophreniaTemporal Lobe Synchrony in Schizophrenia• Step 6: Form classification measure (average the values within each Step 6: Form classification measure (average the values within each
boundary and subtract)boundary and subtract)
• Step 7: Optimize group discrimination (using a sensible error metric)Step 7: Optimize group discrimination (using a sensible error metric)
• Step 8: Apply classification to new dataStep 8: Apply classification to new data
, , |, , .*i IM ti HIM Ct SZDF t t i MSK
min , , , 0 , , 0i Sz i Hc
Err t t DF t t i DF t t i
Calhoun VD, Kiehl KA, Liddle PF, Pearlson GD: “Aberrant Localization of Synchronous Hemodynamic Activity in Auditory Cortex Reliably Characterizes Schizophrenia”. Biol Psychiatry 2004; 55842-849

2010 MRN fMRI Course 2010 MRN fMRI Course 37
Temporal Sorting: fBIRN SIRP TaskTemporal Sorting: fBIRN SIRP Task• MethodsMethods
• Subjects & TaskSubjects & Task• 28 subjects (14 HC/14 SZ) across two sites28 subjects (14 HC/14 SZ) across two sites• Three runs of SIRP task preprocessed with SPM2Three runs of SIRP task preprocessed with SPM2
• ICA AnalysisICA Analysis• All data entered into group ICA analysis in GIFTAll data entered into group ICA analysis in GIFT• ICA time course and image reconstructed for each subject, session, and ICA time course and image reconstructed for each subject, session, and
componentcomponent• Images: sessions averaged together creating single image for each subject and Images: sessions averaged together creating single image for each subject and
componentcomponent• Time courses: SPM SIRP model regressed against ICA time courseTime courses: SPM SIRP model regressed against ICA time course
• Statistical Analysis:Statistical Analysis:• Images: all subjects entered into voxelwise 1-sample t-test in SPM2 and Images: all subjects entered into voxelwise 1-sample t-test in SPM2 and
thresholded at t=4.5thresholded at t=4.5• Time courses: Goodness of fit to SPM SIRP model computed, beta weights for Time courses: Goodness of fit to SPM SIRP model computed, beta weights for
load 1, 3, 5 entered into Group x Load ANOVAload 1, 3, 5 entered into Group x Load ANOVA
fBIRN Phase II Data: fBIRN Phase II Data: www.nbirn.net; ; NCRR (NIH), 5 MOI RR 000827 (2002-2006) and 1 U24 RR0219921 (2006 NCRR (NIH), 5 MOI RR 000827 (2002-2006) and 1 U24 RR0219921 (2006 onwards)onwards)

2010 MRN fMRI Course 2010 MRN fMRI Course 38
Component 1: Bilateral Frontal/ParietalComponent 1: Bilateral Frontal/Parietal
fBIRN Phase II Data: fBIRN Phase II Data: www.nbirn.net; ; NCRR (NIH), 5 MOI RR 000827 (2002-2006) and 1 U24 RR0219921 (2006 NCRR (NIH), 5 MOI RR 000827 (2002-2006) and 1 U24 RR0219921 (2006 onwards)onwards)

2010 MRN fMRI Course 2010 MRN fMRI Course 39
Component 2: Right Frontal, Left Parietal, Post. Cing.Component 2: Right Frontal, Left Parietal, Post. Cing.
fBIRN Phase II Data: fBIRN Phase II Data: www.nbirn.net; ; NCRR (NIH), 5 MOI RR 000827 (2002-2006) and 1 U24 RR0219921 (2006 NCRR (NIH), 5 MOI RR 000827 (2002-2006) and 1 U24 RR0219921 (2006 onwards)onwards)

2010 MRN fMRI Course 2010 MRN fMRI Course 40
Component 3: Temporal LobeComponent 3: Temporal Lobe
fBIRN Phase II Data: fBIRN Phase II Data: www.nbirn.net; ; NCRR (NIH), 5 MOI RR 000827 (2002-2006) and 1 U24 RR0219921 (2006 NCRR (NIH), 5 MOI RR 000827 (2002-2006) and 1 U24 RR0219921 (2006 onwards)onwards)

2010 MRN fMRI Course 2010 MRN fMRI Course 41
Example 2: Simulated Driving ParadigmExample 2: Simulated Driving Paradigm
0 600180 360
*Drive Watch

2010 MRN fMRI Course 2010 MRN fMRI Course 42
Previous WorkPrevious Work• Walter, 2001.Walter, 2001.
DrivingDriving
WatchingWatching
“our study suggests that the main ideas of cognitive psychology used in the design of cars, inthe planning of respective behavioral experiments on driving, as well as in traffic related political decision making (i.e. laws on what drivers are supposed to do and not to doduring driving) may be inadequate, as it suggests a general limited capacity model of the psyche of the driver which is not supported by our results. If driving deactivates ratherthan activates a number of brain regions the quests for the adequate design of the man-machine interface as well as for what the driver should and should not do during driving is still widely open.”
“Our results suggest that simulated driving engages mainly areas concerned with perceptual-motor integration and does not engage areas associated with higher cognitive functions.”

2010 MRN fMRI Course 2010 MRN fMRI Course 43
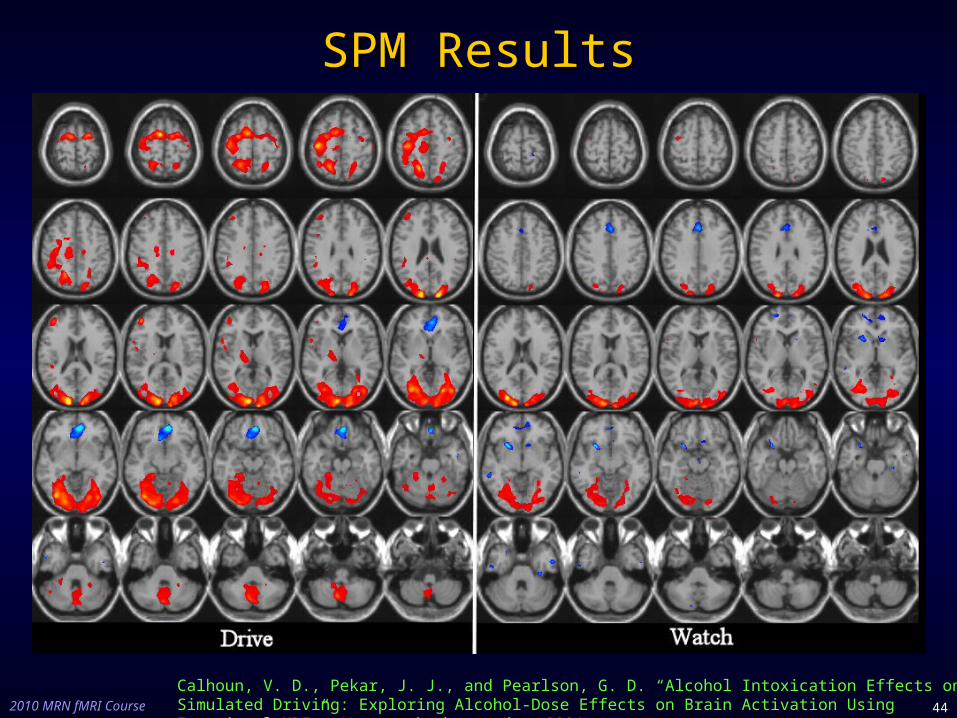
Baseline Simulated Driving ResultsBaseline Simulated Driving Results
Higher Order Visual/Motor: Higher Order Visual/Motor: Increases during driving; less Increases during driving; less during watching.during watching.
Low Order Visual: Low Order Visual: Increases during Increases during driving; less during driving; less during watching.watching.Motor control: Motor control: Increases only during Increases only during driving.driving.Vigilance: Vigilance: Decreases Decreases only during driving; only during driving; amount proportional to amount proportional to speed.speed.Error Monitoring & Error Monitoring & Inhibition: Inhibition: Decreases Decreases only during driving; only during driving; rate proportional to rate proportional to speed.speed.Visual Monitoring: Visual Monitoring: Increases during Increases during epoch transitions.epoch transitions.
N=12N=12
*Drive Watch
V. D. Calhoun, J. J. Pekar, V. B. McGinty, T. Adali, T. D. Watson, and G. D. Pearlson, "Different V. D. Calhoun, J. J. Pekar, V. B. McGinty, T. Adali, T. D. Watson, and G. D. Pearlson, "Different Activation Dynamics in Multiple Neural Systems During Simulated Driving," Activation Dynamics in Multiple Neural Systems During Simulated Driving," Hum. Brain Map.Hum. Brain Map., vol. 16, , vol. 16, pp. 158-167, 2002.pp. 158-167, 2002.
2010 MRN fMRI Course 2010 MRN fMRI Course 44
SPM ResultsSPM Results
Calhoun, V. D., Pekar, J. J., and Pearlson, G. D. “Alcohol Intoxication Effects on Simulated Driving: Exploring Alcohol-Dose Effects on Brain Activation Using Functional MRI”. Neuropsychopharmacology 2004.

2010 MRN fMRI Course 2010 MRN fMRI Course 45
Interpretation of ResultsInterpretation of Results

2010 MRN fMRI Course 2010 MRN fMRI Course 46
Functional Network ConnectivityFunctional Network Connectivity(between groups)(between groups)
B: Parietal
C: L. & M. Visual Cortical Areas
D: Frontal Temporal Parietal
E: Frontal Parietal Subcortical
F: Frontal
G: Temporal
A: DefaultKey: : ρpatient > ρcontrol
: ρcontrol > ρpatient

2010 MRN fMRI Course 2010 MRN fMRI Course 47
FNC SoftwareFNC Software

2010 MRN fMRI Course 2010 MRN fMRI Course 48
Fusion ICA Toolbox (FIT)Fusion ICA Toolbox (FIT)
http://icatb.sourceforge.net Funded by NIH 1 R01 EB 005846Funded by NIH 1 R01 EB 005846
500+ unique downloads

2010 MRN fMRI Course 2010 MRN fMRI Course 49
FMRI Snapshots (movie)FMRI Snapshots (movie)
1ERP (temporal) Components: NT t t 1FMRI (spatial) Components: NS s s
FMRI Image Snapshot: TF t t M T S
Calhoun, V.D., Pearlson, G.D., and Kiehl, K.A. (2006). Neuronal Chronometry of Target Detection: Fusion of Hemodynamic and Event-related Potential Data. NeuroImage 30, 544-553.

2010 MRN fMRI Course 2010 MRN fMRI Course 50
SNPsSNPs GenesGenes
rs1800545rs1800545rs7412rs7412
rs1128503rs1128503rs6578993rs6578993rs1045642rs1045642rs2278718rs2278718rs4784642rs4784642rs521674rs521674
ADRA2AADRA2AAPOEAPOE
ABCB1ABCB1THTH
ABCB1ABCB1MDH1MDH1
GNAO1GNAO1ADRA2AADRA2A
0.55
Tar
get
Stim
uli
Nov
el S
timul
i
SNPsSNPs GenesGenes
rs1800545rs1800545rs7412rs7412
rs6578993rs6578993rs2278718rs2278718rs1128503rs1128503rs429358rs429358
rs3813065rs3813065rs4121817rs4121817rs521674rs521674
ADRA2AADRA2AAPOEAPOE
THTHMDH1MDH1ABCB1ABCB1APOEAPOE
PIK3C3PIK3C3PIK3C3PIK3C3
ADRA2AADRA2A
0.47

2010 MRN fMRI Course 2010 MRN fMRI Course 51
DemoDemo• 3 subject ICA3 subject ICA
• SortingSorting
• Component Explorer (split time courses, event-related Component Explorer (split time courses, event-related average)average)
• Orthogonal ViewerOrthogonal Viewer
• Composite ViewerComposite Viewer
• Examine Regression ParametersExamine Regression Parameters
• Taking Images/Timecourses from GIFT to SPMTaking Images/Timecourses from GIFT to SPM

2010 MRN fMRI Course 2010 MRN fMRI Course 52
2010 MRN fMRI Course 2010 MRN fMRI Course
Comparison of multi-subject ICA methods for analysis of fMRI dataComparison of multi-subject ICA methods for analysis of fMRI data
53E. Erhardt, S. Rachakonda, E. Bedrick, T. Adali, and V. D. Calhoun, "Comparison of multi-subject E. Erhardt, S. Rachakonda, E. Bedrick, T. Adali, and V. D. Calhoun, "Comparison of multi-subject ICA methods for analysis of fMRI data," in ICA methods for analysis of fMRI data," in Proc. HBM, Barcelona, Spain, 2010.Proc. HBM, Barcelona, Spain, 2010.