Embed Size (px)
Citation preview
MRI Isotropic Resolution Reconstruction from two OrthogonalScans
José G. TamezPeña*a, Saara Totterman**b and Kevin J. Parker ***a
aDepartment of Electrical and Computer Engineering, University of Rochester;bDepartment of Radiology, Medical Center, University of Rochester
ABSTRACTAn algorithm for the reconstructions of ISO-resolution volumetric MR data sets from two standard orthogonal MRscans having anisotropic resolution has been developed. The reconstruction algorithm starts by registering a pair oforthogonal volumetric MR data sets. The registration is done by maximizing the correlation between the gradientmagnitude using a simple translation-rotation model in a multi-resolution approach. Then algorithm assumes thatthe individual voxels on the MR data are an average of the magnetic resonance properties of an elongated imagingvolume. Then, the process is modeled as the projection of MR properties into a single sensor. This model allowsthe derivation of a set of linear equations that can be used to recover the MR properties of every single voxel in theISO-resolution volume given only two orthogonal MR scans. Projections on convex sets (FOGS) was used to solvethe set of linear equations. Experimental results show the advantage of having a ISO-resolution reconstructions forthe visualization and analysis of small and thin muscular structures.
Keywords: MRI, ISO-resolution reconstruction, Filtered back-projection, POCS
1. INTRODUCTIONFor many clinical applications standard Magnetic Resonance Imaging (MRI) provides excellent images for a trainedhuman eye. This technology can generate images with high contrast among various soft tissues and organs. As aresult, MRI has become the modality of choice in many diagnostic studies of the head, spine, and joints.1 Butfor an automatic joint-motion analysis an autonomous system has to be able to segment several small and similarstructures. To improve the structure to structure contrast for improved brain segmentation several algorithms havebeen developed which fuse two or more same plane brain MR imaging data sets.2'3 Although these multi-parameterdata sets improve the tissue contrast, they however do not improve the resolution. Based on our experience thesegmentation ofmusculoskeletal structures on MR images cannot be accomplished unless the resolution is improved.4'5The existing in-plane resolution with 300-400 micron pixel size is sufficient; however, the slice thickness of 1 mmor higher is too large. Decrease in signal to noise ratio and limitations of gradient strength have hindered the useof thinner slices. However if two orthogonal data sets are registered and fused that will result in a 3-dimensionaldata set where voxel size and the thickness of the reformatted slices will correspond to the in-plane resolution of theoriginal images. Therefore we developed an algorithm which registers and fuses two orthogonal 3D musculoskeletalimaging data sets and creates 3D isotropic volume data set. Goshtasby6 proposed the fusion of long axis and shortaxis images of the heart to enhance the image resolution. Here we propose a similar approach but with generalapplications on MR images. In this paper we validate registration and fusion of the algorithm by comparing theresolution in the fused data set to the original data set.
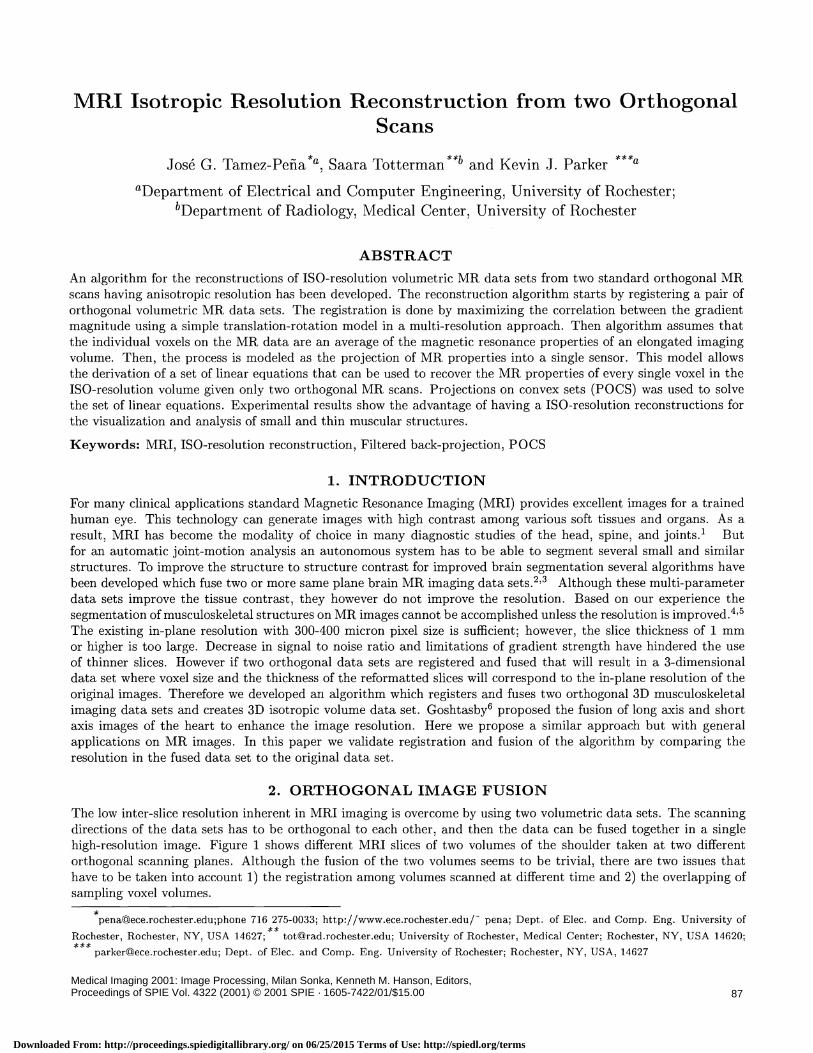
2. ORTHOGONAL IMAGE FUSIONThe low inter-slice resolution inherent in MRI imaging is overcome by using two volumetric data sets. The scanningdirections of the data sets has to be orthogonal to each other, and then the data can be fused together in a singlehigh-resolution image. Figure 1 shows different MRI slices of two volumes of the shoulder taken at two differentorthogonal scanning planes. Although the fusion of the two volumes seems to be trivial, there are two issues thathave to be taken into account 1) the registration among volumes scanned at different time and 2) the overlapping ofsampling voxel volumes.
*pena©ece.rochester.edu;phone 716 275-0033; http://www.ece.rochesteredu/ pena; Dept. of Elec. and comp. Eng. University ofRochester, Rochester, NY, USA 14627;
**tot©rad.rochester.edu; University of Rochester, Medical center; Rochester, NY, USA 14620;
parker©ece.rochester.edu; Dept. of Elec. and Comp. Eng. University of Rochester; Rochester, NY, USA, 14627
Medical Imaging 2001: Image Processing, Milan Sonka, Kenneth M. Hanson, Editors,Proceedings of SPIE Vol. 4322 (2001) © 2001 SPIE · 1605-7422/01/$15.00 87
Downloaded From: http://proceedings.spiedigitallibrary.org/ on 06/25/2015 Terms of Use: http://spiedl.org/terms
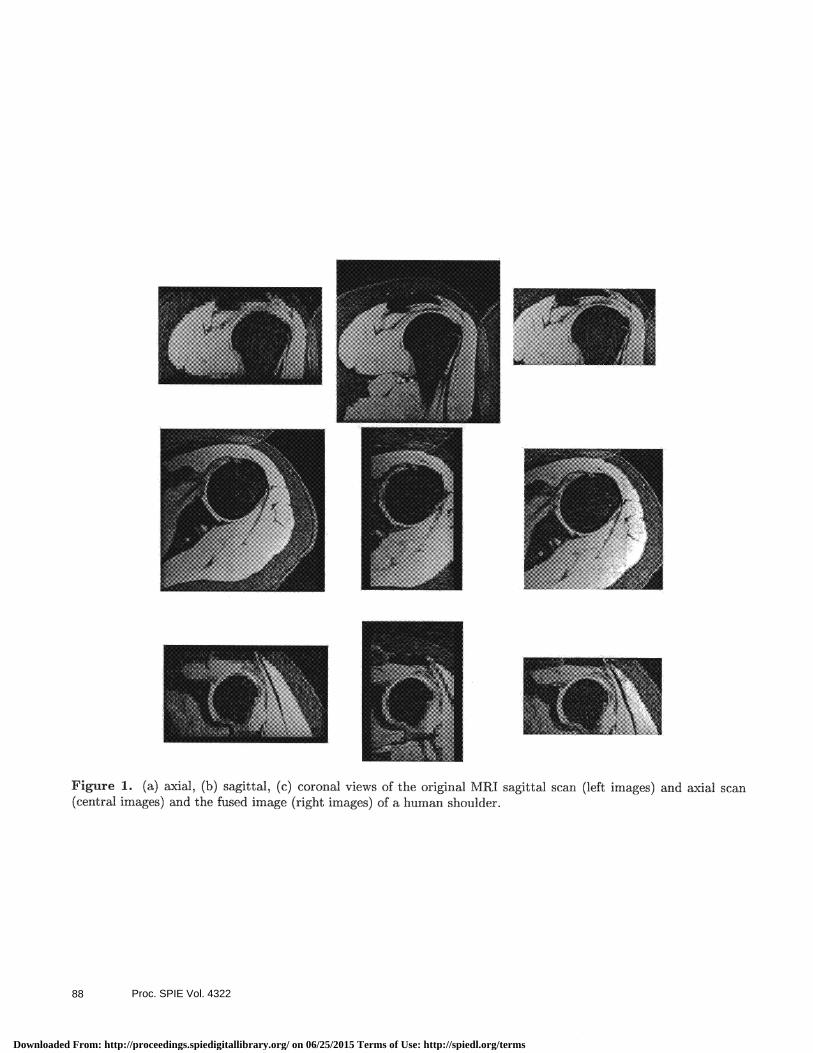
Figure 1. (a) axial, (b) sagittal, (c) coronal views of the original MRI sagittal scan (left images) and axial scan(central images) and the fused image (right images) of a human shoulder.
Proc. SPIE Vol. 432288
Downloaded From: http://proceedings.spiedigitallibrary.org/ on 06/25/2015 Terms of Use: http://spiedl.org/terms
jw1(x,y,z) w2(x,y,z)
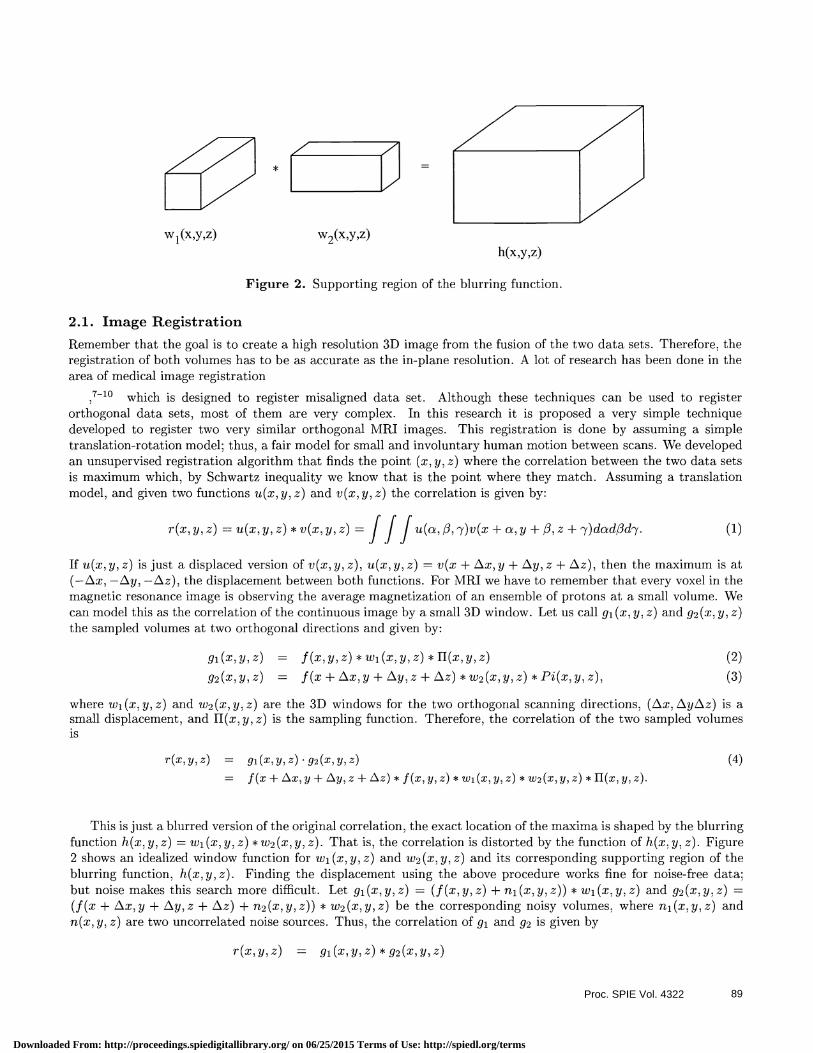
Figure 2. Supporting region of the blurring function.
2.1. Image RegistrationRemember that the goal is to create a high resolution 3D image from the fusion of the two data sets. Therefore, theregistration of both volumes has to be as accurate as the in-plane resolution. A lot of research has been done in thearea of medical image registration
,7-1O which is designed to register misaligned data set. Although these techniques can be used to registerorthogonal data sets, most of them are very complex. In this research it is proposed a very simple techniquedeveloped to register two very similar orthogonal MRI images. This registration is done by assuming a simpletranslation-rotation model; thus, a fair model for small and involuntary human motion between scans. We developedan unsupervised registration algorithm that finds the point (x, y, z)where the correlation between the two data setsis maximum which, by Schwartz inequality we know that is the point where they match. Assuming a translationmodel, and given two functions u(x, y, z) and v(x, y, z) the correlation is given by:
r(x,y,z) = u(x,y,z)*v(x,y,z) = fffu(,,7)v(x+Q,Y+,z +7)ddd7. (1)
If u(x, y, z) is just a displaced version of v(x, y, z), u(x, y, z) = v(x + Lxx, y + Ly, z + Liz), then the maximum is at(—Lix, —Ly, —zz), the displacement between both functions. For MRI we have to remember that every voxel in themagnetic resonance image is observing the average magnetization of an ensemble of protons at a small volume. Wecan model this as the correlation of the continuous image by a small 3D window. Let us call gi (x, y, z) and g (x,y, z)the sampled volumes at two orthogonal directions and given by:
gi(x,y,z) = f(x,y,z)*wi(x,y,z)*H(x,y,z) (2)
g2(x,y,z) = f(x + /.x,y + /.y,z + Liz) *w2(x,y,z) *Pi(x,y,z), (3)
where w1 (x, y, z) and w2 (x, y, z) are the 3D windows for the two orthogonal scanning directions, (Lix, z.y/.z) is asmall displacement, and H(x, y, z) is the sampling function. Therefore, the correlation of the two sampled volumesis
r(x,y,z) = gi(x,y,z) . 92(X,y,Z) (4)
= f(x+zx,y+zy,z+zz)*f(x,y,z)*wi(x,y,z)*w2(x,y,z)*H(x,y,z).
This is just a blurred version of the original correlation, the exact location of the maxima is shaped by the blurringfunction h(x, y, z) = w1(x, y, z) * w2(x, y, z). That is, the correlation is distorted by the function of h(x, y, z). Figure2 shows an idealized window function for w1 (x, y, z) and w2 (x, y, z) and its corresponding supporting region of theblurring function, h(x, y, z). Finding the displacement using the above procedure works fine for noise-free data;but noise makes this search more difficult. Let gi(x,y,z) = (f(x,y,z) + ni(x,y,z)) * w1(x,y,z) and g2(x,y,z) =(f(x + zx, y + Ly, z + Liz) + n2(x, y, z)) * w2 (x, y, z) be the corresponding noisy volumes, where n1(x, y, z) and
n(x,y, z) are two uncorrelated noise sources. Thus, the correlation of gi and Y2 is given by
r(x,y,z) = gi(x,y,z)*g2(x,y,z)
h(x,y,z)
Proc. SPIE Vol. 4322 89
Downloaded From: http://proceedings.spiedigitallibrary.org/ on 06/25/2015 Terms of Use: http://spiedl.org/terms
uooq siq omi sijj oT i!id ndrn mo moij omnssy ip ndu oq moij OflJA IOXOA uOflJOSi qq Ai u1J_uns uqA JflJOfl3 q o siq ouo '((z '11 'x) Tm pu (z '11 'x) Zm) SUIflJOA uTIdus IOXOA uoq odqs uoijjp o OflEE •wq uioij OTU UOTflOSOi qq doios u ooi o popoid o 'siui o aq puosiai o
UOSUd
•uov?J4s!oi JJT pU uojq 's ?4T U)J JO s?m! OiW JO UOTSflJ SAWqS UflJ S1?LU uxMq uooi fflU1S iOj osudmo o psn W? ppdn s xum uooi oq ds qcn y sx q uoji suoioi oiq pu iq PPP"! ods qjiis sNJ ods i joo o siq mqiop 'xds u Tpns uop jo psu nq uoq uoioi puj o psn si nbuq uqmp-Jiq uis qj •UOTOJ LU1 JOJ JflS O mLJO1? OT4 ppux M S14 UJ UO1OJ 1 U1OiJ igns STU1 OmO
ssnoid UOt13TOJJO oq rn posn suo suiod soq uq 'upii qiq LIBA suiod jo dmisqns iius snC pas o 'sos iip OM T4 UOTJ1iO dn pods oj u simi o jo uoisi ap 'iopiq upunsuo ouw oq u1 s ip IoTTA M4 JO UOIJJJO T4 JO uoTndmo pioddi uoqiziwido ithuis AiA psu qnoq
UJA[ •uo!tnIosi uId-uT oq Jo uxiod sn si ozs spuis oq pu 'msis oq jo uoinosu uijd-ui SM XJJS UOIflOSU JSJO T4JJ •PSfl SUOTflOSi UEUJ4I AIJ dos snoTAad jo zs jpq s ds uiqmp-jq U3S rn psisuo qoidd uonosu-nm sqj qodd uouosi-nm i psn 'ssoid
dn pds o U1E UiTX1?TIT P?OT u pdthu4 uiq p!OA oj sus uunp uoiow AJUflTOAUT ioj ppdx uo s1 'ss ip OM JO UO!1SJ iOJ ffiM S)JJOM nbtuq idwis 'ui uoiisod xu s usop
S?M UOiflh1A S?T4 VflI uoi!p TT1 pq prn iuoj 'T1!J 'WI 'UMOp 'dn :suoipnp TUOOTflJO x!s OT OT S0fl[tA BnbTuipB rnqmTp-iq qj suomBdsTp q upp o np 'nbiuq uTqmip-jiq Tdm!s sn o sop M nbiuipo uoizimixui ptipus ui usn uop oq u 9 uOLnb jo uozuuxm qj uiiduns qs-iu pu uTIdmis uxq suijpp sudmo o
U12 SfflI fflOJ JStOU OAOU1J O pSfl tOJJJ ssl?d ixo si (z 'Ii 'x) pui 'si uiIdmis rn zg 'fig 'xg
zo (UT) '
_________________________________________ = (z'fi'x)zp
(z — z'fi'x)ö*(z'fl'x)— (zg+ z'ft'x)5*(z't1'x)
(6) =
(z'fl'x)ap (z'flg
_ fl'x)5*(z't1'x)— (z'flg+'x)5*(z'fl'x)j
( ) C _(Z'fl'X)x (z'fI'xg
— x)5*(z'fI'x)7— (z'It'xg+ x)5*(z'fi'x)7
JioqM
(L) c(zflCx)zp+ (zflx)ap+ (z''x)xpJ = II(z'fl'x)blI
•suoioJ4!p iUJ Aq pmixoidth q ui upii sni pjduns ui
r r r (zv'/v'xv) (9) p1pupII(. + zv 'gI + fly '0 + xv)fl(LII(I— 'q 'o)T5Lt xT-u 1y = (zv "iv 'xv)
:siui uiuosoi iuui OM Jo UO!P1J opnum oq UOUfl?
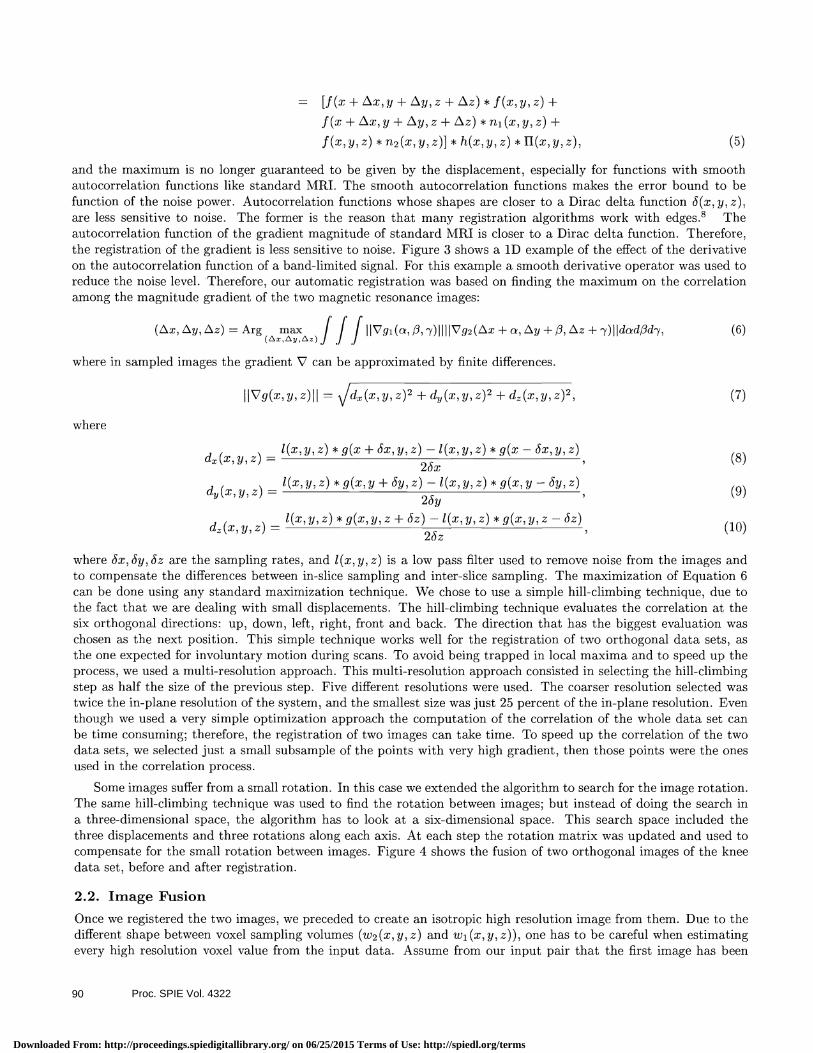
uo!:Iu1o: uo WllUJX1?U1 UpUjj UO psq sx uoqsi aimon no 'oiopiqj, TAT osou xnpu 04 Sfl SA ioido AI?AI1Ep qooms i BTdunx sq ioj puis p4mi-puq jo uopunj aq uo
AI4AIJp Lj: JO XJJ JO Idmxo UT SAOTS UflJ SOU O A!SUS SSJ S UBp1J Jo UO!1S!1 'ioiBq:L uoipuuj IBP 1KI O iSOp Si. J3JJi Pi1PUS Jo BW 0 UOUtl
q1 Tfl!A )IJOM sLuqioT? UOJSU AU?U1 uosi S ifflJOJ 3qJJ sou o OASUS SSj '(z '11 'x) uoipunj pp o isop on sodqs soipx suopunj uojoiioony JMod osiou jo uopunj q o punoq ioiio sojm suopunj uo nooni qooms qj pjj\j pnpuis ij suoipunj uooon q4ooLus qi suovpunj ioj A1pidso 'uw ?dsp Aq UA q o p uiiin iauo ou s mnuixui oq prn
() '(z'fL'x)jj*(z'I'x)'q*[(z'f1'x)u*(z'fi'x)f
+ (z'fI'x)Tu* (zv + z'IIV + fl'XV + x)J
* (zv + z'IIV + fl'XV + x)f] =
Proc. SPIE Vol. 432290
Downloaded From: http://proceedings.spiedigitallibrary.org/ on 06/25/2015 Terms of Use: http://spiedl.org/terms
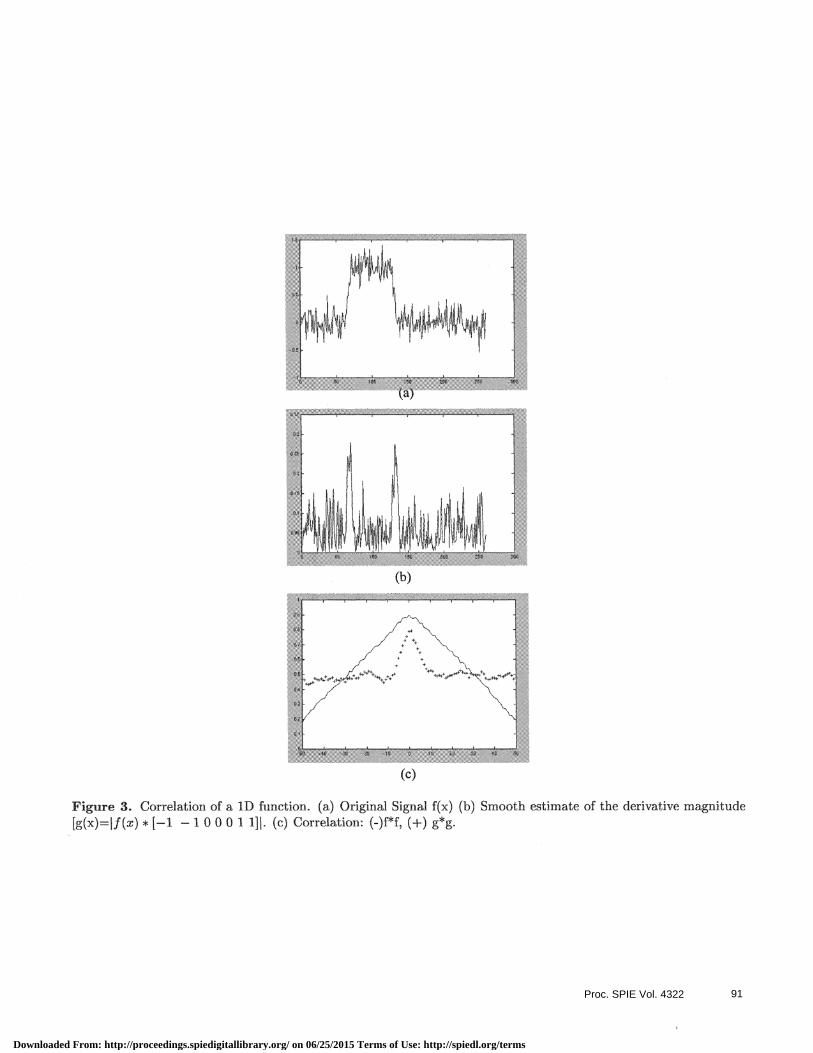
Figure 3. Correlation of a ID function. (a) Original Signal f(x) (b) Smooth estimate of the derivative magnitude{g(x)=f(x) * [—1 — I 0 0 0 1 111. (c) Correlation: (-)ff, (+) g*g,
(b)
(c)
Proc. SPIE Vol. 4322 91
Downloaded From: http://proceedings.spiedigitallibrary.org/ on 06/25/2015 Terms of Use: http://spiedl.org/terms
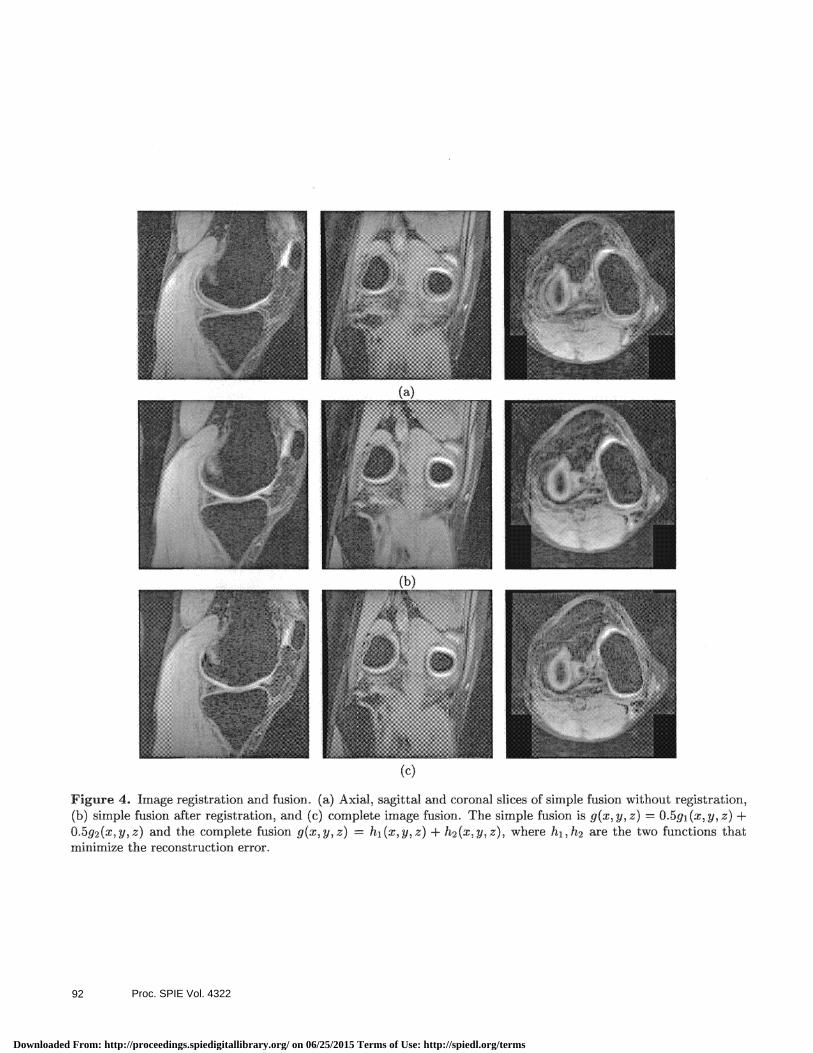
Figure 4. Image registration and fusion. (a) Axial, sagittal and coronal slices of simple fusion without registration,(b) simple fusion after registration, and (c) complete image fusion. The simple fusion is g(x, y, z) = O.5gi(x, y, z) +O.5g2(x, y, z) and the complete fusion g(x, y, z) = h1 (x, y, z) + h2(x, y, z), where h1, h2 are the two functions thatminimize the reconstruction error.
Proc. SPIE Vol. 432292
Downloaded From: http://proceedings.spiedigitallibrary.org/ on 06/25/2015 Terms of Use: http://spiedl.org/terms
(a)
VxEwi
g2(y+3)g(x+3,
y+3)
g2(y+2)
g2(y+1)
g2(y) g(x,y)?
/ g1(x) g1(x+1) g1(x+2) g1(x+3)Known —*-
(b)
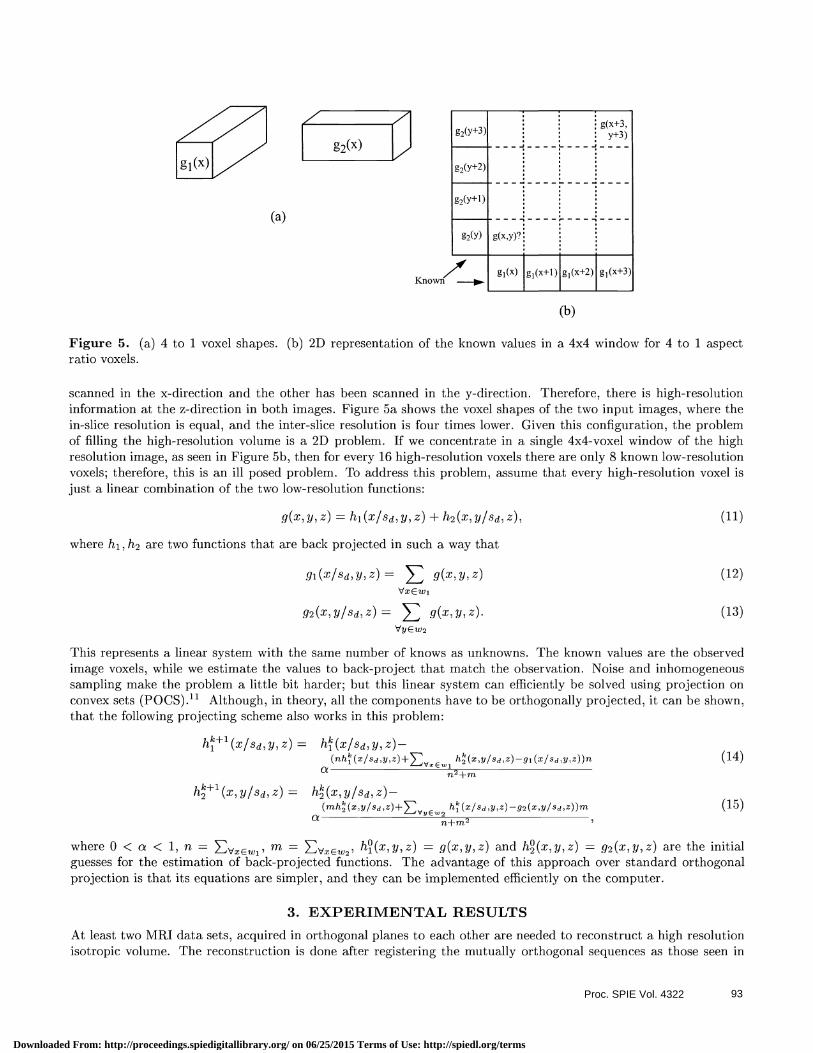
Figure 5. (a) 4 to 1 voxel shapes. (b) 2D representation of the known values in a 4x4 window for 4 to 1 aspectratio voxels.
scanned in the x-direction and the other has been scanned in the y-direction. Therefore, there is high-resolutioninformation at the z-direction in both images. Figure 5a shows the voxel shapes of the two input images, where thein-slice resolution is equal, and the inter-slice resolution is four times lower. Given this configuration, the problemof filling the high-resolution volume is a 2D problem. If we concentrate in a single 4x4-voxel window of the highresolution image, as seen in Figure 5b, then for every 16 high-resolution voxels there are only 8 known low-resolutionvoxels; therefore, this is an ill posed problem. To address this problem, assume that every high-resolution voxel isjust a linear combination of the two low-resolution functions:
g(x,y,z) = hl(x/Sd,y,Z) + h2(x,y/sd,z), (11)
where h1 ,h2 are two functions that are back projected in such a way that
gl(x/sd,y,z) = i: g(x,y,z) (12)
g2(x,y/sd,z) = i: g(x,y,z). (13)
VyEw2
This represents a linear system with the same number of knows as unknowns. The known values are the observedimage voxels, while we estimate the values to back-project that match the observation. Noise and inhomogeneoussampling make the problem a little bit harder; but this linear system can efficiently be solved using projection onconvex sets (POCS).11 Although, in theory, all the components have to be orthogonally projected, it can be shown,that the following projecting scheme also works in this problem:
h' (X/Sd,11 z) = h (x/sd, 71 z) —(nh(x/sd,y,z)+ h (x,y/sd,z)-g1 (x/sd,y,z))n (14)
o En +m
h1(X,y/Sd,Z) = h(X,y/Sd,Z)—(mh(x,y/sd ,z)+ h (x/sd ,y,z) -g (x,y/sd ,z))m (15)
Q yE 2n+m
where 0 < < 1, n = >VxEwi' m = >-IVXEw2' h(x,y,z) = g(x,y,z) and h(x,y,z) = g2(x,y,z) are the initial
guesses for the estimation of back-projected functions. The advantage of this approach over standard orthogonalprojection is that its equations are simpler, and they can be implemented efficiently on the computer.
3. EXPERIMENTAL RESULTSAt least two MRI data sets, acquired in orthogonal planes to each other are needed to reconstruct a high resolutionisotropic volume. The reconstruction is done after registering the mutually orthogonal sequences as those seen in
Proc. SPIE Vol. 4322 93
Downloaded From: http://proceedings.spiedigitallibrary.org/ on 06/25/2015 Terms of Use: http://spiedl.org/terms
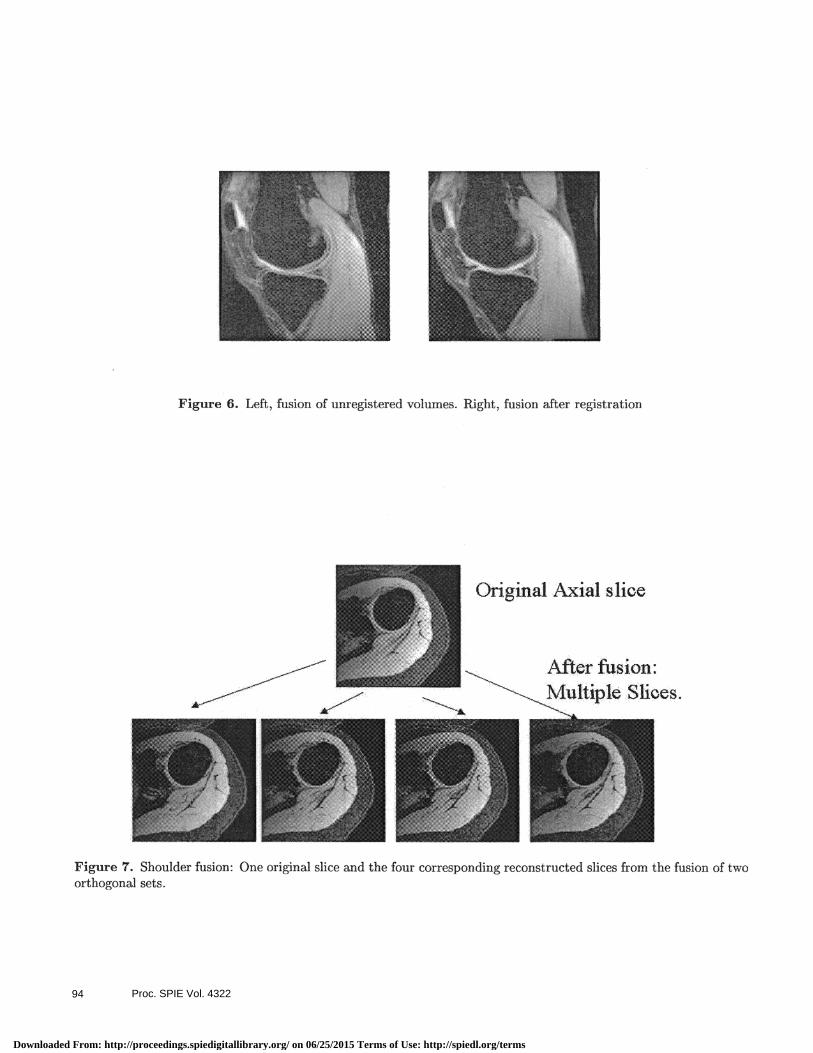
Figu Lft u nfn trdolu h ii ftr I 'OIl
Figure 7. Shoulder fusion: One original slice and the four corresponding reconstructed slices from the fusion of twoorthogonal sets.
original \.xiaI slice
.\Jicr tusjon:\:lLjltil)le Slices.
Proc. SPIE Vol. 432294
Downloaded From: http://proceedings.spiedigitallibrary.org/ on 06/25/2015 Terms of Use: http://spiedl.org/terms
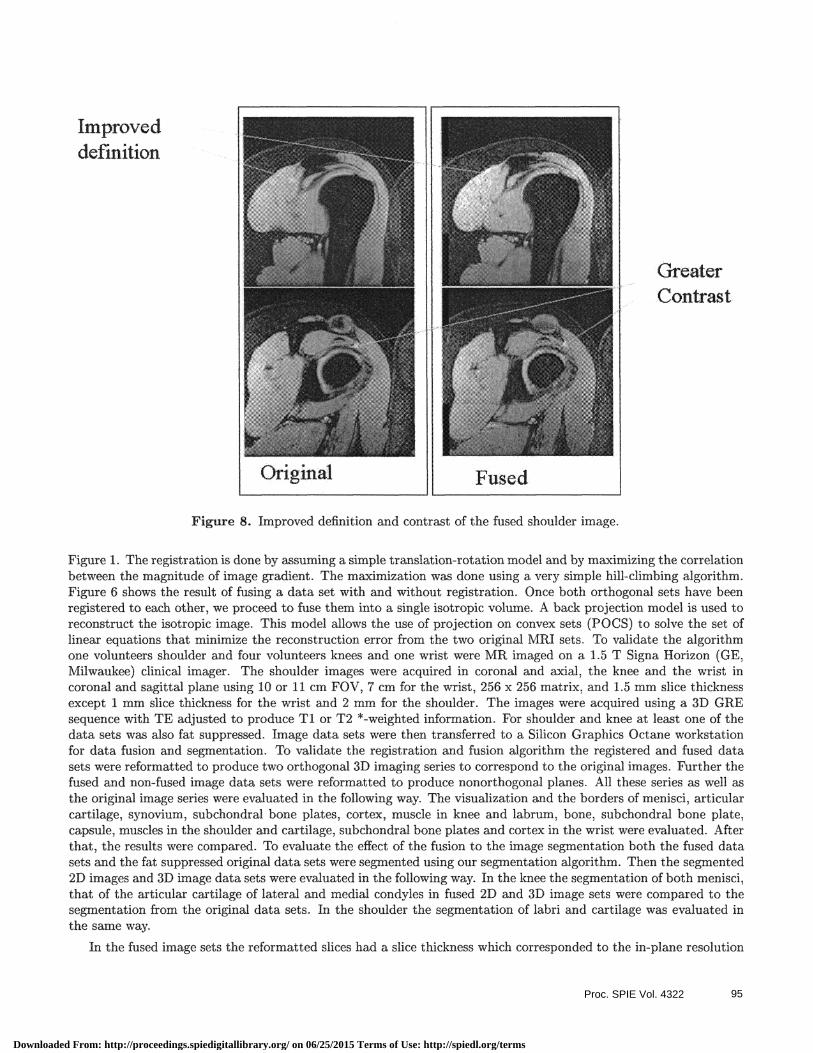
Improveddefinition
GreaterContrast
Figure 8. Improved definition and contrast of the fused shoulder image.
Figure L The registration is done by assuming a simple translation-rotation model and by maximizing the correlationbetween the magnitude of image gradient. The maximization was done using a very simple hillclimbing algorithm.Figure 6 shows the result of fusing a data set with and without registration. Once both orthogonal sets have beenregistered to each other, we proceed to fuse them into a single isotropic volume. A back projection model is used toreconstruct the isotropic image. This model allows the use of projection on convex sets (POCS) to solve the set oflinear equations that minimize the reconstruction error from the two original Mifi sets. To validate the algorithmone volunteers shoulder and four volunteers knees and one wrist were MR imaged on a 1.5 T Signa Horizon (GE,Milwaukee) clinical imager. The shoulder images were acquired in coronal and axial, the knee and the wrist incoronal and sagittal plane using 10 or 11 cm FOV, 7 cm for the wrist, 256 x 256 matrix, and 1.5 mm slice thicknessexcept 1 mm slice thickness for the wrist and 2 mm for the shoulder. The images were acquired using a 3D GREsequence with TE adjusted to produce TI or T2 *..weighted information. For shoulder and knee at least one of thedata sets was also fat suppressed. Image data sets were then transferred to a Silicon Graphics Octane workstationfor data fusion and segmentation. To validate the registration and fusion algorithm the registered and fused datasets were reformatted to produce two orthogonal 3D imaging series to correspond to the original images. Further thefused and non-fused image data sets were reformatted to produce nonorthogonal planes. All these series as well asthe original image series were evaluated in the following way. The visualization and the borders of menisci, articularcartilage, synovium, subchondral bone plates, cortex, muscle in knee and labrum, bone, subchondral bone plate,capsule, muscles in the shoulder and cartilage, subchondral bone plates and cortex in the wrist were evaluated, Afterthat, the results were compared. To evaluate the effect of the fusion to the image segmentation both the fused datasets and the fat suppressed original data sets were segmented using our segmentation algorithm. Then the segmented2D images and 3D image data sets were evaluated in the following way. In the knee the segmentation of both menisci,that of the articular cartilage of lateral and medial condyles in fused 2D and 3D image sets were compared to thesegmentation from the original data sets. In the shoulder the segmentation of labri and cartilage was evaluated inthe same way.
In the fused image sets the reformatted slices bad a slice thickness which corresponded to the in-plane resolution
Proc. SPIE Vol. 4322 95
Downloaded From: http://proceedings.spiedigitallibrary.org/ on 06/25/2015 Terms of Use: http://spiedl.org/terms
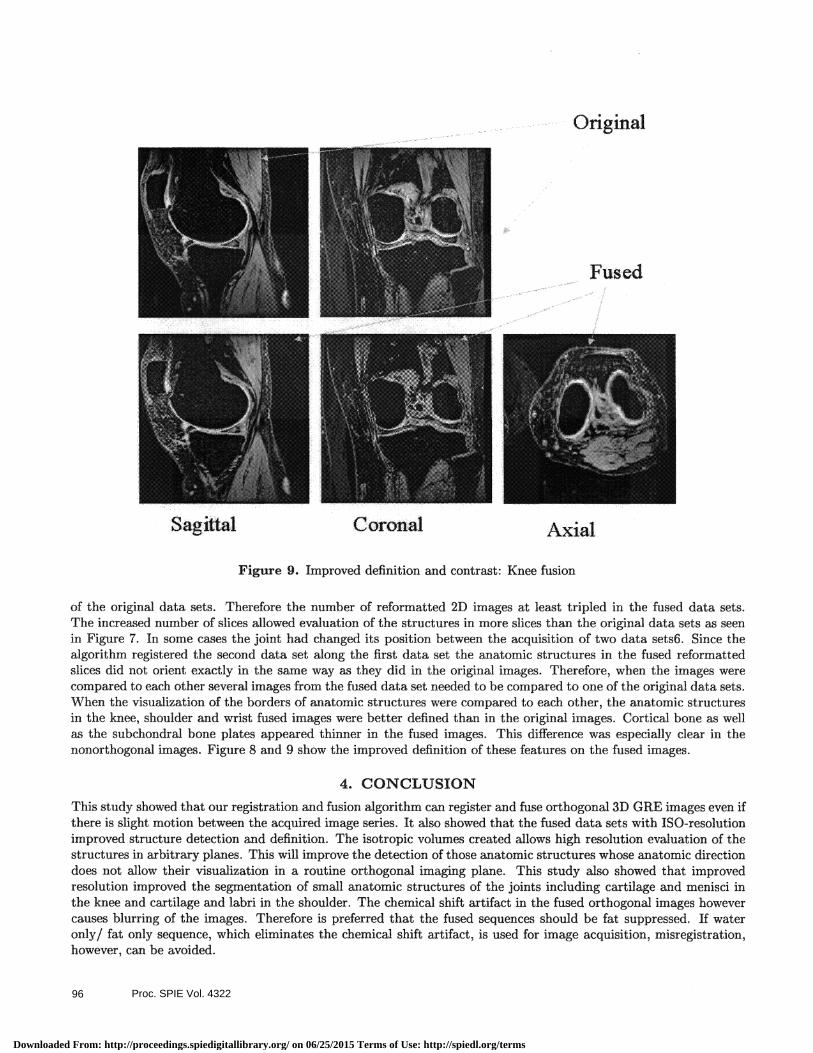
Figure 9. Improved definition and contrast: Knee fusion
of the original data sets. Therefore the number of reformatted 2D images at least tripled in the fused data sets.The increased number of slices allowed evaluation of the structures in more slices than the original data sets as seenin Figure 7. In some cases the joint had changed its position between the acquisition of two data sets6. Since thealgorithm registered the second data set along the first data set the anatomic structures in the fused reformattedslices did not orient exactly in the same way as they did in the original images. Therefore, when the images werecompared to each other several images from the fused data set needed to he compared to one of the original data sets.When the visualization of the borders of anatomic structures were compared to each other, the anatomic structuresin the knee, shoulder and wrist fused images were better defined than in the original images. Cortical bone as wellas the subchondral bone plates appeared thinner in the fused images. This difference was especially clear in thenonorthogonal images. Figure 8 and 9 show the improved definition of these features on the fused images.
4, CONCLUSIONThis study showed that our registration and fusion algorithm can register and fuse orthogonal 3D GRE images even ifthere is slight motion between the acquired image series. It also showed that the fused data sets with ISO-resolutionimproved structure detection and definition, The isotropic volumes created allows high resolution evaluation of thestructures in arbitrary planes. This will improve the detection of those anatomic structures whose anatomic directiondoes not allow their visualization in a routine orthogonal imaging plane. This study also showed that improvedresolution improved the segmentation of small anatomic structures of the joints including cartilage and menisci inthe knee and cartilage and labri in the shoulder, The chemical shift artifact in the fused orthogonal images howevercauses blurring of the images. Therefore is preferred that the fused sequences should be fat suppressed. If wateronly/ fat only sequence, which eliminates the chemical shift artifact, is used for image acquisition, misregistration,however, can be avoided.
OHginai
Sagittal Coronal Axial
Proc. SPIE Vol. 432296
Downloaded From: http://proceedings.spiedigitallibrary.org/ on 06/25/2015 Terms of Use: http://spiedl.org/terms

ACKNOWLEDGMENTSThis work is supported in part by the NSF/NYS Grant to the Center for Electronic Imaging Systems at the Universityof Rochester, the University of Rochester departments of Electrical Engineering and Radiology and by a FulbrightScholarship from the U.S.-Mexico Fulbright-CONACYT Commission, Mexico.
REFERENCES1. G. A. Wright, "Magnetic resonance imaging," Signal Processing , pp. 56--66, 1997.2. V. 5, G. C, M. FB, and et al, "Improved intracranial lesion characterization by tissue segmentation based on a
3d feature map," Magn Reson Med 37, pp. 457—469, 1997.3. V. 5, G. CF, K. R, and et al., "Fast tissue segmentation based on a 4d feature map in characterization of
intracranial lesions," J Magn Reson Imaging 9, pp. 768—776, 1999.4. J. G. Tamez-Peña, S. Totterman, and K. J. Parker, "Unsupervised statistical segmentation of multispectral
volumetric mr images," in Proceedings SPIE, Medical Imaging 1999: Image Processing, vol. 3661, pp. x—x,SPIE, 1999.
5. J. G. Tamez—Peña, S. Totterman, and K. J. Parker, "The integration of automatic segmentation and motiontracking for 4d reconstruction and visualization of musculoskeletal structures," in Proceedings IEEE Workshopon Biomedical Image Analysis, pp. 154—163, IEEE, 1998.
6. G. A.A. and T. D.A., "Fusion of short-axis and long-axis cardiac mr images," Computarize Medical Imagingand Graphics 20(2), pp. 77—87, 1996.
7. J. B. A. Maintz and M. A. Viergever, "A survey of medical image registration," Medical Image Analysis 2(2),pp. 1—36, 1998.
8. J. B. A. Maintz, P. A. van den Elsen, and M. A. Viergever, "Comparison of edge-based and ridge-based regis-tration of ct and mr brain images," Medical Image Analysis 1(2), pp. 151—161, 1996.
9. C. Studholme, D. L. G. Hill, and D. J. Hawkes, "Automated 3d registration of mr and ct images of the head,"Medical Image Analysis 1(2), pp. 163—175, 1996.
10. B. Vemuri, S. Huang, S. Sahni, M. Leonard, C. Mohr, R. Gilmore, and J. Fitzsimmons, "An efficient motionestimator with applications to medical image registration," Medical Image Analysis 2(1), pp. 79—98, 1998.
11. H. Stark and Y. Yang, Vector Space Projections, John Wiley & Sons, INC, New York, 1998.
Proc. SPIE Vol. 4322 97
Downloaded From: http://proceedings.spiedigitallibrary.org/ on 06/25/2015 Terms of Use: http://spiedl.org/terms