Embed Size (px)
Citation preview
7/24/2017
1
MRI Basic for Clinical Trial
Jihong Wang, PhDProfessor, Director of Imaging
Department of Radiation PhysicsUniversity of Texas MD Anderson Cancer Center
Houston, Texas
Imaging based clinical trials
• Determine the value of imaging procedures for detecting, diagnosing, guiding, or monitoring the treatment of disease
• Important factors:– Patient positioning– Imaging acquisition protocol (including consistencies in acquisition slice location!)– Imaging analysis hardware and software – Interpretation guidelines are much more important to imaging trials compared to therapeutic
trials (more critical when quantitative imaging analysis is involved)
• Standardization of the various components in an imaging clinical trial is key and optimization every step of the imaging chain is critical!
• There are efforts to create imaging standards and guidelines by the Cancer Imaging Program of the NIH, RSNA, ACR, ISMRM and many other organizations
7/24/2017
2
Therapeutic trials using imaging
• More on the overall consistency and accuracy among multiple institutions, less focus on the various components in the imaging chain
• Using imaging as biomarkers (or surrogate biomarkers): both anatomical and functional imaging
• Consistency in imaging acquisition protocol, patient positioning, imaging analysis hardware and software, analysis and measurement guidelines are also important, especially when quantitative imaging analysis is involved.
• The promotion in the effort to create imaging biomarker standards is one of the goals of the QIBA, a joint effort by the Cancer Imaging Program of the NIH, RSNA, ACR, ISMRM and many other organizations
To ensure the quality of imaging biomarker
• Define well‐established imaging biomarkers (DWI? T1,T2,T2*)
• Ensure consistency and equality at all sites
• Identical data acquisition for all sites, at all time
– Including patient prep, positioning, protocol, reconstruction, QA
• Standardizes data analysis
• Ensure imaging data harmonization (data acquired on different imaging systems are comparable)
7/24/2017
3
Utilization of MRI in Clinical Trial
• How are MRI used in clinical trials– Anatomical MRI– Functional MRI (Quantitative vs. qualitative)
• MRI QA in Clinical Trials– Prospectively planned– Scanner System QA (monitoring hardware changes)– Scanning Sequence QA/QC (acquisition sequence and patient positioning consistency)
– QA of the Image Analysis Tools– Quantitative MRI initiatives (QIBA etc.)
Physicist's role in Clinical Trial
Must ensure MRI anatomical and quantitative imaging accuracy
– Consistency and standardization are critical
– MRI scanner system check (routine QA)
– Geometric Fidelity (distortion/Linearity)
– Signal Intensity Stability
– Quantitative Imaging QA
– AAPM, ACR QA guidelines for MRI system QA
– QIBA guidelines for quantitative MRI
7/24/2017
4
Key Factors Affects the Characteristics of MR Images
• MRI System– B0 (uniformity, stability)
– B1 (gradients linearity, stability)
– Coils (sensitivity, stability)
– Artifacts (due to environment)
• Pulse Sequences– Various types of sequences (also affected by hardware)
• Analysis Tools– Models, algorithms, software bugs etc.
Reviews of MRI Basics Relevant to Clinical Trials
1. MRI hardware/system components
2. MRI sequences
3. QA procedures
7/24/2017
5
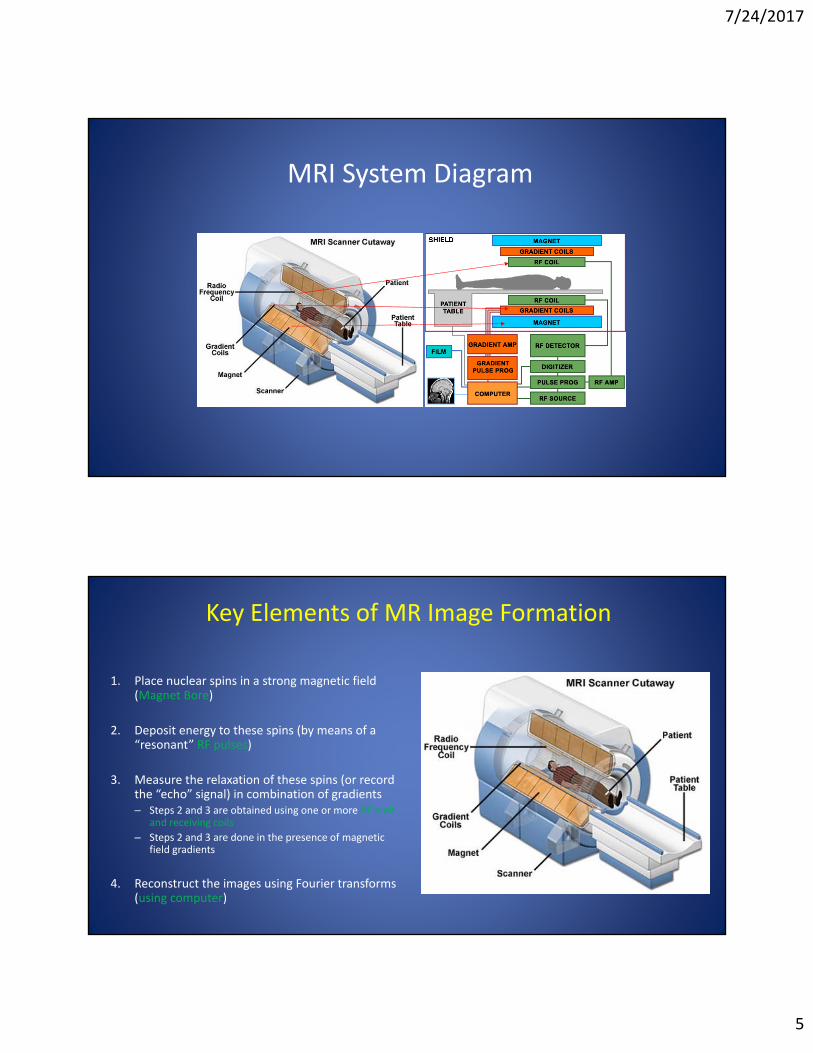
MRI System Diagram
Key Elements of MR Image Formation
1. Place nuclear spins in a strong magnetic field (Magnet Bore)
2. Deposit energy to these spins (by means of a “resonant” RF pulses)
3. Measure the relaxation of these spins (or record the “echo” signal) in combination of gradients– Steps 2 and 3 are obtained using one or more RF emit
and receiving coils
– Steps 2 and 3 are done in the presence of magnetic field gradients
4. Reconstruct the images using Fourier transforms (using computer)
7/24/2017
6
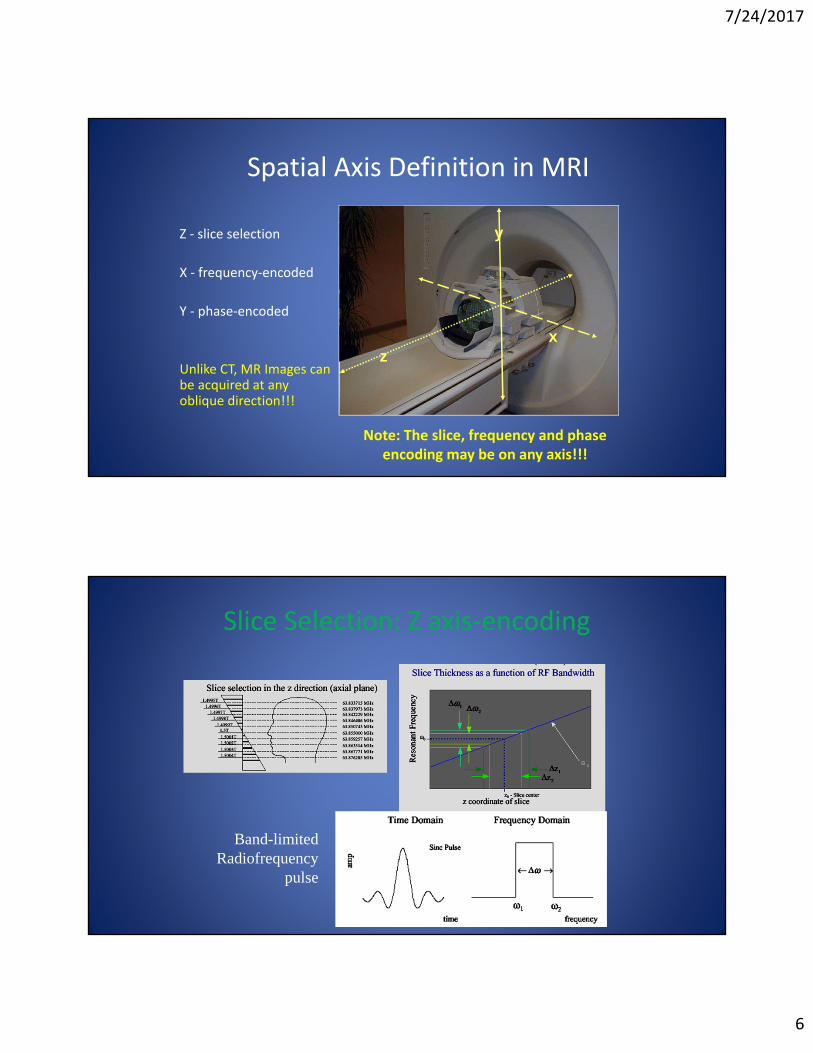
Spatial Axis Definition in MRI
Z ‐ slice selection
X ‐ frequency‐encoded
Y ‐ phase‐encoded
Unlike CT, MR Images can be acquired at any oblique direction!!!
zx
y
Note: The slice, frequency and phase encoding may be on any axis!!!
Slice Selection: Z axis‐encoding
Band-limitedRadiofrequency
pulse
7/24/2017
7
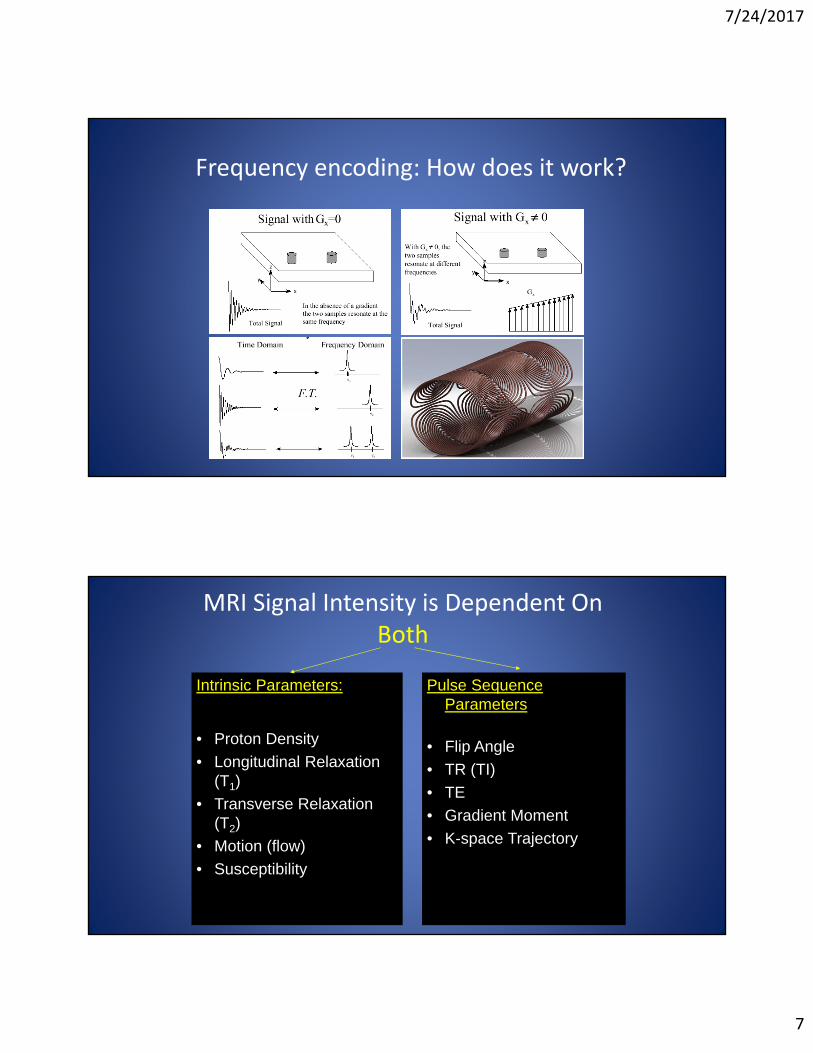
Frequency encoding: How does it work?
MRI Signal Intensity is Dependent On Both
Intrinsic Parameters:
• Proton Density
• Longitudinal Relaxation (T1)
• Transverse Relaxation (T2)
• Motion (flow)
• Susceptibility
Pulse Sequence Parameters
• Flip Angle
• TR (TI)
• TE
• Gradient Moment
• K-space Trajectory
7/24/2017
8
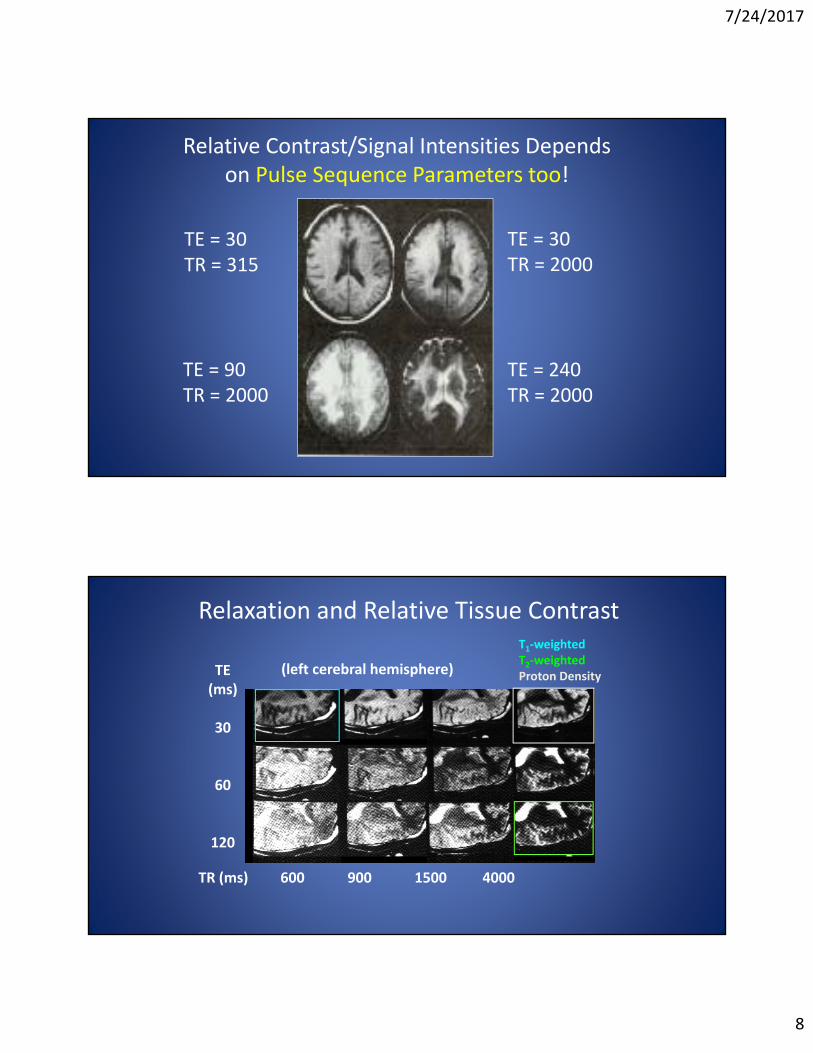
Relative Contrast/Signal Intensities Depends on Pulse Sequence Parameters too!
TE = 30TR = 315
TE = 30TR = 2000
TE = 90TR = 2000
TE = 240TR = 2000
Relaxation and Relative Tissue Contrast
TE (ms)
30
60
120
TR (ms) 600 900 1500 4000
(left cerebral hemisphere)
T1‐weightedT2‐weightedProton Density
7/24/2017
9
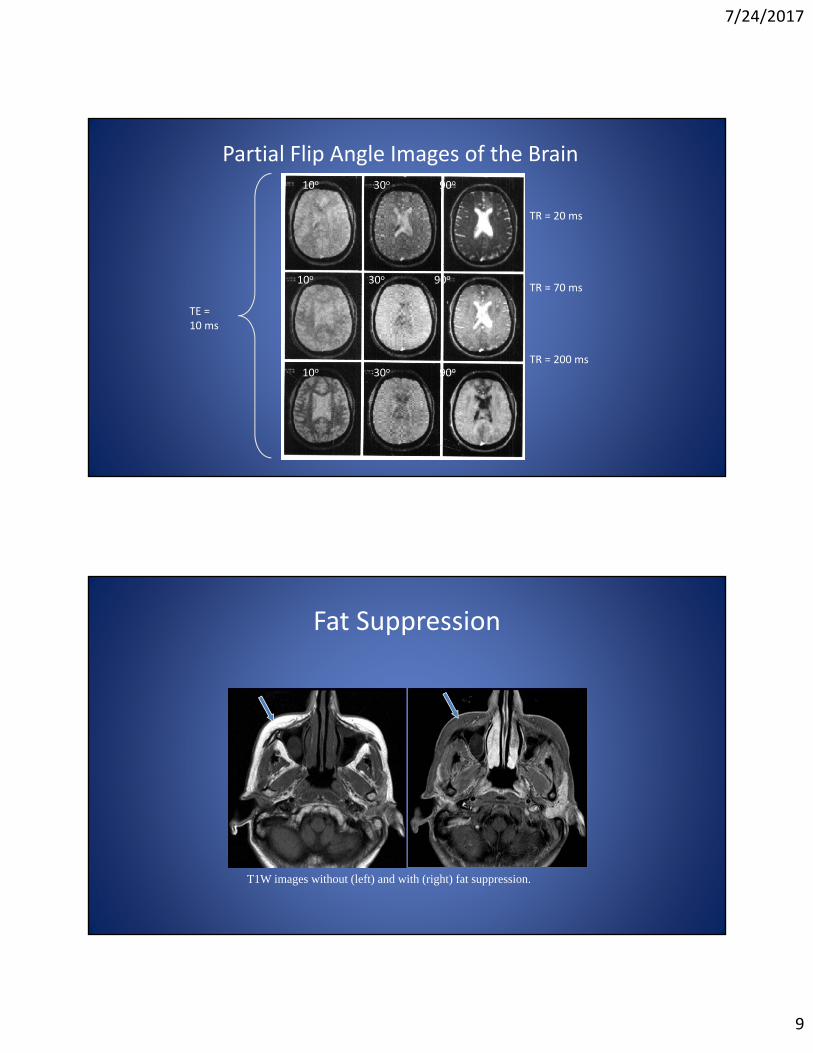
Partial Flip Angle Images of the Brain
TR = 20 ms
TR = 70 ms
TR = 200 ms
10o 30o 90o
10o 30o 90o
10o 30o 90o
TE =10 ms
Fat Suppression
T1W images without (left) and with (right) fat suppression.
7/24/2017
10
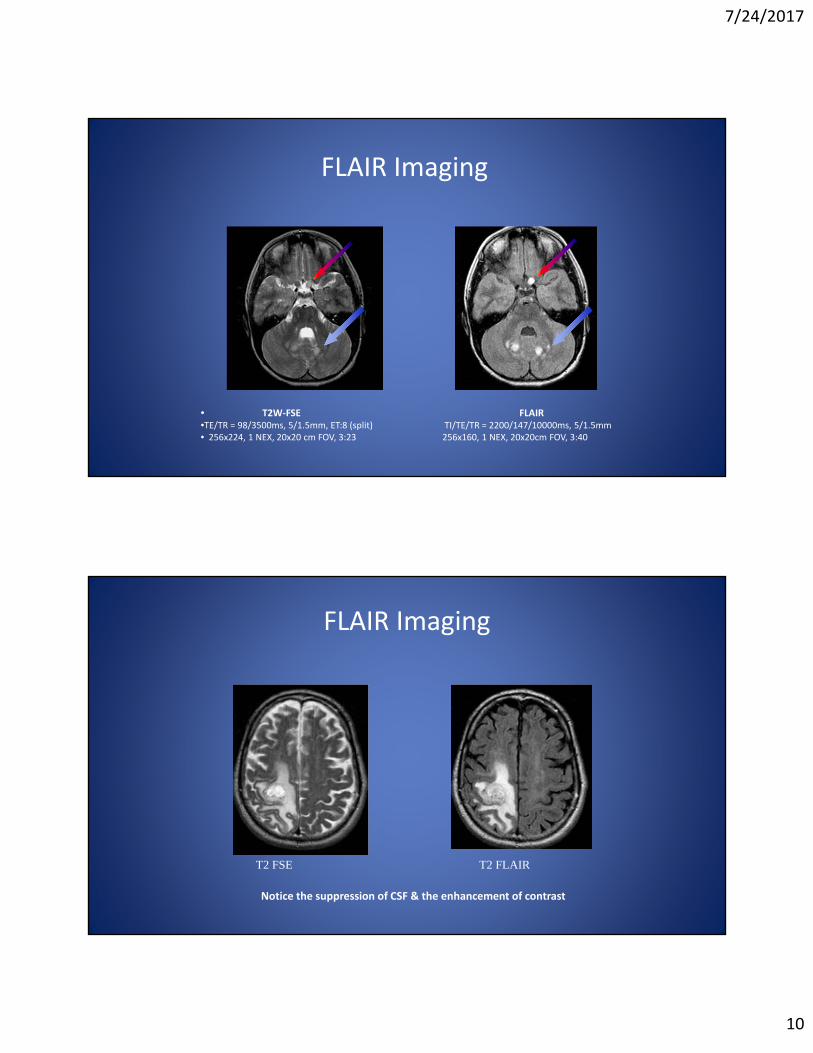
FLAIR Imaging
• T2W‐FSE FLAIR•TE/TR = 98/3500ms, 5/1.5mm, ET:8 (split) TI/TE/TR = 2200/147/10000ms, 5/1.5mm• 256x224, 1 NEX, 20x20 cm FOV, 3:23 256x160, 1 NEX, 20x20cm FOV, 3:40
FLAIR Imaging
T2 FSE T2 FLAIR
Notice the suppression of CSF & the enhancement of contrast
7/24/2017
11
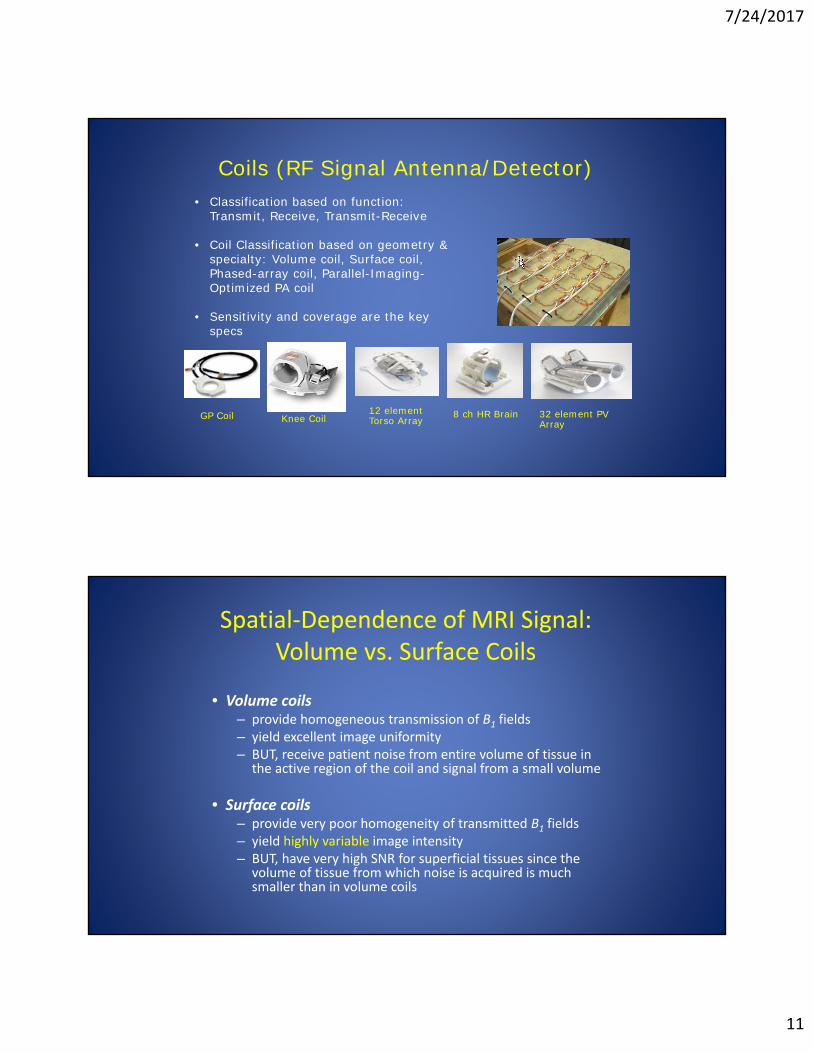
Coils (RF Signal Antenna/Detector)• Classification based on function:
Transmit, Receive, Transmit-Receive
• Coil Classification based on geometry & specialty: Volume coil, Surface coil, Phased-array coil, Parallel-Imaging-Optimized PA coil
• Sensitivity and coverage are the key specs
GP Coil Knee Coil12 elementTorso Array
8 ch HR Brain 32 element PV Array
Spatial‐Dependence of MRI Signal: Volume vs. Surface Coils
• Volume coils– provide homogeneous transmission of B1 fields– yield excellent image uniformity– BUT, receive patient noise from entire volume of tissue in
the active region of the coil and signal from a small volume
• Surface coils– provide very poor homogeneity of transmitted B1 fields– yield highly variable image intensity– BUT, have very high SNR for superficial tissues since the
volume of tissue from which noise is acquired is much smaller than in volume coils
7/24/2017
12
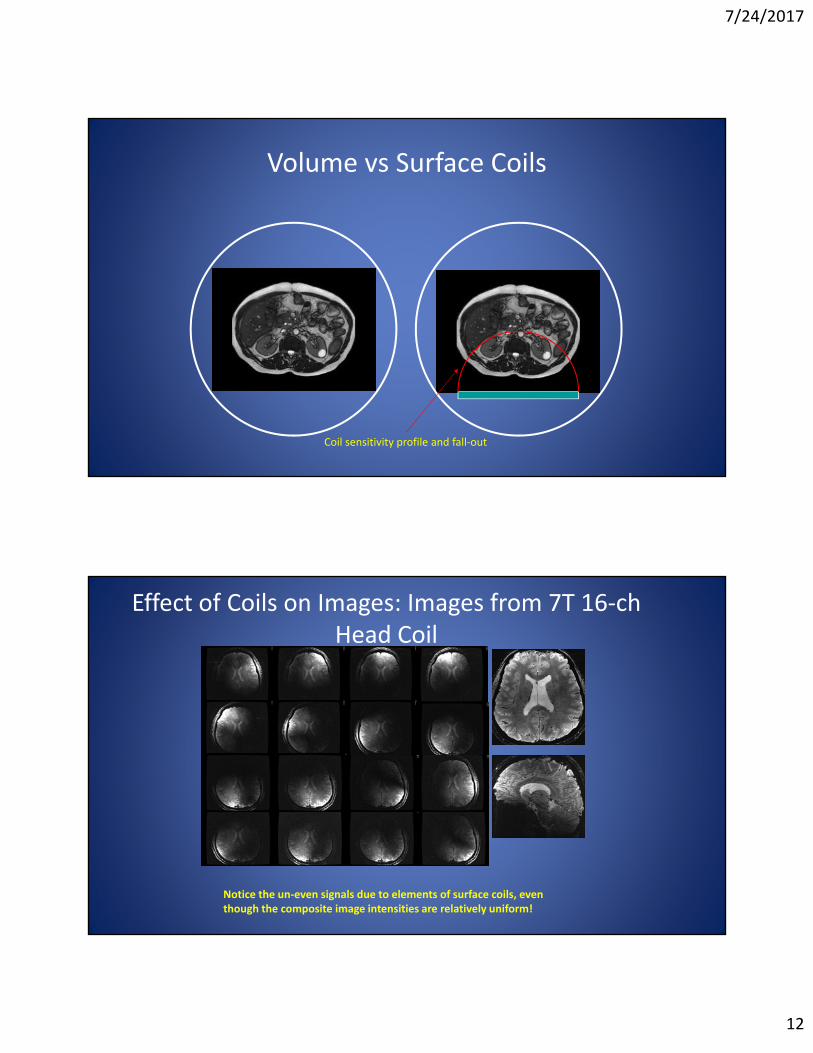
Volume vs Surface Coils
Coil sensitivity profile and fall‐out
Effect of Coils on Images: Images from 7T 16‐ch Head Coil
Notice the un‐even signals due to elements of surface coils, even though the composite image intensities are relatively uniform!
7/24/2017
13
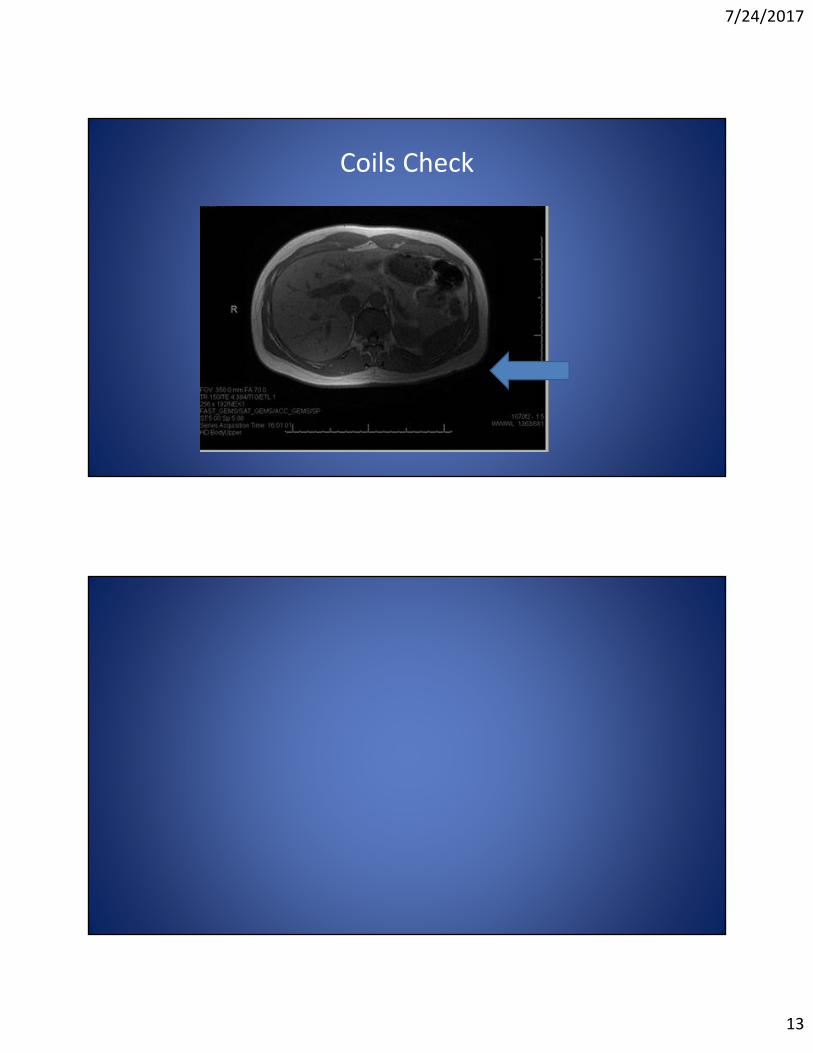
Coils Check
7/24/2017
14
Basic Anatomical Imaging Sequences Types
• Spin Echo
• Gradient Echo
• Inversion Recovery
• Pre‐sequence
• Functional Imaging Sequences
List of Functional MRI Techniques
• Diffusion MRI– DWI– DTI
• BOLD fMRI• Perfusion
– DSC– DCE– ASL
• MR Spectroscopy• CEST:
7/24/2017
15
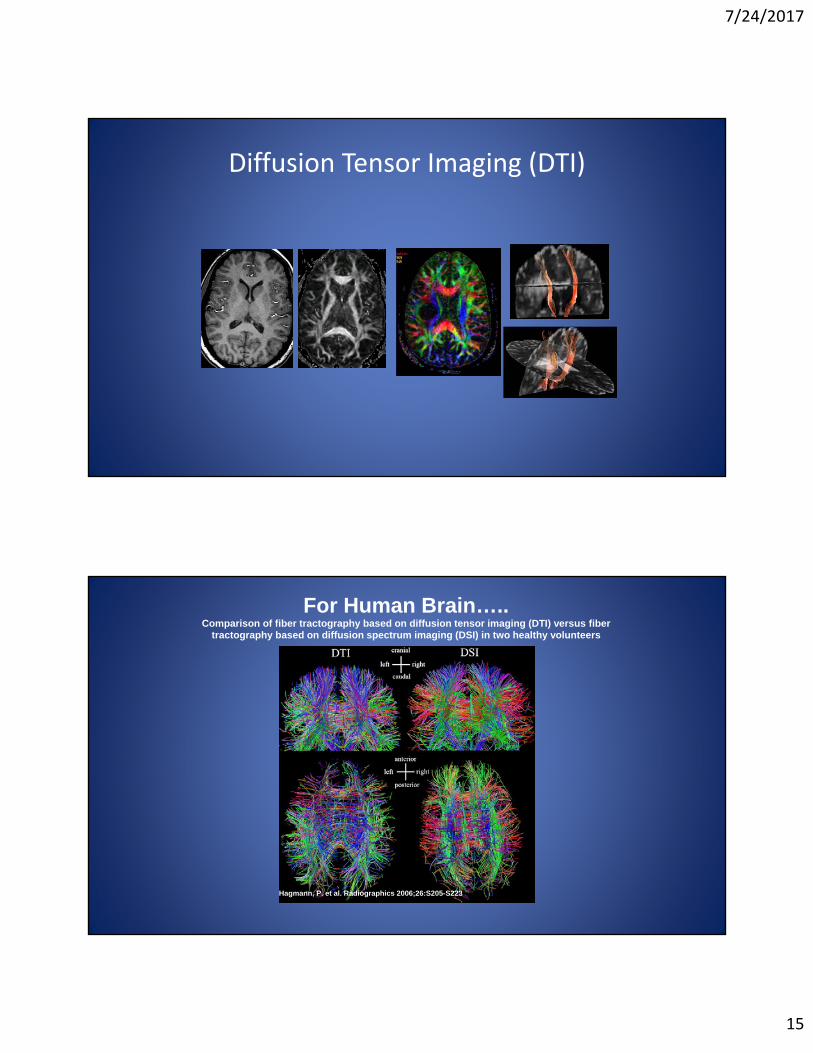
Diffusion Tensor Imaging (DTI)
Hagmann, P. et al. Radiographics 2006;26:S205-S223
For Human Brain…..Comparison of fiber tractography based on diffusion tensor imaging (DTI) versus fiber
tractography based on diffusion spectrum imaging (DSI) in two healthy volunteers
7/24/2017
16
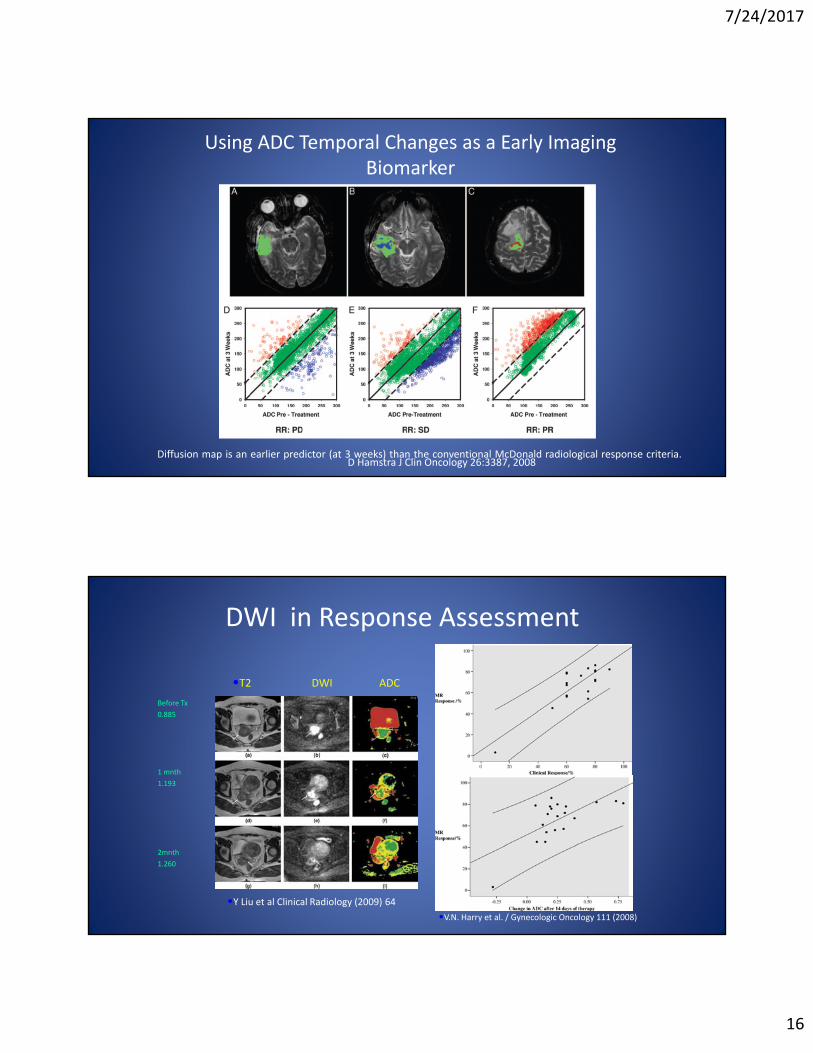
Using ADC Temporal Changes as a Early Imaging Biomarker
Diffusion map is an earlier predictor (at 3 weeks) than the conventional McDonald radiological response criteria.D Hamstra J Clin Oncology 26:3387, 2008
DWI in Response Assessment
Before Tx
0.885
1 mnth
1.193
2mnth
1.260
•T2 DWI ADC
•Y Liu et al Clinical Radiology (2009) 64•V.N. Harry et al. / Gynecologic Oncology 111 (2008)
7/24/2017
17
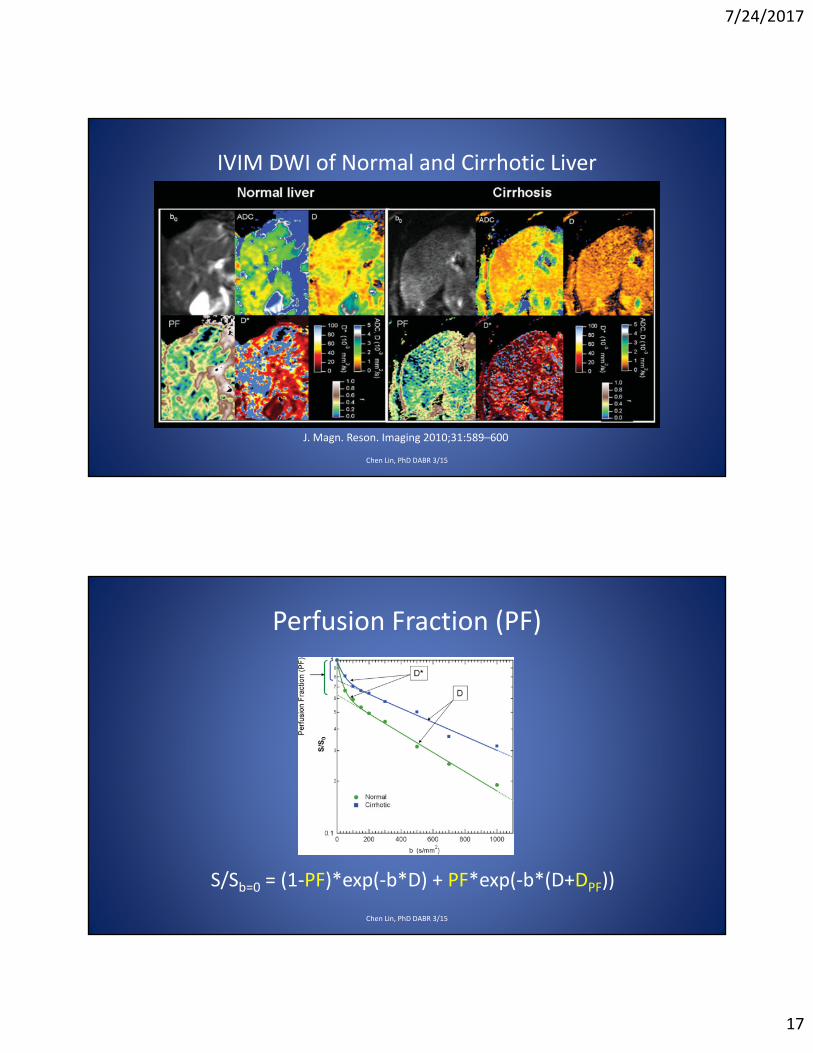
IVIM DWI of Normal and Cirrhotic Liver
Chen Lin, PhD DABR 3/15
J. Magn. Reson. Imaging 2010;31:589–600
Perfusion Fraction (PF)
Chen Lin, PhD DABR 3/15
S/Sb=0 = (1‐PF)*exp(‐b*D) + PF*exp(‐b*(D+DPF))
7/24/2017
18
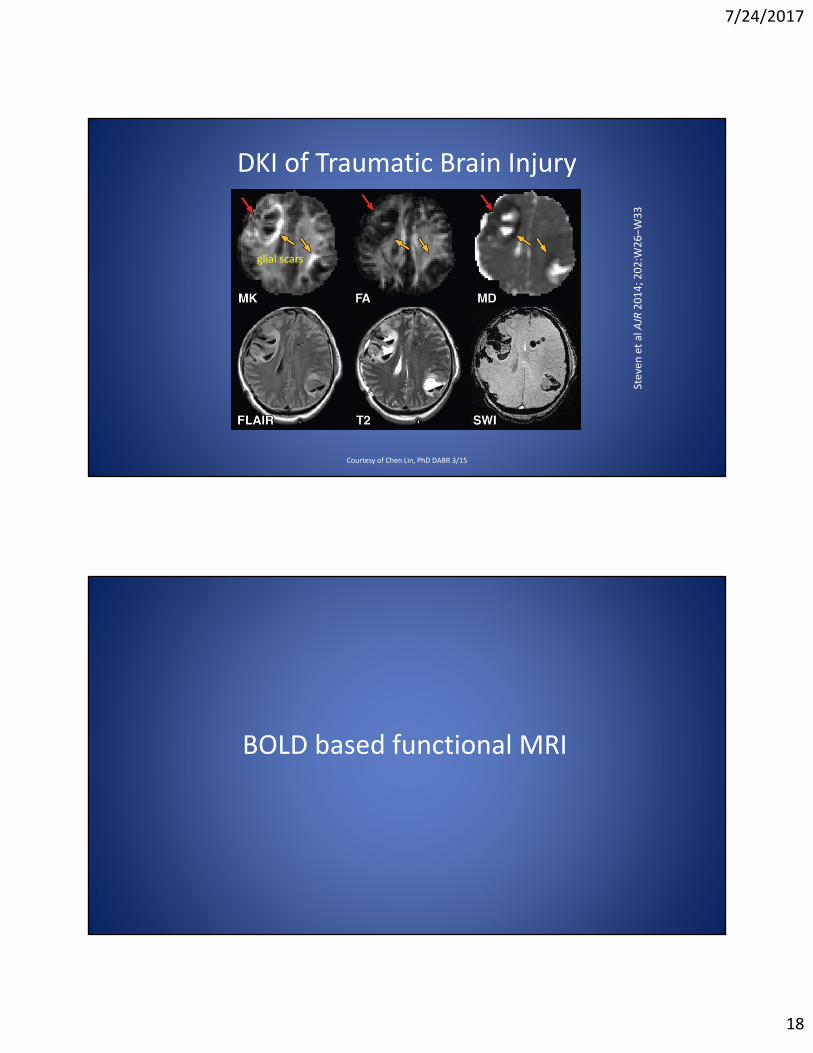
DKI of Traumatic Brain Injury
Courtesy of Chen Lin, PhD DABR 3/15
Steven
et al AJR 2014; 202:W
26–W
33
glial scars
BOLD based functional MRI
7/24/2017
19
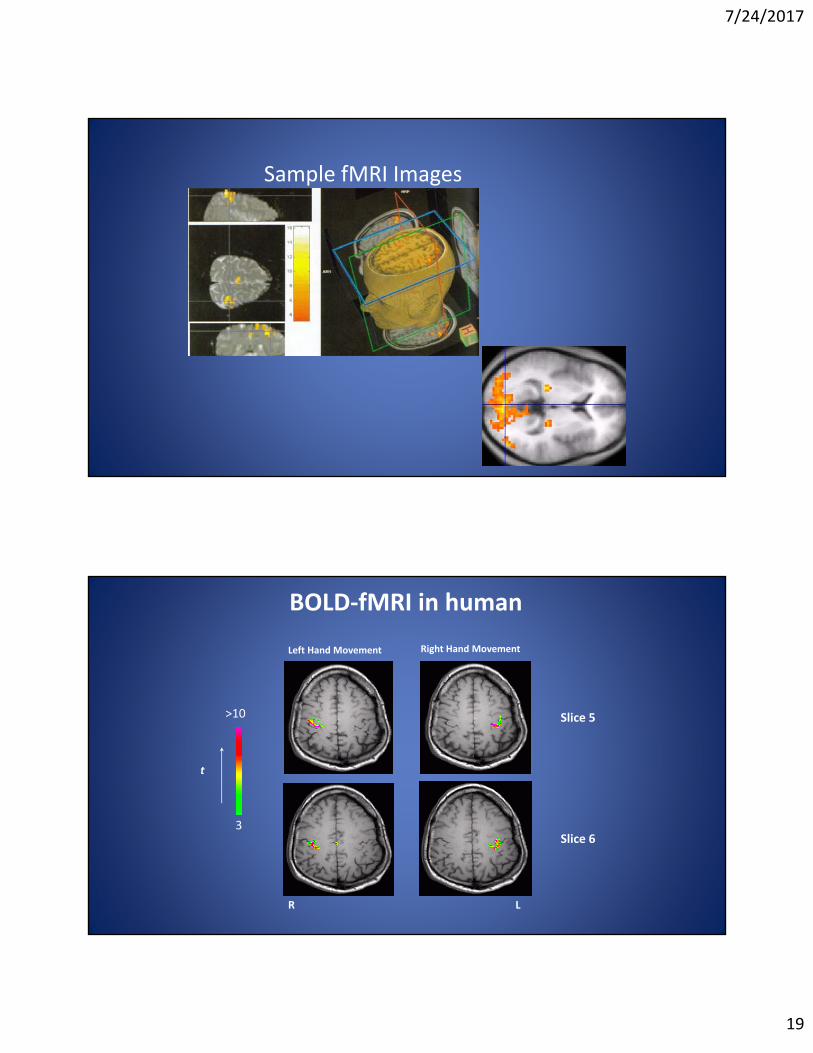
Sample fMRI Images
Left Hand Movement Right Hand Movement
R L
t
>10
3
Slice 5
Slice 6
BOLD‐fMRI in human
7/24/2017
20
Perfusion based functional MRI
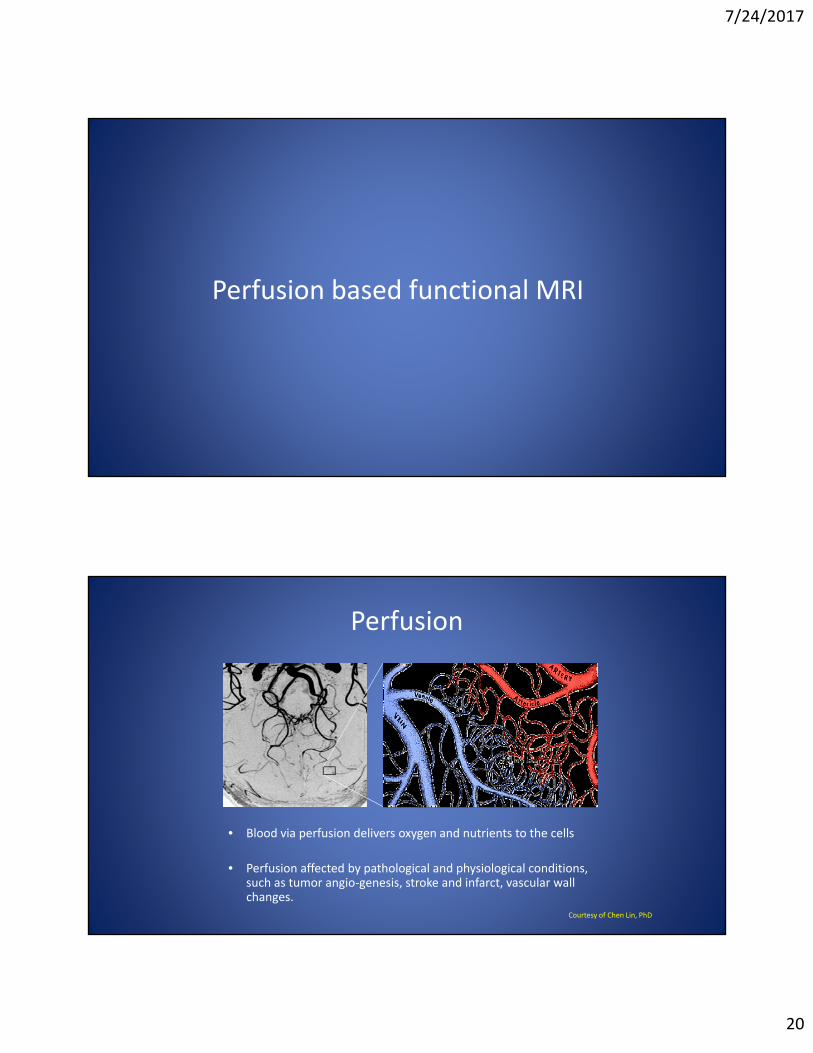
Perfusion
• Blood via perfusion delivers oxygen and nutrients to the cells
• Perfusion affected by pathological and physiological conditions, such as tumor angio‐genesis, stroke and infarct, vascular wall changes.
Courtesy of Chen Lin, PhD
7/24/2017
21
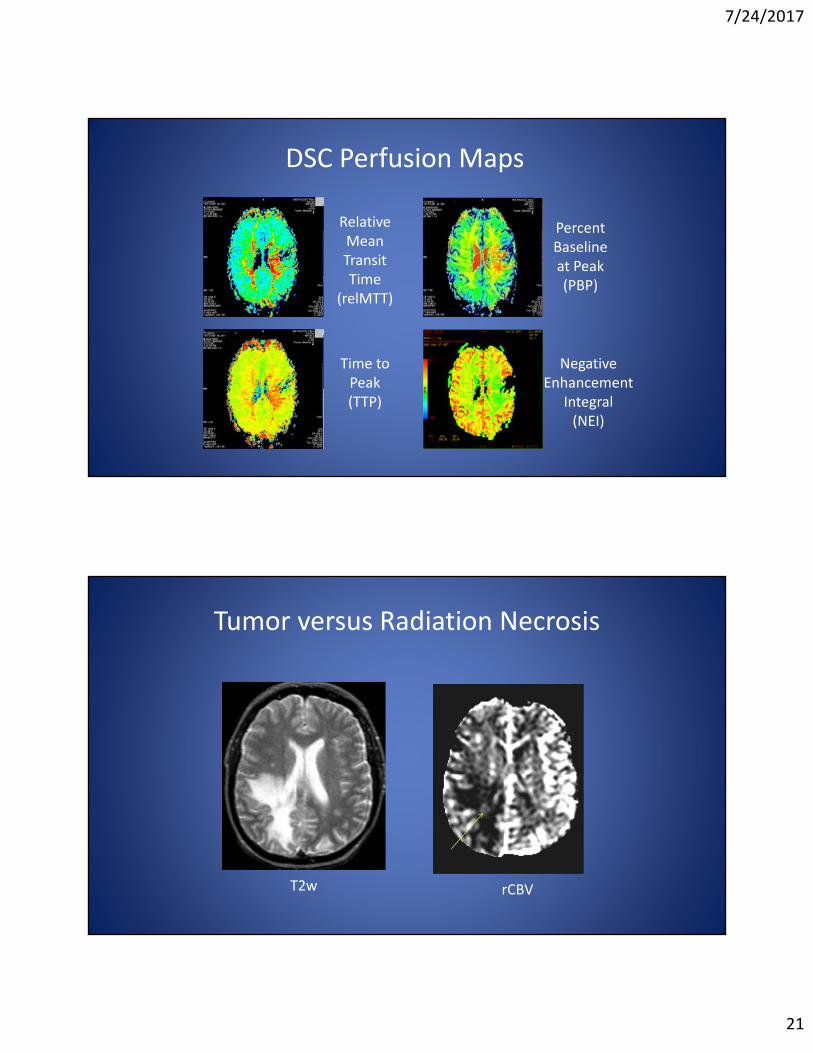
DSC Perfusion Maps
Relative Mean Transit Time
(relMTT)
Percent Baseline at Peak (PBP)
Time to Peak(TTP)
Negative Enhancement
Integral(NEI)
Tumor versus Radiation Necrosis
T2w rCBV
7/24/2017
22
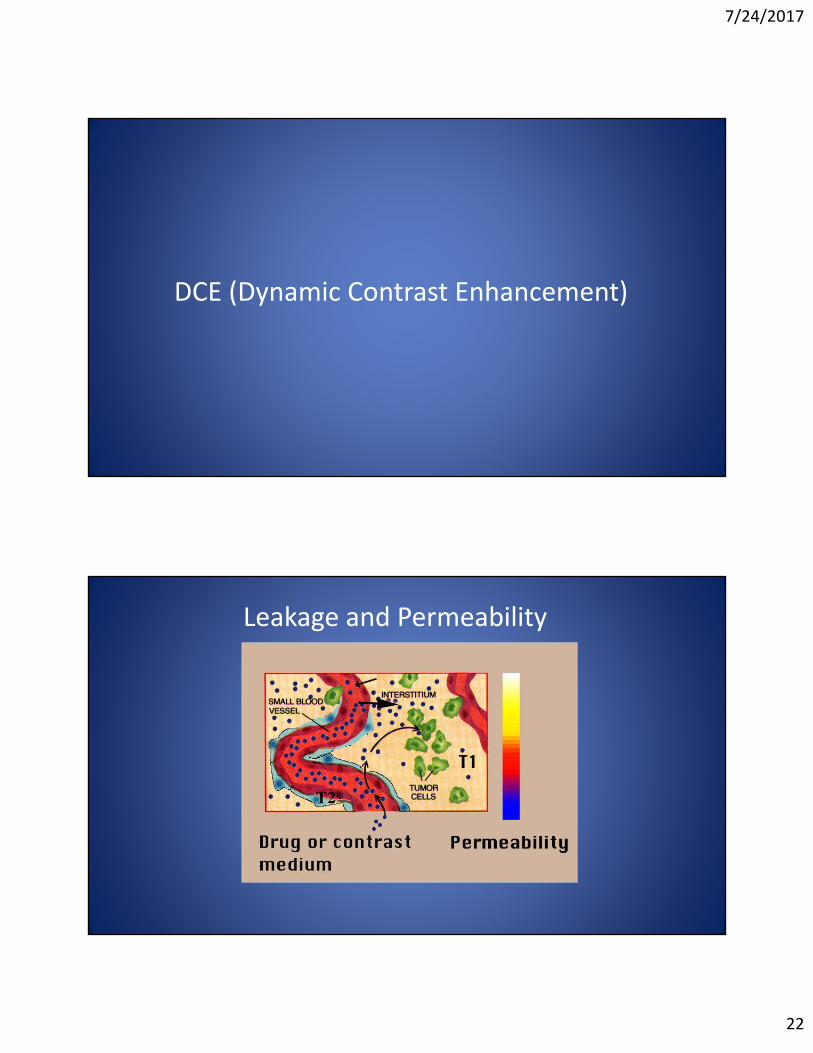
DCE (Dynamic Contrast Enhancement)
Leakage and Permeability
7/24/2017
23
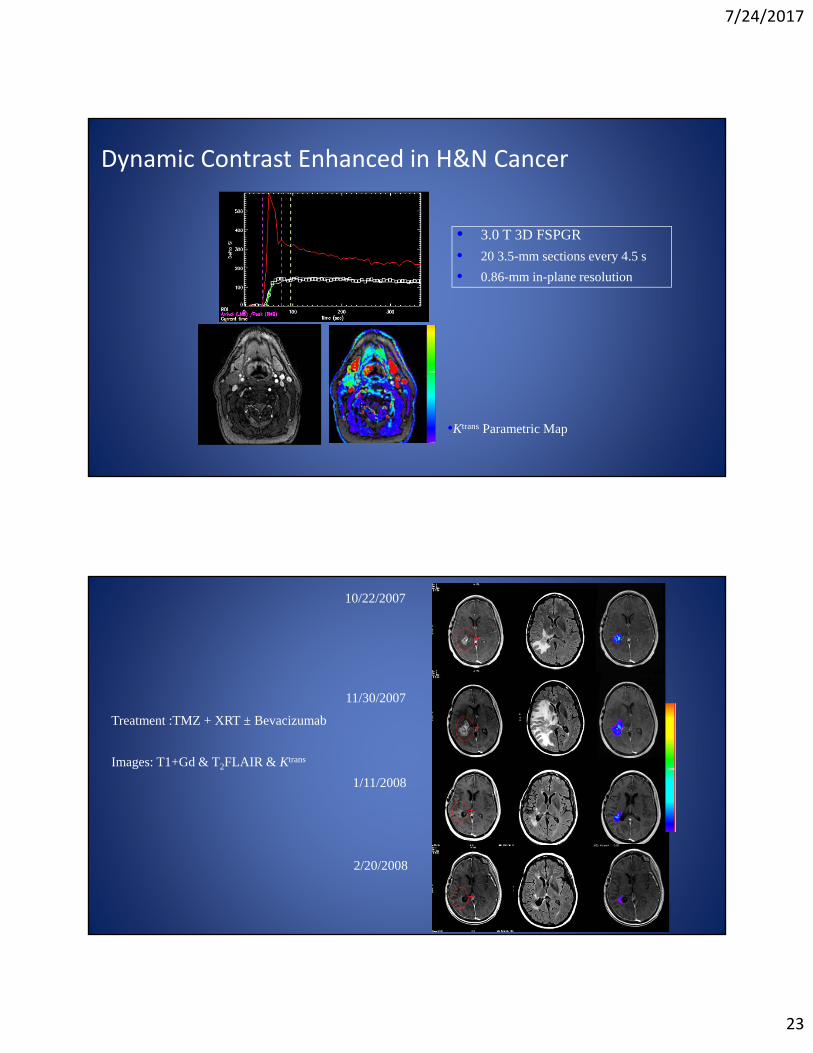
Dynamic Contrast Enhanced in H&N Cancer
• 3.0 T 3D FSPGR
• 20 3.5-mm sections every 4.5 s
• 0.86-mm in-plane resolution
•Ktrans Parametric Map
10/22/2007
11/30/2007
1/11/2008
2/20/2008
Treatment :TMZ + XRT ± Bevacizumab
Images: T1+Gd & T2FLAIR & Ktrans
7/24/2017
24
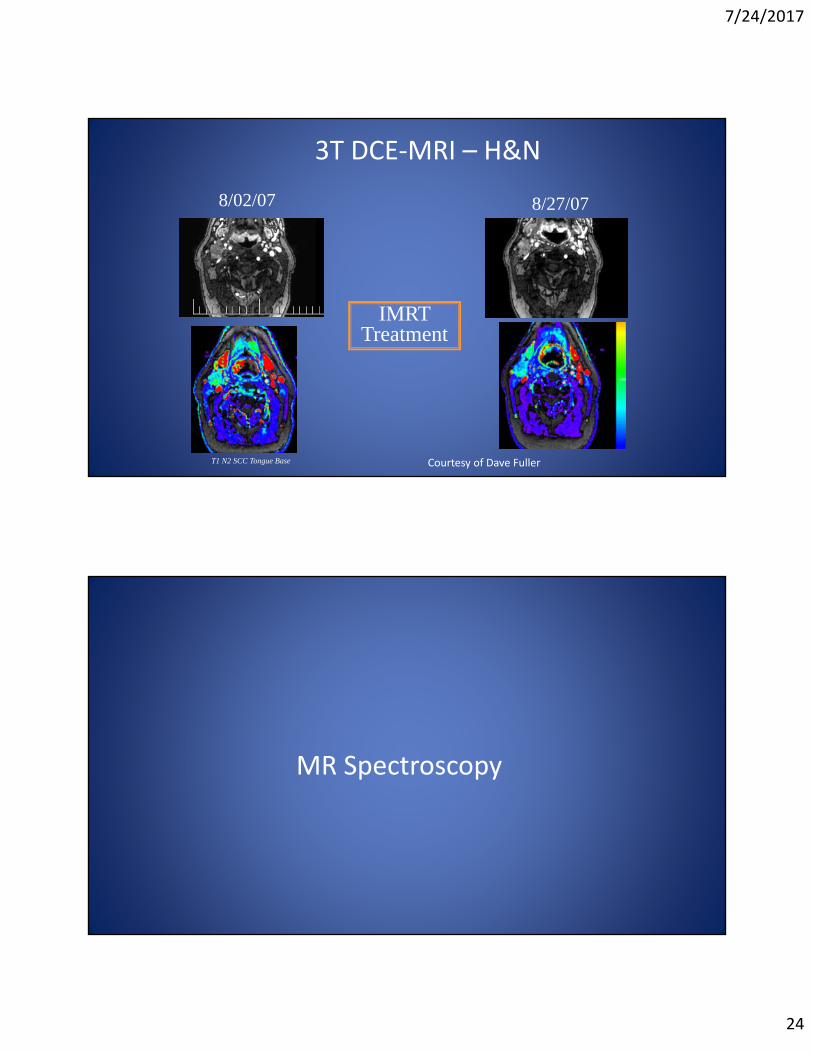
3T DCE‐MRI – H&N
8/02/07 8/27/07
T1 N2 SCC Tongue Base
IMRT Treatment
Courtesy of Dave Fuller
MR Spectroscopy
7/24/2017
25
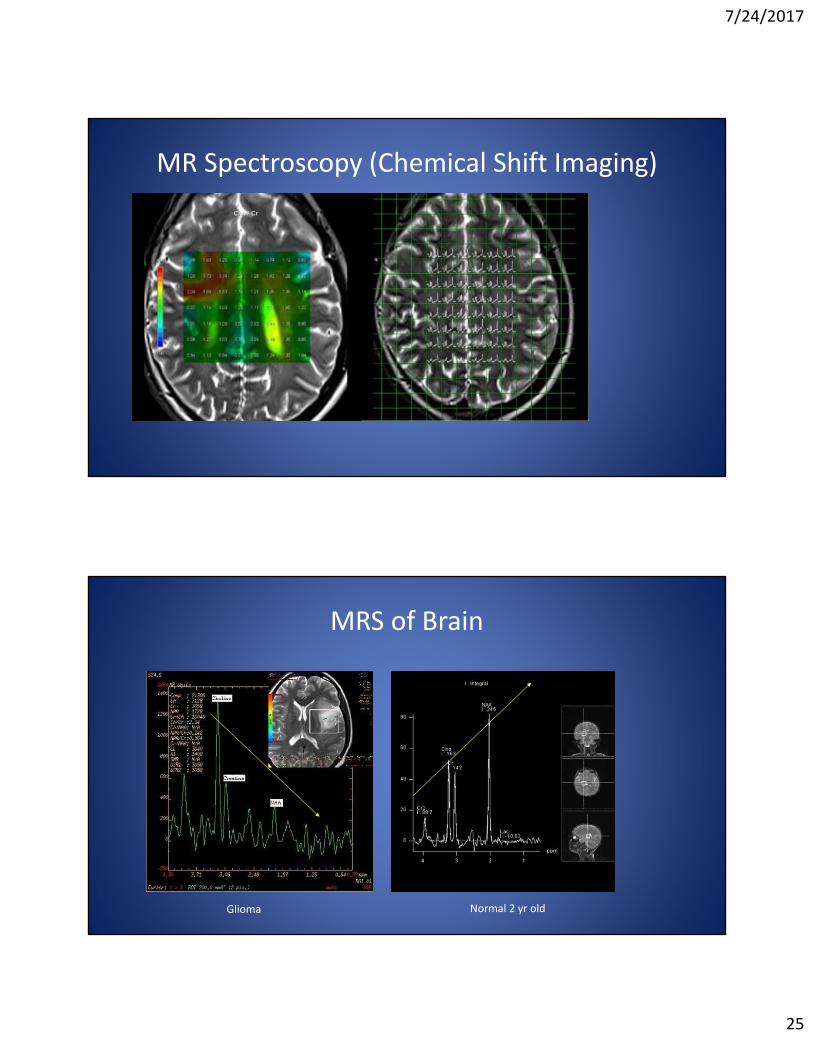
MR Spectroscopy (Chemical Shift Imaging)
MRS of Brain
Glioma Normal 2 yr old
7/24/2017
26
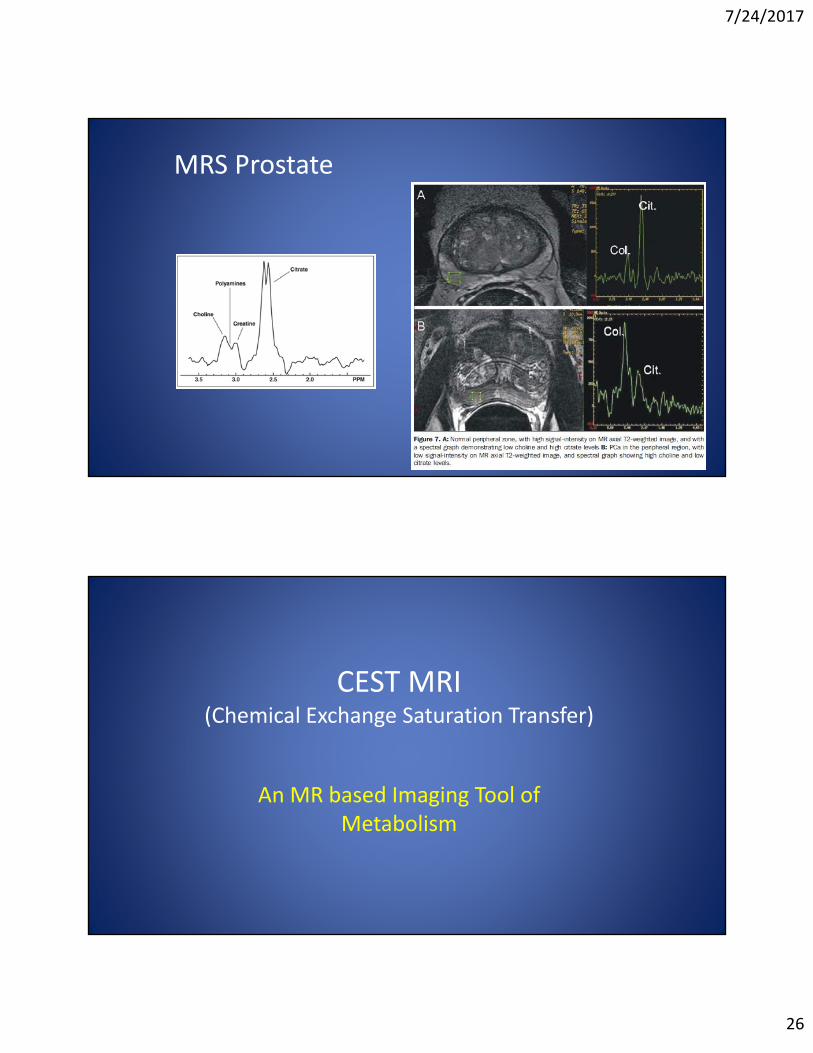
MRS Prostate
CEST MRI(Chemical Exchange Saturation Transfer)
An MR based Imaging Tool of Metabolism
7/24/2017
27
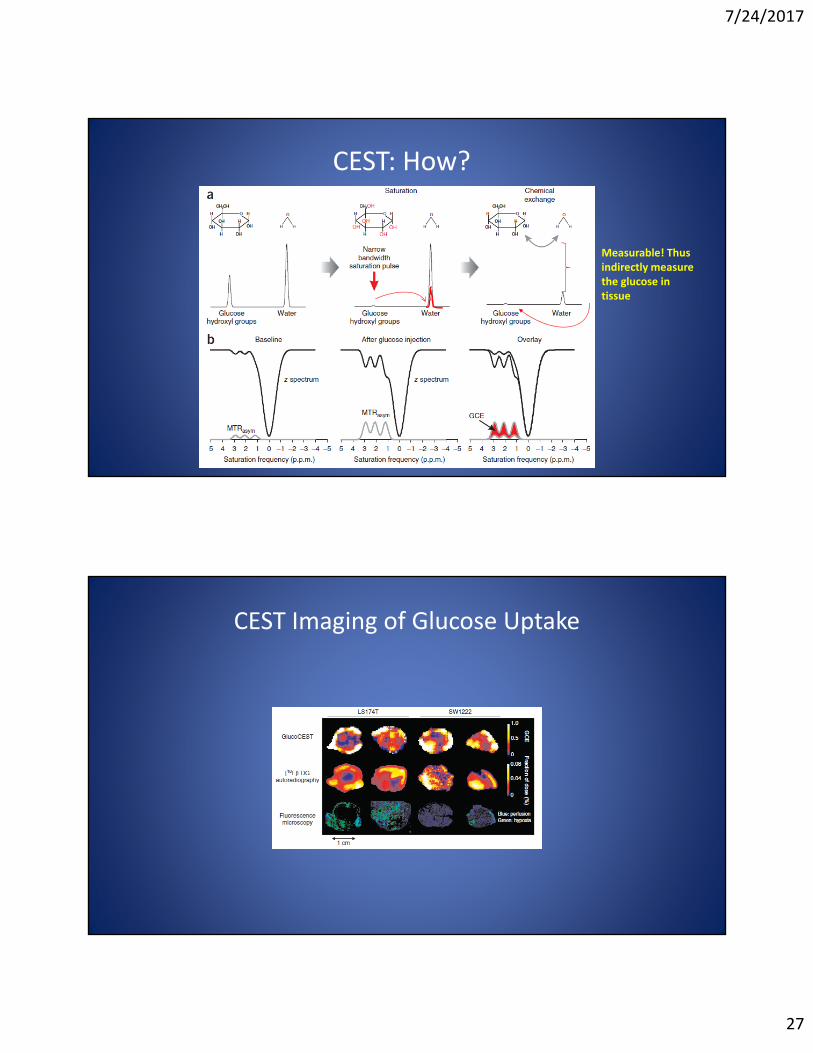
CEST: How?
Measurable! Thus indirectly measure the glucose in tissue
CEST Imaging of Glucose Uptake
7/24/2017
28
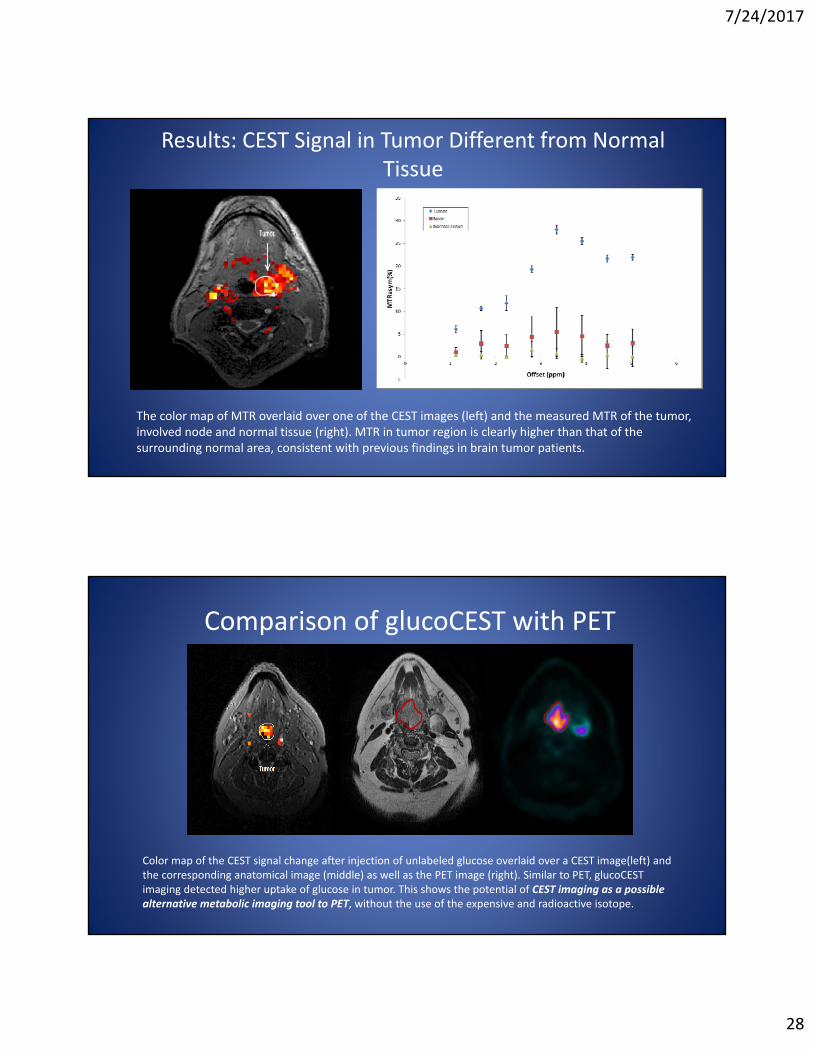
Results: CEST Signal in Tumor Different from Normal Tissue
The color map of MTR overlaid over one of the CEST images (left) and the measured MTR of the tumor, involved node and normal tissue (right). MTR in tumor region is clearly higher than that of the surrounding normal area, consistent with previous findings in brain tumor patients.
Comparison of glucoCEST with PET
Color map of the CEST signal change after injection of unlabeled glucose overlaid over a CEST image(left) and the corresponding anatomical image (middle) as well as the PET image (right). Similar to PET, glucoCESTimaging detected higher uptake of glucose in tumor. This shows the potential of CEST imaging as a possible alternative metabolic imaging tool to PET, without the use of the expensive and radioactive isotope.
CEST MRI Anatomical MRI PET
7/24/2017
29
MRI QA for Clinical Trials
ACR Phantom Imaging
7/24/2017
30
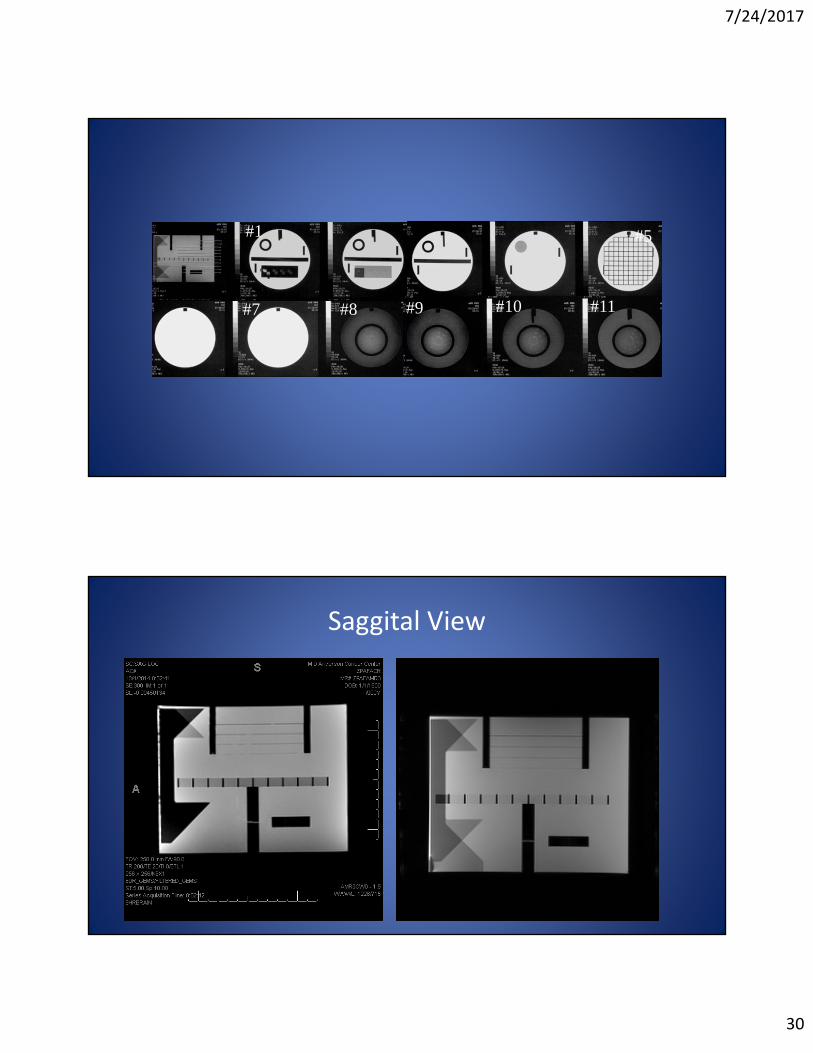
#1 #5
#9 #10 #11#7 #8
Saggital View
7/24/2017
31
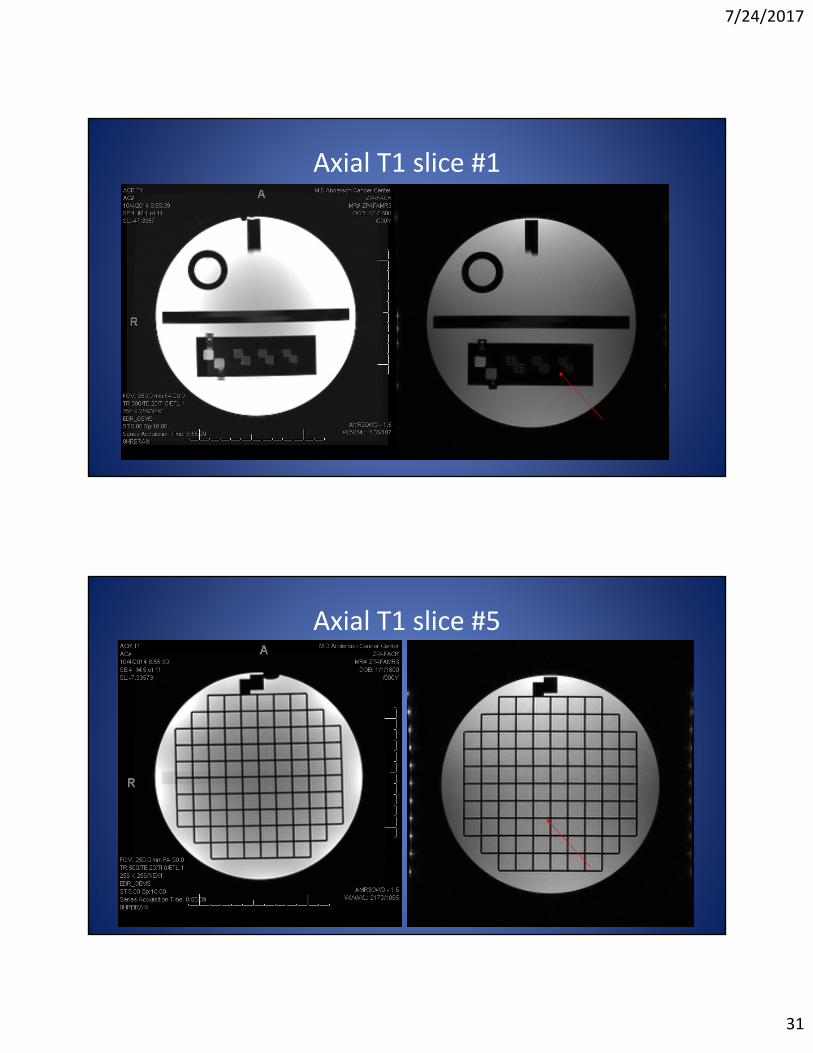
Axial T1 slice #1
Axial T1 slice #5
7/24/2017
32
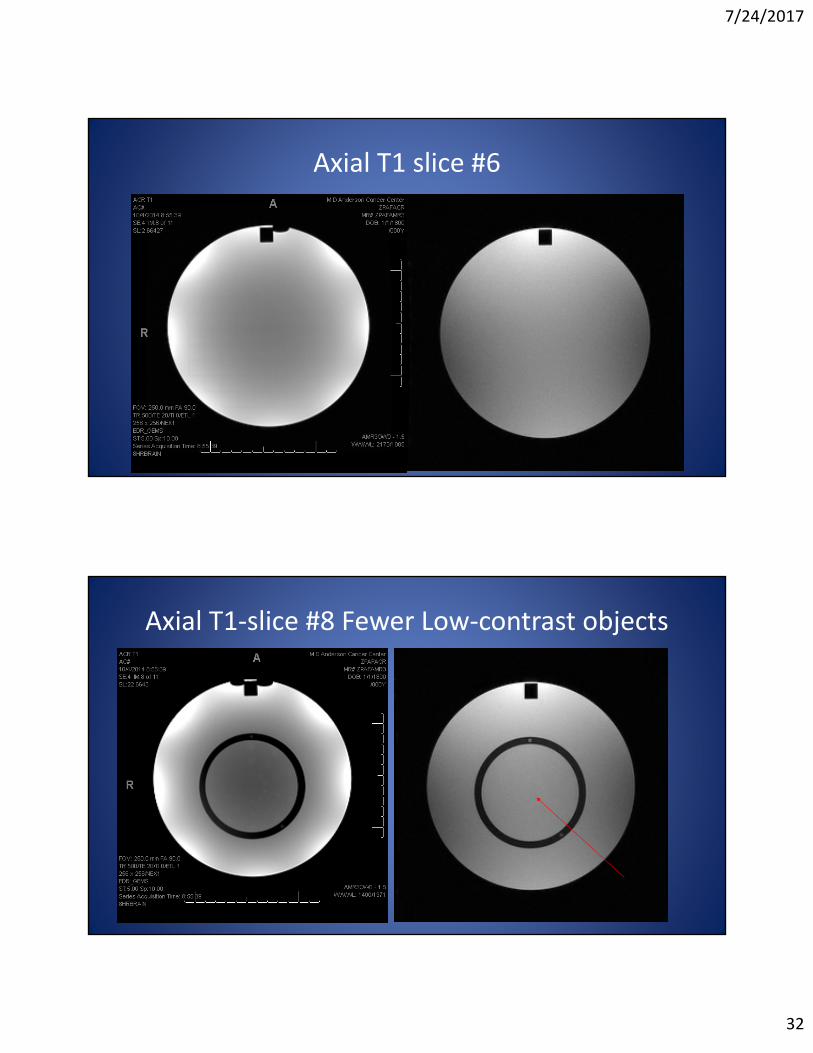
Axial T1 slice #6
Axial T1‐slice #8 Fewer Low‐contrast objects
7/24/2017
33
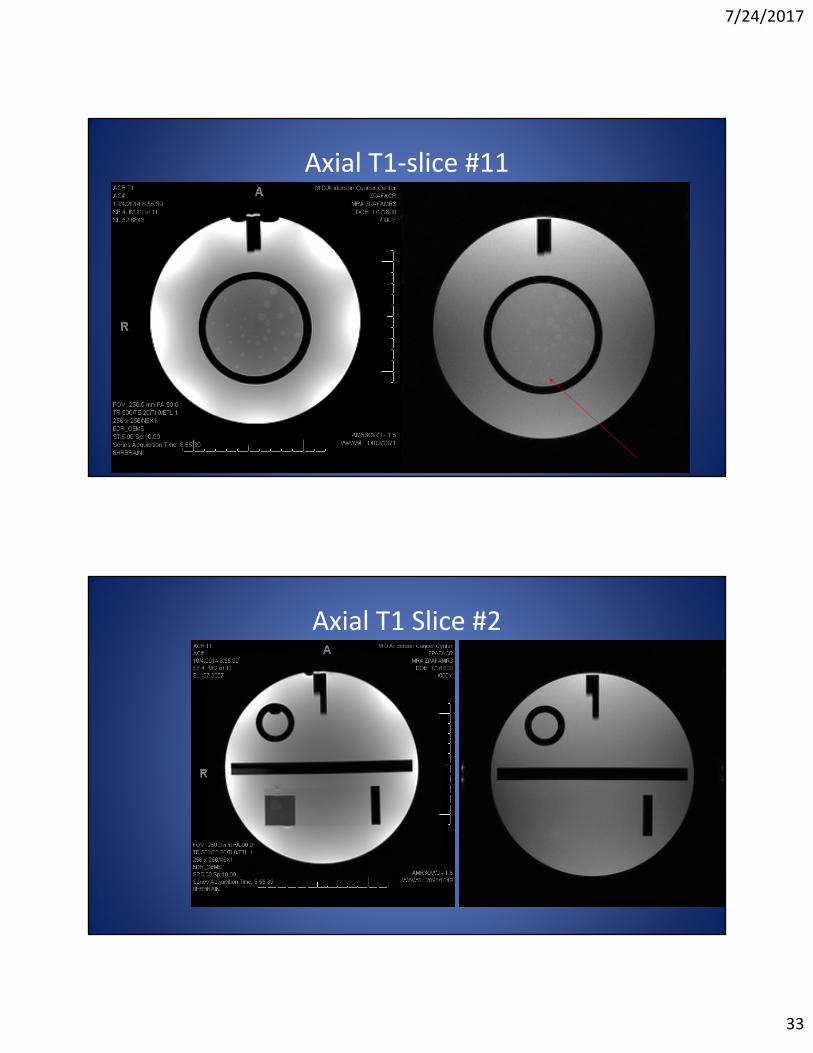
Axial T1‐slice #11
Axial T1 Slice #2
7/24/2017
34
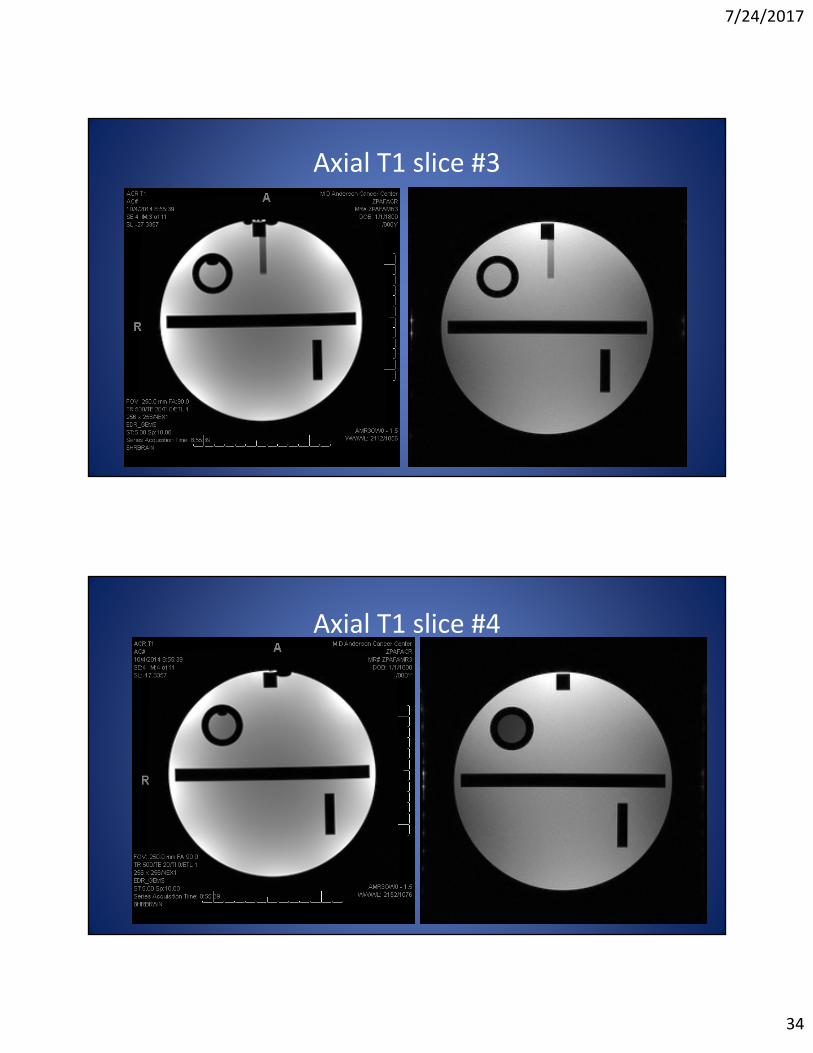
Axial T1 slice #3
Axial T1 slice #4
7/24/2017
35
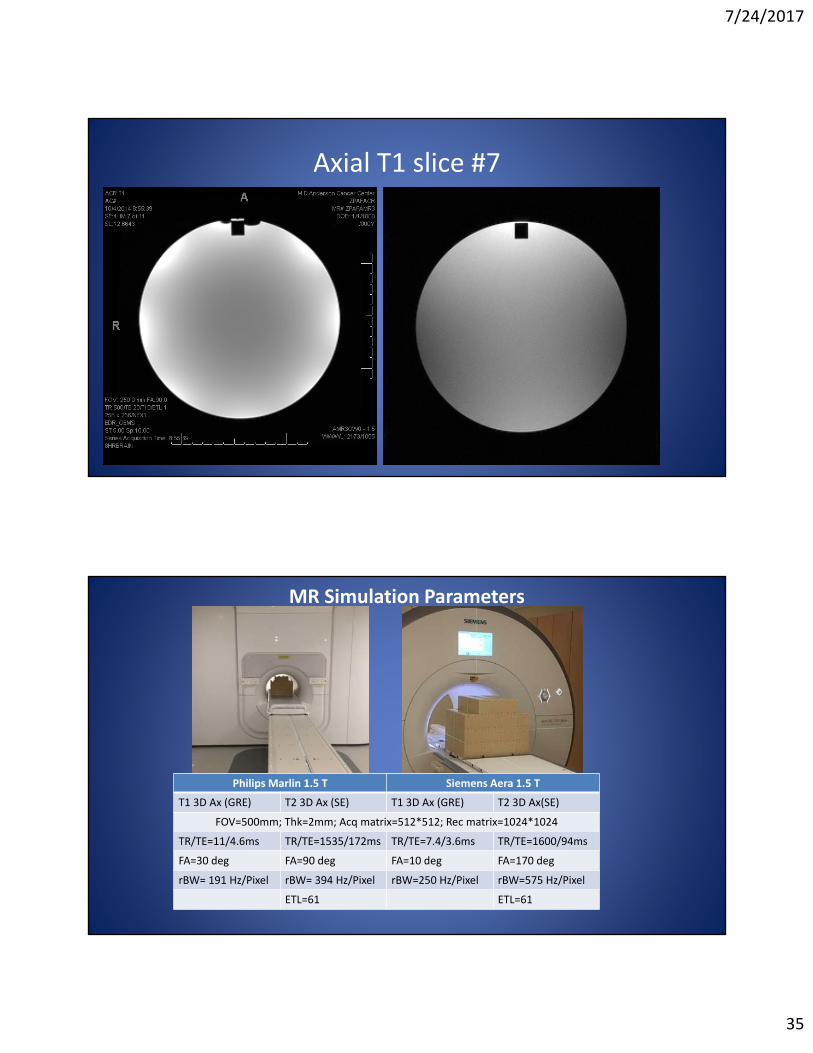
Axial T1 slice #7
MR Simulation Parameters
Philips Marlin 1.5 T Siemens Aera 1.5 T
T1 3D Ax (GRE) T2 3D Ax (SE) T1 3D Ax (GRE) T2 3D Ax(SE)
FOV=500mm; Thk=2mm; Acq matrix=512*512; Rec matrix=1024*1024
TR/TE=11/4.6ms TR/TE=1535/172ms TR/TE=7.4/3.6ms TR/TE=1600/94ms
FA=30 deg FA=90 deg FA=10 deg FA=170 deg
rBW= 191 Hz/Pixel rBW= 394 Hz/Pixel rBW=250 Hz/Pixel rBW=575 Hz/Pixel
ETL=61 ETL=61
7/24/2017
36
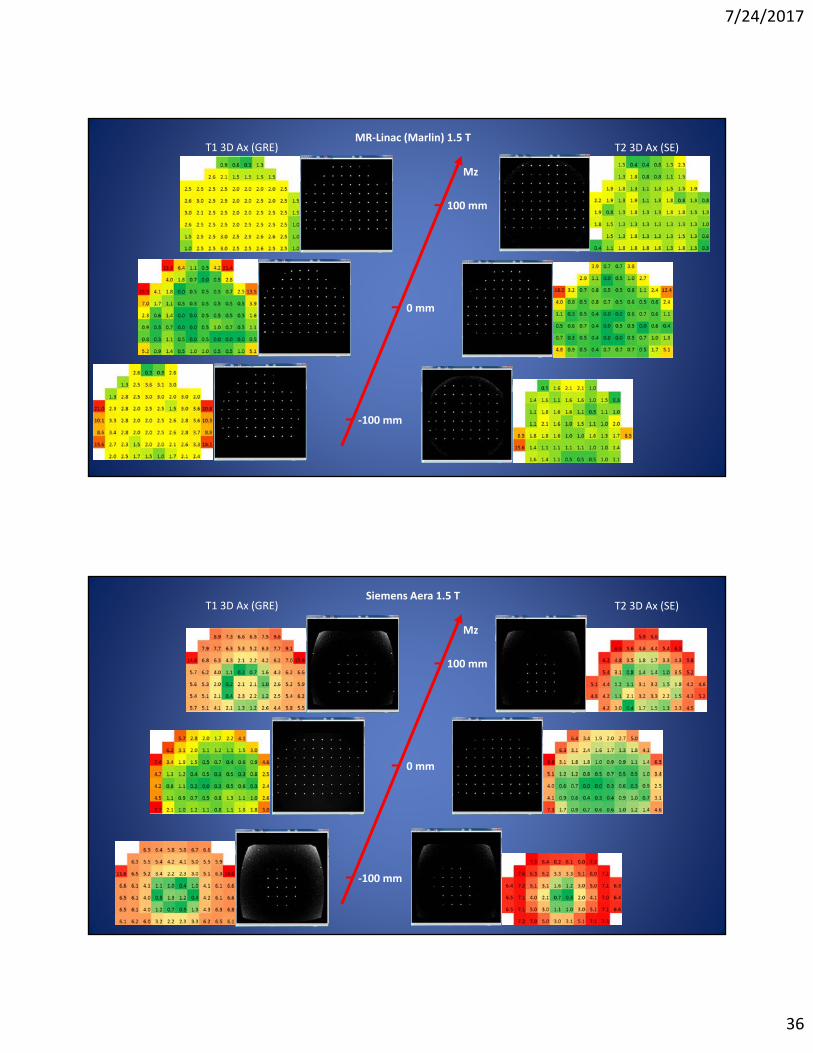
‐100 mm
0 mm
100 mm
Mz
MR‐Linac (Marlin) 1.5 TT1 3D Ax (GRE) T2 3D Ax (SE)
‐100 mm
0 mm
100 mm
Mz
Siemens Aera 1.5 TT1 3D Ax (GRE) T2 3D Ax (SE)
7/24/2017
37
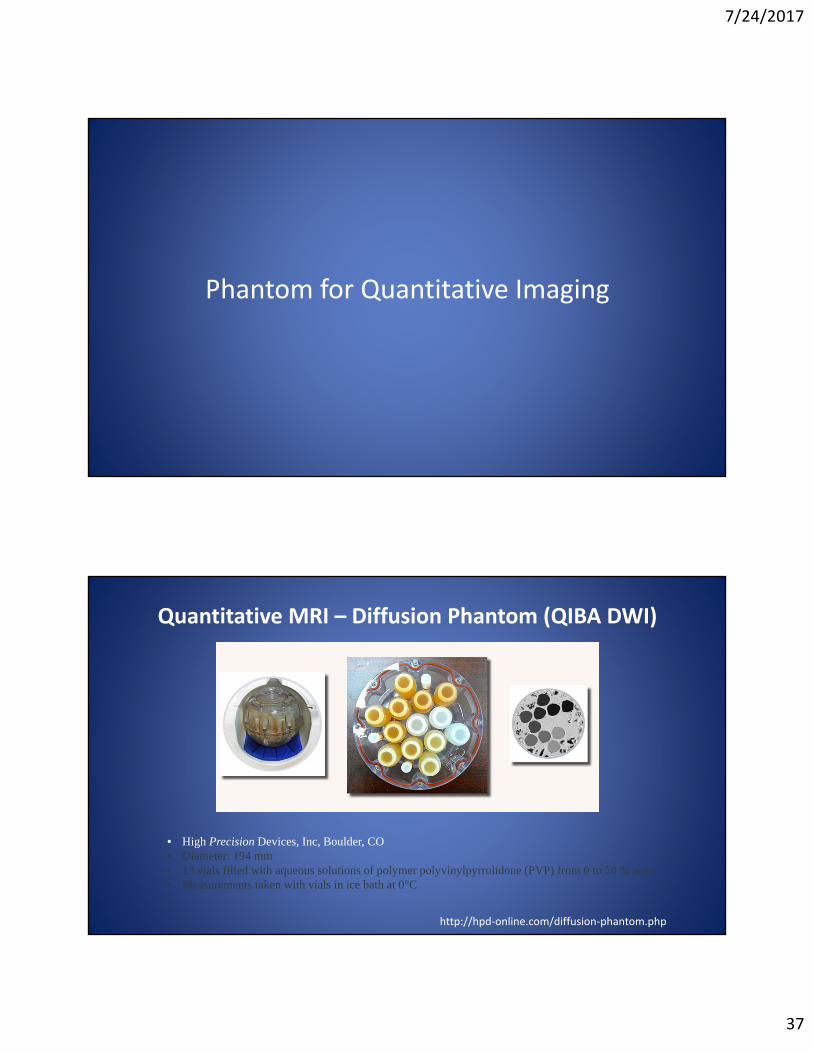
Phantom for Quantitative Imaging
http://hpd‐online.com/diffusion‐phantom.php
Quantitative MRI – Diffusion Phantom (QIBA DWI)
• High Precision Devices, Inc, Boulder, CO• Diameter: 194 mm• 13 vials filled with aqueous solutions of polymer polyvinylpyrrolidone (PVP) from 0 to 50 % w/w• Measurements taken with vials in ice bath at 0°C
7/24/2017
38
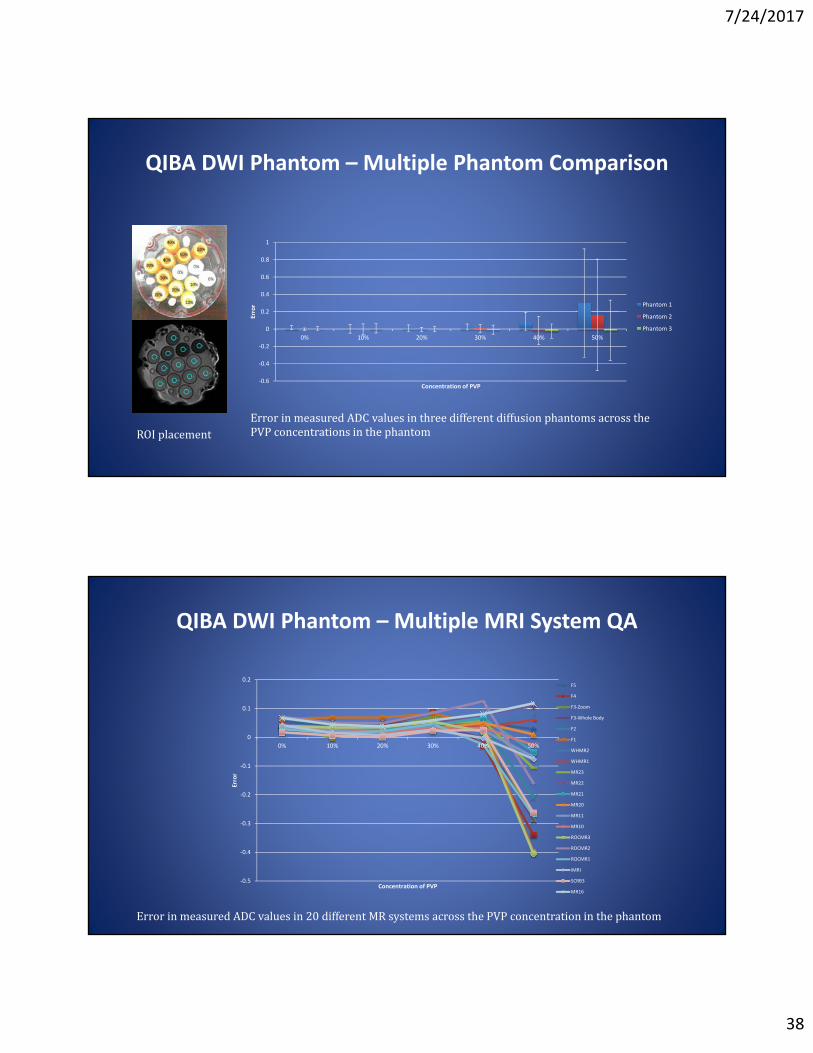
QIBA DWI Phantom – Multiple Phantom Comparison
ROIplacement
‐0.6
‐0.4
‐0.2
0
0.2
0.4
0.6
0.8
1
0% 10% 20% 30% 40% 50%
Error
Concentration of PVP
Phantom 1
Phantom 2
Phantom 3
ErrorinmeasuredADCvaluesinthreedifferentdiffusionphantomsacrossthePVPconcentrationsinthephantom
‐0.5
‐0.4
‐0.3
‐0.2
‐0.1
0
0.1
0.2
0% 10% 20% 30% 40% 50%
Error
Concentration of PVP
F5
F4
F3‐Zoom
F3‐Whole Body
F2
F1
WHMR2
WHMR1
MR23
MR22
MR21
MR20
MR11
MR10
ROCMR3
ROCMR2
ROCMR1
iMRI
SCRB3
MR16
ErrorinmeasuredADCvaluesin20differentMRsystemsacrossthePVPconcentrationinthephantom
QIBA DWI Phantom – Multiple MRI System QA
7/24/2017
39
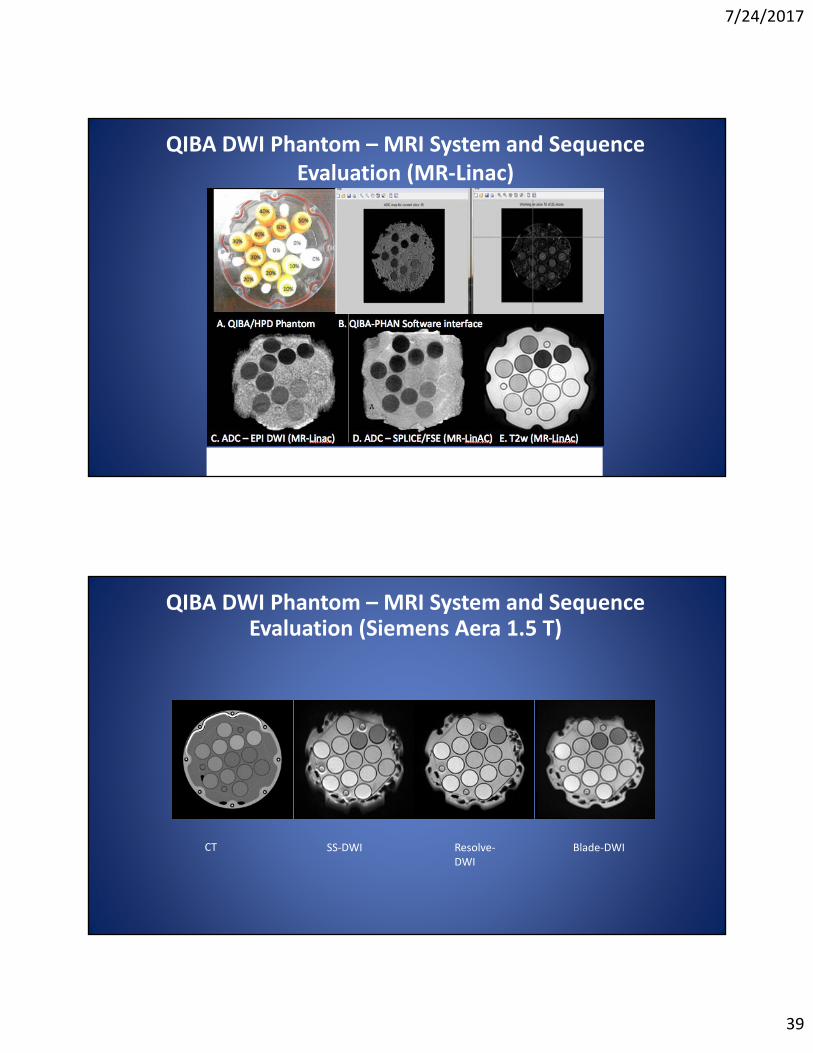
Figure 6: RSNA QIBA DWI phantom (HPD, Inc.), A, cross sectional view showing PVP vials; B, screenshot of QIBA PHAN software (courtesy M Boss and T Chenevert); C: ADC values (b=800s/mm2) acquired on MR-LinAc using EPI (C) and SPLICE/FSE (D) [note decreased distortion with FSE], compared to reference T2-weighted image (E).
QIBA DWI Phantom – MRI System and Sequence Evaluation (MR‐Linac)
CT SS‐DWI Resolve‐DWI
Blade‐DWI
QIBA DWI Phantom – MRI System and Sequence Evaluation (Siemens Aera 1.5 T)
7/24/2017
40
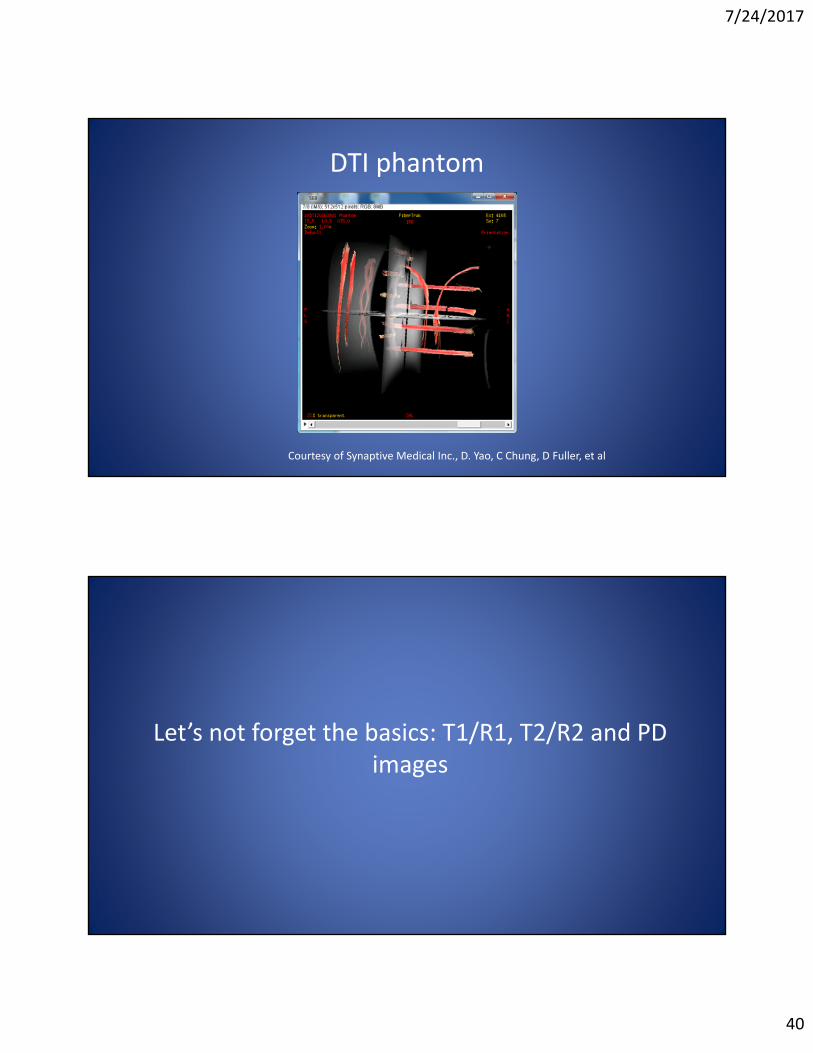
DTI phantom
Courtesy of Synaptive Medical Inc., D. Yao, C Chung, D Fuller, et al
Let’s not forget the basics: T1/R1, T2/R2 and PD images
7/24/2017
41
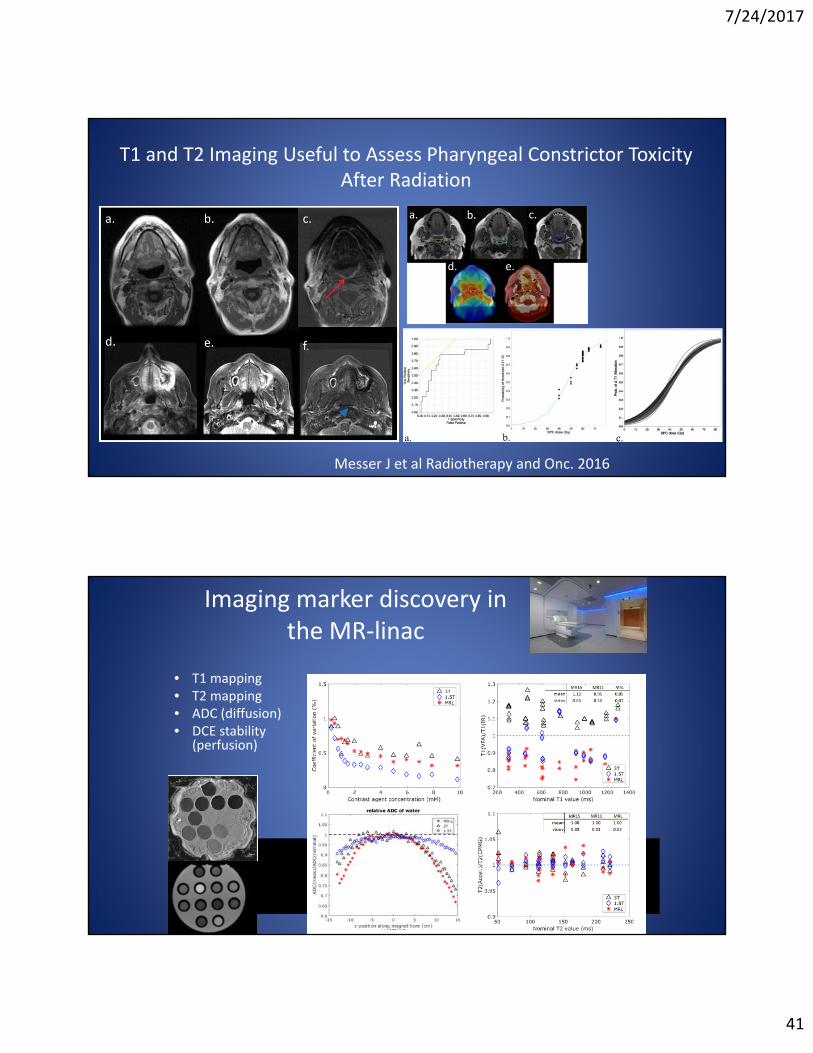
T1 and T2 Imaging Useful to Assess Pharyngeal Constrictor Toxicity After Radiation
Messer J et al Radiotherapy and Onc. 2016
Imaging marker discovery in the MR‐linac
• T1 mapping• T2 mapping• ADC (diffusion)• DCE stability
(perfusion)
T1 map
T2
T1
ADC
DCE stability
7/24/2017
42
Summary
• Physicists’ role in clinical trials are critical
• MRI in clinical trial should be carefully considered prospectively and holistically as a system, not as a single or multiple isolated components
• Do know forget patient positioning!!!