Embed Size (px)
Citation preview
Appendix H AEG Special Event Center Market Impacts
MR+E
3308 Helms Culver City CA 90232 www.mrpluse.com
AEG Special Event Center
Market Impacts
Prepared for AEG Prepared by MR+E 3/30/12
MR+E
AEG Special Events Center Market Impacts I-1
Section I Introduction
Introduction
The Convention and Event Center Project (the “Project”) consists of the following three components: (1) demolition
of the current West Hall of the Los Angeles Convention Center (the “Convention Center”) to be replaced by the
construction of a comparable sized New Hall (the “New Hall”) that will be contiguous to the existing South Hall of the
Convention Center and improve the functionality of the Convention Center, (2) the construction of a new multi-use
entertainment and sports facility on the site of the West Hall (the “Event Center”), and (3) related parking and support
facilities. The Project is located within an approximately 68-acre site that includes all of the existing Convention
Center property, including the Bond Street Parking Lot and the Cherry Street Parking Garage, STAPLES Center, as
well as the air space over Pico Boulevard and LA Live Way (the “Project Site”). The Project Site is generally
bounded by the following major roadways: the I-110 Harbor Freeway to the west; Chick Hearn Court to the north;
Figueroa Street to the east; and Venice Boulevard to the south.
With the implementation of the Project, the Project Site would function as a unified center for convention, sports and
entertainment uses. The Project is proposed to be implemented through adoption of a new Specific Plan and
Community Plan Amendment and related approvals. Although the Specific Plan encompasses the entire Project
Site, its primary focus would be on the regulation of the proposed buildings and related features, including signage,
as well as the regulation of transportation and parking. In addition, notable elements of environmental sustainability
would be comprehensively integrated into the Project and would be one of the key elements that would guide the
design of the Project. In addition to the above improvements, the Project includes approximately 47,000 square feet
of renovations to the existing Concourse Hall and South Hall Food Court. Other changes to the Convention Center’s
existing South Hall would be limited to its interface with the proposed New Hall. Existing parking under the South
Hall and in the Convention Center’s Venice Garage would not be affected by the Project.
This study is focused on the market impacts of the project on both the broader Los Angeles economy as well as on
conditions in Pico Union itself. One of the primary benefits of the project will be its capacity to generate significant
fiscal and economic impacts in Los Angeles. In order to illustrate the capacity of the project to support economic
development and employment a fiscal and economic impact analyses are presented.
Fiscal impacts-- fiscal impacts are the tax revenue implications associated with the project’s operations. This includes an analysis of both the direct on and off-site expenditures and tax events generated by activities associated with the project.
MR+E
AEG Special Events Center Market Impacts I-2
Economic impacts-- economic impacts are the contributions the project will provide to the regional economy of Los Angeles in terms of jobs, economic output and earnings paid to local households.
Because of its proximity to the Project, stakeholders in Pico Union have expressed particular concerns about the
potential effects that the Project might have on the economy of the community. Pico Union is primarily a residential
community with local serving retail uses along its principal corridors. This character is distinct from the commercial
and industrial land uses that are predominant in the nearby South Park district Residential development in the South
Park area has been largely developed in recent years in contrast to Pico Union which is the site of an inventory of
historic structures. During community consultations by the Project applicant, questions regarding the potential
effects on the land-use economics were raised. Specifically the areas of concern were as follows :
Housing prices-- through the community consultation process, stakeholders have communicated a concern that the Project will lead to a significant escalation of housing costs in Pico Union. While the community has not identified the increase in real estate values in and of itself as a concern, some segments of the community have expressed concern that should prices begin to escalate rapidly as a result of the Project there would be a displacement of the community's existing population and a reduction in the stock of affordable housing. Retail mix-- at present the Pico Union area has a mix of community-oriented retail establishments that are primarily focused towards meeting the needs of the immediate neighbors. Concern has been expressed by some that the Event Center, along with its entertainment and sports-oriented tenants, would lead to the proliferation of sports themed retail outlets in the community. If this transformation were to occur, some in the community have expressed concern that it would force out existing retail establishments and lead to an imbalanced retail mix in the community.
Urban decay-- In addition to these considerations the California Environmental Quality Act (CEQA) guidelines require that indirect physical changes not immediately related to the project that are caused indirectly by the project must be disclosed. In the context of CEQA, urban decay is considered an indirect physical impact. The focus of this analysis is to determine if the development of new public event hosting capacities in the market has the potential to result in the closure of or, dis-investment in, competing facilities which may, in turn, result in conditions that lead to urban decay.
To address these questions, this analysis considers the experience of other communities that have seen the
introduction of a new NFL facility to provide examples of the likely future effect in the Pico Union community of the
City of Los Angeles. Key findings of the analysis are summarized in the executive summary that follows.

MR+E
AEG Special Events Center Market Impacts II-1
Section II Executive Summary
Conditions in Pico Union
Pico Union is an older historic part of the urban fabric of central Los Angeles. Adjacent to downtown, Pico Union is
heavily urbanized. The community is bounded by two freeways and a major surface arterial. In general, the housing
stock in the community is made up of older multifamily units with relatively high rates of renter occupied dwelling
units. Consistent with these physical parameters, the community is also home to a large number of low and very low
income households, and a population base that is considerably younger than the County average. Pico Union is also
characterized by the presence of retail along its main corridors.
Staples Center and LA Live
Since the opening of STAPLES Center in 1999 there has been little evidence of widespread gentrification in the
residential or commercial areas west of the 110 freeway. Housing prices in Pico Union have generally co varied with
Los Angeles County prices from 1999 to the present and in general the presence of STAPLES Center has not led to
a transformation in the available housing stock in the community. In particular, during the period from 1996 through
2002, a period which covers three years prior to the opening of STAPLES Center and three years after its opening,
median sales prices in the Pico Union community zip codes trended upward at approximately the same rate as the
State and County as a whole.
As a result of initiatives arising from the STAPLES Center and Los Angeles Sports and Entertainment District
Specific Plan, a number of stabilizing community benefits programs and projects have been implemented. Through
the STAPLES Center Foundation, the arena along with the associated developments at LA Live have made
contributions to a wide variety of community and educational organizations that have brought real and tangible
benefits to Pico Union. In addition to its philanthropic role in the community STAPLES Center and LA Live have
served as a significant source of employment for community residents. The successfully implemented community
benefits program associated with AEG’s developments have been seen as a model for successful community
engagement in Los Angeles and these programs are often used as a standard or benchmark for major development
projects city wide. This commitment to creating community benefits will carry forward with the proposed project as
well.
MR+E
AEG Special Events Center Market Impacts II-2
Fiscal Impacts
On an ongoing annual operating basis, the Project can be anticipated to contribute over $74.1 million in both on and
off-site impacts to all of the relevant jurisdictions with authority over the project. The total amount is comprised of
$22.8 million of on-site impacts and $51.3 million of off-site impacts.
The largest recipient of on-site impacts is the City of Los Angeles with an estimated $10.6 million in revenue
generated by activities that occur directly at the Project. These revenues are made up of a mix of property, sales and
business activity taxes that are detailed in the supporting tables. The City of Los Angeles’ primary source of off-site
impacts comes from hotel transient occupancy tax that is forecast to occur based on events at the Project. The City
of Los Angeles is forecast to be the largest recipient of revenue from the project’s total on and off site operations,
which are forecast to contribute over $27.3 million per year on an annual recurring basis to the City’s general fund.
Economic Impacts
Construction
During the construction period, the project is forecast to directly support 10,785 full time equivalent (FTE) positions
with earnings of over $490 million. This activity can be expected to stimulate additional $597 million in output
supporting over 3,800 FTE positions with earnings of over $110 million throughout the economy of Los Angeles. In
total construction of the project itself can be anticipated to generate over $1.7 billion in output for the local economy
supporting 10,785 full-time equivalent positions with earnings of over $490 million.
In addition to the direct on-site construction impacts, the project will also stimulate additional development that will
contribute to economic output locally. In total the direct on and off-site economic impact associated with construction
of the project is expected to generate over $3.3 billion in output supporting 19,359 FTE positions with earnings of
over $960 million over the construction period.
Operations
The combined operational impact of the project, including the impacts of spectator and public events along with
operations of parking facilities is anticipated to generate expenditures of over $121 million per year on site. This
direct on-site expenditure is anticipated to support 1,897 FTE positions with earnings of over $62 million. This initial
spending can be expected to support an additional $61.5 million in output generating just under 1,650 FTE jobs with
earnings of $15.3 million throughout the local economy. In total annual operations of the project itself can be forecast
to generate over $183 million in output throughout the Los Angeles economy supporting 3,546 FTE positions with
earnings of over $77 million per year.
MR+E
AEG Special Events Center Market Impacts II-3
Taking the direct off-site operations into account, including increased retail sales and hotel occupancy, the project
can be expected to generate over $485.9 million in annual expenditures. This activity would be able to support
nearly 5,080 jobs with earnings of over $128 million per year. This activity can be forecast to support an additional
$177.8 million and output generating 2,290 FTE jobs with earnings of over $35 million.
The combined effects of the direct expenditures and their secondary effects are estimated to generate over $603
million in output for the Los Angeles economy on an annual recurring basis. These expenditures are forecast to
support approximately 7,370 FTE positions with earnings of over $163.3 million.
Stadiums and Housing Values
An analysis of seven comparable markets did not provide consistent evidence of a sustained increase in housing
costs in communities adjacent to new NFL stadiums, either in terms of absolute increases in costs or relative position
compared to state and metro area markets. The case studies overall are decidedly mixed in their outcome in terms of
effects on housing costs. The stadium adjacent communities on average experienced a 5% increase in community
housing values compared to housing values in their greater metro area, but given this sample size and the diversity
of factors effecting housing costs, this is not conclusive. Based on the foregoing and as detailed further below, there
is therefore insufficient evidence to support the conclusion that the development of the Project in the neighborhood
adjacent to Pico Union would bring about large-scale increases in housing costs that would have the effect of
undermining housing affordability in the community. The operation of STAPLES Center since its opening in 1999
further suggests that the presence of event space and public assembly facilities does not in and of itself lead to
gentrification, although these facilities nevertheless have provided substantial economic and other community
benefits to the Pico Union community. Pico Union has not been the site of large scale conversions of rental space or
development of gentrifying residential projects after the introduction of STAPLES Center, a facility with over 200
event days a year.
Stadiums and Retail Mix
The analysis of comparable communities suggests that there is likely to be an incremental increase in demand for
sporting goods and related memorabilia within one mile of the Project. Currently, sporting goods outlets represent
5.3% of the total retail mix within Pico Union. This level representation can be anticipated to increase by
approximately 0.6% to 1.7%, to between nearly 6% and 7% once the Event Center is operational. Based on average
MR+E
AEG Special Events Center Market Impacts II-4
performance in the comparable communities Pico Union can be anticipated to support between 20 and 24 sporting
goods stores tied to activities at the Project. This represents a net increase of between two and six new retail outlets.
It is likely that the 18 existing sporting good outlets that are presently located within Pico Union will reorient more of
their offerings to meet the demand of patrons drawn to the area by the presence of spectator events at the Project.
While these new businesses represent an opportunity for economic development and expanded market opportunities
for existing businesses within Pico Union, this is not a level of change that can be anticipated to alter significantly the
community-serving nature of retail outlets in Pico Union as a whole. As with housing prices, the experience of
STAPLES Center is indicative of the influence that a sports venue can have on the local retail market. Over the 12
years of the arena’s operation, the retail mix in Pico Union has not been dramatically altered to meet the demands of
STAPLES Center patrons. According to the 2000 economic census, which would represent conditions one year after
the opening of STAPLES Center, in the two zip codes that overlap with Pico Union (90005 and 90015) sporting
goods stores accounted for 2.91% of the total retail mix. This represents a net increase of 2.39% in the share of retail
establishments between the opening of STAPLES Center and the present. The presence of STAPLES Center has
not significantly reoriented the retail mix in Pico Union over 12 years of operation. Based on the experience of the
community with STAPLES Center it is unlikely that the Project will cause the community orientation of the retail mix in
Pico Union to be changed in a significant manner.
Urban Decay
The scale of the Proposed Project would place the Event Center in the market for events generally ranging from
25,000 to 72,000 spectators. Use by an NFL team is severally constrained at both the Los Angeles Memorial
Coliseum and the Rose Bowl due to existing lease agreements and operations policies. Although it is possible that
an NFL football franchise could occupy either stadium as an interim use, current lease agreements at the Coliseum
and polices of the City of Pasadena would impede their use as a permanent home stadium for an NFL team. In the
case of the Rose Bowl, the City of Pasadena limits the number of events with attendance over 20,000 to 12 per year
The Los Angeles Memorial Coliseum receives its largest utilization from USC football games, and its lease with the
university effectively reserves USC as the only football user of the stadium. Other events that have used the
Coliseum stadium include uses that are tied to Exposition Park, such as hosting the charitable Revlon Run, an
annual Fourth of July picnic and fireworks display, or public events such as mass citizenship ceremonies .
The Proposed Project does not anticipate relocation of a master tenant from either facility, nor does it require the
reallocation of football events. Development of the Proposed Project is unlikely to dramatically alter the competitive
balance in the market. In terms of spectator events, the only foreseeable areas of direct competition between the
Proposed Project and existing facilities in the market are confined to international soccer events and, to a lesser
MR+E
AEG Special Events Center Market Impacts II-5
degree, concerts and high school football. It is primarily in these categories that existing events already occurring at
Los Angeles area facilities could be anticipated to relocate to the Project Site. However, as a whole, the potential
loss of this activity would not be in itself enough to lead to significant capital disinvestment.
MR+E
AEG Special Events Center Market Impacts III-1
Section III Conditions in Pico Union
Introduction
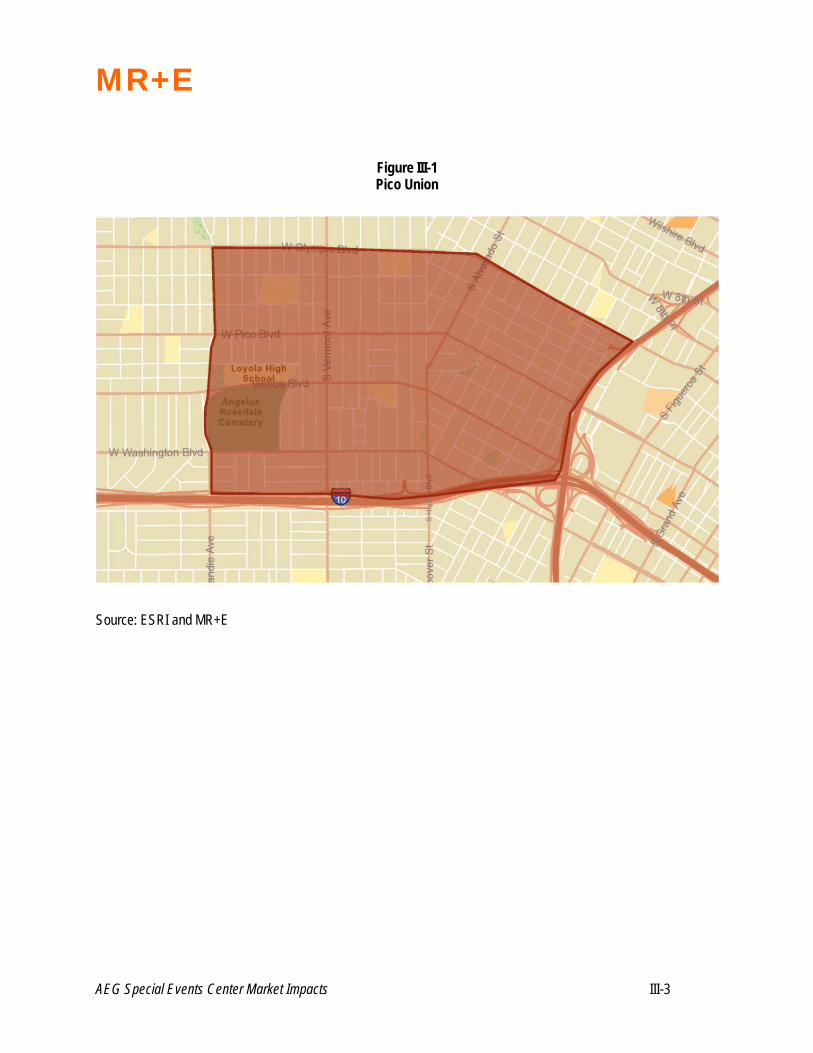
Pico Union is the nearest residential area to the proposed Project site. Pico Union is primarily made up of older
residential units and contains two districts included in the National Register of Historic Places. Commercial
development is concentrated along its arterial corridors. The subject area is bounded by Olympic Boulevard to the
north, Normandie Ave. on the west, Washington Blvd. and the Santa Monica Freeway on the south and the 110
freeway to the east. Figure III-1 illustrates the boundaries of the district that have been used as the basis for this
analysis.
Pico Union is an older historic part of the urban fabric of Central Los Angeles. Adjacent to downtown, Pico Union is
heavily urbanized. In general, the housing stock in Pico Union is older multifamily in nature with relatively high rates
of renter occupied dwelling units. Consistent with these physical parameters, Pico Union also includes a relatively
large number of low and very low income households, and a population base considerably younger than the County
average.
The population living in Pico Union is largely employed in the service industries, as well as construction. These are
two sectors that have been heavily impacted by the national, state and local economic downturn. In terms of
occupation, the employed population is deployed across a wide array of activities but has a strong concentration in
production and related occupations.
In terms of the mix of businesses located in Pico Union, community serving uses such as retail food and beverage
sales, and eating and drinking places tend to predominate. This is consistent with its character as a residential urban
community.
The data provided in this section provides background and context for analysis of the Project’s potential impacts.
The existing business mix is relevant to understand what the potential impact of activities related to the Project might
be on the retail landscape of the community and the cost of housing.
Demographic conditions
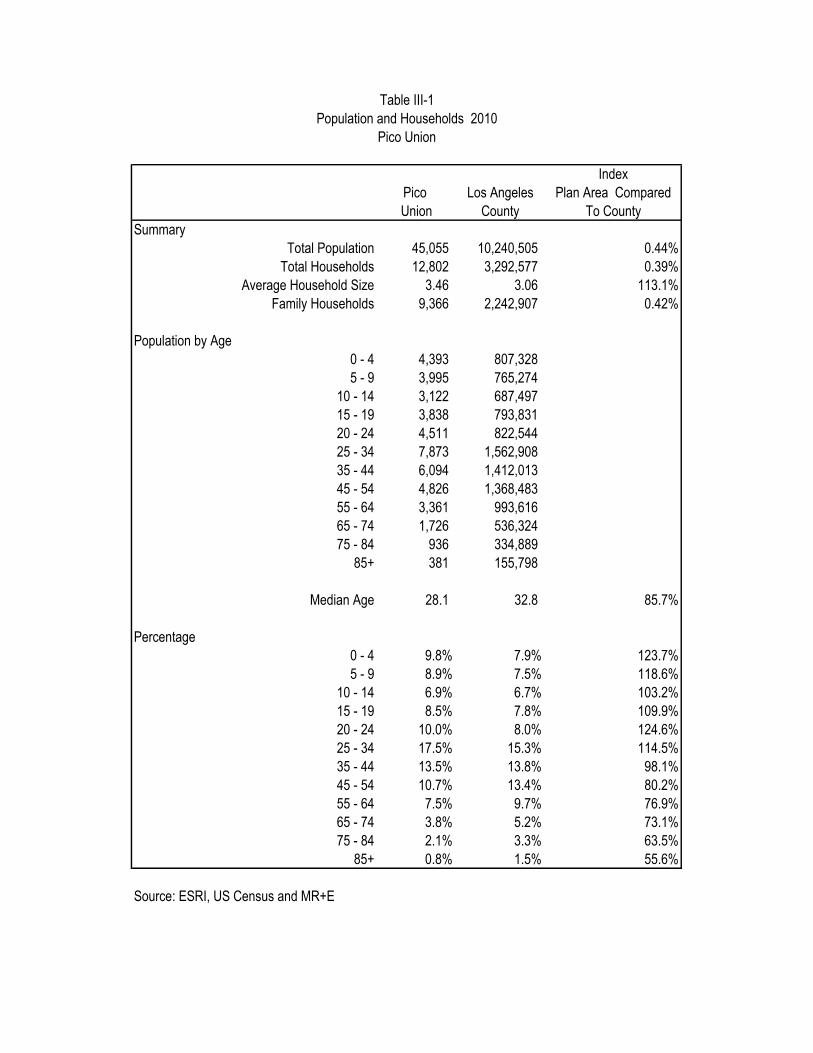
The Pico Union area has a population of approximately 45,000 people living in just under 13,000 households. This
represents 0.44% of the total population of Los Angeles County. The median age in the area is 28.1 years of age.
This is significantly younger than the countywide median age of 32.8. Table III-1 shows the distribution of population
MR+E
AEG Special Events Center Market Impacts III-2
in the community by age, compared to the County as a whole to produce an index. When this index is greater than
100% it implies an overrepresentation of the characteristic or variable examined. An index value of less than 100%
shows an underrepresentation of the characteristic within the community when compared to the County as a whole.
This index based comparison is used in each of the tables that follow.
Table III-2 provides data on race and ethnicity within Pico Union. The population of the community is heavily
Hispanic, which accounts for 87.7% of the total population of the community. This is nearly double the representation
of the Hispanic population in the County of Los Angeles as a whole. In terms of racial characteristics, the other race
and multiracial categories are strongly represented within the community.
MR+E
AEG Special Events Center Market Impacts III-3
Figure III-1 Pico Union
Source: ESRI and MR+E
Index
Pico Los Angeles Plan Area Compared
Union County To County
Summary
Total Population 45,055 10,240,505 0.44%
Total Households 12,802 3,292,577 0.39%
Average Household Size 3.46 3.06 113.1%
Family Households 9,366 2,242,907 0.42%
Population by Age
0 - 4 4,393 807,328
5 - 9 3,995 765,274
10 - 14 3,122 687,497
15 - 19 3,838 793,831
20 - 24 4,511 822,544
25 - 34 7,873 1,562,908
35 - 44 6,094 1,412,013
45 - 54 4,826 1,368,483
55 - 64 3,361 993,616
65 - 74 1,726 536,324
75 - 84 936 334,889
85+ 381 155,798
Median Age 28.1 32.8 85.7%
Percentage
0 - 4 9.8% 7.9% 123.7%
5 - 9 8.9% 7.5% 118.6%
10 - 14 6.9% 6.7% 103.2%
15 - 19 8.5% 7.8% 109.9%
20 - 24 10.0% 8.0% 124.6%
25 - 34 17.5% 15.3% 114.5%
35 - 44 13.5% 13.8% 98.1%
45 - 54 10.7% 13.4% 80.2%
55 - 64 7.5% 9.7% 76.9%
65 - 74 3.8% 5.2% 73.1%
75 - 84 2.1% 3.3% 63.5%
85+ 0.8% 1.5% 55.6%
Source: ESRI, US Census and MR+E
Table III-1
Population and Households 2010
Pico Union

Index
Pico Los Angeles Plan Area Compared
Union County To County
Summary
Total Population 45,055 10,240,505 0.4%
Total Households 12,802 3,292,577 0.4%
Average Household Size 3.46 3.06 113.1%
Family Households 9,366 2,242,907 0.4%
Race and Ethnicity
White 12,183 4,730,690
African American 1,122 884,127
American Indian 471 75,707
Asian 3,427 1,363,720
Pacific Islander 34 28,162
Other Race 25,048 2,619,462
Two or More Races 2,770 538,637
Total 45,055 10,240,505
Total Hispanic Population 39,529 4,966,207
Percentage
White 27.0% 46.2% 58.5%
African American 2.5% 8.6% 28.8%
American Indian 1.0% 0.7% 141.4%
Asian 7.6% 13.3% 57.1%
Pacific Islander 0.1% 0.3% 27.4%
Other Race 55.6% 25.6% 217.3%
Two or More Races 6.1% 5.3% 116.9%
Total 100.0% 100.0%
Total Hispanic Population 87.7% 48.5% 180.9%
Source: ESRI, US Census and MR+E
Table III-2
Race and Ethnicity 2010
Pico Union

MR+E
AEG Special Events Center Market Impacts III-6
Income and employment
Information on household income within Pico Union and compared Los Angeles County is shown in Table III-3.
Median household income in 2010 was reported at slightly over $23,000. This represents just over 40% of the
countywide median household income of just over $54,000. Pico Union is home to a large concentration of low and
very low income households, with over 30% of all community households reporting an annual income of less than
$15,000. These low income households occur at over twice the rate as Los Angeles County as a whole. An
additional 20% of the community's population reports household incomes less than $25,000, which is a rate that also
occurs at over twice the County average.
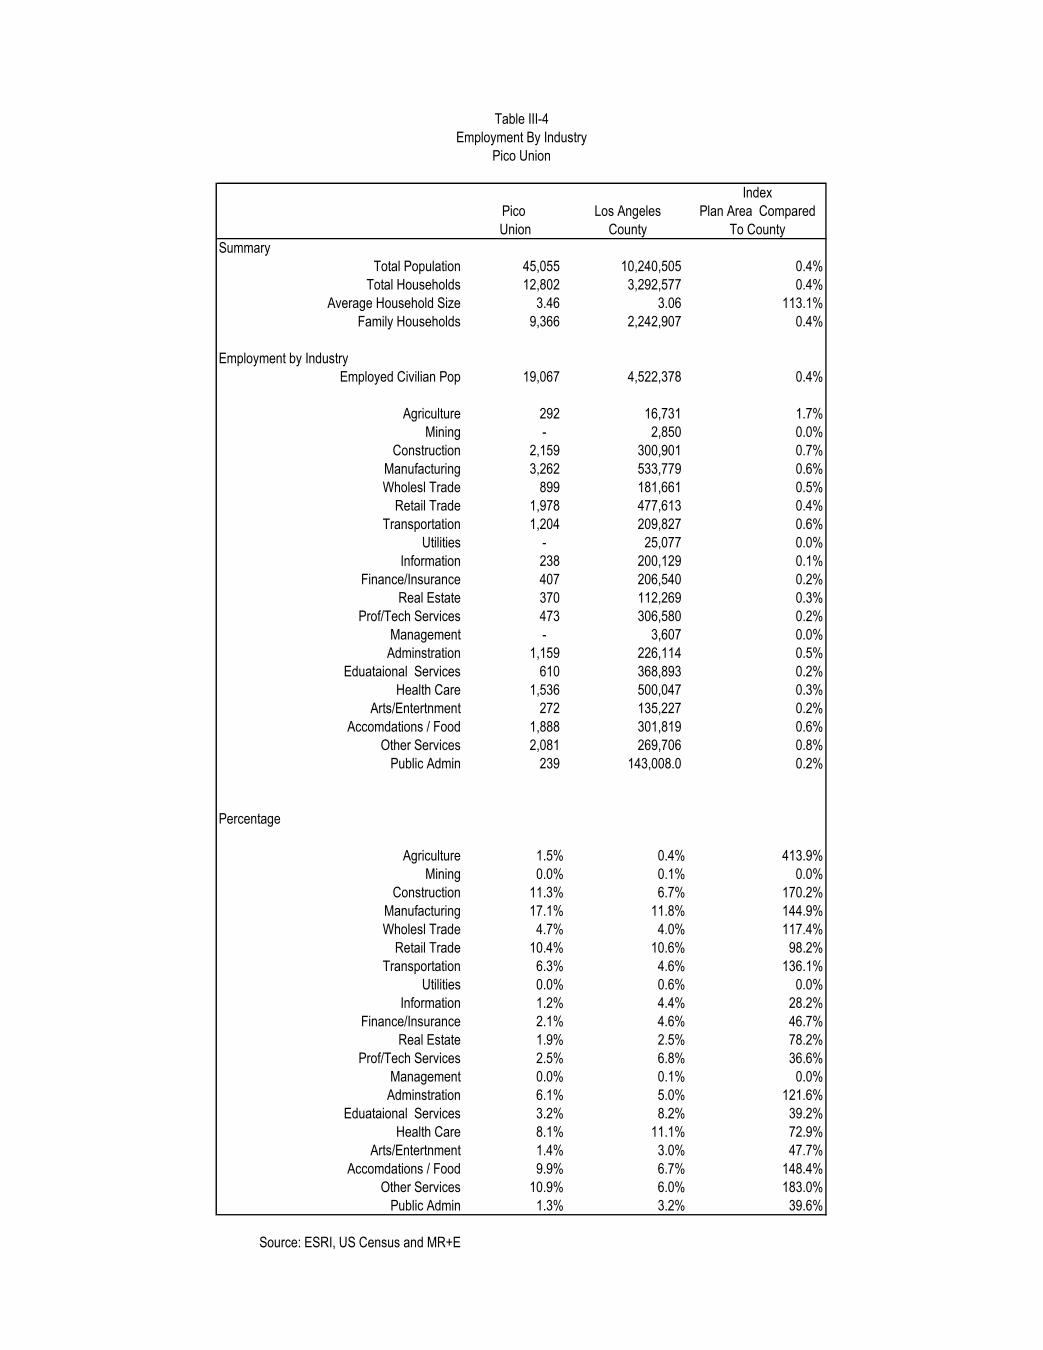
Table III-4 provides information on the employed population of Pico Union. At present, the area reports an employed
civilian population of just over 19,000 people. In terms of industry of employment, manufacturing, construction and
miscellaneous services are the leading sectors of employment of community residents. This means that the
population of the community is exposed as changes in these sectors occur. In terms of representation of the labor
force when compared to the County as a whole, there is a strong representation of employment in services,
construction, food-service, accommodations, and manufacturing. In the current economic downturn, the construction
industry has been particularly severely impacted. This is likely to have a long-term effect on the structure of
employment within the community.
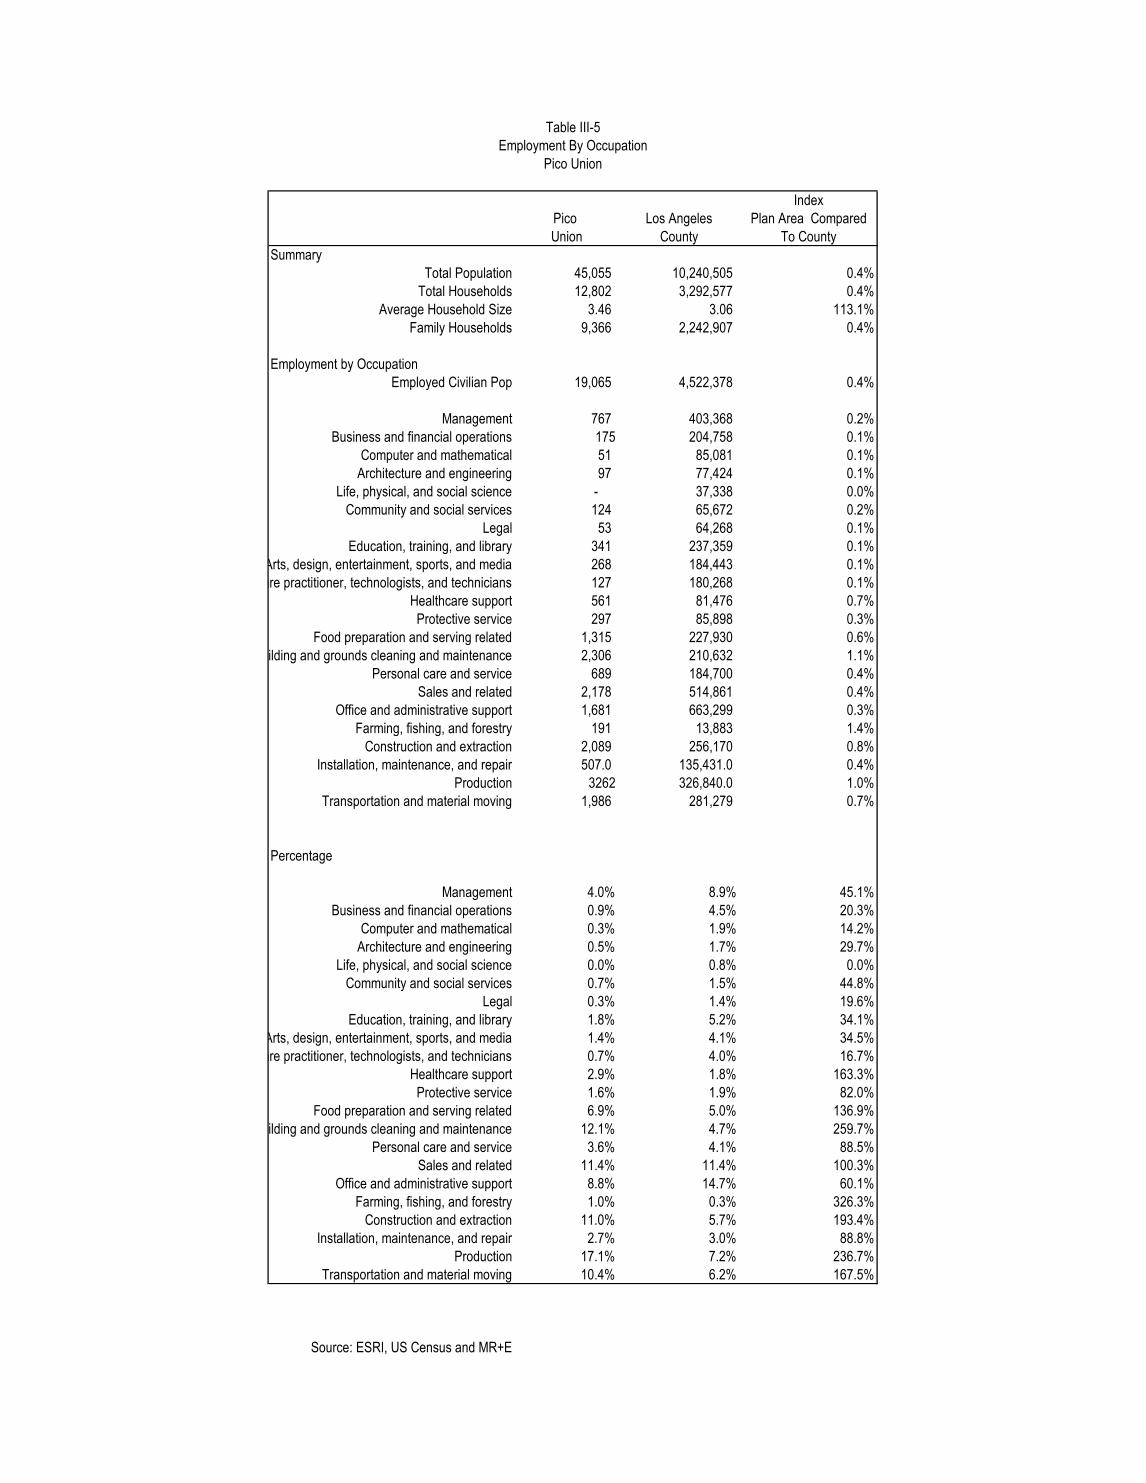
Occupational information is displayed on Table III-5. Leading occupations held by community residents include
grounds cleaning and maintenance, service related employment, production and construction. Each of these
classifications is significantly overrepresented in terms of the proportional share of occupations of LA County workers
as a whole.
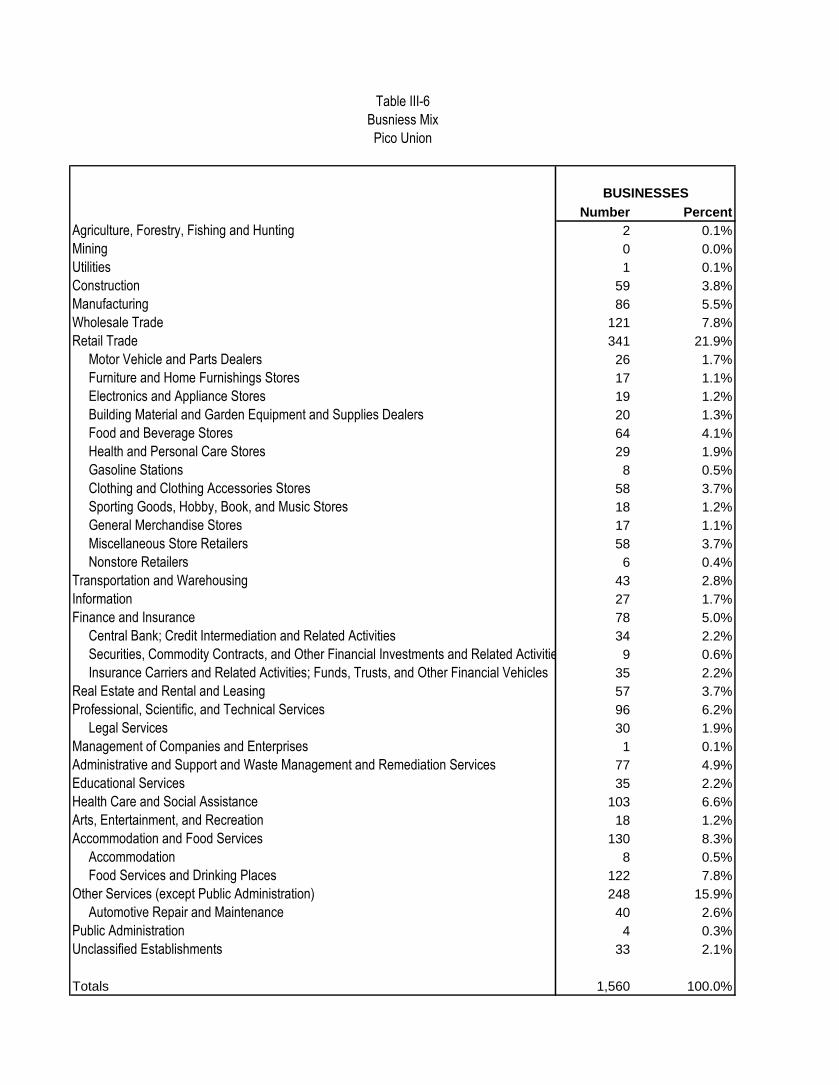
The data above refers to the employment status of community residents and does not reflect the distribution of
employment within the neighborhood. Table III-6 shows the mix of businesses located within the study area. This
information is provided on the basis of North American Industrial Classification System ( NAICS ) codes with the
major groups broken down into subcategories where appropriate. The largest major group for employment in the
community is retail trade, with food and beverage stores making up the largest single category of retail store.
Services, wholesale trade and accommodation and food services are leading sectors of businesses located in Pico
Union.
Housing market
Pico Union, like the rest of Southern California, has experienced a steep decline in the sales value of housing that
began with the onset of the national recession in 2007. For the previous 10 years, housing throughout California and

MR+E
AEG Special Events Center Market Impacts III-7
in Los Angeles County experienced sustained increases in value with a particularly rapid rise beginning in early 2001.
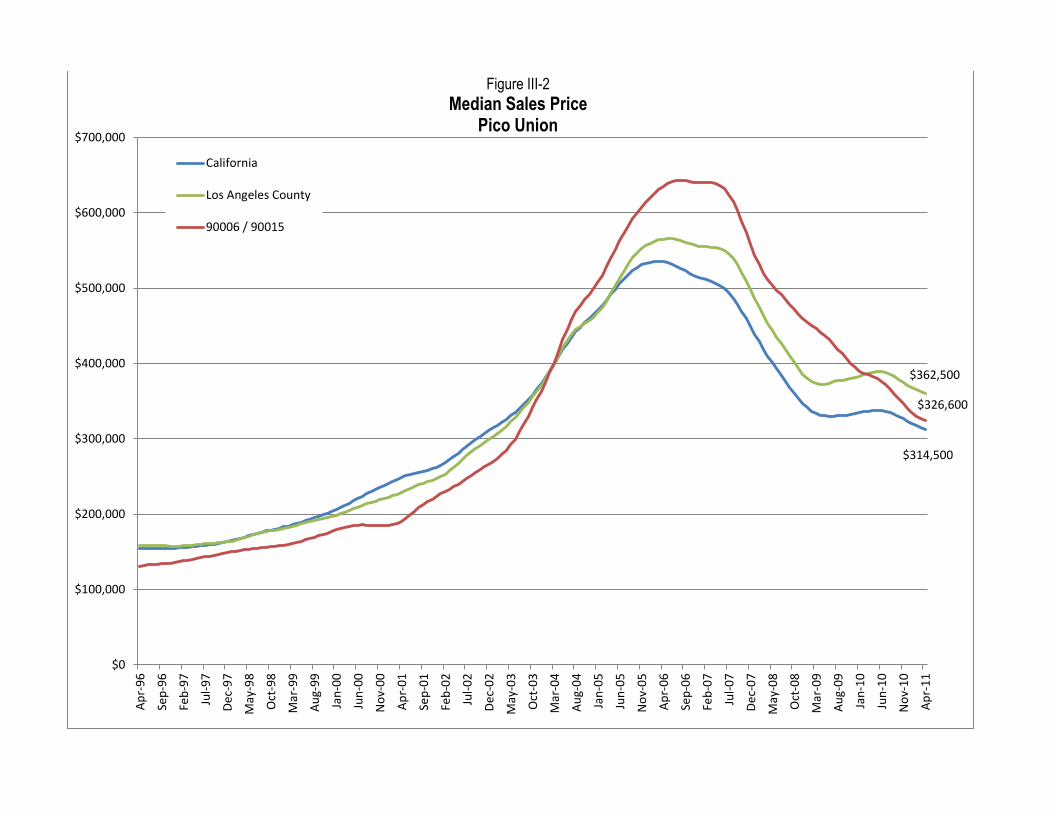
Figure III-2 shows the comparative trend of median sale prices for all homes in California, Los Angeles County and
Pico Union, as represented by zip codes 90006 and 90015. This figure charts a 15-year trend in the relative median
sales price for all dwelling units. From 1996 until 2004 median sales prices in Pico Union were lower than the
average for Los Angeles County and the state as a whole. But beginning in 2004 prices began to appreciate in the
community at a more rapid rate than was experienced elsewhere in the region. This led to a peak median sales price
of just over $640,000 in March of 2007. Median sales price for all units in Pico Union experienced a rapid run-up in
value between 2003 and the beginning of the national recession in 2007. Beginning in April 1996, the median value
for all dwelling units in these two zip code areas was $130,800. This was considerably lower than the Los Angeles
County average of $158,900 and the statewide average of $154,600. From 1996 through 2002, a period which
covers three years prior to the opening of STAPLES Center and three years after its opening, median sales prices in
the community zip codes trended upward at approximately the same rate as the State and County as a whole.
However, as part of the overall run-up in housing values that was experienced from 2002 through 2007 values in the
Pico Union area began to accelerate much more rapidly than the State or the County. By March of 2004, values in
the Pico Union communities exceeded the statewide and county averages for the first time with a median sales value
of $401,800.
From that point forward until the decline in regional real estate values beginning in the spring of 2007, values in Pico
Union outpaced growth in the State and the County. However, with the collapse of regional real estate values,
median sales value in Pico Union has declined faster than either the State of the County and did not benefit from the
effects of the first-time homebuyer tax credit and the federal making home affordable program that arrested the
decline in housing values in the County and the State in 2008 and 2009. Since that time values in Pico Union have
declined more rapidly than the State and the County as a whole, such that by February 2010 prices in Pico Union
were lower than the Los Angeles County median for the first time since early 2004. Presently, values are reverting
back towards the State-wide median. As of April 2011, the median sales price in the Pico Union area was slightly
over $325,000, whereas the median sales price was just over $314,000 in the State as a whole and over $362,000
for Los Angeles County.

Index
Pico Los Angeles Plan Area Compared
Union County To County
Summary
Total Population 45,055 10,240,505 0.4%
Total Households 12,802 3,292,577 0.4%
Average Household Size 3.46 3.06 113.1%
Family Households 9,366 2,242,907 0.4%
Household Income
<$15,000 4,116 395,594 1.0%
$15,000 - $24,999 2,591 310,476 0.8%
$25,000 - $34,999 1,904 332,044 0.6%
$35,000 - $49,999 1,629 455,395 0.4%
$50,000 - $74,999 1,461 674,643 0.2%
$75,000 - $99,999 507 451,803 0.1%
$100,000 - $149,999 352 372,840 0.1%
$150,000 - $199,999 82 141,009 0.1%
$200,000+ 160 158,691 0.1%
Median HH Income 23,210 54,755 42.4%
Average HH Income 36,841 74,879 49.2%
Aggregate HH Income 471,638,482 246,544,873,183 0.2%
Percentage
<$15,000 32.2% 12.0% 267.6%
$15,000 - $24,999 20.2% 9.4% 214.6%
$25,000 - $34,999 14.9% 10.1% 147.5%
$35,000 - $49,999 12.7% 13.8% 92.0%
$50,000 - $74,999 11.4% 20.5% 55.7%
$75,000 - $99,999 4.0% 13.7% 28.9%
$100,000 - $149,999 2.7% 11.3% 24.3%
$150,000 - $199,999 0.6% 4.3% 15.0%
$200,000+ 1.2% 4.8% 25.9%
Source: ESRI, US Census and MR+E
Table III- 3
Income 2010
Pico Union
Index
Pico Los Angeles Plan Area Compared
Union County To County
Summary
Total Population 45,055 10,240,505 0.4%
Total Households 12,802 3,292,577 0.4%
Average Household Size 3.46 3.06 113.1%
Family Households 9,366 2,242,907 0.4%
Employment by Industry
Employed Civilian Pop 19,067 4,522,378 0.4%
Agriculture 292 16,731 1.7%
Mining - 2,850 0.0%
Construction 2,159 300,901 0.7%
Manufacturing 3,262 533,779 0.6%
Wholesl Trade 899 181,661 0.5%
Retail Trade 1,978 477,613 0.4%
Transportation 1,204 209,827 0.6%
Utilities - 25,077 0.0%
Information 238 200,129 0.1%
Finance/Insurance 407 206,540 0.2%
Real Estate 370 112,269 0.3%
Prof/Tech Services 473 306,580 0.2%
Management - 3,607 0.0%
Adminstration 1,159 226,114 0.5%
Eduataional Services 610 368,893 0.2%
Health Care 1,536 500,047 0.3%
Arts/Entertnment 272 135,227 0.2%
Accomdations / Food 1,888 301,819 0.6%
Other Services 2,081 269,706 0.8%
Public Admin 239 143,008.0 0.2%
Percentage
Agriculture 1.5% 0.4% 413.9%
Mining 0.0% 0.1% 0.0%
Construction 11.3% 6.7% 170.2%
Manufacturing 17.1% 11.8% 144.9%
Wholesl Trade 4.7% 4.0% 117.4%
Retail Trade 10.4% 10.6% 98.2%
Transportation 6.3% 4.6% 136.1%
Utilities 0.0% 0.6% 0.0%
Information 1.2% 4.4% 28.2%
Finance/Insurance 2.1% 4.6% 46.7%
Real Estate 1.9% 2.5% 78.2%
Prof/Tech Services 2.5% 6.8% 36.6%
Management 0.0% 0.1% 0.0%
Adminstration 6.1% 5.0% 121.6%
Eduataional Services 3.2% 8.2% 39.2%
Health Care 8.1% 11.1% 72.9%
Arts/Entertnment 1.4% 3.0% 47.7%
Accomdations / Food 9.9% 6.7% 148.4%
Other Services 10.9% 6.0% 183.0%
Public Admin 1.3% 3.2% 39.6%
Source: ESRI, US Census and MR+E
Table III-4
Employment By Industry
Pico Union
Index
Pico Los Angeles Plan Area Compared
Union County To County
Summary
Total Population 45,055 10,240,505 0.4%
Total Households 12,802 3,292,577 0.4%
Average Household Size 3.46 3.06 113.1%
Family Households 9,366 2,242,907 0.4%
Employment by Occupation
Employed Civilian Pop 19,065 4,522,378 0.4%
Management 767 403,368 0.2%
Business and financial operations 175 204,758 0.1%
Computer and mathematical 51 85,081 0.1%
Architecture and engineering 97 77,424 0.1%
Life, physical, and social science - 37,338 0.0%
Community and social services 124 65,672 0.2%
Legal 53 64,268 0.1%
Education, training, and library 341 237,359 0.1%
Arts, design, entertainment, sports, and media 268 184,443 0.1%
Healthcare practitioner, technologists, and technicians 127 180,268 0.1%
Healthcare support 561 81,476 0.7%
Protective service 297 85,898 0.3%
Food preparation and serving related 1,315 227,930 0.6%
Building and grounds cleaning and maintenance 2,306 210,632 1.1%
Personal care and service 689 184,700 0.4%
Sales and related 2,178 514,861 0.4%
Office and administrative support 1,681 663,299 0.3%
Farming, fishing, and forestry 191 13,883 1.4%
Construction and extraction 2,089 256,170 0.8%
Installation, maintenance, and repair 507.0 135,431.0 0.4%
Production 3262 326,840.0 1.0%
Transportation and material moving 1,986 281,279 0.7%
Percentage
Management 4.0% 8.9% 45.1%
Business and financial operations 0.9% 4.5% 20.3%
Computer and mathematical 0.3% 1.9% 14.2%
Architecture and engineering 0.5% 1.7% 29.7%
Life, physical, and social science 0.0% 0.8% 0.0%
Community and social services 0.7% 1.5% 44.8%
Legal 0.3% 1.4% 19.6%
Education, training, and library 1.8% 5.2% 34.1%
Arts, design, entertainment, sports, and media 1.4% 4.1% 34.5%
Healthcare practitioner, technologists, and technicians 0.7% 4.0% 16.7%
Healthcare support 2.9% 1.8% 163.3%
Protective service 1.6% 1.9% 82.0%
Food preparation and serving related 6.9% 5.0% 136.9%
Building and grounds cleaning and maintenance 12.1% 4.7% 259.7%
Personal care and service 3.6% 4.1% 88.5%
Sales and related 11.4% 11.4% 100.3%
Office and administrative support 8.8% 14.7% 60.1%
Farming, fishing, and forestry 1.0% 0.3% 326.3%
Construction and extraction 11.0% 5.7% 193.4%
Installation, maintenance, and repair 2.7% 3.0% 88.8%
Production 17.1% 7.2% 236.7%
Transportation and material moving 10.4% 6.2% 167.5%
Source: ESRI, US Census and MR+E
Table III-5
Employment By Occupation
Pico Union
Number Percent
Agriculture, Forestry, Fishing and Hunting 2 0.1%
Mining 0 0.0%
Utilities 1 0.1%
Construction 59 3.8%
Manufacturing 86 5.5%
Wholesale Trade 121 7.8%
Retail Trade 341 21.9%
Motor Vehicle and Parts Dealers 26 1.7%
Furniture and Home Furnishings Stores 17 1.1%
Electronics and Appliance Stores 19 1.2%
Building Material and Garden Equipment and Supplies Dealers 20 1.3%
Food and Beverage Stores 64 4.1%
Health and Personal Care Stores 29 1.9%
Gasoline Stations 8 0.5%
Clothing and Clothing Accessories Stores 58 3.7%
Sporting Goods, Hobby, Book, and Music Stores 18 1.2%
General Merchandise Stores 17 1.1%
Miscellaneous Store Retailers 58 3.7%
Nonstore Retailers 6 0.4%
Transportation and Warehousing 43 2.8%
Information 27 1.7%
Finance and Insurance 78 5.0%
Central Bank; Credit Intermediation and Related Activities 34 2.2%
Securities, Commodity Contracts, and Other Financial Investments and Related Activities 9 0.6%
Insurance Carriers and Related Activities; Funds, Trusts, and Other Financial Vehicles 35 2.2%
Real Estate and Rental and Leasing 57 3.7%
Professional, Scientific, and Technical Services 96 6.2%
Legal Services 30 1.9%
Management of Companies and Enterprises 1 0.1%
Administrative and Support and Waste Management and Remediation Services 77 4.9%
Educational Services 35 2.2%
Health Care and Social Assistance 103 6.6%
Arts, Entertainment, and Recreation 18 1.2%
Accommodation and Food Services 130 8.3%
Accommodation 8 0.5%
Food Services and Drinking Places 122 7.8%
Other Services (except Public Administration) 248 15.9%
Automotive Repair and Maintenance 40 2.6%
Public Administration 4 0.3%
Unclassified Establishments 33 2.1%
Totals 1,560 100.0%
BUSINESSES
Table III-6
Busniess Mix
Pico Union
$314,500
$362,500
$326,600
$0
$100,000
$200,000
$300,000
$400,000
$500,000
$600,000
$700,000A
pr-
96
Sep
-96
Feb
-97
Jul-
97
De
c-9
7
May
-98
Oct
-98
Mar
-99
Au
g-9
9
Jan
-00
Jun
-00
No
v-0
0
Ap
r-0
1
Sep
-01
Feb
-02
Jul-
02
De
c-0
2
May
-03
Oct
-03
Mar
-04
Au
g-0
4
Jan
-05
Jun
-05
No
v-0
5
Ap
r-0
6
Sep
-06
Feb
-07
Jul-
07
De
c-0
7
May
-08
Oct
-08
Mar
-09
Au
g-0
9
Jan
-10
Jun
-10
No
v-1
0
Ap
r-1
1
Figure III-2
Median Sales Price Pico Union
California
Los Angeles County
90006 / 90015
MR+E
AEG Special Events Center Market Impacts III-13
STAPLES Center and LA Live
Since the opening of STAPLES Center in 1999 there has been little evidence of widespread gentrification in
residential or commercial areas west of the 110 freeway. As a result of certain initiatives arising from the STAPLES
Center and Los Angeles Sports and Entertainment District Specific Plan, a number of stabilizing community benefits
programs and projects have been implemented. Such beneficial programs/projects include: job training and local
hiring, affordable housing, open space improvements, day care facilities and after school programs, and
improvements to the Salvation Army Red Shield Center. LA Live, open since 2008, has also delivered a variety of
dining and entertainment facilities that have been enjoyed by nearby residences including the new 14 screen Regal
Cinema complex.
Through outreach programs at local job training centers, union halls, community faith based organizations, job fairs,
and job training programs at LA Trade Tech, a substantial number (over 5,000) of new, quality, living wages job
opportunities have been created at STAPLES Center, Nokia Theatre, LA Live and the Ritz Carlton/JW Marriott Hotels
at LA Live. The emphasis on local job hiring has also had a favorable stabilizing effect on the local community
despite the challenging nationwide economic downturn.
Youth programs at the Red Shield Center and 10th Street Elementary School have provided after school support for
working families as well as special reading, art and recreational programs and activities.
The combination of local jobs, numerous housing and open space projects, new and upgraded community facilities
and local youth programs all stimulated by the development of STAPLES Center and LA Live, have resulted in
positive impacts in many areas of Pico Union and have contributed to further stability in Project adjacent
neighborhoods.
Similar local hiring initiatives and employment opportunities as well as continued and expanded community
enhancement programs are anticipated to be implemented by the Project. These efforts are anticipated to further
contribute to the quality of life for Pico Union and its residents.
STAPLES Center Foundation has established a number of partnerships in the Los Angeles community to assist
charities in raising funds and awareness for their organizations with a special emphasis on the low-income
neighborhoods, including Pico Union, surrounding the arena. The Foundation has donated more than $10 million in
financial and in-kind support to many community-based organizations, including major partnerships with the following
programs:
A Better LA-- to provide youth services and gang diversion programs
MR+E
AEG Special Events Center Market Impacts III-14
Eisner Pediatric & Family Medical Center—Non profit community health care
Inner City Arts—Support for arts education in low income communities
The Midnight Mission—Primary homeless services in Downtown Los Angeles
Para Los Niños—Non profit community service and educational organization
Salvation Army Red Shield Center—Employment and social services for low income and disabled children
and adults.
10th Street Elementary—The STAPLES Center foundation has a long term relationship with the school.
This has included continued engagement with the school community and support of educational programs.
Community Grant Program—Provides grants to non-profit community organizations located within three
miles of STAPLES Center
Community Partnership Program—Provides in kind donations and use of facilities to support community
groups
Disney Concert Hall –Capital contributions and operations support for the Los Angeles Philharmonic.
Since its opening in 1999, STAPLES Center has hosted an estimated 28 million patrons. Over that time its presence
has been an asset to the neighborhoods of greater Downtown Los Angeles, including Pico Union, by being an
economic anchor tenant for the community. During this time STAPLES Center activities have contributed to growth
in the local economy through direct employment of area residents as well providing business opportunities for a
wide variety of local enterprises providing goods and services required both visitors and event patrons as well as by
providing inputs to the operations of the facilities themselves.
MR+E
AEG Special Events Center Market Impacts IV-1
Section IV Fiscal Impacts
Introduction
This section covers the fiscal impacts of annual operations of the proposed Project. The analysis investigates the
revenue implications for jurisdictions affected by activities at the future facility. These include:
State of California-- sales taxes
Los Angeles County-- property taxes
Metropolitan transit Authority (MTA)-- sales taxes
City of Los Angeles-- property and sales taxes along with a set of local option taxes
Los Angeles Unified School District-- property taxes
Other special districts-- property taxes
The analysis considers two locations for impacts:
On-site impacts-- these are fiscal impacts that occur directly as result of activities that take place within the
Project.
Off-site impacts---Which are the fiscal impacts of activities that are directly related to events that occur at
the new project but take place elsewhere in the City of LA. A key example of this would be hotel room night
generation attributable to an event held at the Project.
Another important feature of this analysis is that it only focuses on net new incremental growth in activities at the Los
Angeles Convention Center (LACC).
Existing fiscal policy was used as the basis for determining impacts and all estimated values are shown as 2012
dollars.
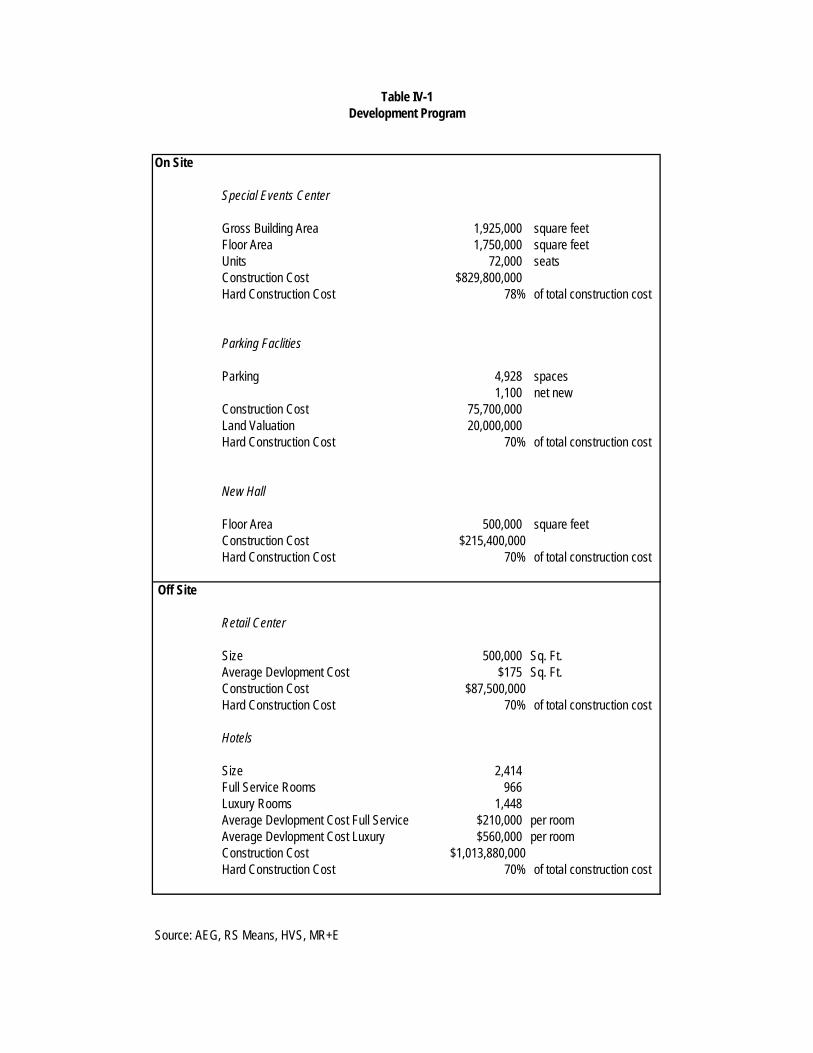
Project Components
The fiscal analysis is focused on a set of on-site and off-site components. The on-site improvements are composed
of the elements of the Project which can be summarized as follows:
1. The special event center (SEC)-- this is a 72,000 seat facility with a gross building area of 1.75 million sq.
ft.. This facility will be able to host large-scale sporting events including NFL football and is convertible into
exhibit space that can be used as part of the overall LACC operations
MR+E
AEG Special Events Center Market Impacts IV-2
2. Parking facilities-- the project anticipates adding 4,000 parking spaces, representing a net growth of 1,100
spaces, in order to accommodate anticipated increased visitation volumes on site.
3. New Hall-- This is an approximately 500,000 square-foot convention and exhibit facility representing an
expansion of the LACC.
The off-site development program is made up principally of two components that are directly attributable to AEG's
investment in the special event center and the LACC expansion. The project is likely to engender additional off-site
private investment throughout Downtown Los Angeles and in the South Park district. However this analysis focuses
on two specific categories of development that have been identified by AEG's internal planning and through an
analysis of the downtown hotel market. These include the following:
1. Retail center-- AEG anticipates an additional development of 500,000 sq. ft. of destination oriented retail to
be co-developed off site along with the development program.
2. Hotels-- A market study prepared in June 2011 anticipates that the downtown hotel market will be able to
absorb 2,414 new rooms as a direct result of activities at the expanded LACC and the SEC this additional
room night capacity is based on demand from incremental growth directly attributed to forecast activities at
the Project. Fiscal impacts of hotel operations discussed in this study are limited to an analysis of the net
incremental growth rather than the total inventory of hotel rooms in Downtown Los Angeles
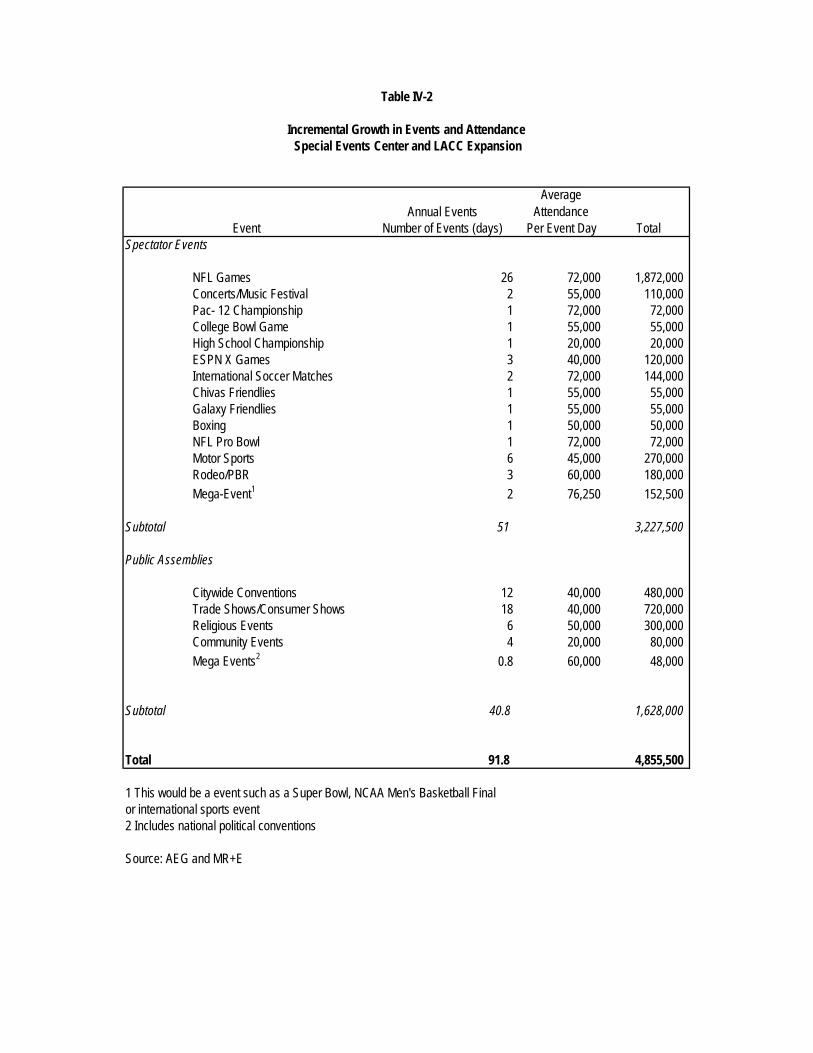
Table IV- 2 provides a forecast of annual events that are expected to occur at the project after construction of the
Project. Events have been divided into two basic categories:
1. Spectator events-- these included spectator sports exhibitions and national championship events that
would primarily use the Stadium configuration of the SEC.
2. Public assemblies-- this is the incremental growth in the number of events and size of anticipated after the
development of the project. This does not represent the total amount of activity that would occur at the
LACC, but rather represents net new business that otherwise would not be accommodated in Los Angeles.
Within the spectator event category NFL games represent the largest single category of event. The facility is
expected to accommodate a variety of spectator sports many of which will have a draw for attendance beyond the
Los Angeles market. Of particular importance are the anticipated annual mega-events which will change in nature
periodically. These are expected to include events such as the NFL Super Bowl the NCAA men's basketball final four
or an international sports event such as a World Cup or similar event
On Site
Special Events Center
Gross Building Area 1,925,000 square feetFloor Area 1,750,000 square feetUnits 72,000 seats Construction Cost $829,800,000Hard Construction Cost 78% of total construction cost
Parking Faclities
Parking 4,928 spaces1,100 net new
Construction Cost 75,700,000 Land Valuation 20,000,000 Hard Construction Cost 70% of total construction cost
New Hall
Floor Area 500,000 square feetConstruction Cost $215,400,000Hard Construction Cost 70% of total construction cost
Off Site
Retail Center
Size 500,000 Sq. Ft.Average Devlopment Cost $175 Sq. Ft.Construction Cost $87,500,000Hard Construction Cost 70% of total construction cost
Hotels
Size 2,414 Full Service Rooms 966 Luxury Rooms 1,448 Average Devlopment Cost Full Service $210,000 per roomAverage Devlopment Cost Luxury $560,000 per roomConstruction Cost $1,013,880,000Hard Construction Cost 70% of total construction cost
Source: AEG, RS Means, HVS, MR+E
Table IV-1Development Program
Annual EventsAverage
AttendanceNumber of Events (days) Per Event Day Total
Spectator Events
NFL Games 26 72,000 1,872,000 Concerts/Music Festival 2 55,000 110,000 Pac- 12 Championship 1 72,000 72,000 College Bowl Game 1 55,000 55,000 High School Championship 1 20,000 20,000 ESPN X Games 3 40,000 120,000 International Soccer Matches 2 72,000 144,000 Chivas Friendlies 1 55,000 55,000 Galaxy Friendlies 1 55,000 55,000 Boxing 1 50,000 50,000 NFL Pro Bowl 1 72,000 72,000 Motor Sports 6 45,000 270,000 Rodeo/PBR 3 60,000 180,000
Mega-Event1 2 76,250 152,500
Subtotal 51 3,227,500
Public Assemblies
Citywide Conventions 12 40,000 480,000 Trade Shows/Consumer Shows 18 40,000 720,000 Religious Events 6 50,000 300,000 Community Events 4 20,000 80,000
Mega Events2 0.8 60,000 48,000
Subtotal 40.8 1,628,000
Total 91.8 4,855,500
1 This would be a event such as a Super Bowl, NCAA Men's Basketball Finalor international sports event2 Includes national political conventions
Source: AEG and MR+E
Event
Table IV-2
Incremental Growth in Events and Attendance Special Events Center and LACC Expansion

MR+E
AEG Special Events Center Market Impacts IV-6
Public assemblies are made up of a variety of activities. This analysis is based on the existing system of
categorization of events:
1. Citywide conventions--- these are conventions that are booked at least 18 months in advance and
consume a significant number of hotel rooms as part of the event. Citywide conventions are typically
national and international scale and are focused on bringing in delegates from outside of the region.
2. Tradeshows and consumer shows -- Tradeshows are events that are open “to the trade” only. And
represent an opportunity for vendors to exhibit services and equipment to potential customers. These are
business-to-business events, typically aimed at a regional market, without a public component. Consumer
shows are events open to the general public generally with the gated admission. Consumer shows may
include a retail component with direct sales.
3. Religious events These are large scale public meetings that are religious in nature
4. Community events Public meetings and civic functions
5. Mega event— Major national meetings such as political conventions which attract participants form outside
the region.
In total is anticipated that the SEC will be able to accommodate on an average annual basis 51 spectator events with
a total attendance of 3.2 million. This includes home games for two NFL franchises. The LACC expansion is
anticipated to generate 40.8 events net new incremental events with an attendance of over 1.6 million. This
combined total would yield 91.8 annual events with a total attendance of over 4.8 million.
Fiscal revenues
The activities at the new project will have fiscal implications for a broad variety of jurisdictions for both dedicated and
general fund purposes. This analysis looks at the total private flow of funds from all sources to relevant jurisdictions
generated from annual operations.
Property tax
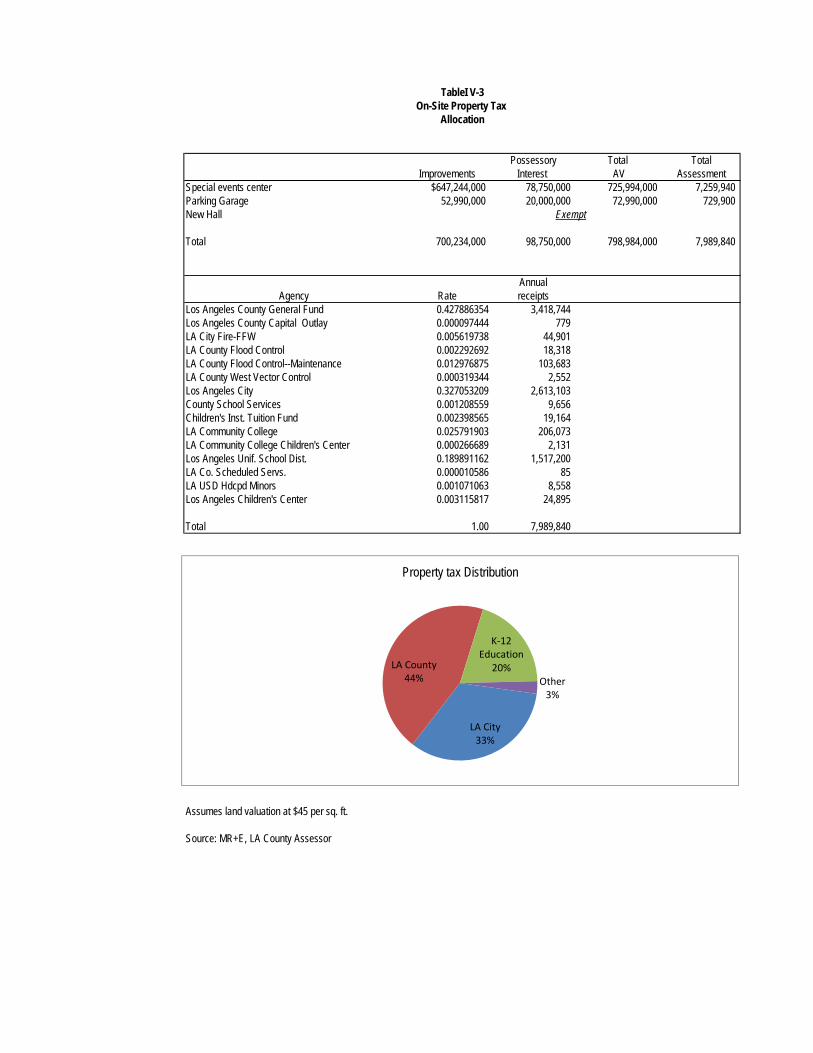
Table IV-3 provides the allocation for property taxes from direct on-site investments. This is based on a total value of
improvements for the SEC and parking garage at just over $ 700 million. This is a significant capital investment in its
own right that will have important contributions in terms of property tax.
Possessory Total TotalImprovements Interest AV Assessment
Special events center $647,244,000 78,750,000 725,994,000 7,259,940 Parking Garage 52,990,000 20,000,000 72,990,000 729,900 New Hall
Total 700,234,000 98,750,000 798,984,000 7,989,840
AnnualAgency Rate receipts
Los Angeles County General Fund 0.427886354 3,418,744 Los Angeles County Capital Outlay 0.000097444 779 LA City Fire-FFW 0.005619738 44,901 LA County Flood Control 0.002292692 18,318 LA County Flood Control--Maintenance 0.012976875 103,683 LA County West Vector Control 0.000319344 2,552 Los Angeles City 0.327053209 2,613,103 County School Services 0.001208559 9,656 Children's Inst. Tuition Fund 0.002398565 19,164 LA Community College 0.025791903 206,073 LA Community College Children's Center 0.000266689 2,131 Los Angeles Unif. School Dist. 0.189891162 1,517,200 LA Co. Scheduled Servs. 0.000010586 85 LA USD Hdcpd Minors 0.001071063 8,558 Los Angeles Children's Center 0.003115817 24,895
Total 1.00 7,989,840
LA City 2,658,004 LA County 3,541,523 K-12 Education 1,579,473 Other 210,840
Assumes land valuation at $45 per sq. ft.
Source: MR+E, LA County Assessor
Exempt
On-Site Property Tax Allocation
TableI V-3
LA City 33%
LA County44%
K‐12 Education
20%Other3%
Property tax Distribution
MR+E
AEG Special Events Center Market Impacts IV-10
Over and above the capital cost associated with improvements is a possessory interest which accounts for the value
of land occupied by private projects where in the city of Los Angeles retains title. This possessory interest assumes
a land valuation of $45 per sq. ft. New Hall would remain a public facility as part of LACC and would be exempt from
property taxes. The distribution of the annual assessment of over $7.9 million is shown on the table and is based on
existing tax rate area (TRA) that is in place for the site. The largest single recipient of funds, at just over $3.4 million,
would be Los Angeles County's general fund. The County, including general fund and flood control accounts, make
up 44% of the total distribution of property tax generated by the project. The City of Los Angeles would receive 33%
of the direct on-site property tax generated by the project estimated at just over $2.6 million per year. K-12 education
including LAUSD would receive 20% of the total with LAUSD itself receiving just over $1.5 million per year.
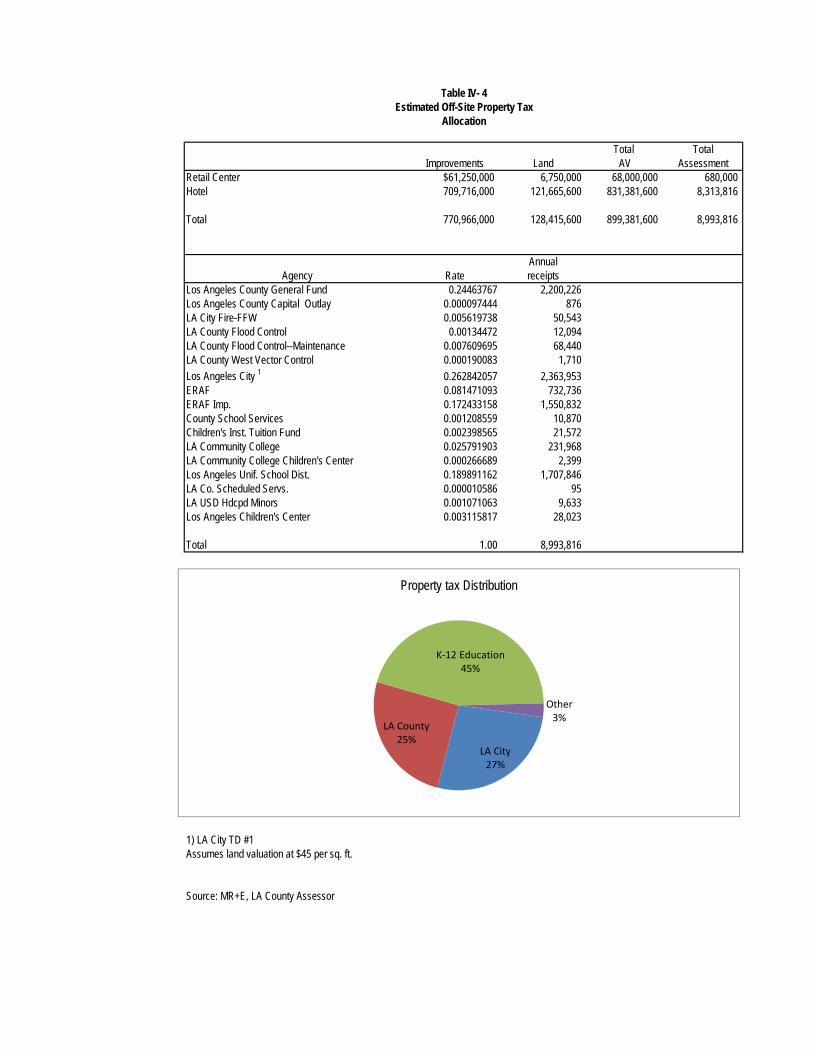
In terms of the estimated off-site property tax stemming from the retail center and the net new in hotel development,
the tax rate area including city of Los Angeles TD#1 was used for analyzing the property tax implications. The
specific geography of the investment may be spread out over multiple TRA's however TD #1 and its associated rates
were used for the purposes of this analysis. Note that this is subject to Educational Revenue Augmentation Fund
(ERAF) distributions and as such K-12 education receives a larger proportion of property tax revenues. In terms of
the direct offsite investments the total assessed valuation is estimated at just over $899 million. Resulting in over
$8.9 million in total tax assessed. The largest recipient of this revenue would be K-12 education due to the presence
of the ERAF funding formula. The largest single amount would be the City of Los Angeles general fund at $2.3 million
per year followed by Los Angeles County general fund at just over $2.2 million per year.
Sales tax
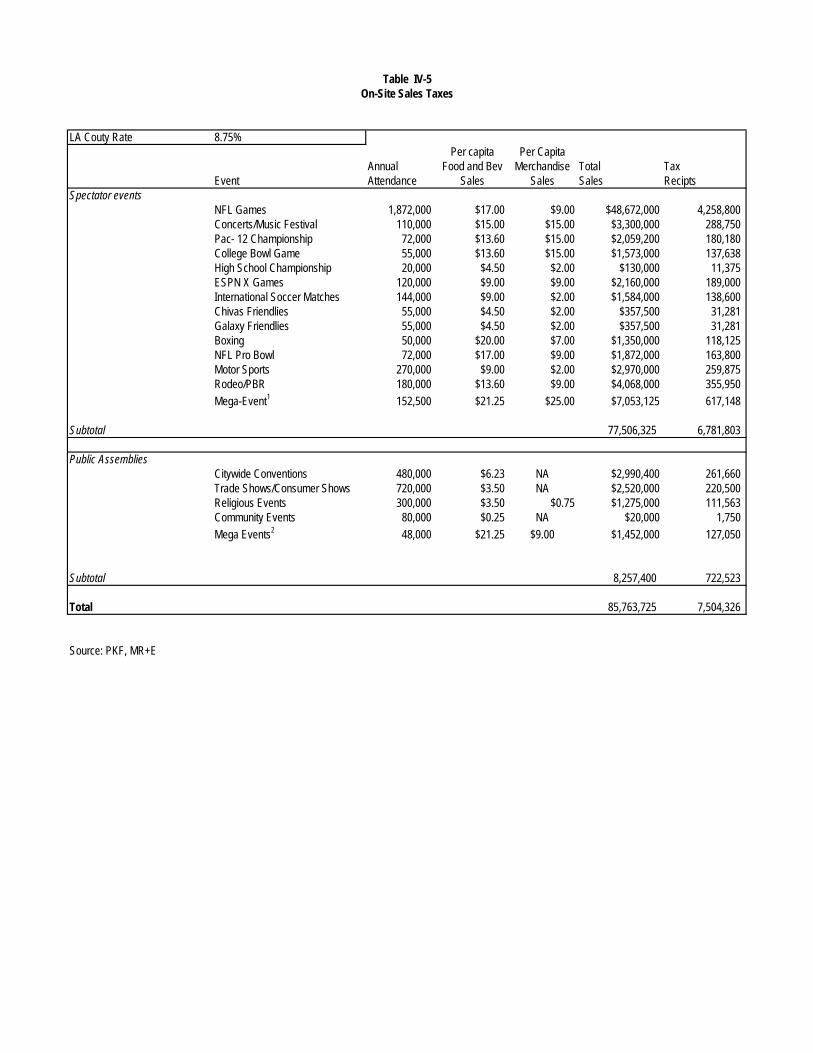
Table IV-5 presents an estimate of direct retail sales that occur on site. This analysis is based on an estimate of per
capita sales by event attendees at events that occur within the project. This represents spending on taxable goods
such as prepared food and merchandise at the facility. Presently Los Angeles County’s sales tax rate is 8.75%. This
analysis anticipates that spectator events would generate just over $77.5 million in taxable sales per year yielding
total tax receipts of $6.7 million. Net growth in public assemblies is anticipated to generate over $8.2 million in direct
taxable sales on-site which would generate over $722,000 in sales tax receipts. In total on annual recurring basis on
site retail sales are forecast to generate over $7.5 million in sales tax revenue.
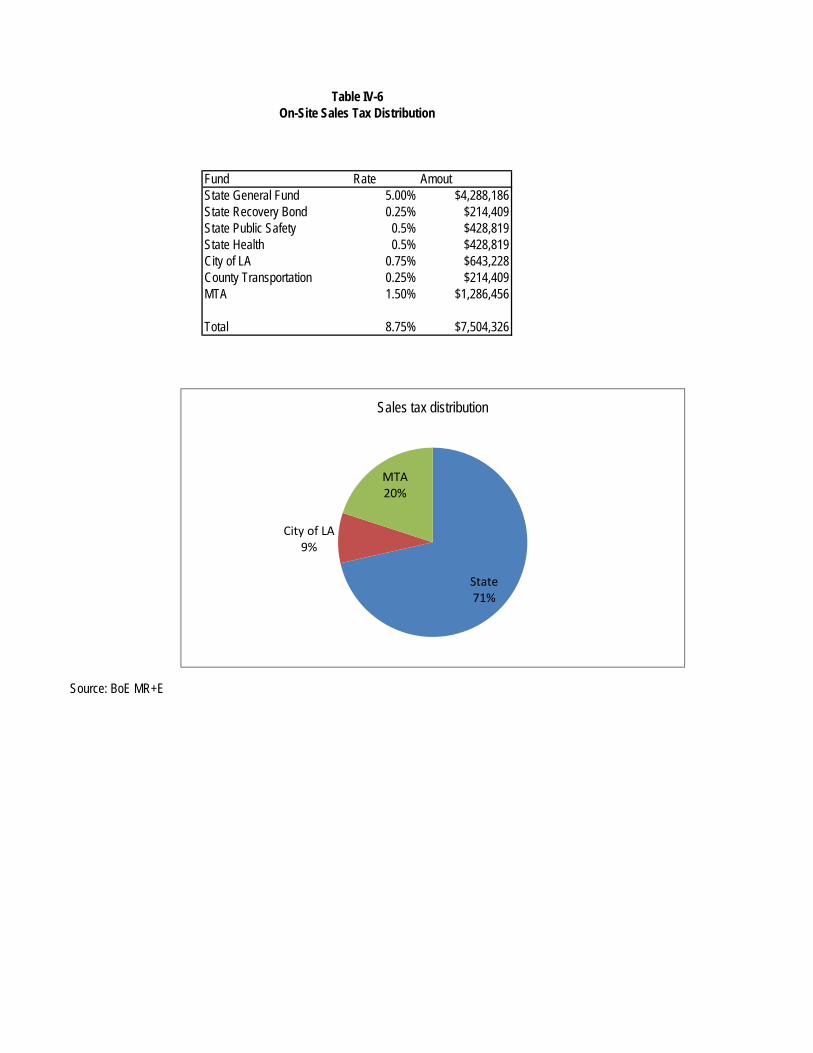
Table IV-6 provides the distribution of the 8.75% rate by fund. The largest single recipient of sales tax is the State of
California general fund which would receive 5% of the 8.75% collected. The second largest recipient of sales tax is
the MTA which would receive 1.5% of all retail sales. This is a result of measure R and additional assessments
within the County. The City of Los Angeles would receive .75%, or an estimated $643,000, per year from direct on-
site retail sales.
Total TotalImprovements Land AV Assessment
Retail Center $61,250,000 6,750,000 68,000,000 680,000 Hotel 709,716,000 121,665,600 831,381,600 8,313,816
Total 770,966,000 128,415,600 899,381,600 8,993,816
AnnualAgency Rate receipts
Los Angeles County General Fund 0.24463767 2,200,226 Los Angeles County Capital Outlay 0.000097444 876 LA City Fire-FFW 0.005619738 50,543 LA County Flood Control 0.00134472 12,094 LA County Flood Control--Maintenance 0.007609695 68,440 LA County West Vector Control 0.000190083 1,710
Los Angeles City 1 0.262842057 2,363,953 ERAF 0.081471093 732,736 ERAF Imp. 0.172433158 1,550,832 County School Services 0.001208559 10,870 Children's Inst. Tuition Fund 0.002398565 21,572 LA Community College 0.025791903 231,968 LA Community College Children's Center 0.000266689 2,399 Los Angeles Unif. School Dist. 0.189891162 1,707,846 LA Co. Scheduled Servs. 0.000010586 95 LA USD Hdcpd Minors 0.001071063 9,633 Los Angeles Children's Center 0.003115817 28,023
Total 1.00 8,993,816
LA City 2,414,496 LA County 2,281,732 K-12 Education 4,063,911 Other 233,677
1) LA City TD #1Assumes land valuation at $45 per sq. ft.
Source: MR+E, LA County Assessor
Estimated Off-Site Property Tax Allocation
Table IV- 4
LA City 27%
LA County25%
K‐12 Education45%
Other3%
Property tax Distribution
LA Couty Rate 8.75%Per capita Per Capita
Annual Food and Bev Merchandise Total TaxEvent Attendance Sales Sales Sales Recipts
Spectator eventsNFL Games 1,872,000 $17.00 $9.00 $48,672,000 4,258,800 Concerts/Music Festival 110,000 $15.00 $15.00 $3,300,000 288,750 Pac- 12 Championship 72,000 $13.60 $15.00 $2,059,200 180,180 College Bowl Game 55,000 $13.60 $15.00 $1,573,000 137,638 High School Championship 20,000 $4.50 $2.00 $130,000 11,375 ESPN X Games 120,000 $9.00 $9.00 $2,160,000 189,000 International Soccer Matches 144,000 $9.00 $2.00 $1,584,000 138,600 Chivas Friendlies 55,000 $4.50 $2.00 $357,500 31,281 Galaxy Friendlies 55,000 $4.50 $2.00 $357,500 31,281 Boxing 50,000 $20.00 $7.00 $1,350,000 118,125 NFL Pro Bowl 72,000 $17.00 $9.00 $1,872,000 163,800 Motor Sports 270,000 $9.00 $2.00 $2,970,000 259,875 Rodeo/PBR 180,000 $13.60 $9.00 $4,068,000 355,950
Mega-Event1 152,500 $21.25 $25.00 $7,053,125 617,148
Subtotal 77,506,325 6,781,803
Public AssembliesCitywide Conventions 480,000 $6.23 NA $2,990,400 261,660 Trade Shows/Consumer Shows 720,000 $3.50 NA $2,520,000 220,500 Religious Events 300,000 $3.50 $0.75 $1,275,000 111,563 Community Events 80,000 $0.25 NA $20,000 1,750
Mega Events2 48,000 $21.25 $9.00 $1,452,000 127,050
Subtotal 8,257,400 722,523
Total 85,763,725 7,504,326
Source: PKF, MR+E
Table IV-5On-Site Sales Taxes
MR+E
AEG Special Events Center Market Impacts IV-13
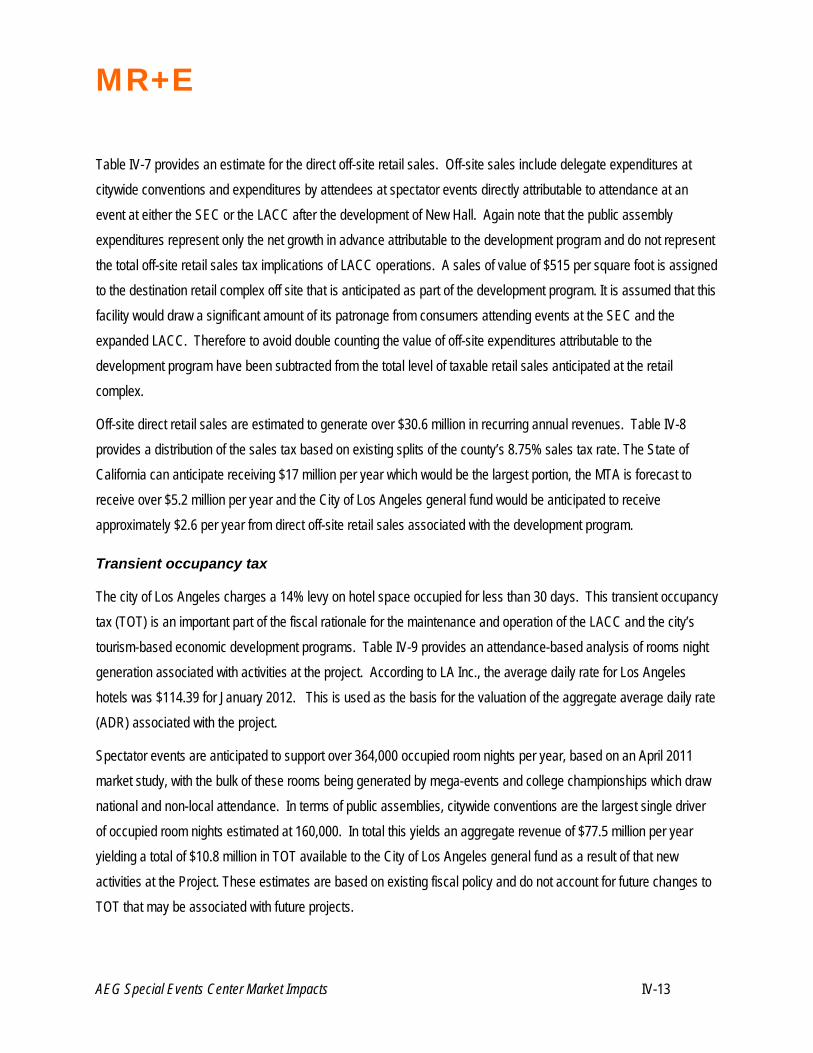
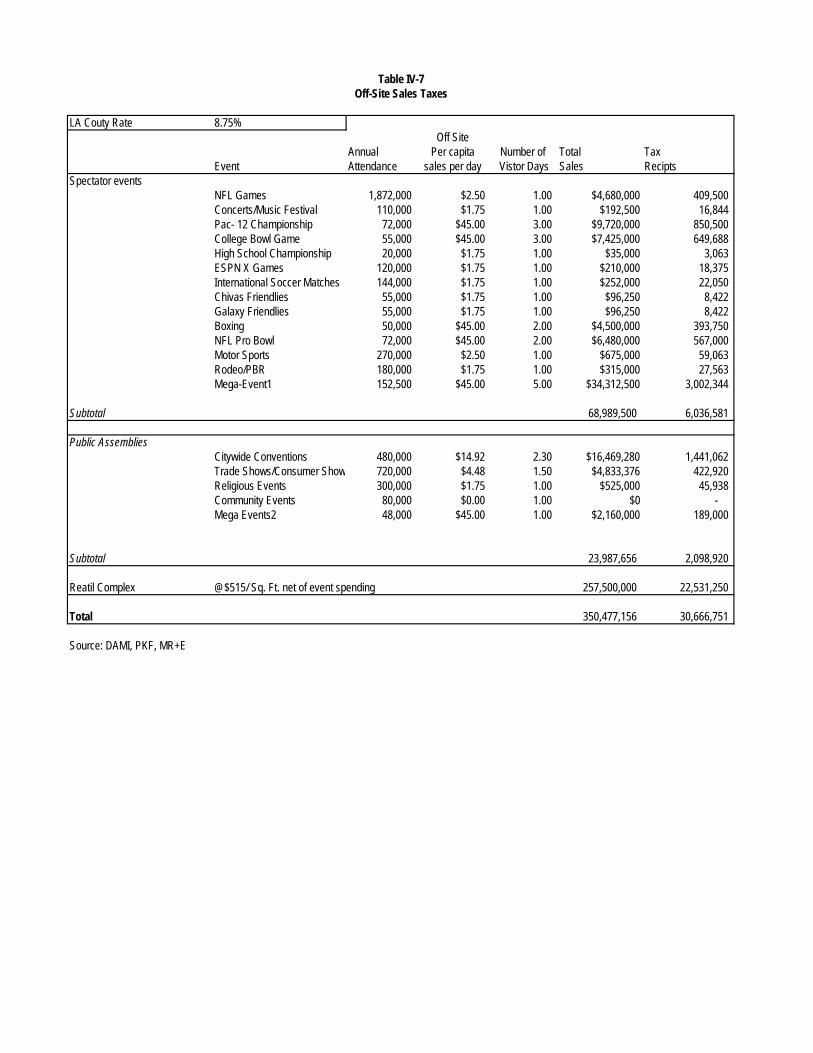
Table IV-7 provides an estimate for the direct off-site retail sales. Off-site sales include delegate expenditures at
citywide conventions and expenditures by attendees at spectator events directly attributable to attendance at an
event at either the SEC or the LACC after the development of New Hall. Again note that the public assembly
expenditures represent only the net growth in advance attributable to the development program and do not represent
the total off-site retail sales tax implications of LACC operations. A sales of value of $515 per square foot is assigned
to the destination retail complex off site that is anticipated as part of the development program. It is assumed that this
facility would draw a significant amount of its patronage from consumers attending events at the SEC and the
expanded LACC. Therefore to avoid double counting the value of off-site expenditures attributable to the
development program have been subtracted from the total level of taxable retail sales anticipated at the retail
complex.
Off-site direct retail sales are estimated to generate over $30.6 million in recurring annual revenues. Table IV-8
provides a distribution of the sales tax based on existing splits of the county’s 8.75% sales tax rate. The State of
California can anticipate receiving $17 million per year which would be the largest portion, the MTA is forecast to
receive over $5.2 million per year and the City of Los Angeles general fund would be anticipated to receive
approximately $2.6 per year from direct off-site retail sales associated with the development program.
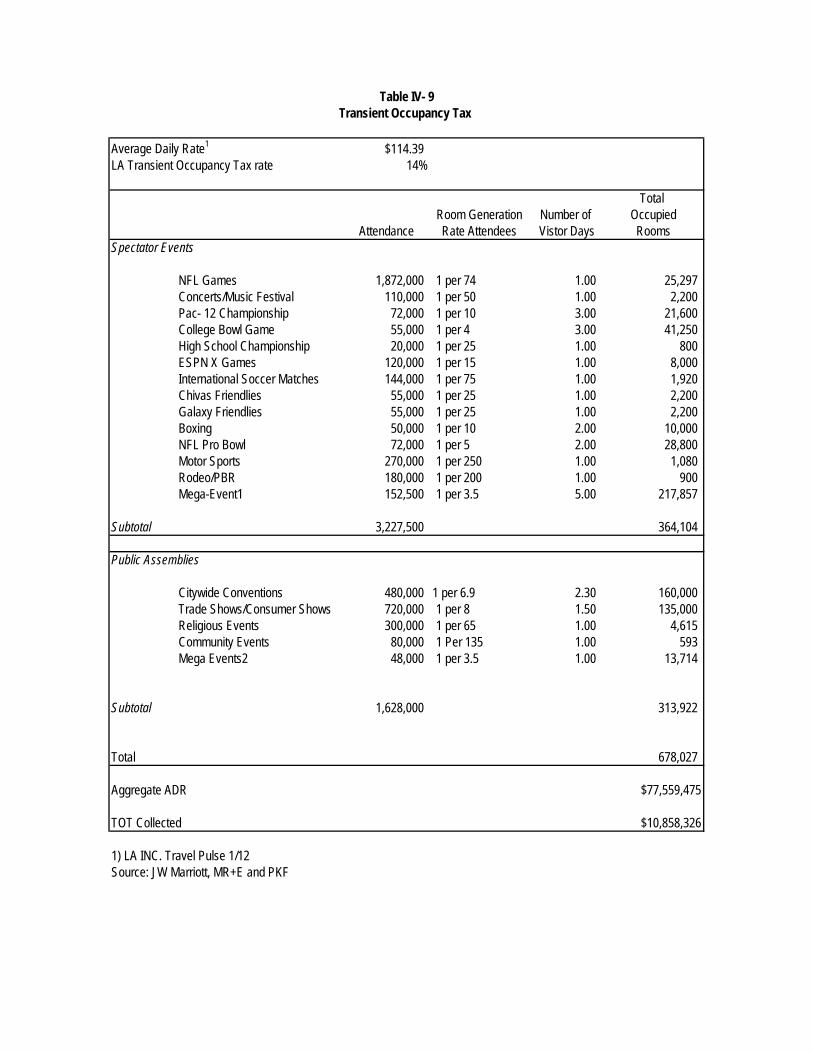
Transient occupancy tax
The city of Los Angeles charges a 14% levy on hotel space occupied for less than 30 days. This transient occupancy
tax (TOT) is an important part of the fiscal rationale for the maintenance and operation of the LACC and the city’s
tourism-based economic development programs. Table IV-9 provides an attendance-based analysis of rooms night
generation associated with activities at the project. According to LA Inc., the average daily rate for Los Angeles
hotels was $114.39 for January 2012. This is used as the basis for the valuation of the aggregate average daily rate
(ADR) associated with the project.
Spectator events are anticipated to support over 364,000 occupied room nights per year, based on an April 2011
market study, with the bulk of these rooms being generated by mega-events and college championships which draw
national and non-local attendance. In terms of public assemblies, citywide conventions are the largest single driver
of occupied room nights estimated at 160,000. In total this yields an aggregate revenue of $77.5 million per year
yielding a total of $10.8 million in TOT available to the City of Los Angeles general fund as a result of that new
activities at the Project. These estimates are based on existing fiscal policy and do not account for future changes to
TOT that may be associated with future projects.
Fund Rate AmoutState General Fund 5.00% $4,288,186State Recovery Bond 0.25% $214,409State Public Safety 0.5% $428,819State Health 0.5% $428,819City of LA 0.75% $643,228County Transportation 0.25% $214,409MTA 1.50% $1,286,456
Total 8.75% $7,504,326
State $5,360,233City of LA $643,228MTA $1,500,865
$7,504,326
Source: BoE MR+E
Table IV-6On-Site Sales Tax Distribution
State71%
City of LA9%
MTA20%
Sales tax distribution
LA Couty Rate 8.75%Off Site
Annual Per capita Number of Total TaxEvent Attendance sales per day Vistor Days Sales Recipts
Spectator eventsNFL Games 1,872,000 $2.50 1.00 $4,680,000 409,500 Concerts/Music Festival 110,000 $1.75 1.00 $192,500 16,844 Pac- 12 Championship 72,000 $45.00 3.00 $9,720,000 850,500 College Bowl Game 55,000 $45.00 3.00 $7,425,000 649,688 High School Championship 20,000 $1.75 1.00 $35,000 3,063 ESPN X Games 120,000 $1.75 1.00 $210,000 18,375 International Soccer Matches 144,000 $1.75 1.00 $252,000 22,050 Chivas Friendlies 55,000 $1.75 1.00 $96,250 8,422 Galaxy Friendlies 55,000 $1.75 1.00 $96,250 8,422 Boxing 50,000 $45.00 2.00 $4,500,000 393,750 NFL Pro Bowl 72,000 $45.00 2.00 $6,480,000 567,000 Motor Sports 270,000 $2.50 1.00 $675,000 59,063 Rodeo/PBR 180,000 $1.75 1.00 $315,000 27,563 Mega-Event1 152,500 $45.00 5.00 $34,312,500 3,002,344
Subtotal 68,989,500 6,036,581
Public AssembliesCitywide Conventions 480,000 $14.92 2.30 $16,469,280 1,441,062 Trade Shows/Consumer Show 720,000 $4.48 1.50 $4,833,376 422,920 Religious Events 300,000 $1.75 1.00 $525,000 45,938 Community Events 80,000 $0.00 1.00 $0 - Mega Events2 48,000 $45.00 1.00 $2,160,000 189,000
Subtotal 23,987,656 2,098,920
Reatil Complex @$515/ Sq. Ft. net of event spending 257,500,000 22,531,250
Total 350,477,156 30,666,751
Source: DAMI, PKF, MR+E
Table IV-7Off-Site Sales Taxes
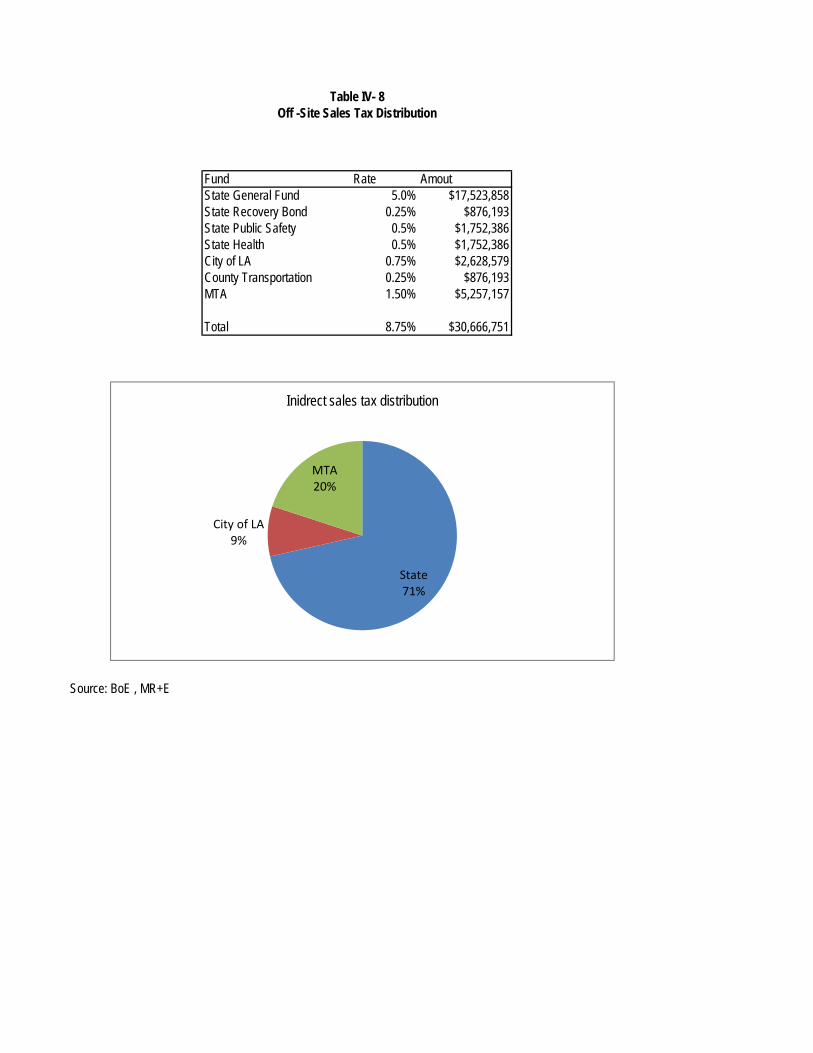
Fund Rate AmoutState General Fund 5.0% $17,523,858State Recovery Bond 0.25% $876,193State Public Safety 0.5% $1,752,386State Health 0.5% $1,752,386City of LA 0.75% $2,628,579County Transportation 0.25% $876,193MTA 1.50% $5,257,157
Total 8.75% $30,666,751
State $21,904,822City of LA $2,628,579MTA $6,133,350
$30,666,751
Source: BoE , MR+E
Table IV- 8Off -Site Sales Tax Distribution
State71%
City of LA9%
MTA20%
Inidrect sales tax distribution
Average Daily Rate1 $114.39LA Transient Occupancy Tax rate 14%
Total Room Generation Number of Occupied
Attendance Rate Attendees Vistor Days RoomsSpectator Events
NFL Games 1,872,000 1 per 74 1.00 25,297 Concerts/Music Festival 110,000 1 per 50 1.00 2,200 Pac- 12 Championship 72,000 1 per 10 3.00 21,600 College Bowl Game 55,000 1 per 4 3.00 41,250 High School Championship 20,000 1 per 25 1.00 800 ESPN X Games 120,000 1 per 15 1.00 8,000 International Soccer Matches 144,000 1 per 75 1.00 1,920 Chivas Friendlies 55,000 1 per 25 1.00 2,200 Galaxy Friendlies 55,000 1 per 25 1.00 2,200 Boxing 50,000 1 per 10 2.00 10,000 NFL Pro Bowl 72,000 1 per 5 2.00 28,800 Motor Sports 270,000 1 per 250 1.00 1,080 Rodeo/PBR 180,000 1 per 200 1.00 900 Mega-Event1 152,500 1 per 3.5 5.00 217,857
Subtotal 3,227,500 364,104
Public Assemblies
Citywide Conventions 480,000 1 per 6.9 2.30 160,000 Trade Shows/Consumer Shows 720,000 1 per 8 1.50 135,000 Religious Events 300,000 1 per 65 1.00 4,615 Community Events 80,000 1 Per 135 1.00 593 Mega Events2 48,000 1 per 3.5 1.00 13,714
Subtotal 1,628,000 313,922
Total 678,027
Aggregate ADR $77,559,475
TOT Collected $10,858,326
1) LA INC. Travel Pulse 1/12Source: JW Marriott, MR+E and PKF
Table IV- 9Transient Occupancy Tax
MR+E
AEG Special Events Center Market Impacts IV-17
Parking tax
The City of Los Angeles levies a 10% parking tax on all automobile parking facilities. Based on the trip generation
rates supplied by the project DEIR shown on Table IV-10. the project is anticipated to generate $47.4 million in
aggregate parking expenditures. This would yield over $4.7 million per year to the general fund accounts of the City
of Los Angeles.
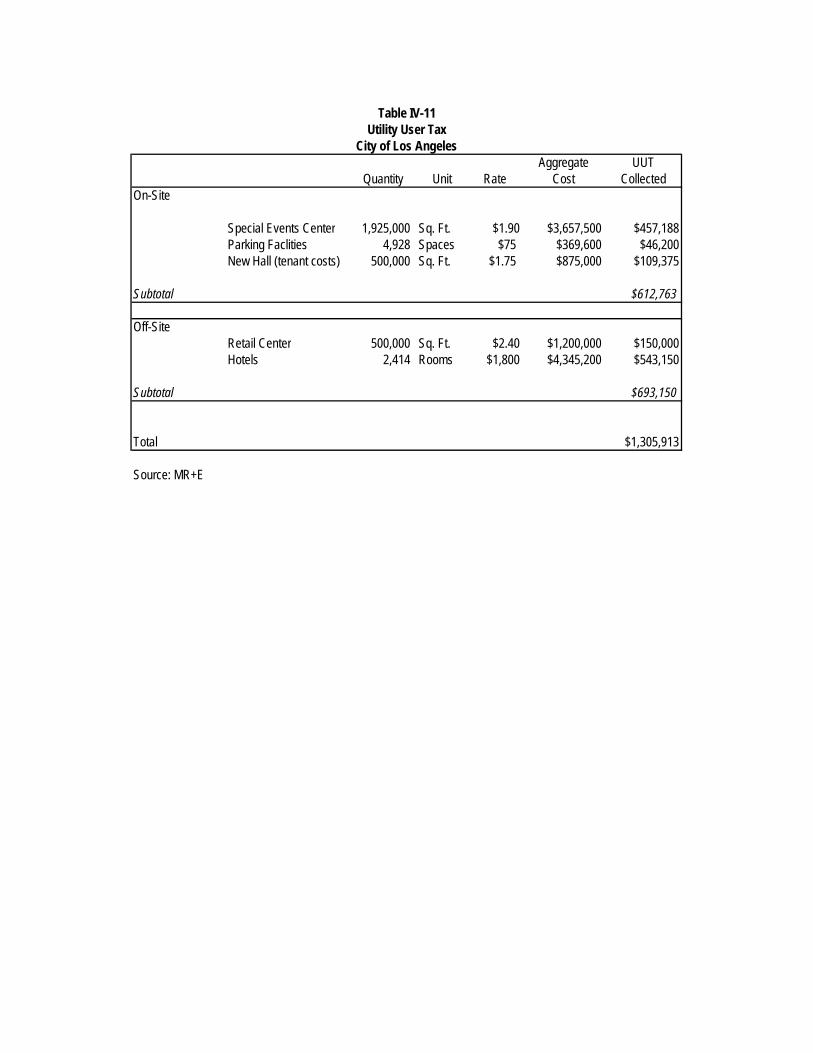
Utility user tax
The City of Los Angeles levies a utility user tax (UUT) on electricity gas and telephone use at all addresses in LA.
On-site generation of UUT will come primarily from the consumption of electricity at the special events center as well
as utilities by exhibitors and attendees at New Hall. Using an average annual rate of utility consumption of $1.90 per
sq. ft. the SEC can be anticipated to generate over $415,000 worth of annual UUT revenue for the City of Los
Angeles. Off-site consumption of utilities at the retail center and the incremental additional hotel rooms is estimated
at just over $693,000 per year yielding a total estimated UUT levy of $1.3 million in net new revenue to the city's
general fund accounts. Table IV-11 shows the generation rates aggregate cost and total yield for this category of
revenue.
Business license tax
Los Angeles municipal code provides for a gross receipts tax on business operations located within the city. The
primary source of business license assessments from on-site activities would stem from operations of the two NFL
teams and other event operations. The internal financial operations of an NFL franchise are notoriously difficult for
outsiders to gain access to. However, in their preliminary planning AEG estimates gross receipts of $262 million on
team and stadium operations for each team. The sum of the value of the other event operators is based on 40% of
the NFL operating gross receipts. Gross receipts of retail sales are based on estimates of on-site retail sales by
category of user. Direct off-site business license tax is based on the aggregate ADR of the hotels and sales per
square foot of the retail center combined on and off-site direct activities are estimated to generate over $2.1 million
per year to general fund revenues the City of Los Angeles. This assumes that the new business exemption will expire
on 12/31/12 as currently scheduled. The derivation of this estimate is shown on Table IV-12.

Average Parking Rate $18Total on Site Spaces 10,238LA Parking Occupancy Tax Rate 10%
Total OccupiedSpaces
Annual Parking Generation 5,276,188 Vehicles1
2,638,094 Occupied SpacesAggregate Parking $47,485,692
Parking Tax Collected $4,748,569
1) Per EIR transportation demand estimates
Source:The Mobility Group and MR+E
Table IV-10Parking Tax
Aggregate UUTQuantity Unit Rate Cost Collected
On-Site
Special Events Center 1,925,000 Sq. Ft. $1.90 $3,657,500 $457,188Parking Faclities 4,928 Spaces $75 $369,600 $46,200New Hall (tenant costs) 500,000 Sq. Ft. $1.75 $875,000 $109,375
Subtotal $612,763
Off-SiteRetail Center 500,000 Sq. Ft. $2.40 $1,200,000 $150,000Hotels 2,414 Rooms $1,800 $4,345,200 $543,150
Subtotal $693,150
Total $1,305,913
Source: MR+E
Table IV-11Utility User Tax
City of Los Angeles

Gross TaxReceipts Rate Receipts
OnsiteNFL and Stadium Operations $524,000,000 0.002550 $1,336,200Other Event Operations $209,600,000 0.002550 $534,480Retail Sales $85,763,725 0.001270 $108,920
Subtotal $1,979,600
Off Site
Retail Center $30,666,751 0.001270 $38,947Hotels $77,559,475 0.001270 $98,501
Subtotal $137,447
Total $2,117,047
Source: MR+E
Table IV-12City of Los Angeles
Business License Tax
MR+E
AEG Special Events Center Market Impacts IV-22
Summary and implications
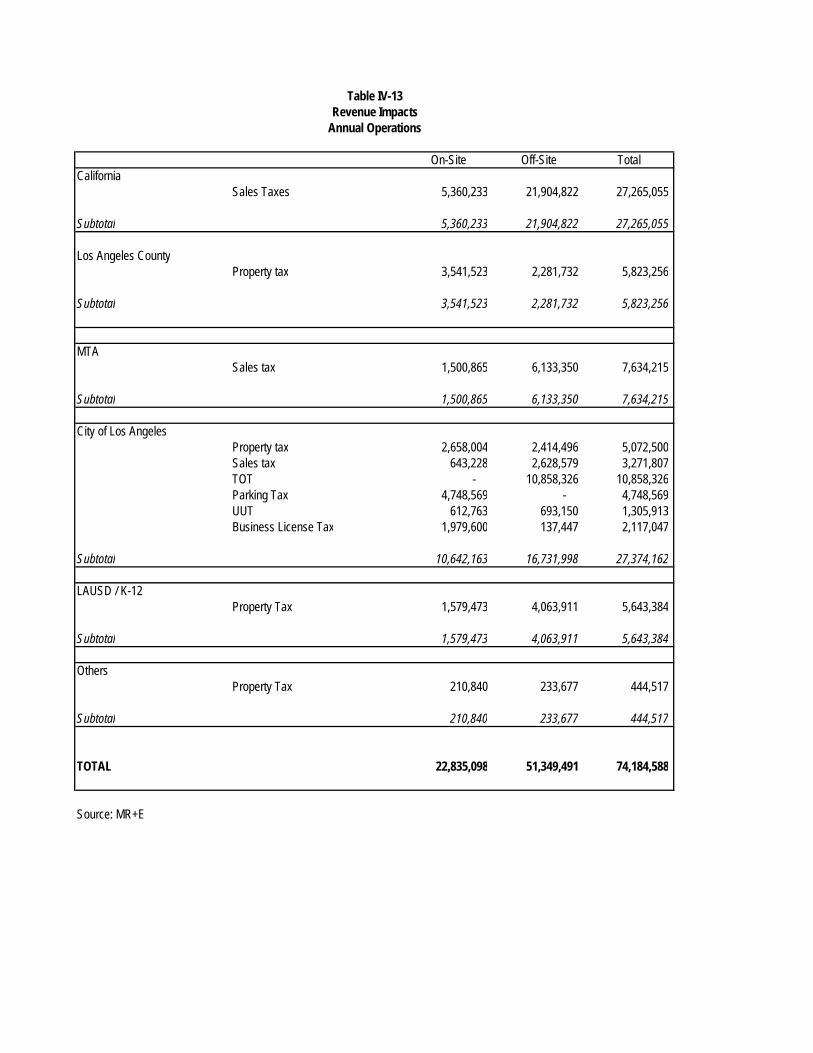
Table IV-13 summarizes the revenue impacts from all sources for activities at Project for a stable operating year.
This includes both direct on-site impacts as well as off-site impacts that are directly attributable to activities at the
Project. It is important to note that these off-site impacts are direct primary impacts (that is to say they are not
forecast based on economic multipliers representing secondary rounds of expenditure), but are referred to as off-site
due to the location where the taxable event would take place.
On an ongoing annual operating basis, the project can be anticipated to contribute over $74.1 million in both on and
off-site impacts to all of the relevant jurisdictions with authority over the project. The total amount is comprised of
$22.8 million of on-site impacts and $51.3 million of off-site impacts.
The largest recipient of on-site impacts is the City of Los Angeles with an estimated $10.6 million in revenue
generated by activities that occur directly at the Project. These revenues are made up of a mix of property, sales and
business activity taxes that are detailed in the supporting tables. The City of Los Angeles’ primary source of off-site
impacts comes from hotel transient occupancy tax that is forecast to occur based on events at the Project. The City
of Los Angeles is forecast to be the largest recipient of revenue from the project’s total on and off site operations,
which are forecast to contribute over $27.3 million per year on an annual recurring basis to the city’s general fund.
On-Site Off-Site TotalCalifornia
Sales Taxes 5,360,233 21,904,822 27,265,055
Subtotal 5,360,233 21,904,822 27,265,055
Los Angeles CountyProperty tax 3,541,523 2,281,732 5,823,256
Subtotal 3,541,523 2,281,732 5,823,256
MTASales tax 1,500,865 6,133,350 7,634,215
Subtotal 1,500,865 6,133,350 7,634,215
City of Los AngelesProperty tax 2,658,004 2,414,496 5,072,500 Sales tax 643,228 2,628,579 3,271,807 TOT - 10,858,326 10,858,326 Parking Tax 4,748,569 - 4,748,569 UUT 612,763 693,150 1,305,913 Business License Tax 1,979,600 137,447 2,117,047
Subtotal 10,642,163 16,731,998 27,374,162
LAUSD / K-12Property Tax 1,579,473 4,063,911 5,643,384
Subtotal 1,579,473 4,063,911 5,643,384
OthersProperty Tax 210,840 233,677 444,517
Subtotal 210,840 233,677 444,517
TOTAL 22,835,098 51,349,491 74,184,588
Source: MR+E
Table IV-13Revenue Impacts
Annual Operations
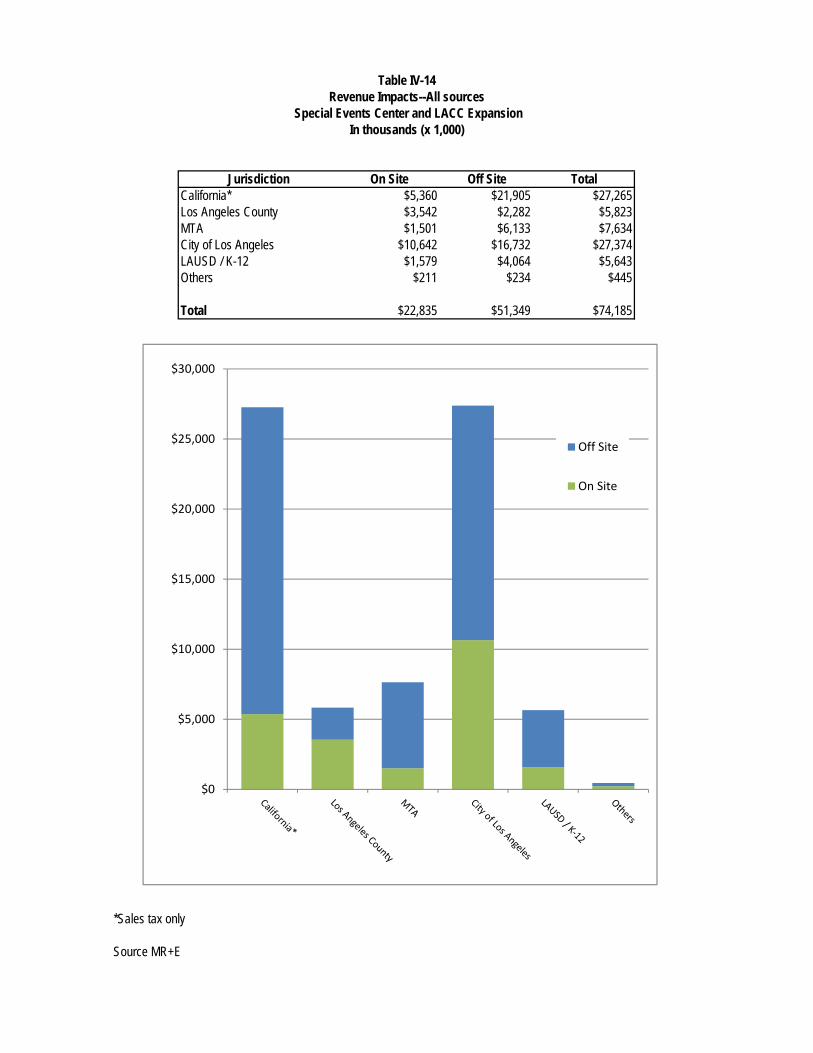
Jurisdiction On Site Off Site TotalCalifornia* $5,360 $21,905 $27,265Los Angeles County $3,542 $2,282 $5,823MTA $1,501 $6,133 $7,634City of Los Angeles $10,642 $16,732 $27,374LAUSD / K-12 $1,579 $4,064 $5,643Others $211 $234 $445
Total $22,835 $51,349 $74,185
Source:MR+E
*Sales tax only
Source MR+E
Table IV-14Revenue Impacts--All sources
Special Events Center and LACC ExpansionIn thousands (x 1,000)
$0
$5,000
$10,000
$15,000
$20,000
$25,000
$30,000
Off Site
On Site

MR+E
AEG Special Events Center Market Impacts VI-1
Section V Economic Impacts
Introduction
This section considers the effects of construction and operations of the project on the regional economy of Los
Angeles. Economic impacts are distinct from fiscal impacts in that they measure the likely future effects of the project
on the general economy in terms of output, earnings by households and supportable employment positions. The
forecasts discussed in this section include both consideration of on-site activities, as well as the anticipated off-site
effects generated by attendance at spectator and public events at the project. Details on the derivation of levels of
economic activity have been held consistent between the economic and fiscal impact analyses.
Economic Impact Approach
In examining the economic impacts of the Project, a regional input-output (I/O) analysis approach can be seen as the
most effective method for understanding the impacts of new economic activities. In this approach, new activities are
treated as exogenous shocks to the regional economy. In other words, changes to the local economy are taken as
gross impacts that have an effect on the existing industrial structure of the County.
Input-Output Models
The basic principle behind a regional input-output analysis is to identify and disaggregate all of the absolute flows of
expenditures between final demand and the industries which supply intermediate inputs. This is represented in terms
of technical coefficients which represent the requirements of a particular activity to deliver a unit of final demand to
the market.
Examining these technical relationships of production has a long lineage in economic thinking and is a valid method
in approaching regional impacts of specific projects. Pioneering work done in operationalizing these relationships
was undertaken by Wassilly Leontief and the development of the input-output model which began in the late 1930s,
which would eventually be recognized with a Nobel Prize in Economics in 1973. Essentially, the input-output model
allows for analysis of relationships between sectors in the economy by exposing the sectoral interdependence of
commodity production. The coefficients in an input-output matrix serve as a “snapshot” of the state of technology
that is being deployed for commodity production, by showing the amounts and types of inputs that are required to
produce a given output. A regional industry-by-industry total requirements table is prepared by calculating a Leontief
of inverse from the regional direct requirements. In input-output methodology, the multipliers account for the sum of
the direct and indirect and induced effects of a change in final demand.
MR+E
AEG Special Events Center Market Impacts VI-2
Input-output analysis is chosen in this type of analysis because it is considered to be more precise and flexible than
the economic impacts analysis approaches including the economic base approach, which measures how changes in
final demand influence a region’s exports of goods and services, or a regional income account approach, which is a
scaled-down version of the Keynesian macro-economic analysis approach, which measures economic growth as
stemming primarily from increases in personal income. In general, input-output analysis is a preferred method for
analyzing local-scale or region-wide changes in large and complex economies such as Los Angeles. The
advantages of this approach include the following:
Equal comparison between policy options. By using input-output analysis, it is possible to measure the
effects in equal terms between one project and another, or between the project and a no-build option.
The approach accounts for the specific project that is being analyzed. The input-output analysis takes
into account the specificity of the type of projects and the goods and services that are being produced, and it
provides specific estimates related to the qualitative differences between different types of investments.
This allows for an analysis of the specific economic activities being undertaken and their regional effects.
Captures macro-economic changes. The input-output analysis is effective in a large and mature regional
economy where even large-scale investments may only represent a very small marginal growth in the
context of the overall regional economy. Despite the fact that the investments may be limited, they will still
have economic impacts. They can be determined through an approach that focuses on the specific qualities
of the investment rather than treating it in an aggregate form.
RIMS II
This analysis is based in an input output (I/O) method of forecasting indirect, induced and total effects of both the
construction period and annual ongoing operations of the Project. This accounts for the economic impacts of both the
initial investment and the additional rounds of economic activities that are caused by the first round expenditure (this
is the “multiplier” effect). The US Dept of Commerce, Bureau of Economic Analysis (USBEA) RIMS II model was
used as the basis of these forecasts. RIMS II produces a distinctive and specific set of multipliers for each economic
region being investigated. That is to say, the multipliers produced by the model are tied to the economic base of the
region, and given the diversity of industrial sectors that are existent in any one geographic area, will yield different,
and in some cases dramatically different, multiplier numbers.
It is important to recognize that there is no one single multiplier number for an industry that can be applied broadly in
any geographic area. But rather, each multiplier is specific to the economy of the region which is being investigated.
The multipliers are reflective of the indigenous capacity of the local economy to serve final demand in the industry
MR+E
AEG Special Events Center Market Impacts VI-3
(i.e., provide all of the inputs) less any net leakages from outside the economy (i.e., goods or services that must be
imported into Los Angeles County wherein the production and value added takes place elsewhere).
Using RIMS II for economic impact analysis has several advantages. RIMS II multipliers can be estimated for any
region composed of one or more counties, and for any industry or group of industries in the national I/O table. RIMS
II is widely used in both the public and private sectors and is in many respects an industry standard model for the
estimation of economic impacts. According to empirical tests, the estimates based on RIMS II are similar in
magnitude to the estimates based upon custom-made and user-specific surveys.1
Economic impacts are reported as follows:
Direct expenditures This represents the direct costs for goods and services required for a unit of final demand. In
this case it includes capital construction cost, professional services included in soft costs and the costs for goods and
services during the operations of the building. Not included are economic rents such as fees and profits.
Indirect output Based on multipliers specific to Los Angeles County provided by RIMS II, the tables report the
secondary and induced increases in economic activity (output) generated by the direct expenditures in each sector.
This is the multiplier effect.
Total Output This is the combined value of the initial direct expenditure along with the indirect effects
Earnings This represents the total wages received by households in the County based on both the direct and indirect
effects
Employment This represents the fulltime equivalent annual employment supported by the total output requirements.
For the construction period these jobs occur only during the construction phase for operations these are annual
recurring positions.
1 See Sharon M. Brucker, Steven E. Hastings, and William Lathan, III, the “Variation of Estimated Impacts from Five Regional
Input/Output Models,” International Regional Science Review, 13 (1990: 119-139.)
MR+E
AEG Special Events Center Market Impacts VI-4
Assumptions in the Model
It is important to recognize the following broad assumptions that are at the basis of this economic impact analysis.
Specific assumptions will be detailed in the appendix to this report which includes a summary table of project
assumptions, but the broad methodological issues include the following:
All impacts discussed in this analysis represent gross economic impacts rather than marginal impacts.
All investments are treated as exogenous inputs the regional economy.
The monetary amounts shown here are in constant dollars based on projected performance of the project.
One primary region of influence is used in this analysis-- Los Angeles County. Because there is a free
movement of goods and labor throughout the entire metropolitan area, these impacts may be felt throughout
the broader metropolitan region.
Operation impacts are treated as annually recurring impacts.
Construction impacts are treated as one-time impacts which take place over the course of the construction
of the entire project
Economic Impacts
Economic impacts associated with each element of the project are described in this section. For each component of
the project, both the on-site program elements such as the special event center, parking structures and LACC
expansion, and the direct off-site components including new hotel and retail development, are presented for both a
one-time construction period impact and the annual recurring operations impact.
Special events center
With an anticipated capital budget of $829.8 million, the construction impacts of the special event center will
represent a significant investment in the local economy, and will support increases in output and employment based
on the scale of the capital construction itself. Table V-1 provides an overview of the forecasted economic impacts for
the SEC. During construction this portion of the project can be expected to support over 5,200 direct FTE positions
with an average annual wage of $55,000. The secondary impacts of this activity will yield an additional $428.9 million
in added output the local economy and support an additional 2,700 FTE positions throughout Los Angeles during the
construction. In total the physical development of the SEC can be expected to generate over $1.2 billion in output for
the Los Angeles economy that would support over $362 million in earnings and more than 7,900 FTE positions.
In terms of operations the SEC will generate economic activity based on attendance at spectator events as well as
the costs associated with NFL and spectator event operations. An important source of FTE employment will be
contingent labor that's employed over the course of an event day.
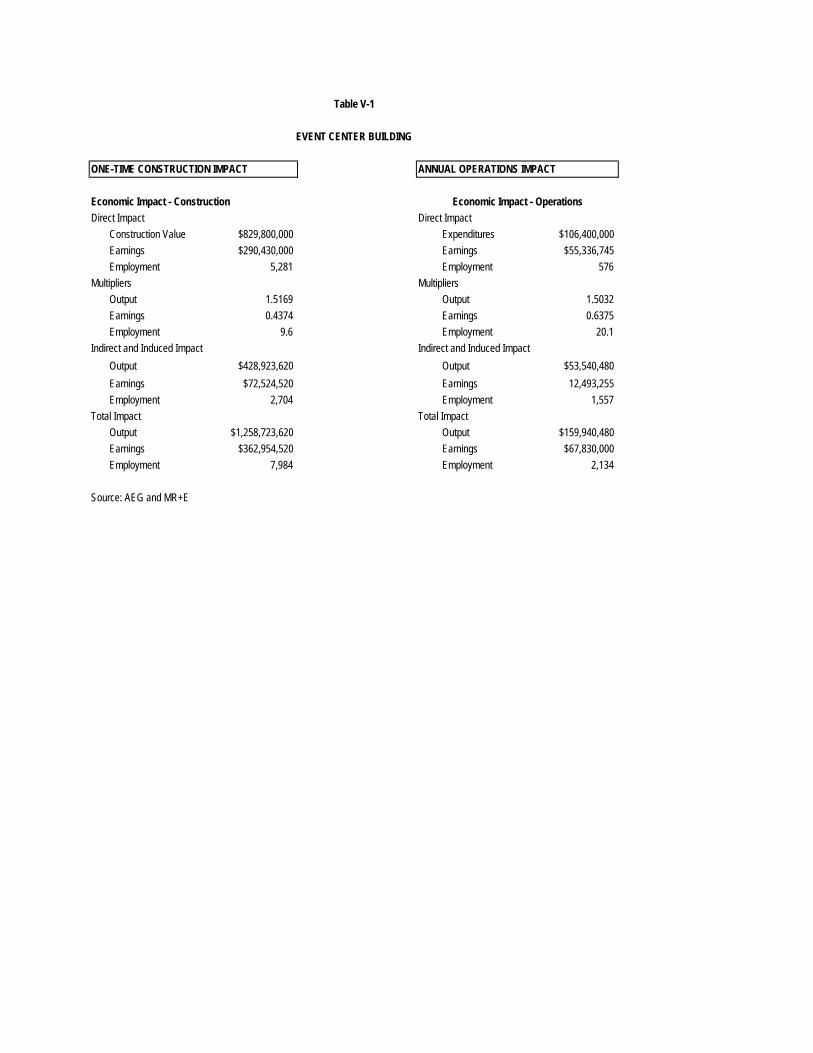
ONE-TIME CONSTRUCTION IMPACT ANNUAL OPERATIONS IMPACT
Economic Impact - Construction
Direct Impact Direct Impact
Construction Value $829,800,000 Expenditures $106,400,000
Earnings $290,430,000 Earnings $55,336,745
Employment 5,281 Employment 576
Multipliers Multipliers
Output 1.5169 Output 1.5032
Earnings 0.4374 Earnings 0.6375
Employment 9.6 Employment 20.1
Indirect and Induced Impact Indirect and Induced Impact
Output $428,923,620 Output $53,540,480
Earnings $72,524,520 Earnings 12,493,255
Employment 2,704 Employment 1,557
Total Impact Total Impact
Output $1,258,723,620 Output $159,940,480
Earnings $362,954,520 Earnings $67,830,000
Employment 7,984 Employment 2,134
Source: AEG and MR+E
Economic Impact - Operations
Table V-1
EVENT CENTER BUILDING
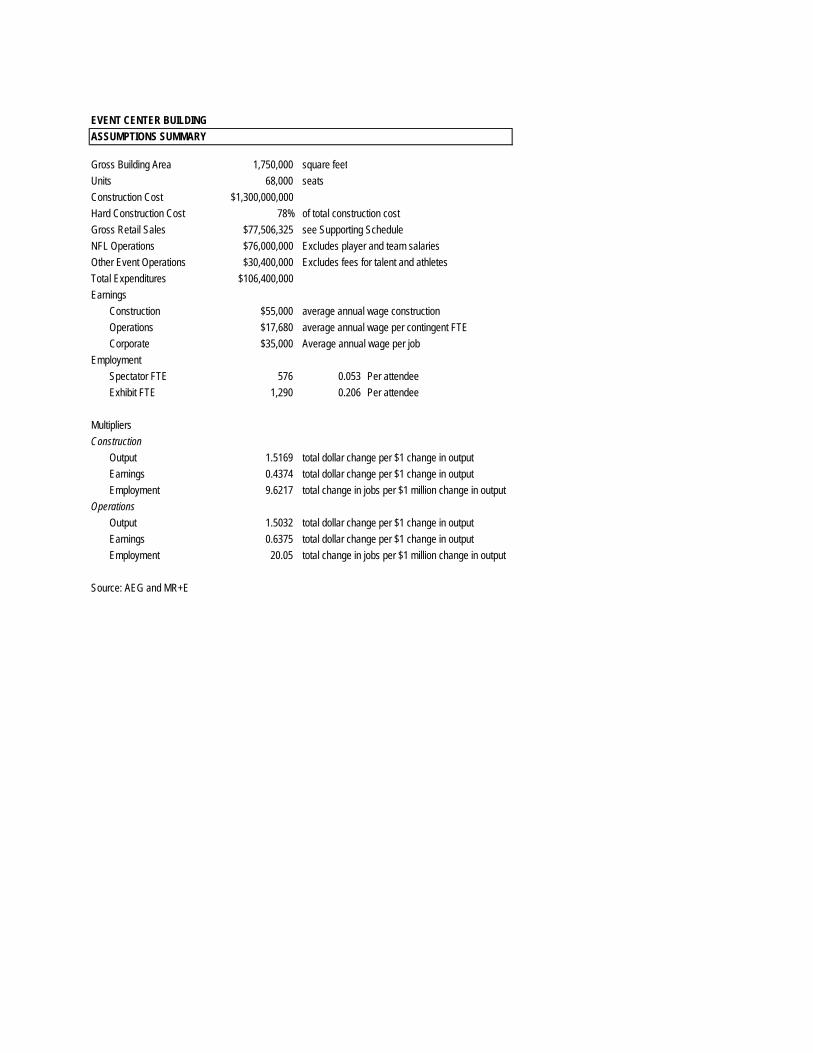
EVENT CENTER BUILDING
ASSUMPTIONS SUMMARY
Gross Building Area 1,750,000 square feet
Units 68,000 seats
Construction Cost $1,300,000,000
Hard Construction Cost 78% of total construction cost
Gross Retail Sales $77,506,325 see Supporting Schedule
NFL Operations $76,000,000 Excludes player and team salaries
Other Event Operations $30,400,000 Excludes fees for talent and athletes
Total Expenditures $106,400,000
Earnings
Construction $55,000 average annual wage construction
Operations $17,680 average annual wage per contingent FTE
Corporate $35,000 Average annual wage per job
Employment
Spectator FTE 576 0.053 Per attendee
Exhibit FTE 1,290 0.206 Per attendee
Multipliers
Construction
Output 1.5169 total dollar change per $1 change in output
Earnings 0.4374 total dollar change per $1 change in output
Employment 9.6217 total change in jobs per $1 million change in output
Operations
Output 1.5032 total dollar change per $1 change in output
Earnings 0.6375 total dollar change per $1 change in output
Employment 20.05 total change in jobs per $1 million change in output
Source: AEG and MR+E
MR+E
AEG Special Events Center Market Impacts VI-8
Using a factor of one contingent worker per 19 attendees (a factor based on analysis by the NFL Players Association
on economic activity at NFL venues) and assuming 260 days of work equivalent to one FTE position, spectator
events at the SEC can be anticipated to support 576 direct FTE positions based on anticipated attendance levels.
Economic impact will also be supported by the direct requirements of NFL and event operations. Excluding player
and team salaries each NFL team is anticipated to generate expenditures of $38 million for a total of $76 million per
year in direct team spending. Other event operations are estimated at $30.4 million exclusive of performer and
athlete fees. These operations expenditures are further supported by an on-site retail sales of $77.5 million as was
discussed in the fiscal impact section. In total annual operations at the SEC can be anticipated to support over $106
million in annual expenditures on a recurring operating basis. These direct expenditures can be anticipated to
support an additional $53.5 million in additional output and support an additional 1,557 FTE positions.
In total the annual operations impact of the SEC is estimated at $159.9 million in output supporting 2,134 FTE
positions with earnings of over $67.8 million per year.
Parking
The project anticipates construction of over 4,000 parking spaces on site. This represents a construction value of
$75.7 million. The effect of this construction will be to directly support for 421 FTE positions with earnings of over
$23 million during the construction period. This activity can in turn be anticipated to induce an additional $39 million
with output throughout the regional economy supporting 307 FTE positions with earnings of over $9.9 million. The
total forecast construction impact of parking construction is an increase in output of $114.8 million supporting 728
FTE positions with earnings of $33.1 million.
Operations impacts will also occur from the parking facilities. Assuming a fixed operating cost of $200 per space per
year the parking facility will require over $1.2 million in annual expenditures for maintenance and operations and the
facility will require 31 FTE positions per year. This in turn can be anticipated to support an additional $685,000 in
increased output and an additional eight FTE positions with earnings of just under $240,000.
In total the parking program associated with the project can be anticipated to generate $1.9 million in output
supporting 38 FTE positions with earnings of $791,000 in annual recurring basis. This is summarized on table V-2
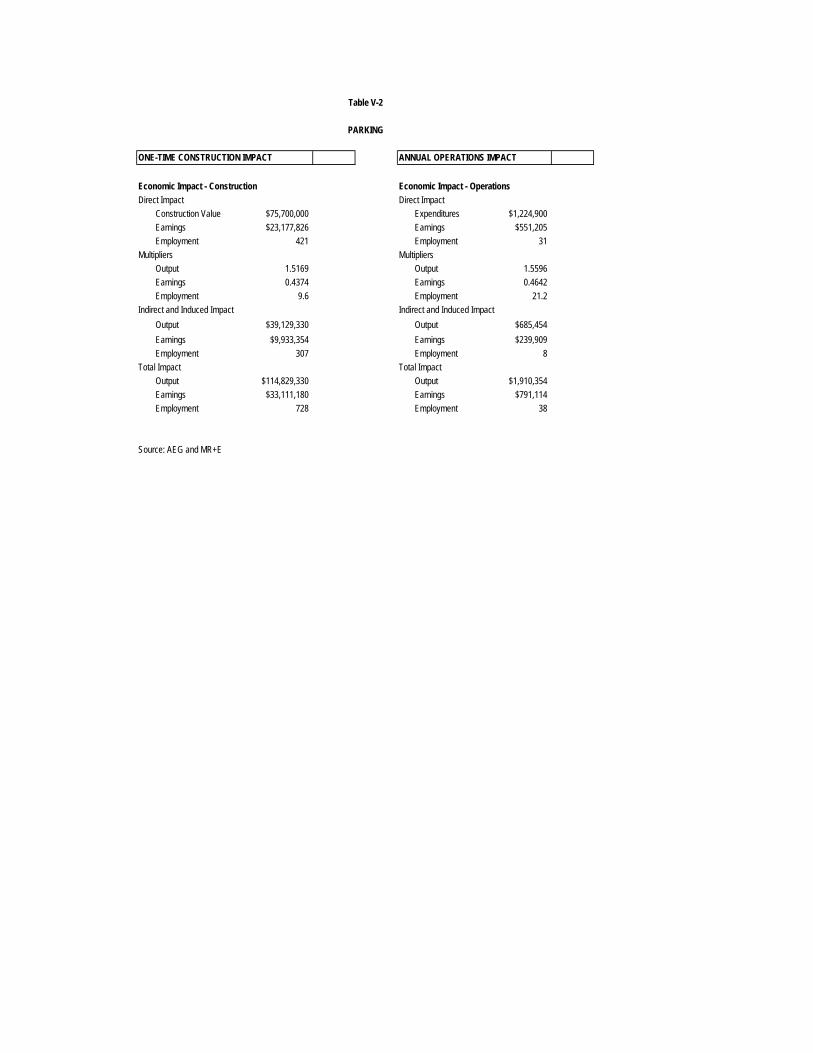
ONE-TIME CONSTRUCTION IMPACT ANNUAL OPERATIONS IMPACT
Economic Impact - Construction Economic Impact - Operations
Direct Impact Direct Impact
Construction Value $75,700,000 Expenditures $1,224,900
Earnings $23,177,826 Earnings $551,205
Employment 421 Employment 31
Multipliers Multipliers
Output 1.5169 Output 1.5596
Earnings 0.4374 Earnings 0.4642
Employment 9.6 Employment 21.2
Indirect and Induced Impact Indirect and Induced Impact
Output $39,129,330 Output $685,454
Earnings $9,933,354 Earnings $239,909
Employment 307 Employment 8
Total Impact Total Impact
Output $114,829,330 Output $1,910,354
Earnings $33,111,180 Earnings $791,114
Employment 728 Employment 38
Source: AEG and MR+E
Table V-2
PARKING
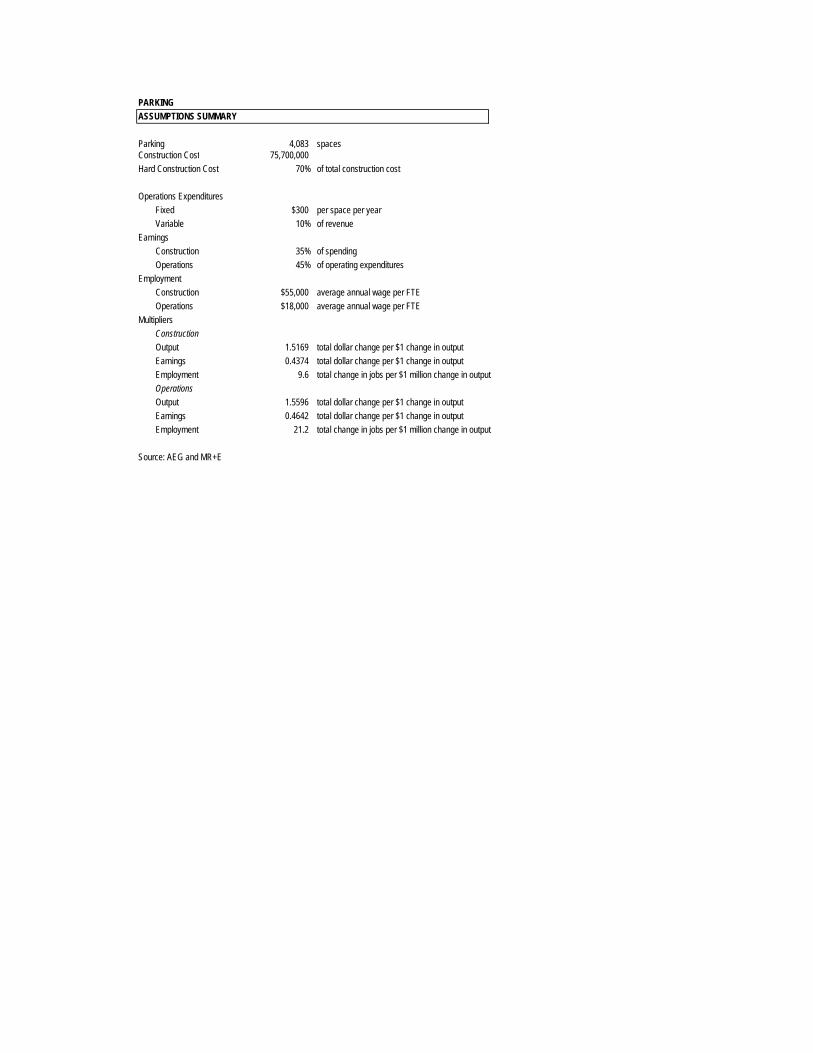
PARKING
ASSUMPTIONS SUMMARY
Parking 4,083 spacesConstruction Cost 75,700,000
Hard Construction Cost 70% of total construction cost
Operations Expenditures
Fixed $300 per space per year
Variable 10% of revenue
Earnings
Construction 35% of spending
Operations 45% of operating expenditures
Employment
Construction $55,000 average annual wage per FTE
Operations $18,000 average annual wage per FTE
Multipliers
Construction
Output 1.5169 total dollar change per $1 change in output
Earnings 0.4374 total dollar change per $1 change in output
Employment 9.6 total change in jobs per $1 million change in output
Operations
Output 1.5596 total dollar change per $1 change in output
Earnings 0.4642 total dollar change per $1 change in output
Employment 21.2 total change in jobs per $1 million change in output
Source: AEG and MR+E
MR+E
AEG Special Events Center Market Impacts VI-11
New Hall
As with the other components of the project, New Hall will generate economic activity from both construction and
operations. With an estimated construction value of $215.4 million, the facility can be anticipated to directly support
1,199 FTE positions of the course of the construction periods with earnings of $65.9 million. This direct economic
activity can be anticipated to support an additional 873 FTE positions with earnings of over $28.2 million and
contribution of $113.7 million in output to the regional economy. In total, construction of the facility can be
anticipated to support 2,073 FTE positions with earnings of over $94.2 million generating an output of over $326.7
million over the course of the construction period.
In terms of annual operations, increased activity the LACC will generate economic impacts based on the facilities
operations expenditures and on-site expenditures by event participants. Direct on-site expenditures are forecast at
$8.5 million per year as described in the fiscal impact section. This is supplemented by an estimate of $5.7 million
increased operations expenditures for the LACC based on its current operating budget with an increase of 28% to
reflect the increased capacity of the facility. In total this would produce an estimated $13.9 million in direct economic
activity per year at New Hall. This in turn can be anticipated to support 1,290 FTE positions with earnings over $6.2
million. The direct expenditures can be anticipated to indirectly support an additional $7.3 million in output 84 FTE
positions with earnings of over $2.5 million. As shown on table V-3 the total annual contribution to the regional
economy of New Hall operations are estimated to be $21.3 million and output which would support 1,374 FTE
positions with earnings over $8.8 million per year.
Off-site hotels
As with the fiscal impacts, economic impacts have been divided into two categories; direct on-site expenditures tied
to the project and direct off-site expenditures tied to project activities. The stimulation of new hotel development is a
key benefit of the project. Previous market analysis along with ongoing development proposals in downtown Los
Angeles which have been tied to project implementation lead to an estimate of the project yielding the development
of 2,414 new hotel rooms in the City of Los Angeles. These projects are anticipated to have the total capital cost of
just over $1 billion. Construction of these facilities will support over 4,500 FTE positions with earnings of over $248
million over the construction time span of the projects. This will in turn support an additional 3,235 FTE positions with
earnings of over $183 million. In total hotel construction can be anticipated to contribute $1.5 billion regional output
and support over 7,800 FTE positions through the completion of the development of the 2,414 rooms anticipated to
be stimulated by the project.
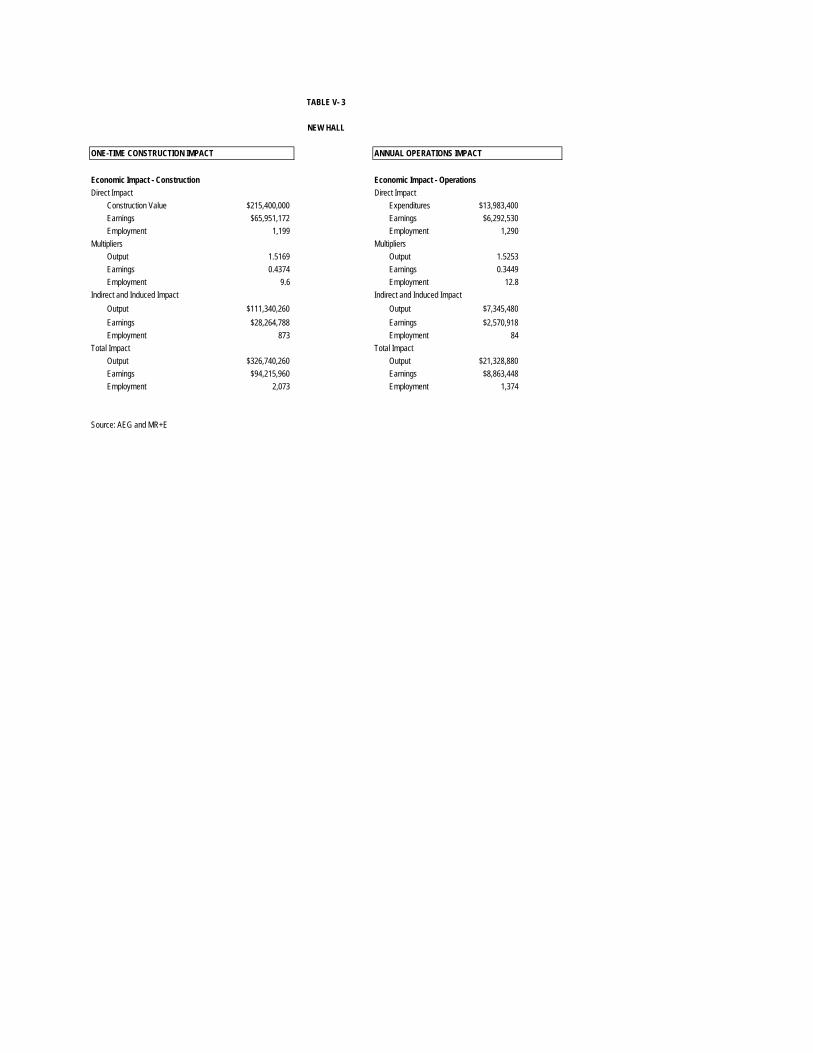
ONE-TIME CONSTRUCTION IMPACT ANNUAL OPERATIONS IMPACT
Economic Impact - Construction Economic Impact - Operations
Direct Impact Direct Impact
Construction Value $215,400,000 Expenditures $13,983,400
Earnings $65,951,172 Earnings $6,292,530
Employment 1,199 Employment 1,290
Multipliers Multipliers
Output 1.5169 Output 1.5253
Earnings 0.4374 Earnings 0.3449
Employment 9.6 Employment 12.8
Indirect and Induced Impact Indirect and Induced Impact
Output $111,340,260 Output $7,345,480
Earnings $28,264,788 Earnings $2,570,918
Employment 873 Employment 84
Total Impact Total Impact
Output $326,740,260 Output $21,328,880
Earnings $94,215,960 Earnings $8,863,448
Employment 2,073 Employment 1,374
Source: AEG and MR+E
TABLE V- 3
NEW HALL
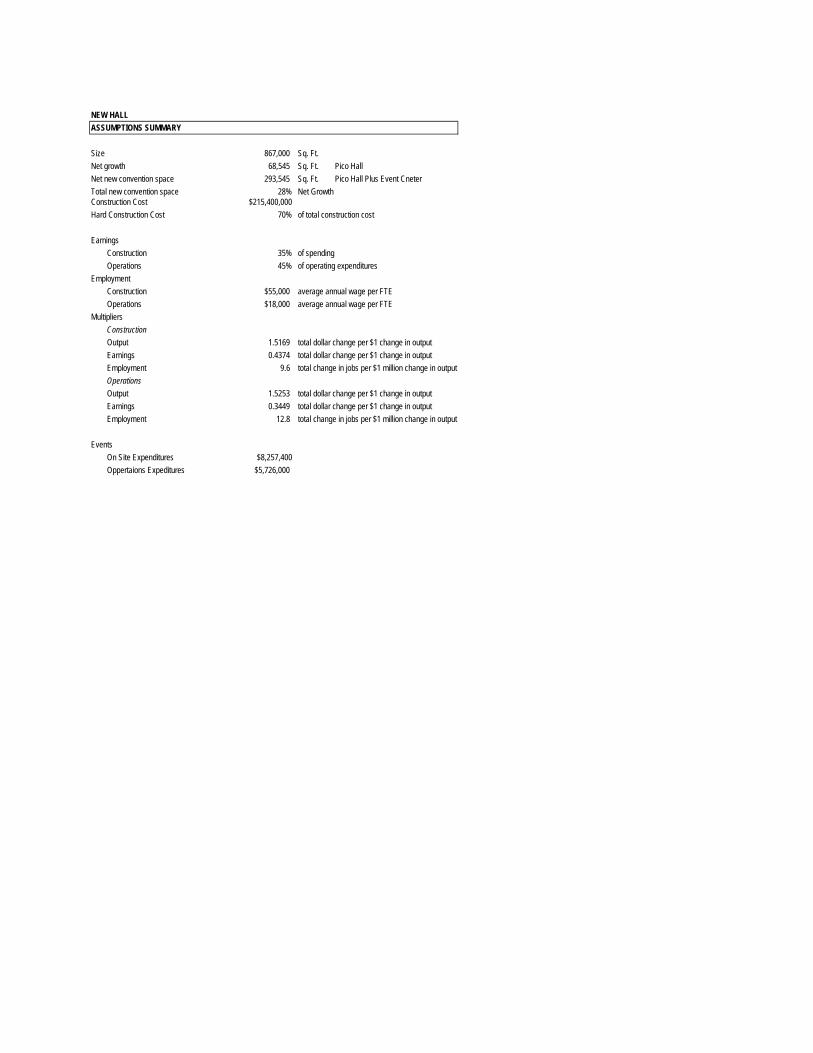
NEW HALL
ASSUMPTIONS SUMMARY
Size 867,000 Sq. Ft.
Net growth 68,545 Sq. Ft. Pico Hall
Net new convention space 293,545 Sq. Ft. Pico Hall Plus Event Cneter
Total new convention space 28% Net GrowthConstruction Cost $215,400,000
Hard Construction Cost 70% of total construction cost
Earnings
Construction 35% of spending
Operations 45% of operating expenditures
Employment
Construction $55,000 average annual wage per FTE
Operations $18,000 average annual wage per FTE
Multipliers
Construction
Output 1.5169 total dollar change per $1 change in output
Earnings 0.4374 total dollar change per $1 change in output
Employment 9.6 total change in jobs per $1 million change in output
Operations
Output 1.5253 total dollar change per $1 change in output
Earnings 0.3449 total dollar change per $1 change in output
Employment 12.8 total change in jobs per $1 million change in output
Events
On Site Expenditures $8,257,400
Oppertaions Expeditures $5,726,000

MR+E
AEG Special Events Center Market Impacts VI-15
Table V-4 shows the derivation of these estimates along with a forecast of annual operations impacts based on hotel
occupancy expenditures. These activities are expected to total over $101 million per year should be able to support
1,931 FTE positions with earnings of over $38 million. This in turn is anticipated to generate an additional $44.2
million and output $15.4 million in earnings supporting 504 FTE positions. In total the off-site hotels can be
anticipated to generate an increase of $145 million in output supporting 2,435 FTE positions with earnings of over
$54 million per year.
Off-site Retail
The economic impacts associated with off-site retail expenditures based on the estimated volume of retail sales
generated by the project as described and fiscal impacts is shown on table V-5. Construction of these facilities is
estimated at $87.5 million an amount that would support 435 FTE positions with earnings of over $23.9 million. This
would in turn support an additional $45.2 million in output generating 288 additional FTE positions with earnings of
$15.8 million. The total impact of construction required retail facilities would be $132.7 million in output supporting
723 FTE positions with earnings of $39.7 million.
Annual operations of the retail facilities that would result from the project would be $262.8 million per year. This
would directly support 1,250 FTE positions with earnings of $27.5 million. This direct expenditure would support an
additional $12 million in output supporting 137 positions with earnings of $4.2 million. In total direct off-site retail
expenditures can be expected to account for $275.8 million in output $31.7 million in earnings to households and
creating 1,387 FTE positions.
Summary and conclusions
The project can be anticipated to have significant positive impacts on the Los Angeles economy. With the direct
capital construction cost estimated at $1.1 billion, the project represents one of the largest private construction
projects that has been undertaken in the region in decades. In addition, the project represents a significant upgrade
to the hosting capacity of the LACC and through its operations has the opportunity to attract significant levels of new
visitation to Los Angeles. These benefits can be anticipated to occur as a result of on-site activities, associated with
spectator and public events as well as off-site by generating new hotel and retail development.
Construction
During the construction period, the project is forecast to directly support 6,901 FTE positions with earnings of over
$379 million. This activity can be expected to stimulate additional $110 million in output supporting over 3,800 FTE
positions with earnings of over $110 million throughout the economy of Los Angeles.
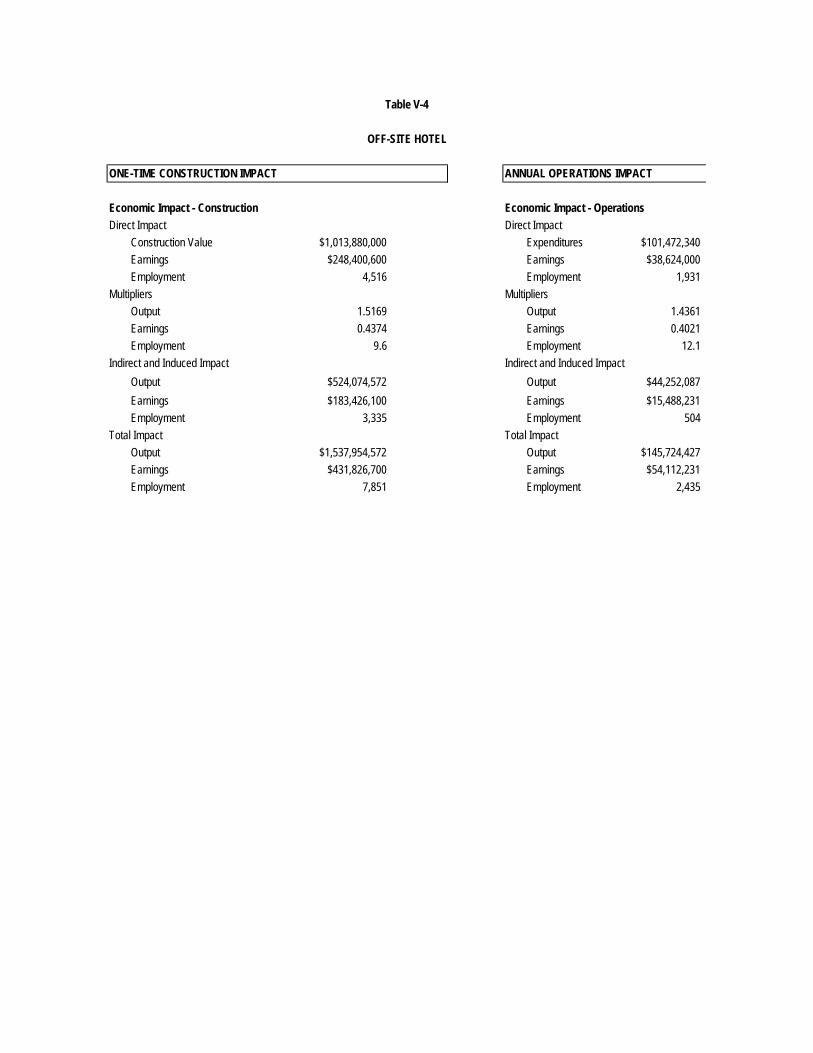
ONE-TIME CONSTRUCTION IMPACT ANNUAL OPERATIONS IMPACT
Economic Impact - Construction Economic Impact - Operations
Direct Impact Direct Impact
Construction Value $1,013,880,000 Expenditures $101,472,340
Earnings $248,400,600 Earnings $38,624,000
Employment 4,516 Employment 1,931
Multipliers Multipliers
Output 1.5169 Output 1.4361
Earnings 0.4374 Earnings 0.4021
Employment 9.6 Employment 12.1
Indirect and Induced Impact Indirect and Induced Impact
Output $524,074,572 Output $44,252,087
Earnings $183,426,100 Earnings $15,488,231
Employment 3,335 Employment 504
Total Impact Total Impact
Output $1,537,954,572 Output $145,724,427
Earnings $431,826,700 Earnings $54,112,231
Employment 7,851 Employment 2,435
Table V-4
OFF-SITE HOTEL
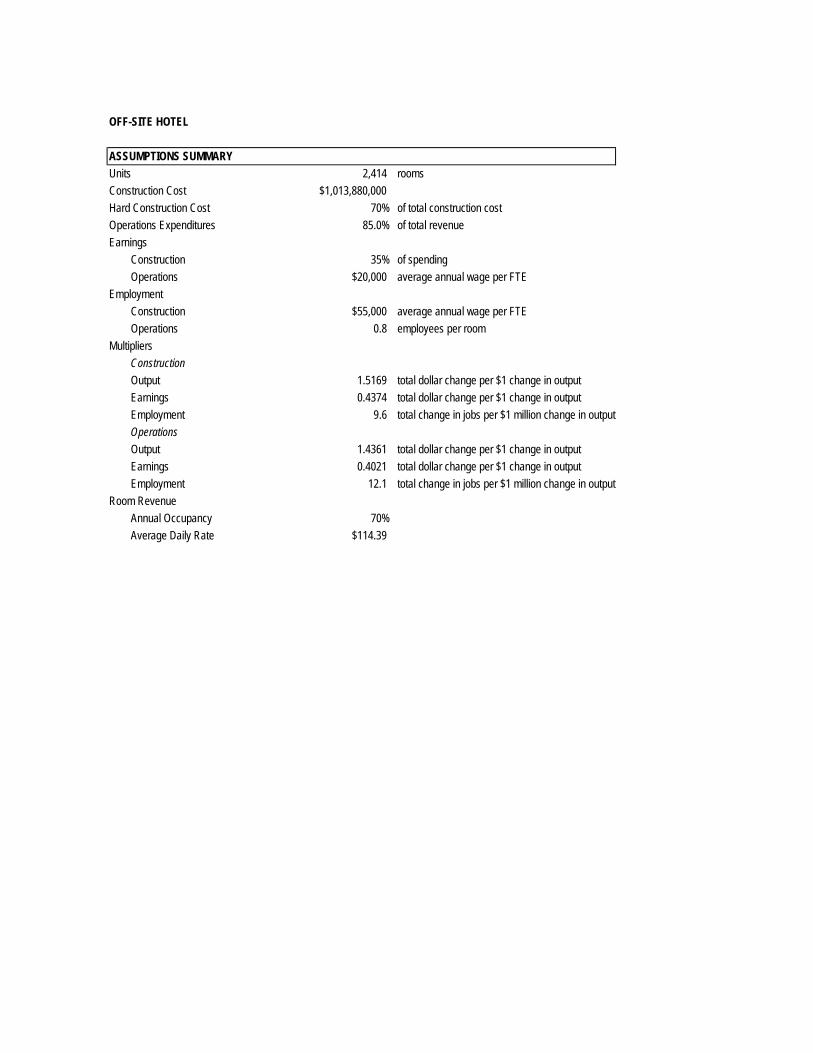
OFF-SITE HOTEL
ASSUMPTIONS SUMMARY
Units 2,414 rooms
Construction Cost $1,013,880,000
Hard Construction Cost 70% of total construction cost
Operations Expenditures 85.0% of total revenue
Earnings
Construction 35% of spending
Operations $20,000 average annual wage per FTE
Employment
Construction $55,000 average annual wage per FTE
Operations 0.8 employees per room
Multipliers
Construction
Output 1.5169 total dollar change per $1 change in output
Earnings 0.4374 total dollar change per $1 change in output
Employment 9.6 total change in jobs per $1 million change in output
Operations
Output 1.4361 total dollar change per $1 change in output
Earnings 0.4021 total dollar change per $1 change in output
Employment 12.1 total change in jobs per $1 million change in output
Room Revenue
Annual Occupancy 70%
Average Daily Rate $114.39

MR+E
AEG Special Events Center Market Impacts VI-19
Construction of the project itself can be anticipated to generate over $1.7 billion in output for the local economy
supporting 10,785 full-time equivalent positions with earnings of over $490.2 million.
In addition to this direct on-site construction impacts, the project will also stimulate additional development that will
contribute to economic output locally. In total the direct on and off-site economic impact associated with construction
of the project is expected to generate over $3.3 billion in output supporting over 19,000 FTE positions with earnings
of over $961 million over the construction period.
Operations
The combined operational impact of the project, including the impacts of spectator and public events along with
operations of parking facilities is anticipated to generate expenditures of over $121 million per year on site. This
direct on-site expenditure is anticipated to support 1,897 FTE positions with earnings of over $62 million. This initial
spending can be expected to support an additional $61.5 million in output generating just under 1,650 FTE jobs with
earnings of $15.3 million throughout the local economy. In total annual operations of the project itself can be forecast
to generate over $183 million in output throughout the Los Angeles economy supporting 3,546 FTE positions with
earnings of over $77 million per year.
Taking the direct off-site operations into account, including increased retail sales and hotel occupancy, the project
can be expected to generate over $485.9 million in annual expenditures. This activity would be able to support
nearly 5,080 jobs with earnings of over $128 million per year. This activity can be forecast to support $177.8 million
and output generating 2,290 FTE jobs with earnings of over $35 million.
In total, annual recurring operations of the project can be expected to generate over $485 million in direct
expenditures in Los Angeles. This activity will directly support nearly 5,080 jobs in the city with earnings of over $128
million. This activity will induce an additional hundred and $17.8 million in annual output supporting nearly 2,300 FTE
positions in the local economy providing over $35 million in earnings to area households. The combined effects of
the direct expenditures and their secondary effects are estimated to generate over $603 million in output for the Los
Angeles economy on an annual recurring basis. These expenditures are forecast to support approximately 7,370
FTE positions with earnings of over $163.3 million.
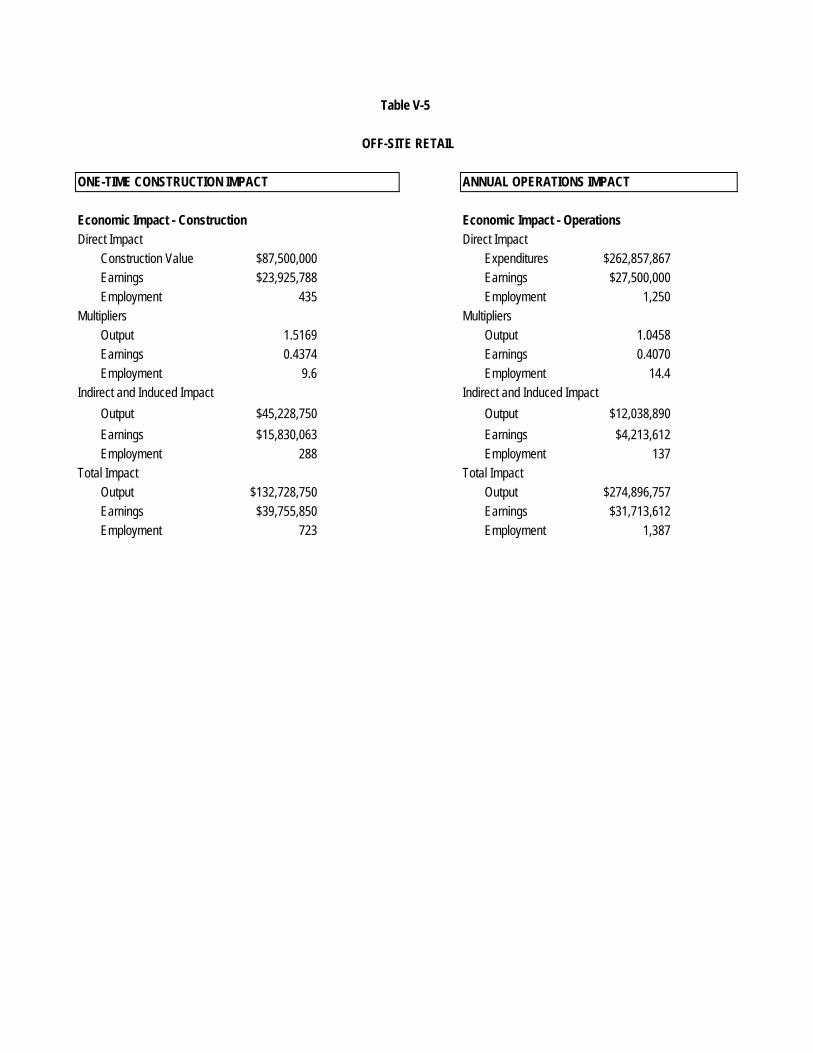
ONE-TIME CONSTRUCTION IMPACT ANNUAL OPERATIONS IMPACT
Economic Impact - Construction Economic Impact - OperationsDirect Impact Direct Impact
Construction Value $87,500,000 Expenditures $262,857,867Earnings $23,925,788 Earnings $27,500,000Employment 435 Employment 1,250
Multipliers MultipliersOutput 1.5169 Output 1.0458 Earnings 0.4374 Earnings 0.4070 Employment 9.6 Employment 14.4
Indirect and Induced Impact Indirect and Induced Impact
Output $45,228,750 Output $12,038,890
Earnings $15,830,063 Earnings $4,213,612Employment 288 Employment 137
Total Impact Total ImpactOutput $132,728,750 Output $274,896,757Earnings $39,755,850 Earnings $31,713,612Employment 723 Employment 1,387
Table V-5
OFF-SITE RETAIL
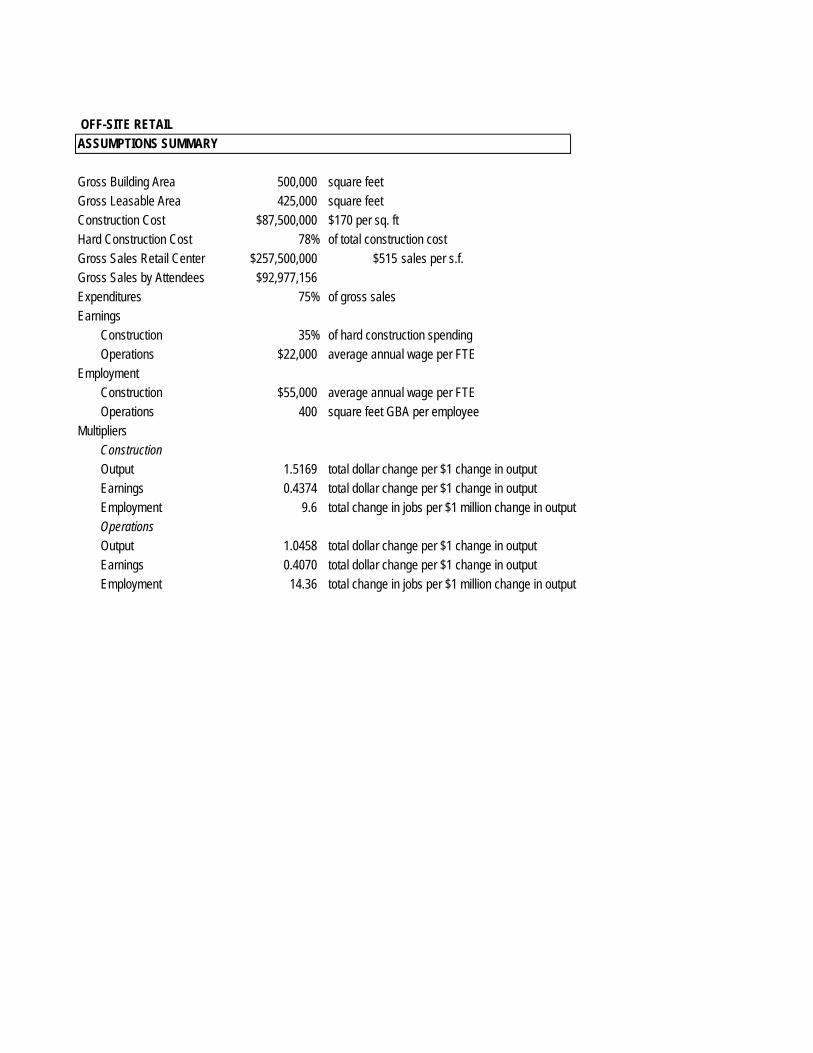
OFF-SITE RETAILASSUMPTIONS SUMMARY
Gross Building Area 500,000 square feetGross Leasable Area 425,000 square feetConstruction Cost $87,500,000 $170 per sq. ftHard Construction Cost 78% of total construction costGross Sales Retail Center $257,500,000 $515 sales per s.f. Gross Sales by Attendees $92,977,156Expenditures 75% of gross salesEarnings
Construction 35% of hard construction spendingOperations $22,000 average annual wage per FTE
EmploymentConstruction $55,000 average annual wage per FTEOperations 400 square feet GBA per employee
MultipliersConstructionOutput 1.5169 total dollar change per $1 change in outputEarnings 0.4374 total dollar change per $1 change in outputEmployment 9.6 total change in jobs per $1 million change in outputOperationsOutput 1.0458 total dollar change per $1 change in outputEarnings 0.4070 total dollar change per $1 change in outputEmployment 14.36 total change in jobs per $1 million change in output

On-site Total On-site Total
ONE-TIME CONSTRUCTION IMPACT ONE-TIME CONSTRUCTION IMPACT ANNUAL OPERATIONS IMPACT ANNUAL OPERATIONS IMPACT
Economic Impact - Construction Economic Impact - Construction Economic Impact - Operations Economic Impact - Operations
Direct Impact Direct Impact Direct Impact Direct Impact
Construction Value 1,120,900,000 Construction Value $2,222,280,000 Expenditures $121,608,300 Expenditures $485,938,507
Earnings 379,558,998 Earnings $651,885,386 Earnings $62,180,480 Earnings $128,304,480
Employment 6,901 Employment 11,852 Employment 1,897 Employment 5,078
Indirect and Induced Impact Indirect and Induced Impact Indirect and Induced Impact Indirect and Induced Impact
Output 579,393,210 Output $1,148,696,532 Output $61,571,414 Output $117,862,392
Earnings 110,722,662 Earnings $309,978,825 Earnings $15,304,082 Earnings $35,005,924
Employment 3,884 Employment 7,507 Employment 1,649 Employment 2,290
Total Impact Total Impact Total Impact Total Impact
Output 1,700,293,210 Output $3,370,976,532 Output $183,179,714 Output $603,800,898
Earnings 490,281,660 Earnings $961,864,210 Earnings $77,484,562 Earnings $163,310,404
Employment 10,785 Employment 19,359 Employment 3,546 Employment 7,368
Source: AEG and MR+E
Table V-6
Summary of Impacts

MR+E
AEG Special Events Center Market Impacts VI-1
Section VI Housing Effects
Introduction
Housing markets are very complicated. Generally speaking, it is very difficult to link changes in market values over
time to a specific event or development. That being said, the value of housing in a community is strongly tied to the
available amenities, quality of life and the physical condition of the housing stock itself. Stakeholders in the Pico
Union area have expressed concern that the Project has the potential to significantly impact the availability of
affordable housing. This is of concern in light of the fact that so many of the residents of Pico Union depend on the
availability of attainably priced rental units to remain housed in the community. As conditions have improved
throughout downtown Los Angeles by the provision of community amenities, new cultural facilities, and housing
opportunities brought about by the City's adaptive reuse ordinance, Downtown Los Angeles has seen increased
levels of development for market rate and luxury housing units over the last 5 to 7 years. This section is primarily
concerned with addressing issues related to the potential effects that the Project could have on the availability of
lower cost attainably priced units within Pico Union. This analysis is based on a review of the trends in housing
values and comparable communities throughout the United States where a new NFL stadium has been developed.
The neighborhood effects in these comparable cases are compared to changes in housing value at the state and
metropolitan level to identify any potential changes in the overall direction of housing values that may have occurred
after the opening of a new stadium facility.
While this analysis focuses on the value of for sale units in the community is important to recognize that rents are
strongly associated with the sales value of residential real estate. Generally speaking investor-owned units (those
that are not occupied by an on-site owner) are appraised and financed on the basis of a capitalized value for income
stream (the “cap rate”). As a result, as sales costs increase, cash flows from rents will also tend to rise. While
housing values and rents are not uniformly correlated, as long-term investors may trade occupancy for income by
stabilizing reducing rents, typically rental rates are closely to the implied cap rate driven by the sales price.
Conditions in Pico Union
At present, Pico Union, as defined by the study area described in Section III, is the site of just over 13,000 total
dwelling units. The vast majority of these are renter occupied, with owner occupied housing comprising just under
10% of the total available housing stock. This compares to the countywide average of approximately 46%. Table VI-
1 shows the distribution of owner occupied housing by value.

IndexPico Los Angeles Plan Area ComparedUnion County To County
Summary Total Population 45,055 10,240,505 0.4%
Total Households 12,802 3,292,577 0.4%Average Household Size 3.46 3.06 113.1%
Family Households 9,366 2,242,907 0.4%Total Units 13,125 3,370,108 0.4%
Owner Occupied Units 1,292 1,544,182 0.1%Renter Occupied 11,833 1,825,926 0.6%
Percent Owner Occupied 9.8% 45.8% 21.5%
Housing Value--Owner OccupiedLess than $10,000 - 5,931 0.00%
$10,000 to $14,999 - 3,205 0.00%$15,000 to $19,999 - 2,463 0.00%$20,000 to $24,999 10 2,895 0.35%$25,000 to $29,999 24 3,318 0.72%$30,000 to $34,999 10 3,829 0.26%$35,000 to $39,999 - 3,985 0.00%$40,000 to $49,999 - 7,695 0.00%$50,000 to $59,999 - 7,156 0.00%$60,000 to $69,999 - 5,508 0.00%$70,000 to $79,999 - 5,335 0.00%$80,000 to $89,999 10 5,399 0.19%$90,000 to $99,999 21 4,069 0.52%
$100,000 to $124,999 18 13,038 0.14%$125,000 to $149,999 18 9,627 0.19%$150,000 to $174,999 21 16,370 0.13%$175,000 to $199,999 18 15,520 0.12%$200,000 to $249,999 45 59,611 0.08%$250,000 to $299,999 22 60,289 0.04%$300,000 to $399,999 145 218,794 0.07%$400,000 to $499,999 275 277,195 0.10%$500,000 to $749,999 515 465,442.0 0.11%$750,000 to $999,999 103 175,496.0 0.06%
$1,000,000 or more 38 172,012 0.02%
Percentage
$15,000 to $19,999 0.0% 0.4% 0.0%$20,000 to $24,999 0.0% 0.2% 0.0%$25,000 to $29,999 0.0% 0.2% 0.0%$30,000 to $34,999 0.8% 0.2% 412.8%$35,000 to $39,999 1.9% 0.2% 864.5%$40,000 to $49,999 0.8% 0.2% 312.1%$50,000 to $59,999 0.0% 0.3% 0.0%$60,000 to $69,999 0.0% 0.5% 0.0%$70,000 to $79,999 0.0% 0.5% 0.0%$80,000 to $89,999 0.0% 0.4% 0.0%$90,000 to $99,999 0.0% 0.3% 0.0%
$100,000 to $124,999 0.8% 0.3% 221.4%$125,000 to $149,999 1.6% 0.3% 616.8%$150,000 to $174,999 1.4% 0.8% 165.0%$175,000 to $199,999 1.4% 0.6% 223.5%$200,000 to $249,999 1.6% 1.1% 153.3%$250,000 to $299,999 1.4% 1.0% 138.6%$300,000 to $399,999 3.5% 3.9% 90.2%$400,000 to $499,999 1.7% 3.9% 43.6%$500,000 to $749,999 11.2% 14.2% 79.2%$750,000 to $999,999 21.3% 18.0% 118.6%
$1,000,000 or more 39.9% 30.1% 132.2%
Source: ESRI, US Census and MR+E
Table VI-1Housing Value
Pico Union
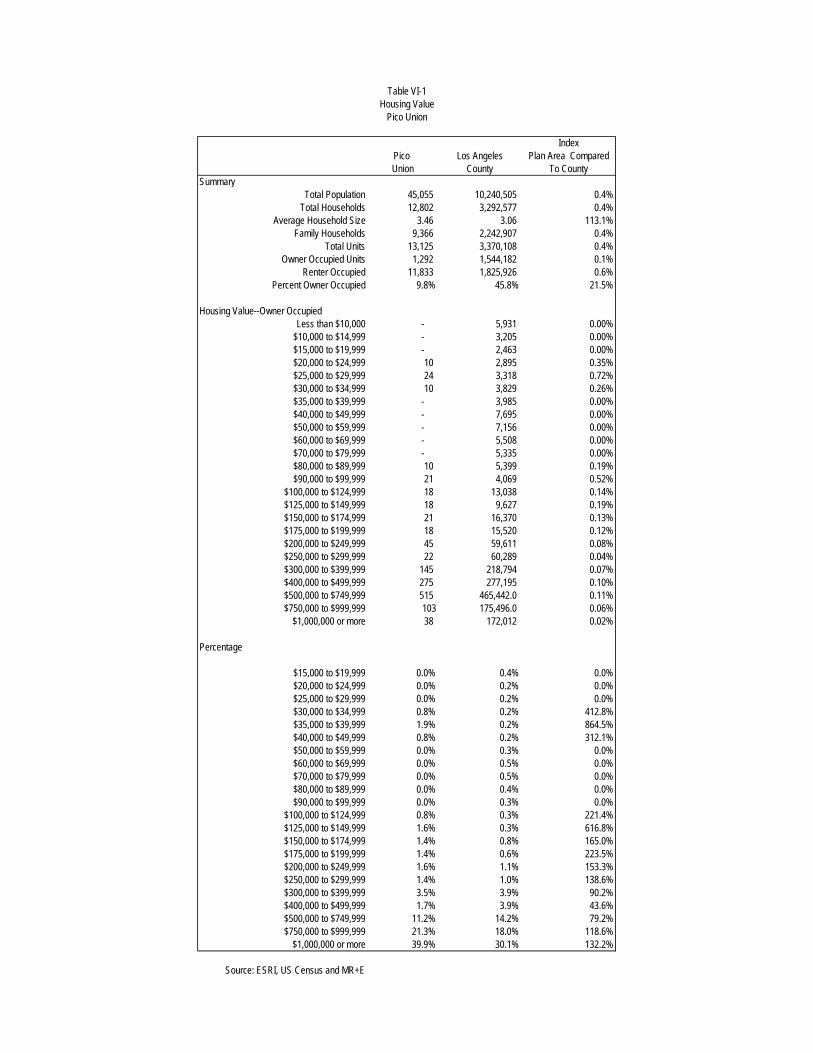
MR+E
AEG Special Events Center Market Impacts VI-3
The median home value for owner occupied dwelling units in Pico Union in 2010 was estimated at just over $476,000
by the US Census American Community Survey (ACS). This figure only relates to the value of owner occupied
dwelling units. This compares to a comparable figure of just under $522,000 for LA County as a whole. This figure is
somewhat influenced by the fact that there are a fair number of large historic and well maintained single-family
houses within the historic districts of Pico Union, most of which are owner occupied. This has a tendency to push
the value owner occupied housing towards the higher end of the market. In fact, the ACS reports more than 600
owner occupied dwelling units with values over $500,000. However, as was discussed in the previous section, the
majority of households in Pico Union do not have incomes to support housing values at that level.
As a result of the social and economic conditions found in Pico Union, the preponderance of dwelling units are renter
occupied. The median rent reported by the ACS for 2010 within Pico Union was just under $630 per month,
compared to countywide median of $970. The distribution of rental costs in Pico Union compared to LA County is
displayed on Table VI-2. Consistent with the high rates of renter occupied housing and the fact that it is an older
inner-city community, the majority of the housing stock in Pico Union is made up of multifamily units. Single-family
detached units account for just under 19% of the total number of dwelling units in the community. This compares to
almost 50% single-family detached housing in the County as a whole. Table VI-3 shows the distribution of dwelling
units by unit type for Pico Union and LA County. In addition, the table shows the date of construction for these
dwelling units with the median year of the structure built in Pico Union in 1945, as compared to 1961 for the County.
41% of the dwelling units built in Pico Union were constructed prior to 1939. While the data in this trend analysis
focuses on the sale value of all units, rental values in a real estate market closely track sales values and represent a
proxy indicator of the overall affordability of housing in the community
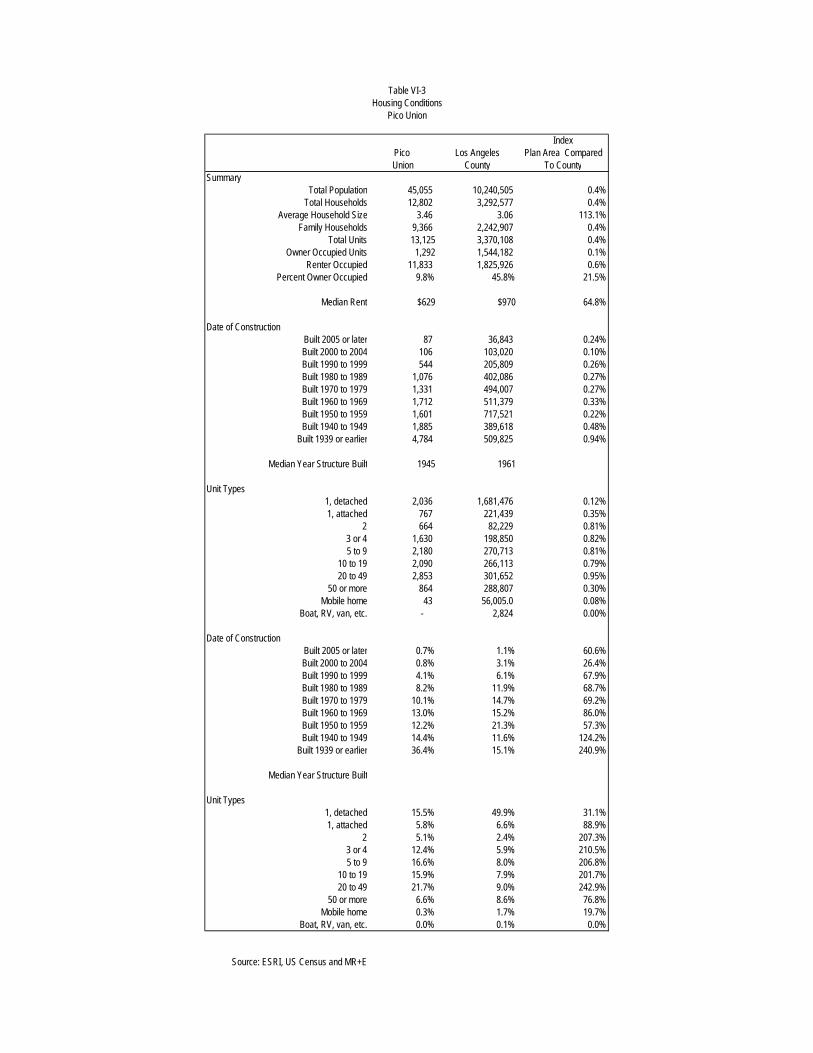
IndexPico Los Angeles Plan Area ComparedUnion County To County
Summary Total Population 45,055 10,240,505 0.4%
Total Households 12,802 3,292,577 0.4%Average Household Size 3.46 3.06 113.1%
Family Households 9,366 2,242,907 0.4%Total Units 13,125 3,370,108 0.4%
Owner Occupied Units 1,292 1,544,182 0.1%Renter Occupied 11,833 1,825,926 0.6%
Percent Owner Occupied 9.8% 45.8% 21.5%
Median Rent $629 $970 64.8%
Date of ConstructionBuilt 2005 or later 87 36,843 0.24%Built 2000 to 2004 106 103,020 0.10%Built 1990 to 1999 544 205,809 0.26%Built 1980 to 1989 1,076 402,086 0.27%Built 1970 to 1979 1,331 494,007 0.27%Built 1960 to 1969 1,712 511,379 0.33%Built 1950 to 1959 1,601 717,521 0.22%Built 1940 to 1949 1,885 389,618 0.48%
Built 1939 or earlier 4,784 509,825 0.94%
Median Year Structure Built 1945 1961
Unit Types1, detached 2,036 1,681,476 0.12%1, attached 767 221,439 0.35%
2 664 82,229 0.81%3 or 4 1,630 198,850 0.82%5 to 9 2,180 270,713 0.81%
10 to 19 2,090 266,113 0.79%20 to 49 2,853 301,652 0.95%
50 or more 864 288,807 0.30%Mobile home 43 56,005.0 0.08%
Boat, RV, van, etc. - 2,824 0.00%
Date of ConstructionBuilt 2005 or later 0.7% 1.1% 60.6%Built 2000 to 2004 0.8% 3.1% 26.4%Built 1990 to 1999 4.1% 6.1% 67.9%Built 1980 to 1989 8.2% 11.9% 68.7%Built 1970 to 1979 10.1% 14.7% 69.2%Built 1960 to 1969 13.0% 15.2% 86.0%Built 1950 to 1959 12.2% 21.3% 57.3%Built 1940 to 1949 14.4% 11.6% 124.2%
Built 1939 or earlier 36.4% 15.1% 240.9%
Median Year Structure Built
Unit Types1, detached 15.5% 49.9% 31.1%1, attached 5.8% 6.6% 88.9%
2 5.1% 2.4% 207.3%3 or 4 12.4% 5.9% 210.5%5 to 9 16.6% 8.0% 206.8%
10 to 19 15.9% 7.9% 201.7%20 to 49 21.7% 9.0% 242.9%
50 or more 6.6% 8.6% 76.8%Mobile home 0.3% 1.7% 19.7%
Boat, RV, van, etc. 0.0% 0.1% 0.0%
Source: ESRI, US Census and MR+E
Table VI-3Housing Conditions
Pico Union

MR+E
AEG Special Events Center Market Impacts VI-6
STAPLES Center and LA Live
Pico Union has had experience with the presence of a major sports venue and entertainment destination nearby
since the opening of STAPLES Center in 1999. This is instructive in that during its time of operations the facility has
been the site of over 200 annual events. Over this period, Pico Union has not experienced destabilizing changes in
its residential real estate market. The community remains a reserve of attainably priced housing within the Los
Angeles market and continues to be the site of a large number of rental units. The presence of STAPLES Center
and LA Live have not resulted in wholesale changes to the composition of the community’s housing stock nor has it
led to the development of gentrifying projects despite an expansion of the housing market in greater Downtown Los
Angeles that has occurred over the last decade. The ACS data for the Pico Union community indicates that the
area’s housing stock grew by 7 units from 2000 to the present. This represented a 0.11% increase in the total
number of available units in the community, and compares to a County wide rate of 4.15% over the same period.
The basic mix of unit types and tenure have remained stable since the introduction of STAPLES Center and the
community has not experienced significant changes in its demographic composition over this time. In terms of
housing values, from 1996 through 2002, a period which covers three years prior to the opening of STAPLES Center
and three years after its opening, median sales prices in the community zip codes trended upward at approximately
the same rate as the State and County as a whole. Pico Union did experience faster rates of growth from 2002
through the collapse of the housing bubble in 2007 but this run up is independent of either the operations of
STAPLES Center or development of LA Live, which opened in 2008. In general the experience of STAPLES Center,
which has accommodated approximately 48 million patrons since its opening, has not been transformative to the
structure of the housing market or available housing stock in Pico Union.
Comparable communities
Since 1998, 16 new NFL venues have been built .This time period was selected because it included two
expansionary and recessionary periods in the US national economy. This is a long enough time frame to allow for a
review of changes in prices within each of the local markets without being distorted by any particular portion of the
economic cycle in terms of expansion or recession. The time period also matched available housing cost data that
ran from 1996 to 2011. This time period covered a significant number of new stadium developments well at the same
time a consistent level of data was available in each of the markets examined over this time. These facilities were
examined to establish their long-term effect on neighborhood housing values. Zip Code level housing price data was
used as a basis for establishing long term trends in local housing markets. This was then compared to the

MR+E
AEG Special Events Center Market Impacts VI-7
performance of state and metro area housing markets over the same time. This was done with the goal of
determining any relative differentiation that occurs before or after the development of a new facility.
The following criteria were used in determining which stadiums to use for the comparable analysis:
Length of time series-- The two most recently developed stadiums, Cowboy Stadium in Arlington Texas
and Met Life Stadium in East Rutherford New Jersey, were excluded due to the short amount of time that
they have been in operation as housing costs tend to be affected over time. Facilities developed at the
beginning of the time period, Bank of America Stadium in Charlotte North Carolina and FedEx Field in
Landover Maryland, were also excluded because there was not enough historic data available to allow for
meaningful comparisons.
Number of dwelling units-- the comparables analysis is based on housing sales values at the zip code
level. In a number of instances, the facilities are not located in a zip code with a significant number of
dwelling units of any kind that can be used to determine trends and effects. The stadiums with limited to no
dwelling units nearby included those developed in Detroit, Nashville, Seattle, Cleveland, Cincinnati,
Houston, Indianapolis and Chicago.
Under these criteria the following new Stadium facilities were used in this comparable analysis:
Heinz Field-- Pittsburgh, Pennsylvania
Sports Authority Field—Denver, Colorado
Gillette Stadium – Foxboro, Massachusetts
Lincoln Financial Field –Philadelphia, Pennsylvania
University of Phoenix Stadium -- Glendale, Arizona
M & T Bank Stadium—Baltimore, Maryland
Raymond James Stadium—Tampa, Florida.
Heinz Field—Pittsburgh
Opened in 2001, Heinz field is the home of the Pittsburgh Steelers NFL franchise. The stadium is located along the
banks of the Ohio River in the North Shore neighborhood of Pittsburgh. Heinz Field was developed at a cost of $281
million as part of a comprehensive public assembly facility development program undertaken by the City of
Pittsburgh. This included the development of nearby PNC Park, which is the home of the Pittsburgh Pirates major
league baseball franchise, and an expansion to the Lawrence Convention Center which is located across the river in
downtown Pittsburgh.
MR+E
AEG Special Events Center Market Impacts VI-8
In addition to serving as the home field for an NFL franchise, the stadium also accommodates the University of
Pittsburgh's intercollegiate football games and hosts a number of special events including major concerts and the
2011 NHL winter classic outdoor ice hockey game. The stadium has a seating capacity of just over 65,000 and
includes a series of tiered club and box seats.
The surrounding neighborhood includes a number of historic districts including Allegheny West, the so-called
Mexican war streets and the district of Allegheny Center. The 15-year housing price trend for this district is displayed
on Figure VI-1. This covers the Zip code in which the stadium is located. As of April 2011, the median sales price for
all homes in the zip code that includes Heinz Field was $70,300. This compares to a metro area median of $107,300
and the statewide value of $143,200. Housing in the immediate neighborhood has been significantly less expensive
from the beginning of the time period in April 1996 through the study period. A comparison of the changes in the
value of housing in the zip code that includes Heinz Field to that in the metro and statewide areas through the study
period is summarized in the table below.
April 2006 April 2011 Difference % growth Variance
Pennsylvania $83,100 $143,200 $60,100 72.3% -7.8%
Pittsburgh $66,600 $108,000 $41,400 62.2% 2.4%
51212 $42,900 $70,600 $27,700 64.6%
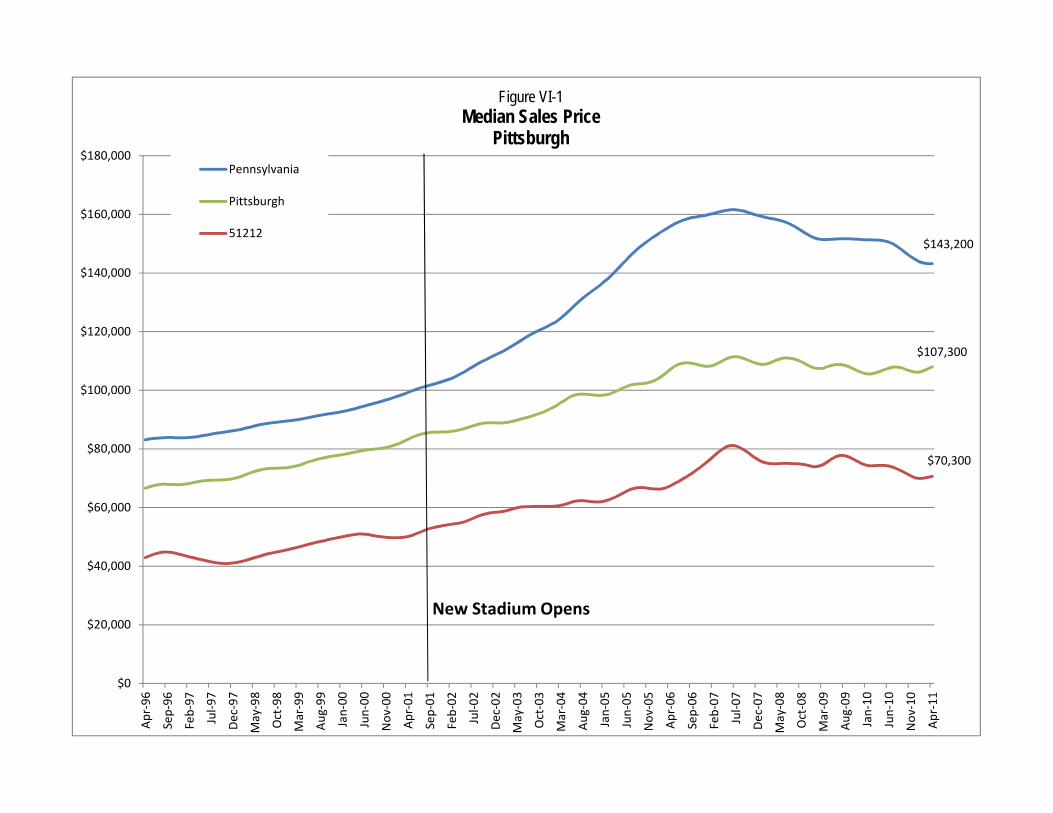
$143,200
$107,300
$70,300
$0
$20,000
$40,000
$60,000
$80,000
$100,000
$120,000
$140,000
$160,000
$180,000Apr‐96
Sep‐96
Feb‐97
Jul‐97
Dec‐97
May‐98
Oct‐98
Mar‐99
Aug‐99
Jan‐00
Jun‐00
Nov‐00
Apr‐01
Sep‐01
Feb‐02
Jul‐02
Dec‐02
May‐03
Oct‐03
Mar‐04
Aug‐04
Jan‐05
Jun‐05
Nov‐05
Apr‐06
Sep‐06
Feb‐07
Jul‐07
Dec‐07
May‐08
Oct‐08
Mar‐09
Aug‐09
Jan‐ 10
Jun‐10
Nov‐10
Apr‐11
Figure VI-1Median Sales Price
Pittsburgh
Pennsylvania
Pittsburgh
51212
New Stadium Opens
MR+E
AEG Special Events Center Market Impacts VI-10
Sports Authority Field—Denver
Opened in September 2001 to replace the commercially obsolete Mile High Stadium, Sports Authority Field (originally
named Invesco Field) is located adjacent to downtown Denver in the Sun Valley neighborhood. The Stadium has a
dedicated light rail station and is located along Interstate 25 near the Colfax Avenue exit. Federal Boulevard, which is
a major north-south thoroughfare through Denver, borders the Stadium site along the west side.
The Stadium has a capacity of just over 76,000 for football. It has been primarily used as the home field for the
Denver Broncos NFL franchise. Other uses include concerts, soccer games, minor-league sports and special events
such as University of Colorado football games. The facility was built with the total development cost of just under
$365 million. The facility is publicly owned by the Denver metropolitan football stadium district.
The Sun Valley district of Denver is an historically low income community with relatively low rates of homeownership.
Sun Valley and the surrounding neighborhoods of Lincoln Park and Jefferson Park are the primary location of the city
of Denver's public housing units. Sales values for the zip code that include Sports Authority Field are shown on
Figure VI-2. As of April 2011, median sales price for all dwelling units in the community was $143,524. This
compares to a median value for the City of Denver of $195,300 and $191,400 for the State of Colorado as a whole.
A comparison of the changes in the value of housing in the zip code that includes Sports Authority Field to that in the
metro and statewide areas through the study period is summarized in the table below.
April 1996 April 2011 Difference % growth Variance
Colorado $116,300 $191,700 $75,400 64.8% 31.5%
Denver $118,900 $195,700 $76,800 64.6% 31.8%
80204 $73,189 $143,728 $70,539 96.4%
Gillette Stadium—Foxboro Massachusetts.
Foxboro is a suburban community located in Norfolk County, Massachusetts. It is approximately 20 miles southwest
of Boston and 18 miles northeast of Providence, Rhode Island. Norfolk County is part of the greater Boston
Combined Statistical Area (CSA). Gillette Stadium, which opened in 2002, is the home field for the New England
Patriots NFL football franchise. This team has a long association with Foxboro, having played in an earlier stadium
located in the community from 1971 to 2001. Gillette Stadium has a seating capacity of 68,000 for football. In
MR+E
AEG Special Events Center Market Impacts VI-11
addition to NFL games, Gillette Stadium is used by major league soccer, as well as NCAA and high school football
games.
Beginning in 2007, the owners of Gillette Stadium developed a lifestyle and destination retail center named Patriot
Place on the site adjacent to the Stadium. Key tenants include Bass Pro Shops, Bed Bath and Beyond and other
national retail tenants. The project also includes a multiplex theater and a full-service hotel.
Housing values in the Foxboro zip code that includes Gillette Stadium have been closely parallel to median sales
prices for all homes in the Boston metropolitan area, which has consistently outpaced values in the state as a whole.
Figure VI-3 displays the relationship. A comparison of the changes in the value of housing in the zip code that
includes Gillette Stadium to that in the metro and statewide areas through the study period is summarized in the table
below.
April 1996 April 2011 Difference % growth Variance
Massachusetts $ 137,700 $ 282,800 $ 145,100 105.4% -14.3%
Boston $ 152,900 $ 314,100 $ 161,200 105.4% -14.4%
02035 $ 163,500 $ 312,400 $ 148,900 91.1%
Lincoln Financial Field—Philadelphia
Lincoln Financial Field, which opened in 2003 to replace the former Veterans Stadium, is the home of the National
Football League's Philadelphia Eagles franchise. The stadium had a total construction budget of approximately $512
million and has a seating capacity of over 68,000 spectators for football. In addition to serving as a NFL home field,
the Stadium also accommodates NCAA football, major league and international soccer matches, as well as concerts
and special events. The Stadium is part of a larger sports complex in South Philadelphia that includes an arena for
Philadelphia's NHL and NBA franchises, as well as the baseball stadium for the Philadelphia Phillies.
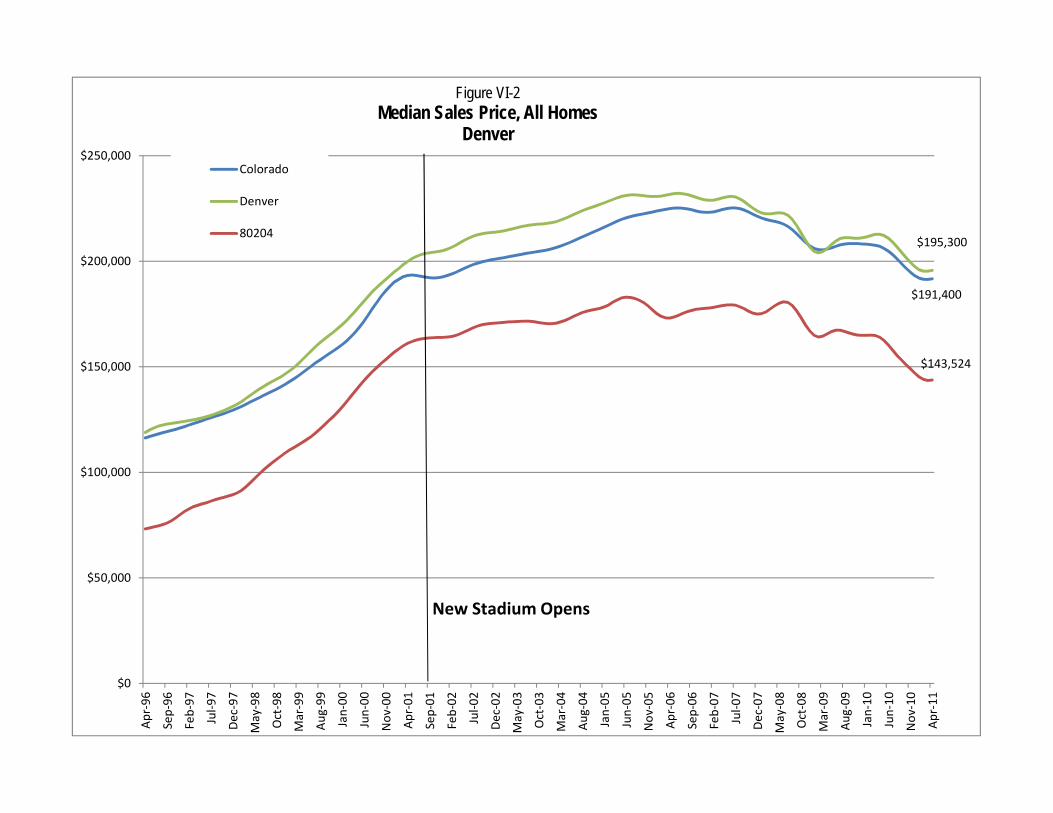
$191,400
$195,300
$143,524
$0
$50,000
$100,000
$150,000
$200,000
$250,000Apr‐96
Sep‐96
Feb‐97
Jul‐97
Dec‐97
May‐98
Oct‐98
Mar‐99
Aug‐99
Jan‐00
Jun‐00
Nov‐00
Apr‐01
Sep‐01
Feb‐02
Jul‐02
Dec‐02
May‐03
Oct‐03
Mar‐04
Aug‐04
Jan‐05
Jun‐05
Nov‐05
Apr‐06
Sep‐06
Feb‐07
Jul‐07
Dec‐07
May‐08
Oct‐08
Mar‐09
Aug‐09
Jan‐ 10
Jun‐10
Nov‐10
Apr‐11
Figure VI-2Median Sales Price, All Homes
Denver
Colorado
Denver
80204
New Stadium Opens
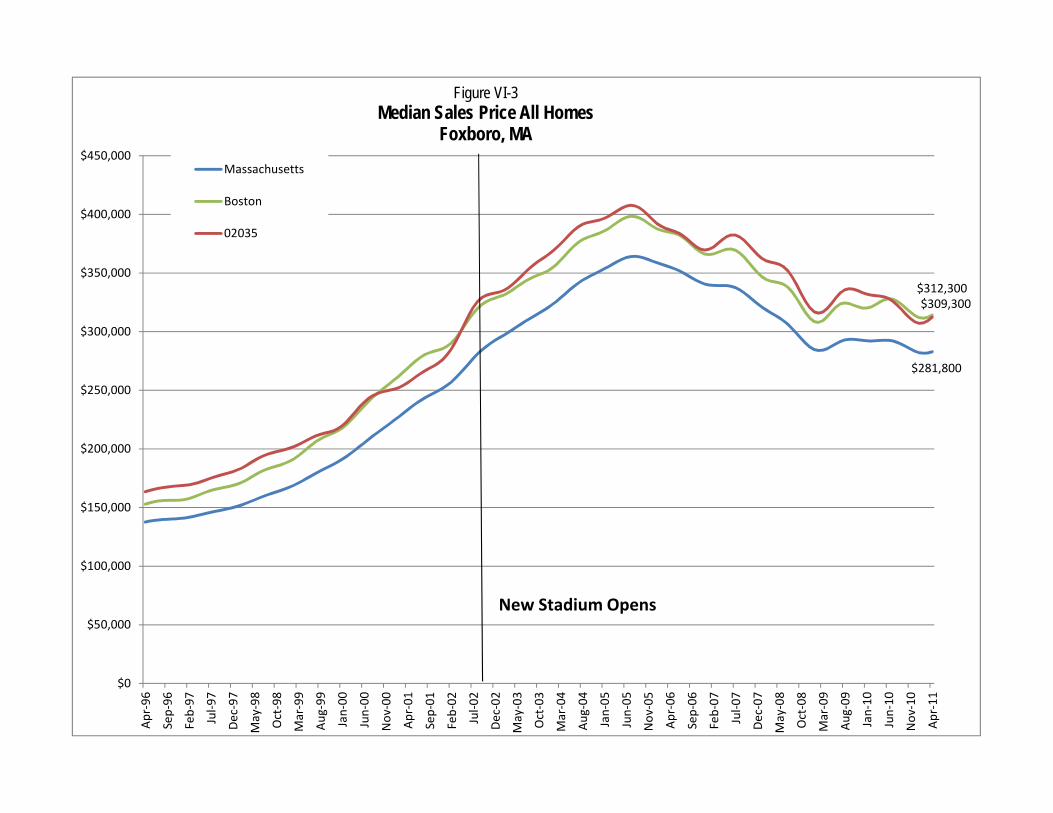
$281,800
$312,300$309,300
$0
$50,000
$100,000
$150,000
$200,000
$250,000
$300,000
$350,000
$400,000
$450,000Apr‐96
Sep‐96
Feb‐97
Jul‐97
Dec‐97
May‐98
Oct‐98
Mar‐99
Aug‐99
Jan‐00
Jun‐00
Nov‐00
Apr‐01
Sep‐01
Feb‐02
Jul‐02
Dec‐02
May‐03
Oct‐03
Mar‐04
Aug‐04
Jan‐05
Jun‐05
Nov‐05
Apr‐06
Sep‐06
Feb‐07
Jul‐07
Dec‐07
May‐08
Oct‐08
Mar‐09
Aug‐09
Jan‐ 10
Jun‐10
Nov‐10
Apr‐11
Figure VI-3Median Sales Price All Homes
Foxboro, MA
Massachusetts
Boston
02035
New Stadium Opens
MR+E
AEG Special Events Center Market Impacts VI-13
The Philadelphia sports complex is accessible from Interstate 95 and is located along Patterson Avenue in South
Philadelphia. The Philadelphia neighborhood surrounding Lincoln Financial Field witnessed a significant run-up in
housing values between the opening of the Stadium in 2003 and the present. Prior to early 2002, the zip code
containing Lincoln Financial Field had a median sales price below the metro Philadelphia average. However,
beginning in June of 2002, the area eclipsed the city median for the first time and grew in each successive month
until the summer of 2007. As shown in Figure VI-4, present housing values are at $126,600, which compares to a
City of Philadelphia median of $107,400 and the statewide median of $143,200. The very low initial price of housing
in the community has the effect of amplifying its appreciation relative to growth in the market as a whole. Housing in
the zip code containing Lincoln Financial Field began the study period at $40,600. This was the lowest value in any
of the case study communities. The large percentage growth between 1996 and 2011 is largely an artifact of
changes from a low base. This run up in value on a percentage basis is likely to be more attributable to the effects
of loosened lending standards and low interest rates that were experienced from 2001 to 2008, which resulted in
significant value increases in housing economy wide. These circumstances had the effect of allowing for escalating
sales prices with leveraged capital on housing that had a very low initial price.
These conditions are unlikely to be repeated and as a result this level of appreciation is not likely to occur in Pico
Union in the future for two main reasons. Firstly Pico Union has significantly higher values that are closer to the
market median and secondly, the community is less likely to experience mortgage based arbitrage due to changes in
credit markets.
A comparison of the changes in the value of housing in the zip code that includes Lincoln Financial Field to that in the
metro and statewide areas through the study period is summarized in the table below.
April 1996 April 2011 Difference % growth Variance
Pennsylvania $ 83,100 $ 143,200 $ 60,100 72.3% 137.8%
Philadelphia $ 45,900 $ 107,700 $ 61,800 134.6% 75.5%
19148 $ 40,600 $ 125,900 $ 85,300 210.1%
University of Phoenix Stadium-- Glendale Arizona
Developed jointly by the Arizona Sports and Tourism Authority, the City of Glendale and the Arizona Cardinals
football team, University of Phoenix Stadium is the home of the annual BCS Fiesta Bowl game as well as serving as
the home Stadium for the Cardinals NFL franchise. Glendale Arizona is located in Maricopa County as part of the
MR+E
AEG Special Events Center Market Impacts VI-14
greater Phoenix Metropolitan area. It is located about 10 miles northwest from downtown Phoenix. In addition to
serving as a sports venue, University of Phoenix Stadium was designed to be able to accommodate public assembly
events in addition to spectator events. Total development cost for the project was approximately $455 million. The
facility opened in August of 2006. University of Phoenix Stadium has hosted NCAA men's basketball regional finals
as well as the Super Bowl in 2008. Other major events have included Wrestlemania and a number of high-profile
concerts. In its basic configuration, the Stadium has a capacity of just over 63,000 seats but is expandable to over
78,000 for special events.
The Phoenix metropolitan market saw some of the most rapid increases in housing values during the economic
expansion and housing market inflation of the first half of the decade. From 1996 until April of 2005, values in the zip
code that includes the University of Phoenix Stadium tracked closely with increases in value experienced in the
Phoenix metropolitan area and the State of Arizona as a whole. From spring 1995 until the market's peak in April
2006, values surrounding the stadium accelerated more rapidly than the State and metropolitan area. Shortly
thereafter, University of Phoenix Stadium opened. Prices in the Phoenix area have declined precipitously since that
peak and values in the Glendale area have reverted back towards their long-term values. Figure IV-5 illustrates the
trends in housing prices over the 15-year time period analyzed. A comparison of the changes in the value of housing
in the zip code that includes University of Phoenix Stadium to that in the metro and statewide areas through the
study period is summarized in the table below.
April 1996 April 2011 Difference % growth Variance
Arizona $93,700 $130,700 $37,000 39.5% -16.6%
Phoenix $93,400 $125,000 $31,600 33.8% -10.9%
85305 $100,900 $124,000 $23,100 22.9%
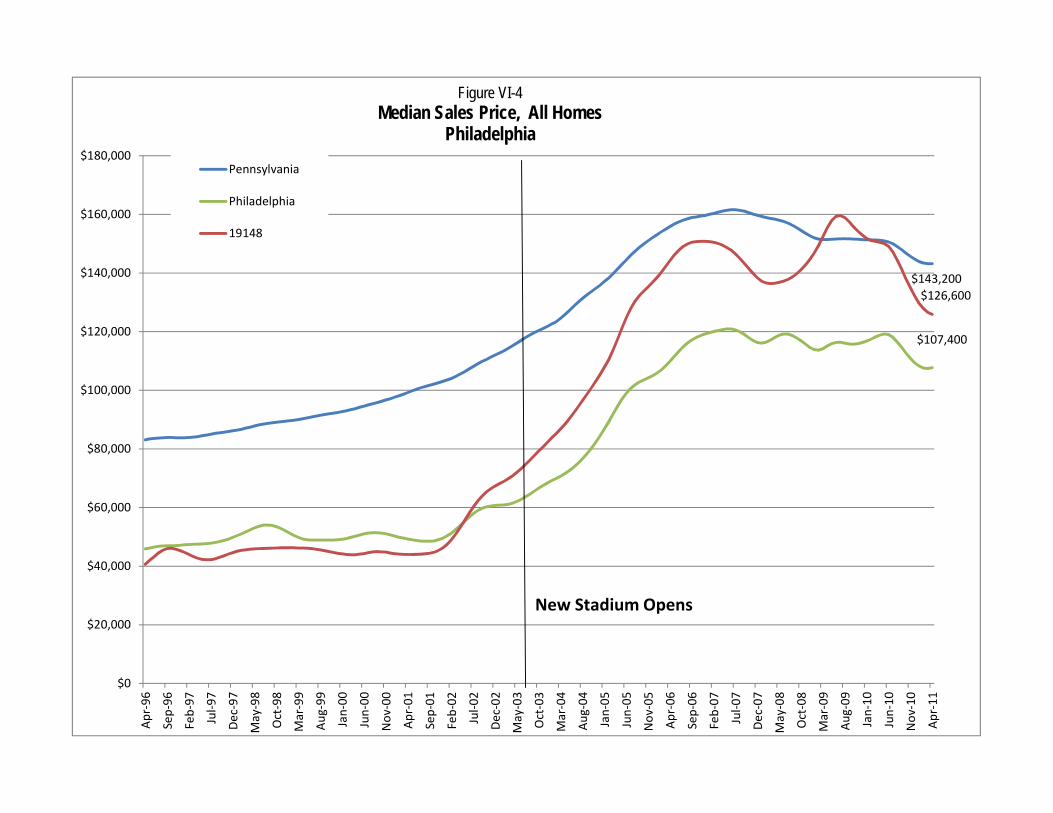
$143,200
$107,400
$126,600
$0
$20,000
$40,000
$60,000
$80,000
$100,000
$120,000
$140,000
$160,000
$180,000Apr‐96
Sep‐96
Feb‐97
Jul‐97
Dec‐97
May‐98
Oct‐98
Mar‐99
Aug‐99
Jan‐00
Jun‐00
Nov‐00
Apr‐01
Sep‐01
Feb‐02
Jul‐02
Dec‐02
May‐03
Oct‐03
Mar‐04
Aug‐04
Jan‐05
Jun‐05
Nov‐05
Apr‐06
Sep‐06
Feb‐07
Jul‐07
Dec‐07
May‐08
Oct‐08
Mar‐09
Aug‐09
Jan‐ 10
Jun‐10
Nov‐10
Apr‐11
Figure VI-4Median Sales Price, All Homes
Philadelphia
Pennsylvania
Philadelphia
19148
New Stadium Opens
MR+E
AEG Special Events Center Market Impacts VI-16
M & T Bank Stadium—Baltimore
Opened in 1998, M & T Bank Stadium is located adjacent to the Hamburg Street station in the Baltimore light rail
system in central Baltimore. M & T Bank Stadium is the home of the Baltimore Ravens NFL franchise and is part of a
larger sports and entertainment complex that includes the Camden Yards baseball stadium. M & T Bank Stadium is
primarily used for football games, however several large scale concerts have been held at the facility over the years.
In addition, the stadium has served as the site of the NCAA men's lacrosse championship. The facility has a capacity
of approximately 71,000.
Figure VI-6 shows the distribution of housing prices in the market over a 15 year time period, which includes the
opening of the stadium in 1998. For the most part, price increases and decreases in the zip code that includes M & T
Bank Stadium have co varied with overall trends in the state and metropolitan region since development of the
stadium. Currently, prices in the area are at $167,500, compared to the citywide average of $221,600 and the
statewide value of $236,300. A comparison of the changes in the value of housing in the zip code that includes M&T
Bank Stadium to that in the metro and statewide areas through the study period is summarized in the table below.
April 1996 April 2011 Difference % growth Variance
Maryland $124,000 $235,800 $111,800 90.2% 98.9%
Baltimore $113,100 $221,900 $108,800 96.2% 92.9%
21230 $58,500 $169,100 $110,600 189.1%
Raymond James Stadium—Tampa
Opened in 1998, Raymond James Stadium serves as the home to the Tampa Bay Buccaneers NFL franchise and
the South Florida University NCAA football team. In addition, the facility houses the annual Outback Bowl. The
stadium was also the site of the 2001 and 2009 Super Bowls. Construction cost for the facility is estimated at just
under $170 million. The stadium has a capacity of over 65,000 seats, expandable to 75,000 depending on the
configuration. The stadium is located adjacent to the Tampa International Airport in North West Tampa. Historically,
the area has been the site of lower cost housing when compared to the Tampa market as a whole. From 1996
through 2011, the community has had housing prices significantly below the statewide or metropolitan average.
Growth in values in the community is tracked closely to changes in the broader markets. At present, the median
value for housing located in the zip code with the Stadium is $73,800, and it is $108,400Statewide and $124,200 in
MR+E
AEG Special Events Center Market Impacts VI-17
the metropolitan area. Figure VI-7 shows the distribution of the time series investigated. A comparison of the
changes in the value of housing in the zip code that includes Raymond James Stadium to that in the metro and
statewide areas through the study period is summarized in the table below.
April 1996 April 2011 Difference % growth Variance
Florida $80,400 $124,000 $43,600 54.2% -15.1%
Tampa $70,600 $108,400 $37,800 53.5% -14.4%
33607 $52,400 $72,900 $20,500 39.1%
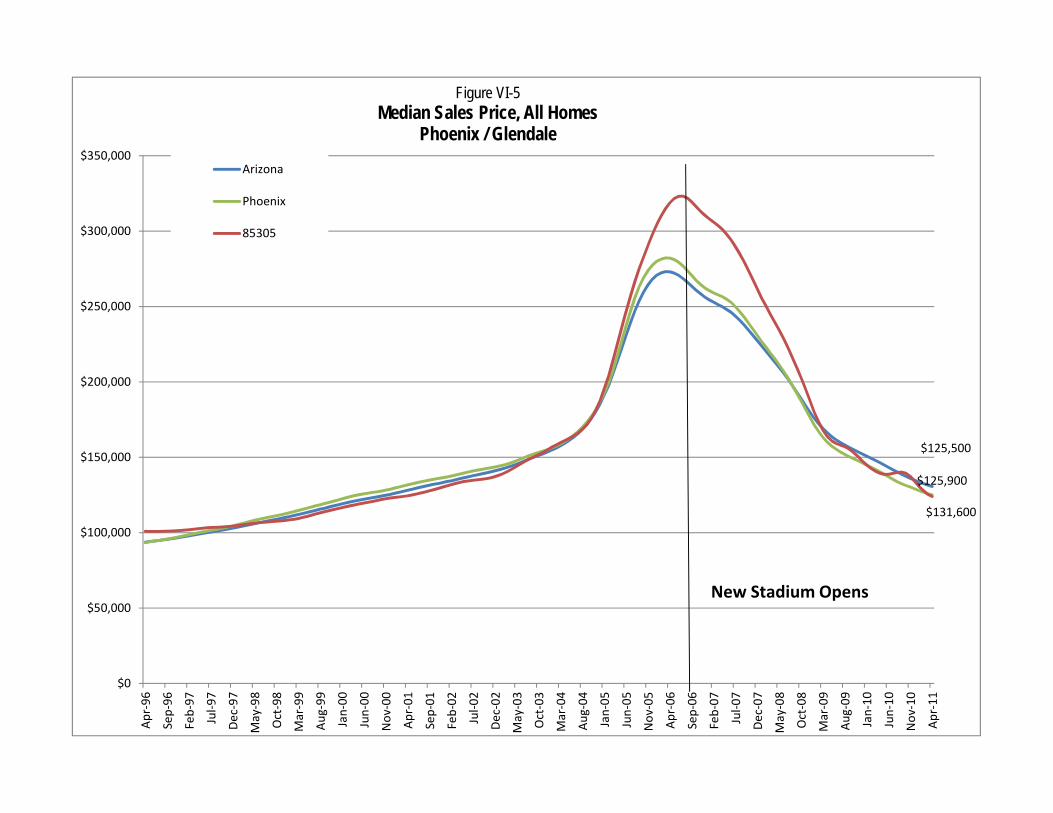
$131,600
$125,900
$125,500
$0
$50,000
$100,000
$150,000
$200,000
$250,000
$300,000
$350,000Apr‐96
Sep‐96
Feb‐97
Jul‐97
Dec‐97
May‐98
Oct‐98
Mar‐99
Aug‐99
Jan‐00
Jun‐00
Nov‐00
Apr‐01
Sep‐01
Feb‐02
Jul‐02
Dec‐02
May‐03
Oct‐03
Mar‐04
Aug‐04
Jan‐05
Jun‐05
Nov‐05
Apr‐06
Sep‐06
Feb‐07
Jul‐07
Dec‐07
May‐08
Oct‐08
Mar‐09
Aug‐09
Jan‐ 10
Jun‐10
Nov‐10
Apr‐11
Figure VI-5Median Sales Price, All Homes
Phoenix / Glendale
Arizona
Phoenix
85305
New Stadium Opens
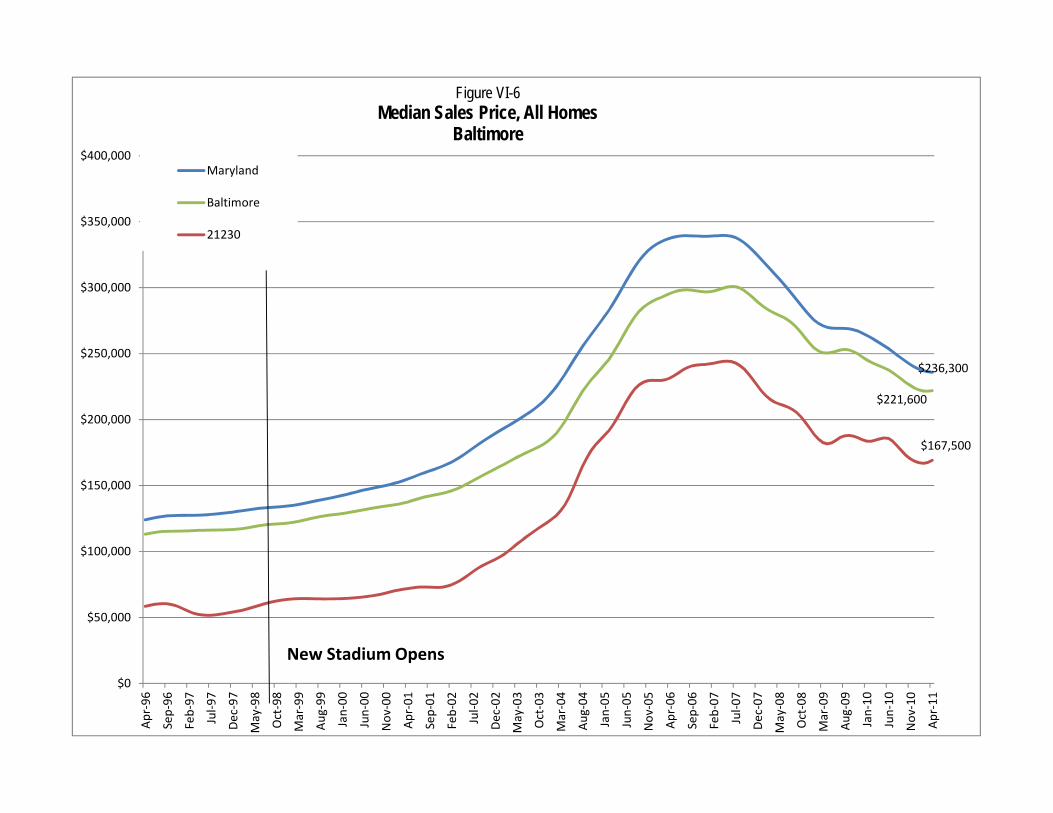
$236,300
$221,600
$167,500
$0
$50,000
$100,000
$150,000
$200,000
$250,000
$300,000
$350,000
$400,000Apr‐96
Sep‐96
Feb‐97
Jul‐97
Dec‐97
May‐98
Oct‐98
Mar‐99
Aug‐99
Jan‐00
Jun‐00
Nov‐00
Apr‐01
Sep‐01
Feb‐02
Jul‐02
Dec‐02
May‐03
Oct‐03
Mar‐04
Aug‐04
Jan‐05
Jun‐05
Nov‐05
Apr‐06
Sep‐06
Feb‐07
Jul‐07
Dec‐07
May‐08
Oct‐08
Mar‐09
Aug‐09
Jan‐ 10
Jun‐10
Nov‐10
Apr‐11
Figure VI-6Median Sales Price, All Homes
Baltimore
Maryland
Baltimore
21230
New Stadium Opens
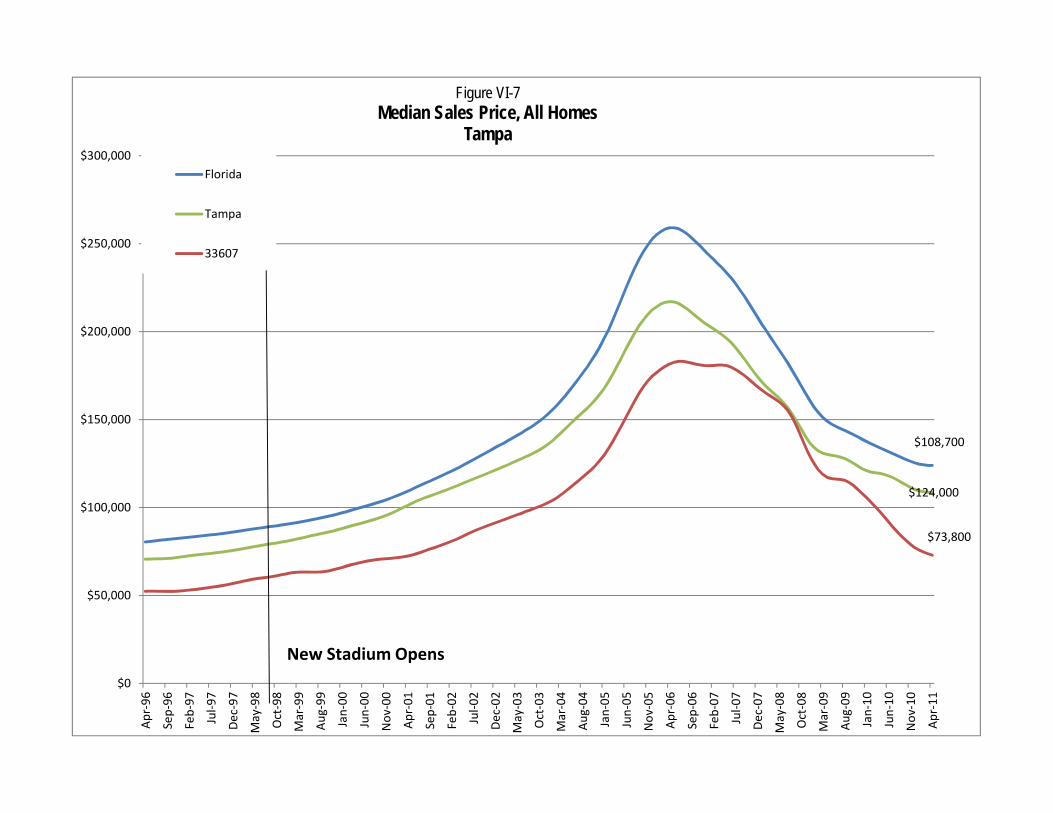
$124,000
$108,700
$73,800
$0
$50,000
$100,000
$150,000
$200,000
$250,000
$300,000Apr‐96
Sep‐96
Feb‐97
Jul‐97
Dec‐97
May‐98
Oct‐98
Mar‐99
Aug‐99
Jan‐00
Jun‐00
Nov‐00
Apr‐01
Sep‐01
Feb‐02
Jul‐02
Dec‐02
May‐03
Oct‐03
Mar‐04
Aug‐04
Jan‐05
Jun‐05
Nov‐05
Apr‐06
Sep‐06
Feb‐07
Jul‐07
Dec‐07
May‐08
Oct‐08
Mar‐09
Aug‐09
Jan‐ 10
Jun‐10
Nov‐10
Apr‐11
Figure VI-7Median Sales Price, All Homes
Tampa
Florida
Tampa
33607
New Stadium Opens
MR+E
AEG Special Events Center Market Impacts VI-21
Market Effects
Table VI-4shows the change in value for housing in the zip codes associated with each of the new stadium discussed
above. In terms of value, the Boston /Foxboro market recorded the largest absolute change of $148,900 over the 15-
year time span. The market that experienced the lowest increase in absolute value was the neighborhood
surrounding Raymond James Stadium in Tampa, which saw a $20,500 increase in the median housing value during
the time period investigated. In terms of percentage growth, the community in South Philadelphia associated with
Lincoln Financial Field experienced the greatest increase-- more than doubling in value over the 15 years examined.
The Glendale/Phoenix market associated with University of Phoenix Stadium saw the most modest percentage
increase at 22.9%. Taken together, all of the project comparables on average saw nearly a doubling of home values
over the entire time period, with an average growth of approximately $70,000.
These absolute values can be normalized to the state and metro area trends. The goal of this is to determine
whether or not over time these communities have in general outperformed or underperformed their market context.
Three of the market areas (Baltimore, Philadelphia and Denver) experienced rates of growth significantly greater than
the metro area in which they are located. This is an indication that market conditions in the community were
significantly transformed between 1996 and 2011. The Pittsburgh market registered a slight improvement in the rate
of change when compared to the metro area, but failed to keep up with the rate of growth experienced in
Pennsylvania as a whole. Three other local markets, Phoenix, Boston and Tampa, underperformed both the state
and metro markets over this time. The average improvement in growth rates for markets that experienced positive
growth when compared to the metro area was 23% . This is substantially larger than the median variance of 2%
among all of the comparables showing the influence of large changes in the rate of growth experienced in Baltimore
and Philadelphia and to an extent Denver. Taken as a whole the same outperformed the metro areas in which the
stadiums were located. . A similar effect is seen with the state data, with an average growth rate in the local markets
exceeding the rate of growth in the total state markets by 31%, with the median loss of 8% over time across the
sample. The effect of the development of a stadium on the local housing market is illustrated by examining the
variance between the growth rate that occurred in the local market before and after the development of the stadium
compared to the growth rates in each metro area over the same time period. This is a process which allows for cross
comparison of the effects before and after the development of the stadium in local real estate market.

$124,000
$108,700
$73,800
$0
$50,000
$100,000
$150,000
$200,000
$250,000
$300,000Apr‐96
Sep‐96
Feb‐97
Jul‐97
Dec‐97
May‐98
Oct‐98
Mar‐99
Aug‐99
Jan‐00
Jun‐00
Nov‐00
Apr‐01
Sep‐01
Feb‐02
Jul‐02
Dec‐02
May‐03
Oct‐03
Mar‐04
Aug‐04
Jan‐05
Jun‐05
Nov‐05
Apr‐06
Sep‐06
Feb‐07
Jul‐07
Dec‐07
May‐08
Oct‐08
Mar‐09
Aug‐09
Jan‐ 10
Jun‐10
Nov‐10
Apr‐11
Figure VI-7Median Sales Price, All Homes
Tampa
Florida
Tampa
33607
New Stadium Opens
MR+E
AEG Special Events Center Market Impacts VI-23
Note that this is not necessarily a statement of causality, but rather a reflection of measured effects. Housing
markets are enormously complicated and can be influenced by a wide variety of external effects that go beyond the
presence of the stadium in the community. That being said, each of these stadiums represents a significant capital
investment and are of the scale that allows them to be potentially transformative. The data for each of the case study
communities is summarized on table VI-5.
Table VI-6 provides data on this relationship in percentage terms before and after the construction of the stadium in
each of the comparable communities examined. Two of the communities, Philadelphia and Pittsburgh, saw growth
rates that outperformed the metro area after the construction of a new NFL venue. Two other communities, Baltimore
and Foxboro/Boston, stayed essentially even with the metro area after the development of the stadium and in both
cases each of these communities improved their relative variance to prices in the metro area from before the opening
of the new stadium facility. Three of the case study examples, Phoenix/Glendale, Denver and Tampa, produced
rates of growth lower than the metro area in which they are located after the development of the new stadium facility.
The average increase in housing values in the communities immediately proximate to a stadium after development
was 5%. .
Summary and conclusions
The analysis of comparable facilities does not provide evidence of a consistent sustained run-up in housing values
either in terms of absolute increases in costs or relative position compared to state and metro markets in
communities adjacent to new NFL stadiums. The case study of Philadelphia represents an outlier among the sample
set, as the low initial value of the neighborhood housing market led to values that moved from underperforming the
state and metro to approaching median values in the market due to the nominal increase in value. The conditions in
Philadelphia are unlikely to be repeated due to the higher baseline value of housing in Pico Union. As a result this
level of appreciation is not likely to occur in Pico Union after the operation of the Project. In each of the other cases
values in the stadium adjacent zip code seem to have largely covaried with local market conditions
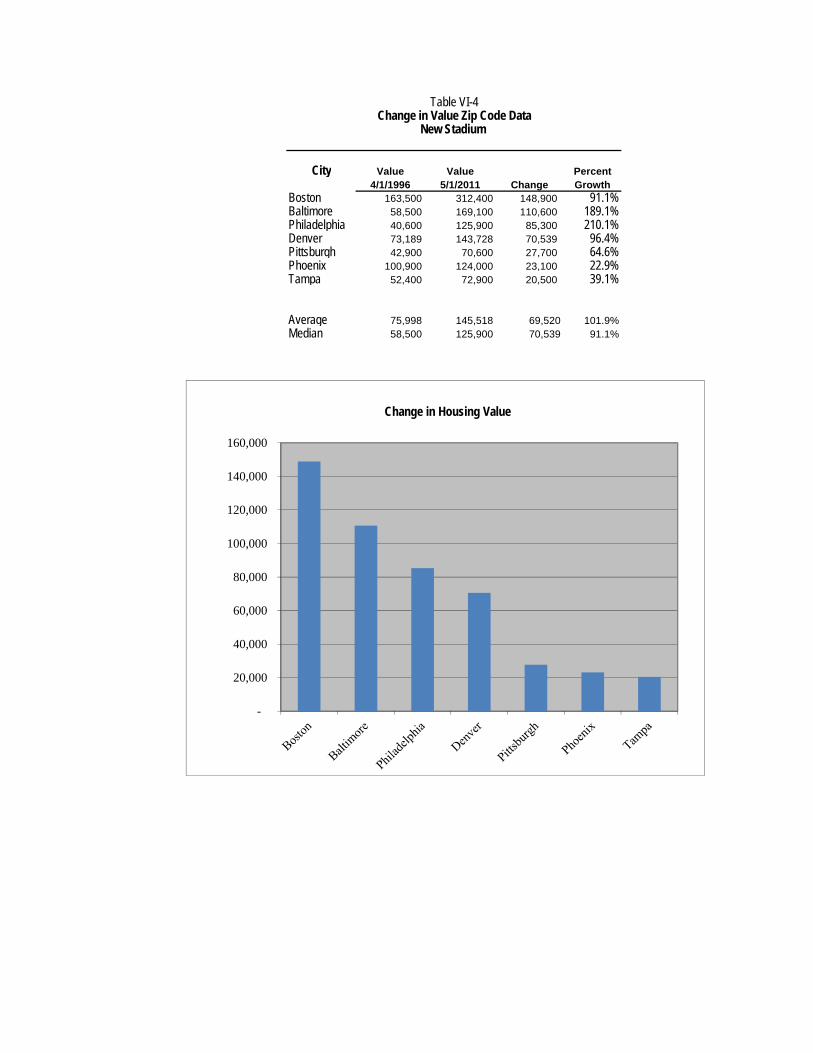
City Value Value Percent4/1/1996 5/1/2011 Change Growth
Boston 163,500 312,400 148,900 91.1%Baltimore 58,500 169,100 110,600 189.1%Philadelphia 40,600 125,900 85,300 210.1%Denver 73,189 143,728 70,539 96.4%Pittsburgh 42,900 70,600 27,700 64.6%Phoenix 100,900 124,000 23,100 22.9%Tampa 52,400 72,900 20,500 39.1%
Average 75,998 145,518 69,520 101.9%Median 58,500 125,900 70,539 91.1%
Change in Value Zip Code DataNew Stadium
Table VI-4
-
20,000
40,000
60,000
80,000
100,000
120,000
140,000
160,000
Change in Housing Value
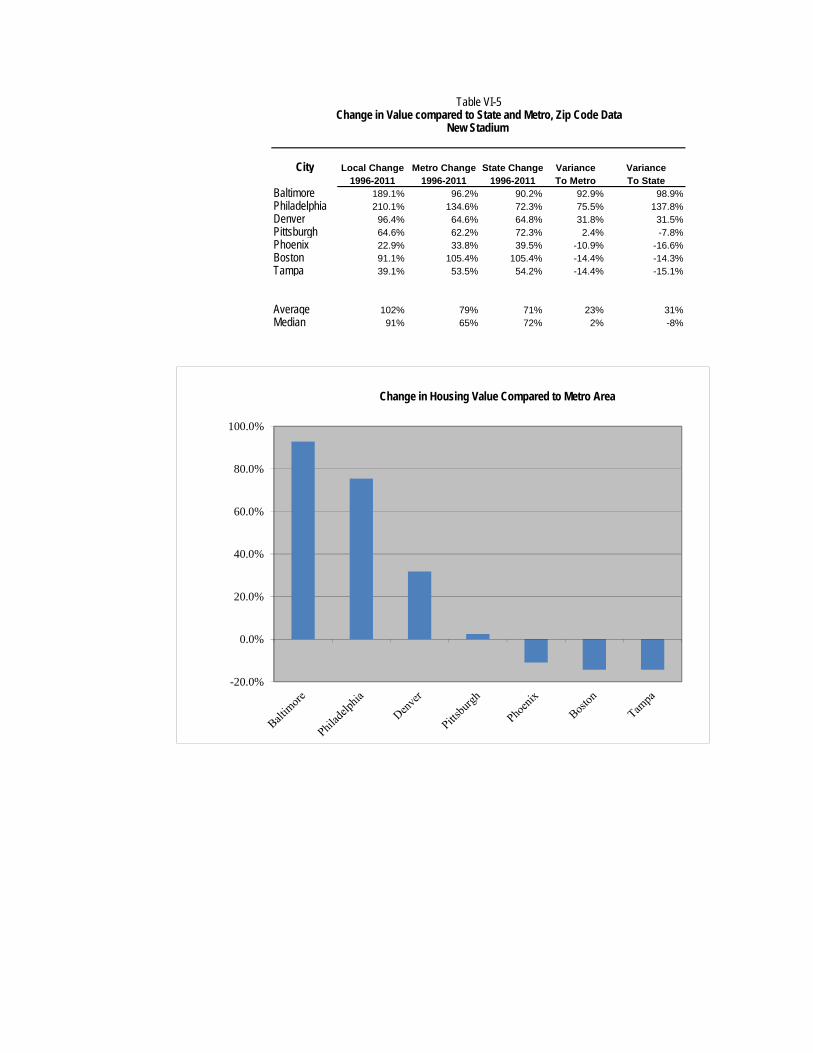
City Local Change Metro Change State Change Variance Variance1996-2011 1996-2011 1996-2011 To Metro To State
Baltimore 189.1% 96.2% 90.2% 92.9% 98.9%Philadelphia 210.1% 134.6% 72.3% 75.5% 137.8%Denver 96.4% 64.6% 64.8% 31.8% 31.5%Pittsburgh 64.6% 62.2% 72.3% 2.4% -7.8%Phoenix 22.9% 33.8% 39.5% -10.9% -16.6%Boston 91.1% 105.4% 105.4% -14.4% -14.3%Tampa 39.1% 53.5% 54.2% -14.4% -15.1%
Average 102% 79% 71% 23% 31%Median 91% 65% 72% 2% -8%
Change in Value compared to State and Metro, Zip Code DataNew Stadium
Table VI-5
-20.0%
0.0%
20.0%
40.0%
60.0%
80.0%
100.0%
Change in Housing Value Compared to Metro Area
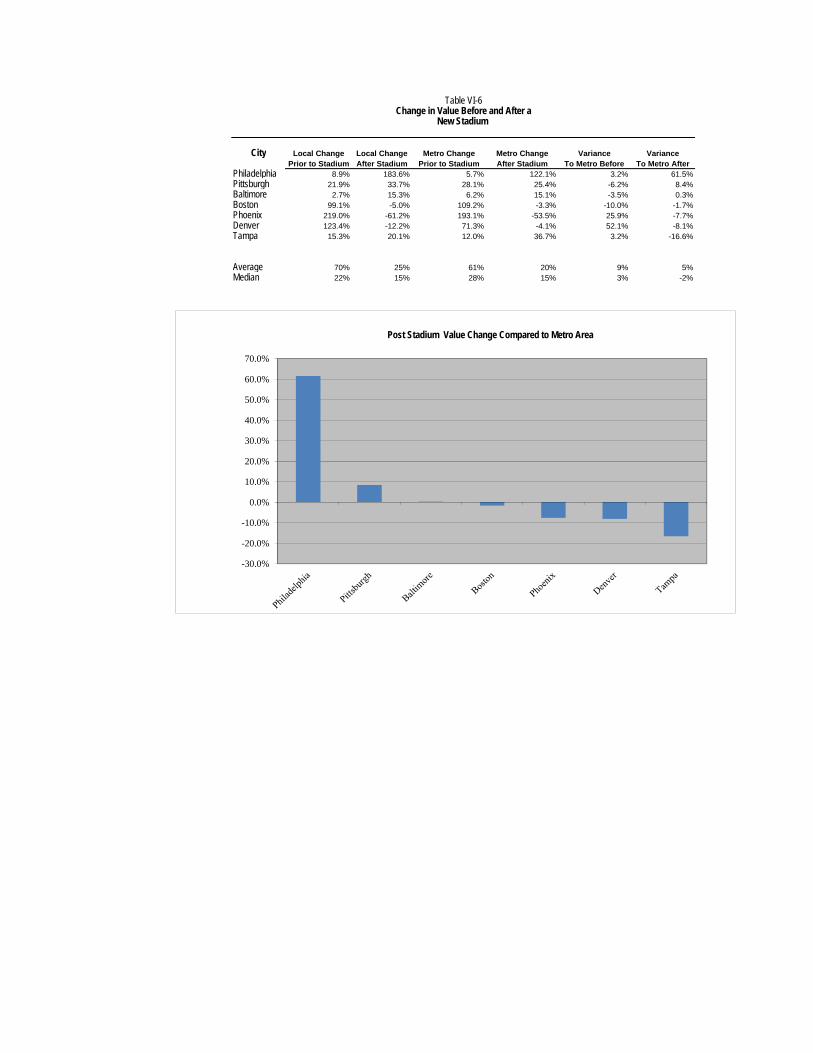
City Local Change Local Change Metro Change Metro Change Variance VariancePrior to Stadium After Stadium Prior to Stadium After Stadium To Metro Before To Metro After
Philadelphia 8.9% 183.6% 5.7% 122.1% 3.2% 61.5%Pittsburgh 21.9% 33.7% 28.1% 25.4% -6.2% 8.4%Baltimore 2.7% 15.3% 6.2% 15.1% -3.5% 0.3%Boston 99.1% -5.0% 109.2% -3.3% -10.0% -1.7%Phoenix 219.0% -61.2% 193.1% -53.5% 25.9% -7.7%Denver 123.4% -12.2% 71.3% -4.1% 52.1% -8.1%Tampa 15.3% 20.1% 12.0% 36.7% 3.2% -16.6%
Average 70% 25% 61% 20% 9% 5%Median 22% 15% 28% 15% 3% -2%
Change in Value Before and After aNew Stadium
Table VI-6
-30.0%
-20.0%
-10.0%
0.0%
10.0%
20.0%
30.0%
40.0%
50.0%
60.0%
70.0%
Post Stadium Value Change Compared to Metro Area
MR+E
AEG Special Events Center Market Impacts VI-26
Based on these case studies, it is possible to anticipate that Pico Union may experience only a marginal increase in
the value housing relative to the Los Angeles market as a whole. Applying the average experience of this case study
communities, Pico Union can anticipate a 5% increase in community housing values compared to the Los Angeles
market as a whole, over the long run after the introduction the stadium. The extent to which this change in housing
value is translated into rents would be determined by a variety of factors including vacancy rates and the addition of
new rental inventory in the community. In any event, there is not evidence to support the expectation that the
development of the Project adjacent to Pico Union will bring about large-scale increases in housing costs that will
have the effect of undermining housing affordability in the community nor are they anticipated to lead to a structural
transformation of the local housing market.
The experience of the community with STAPLES Center is further evidence of the role that a major sports and
entertainment venue plays in the value of residential real estate in neighboring communities. Since the opening of
STAPLES Center in 1999, Pico Union has not been the site of significant new residential development that has led to
gentrification, nor has it experienced a large scale conversion of units from rental to owner occupancy or a run up in
housing costs that have transformed the character of the community. STAPLES Center, along with LA Live have
served as a stabilizing influence on the community by providing nearby employment opportunities and community
benefits for the residents of Pico Union.

MR+E
AEG Special Events Center Market Impacts VII-1
Section VII Retail Mix
Introduction
The Project has the potential for substantial benefits to the local economy of Los Angeles. The expanded
Convention Center is anticipated to become more competitive for large-scale citywide events that drive visitor
spending and the consumption of hotel room nights. The Event Center would host a significant number of large-scale
spectator events, including NFL football games that will create demand for goods and services by spectators. Some
residents in Pico Union, however, have expressed concern that new spending by visitors and the additional economic
activity generated by the Project would distort the local retail market in such a manner that demand for sports apparel
and related items would overwhelm community serving retail.
The type of retail establishments that provide sporting goods and related memorabilia are included in the North
American Industrial Classification System (NAICS) as a subgroup of all retail establishments. This group, which is
coded 4511, includes Sporting Goods, Hobby, Book, and Music Stores. In the analysis which follows, the distribution
of retail stores in this classification will be examined in comparison to a number of comparable NFL venues to
determine the size of this component in the overall local retail market and to determine any relationships between the
presence of these retail establishments and levels of patronage at NFL venues. Stadiums that were developed
within the last 15 years were chosen as comparable venues. The 15 year time period was selected because it
provided several new stadiums and covered two economic expansions and recessions.
Conditions in Pico Union
At present, Pico Union has a retail mix oriented towards serving the local community. With the exception of some
notable region-serving retailers such as La Curacao, the retail outlets in Pico Union are primarily geared towards
meeting the day-to-day needs of the neighborhood's residents. At present, there are 340 retail stores reported within
the boundaries of the study area. The largest single category of retail store is food and beverage outlets, which
account for 64 outlets or approximately 19% of all retail outlets in the community. Table VII-1 shows the distribution
of retail outlets by major NAICS group for the plan area. Other significant categories include clothing and clothing
accessory stores, as well as miscellaneous retail stores.
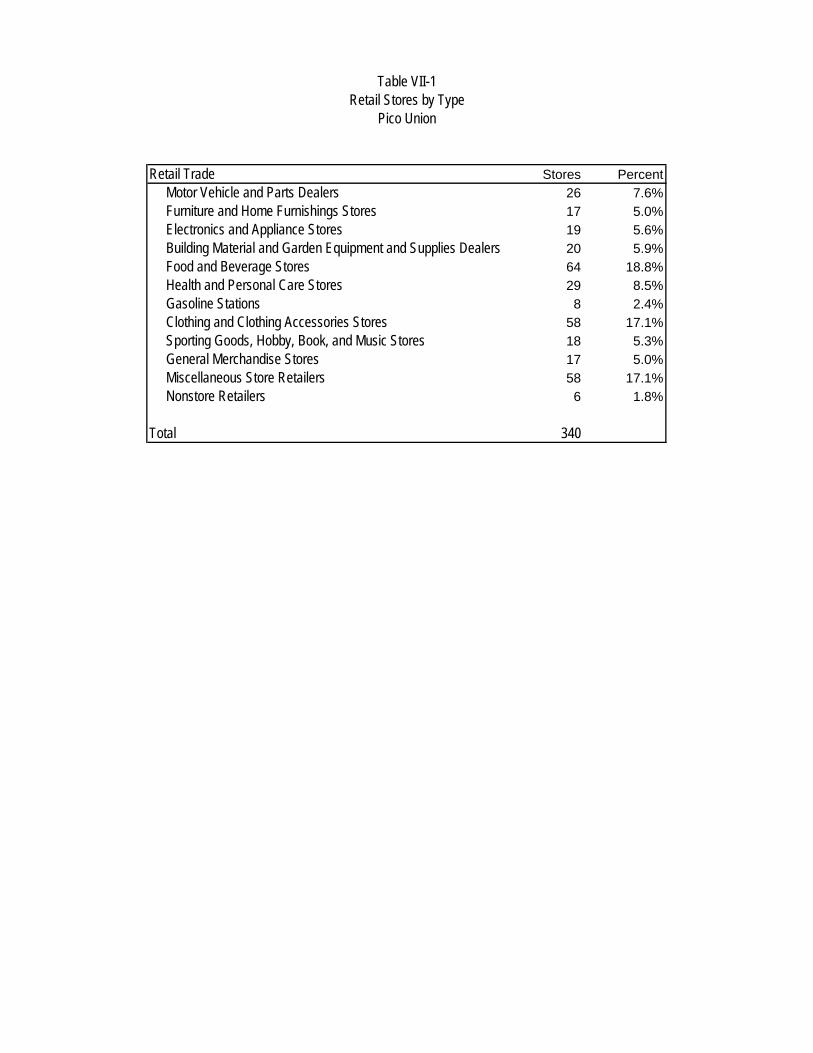
Retail Trade Stores Percent
Motor Vehicle and Parts Dealers 26 7.6%
Furniture and Home Furnishings Stores 17 5.0%
Electronics and Appliance Stores 19 5.6%
Building Material and Garden Equipment and Supplies Dealers 20 5.9%
Food and Beverage Stores 64 18.8%
Health and Personal Care Stores 29 8.5%
Gasoline Stations 8 2.4%
Clothing and Clothing Accessories Stores 58 17.1%
Sporting Goods, Hobby, Book, and Music Stores 18 5.3%
General Merchandise Stores 17 5.0%
Miscellaneous Store Retailers 58 17.1%
Nonstore Retailers 6 1.8%
Total 340
Table VII-1Retail Stores by Type
Pico Union
MR+E
AEG Special Events Center Market Impacts VII-3
Table VII-2 shows the ratio between the retail sector as a whole and the sporting goods hobby category in
comparison to total population and employment. At present, there are approximately 132 people in the community
per retail establishment. The retail sector accounts for approximately 22% of all business establishments within Pico
Union. The sporting goods subsector includes 18 stores, accounting for 1.2% of the total mix of businesses in the
community. This results in a ratio of 2,503 residents per sporting goods store.
According to the 2000 economic census, which would represent conditions one year after the opening of STAPLES
Center, in the two zip codes that overlap with Pico Union (90005 and 90015), the comparable categories accounted
for 2.91% of the total retail mix. This represents an increase of 2.39% in the share of retail establishments between
the opening of STAPLES Center and the present.
Comparable communities
In order to determine the effect of NFL stadiums on the retail mix of the surrounding area, this analysis examines the
distribution of retail stores located within a mile of comparable venues. Data is provided for the number and
percentage of sporting goods stores compared to the total retail trade category in each community. Data is provided
at four levels of geography as follows:
0 to 0.25 miles
0.25 to 0.5 miles
0.5 to 1.0 miles
Total from 0 to 1.0 miles
Data is provided for the number of establishments, employees as well as the residential population. In addition,
annual attendance for each stadium is provided.
Atlanta
The Georgia Dome, which is located near downtown Atlanta in the Vine City district, is in many ways similar to the
proposed Event Center in terms of its neighbors and location. The Stadium is located adjacent to the Georgia World
Congress Center, one of the nation’s largest convention center facilities, and the Philips Arena, which is home to the
Atlanta Hawks NBA franchise. Several major visitor attractions are located within walking distance of the Georgia
Dome, including the Georgia aquarium and the World of Coca-Cola attraction.
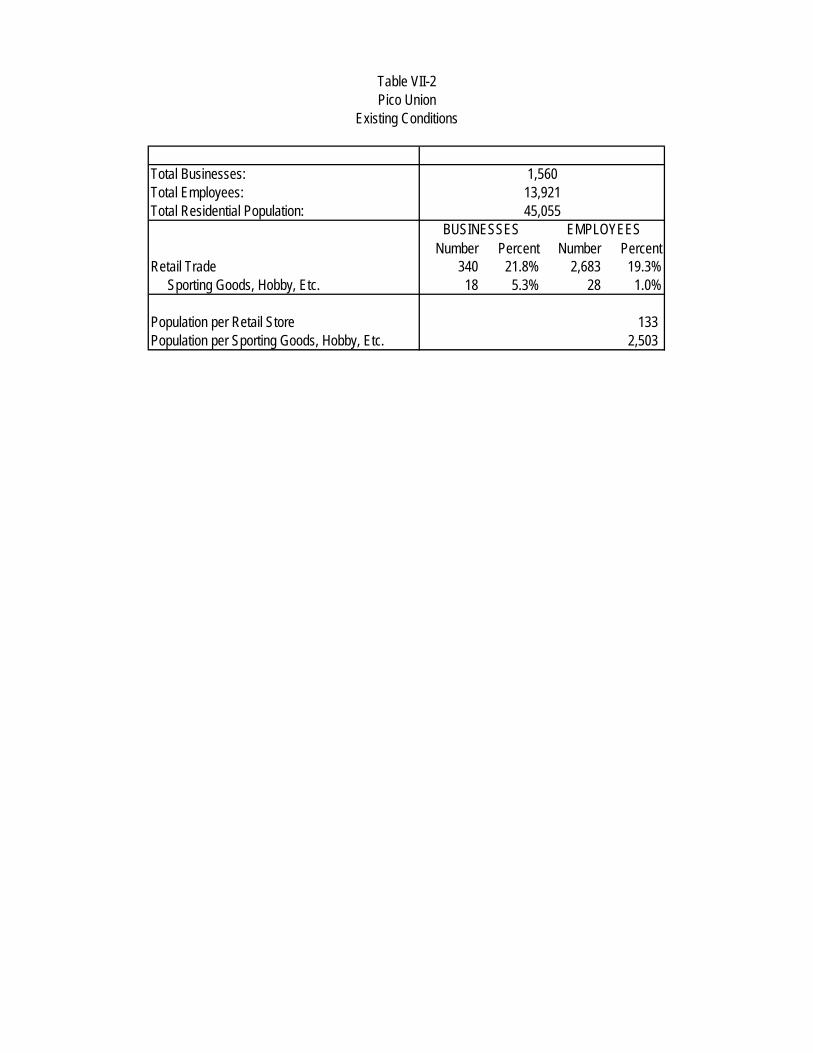
Total Businesses:Total Employees:Total Residential Population:
Number Percent Number PercentRetail Trade 340 21.8% 2,683 19.3% Sporting Goods, Hobby, Etc. 18 5.3% 28 1.0%
Population per Retail StorePopulation per Sporting Goods, Hobby, Etc.
Table VII-2Pico Union
Existing Conditions
2,503 133
45,055BUSINESSES EMPLOYEES
1,56013,921

MR+E
AEG Special Events Center Market Impacts VII-4
Table VII-3 shows the distribution of employment and establishments at three ranges of geography up to 1 mile
distant from the Stadium and tracks the entire retail trade sector and the sporting goods hobby etc. subsector. The
Stadium has an annual NFL attendance of just under 543,000 which yields an attendance per store of approximately
16,450. (this represents the NFL attendance per sporting goods store in the market area) As of 2011, there were 33
sporting goods stores representing 6.8% the total retail establishments located within a mile of the Stadium.
Cincinnati
Table VII-4 provides comparable information for Paul Brown Stadium in Cincinnati Ohio. The Stadium is located
along the banks of the Ohio River in Cincinnati's central business district. The Stadium is located approximately a
half mile south of the city’s convention center and is adjacent to the Great American ballpark, which is the home field
of the Cincinnati Reds. The fact that a baseball stadium is nearby may serve to increase levels of patronage at
sporting goods stores in the area. Paul Brown Stadium has an annual NFL attendance of just under 483,000. This
yields an annual attendance per sporting goods store of 17,247. There are 28 sporting goods stores located within 1
mile of the Stadium, which accounts for 7.7% of the local retail mix.
Arlington Texas (Dallas)
Cowboy Stadium located in the Dallas suburb of Arlington is part of a larger sports and entertainment complex that
includes the Rangers ballpark, a major league baseball stadium, and two amusement parks – Six Flags over Texas
and Six Flags Hurricane Harbor. There are nine sporting goods stores located within a mile the stadium which
represent 5.2% of the total retail mix in the area. This is the newest facility in the sample and as such, the number of
sporting goods stores in the area may increase over time. The Stadium has an annual NFL attendance of just under
670,000, which yields an attendance ratio of its 77,375 attendees per store. Table VII-5 illustrates the distribution for
this facility.

Total Businesses:
Total Employees:
Total Residential Population:
Number Percent Number Percent Number Percent Number Percent
Retail Trade 2 11.8% 41 8.5% 444 9.2% 487 9.2% Sporting Goods, Hobby, Etc. 0 0.0% 4 9.8% 29 6.5% 33 6.8%
Population per Retail StorePopulation per Sporting Goods, Hobby, Etc.
Annual Attendance 542,800Attendance per Store 16,448
Source: Dunn and Bradstreet, NFL and MR+E
614.4
AtlantaGeorgia Dome
5,30398,03420,276
324.00
89.3915.8 550.5
36.0 41.6
4,803
223 10,592
648 3,663 15,965BUSINESSESBUSINESSES BUSINESSES
Total
BUSINESSES
87,219
Table VII-3
0 to 0.25 Miles 0.25 to 0.5 Miles 0.5 to 1.0 Miles17 483

Total Businesses:
Total Employees:
Total Residential Population:
Number Percent Number Percent Number Percent Number Percent
Retail Trade 11 8.3% 95 8.9% 260 9.9% 366 9.5% Sporting Goods, Hobby, Etc. 1 9.1% 7 7.4% 20 7.7% 28 7.7%
Population per Retail StorePopulation per Sporting Goods, Hobby, Etc.
Annual Attendance 482,917Attendance per Store 17,247
Source: Dunn and Bradstreet, NFL and MR+E
3 127.1 616.1 471.9
BUSINESSES
0.3 9.4 47.4 36.1
3 890 12,321 13,214BUSINESSES BUSINESSES BUSINESSES
132 1,073 2,632 3,8375,152 38,364 66,831 110,347
Table VII-4Cincinnati
Paul Brown Stadium
0 to 0.25 Miles 0.25 to 0.5 Miles 0.5 to 1.0 Miles Total
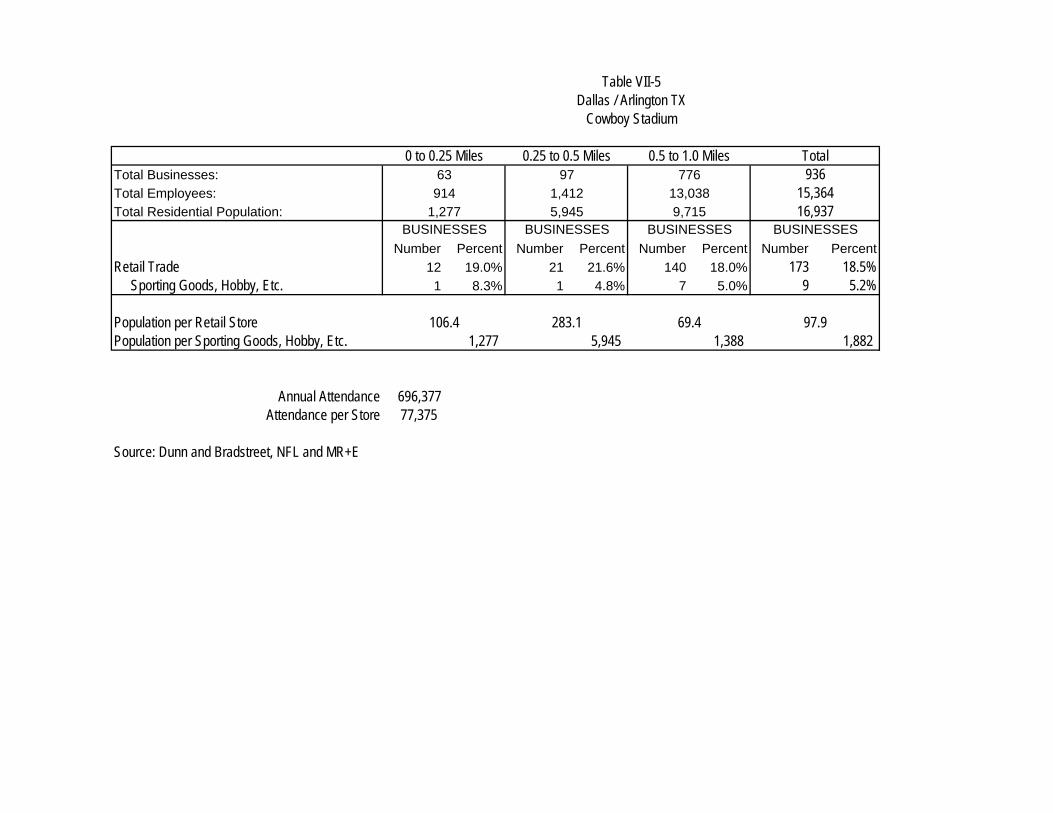
Total Businesses:
Total Employees:
Total Residential Population:
Number Percent Number Percent Number Percent Number Percent
Retail Trade 12 19.0% 21 21.6% 140 18.0% 173 18.5% Sporting Goods, Hobby, Etc. 1 8.3% 1 4.8% 7 5.0% 9 5.2%
Population per Retail StorePopulation per Sporting Goods, Hobby, Etc.
Annual Attendance 696,377Attendance per Store 77,375
Source: Dunn and Bradstreet, NFL and MR+E
1,277 5,945 1,388 1,882
BUSINESSES
106.4 283.1 69.4 97.9
1,277 5,945 9,715 16,937BUSINESSES BUSINESSES BUSINESSES
63 97 776 936914 1,412 13,038 15,364
Table VII-5Dallas / Arlington TX
Cowboy Stadium
0 to 0.25 Miles 0.25 to 0.5 Miles 0.5 to 1.0 Miles Total
MR+E
AEG Special Events Center Market Impacts VII-8
Denver
Located in the Sun Valley community of Denver, Sports Authority Field at Mile High is the home of the Denver
Broncos NFL franchise. The stadium is located on the west side of downtown Denver and is separated from the
central business district by I-25. Annual attendance for NFL events of the Stadium was just under 600,000 in 2011,
which yielded an annual average attendance of just under 75,000 per store for the eight stores in the sporting goods
category located within a mile of the stadium. As shown on Table VII-6, these stores represented a 5.2% share of
the retail business mix in the area.
Detroit
Ford Field in Detroit Michigan is the home field of the Lions NFL franchise. The Stadium is located adjacent to
Comerica Park, which is the home stadium for the Detroit Tigers major league baseball team. For 2011, there were
reported 24 sporting goods located within a mile of Ford Field. Based on an annual football attendance of just over
450,000, this yielded an annual attendance per store of 18,762. Details on the business mix and relationship
between attendance and stores is displayed on Table VII-7. The presence of a nearby baseball stadium in the area
may lead to more market support for sporting goods retailers from non-NFL generated patrons than in the football
only comparables
Indianapolis
Home to the Indianapolis Colts of the NFL, Lucas Oil Stadium is located in downtown Indianapolis adjacent to the
Indiana convention center in the southwest quadrant of the city's downtown district. Table VII-8 provides data on the
distribution of sporting goods stores within a mile of the stadium. This category represents 8.1% of the total business
mix in the area. Indianapolis reported a NFL attendance of just under 536,000, which resulted in an attendance per
store of approximately 33,500.

Total Businesses:
Total Employees:
Total Residential Population:
Number Percent Number Percent Number Percent Number Percent
Retail Trade 10 19.2% 14 16.3% 85 13.4% 109 14.1% Sporting Goods, Hobby, Etc. 0 0.0% 3 21.4% 5 5.9% 8 7.3%
Population per Retail StorePopulation per Sporting Goods, Hobby, Etc.
Annual Attendance 599,264Attendance per Store 74,908
Source: Dunn and Bradstreet, NFL and MR+E
0.0 1087.0 3077.2 2430.8
BUSINESSES
79.9 232.9 181.0 178.4
799 3,261 15,386 19,446BUSINESSES BUSINESSES BUSINESSES
52 86 634 772802 1,048 14,471 16,321
Table VII-6Denver
Sports Authority Field
0 to 0.25 Miles 0.25 to 0.5 Miles 0.5 to 1.0 Miles Total

Total Businesses:
Total Employees:
Total Residential Population:
Number Percent Number Percent Number Percent Number Percent
Retail Trade 11 7.1% 63 9.4% 175 8.2% 249 8.4% Sporting Goods, Hobby, Etc. 1 9.1% 5 7.9% 18 10.3% 24 9.6%
Population per Retail StorePopulation per Sporting Goods, Hobby, Etc.
Annual Attendance 450,286Attendance per Store 18,762
Source: Dunn and Bradstreet, NFL and MR+E
59.0 1017.6 720.4 754.8
BUSINESSES
5.4 80.8 74.1 72.8
59 5,088 12,968 18,115BUSINESSES BUSINESSES BUSINESSES
156 670 2,129 2,9555,111 22,288 96,592 123,991
Table VII-7Detroit
Ford Field
0 to 0.25 Miles 0.25 to 0.5 Miles 0.5 to 1.0 Miles Total

Total Businesses:
Total Employees:
Total Residential Population:
Number Percent Number Percent Number Percent Number Percent
Retail Trade 11 11.0% 78 15.4% 109 5.2% 198 7.3% Sporting Goods, Hobby, Etc. 1 9.1% 5 6.4% 10 9.2% 16 8.1%
Population per Retail StorePopulation per Sporting Goods, Hobby, Etc.
Annual Attendance 535,802Attendance per Store 33,488
Source: Dunn and Bradstreet, NFL and MR+E
196.0 104.0 879.3 594.3
BUSINESSES
17.8 6.7 80.7 48.0
196 520 8,793 9,509BUSINESSES BUSINESSES BUSINESSES
100 506 2,107 2,7132,192 15,251 84,758 102,201
Table VII-8Indianapolis
Lucas Oil Stadium
0 to 0.25 Miles 0.25 to 0.5 Miles 0.5 to 1.0 Miles Total
MR+E
AEG Special Events Center Market Impacts VII-12
Glendale AZ (Phoenix)
Located in the Phoenix suburb of Glendale Arizona, University of Phoenix Stadium is home to the Arizona Cardinals
NFL franchise. The Stadium is located directly adjacent to the Westgate City Center Mall, which also includes the
Jobbing.com arena, which is home to the Phoenix Coyotes NHL franchise. At present, the area supports one
standalone independent sporting goods store within the mall. There is no other free standing retail within a mile of the
stadium. Details on the business mix and attendance ratios are provided on table VII-9
Seattle
The city's NFL Stadium, Century Link Field, is located in an infrastructure dense area south west of the city's
international district adjacent to the port of Seattle. It is directly adjacent to Safeco Field, which is the home of the
Seattle Mariners major league baseball franchise. Table VII-10 provides information on the distribution of sporting
goods stores in relation to the stadium. At present there are 57 stores in this category located within a mile of the
facility representing 8.5% of the retail business mix in the area.
St. Louis
The Edward Jones Dome located in downtown St. Louis is integrated into the city’s convention center (known as the
America’s Center). Since 1995, the Stadium has been the home of the St. Louis Rams NFL football club. The
Stadium is located near Bush Stadium, which is the home to the St. Louis Cardinals. At present, there are 13
sporting goods shops within a mile of the Stadium representing 7.6% of the retail business mix and the area. As with
some of the other case studies the presence of a baseball stadium nearby would suggest that some of the support
for these outlets comes from non-NFL patrons. With an NFL attendance of just over 423,00,0 this resulted in an
attendance per store of 32,500 patrons. Detailed data on the distribution is provided on table VII-10.
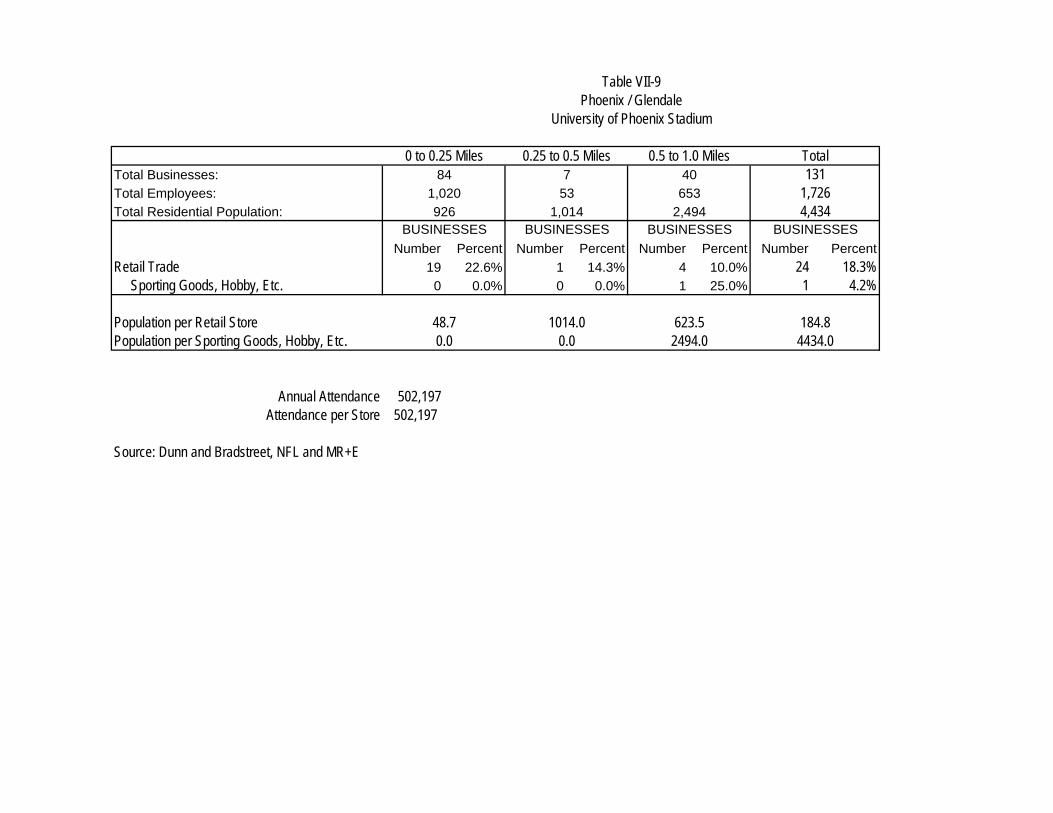
Total Businesses:
Total Employees:
Total Residential Population:
Number Percent Number Percent Number Percent Number Percent
Retail Trade 19 22.6% 1 14.3% 4 10.0% 24 18.3% Sporting Goods, Hobby, Etc. 0 0.0% 0 0.0% 1 25.0% 1 4.2%
Population per Retail StorePopulation per Sporting Goods, Hobby, Etc.
Annual Attendance 502,197Attendance per Store 502,197
Source: Dunn and Bradstreet, NFL and MR+E
0.0 0.0 2494.0 4434.0
BUSINESSES
48.7 1014.0 623.5 184.8
926 1,014 2,494 4,434BUSINESSES BUSINESSES BUSINESSES
84 7 40 1311,020 53 653 1,726
Table VII-9Phoenix / Glendale
University of Phoenix Stadium
0 to 0.25 Miles 0.25 to 0.5 Miles 0.5 to 1.0 Miles Total
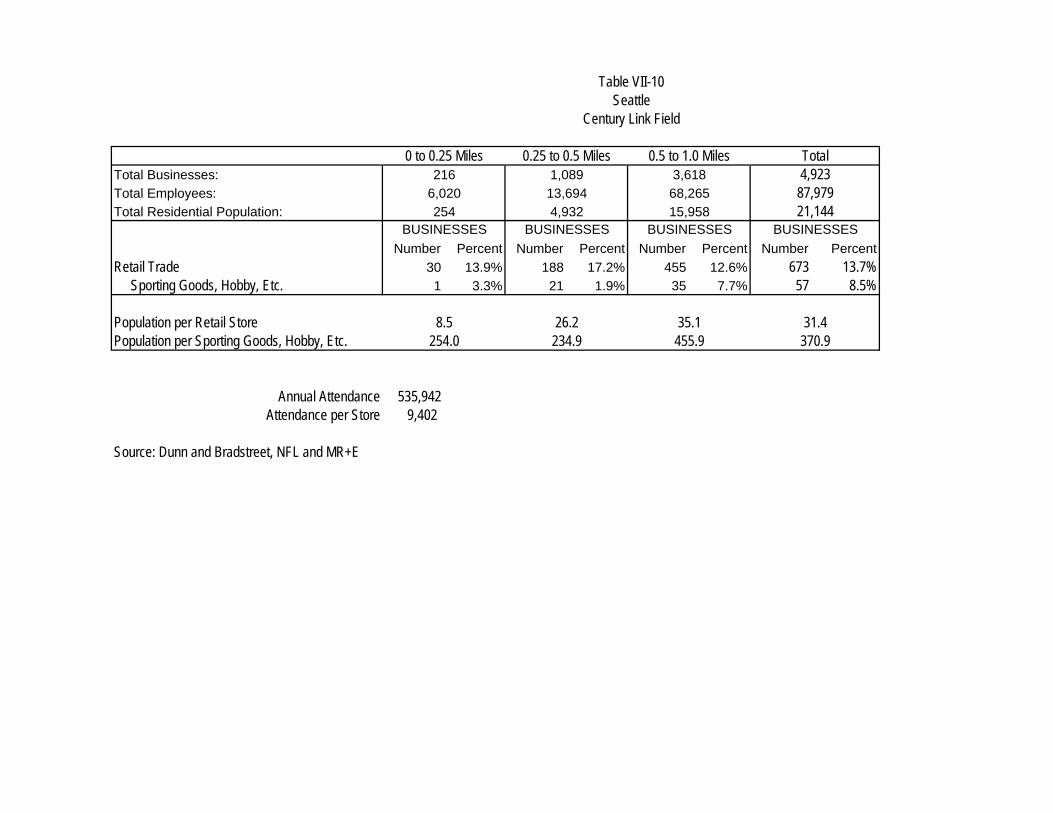
Total Businesses:
Total Employees:
Total Residential Population:
Number Percent Number Percent Number Percent Number Percent
Retail Trade 30 13.9% 188 17.2% 455 12.6% 673 13.7% Sporting Goods, Hobby, Etc. 1 3.3% 21 1.9% 35 7.7% 57 8.5%
Population per Retail StorePopulation per Sporting Goods, Hobby, Etc.
Annual Attendance 535,942Attendance per Store 9,402
Source: Dunn and Bradstreet, NFL and MR+E
254.0 234.9 455.9 370.9
BUSINESSES
8.5 26.2 35.1 31.4
254 4,932 15,958 21,144BUSINESSES BUSINESSES BUSINESSES
216 1,089 3,618 4,9236,020 13,694 68,265 87,979
Table VII-10Seattle
Century Link Field
0 to 0.25 Miles 0.25 to 0.5 Miles 0.5 to 1.0 Miles Total

Total Businesses:
Total Employees:
Total Residential Population:
Number Percent Number Percent Number Percent Number Percent
Retail Trade 18 6.6% 74 6.9% 80 10.3% 172 8.1% Sporting Goods, Hobby, Etc. 2 11.1% 6 8.1% 5 6.3% 13 7.6%
Population per Retail StorePopulation per Sporting Goods, Hobby, Etc.
Annual Attendance 423,383Attendance per Store 32,568
Source: Dunn and Bradstreet, NFL and MR+E
83.50 574.5 1131.4 713.2
BUSINESSES
9.3 46.6 70.7 53.9
167 3,447 5,657 9,271BUSINESSES BUSINESSES BUSINESSES
271 1,072 778 2,1216,995 26,279 24,407 57,681
Table VII-11St. Louis
A.G. Edwards Dome
0 to 0.25 Miles 0.25 to 0.5 Miles 0.5 to 1.0 Miles Total
MR+E
AEG Special Events Center Market Impacts VII-16
Market Effects
Table VII-11 shows the total number of sporting goods and hobby stores by distance from the stadium for each of the
case study communities. Within a mile from the stadium, the average number of retail outlets in this category was 21
stores and the median value was 16; within a half mile, the average and median number of retail outlets was seven;
and within a quarter-mile the average and median number of retail stores was one. .
In terms of the retail mix, the distribution of sporting goods stores ranges from a high of 9.6% of all retail stores in
Detroit to a low of 4.2% in Phoenix. The average share of the total retail establishments across the comparative
cities was 7%, with the median slightly higher of 7.6% of the retail mix. The average number of stores in this
category was 21 with a median of 16. Table VII-13 illustrates the distribution.
An additional measure of the relationship between sporting goods stores and stadium activity is a relationship
between NFL attendance and the total numbers of stores. Table VII-14 shows this relationship for each of the
comparable communities. The attendance figures for each stadium were based on information provided by the NFL
and cover the 2010-2011 season. On average, just under 87,000 attendees support one sporting goods store within
a mile of the venue. This average is somewhat positively skewed with a median of just over 32,500 attendees per
store. Local patronage is shown on the table, as well as values for resident population within a mile per store, which
range from a high of 4,434 in Phoenix to a low of 371 in Seattle.
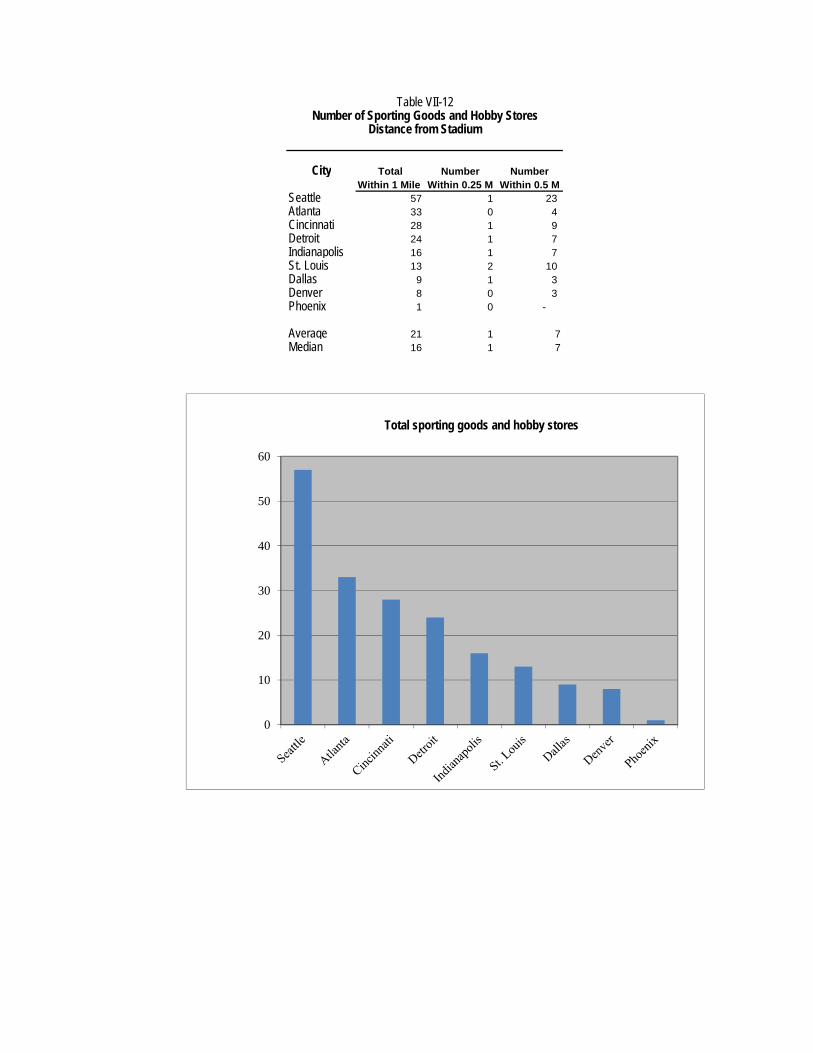
City Total Number NumberWithin 1 Mile Within 0.25 M Within 0.5 M
Seattle 57 1 23 Atlanta 33 0 4 Cincinnati 28 1 9 Detroit 24 1 7 Indianapolis 16 1 7 St. Louis 13 2 10 Dallas 9 1 3 Denver 8 0 3 Phoenix 1 0 -
Average 21 1 7Median 16 1 7
Number of Sporting Goods and Hobby StoresDistance from Stadium
Table VII-12
0
10
20
30
40
50
60
Total sporting goods and hobby stores
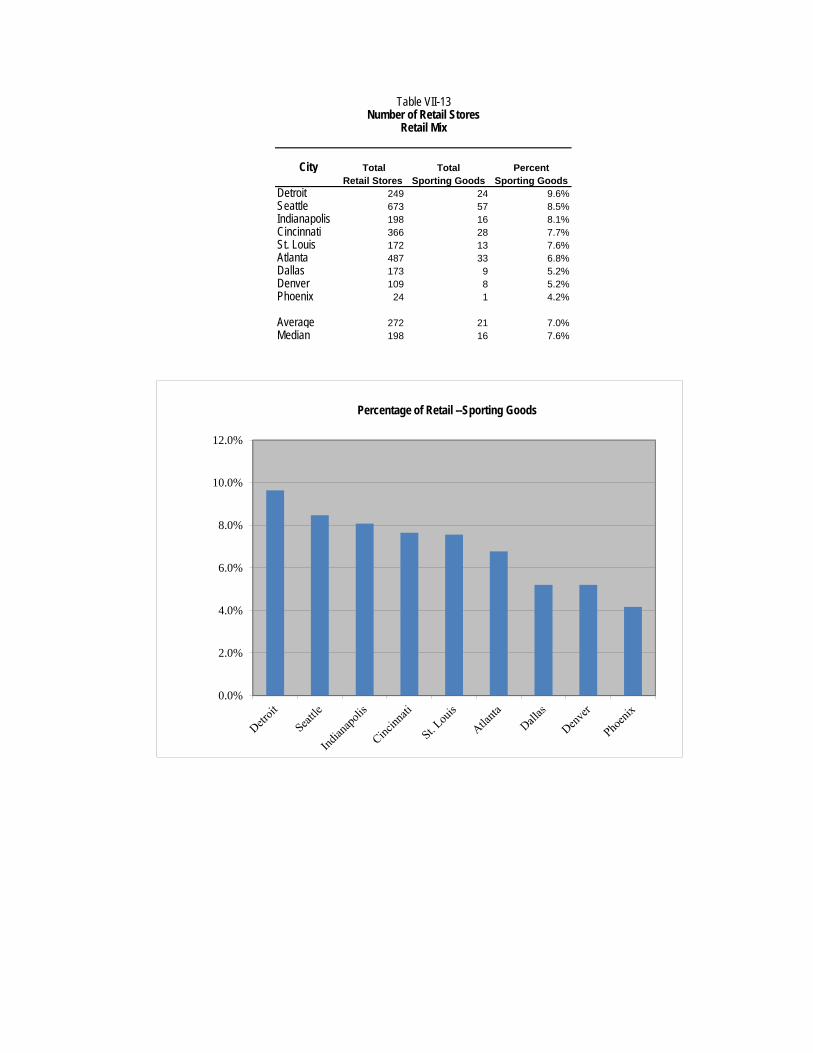
City Total Total PercentRetail Stores Sporting Goods Sporting Goods
Detroit 249 24 9.6%Seattle 673 57 8.5%Indianapolis 198 16 8.1%Cincinnati 366 28 7.7%St. Louis 172 13 7.6%Atlanta 487 33 6.8%Dallas 173 9 5.2%Denver 109 8 5.2%Phoenix 24 1 4.2%
Average 272 21 7.0%Median 198 16 7.6%
Number of Retail StoresRetail Mix
Table VII-13
0.0%
2.0%
4.0%
6.0%
8.0%
10.0%
12.0%
Percentage of Retail --Sporting Goods
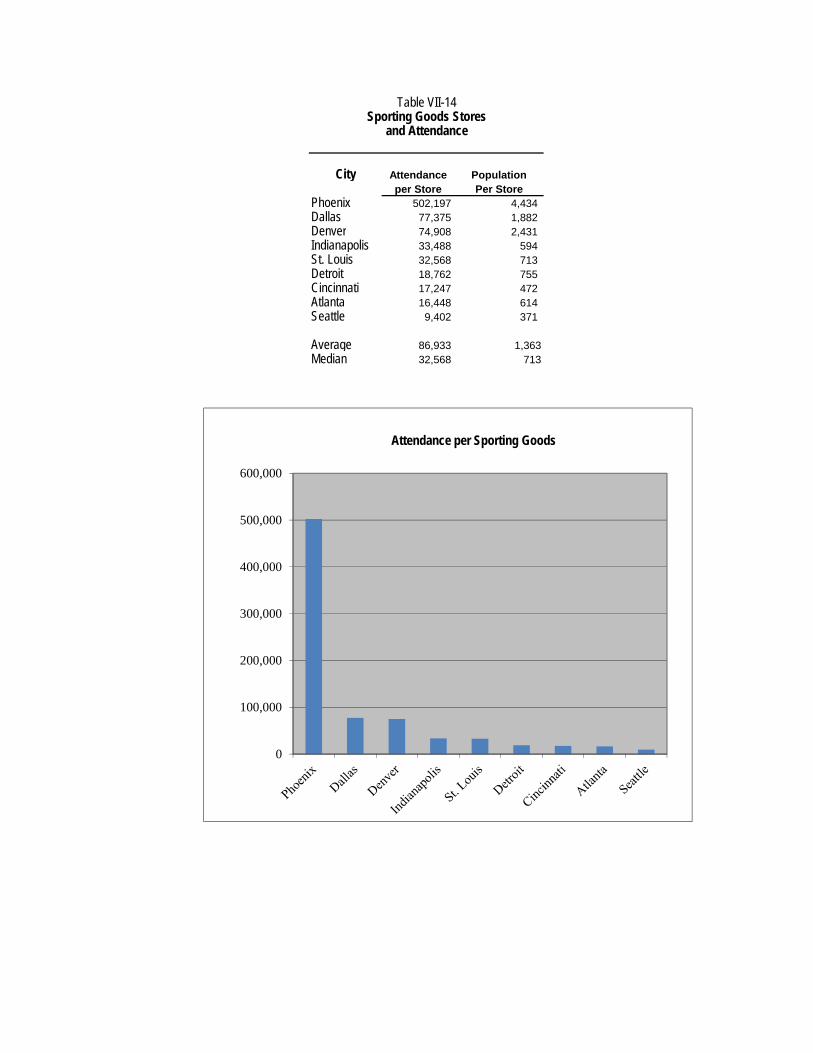
City Attendance Populationper Store Per Store
Phoenix 502,197 4,434 Dallas 77,375 1,882 Denver 74,908 2,431 Indianapolis 33,488 594 St. Louis 32,568 713 Detroit 18,762 755 Cincinnati 17,247 472 Atlanta 16,448 614 Seattle 9,402 371
Average 86,933 1,363Median 32,568 713
Sporting Goods Storesand Attendance
Table VII-14
0
100,000
200,000
300,000
400,000
500,000
600,000
Attendance per Sporting Goods

MR+E
AEG Special Events Center Market Impacts VII-21
Based on the foregoing, the following three measures are used to forecast the likely future presence of sporting
goods retailers in the Pico Union area based on the observed frequency in the comparable communities:
1. Average number of retail stores
2. Average percentage distribution of sporting goods stores
3. Ratio of sporting goods stores to NFL attendance (assumes two NFL tenants at the Event Center with a
total football attendance of 1,740,000)
Given these factors, the following range of frequency for sporting goods stores in Pico Union can be anticipated as
follows
Forecast for Pico Union
Number Percent of Retail
Factor Stores Net growth Percent Net growth 1) Average number of stores 24 6 7.0% 1.7%
2) Percent distribution 21 3 6.2% 0.9% 3) NFL attendance
20.0 2 5.9% 0.6%
1. Based on analysis of the average number of stores within a mile of the Event Center, Pico Union can
anticipate being the site of 24 sporting good outlets in this category, representing a net increase of six net
new stores in the community. This would translate to sporting goods stores comprising approximately 7% of
all retail stores in the Pico Union area, or an increase of 1.7% over the existing levels.
2. Using the average percent distribution as a baseline, Pico Union can anticipate the addition of three net new
sporting goods stores within one mile of the Event Center. This would result in three net new outlets in the
community and an increase in the composition of sporting goods stores in the retail mix of just under 1%.
3. A forecast based on anticipated NFL attendance produces market support for a total of 20 sporting goods
stores within a mile of the venue. This would represent a net growth of two new outlets or an increase of
just over 0.5% in the retail mix.
MR+E
AEG Special Events Center Market Impacts VII-22
Summary and conclusions
The analysis of comparable communities suggests that there is likely to be an increase demand for sporting goods
and related memorabilia within one mile of the Project. Based on average performance, Pico Union can be
anticipated to support between 20 and 24 stores tied to activities at the stadium. This represents a net increase of
between two and six new sporting good outlets. It is likely that the 18 existing outlets located within the community
will reorient more of their offerings to meet the demand of patrons drawn to the area by the presence of spectator
events at the Event Center. Currently sporting goods outlets represent 5.3% of the total retail mix within Pico Union.
This level representation can be anticipated to increase to between nearly 6% and 7% once the Event Center is
operational.
A net increase of approximately 0.6% to 1.7% of sporting goods stores in the retail mix can be anticipated to occur in
the community. The Project will represent an opportunity for economic development and new expenditures in Pico
Union. At the same time the demand for sporting goods and related items does not represent a level of change that
can be anticipated to significantly alter the community serving nature of retail outlets in Pico Union as a whole.
The experience of STAPLES Center is indicative of the relative effect that a major sporting venue has had on the
community. Since its opening in 1999 STAPLES Center has been the home of two National Basketball Association
and one National Hockey League franchises in addition to several other sports teams and public events. During this
time the retail mix in Pico Union has largely been oriented towards the community and its needs rather than meeting
the demands of facility patrons. This market orientation in the overall retail mix of Pico Union is likely to remain after
the development of the Project.
MR+E
AEG Special Events Center Market Impacts VIII-1
Section VIII Urban Decay
Introduction
This section describes the potential effects from Project implementation on the physical condition of comparable
public assembly facilities in the Los Angeles market and the potential for the Project to result in urban decay at these
facilities. The California Environmental Quality Act (“CEQA”) requires that significant effects on the environment be
analyzed, disclosed, and mitigated, if feasible; prior to the approval of discretionary land use approvals. The CEQA
Guidelines require that indirect physical changes not immediately related to the project that are caused indirectly by
the project must be disclosed. In the context of CEQA, urban decay is considered an indirect physical impact. The
focus of this analysis is to determine if the development of new public event hosting capacities in the market has the
potential to result in the closure of or, dis-investment in, competing facilities which may, in turn, result in conditions
that lead to urban decay.
The evaluation of potential urban decay impacts has traditionally been outside the realm of CEQA. However, key
court decisions such as Bakersfield Citizens for Local Control v. City of Bakersfield, 124 Cal. App. 4th 1184 (Cal.
App. 5th Dist. 2004), as well as Anderson First Coalition. v. City of Anderson , 130 Cal. App. 4th 1173 (Cal. App. 3d
Dist. 2005)e, have suggested that this type of analysis should be undertaken to assess the possibility of urban decay
and indirect physical impacts on the environment as part of significant projects that are commercial in nature.
For the purpose of this analysis, urban decay is defined as physical deterioration that is so prevalent and substantial
that it impairs the proper utilization of affected real estate or the health, safety, and welfare of the surrounding
community. Physical deterioration includes, but is not limited to: abnormally high vacancies, abandoned buildings,
and social dislocation resulting from decreased utilization at competing sites. Note that these are different criteria
than the findings of blight as defined by the Community Redevelopment Law.
Using the standard of decay, the Project could be said to have an influence on the physical conditions of the
competitive facilities if its presence in the market place leads to a cycle of dis-use and dis-investment that is
consistent with urban decay. In order to establish the potential for urban decay the following factors will be analyzed:
Identification of comparable competitive facilities in the Los Angeles market;
Planned and recent capital investments that affect the physical condition of the competitive facilities; and
Potential for displacement of existing event activity from Los Angeles area facilities to the Project.
In assessing the potential for displacement two separate types of public events will be analyzed:
MR+E
AEG Special Events Center Market Impacts VIII-2
Spectator events, defined as mass public events that are anticipated to utilize the Project’s proposed 72,000
seat Event Center; and
Public assemblies, defined as events that would primarily use the upgraded Convention Center facilities
included in the Project.
For urban decay to occur, the physical condition of the effected facility must be degraded significantly. The loss of
market share and a more competitive environment are not sufficient conditions for findings of urban decay.
Market Definition
The market for the spectator events and public assemblies can overlap but each is affected by different dynamics
and program requirements. Generally speaking, the spectator events require a stadium configuration with a seating
bowl whereas the public assemblies principally require flat floor exhibit space and meeting rooms. There is potential
overlap in a joint use facility such as the one that is been proposed in this Project, however the specific program
requirements of each of these activities limits the number of potential competitive sites that could be affected by
development of the Project.
Spectator events
The Project is intended to take advantage of the fact that currently the Los Angeles area is unable to attract a
National Football League (“NFL” or the “League”) franchise to any of the existing stadiums in the market. Since the
departure of the Los Angeles Raiders and Los Angeles Rams NFL franchises from the Los Angeles market prior to
the start of the 1995 NFL season, the NFL has entertained several detailed proposals to locate a professional football
franchise in Los Angeles County. Through this process, the League has analyzed the potential for operating at an
existing stadium facility in the County. The two existing facilities that would be able to accommodate the NFL are the
Los Angeles Memorial Coliseum located in Exposition Park in the City of Los Angeles, and the Rose Bowl located in
Pasadena. In addition to the existing facilities, there have been a broad variety of speculative proposals to build new
stadium facilities that could accommodate an NFL franchise in the Los Angeles market. However, to date none of
these proposals have moved beyond a planning stage nor have any of these proposals been able to secure an NFL
tenant.
The scale of the Project would place the Event Center in the market for events ranging from greater than 20,000 to
72,000 spectators. The upper range is far larger than what could be accommodated by any of the existing indoor
arenas in Los Angeles County. As a result, the facilities that could potentially face a displacement of their existing
levels of utilization would be limited to large scale stadium facilities. The key competitive facilities that could
potentially be affected by the Project include:
MR+E
AEG Special Events Center Market Impacts VIII-3
The Los Angeles County Memorial Coliseum— Operated by the Coliseum Commission (a joint powers agency
that includes the City of Los Angeles, Los Angeles County and the State of California), the Coliseum is a 93,000-seat
stadium. Completed in 1923, the Coliseum has been the site of two Olympic Games and has in the past served as a
home stadium for two NFL franchises (the Los Angeles Rams from 1946 to 1979 and the Los Angeles Raiders from
1982 to 1994). The Coliseum is also a registered National Historic Landmark that both recognizes its importance to
the region and at the same time requires preservation of its key architectural features. In 2008, the Coliseum
Commission entered into a master tenant relationship with the University of Southern California (“USC”) that
effectively reserves USC as the only football user of the stadium. The agreement calls for revenue sharing between
the parties and capital improvements by the Commission in exchange for USC assuming operations and
management responsibilities.
The Rose Bowl—Completed in 1922, the Rose Bowl, which is listed as a National Historic Landmark, is owned by
the City of Pasadena and operated by the non-profit Rose Bowl Operating Company. The stadium is the site of the
annual Tournament of Roses college football championship game. Since 1982, the Rose Bowl has been the home
stadium for the University of California – Los Angeles (“UCLA”) football team. In addition, the Rose Bowl has been
used as a venue for special events including the FIFA Men’s World Cup in 1994, the FIFA Woman’s World Cup in
1999 and five NFL Super Bowls. The stadium has a capacity of just over 93,000 seats, which can change based on
differing configurations.
In addition to these two major outdoor stadiums, there are other facilities that due to their seating capacity or
configuration are unlikely to see their utilization for spectator events affected by the Project. The Event Center is
generally not expected to attract spectator events with an anticipated attendance of fewer than 20,000 attendees.
The other local facilities that are not anticipated to be directly impacted by the Project include:
Dodger Stadium, Los Angeles—Home to the Los Angeles Dodgers, this baseball-only stadium has limited
capacity to accommodate non-baseball sporting events. Concerts and religious services have been
conducted at the stadium in the past on an irregular basis. Constructed in 1962, Dodger Stadium was not
intended to be a multi-purpose facility and this has limited its ability to be used as a venue for non-baseball
events. The stadium has a capacity of approximately 56,000. The owner occupied facility underwent major
renovations in 2006. Capital investments undertaken at the time included a replacement of the stadium’s
seats, repair and maintenance on the structure within the seating bowl area and construction of club seats
along the baseline seating area. These changes have reinforced the baseball orientation of the stadium.
The Home Depot Center, Carson— Operated by AEG, this stadium has a maximum capacity of 27,000.
The Home Depot Center is a relatively new facility which was completed in 2003 with a capital cost of
approximately $150 million. The stadium currently has two Major League Soccer (“MLS”) teams as tenants
MR+E
AEG Special Events Center Market Impacts VIII-4
and has hosted special events such as concerts and tournaments for a variety of amateur and professional
sports such as rugby and lacrosse. Other features at the Home Depot Center include, a tennis venue, a
cycling velodrome and track and field complex.
Public assembly
At approximately 720,000 sq. ft., the Convention Center is the Los Angeles market’s leading public assembly facility.
The Convention Center has the capacity to host the largest city-wide events in the market and is the site of several
significant trade and consumer shows each year. One of the goals of the Project is to upgrade the Convention Center
and increase its competiveness in the national market. The set of facilities competing with the project on a national
level include large scale convention centers located in markets outside of Los Angeles County. The success of these
facilities is dependent upon numerous factors, ranging from local conditions, geographic preferences and national
trends. As such, it is not anticipated that improvements to one competing facility would present the potential for
reduced business volume at the level that could result in urban decay. In the local market, Los Angeles County, the
public assembly market is characterized by a set of regional and community serving facilities that could potentially be
directly affected by the project through the addition of new available space within the immediate area. Facilities in the
market include:
The Long Beach Convention Center-- This is the 2nd largest public assembly facility in Los Angeles County with a
total size of just over 381,000 sq. ft. Originally built in 1962, the center underwent a major upgrade and expansion in
1994. The publicly owned facility is privately operated by SMG. The facility’s largest events include an annual
meeting of the Jehovah’s Witnesses, and a variety of consumer shows and events. The center also includes a
13,000 seat arena as part of the complex and an adjacent 528 room Hyatt Hotel.
The Los Angeles County Fair Association (Fairplex)—Pomona. Home to the LA County Fair, Fairplex currently
hosts a wide variety of trade and consumer shows, in addition to its annual fair, horse racing and motor sports
programing. Fairplex has approximately 300,000 sq. ft. of indoor exhibit space available on its 540 acre campus. It
is also the site of a 300-room Sheraton Suites Hotel. Fairplex is operated by the Los Angeles County Fair
Association, a self-supporting nonprofit organization charged with operating the facility in the public interest on behalf
of the County of Los Angeles.
The Pasadena Center-- Located in downtown Pasadena, the complex is home to the historic 3,000 seat Pasadena
civic auditorium. The Pasadena Center provides 120,000 sq. ft. of meeting and exhibition space and is also the site
of the 300 room Pasadena Sheraton Hotel. The market focus of the Pasadena Center has been on state and
regional meetings and exhibitions as well as consumer shows.
MR+E
AEG Special Events Center Market Impacts VIII-5
In addition to these stand-alone public assembly facilities, there are several hotels in the Los Angeles market with
significant meeting space. In general they are used as adjunct space for city wide conventions or as meeting space
for smaller events. Typically, hotels do not directly compete with major convention facilities for trade and consumer
shows.
Capital Projects
One important cause of urban decay is the lack of reinvestment in the fixed capital stock in existing facilities. Urban
decay comes about as a result of existing facilities in the market becoming so economically disadvantaged that they
are unable to keep up with basic maintenance and repairs, let alone expand and improve their capital stock. Urban
decay is not simply the loss of market share or relative business volumes, but rather the creation of a circumstance
that results in the physical deterioration of a facility that has been accelerated by the presence of the proposed
project under review.
One proxy indicator of the relative strength of existing facilities in the market is their current levels of capital
investment. Ongoing investment is a contraindication of future decay. This section discusses ongoing and recent
capital projects at competitive spectator and public assembly facilities in the Los Angeles market.
Spectator events
Los Angeles Memorial Coliseum -- Beginning in 2008, the Los Angeles Memorial Coliseum began a series of
improvements that included a replacement of football field and turf, upgrading of the field drainage system; the
replacement of the main video boards, upgrades to the sound system and cosmetic improvements to the peristyle.
In addition, these investments added 1,607 new seats and expanded the concession services to include a new grilled
food concession program.
The Coliseum Commission’s long term leasing agreement with USC requires the following investments in the facility:
Replacement of the seating in the stadium bowl;
An upgrade of elevators and escalators;
Additional public restroom facilities;
Locker room upgrades; and
Life safety improvements to the stadium itself.
The total cost of these required improvements is estimated at over $60 Million. Under the terms of USC’s lease with
the Coliseum Commission, USC has the right to make these investments in lieu of rent amortized over the term of the
lease. The Coliseum Commission has indicated that they do not have the capacity to make these investments
MR+E
AEG Special Events Center Market Impacts VIII-6
directly and as a result USC has been reported to be considering triggering its option to undertake these
improvements directly, with construction anticipated to begin in 2012.
Rose Bowl-- Calling the project, “The Next 100 Years,” the City of Pasadena and the Rose Bowl Operating
Company broke ground in January 2011 on a $152 million capital improvement program for the stadium. Key
features of the re-investment program include:
Improvements to the entrance and egress for the stadium and grounds;
Increased concourse capacity;
Restroom improvements;
Increased concessions;
New video board;
Renovation of the historic scoreboard;
Reestablishment of the historic field hedge; and
Press box renovation.
The project is anticipated to be completed over a three-year time period. The financing plan includes lease
extensions that call for UCLA to remain as the football tenant at the Rose Bowl Stadium through 2042, and for
the stadium to serve as home to the Rose Bowl Game through at least 2043.
Public Assembly
The Los Angeles County Fair Association (Fairplex)-- Construction began in 2010 on a new Trade and
Conference Center (“TCC”) on the Fairplex campus. Scheduled to open by January 2012, the facility will provide
85,000 sq. ft. of new meeting and exhibition space. The total capital cost of the development of the TCC is estimated
at over $30 million. The project was funded via a combination of private loans, federal grants, assistance from the
Pomona Redevelopment Agency and Recovery Zone Facility Bonds allocated to Los Angeles County as part of the
American Recovery and Reinvestment Act. With access to the nearby Sheraton Suites Hotel, the TCC is aimed at
accommodating trade shows, corporate meetings and regional associations. Key features of the facility include:
9,000 sq. ft. of pre-function space;
High-speed Internet access in all meeting and public spaces;
Multiple residential seating areas for impromptu gatherings;
On site conference management services; and
MR+E
AEG Special Events Center Market Impacts VIII-7
Audio visual equipment and on-site technicians.
The TCC is anticipated to support existing programs and users of Fairplex and will allow it to accommodate
association business and events that would require on site hotel space as part of a multi-day event.
The Pasadena Center -- In 2009, the Pasadena Center underwent a major renovation and expansion with a total
capital cost of over $150 million. The project was financed by the City of Pasadena using, in part, general obligation
bonds to fund construction. The main features of the project included:
A new 55,000 sq. ft. exhibit hall;
A 25,000-sq. ft. ballroom;
25,000 sq. ft. of pre-function space;
A new 22,000-sq. ft. outdoor plaza; and
The existing 28,000-sq. ft. Conference Center building was also renovated and received a new façade.
In 2010, the first full year of operations, the expanded center hosted over 500 events and exceeded previous records
for attendance occupancy and room night generation from events booked at the center.
Of the facilities in the direct competitive set for the Project, four of the five facilities have undergone or committed to a
major capital investment over the last three years. Additionally, all of these facilities are owned by public agencies,
three are operated by nonprofit public benefit corporations or a university and one is managed by a private operator
under contract with a city. This is significant in that the public agencies that own these spectator event and public
assembly facilities have a fiduciary responsibility to maintain the facilities in a manner consistent with the public
interest. Towards this end, the responsible agencies have been aggressive in finding partners who can contribute
capital for maintenance and upkeep or have made significant direct public investments in their facilities. This is an
indication that each of the competitive facilities are in a financial position to maintain and upgrade their properties.
Potential Displacement
The effect of the Project on the market area has the potential to add net new spectator event and public assembly
activity to the area. This is particularly true of NFL football, which has not been present in the Los Angeles market
since 1995. In other instances, the Event Center and improvements to the Convention Center will represent a
potential source of competition for existing facilities in selected categories of activities. The extent to which there is a
potential for overlap between the Project and existing facilities is based on the types of events that currently occur
within the competitive set. This section summarizes by type of event where there is potential for market share

MR+E
AEG Special Events Center Market Impacts VIII-8
competition between the Project and existing facilities. The categories of spectator events are based on Project
applicant AEG’s business plan for operations of the Event Center in terms of the type of spectator events that are
anticipated to occur.
Key aspects of the competitive environment for each category of use are described below.
Spectator Events
NFL Football-- From 1982 to 1994, the Los Angeles Memorial Coliseum was the home stadium for the Los
Angeles Raiders NFL franchise. Prior to this time, the Coliseum had also been the home stadium for the
Los Angeles Rams from 1946 until 1979, at which point the team moved to Orange County, where it played
its home games until 1994 when it moved to St. Louis. From the departure of the Raiders until the
establishment of the master lease between the Coliseum Commission and USC in 2009, the City of Los
Angeles’ official policy was geared towards returning NFL football to the Coliseum. However, the terms of
the lease between the Coliseum Commission and USC gave USC the authority to accept or reject any
proposal for a second amateur or professional football team at the Coliseum. The current agreement for
capital improvements between USC and the Commission are not designed to accommodate the program
requirements of an NFL franchise.
The Rose Bowl in Pasadena has been the site of five NFL Super Bowls in the past; however it has never
been a regular season home for an NFL franchise. The Rose Bowl's location in a park surrounded by single-
family residential neighborhoods has led to severe constraints on the facility’s use as a sporting venue. In
2006 Pasadena voters rejected a ballot initiative that would have permitted an NFL franchise to operate at
the Rose Bowl. After the community's opposition to NFL operations at the facility, the City and the Rose
Bowl operating company sought to secure UCLA football as a long-term tenant at the facility. During this
process the University and the City agreed on a set of physical improvements that would be required at the
Rose Bowl in order to meet the University’s requirements at the site. The current Rose Bowl Operating
Company’s lease with UCLA does not anticipate the presence of NFL football at the Rose Bowl nor are the
capital improvements currently being undertaken designed to accommodate an NFL tenant on a permanent
basis.
Elected officials from the City of Pasadena have indicated as recently as August of 2011 that under carefully
negotiated conditions, the Rose Bowl might be made available as an interim site for NFL games. These
conditions include agreement by its master tenant, UCLA, and a requirement that the City of Pasadena and
the Rose Bowl Operating Company retain full operational control. Any future modifications to the existing
Rose Bowl operating agreements would also require approval from the Pasadena City Council.
MR+E
AEG Special Events Center Market Impacts VIII-9
Concerts/ music festivals— In previous years, both the Rose Bowl and Los Angeles Memorial Coliseum
have been the site of large-scale concerts and music festivals. Because of the Rose Bowl's location in a
residential neighborhood, it has been increasingly difficult for the facility to find suitable dates for concert
events that would not be disruptive to the community. As a result, the Rose Bowl Operating Company has
deemphasized this use in recent years. Concerts are occasionally accommodated at Dodger Stadium as
well. The Coliseum has successfully hosted a major concerts and music events without incident. Notable
events include concerts by U2, the Rolling Stones and the largest attended Latin music event, a concert by
RBD in 2006 with an attendance of over 67,000. Music festivals have had a more controversial recent track
record that has brought into question the suitability of the Coliseum as a venue for this type of event.
PAC-12 Football Championship-- With the reorganization of the NCAA's Pac-12 Conference for the 2011
NCAA football season, the conference transitioned to a 12- team two division format. This allowed for one
additional intercollegiate football game matching the two division champions for a final championship game.
Presently, the conference has conceived this as occurring at the home stadium of one of the participating
teams, as it did in 2011. This would not represent a net loss of activity at the competing stadiums as
neither UCLA or USC can be depended upon to qualify for the championship game every year.
High school football championships—in recent years, the CIF/City Section Football Championship has
occurred at the Los Angeles Memorial Coliseum. The Project applicant is interested in hosting this event or
a similar CIF high school football championship at the Event Center.
ESPN X games-- ESPN X games have a long-standing relationship with Staples Center, which is owned
and operated by AEG, as the site for this event. In 2003 and 2010, portions of this event were held at the
Coliseum.
International soccer matches-- Los Angeles Memorial Coliseum has been the site of several important
international soccer matches in recent years. In addition, the Rose Bowl was used as the site for the
championship finals for both the men's and women's FIFA World Cups.
MLS friendlies and exhibition games-- The Home Depot Center in Carson, which is owned and operated
by AEG and is the home stadium for both Los Angeles MLS teams, hosts several matches each year
between these teams and international soccer teams, known as “friendlies.” Some of these events which
would be anticipated to draw crowds in excess of the capacity of Home Depot Center would likely shift
between the present and future AEG venues. The Coliseum and the Rose Bowl have hosted MLS friendlies
in the past. In the future the Project may host the MLS All-Star and MLS Cup games.
MR+E
AEG Special Events Center Market Impacts VIII-10
Boxing-- Neither the Rose Bowl nor the Los Angeles Memorial Coliseum has hosted a major boxing event
in the modern era.
NFL Pro Bowl-- From 1950 to 1971, the NFL Pro bowl was played at the Los Angeles Coliseum. Since
the 1971 season, the event has been held at Aloha Stadium in Honolulu, Hawaii most years. In recent
years, the NFL has been looking to play this exhibition game in other locations within the continental United
States. The 2010 Pro Bowl was played in Miami.
In terms of spectator events, the only foreseeable areas of direct competition between the Project and existing
facilities in the market are confined to international soccer events and to a lesser degree concerts and high school
football. It is primarily in these categories that existing events already occurring at Los Angeles area facilities could
be anticipated to relocate to the Project. Use by an NFL team is severally constrained at both the Los Angeles
Memorial Coliseum and the Rose Bowl due to existing lease agreements and operations policies. Although it is
possible that an NFL football franchise could occupy either stadium as an interim use, current lease agreements at
the Coliseum and polices of the City of Pasadena would impede their use as a permanent home stadium for an NFL
team.
Public Assemblies
City wide conventions— These events are multi-day events that occupy space in the Los Angeles
Convention Center and generate more than 1,200 room nights on the peak night of activity. Typically, city
wide conventions are associational in nature and tied to specific communities of interest or profession and
occupation.
Tradeshows--These events are business-to-business events that are open only “to the trade”. Attendance
is generally free for qualified delegates and the primary revenue source for the show are fees paid by the
exhibitors seeking to demonstrate their products and services to a qualified audience.
Consumer shows-- These events are business to consumer events that are open to the general public.
Most consumer shows have an admission entry fee and are open to the public at large. Often times,
consumer shows will include a retail component where vendors sell items directly to consumers.
The capacities of the proposed Project do not fundamentally alter the market dynamics for public assembly
events in Los Angeles County. At present, the Convention Center is the largest public assembly facility in the
market and the proposed replacement and improvements associated with this Project will reinforce the
Convention Center’s position as the primary convention site in the Los Angeles market. It can be anticipated
MR+E
AEG Special Events Center Market Impacts VIII-11
that the Convention Center will become more effective in areas where it is already seeking market position vis-à-
vis regional and national competitors.
Findings
In determining the potential of the Project to create conditions that will result in urban decay, the following factors
have been observed:
Capital Investment
Ownership
Tenants
Competitive Balance
Displacement
Each of these factors was considered for both the Event Center and the Convention Center.
Event Center
Capital Investment— Both the Rose Bowl and the Coliseum have been engaged in an ongoing program of
investment and recapitalization of their assets. The expected total value of these improvements is
anticipated to be over $212 Million. This represents a significant commitment by both the facility owners
and their master tenants to retain the physical capital stock of both stadiums.
Ownership—Both the Rose Bowl and Coliseum are publicly owned. This is significant in that the public
institutions have a fiduciary responsibility to maintain and preserve public capital assets.
Tenants— Each of the spectator venues has a contract in place with one or more tenants. This has the
effect of providing sources of utilization over the long term that will provide for continued economic use of
the facilities.
Competitive Balance— Development of the project is unlikely to dramatically alter the competitive balance
in the market. Presently, the number of annual events held at the Rose Bowl is limited by municipal
policies. The main categories of spectator events where the project anticipates competing directly with
existing facilities are primarily limited to amateur sports and international soccer. The project does not
anticipate relocation of a master tenant from either facility, nor does it require the reallocation of football
events.
MR+E
AEG Special Events Center Market Impacts VIII-12
Displacement—NFL football is not presently accommodated in the market. Some classes of events such
as international soccer, high school football and concerts may shift from the existing facilities, but as a whole
the potential loss of this activity would not be in itself enough to lead to significant capital disinvestment. In
each case the existing facilities would retain their anchor tenants. It is important to recognize that both the
Los Angeles Memorial Coliseum and the Rose Bowl currently have long term lease agreements with master
tenants that secure revenue streams for each facility. Neither of these master tenant arrangements would
be affected by the development of the project, nor would they lead to abandonment by the master tenants of
either the Coliseum or the Rose Bowl. It is unlikely that the loss of business volumes related to secondary
users would be sufficient to undermine the basic financial security of the facilities over the long term.
In the case of the Rose Bowl the city of Pasadena limits the number of events with attendance over 20,000
to 12 per year. This includes the six regularly scheduled UCLA home football games and the Rose Bowl
game on New Year's Day. The remaining five major events that are permitted do not necessarily occur
every year.
The Los Angeles Memorial Coliseum receives its largest utilization from USC football. Other events that
have used the Stadium include uses that are tied to Exposition Park such as hosting the charitable Revlon
Run, an annual Fourth of July picnic and fireworks display or public events such as mass citizenship
ceremonies. Use of the facility for these secondary events would not be affected by the project.
Convention Center
Capital Investment-- The expansion of the Pasadena center and the construction of the new TCC at
Fairplex represent over $180 million in recapitalization of competitive public assembly venues. These
investments will help to preserve the long-term viability and physical infrastructure of two major facilities in
the local market to have the potential to be competitive with the Los Angeles Convention Center
Ownership-- All of the identified competitive facilities that could potentially be affected by the project are
public assets. In the case of the Long Beach Convention Center and Fairplex, the facilities are operated by
private entities however the underlying asset in both cases remains with the City of Long Beach and Los
Angeles County. For these facilities, as well as for the Pasadena Center, successful operations of the public
assembly facilities is an important part of each community's long-term economic development strategy
through the promotion of on-site sales and room night generation. The economic performance of these
facilities reinforces the public sector's interest in their long-term vitality.