Embed Size (px)
Citation preview

MRD in different disorders
Andy C. Rawstron
HMDS
St. James’s Institute of Oncology
Leeds Teaching Hospitals NHS Trust
MRD in CLL as an intermediate endpoint for licensure: requires a quantitative method that is not influenced by the
polyclonal background with prospective validation
www.ema.europa.eu/docs/en_GB/document_library/Scientific_guidel
ine/2014/12/WC500179047.pdf
Development of ‘MRD’ as aregulatory endpoint:
Identify MRD endpoint in clinical trials
Develop assay
Standardisation of assay
Apply standardised assay prospectively
Apply to regulatory action
1995
2007
2012
2002
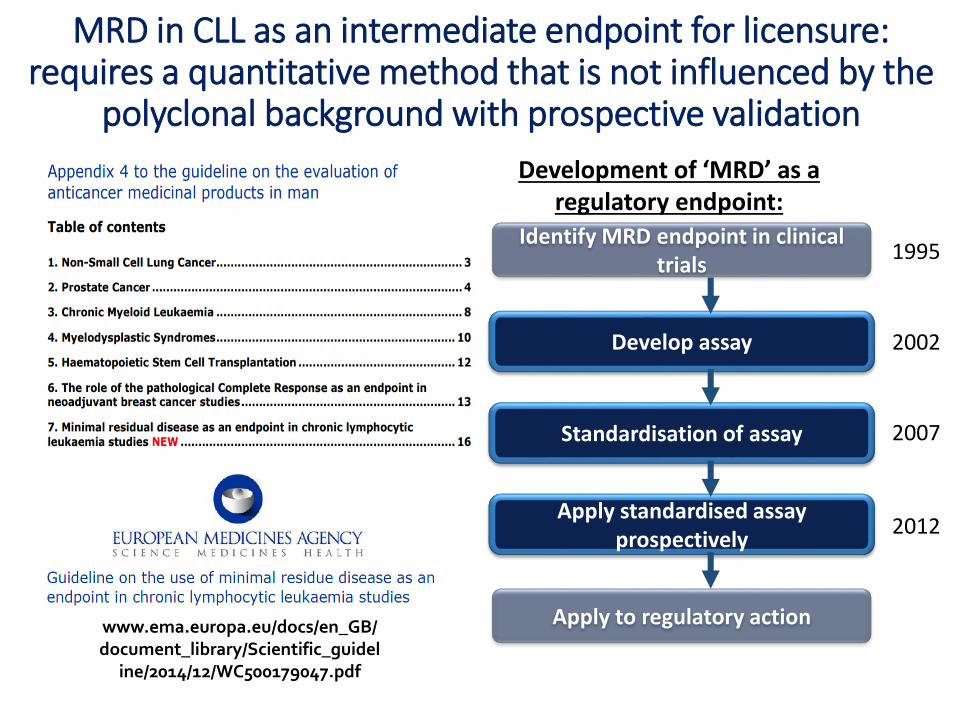
B, bendamustine;C, Cyclophosphamide;
F, Fludarabine;M, mitoxantrone;
R, rituximab* Clinical responses only.
Chlorambucil2–4
90
80
70
50
30
20
10
0
60
40
Patie
nts(
%)
MRD-positive CR (or sample not available)
MRD-negative CR
Fludara-bine*3–5
Alem
tu-
zum
ab2 FC3,5,7,8
FCR7,
8
FCM
9
RFCM
10
BR6
1970 1980 1990 2000 2010 2020
MorphologyQualitativeLOD 1-10%
2/3-CLR Flow or IgH-PCRQualitativeLOD 0.1-1%
ERIC Flow RQ-PCR-CLR Quantitative
LOD 10-5 – 10-4
HTSQuantitative
LOD 10-6 – 10-5
VR11
1. Adapted from: Ghia P. Hematology 2012; 2012:97–104; 2. Hillmen P, et al. J Clin Oncol 2007; 25:5616–5623; 3. Catovsky D, et al. Lancet 2007; 370:230–239; 4. Eichhorst BF, et al. Blood 2009; 114:3382–3391; 5. Eichhorst BF, et al. Blood 2006; 107:885–891; 6. Fischer K, et al. J Clin Oncol 2012; 30:3209–3216; 7. Hallek M, et al. Lancet 2010; 376:1164–1174; 8. Böttcher S, et al. J Clin Oncol2012; 30:980–988; 9. Bosch F, et al. Clin Cancer Res 2008; 14:155–161; 10. Bosch F, et al. J Clin Oncol 2009; 27:4578–4584; 11. Seymour J, et al. Lancet Oncol 2017; 18:230-240.
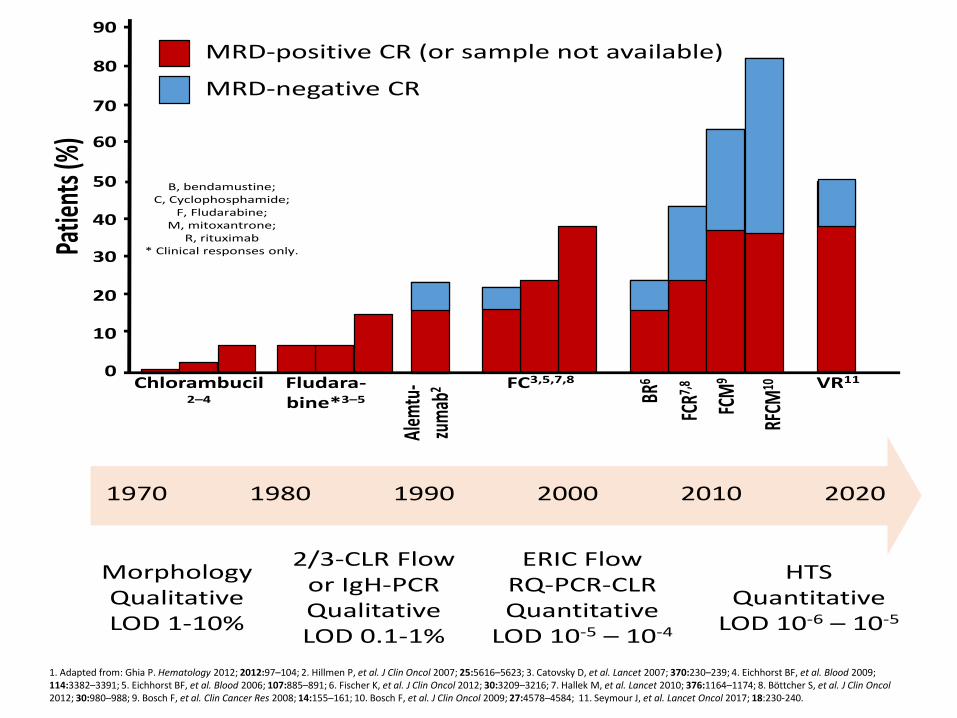
Venetoclax (BH3-mimetic) can effect MRD-negative remissions: treatment cessation is a possibility
Andrew Roberts et al, N Engl J Med. 2016 Jan 28;374(4):311-22http://learningcenter.ehaweb.org/eha/2016/
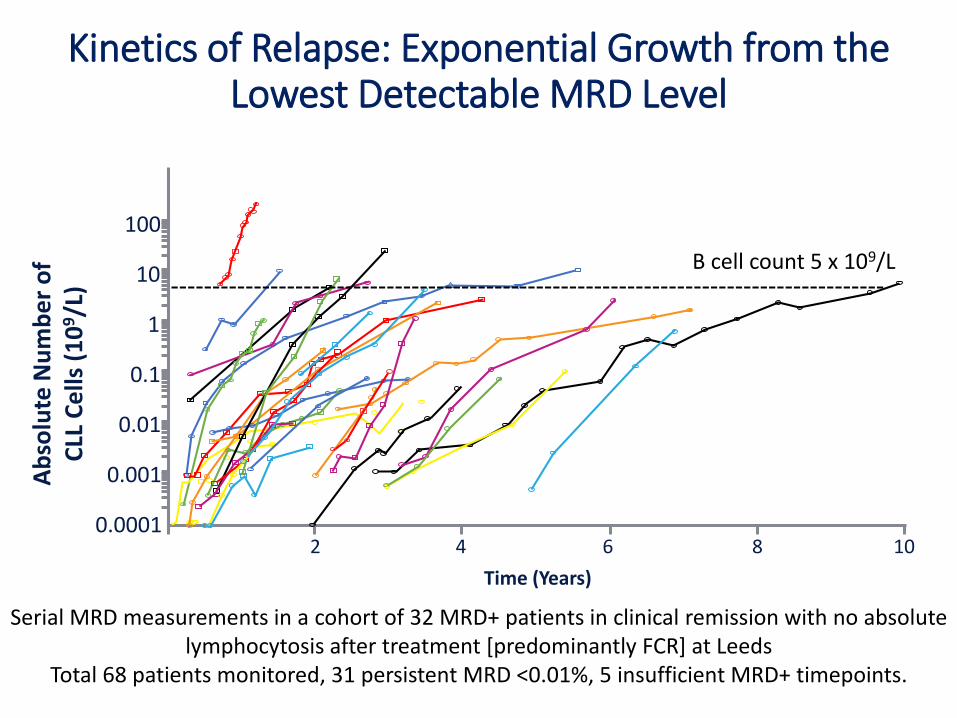
Kinetics of Relapse: Exponential Growth from the Lowest Detectable MRD Level
Time (Years)
Serial MRD measurements in a cohort of 32 MRD+ patients in clinical remission with no absolute lymphocytosis after treatment [predominantly FCR] at Leeds
Total 68 patients monitored, 31 persistent MRD <0.01%, 5 insufficient MRD+ timepoints.
2 4 6 8 10
0.01
0.1
1
10
100
0.001
0.0001
Ab
solu
te N
um
be
r o
f C
LL C
ells
(1
09/L
)
B cell count 5 x 10⁹/L

ADMIRE/ARCTIC Trial (FCR-Based Treatment): Sequential Benefit in PFS per Log Reduction in MRD
Rawstron AC, et al. XVI iwCLL Annual Meeting 2015.FCR, fludarabine, cyclophosphamide, rituximab.
33% (95% CI = 27–38) risk reduction for disease progression per log reduction in MRD level
Progression-free Survivalby bone marrow MRD level at 3 months post treatment
N=343 ×××××××
××
×××
×××
××××
×××
×××
××××
××
×
×××××××
×
××××××××××××
×××××××××××××××××××××××
××××
××××××××××××
×
×
× × ××
×
×
×
×
××××
×
×
×
<0.01%<0.1%<1%<10%≥10%
Log-Rank2
4 = 224.125p<0.0001
0 6 12 18 24 30 36 42 48 54 60
1.0
0.8
0.6
0.4
0.2
0.0Pro
po
rtio
n A
live
an
d P
rogr
ess
ion
Fre
e
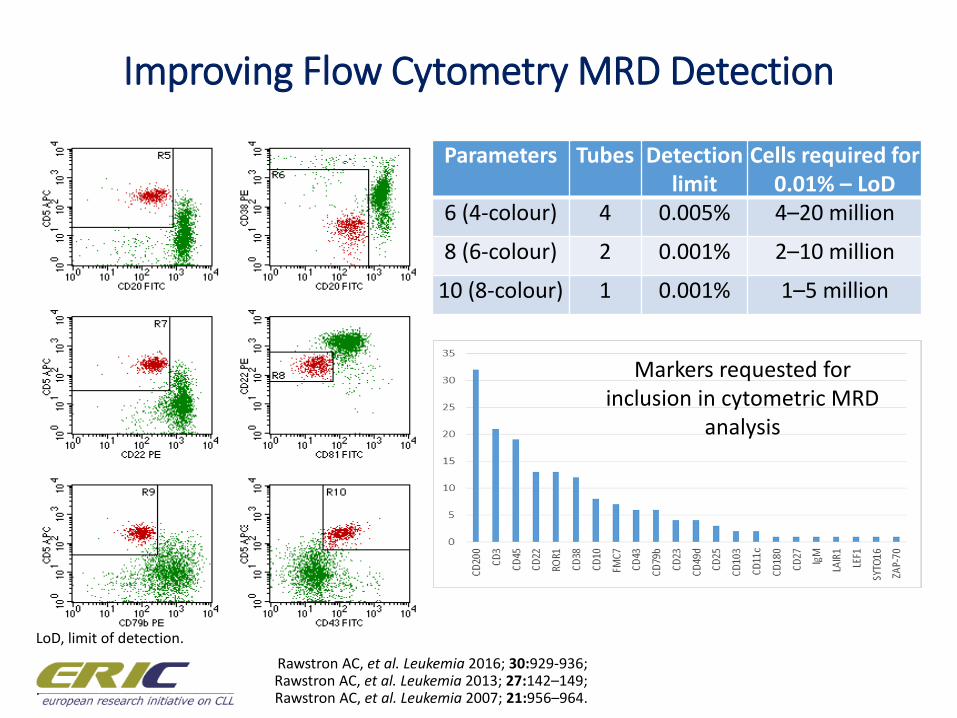
Improving Flow Cytometry MRD Detection
Rawstron AC, et al. Leukemia 2016; 30:929-936;Rawstron AC, et al. Leukemia 2013; 27:142–149;Rawstron AC, et al. Leukemia 2007; 21:956–964.
Parameters Tubes Detection limit
Cells required for 0.01% – LoD
6 (4-colour) 4 0.005% 4–20 million
8 (6-colour) 2 0.001% 2–10 million
10 (8-colour) 1 0.001% 1–5 million
LoD, limit of detection.
.
Markers requested for inclusion in cytometric MRD
analysis
Rawstron AC, et al. Leukemia 2016; 30:929–936.
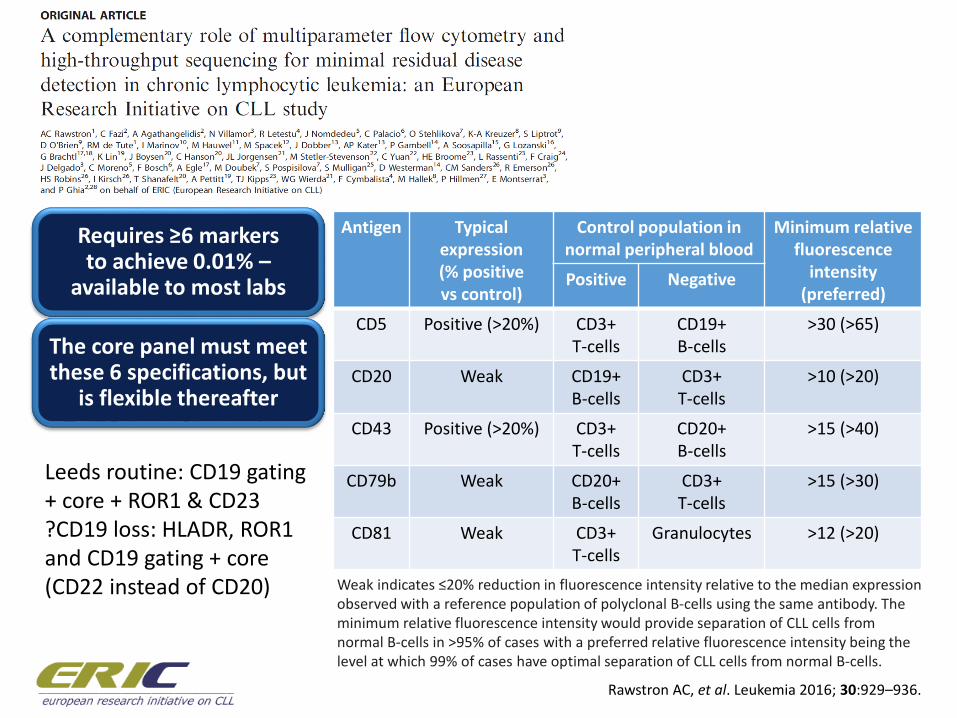
Antigen Typical expression(% positive vs control)
Control population in normal peripheral blood
Minimum relative fluorescence
intensity (preferred)
Positive Negative
CD5 Positive (>20%) CD3+ T-cells
CD19+B-cells
>30 (>65)
CD20 Weak CD19+B-cells
CD3+T-cells
>10 (>20)
CD43 Positive (>20%) CD3+T-cells
CD20+ B-cells
>15 (>40)
CD79b Weak CD20+B-cells
CD3+ T-cells
>15 (>30)
CD81 Weak CD3+T-cells
Granulocytes >12 (>20)
Weak indicates ≤20% reduction in fluorescence intensity relative to the median expression observed with a reference population of polyclonal B-cells using the same antibody. The minimum relative fluorescence intensity would provide separation of CLL cells from normal B-cells in >95% of cases with a preferred relative fluorescence intensity being the level at which 99% of cases have optimal separation of CLL cells from normal B-cells.
Requires ≥6 markers to achieve 0.01% –
available to most labs
The core panel must meet these 6 specifications, but
is flexible thereafter
Leeds routine: CD19 gating + core + ROR1 & CD23?CD19 loss: HLADR, ROR1 and CD19 gating + core (CD22 instead of CD20)
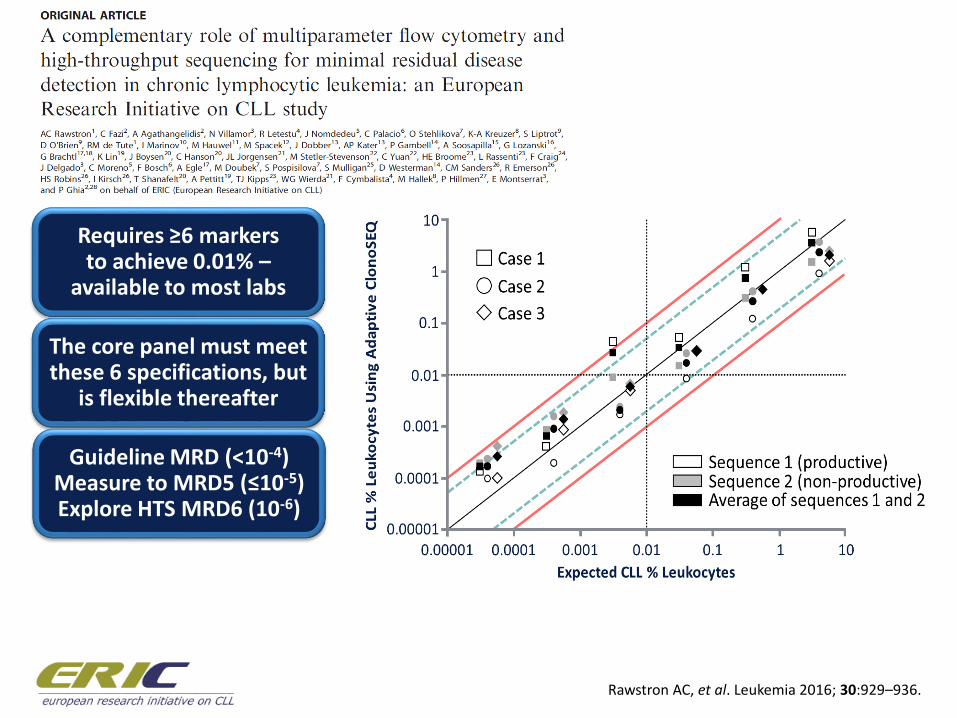
Rawstron AC, et al. Leukemia 2016; 30:929–936.
Requires ≥6 markers to achieve 0.01% –
available to most labs
The core panel must meet these 6 specifications, but
is flexible thereafter
Guideline MRD (<10-4)Measure to MRD5 (≤10-5) Explore HTS MRD6 (10-6)
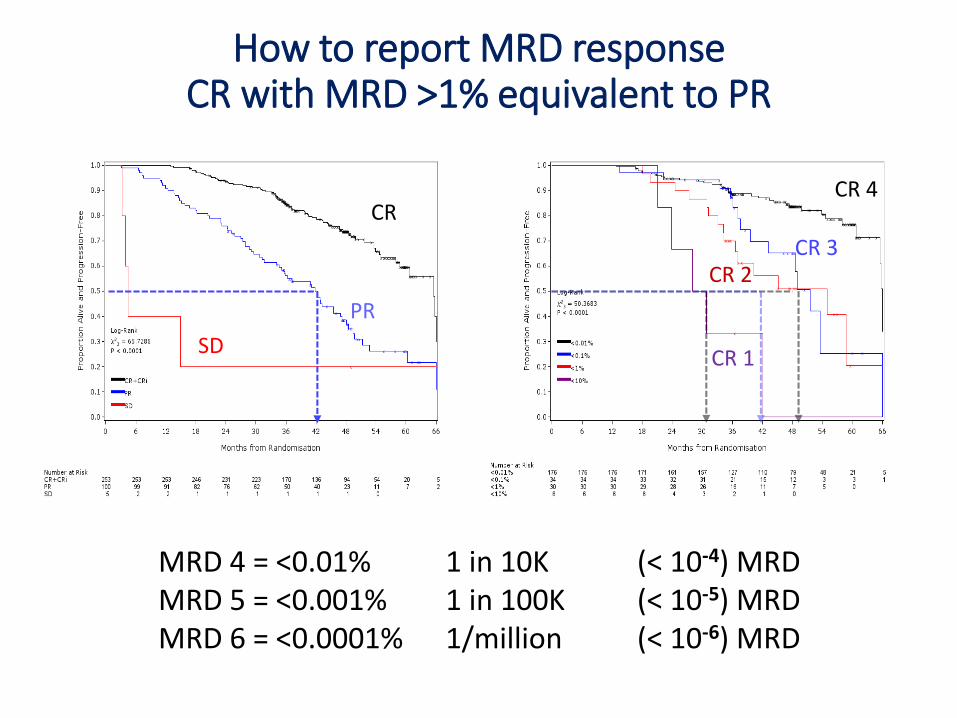
How to report MRD responseCR with MRD >1% equivalent to PR
CR 4
CR 3CR 2
CR 1
CR
PR
SD
MRD 4 = <0.01% 1 in 10K (< 10-4) MRDMRD 5 = <0.001% 1 in 100K (< 10-5) MRDMRD 6 = <0.0001% 1/million (< 10-6) MRD
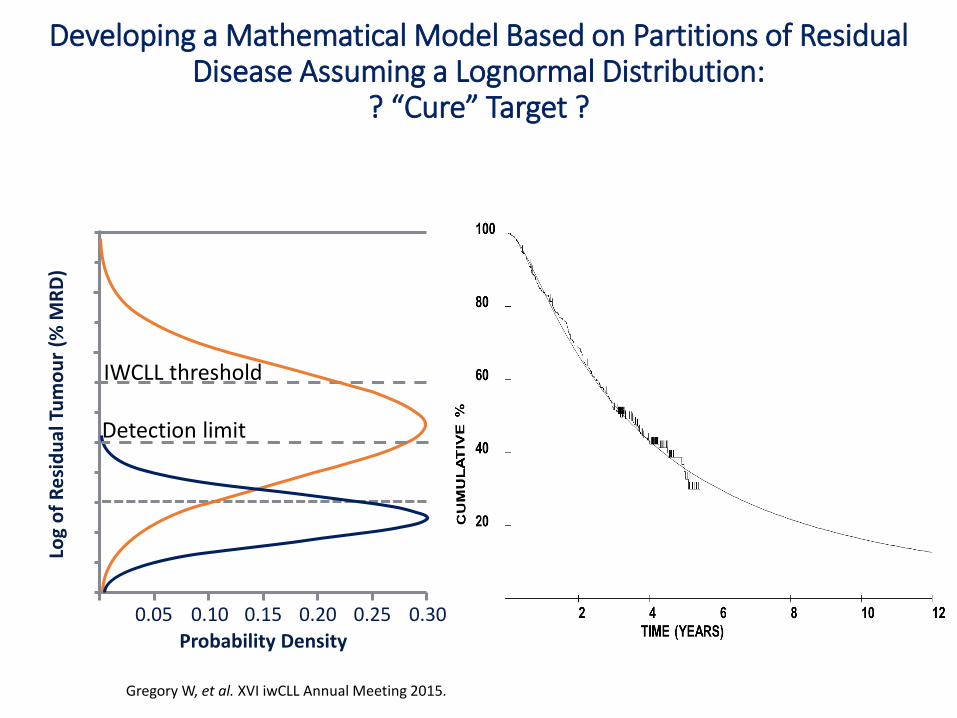
Developing a Mathematical Model Based on Partitions of Residual Disease Assuming a Lognormal Distribution:
? “Cure” Target ?
Gregory W, et al. XVI iwCLL Annual Meeting 2015.
Log
of
Re
sid
ual
Tu
mo
ur
(% M
RD
)
0.05 0.10 0.15 0.20 0.25 0.30
Probability Density
IWCLL threshold
Detection limit
• Ensuring broad access to techniques for measuring MRD and identifying suitable approaches to reporting response
Insights into MRD from CLL
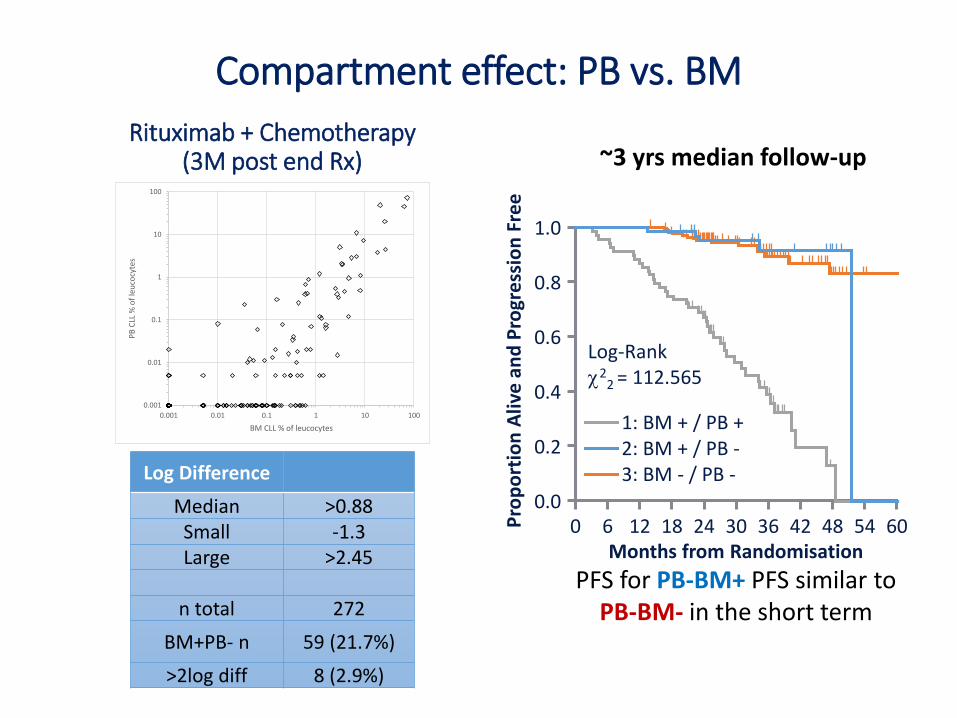
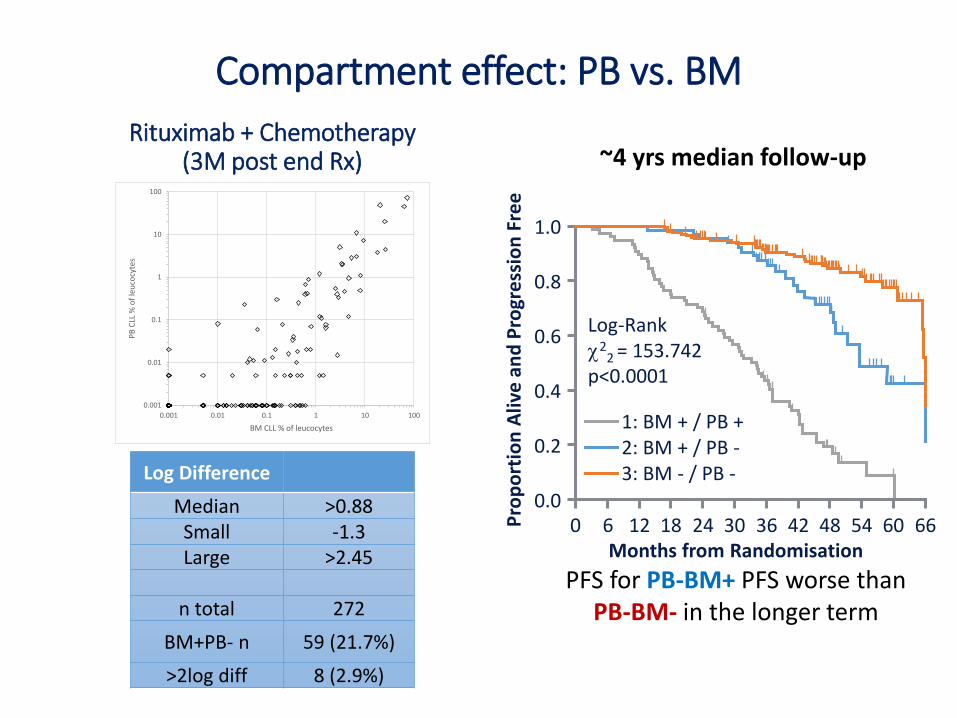
Compartment effect: PB vs. BM
0.001
0.01
0.1
1
10
100
0.001 0.01 0.1 1 10 100
PB
CLL
% o
f le
uco
cyte
s
BM CLL % of leucocytes
Log Difference
Median >0.88Small -1.3Large >2.45
n total 272
BM+PB- n 59 (21.7%)
>2log diff 8 (2.9%)
Rituximab + Chemotherapy (3M post end Rx)
PFS for PB-BM+ PFS similar to PB-BM- in the short term
~3 yrs median follow-up
Months from Randomisation
Pro
po
rtio
n A
live
an
d P
rogr
ess
ion
Fre
e
0.2
0.4
0.6
0.8
1.0
0.06 12 18 24 30 36 600 42 48 54
Log-Rank2
2 = 112.565
1: BM + / PB +2: BM + / PB -3: BM - / PB -
Months from Randomisation
Pro
po
rtio
n A
live
an
d P
rogr
ess
ion
Fre
e
0.2
0.4
0.6
0.8
1.0
0.06 12 18 24 30 36 600 42 48 54 66
Log-Rank2
2 = 153.742p<0.0001
1: BM + / PB +2: BM + / PB -3: BM - / PB -
Compartment effect: PB vs. BM
0.001
0.01
0.1
1
10
100
0.001 0.01 0.1 1 10 100
PB
CLL
% o
f le
uco
cyte
s
BM CLL % of leucocytes
Log Difference
Median >0.88Small -1.3Large >2.45
n total 272
BM+PB- n 59 (21.7%)
>2log diff 8 (2.9%)
Rituximab + Chemotherapy (3M post end Rx)
PFS for PB-BM+ PFS worse than PB-BM- in the longer term
~4 yrs median follow-up
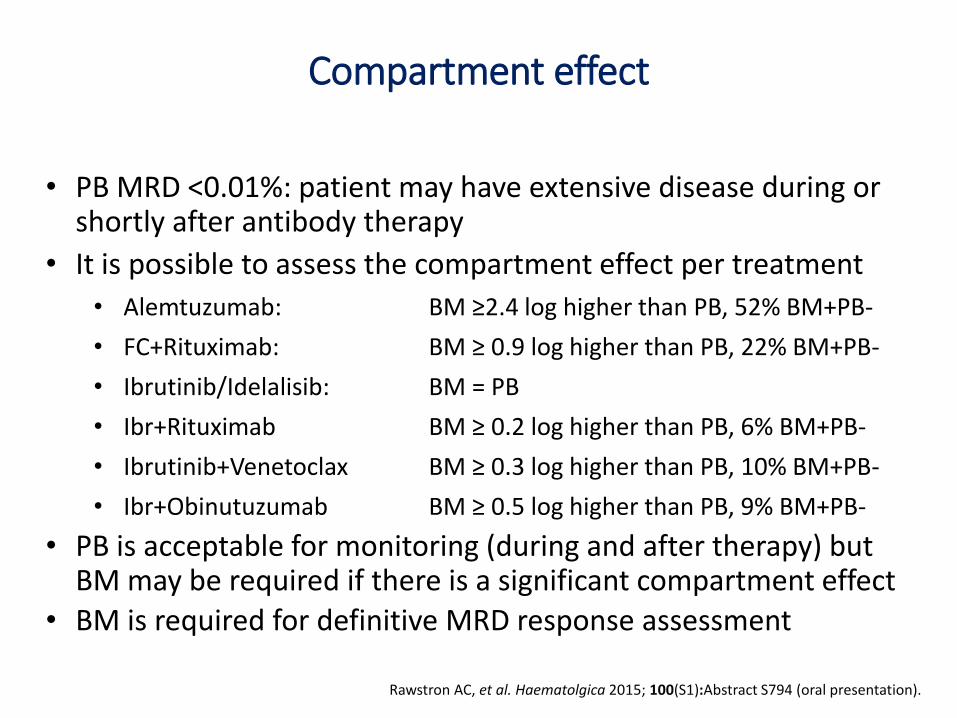
Compartment effect
Rawstron AC, et al. Haematolgica 2015; 100(S1):Abstract S794 (oral presentation).
• PB MRD <0.01%: patient may have extensive disease during or shortly after antibody therapy
• It is possible to assess the compartment effect per treatment
• Alemtuzumab: BM ≥2.4 log higher than PB, 52% BM+PB-
• FC+Rituximab: BM ≥ 0.9 log higher than PB, 22% BM+PB-
• Ibrutinib/Idelalisib: BM = PB
• Ibr+Rituximab BM ≥ 0.2 log higher than PB, 6% BM+PB-
• Ibrutinib+Venetoclax BM ≥ 0.3 log higher than PB, 10% BM+PB-
• Ibr+Obinutuzumab BM ≥ 0.5 log higher than PB, 9% BM+PB-
• PB is acceptable for monitoring (during and after therapy) but BM may be required if there is a significant compartment effect
• BM is required for definitive MRD response assessment
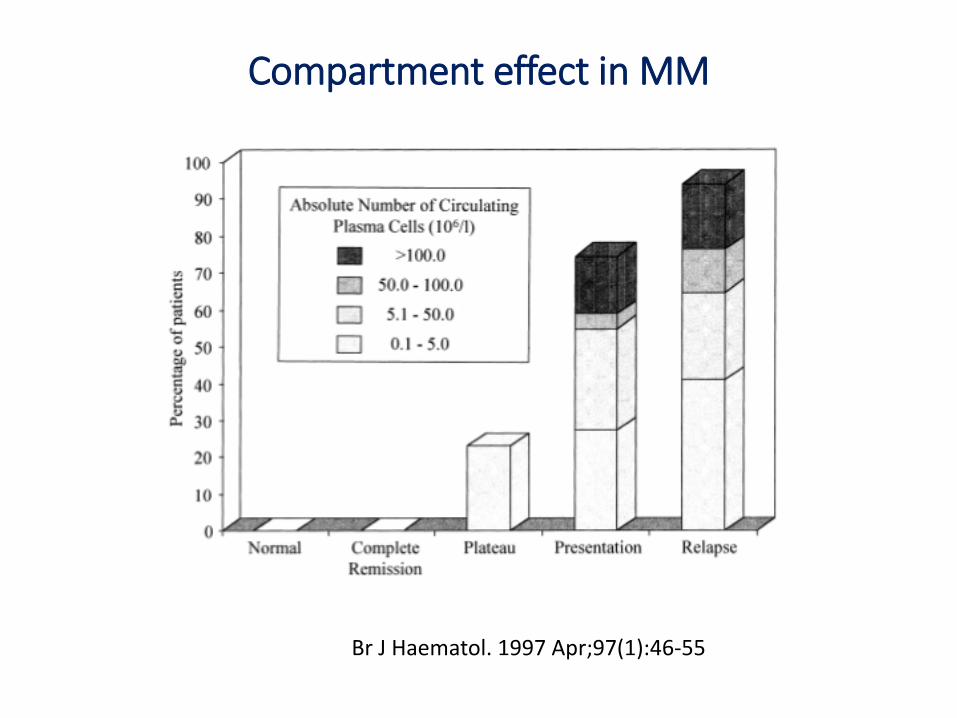
Compartment effect in MM
Br J Haematol. 1997 Apr;97(1):46-55
• Ensuring broad access to techniques for measuring MRD and identifying suitable approaches to reporting response
• Understanding compartment effects
Insights into MRD from CLL
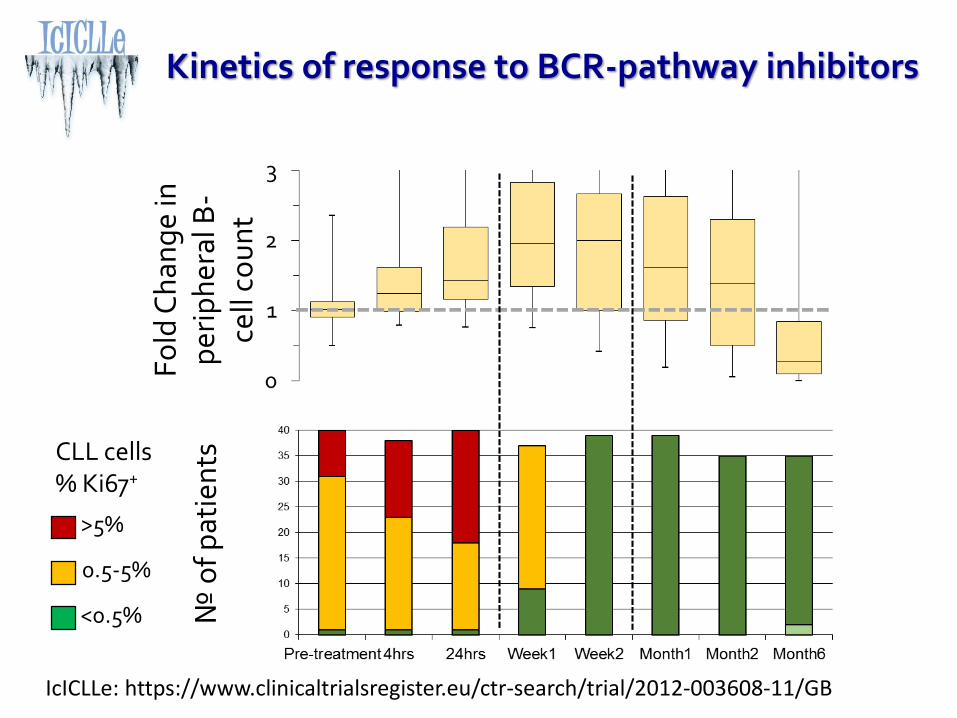
Kinetics of response to BCR-pathway inhibitors
№ o
f p
atie
nts
>5%
0.5-5%
<0.5%
CLL cells % Ki67+
Fo
ld C
han
ge
in
per
iph
eral
B-
cell
cou
nt
IcICLLe: https://www.clinicaltrialsregister.eu/ctr-search/trial/2012-003608-11/GB
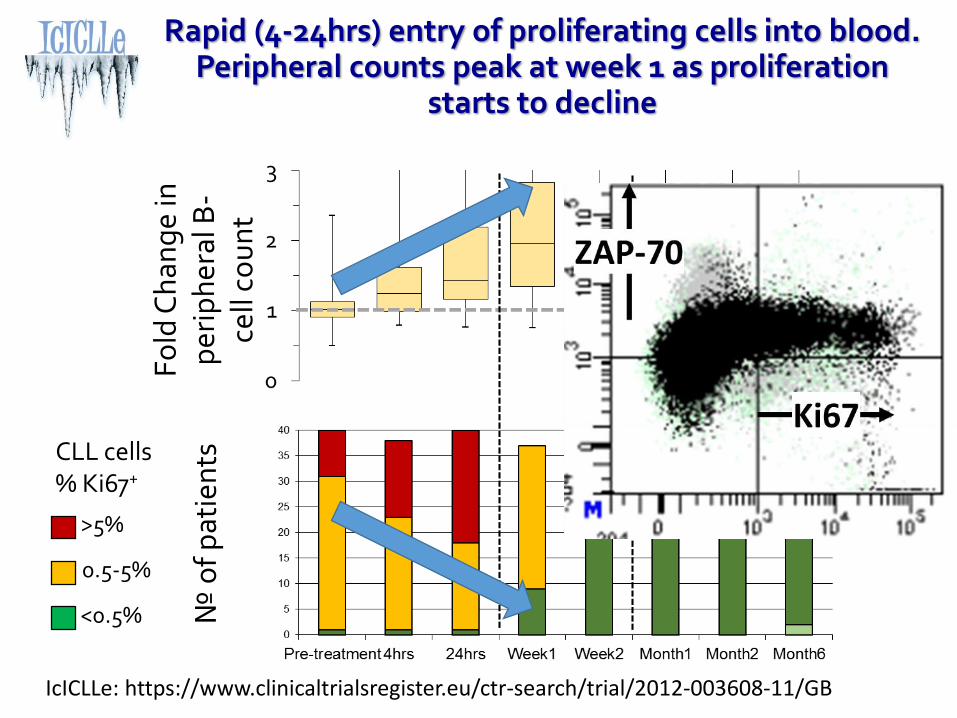
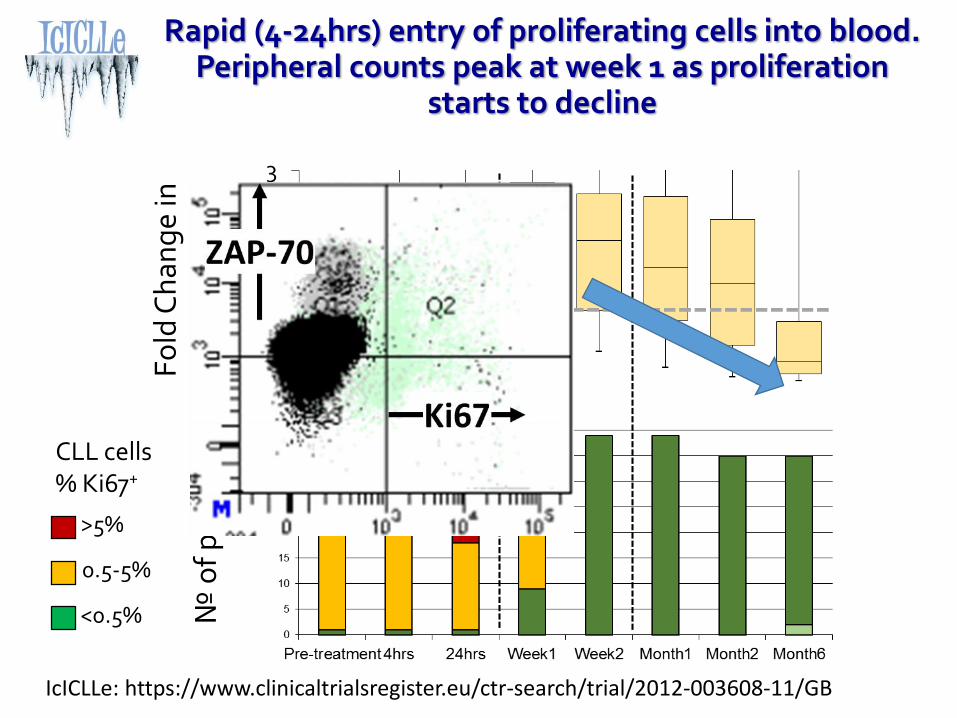
Rapid (4-24hrs) entry of proliferating cells into blood. Peripheral counts peak at week 1 as proliferation
starts to decline
№ o
f p
atie
nts
>5%
0.5-5%
<0.5%
CLL cells % Ki67+
Fo
ld C
han
ge
in
per
iph
eral
B-
cell
cou
nt
IcICLLe: https://www.clinicaltrialsregister.eu/ctr-search/trial/2012-003608-11/GB
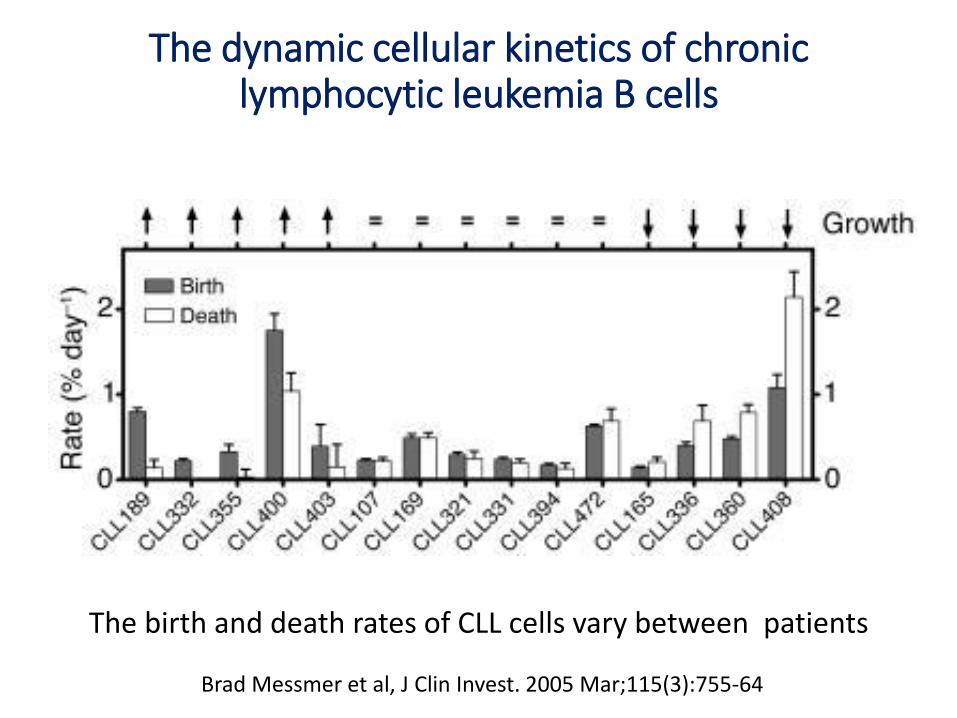
The dynamic cellular kinetics of chronic lymphocytic leukemia B cells
The birth and death rates of CLL cells vary between patients
Brad Messmer et al, J Clin Invest. 2005 Mar;115(3):755-64
Measuring the kinetics of response to BCR-pathway inhibitors: MRD analysis to determine
“CLL halving-time”
0.001
0.01
0.1
1
10
100
1000
0 6 12 180.001
0.01
0.1
1
10
100
1000
1 2 6 9 12 18
Ab
solu
te C
LL C
ell
Co
un
t(1
09/L
)
Months of Ibrutinib Treatment
IcICLLe: https://www.clinicaltrialsregister.eu/ctr-search/trial/2012-003608-11/GB
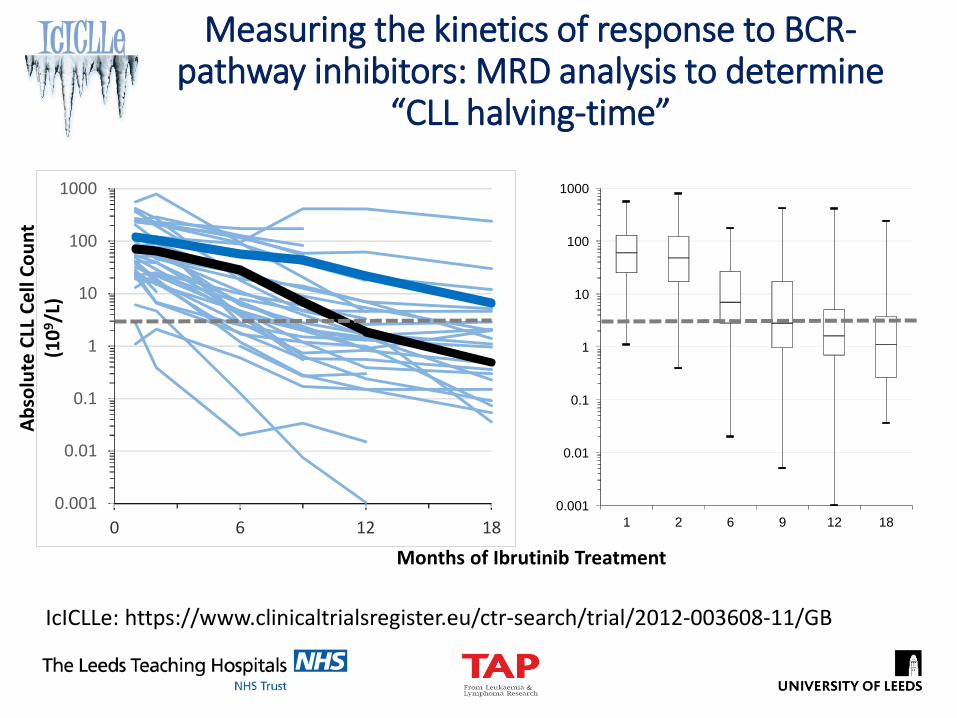
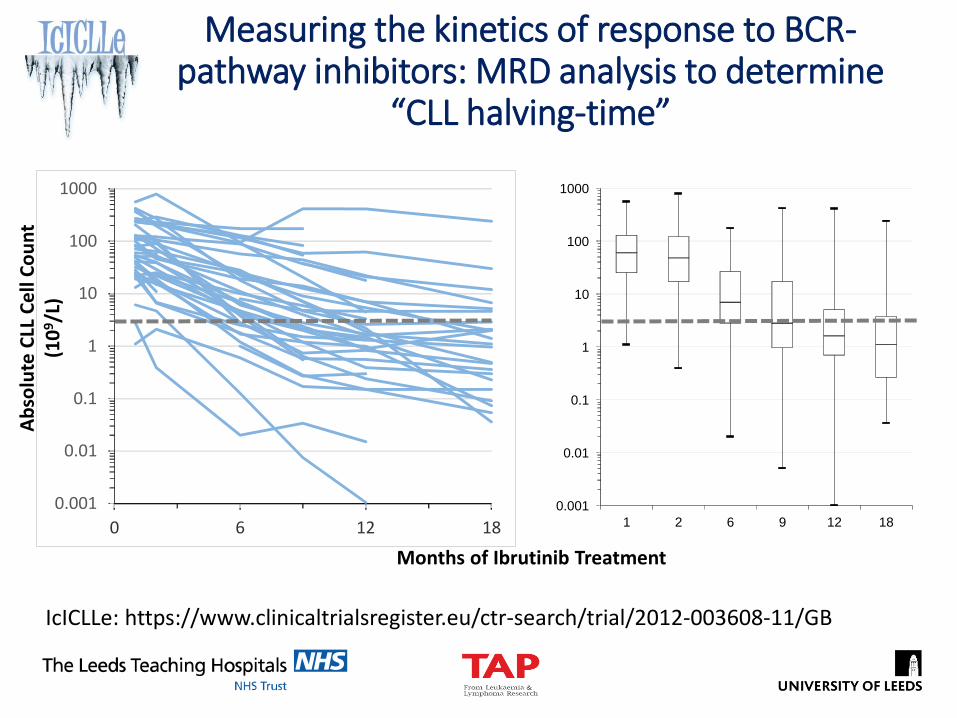
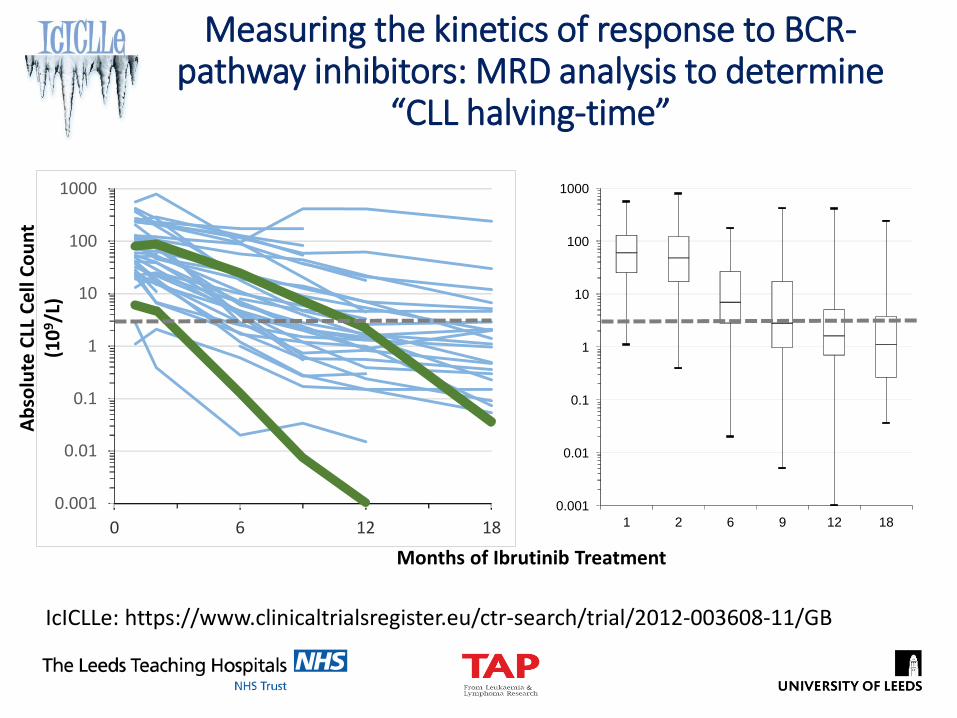
Measuring the kinetics of response to BCR-pathway inhibitors: MRD analysis to determine
“CLL halving-time”
0.001
0.01
0.1
1
10
100
1000
0 6 12 18
Ab
solu
te C
LL C
ell
Co
un
t(1
09/L
)
Months of Ibrutinib Treatment
IcICLLe: https://www.clinicaltrialsregister.eu/ctr-search/trial/2012-003608-11/GB
0.001
0.01
0.1
1
10
100
1000
1 2 6 9 12 18
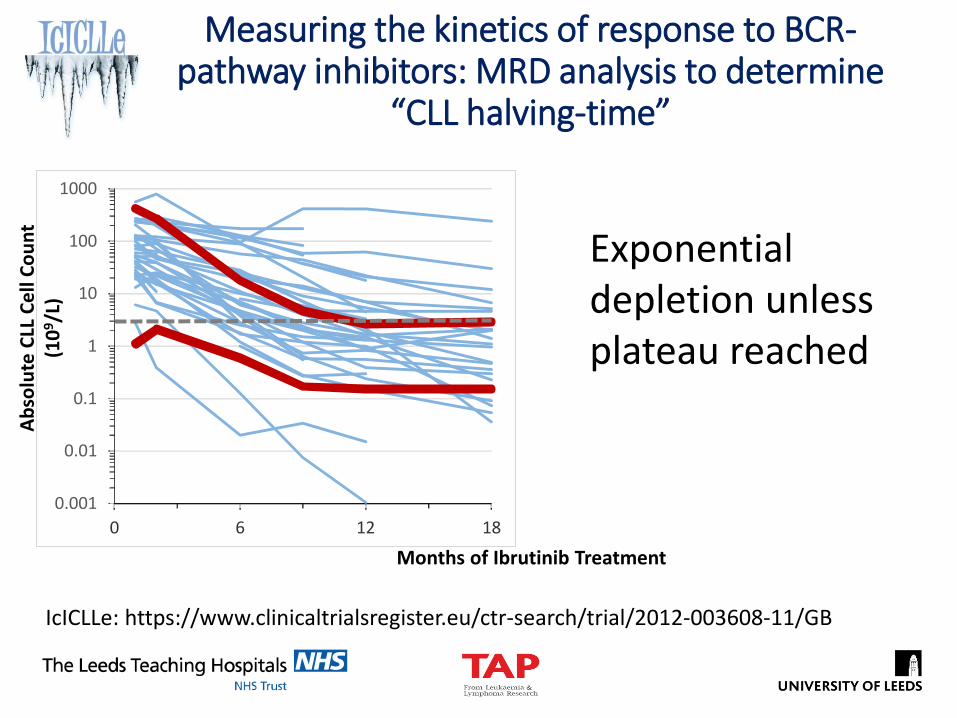
Measuring the kinetics of response to BCR-pathway inhibitors: MRD analysis to determine
“CLL halving-time”
0.001
0.01
0.1
1
10
100
1000
0 6 12 18
Ab
solu
te C
LL C
ell
Co
un
t(1
09/L
)
Months of Ibrutinib Treatment
IcICLLe: https://www.clinicaltrialsregister.eu/ctr-search/trial/2012-003608-11/GB
Exponential depletion unless plateau reached
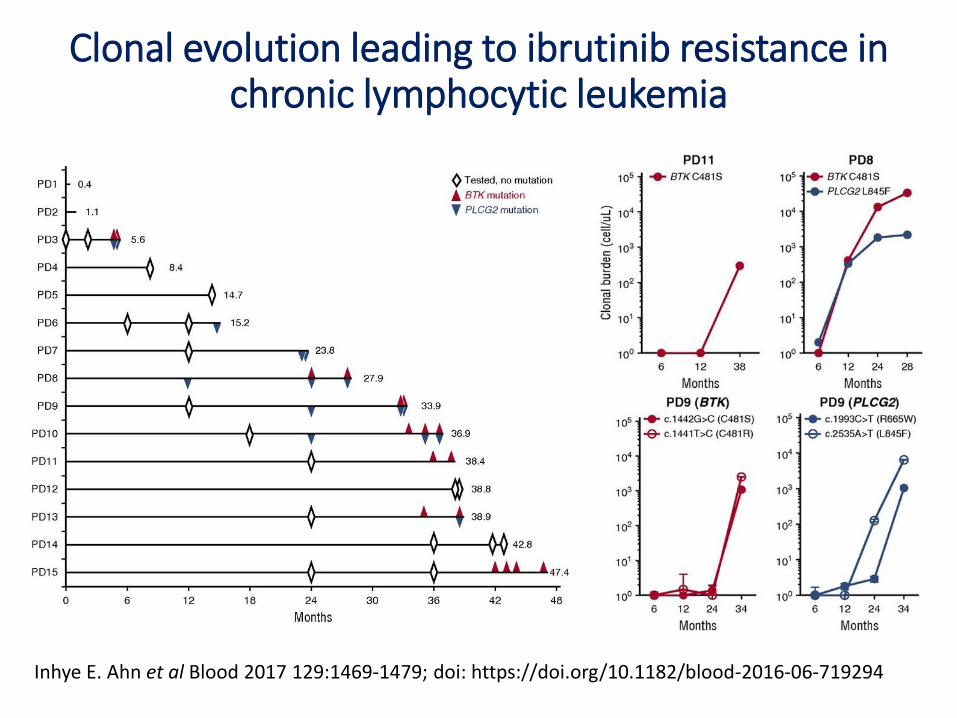
Clonal evolution leading to ibrutinib resistance in chronic lymphocytic leukemia
Inhye E. Ahn et al Blood 2017 129:1469-1479; doi: https://doi.org/10.1182/blood-2016-06-719294
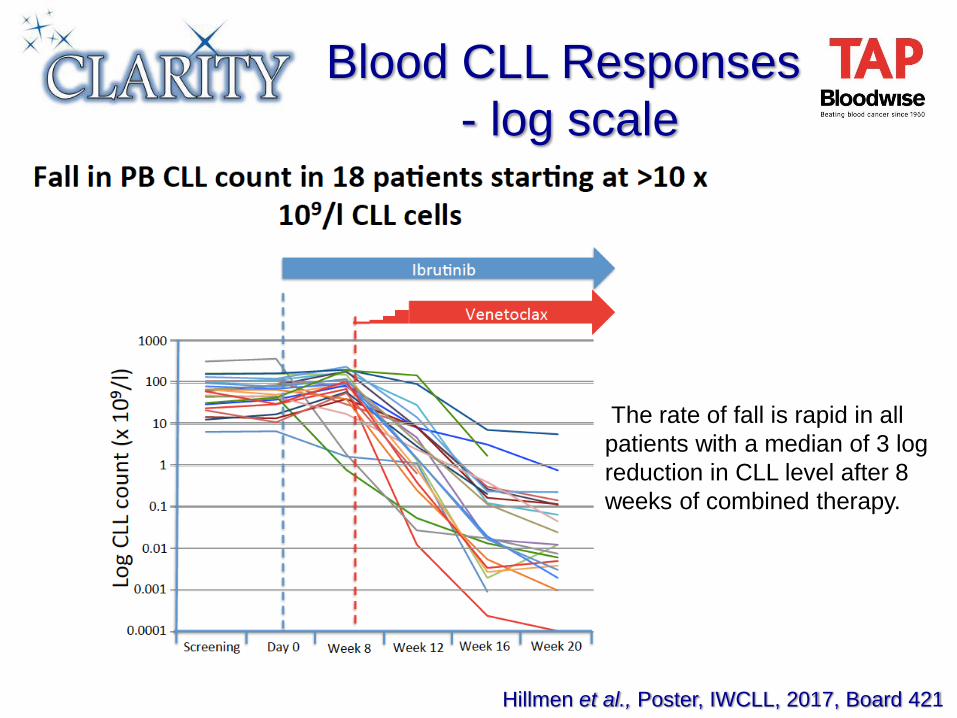
Blood CLL Responses
- log scale
The rate of fall is rapid in all
patients with a median of 3 log
reduction in CLL level after 8
weeks of combined therapy.
Hillmen et al., Poster, IWCLL, 2017, Board 421
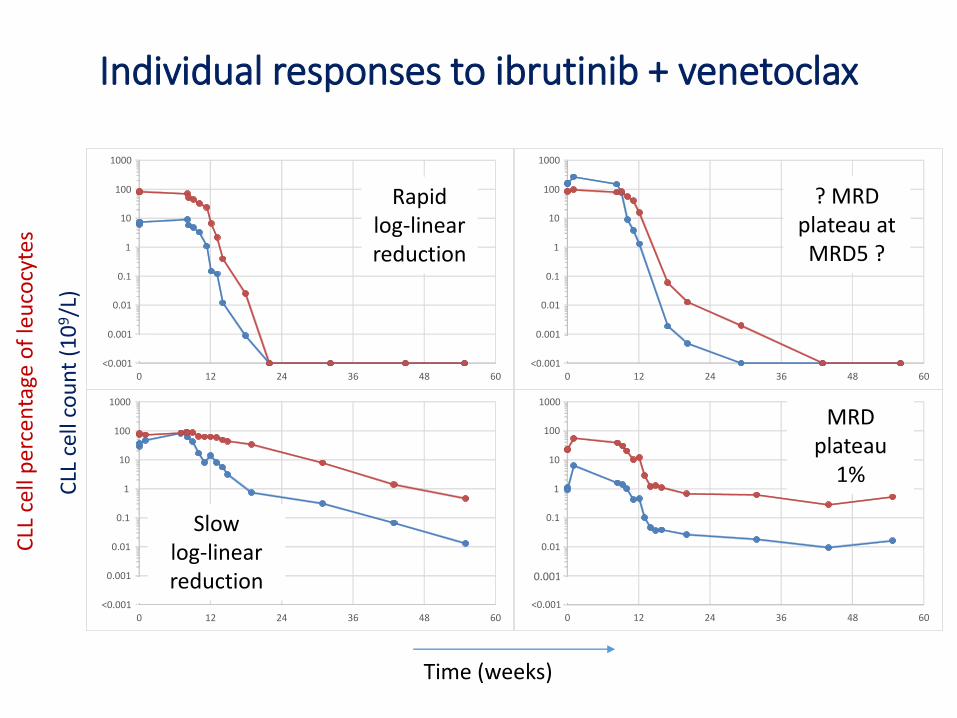
Individual responses to ibrutinib + venetoclax
<0.001
0.001
0.01
0.1
1
10
100
1000
0 12 24 36 48 60<0.001
0.001
0.01
0.1
1
10
100
1000
0 12 24 36 48 60
<0.001
0.001
0.01
0.1
1
10
100
1000
0 12 24 36 48 60<0.001
0.001
0.01
0.1
1
10
100
1000
0 12 24 36 48 60
Time (weeks)
CLL
cel
l co
un
t (1
09/L
)
CLL
cel
l pe
rcen
tage
of
leu
cocy
tes
Rapid log-linear reduction
Slow log-linear reduction
? MRD plateau at MRD5 ?
MRD plateau
1%
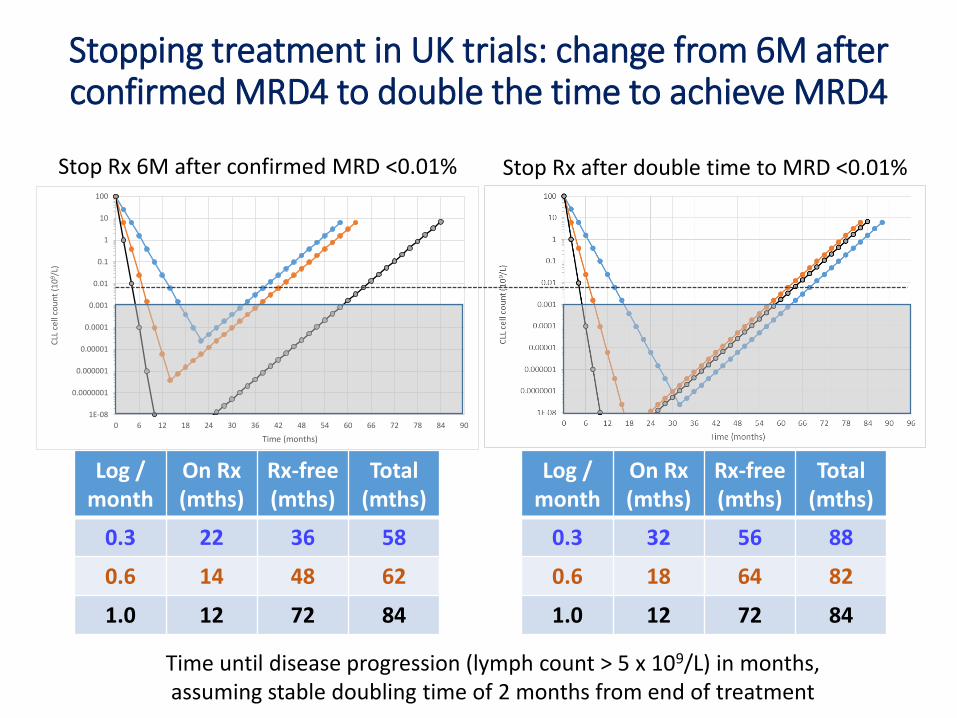
Stopping treatment in UK trials: change from 6M after confirmed MRD4 to double the time to achieve MRD4
Log / month
On Rx (mths)
Rx-free(mths)
Total (mths)
0.3 22 36 58
0.6 14 48 62
1.0 12 72 84
Log / month
On Rx (mths)
Rx-free(mths)
Total (mths)
0.3 32 56 88
0.6 18 64 82
1.0 12 72 84
1E-08
0.0000001
0.000001
0.00001
0.0001
0.001
0.01
0.1
1
10
100
0 6 12 18 24 30 36 42 48 54 60 66 72 78 84 90
CLL
cel
l co
un
t (1
09 /
L)
Time (months)
Time until disease progression (lymph count > 5 x 10⁹/L) in months, assuming stable doubling time of 2 months from end of treatment
Stop Rx 6M after confirmed MRD <0.01% Stop Rx after double time to MRD <0.01%
• Ensuring broad access to techniques for measuring MRD and identifying suitable approaches to reporting response
• Understanding compartment effects
• Improving knowledge of MRD kinetics to optimise treatment
Insights into MRD from CLL
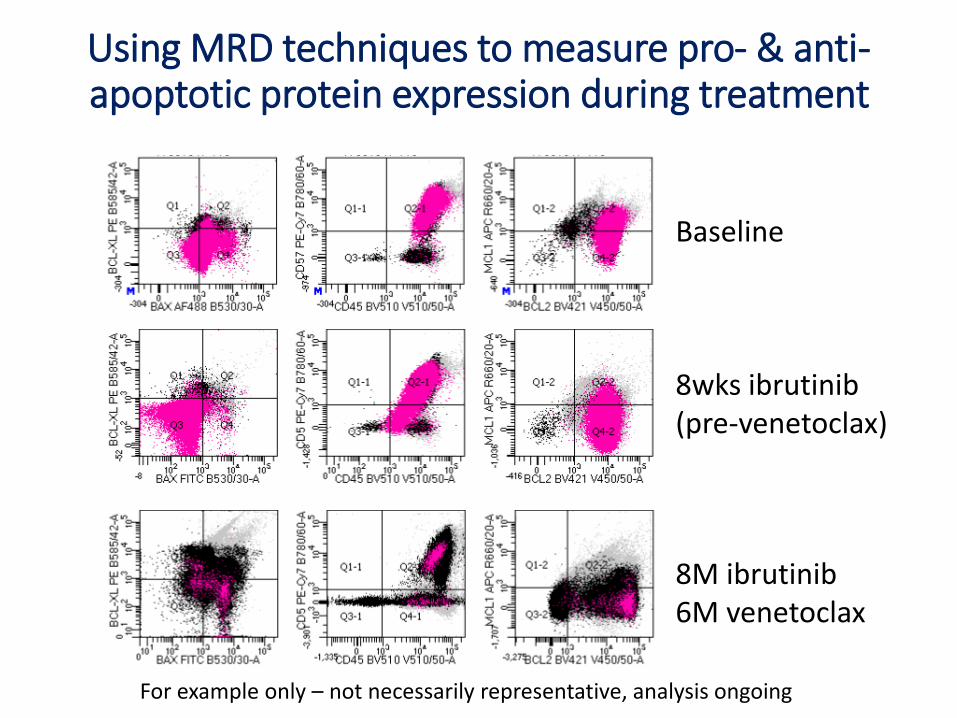
Using MRD techniques to measure pro- & anti-apoptotic protein expression during treatment
Baseline
8wks ibrutinib(pre-venetoclax)
8M ibrutinib6M venetoclax
For example only – not necessarily representative, analysis ongoing
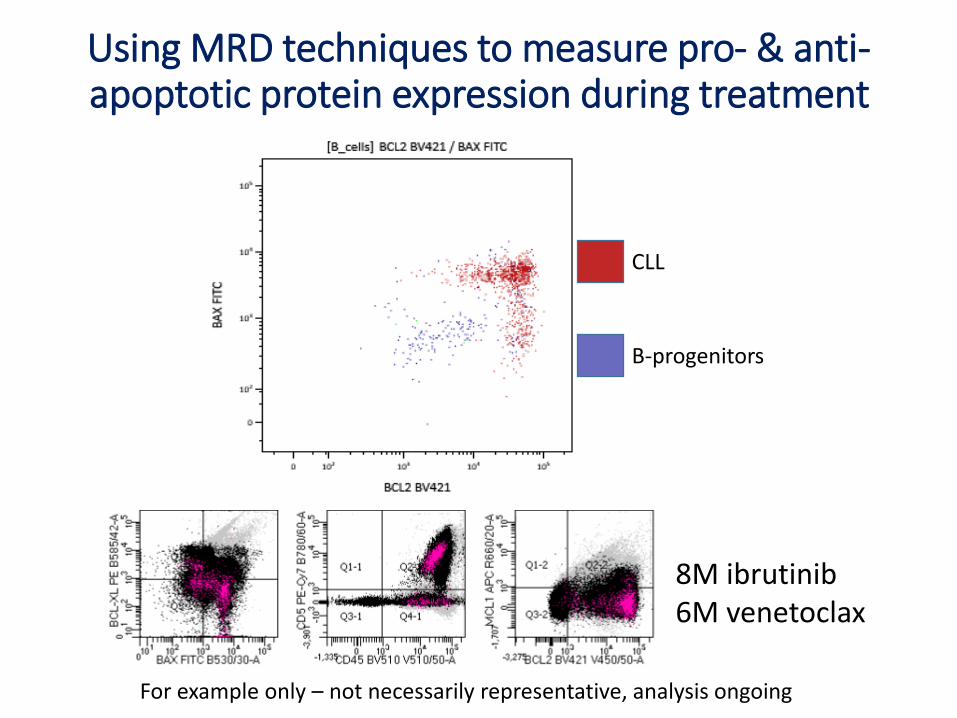
Using MRD techniques to measure pro- & anti-apoptotic protein expression during treatment
8M ibrutinib6M venetoclax
For example only – not necessarily representative, analysis ongoing
CLL
B-progenitors
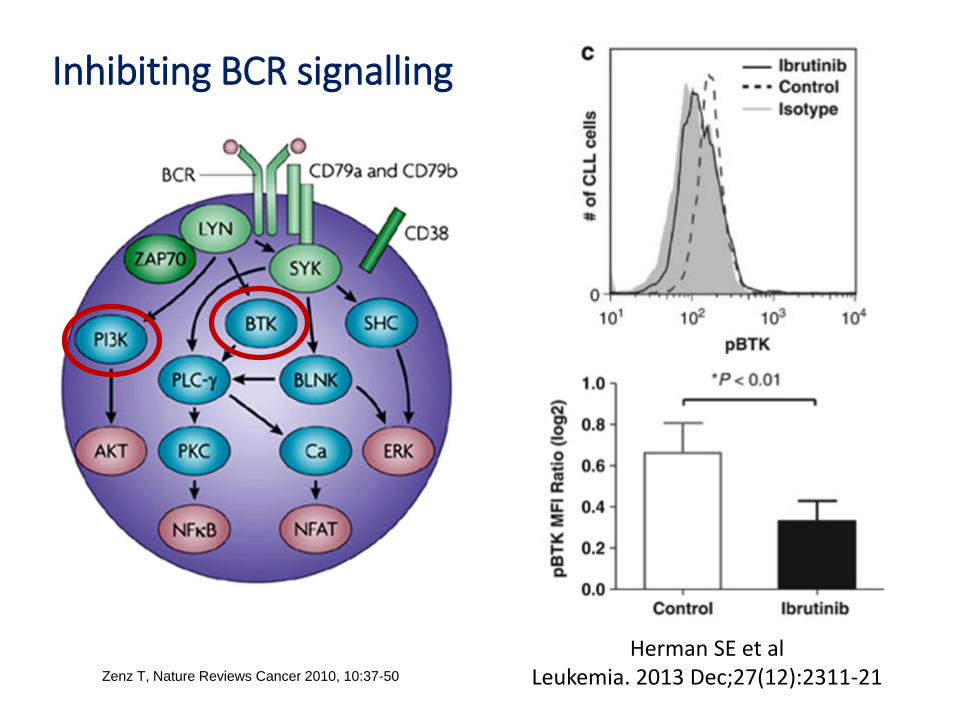
Inhibiting BCR signalling
Zenz T, Nature Reviews Cancer 2010, 10:37-50
Herman SE et al Leukemia. 2013 Dec;27(12):2311-21
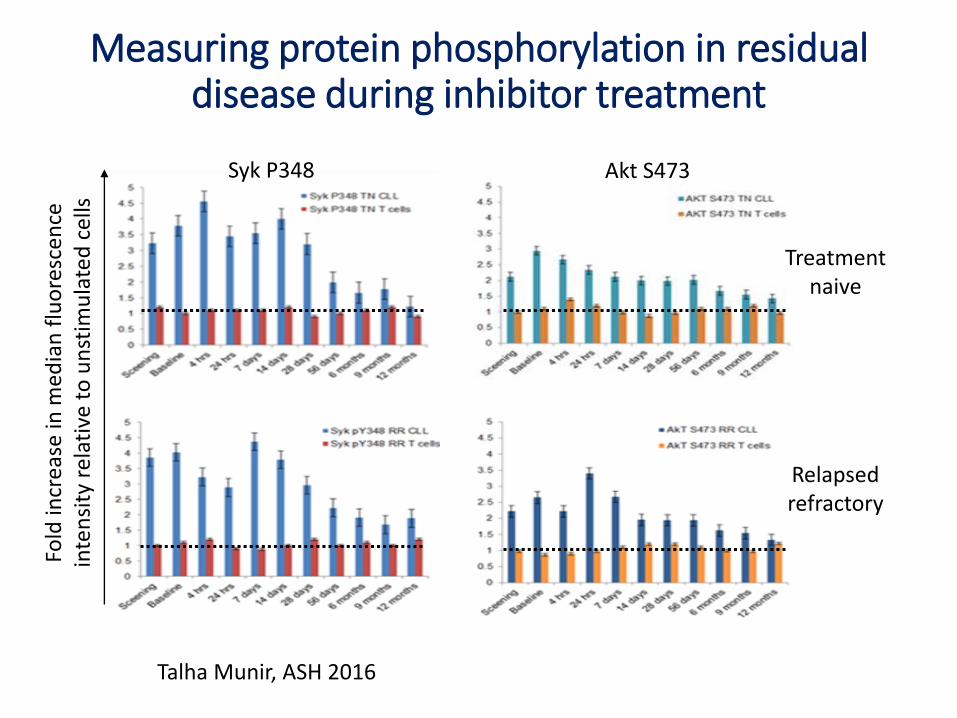
Measuring protein phosphorylation in residual disease during inhibitor treatment
Fold
incr
ease
in m
edia
n f
luo
resc
ence
in
ten
sity
rel
ativ
e to
un
stim
ula
ted
cel
ls
Syk P348 Akt S473
Treatment naive
Relapsed refractory
Talha Munir, ASH 2016
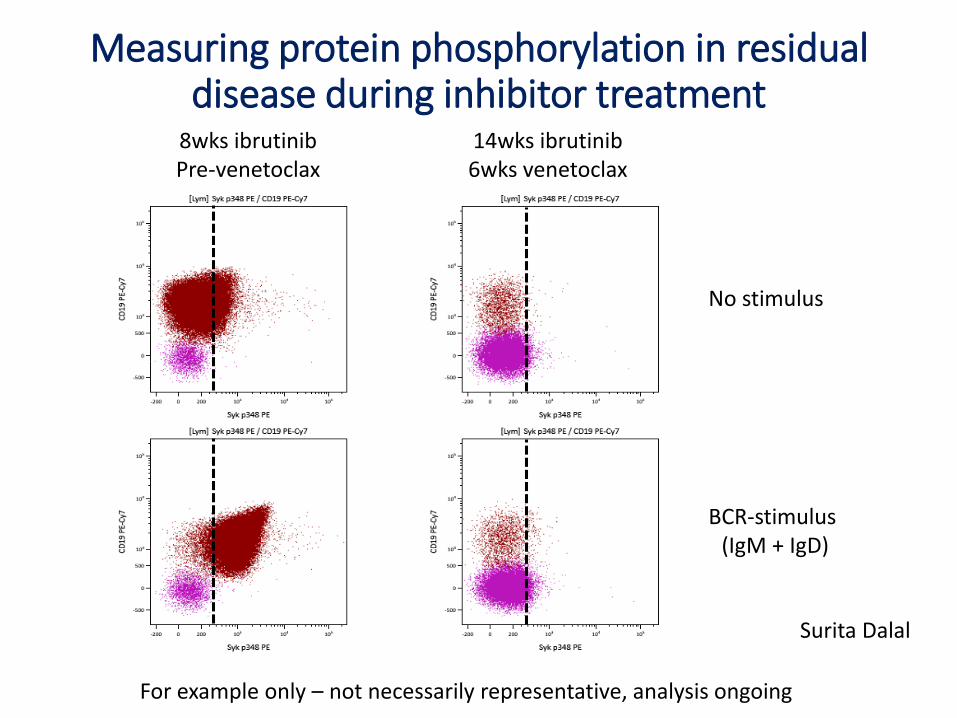
Measuring protein phosphorylation in residual disease during inhibitor treatment
Surita Dalal
8wks ibrutinibPre-venetoclax
14wks ibrutinib6wks venetoclax
No stimulus
BCR-stimulus (IgM + IgD)
For example only – not necessarily representative, analysis ongoing
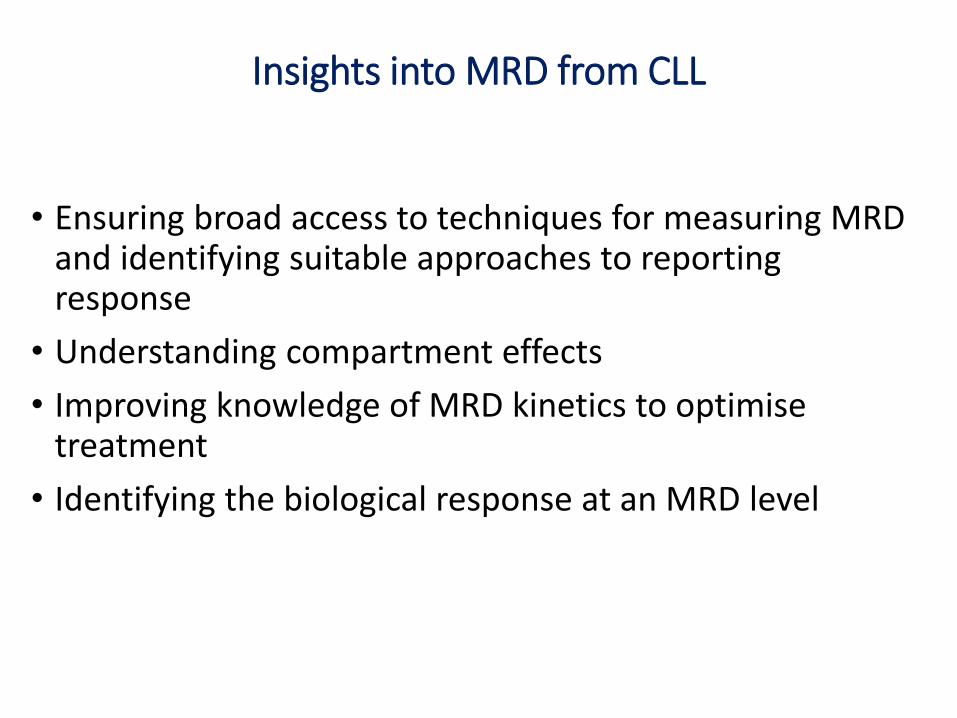
• Ensuring broad access to techniques for measuring MRD and identifying suitable approaches to reporting response
• Understanding compartment effects
• Improving knowledge of MRD kinetics to optimise treatment
• Identifying the biological response at an MRD level
Insights into MRD from CLL
Acknowledgements
NCRINational
Cancer
Research
Institute
Peter Hillmen (Chair)
David Allsup
Garry Bisshopp
Adrian Bloor
Daniel Catovsky
Claire Dearden
Caroline Duncan
Martin Dyer
Chris Fegan
George Follows
Helen McCarthy
Mel Oates
Piers Patten
Andy Pettitt
Chris Pocock
Guy Pratt
Anna Schuh
Jon Strefford
Renata Walewska
Nick York
NCRI CLL Trials Sub-group
Leeds CTRUAnna Hockaday Dena HowardJamie Oughton Fabrizio MessinaLucy Williams Lucy McParlandClaire Dimbleby David StonesDavid Philips Chris LinseySeren Langley David CairnsJames Baglin Walter GregoryJulia Brown
HMDS, LeedsAndy Rawstron Talha Munir
Abraham Varghese Ruth de Tute
Jane Shingles Cathy Burton
Francesco Forconi
Chris Fox
John Gribben
S Hewamana
Anna Hockaday
Dena Howard
Claire Hutchinson
Ben Kennedy
Scott Marshall
Alison McCaig
Janssen Novartis
GileadPharmacyclics
Roche
Bloodwise TAP ProgrammeRebecca Bishop Francesca YatesKristian Brock Samuel Muñoz-VicenteTina McLeod Sonia foxYolande Jeffferson-Hulme Sophie CrampShamyla Siddique Charles Craddock
UKCLL Trials
Biobank, Melanie Oates
Melanie Goss
Emily Cass
Andy Pettitt
Liverpool CTUMatthew BickerstaffJames DoddLucy ReadChantelle MurphyZelicia GeraldJo GouldingFrances SweeneyZviwone GoreKate Culshaw Bernadette O’Donnell
Napp
Abbvie Acerta/AZ
University of LeedsKatie Holmes Surita Dalal
Nicola McWhirter Alasdair Dewar
Pascal LeFevre Darren Newton