Embed Size (px)
Citation preview
ORIGINALRESEARCH
MR Spectroscopy Findings in Early Stages ofMotor Neuron Disease
M.M. van der GraaffC. Lavini
E.M. AkkermanCh.B. Majoie
A.J. NederveenA.H. Zwinderman
F. BrugmanL.H. van den BergJ.M.B.V. de Jong
M. de Visser
BACKGROUND AND PURPOSE: Upper motor neuron degeneration varies in different phenotypes ofMND. We used single-voxel MR spectroscopy of the primary motor cortex to detect corticomotoneu-ron degeneration and glial hyperactivity in different phenotypes of MND with a relatively short diseaseduration, contributing to further delineation of the phenotypes.
MATERIALS AND METHODS: We prospectively included patients with ALS-B, ALS-L, and PMA andcompared their data with those of patients with PLS and healthy controls. Each cohort consisted of 12individuals. Disease duration was �1 year in ALS and PMA, but longer in PLS by definition. Follow-upexamination was at 6 months. We measured ALSFRS-R, finger- and foot-tapping speed, and levels ofthe following: 1) NAAx, 2) mIns, and 3) Glx in the primary motor cortex.
RESULTS: At baseline, we found significantly decreased NAAx levels and increased mIns levels in PLS.Levels of NAAx and mIns in patients with ALS-L and ALS-B were not significantly different from thosein controls, but NAAx levels were significantly lower compared with those in PMA. At follow-up, onlyin PMA was a decrease of NAAx demonstrated. Glx levels varied widely in all groups. Levels of NAAxand mIns correlated well with clinical variables.
CONCLUSIONS: Metabolite changes suggest neuronal dysfunction and active glial involvement in PLS.The corticomotoneuron is affected in early ALS-B and ALS-L, but at a later stage also in PMA. MRspectroscopy data are useful to obtain insight into the disease process at the level of the upper motorneuron in various phenotypes of MND.
ABBREVIATIONS: ALS � amyotrophic lateral sclerosis; ALS-B � bulbar onset ALS; ALSFRS-R �Revised ALS Functional Rating Scale; ALS-L � limb-onset ALS; CI � confidence interval; Glx �glutamate � glutamine; L � left; mIns � myo-inositol; MND � motor neuron disease; MRS � MRspectroscopy; NA � not applicable; NAA � N-acetylaspartate; NAAx � N-acetylaspartate �N-acetyl aspartylglutamate; NS � not significant; PLS � primary lateral sclerosis; PMA � progres-sive muscular atrophy; R � right; ROC � receiver operating characteristic analysis; VC � vitalcapacity
ALS is characterized by progressive upper motor neuronand lower motor neuron degeneration and poor progno-
sis.1,2 Whether the primary target of disease in ALS is the uppermotor neuron, the lower motor neuron, or both simulta-neously remains controversial.3-5
Other diseases within the spectrum of MND includePMA and PLS. PMA is defined by progressive lower motorneuron signs and is diagnosed after exclusion of other lowermotor neuron syndromes.6 There is accumulating evidencethat the prognosis of PMA resembles that of ALS and thatupper motor neuron signs may occur in the course of thedisease.7-9 PLS is a pure upper motor neuron syndrome ofslowly progressive spinobulbar spasticity. Diagnosis re-quires exclusion of other upper motor neuron syndromes
and a duration of 3– 4 years to exclude upper motorneuron�dominant ALS. Survival is generally longer in PLSthan that in ALS.10,11 The exact relationship between PMA,ALS, and PLS remains unresolved.
Proton MR spectroscopy of the motor cortex can be used tostudy involvement of the upper motor neurons. Metabolitesmeasured with MR spectroscopy provide information on thecomposition of brain tissue in the selected region. NAA is pri-marily present in (motor) neurons, and a decreased level re-flects a dysfunction or loss of neurons.12 Several cross-sec-tional MR spectroscopy studies of the motor cortex showedabnormally low levels of NAA in patients with advancedALS.13-17 Increased levels of mIns indicate increased mem-brane turnover and are considered to represent glial (hyper-)activity.18 A cross-sectional study among patients with ALSdemonstrated better sensitivity and specificity of NAAx andmIns combined in an NAA/mIns index for detecting diseasethan of NAAx or mIns separately.19 Glutamate is also of greatinterest given its role in the pathogenesis of ALS, but itsspectroscopic measurement is hampered by technicalshortcomings.20,21
This controlled MR spectroscopy study compared cortico-motoneuron degeneration and glial hyperactivity in the pri-mary motor cortex in cohorts of patients with recent-onsetMND. With this study, we aimed to further delineate the var-ious phenotypes within the MND spectrum with respect to theprofile of upper motor neuron involvement.
Received March 2, 2010; accepted after revision May 5.
From the Departments of Neurology (M.M.v.d.G, J.M.B.V.d.J., M.d.V.), Radiology(C.L., E.M.A., Ch.B.M., A.J.N.), and Epidemiology and Biostatistics (A.H.Z.), Aca-demic Medical Center, Amsterdam, the Netherlands; and Department of Neurology(F.B., L.H.v.d.B.), Rudolf Magnus Institute of Neuroscience, University MedicalCenter, Utrecht, the Netherlands.
The first author has full access to all of the data in the study and takes responsibility forthe integrity of the data and the accuracy of the data analysis.
Maaike van der Graaff was funded by the Prinses Beatrix Fonds (The Hague, theNetherlands), which is a charity organization (MAR02– 0108)
Please address correspondence to Maaike van der Graaff, MD, Academic Medical Center,Department of Neurology (Room H2–234), PO Box 22660, 1100 DD Amsterdam, theNetherlands; e-mail: [email protected]
DOI 10.3174/ajnr.A2217
FUN
CTION
AL
ORIGINAL
RESEARCH
AJNR Am J Neuroradiol 31:1799 – 806 � Nov-Dec 2010 � www.ajnr.org 1799
Materials and Methods
SubjectsWe studied cohorts of patients with ALS-B, ALS-L, PMA, and PLS,
and healthy controls. Patients with ALS and PMA were recruited from
neuromuscular outpatient clinics in the Netherlands (University
Medical Centers of Amsterdam, Utrecht, Rotterdam, and the Catha-
rina Hospital in Eindhoven). Each cohort consisted of 12 individuals.
All patients with ALS met the revised El Escorial criteria for probable
(laboratory-supported) or definite ALS.22 Patients with PLS were re-
cruited from a cohort of those with PLS studied at the University
Medical Center in Utrecht. Alternative diagnoses had been ruled out
by extensive investigation.23,24 PMA was diagnosed when clinical and
electrophysiologic evidence of progressive pure lower motor neuron
involvement was present in �2 regions, excluding patients with focal
or segmental muscular atrophy and after ruling out other lower mo-
tor neuron diseases.9,22 All patients had weakness for �1 year, except
for the patients with PLS who, by definition, had a longer disease
duration. Healthy age-matched controls were recruited from hospital
personnel and partners of patients. Patients and controls were in-
cluded between June 2004 and March 2007. A follow-up visit was
scheduled 6 months after the baseline visit, except for patients with
PLS, whose data were meant to obtain reference values for longstand-
ing and prominent upper motor neuron involvement. The protocol
was approved by the local ethics committee, and all subjects gave
written informed consent.
Clinical ParametersWe measured finger- and foot-tapping speed (taps per 10 seconds
that were expressed as taps/s after averaging values for the left and
right side). Deceleration of tapping speed suggests an upper motor
neuron lesion.25 VC was measured with a handheld spirometer (Mi-
cro Medical “Micro”, Gold Standard Version; PT Medical, Leek, the
Netherlands), with the patient in a sitting position with a disposable
mask positioned over the mouth and nose, and was expressed as a
percentage of expected normal value. The ALSFRS-R (range, 0 – 48)
was administered to all subjects.26 Furthermore, we calculated the
disease progression as follows: disease progression rate � (48 � ALS-
FRS-R score) / disease duration.27
MR Imaging and Proton MR Spectroscopy AcquisitionTo detect structural abnormalities unrelated to MND that may also
affect the primary motor cortex, we acquired 3D T1-weighted, T2-
weighted, and fluid-attenuated inversion recovery images, angulated
along the anterior/posterior commissure line on a 3T MR imaging
scanner (Intera; Philips Medical Systems, Best, the Netherlands) at
baseline and at follow-up.
Single-voxel spectroscopy (point-resolved spectroscopic se-
quence; TE � 35 ms, TR � 2000 ms, voxel size � 13 � 25 � 20 mm,
voxel volume � 6.5 mL) was performed in the precentral gyrus, with
the 3T Intera scanner.28 In all patients, the same investigator
(M.M.v.d.G.) positioned the voxel, first by using the axial sections
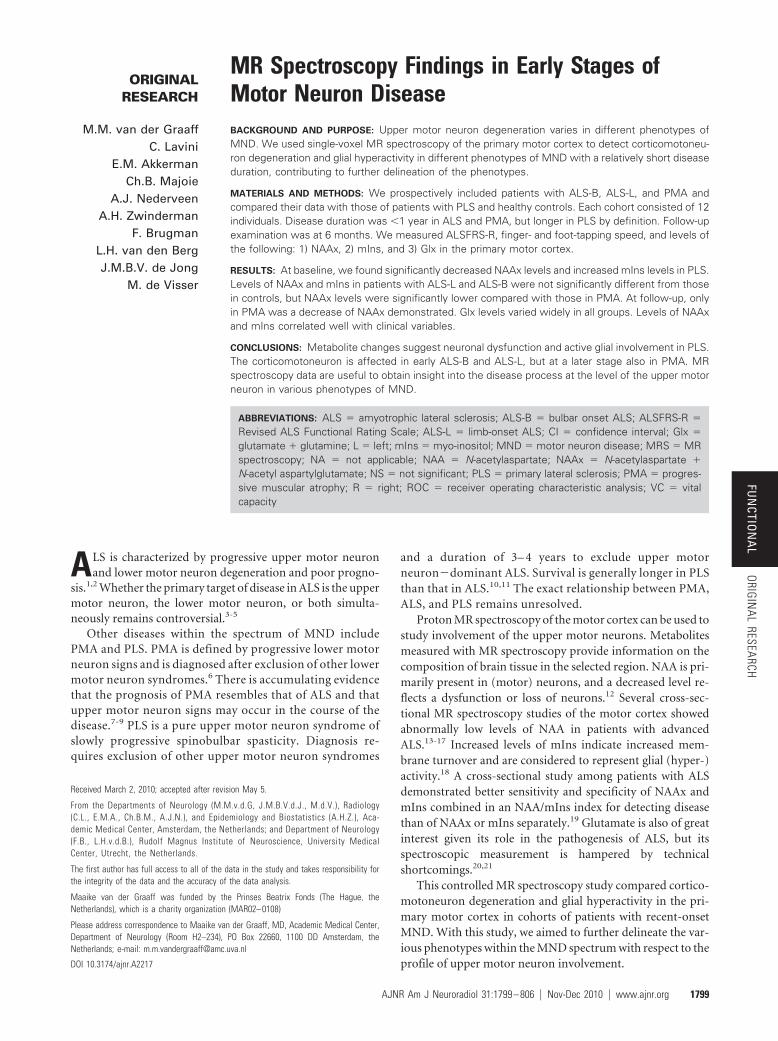
(Fig 1A), with subsequent adjustments in the sagittal (Fig 1B) and
coronal (Fig 1C) planes. We saved the voxel position in all 3 planes
and used this file to replace the voxel as precisely as possible after 6
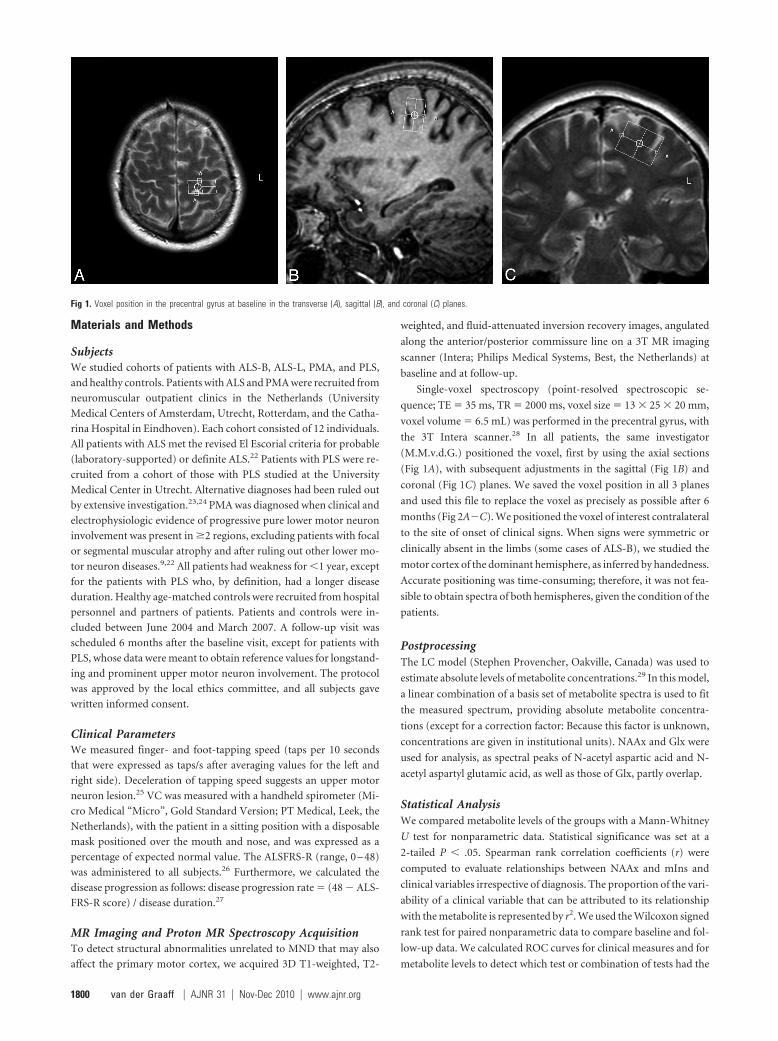
months (Fig 2A�C). We positioned the voxel of interest contralateral
to the site of onset of clinical signs. When signs were symmetric or
clinically absent in the limbs (some cases of ALS-B), we studied the
motor cortex of the dominant hemisphere, as inferred by handedness.
Accurate positioning was time-consuming; therefore, it was not fea-
sible to obtain spectra of both hemispheres, given the condition of the
patients.
PostprocessingThe LC model (Stephen Provencher, Oakville, Canada) was used to
estimate absolute levels of metabolite concentrations.29 In this model,
a linear combination of a basis set of metabolite spectra is used to fit
the measured spectrum, providing absolute metabolite concentra-
tions (except for a correction factor: Because this factor is unknown,
concentrations are given in institutional units). NAAx and Glx were
used for analysis, as spectral peaks of N-acetyl aspartic acid and N-
acetyl aspartyl glutamic acid, as well as those of Glx, partly overlap.
Statistical AnalysisWe compared metabolite levels of the groups with a Mann-Whitney
U test for nonparametric data. Statistical significance was set at a
2-tailed P � .05. Spearman rank correlation coefficients (r) were
computed to evaluate relationships between NAAx and mIns and
clinical variables irrespective of diagnosis. The proportion of the vari-
ability of a clinical variable that can be attributed to its relationship
with the metabolite is represented by r2. We used the Wilcoxon signed
rank test for paired nonparametric data to compare baseline and fol-
low-up data. We calculated ROC curves for clinical measures and for
metabolite levels to detect which test or combination of tests had the
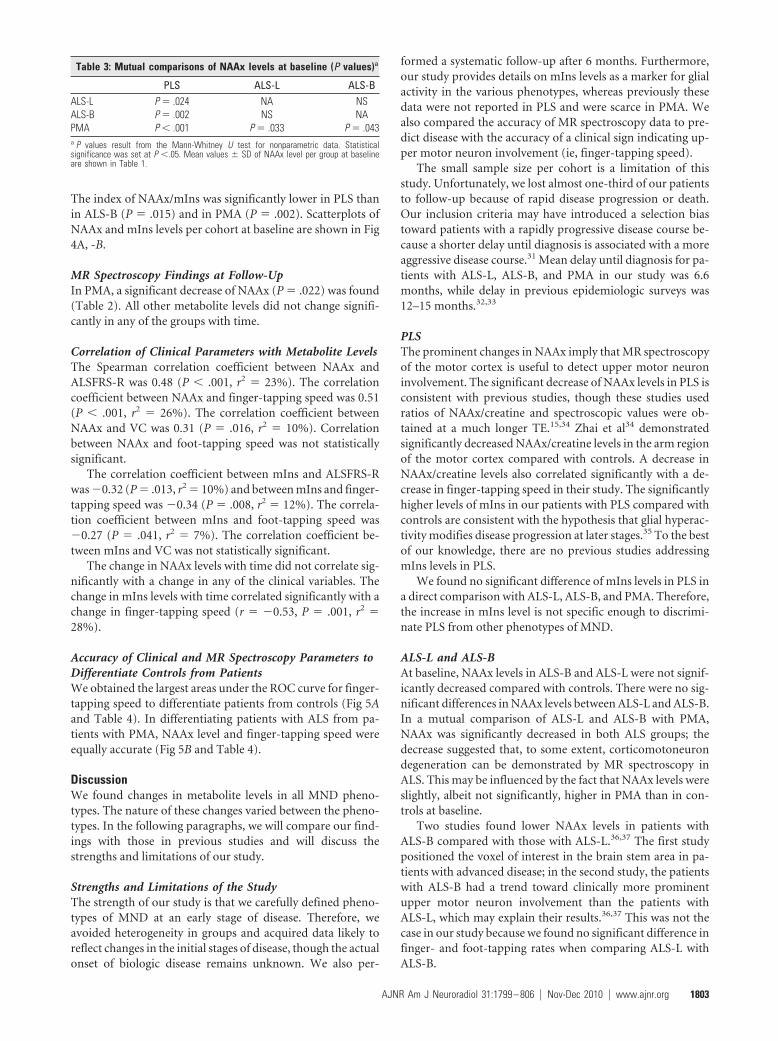
Fig 1. Voxel position in the precentral gyrus at baseline in the transverse (A), sagittal (B), and coronal (C) planes.
1800 van der Graaff � AJNR 31 � Nov-Dec 2010 � www.ajnr.org
highest accuracy in predicting disease, by comparing the areas under
the curves.
To detect a 20% decrease of NAAx in patients compared with
controls with a power of 80% and an � of 5%, 6 patients per cohort
were needed.30 On the basis of another study, 11 patients per cohort
were needed to detect a 10% decrease of NAAx within a cohort at
repeated measurement with the same power and �.17 We decided to
include 12 patients per cohort.
Results
Clinical Findings at Baseline and at Follow-UpBaseline characteristics and significant differences betweenpatient groups and controls are summarized in Table 1. Dis-ease-progression rate at baseline was significantly slower inPLS than in ALS-L (P � .003), ALS-B (P � .013), and PMA(P � .009). VC did not differ significantly between PLS andany of the other patient groups. The ALSFRS-R score was sig-nificantly lower in PLS than in ALS-L (P � .010), ALS-B (P �.009), and PMA (P � .001). Finger-tapping speed was signif-icantly lower in PLS than in ALS-B (P � .004) and PMA (P �.001) and significantly lower in ALS-L (3.3 � 1.3) comparedwith PMA (4.8 � 0.7) (P � .006). Foot-tapping speed wassignificantly lower in PLS than in ALS-L (P � .011) and ALS-B(P � .004). Disease-progression rate, VC, and ALSFRS-R
score did not differ significantly between PMA and ALS-L orALS-B, respectively, nor between ALS-L and ALS-B.
At follow-up, 7 patients with ALS-L, 9 with ALS-B, 10 withPMA, and 12 controls were able to undergo a repeat scanningsession. For PLS, no follow-up data were obtained. Follow-updata are listed in Table 2. The ALSFRS-R score decreased in allpatient groups compared with healthy controls. VC decreasedsignificantly in ALS-B and in PMA. Finger-tapping speed de-creased significantly in ALS-L (P � .046) and ALS-B (P �.038), but not in PMA. Foot-tapping speed did not changesignificantly in any of the groups. None of the patients withPMA developed clinical upper motor neuron signs during the6 months of follow-up.
MR Imaging Findings at BaselineNone of the MR images revealed structural abnormalities ofthe motor cortex unrelated to MND.
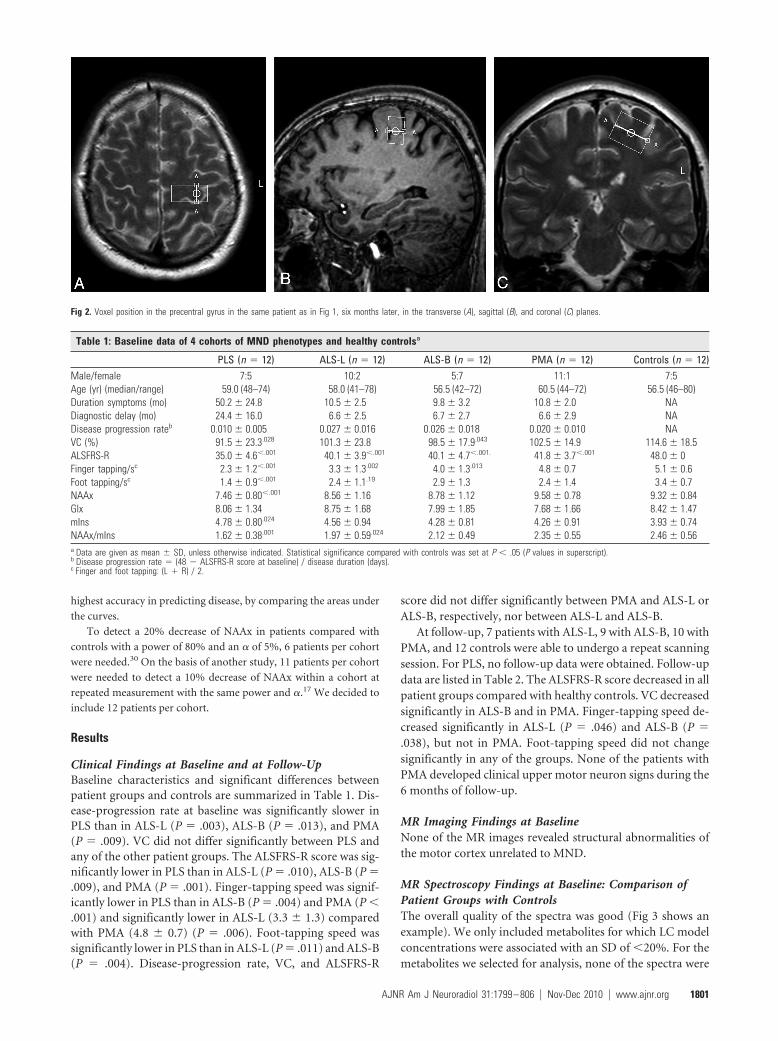
MR Spectroscopy Findings at Baseline: Comparison ofPatient Groups with ControlsThe overall quality of the spectra was good (Fig 3 shows anexample). We only included metabolites for which LC modelconcentrations were associated with an SD of �20%. For themetabolites we selected for analysis, none of the spectra were
Fig 2. Voxel position in the precentral gyrus in the same patient as in Fig 1, six months later, in the transverse (A), sagittal (B), and coronal (C) planes.
Table 1: Baseline data of 4 cohorts of MND phenotypes and healthy controlsa
PLS (n � 12) ALS-L (n � 12) ALS-B (n � 12) PMA (n � 12) Controls (n � 12)Male/female 7:5 10:2 5:7 11:1 7:5Age (yr) (median/range) 59.0 (48–74) 58.0 (41–78) 56.5 (42–72) 60.5 (44–72) 56.5 (46–80)Duration symptoms (mo) 50.2 � 24.8 10.5 � 2.5 9.8 � 3.2 10.8 � 2.0 NADiagnostic delay (mo) 24.4 � 16.0 6.6 � 2.5 6.7 � 2.7 6.6 � 2.9 NADisease progression rateb 0.010 � 0.005 0.027 � 0.016 0.026 � 0.018 0.020 � 0.010 NAVC (%) 91.5 � 23.3.028 101.3 � 23.8 98.5 � 17.9.043 102.5 � 14.9 114.6 � 18.5ALSFRS-R 35.0 � 4.6�.001 40.1 � 3.9�.001 40.1 � 4.7�.001. 41.8 � 3.7�.001 48.0 � 0Finger tapping/sc 2.3 � 1.2�.001 3.3 � 1.3.002 4.0 � 1.3.013 4.8 � 0.7 5.1 � 0.6Foot tapping/sc 1.4 � 0.9�.001 2.4 � 1.1.19 2.9 � 1.3 2.4 � 1.4 3.4 � 0.7NAAx 7.46 � 0.80�.001 8.56 � 1.16 8.78 � 1.12 9.58 � 0.78 9.32 � 0.84Glx 8.06 � 1.34 8.75 � 1.68 7.99 � 1.85 7.68 � 1.66 8.42 � 1.47mIns 4.78 � 0.80.024 4.56 � 0.94 4.28 � 0.81 4.26 � 0.91 3.93 � 0.74NAAx/mIns 1.62 � 0.38.001 1.97 � 0.59.024 2.12 � 0.49 2.35 � 0.55 2.46 � 0.56a Data are given as mean � SD, unless otherwise indicated. Statistical significance compared with controls was set at P � .05 (P values in superscript).b Disease progression rate � (48 � ALSFRS-R score at baseline) / disease duration (days).c Finger and foot tapping: (L � R) / 2.
AJNR Am J Neuroradiol 31:1799 – 806 � Nov-Dec 2010 � www.ajnr.org 1801
rejected. Metabolite levels at baseline are shown in Table 1. Wefound significantly decreased levels of NAAx in PLS (P � .001)but not in ALS-L, ALS-B, or PMA compared with controls.Levels of mIns were significantly increased in the PLS group(P � .024). Glutamate levels varied widely in all groups, withno significant differences between the groups. The index ofNAAx/mIns was significantly lower in PLS (P � .001) and inALS-L (P � .024) compared with controls.
MR Spectroscopy Findings at Baseline: MutualComparison of Patient GroupsIn PLS, the level of NAAx was significantly lower than that inALS-L, ALS-B, and PMA (Table 3). The level of mIns did notdiffer significantly between PLS and each of the other patientgroups. Mutual comparison of both ALS groups yielded nosignificant differences. Compared with PMA, the level ofNAAx was significantly lower in ALS-L and ALS-B (Table 3).
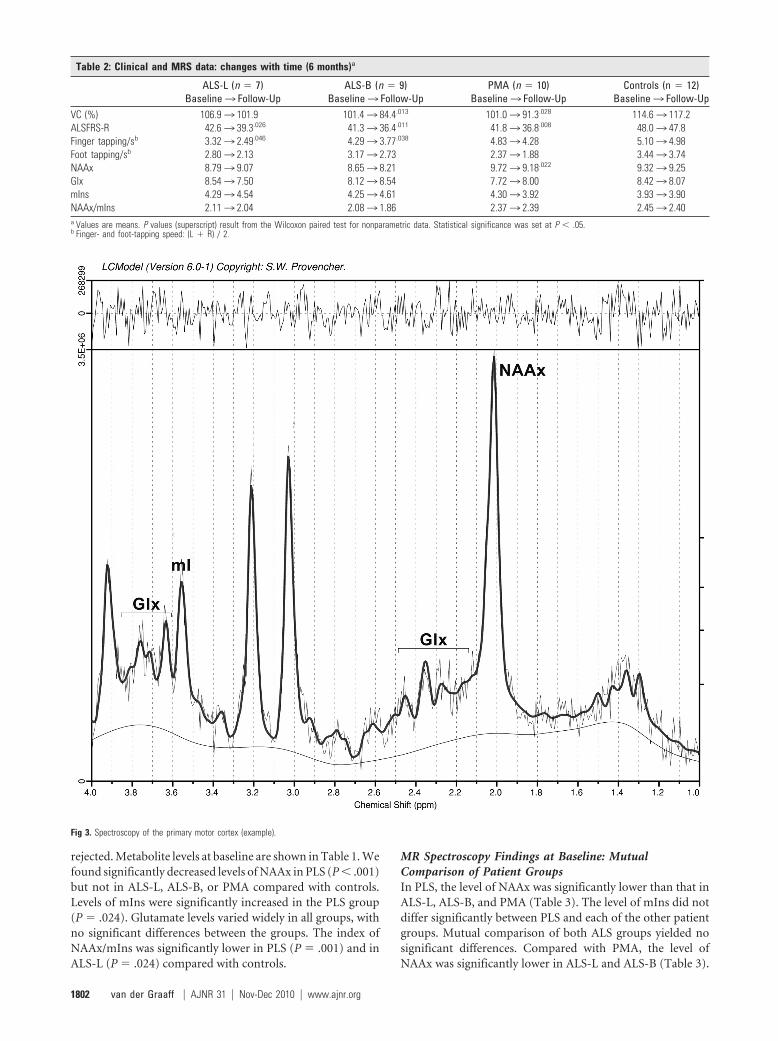
Table 2: Clinical and MRS data: changes with time (6 months)a
ALS-L (n � 7)Baseline3 Follow-Up
ALS-B (n � 9)Baseline3 Follow-Up
PMA (n � 10)Baseline3 Follow-Up
Controls (n � 12)Baseline3 Follow-Up
VC (%) 106.93 101.9 101.43 84.4.013 101.03 91.3.028 114.63 117.2ALSFRS-R 42.63 39.3.026 41.33 36.4.011 41.83 36.8.008 48.03 47.8Finger tapping/sb 3.323 2.49.046 4.293 3.77.038 4.833 4.28 5.103 4.98Foot tapping/sb 2.803 2.13 3.173 2.73 2.373 1.88 3.443 3.74NAAx 8.793 9.07 8.653 8.21 9.723 9.18.022 9.323 9.25Glx 8.543 7.50 8.123 8.54 7.723 8.00 8.423 8.07mIns 4.293 4.54 4.253 4.61 4.303 3.92 3.933 3.90NAAx/mIns 2.113 2.04 2.083 1.86 2.373 2.39 2.453 2.40a Values are means. P values (superscript) result from the Wilcoxon paired test for nonparametric data. Statistical significance was set at P � .05.b Finger- and foot-tapping speed: (L � R) / 2.
Fig 3. Spectroscopy of the primary motor cortex (example).
1802 van der Graaff � AJNR 31 � Nov-Dec 2010 � www.ajnr.org
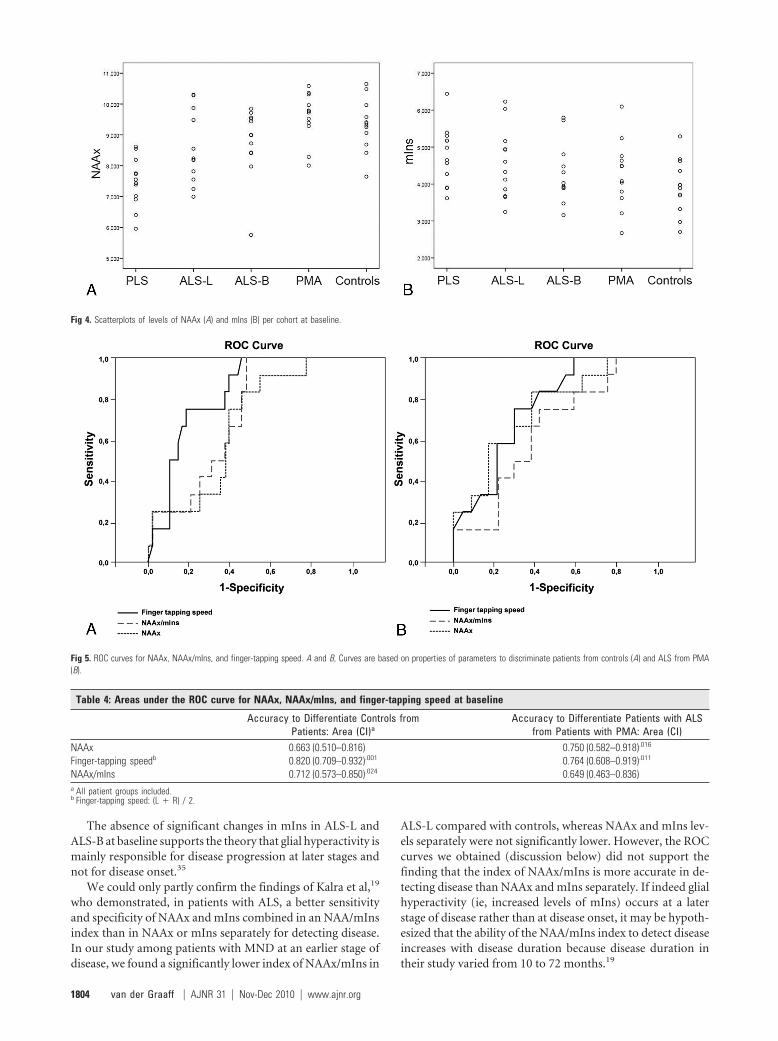
The index of NAAx/mIns was significantly lower in PLS thanin ALS-B (P � .015) and in PMA (P � .002). Scatterplots ofNAAx and mIns levels per cohort at baseline are shown in Fig4A, -B.
MR Spectroscopy Findings at Follow-UpIn PMA, a significant decrease of NAAx (P � .022) was found(Table 2). All other metabolite levels did not change signifi-cantly in any of the groups with time.
Correlation of Clinical Parameters with Metabolite LevelsThe Spearman correlation coefficient between NAAx andALSFRS-R was 0.48 (P � .001, r2 � 23%). The correlationcoefficient between NAAx and finger-tapping speed was 0.51(P � .001, r2 � 26%). The correlation coefficient betweenNAAx and VC was 0.31 (P � .016, r2 � 10%). Correlationbetween NAAx and foot-tapping speed was not statisticallysignificant.
The correlation coefficient between mIns and ALSFRS-Rwas �0.32 (P � .013, r2 � 10%) and between mIns and finger-tapping speed was �0.34 (P � .008, r2 � 12%). The correla-tion coefficient between mIns and foot-tapping speed was�0.27 (P � .041, r2 � 7%). The correlation coefficient be-tween mIns and VC was not statistically significant.
The change in NAAx levels with time did not correlate sig-nificantly with a change in any of the clinical variables. Thechange in mIns levels with time correlated significantly with achange in finger-tapping speed (r � �0.53, P � .001, r2 �28%).
Accuracy of Clinical and MR Spectroscopy Parameters toDifferentiate Controls from PatientsWe obtained the largest areas under the ROC curve for finger-tapping speed to differentiate patients from controls (Fig 5Aand Table 4). In differentiating patients with ALS from pa-tients with PMA, NAAx level and finger-tapping speed wereequally accurate (Fig 5B and Table 4).
DiscussionWe found changes in metabolite levels in all MND pheno-types. The nature of these changes varied between the pheno-types. In the following paragraphs, we will compare our find-ings with those in previous studies and will discuss thestrengths and limitations of our study.
Strengths and Limitations of the StudyThe strength of our study is that we carefully defined pheno-types of MND at an early stage of disease. Therefore, weavoided heterogeneity in groups and acquired data likely toreflect changes in the initial stages of disease, though the actualonset of biologic disease remains unknown. We also per-
formed a systematic follow-up after 6 months. Furthermore,our study provides details on mIns levels as a marker for glialactivity in the various phenotypes, whereas previously thesedata were not reported in PLS and were scarce in PMA. Wealso compared the accuracy of MR spectroscopy data to pre-dict disease with the accuracy of a clinical sign indicating up-per motor neuron involvement (ie, finger-tapping speed).
The small sample size per cohort is a limitation of thisstudy. Unfortunately, we lost almost one-third of our patientsto follow-up because of rapid disease progression or death.Our inclusion criteria may have introduced a selection biastoward patients with a rapidly progressive disease course be-cause a shorter delay until diagnosis is associated with a moreaggressive disease course.31 Mean delay until diagnosis for pa-tients with ALS-L, ALS-B, and PMA in our study was 6.6months, while delay in previous epidemiologic surveys was12–15 months.32,33
PLSThe prominent changes in NAAx imply that MR spectroscopyof the motor cortex is useful to detect upper motor neuroninvolvement. The significant decrease of NAAx levels in PLS isconsistent with previous studies, though these studies usedratios of NAAx/creatine and spectroscopic values were ob-tained at a much longer TE.15,34 Zhai et al34 demonstratedsignificantly decreased NAAx/creatine levels in the arm regionof the motor cortex compared with controls. A decrease inNAAx/creatine levels also correlated significantly with a de-crease in finger-tapping speed in their study. The significantlyhigher levels of mIns in our patients with PLS compared withcontrols are consistent with the hypothesis that glial hyperac-tivity modifies disease progression at later stages.35 To the bestof our knowledge, there are no previous studies addressingmIns levels in PLS.
We found no significant difference of mIns levels in PLS ina direct comparison with ALS-L, ALS-B, and PMA. Therefore,the increase in mIns level is not specific enough to discrimi-nate PLS from other phenotypes of MND.
ALS-L and ALS-BAt baseline, NAAx levels in ALS-B and ALS-L were not signif-icantly decreased compared with controls. There were no sig-nificant differences in NAAx levels between ALS-L and ALS-B.In a mutual comparison of ALS-L and ALS-B with PMA,NAAx was significantly decreased in both ALS groups; thedecrease suggested that, to some extent, corticomotoneurondegeneration can be demonstrated by MR spectroscopy inALS. This may be influenced by the fact that NAAx levels wereslightly, albeit not significantly, higher in PMA than in con-trols at baseline.
Two studies found lower NAAx levels in patients withALS-B compared with those with ALS-L.36,37 The first studypositioned the voxel of interest in the brain stem area in pa-tients with advanced disease; in the second study, the patientswith ALS-B had a trend toward clinically more prominentupper motor neuron involvement than the patients withALS-L, which may explain their results.36,37 This was not thecase in our study because we found no significant difference infinger- and foot-tapping rates when comparing ALS-L withALS-B.
Table 3: Mutual comparisons of NAAx levels at baseline (P values)a
PLS ALS-L ALS-BALS-L P � .024 NA NSALS-B P � .002 NS NAPMA P � .001 P � .033 P � .043a P values result from the Mann-Whitney U test for nonparametric data. Statisticalsignificance was set at P �.05. Mean values � SD of NAAx level per group at baselineare shown in Table 1.
AJNR Am J Neuroradiol 31:1799 – 806 � Nov-Dec 2010 � www.ajnr.org 1803
The absence of significant changes in mIns in ALS-L andALS-B at baseline supports the theory that glial hyperactivity ismainly responsible for disease progression at later stages andnot for disease onset.35
We could only partly confirm the findings of Kalra et al,19
who demonstrated, in patients with ALS, a better sensitivityand specificity of NAAx and mIns combined in an NAA/mInsindex than in NAAx or mIns separately for detecting disease.In our study among patients with MND at an earlier stage ofdisease, we found a significantly lower index of NAAx/mIns in
ALS-L compared with controls, whereas NAAx and mIns lev-els separately were not significantly lower. However, the ROCcurves we obtained (discussion below) did not support thefinding that the index of NAAx/mIns is more accurate in de-tecting disease than NAAx and mIns separately. If indeed glialhyperactivity (ie, increased levels of mIns) occurs at a laterstage of disease rather than at disease onset, it may be hypoth-esized that the ability of the NAA/mIns index to detect diseaseincreases with disease duration because disease duration intheir study varied from 10 to 72 months.19
Fig 4. Scatterplots of levels of NAAx (A) and mIns (B) per cohort at baseline.
Fig 5. ROC curves for NAAx, NAAx/mIns, and finger-tapping speed. A and B, Curves are based on properties of parameters to discriminate patients from controls (A) and ALS from PMA(B).
Table 4: Areas under the ROC curve for NAAx, NAAx/mIns, and finger-tapping speed at baseline
Accuracy to Differentiate Controls fromPatients: Area (CI)a
Accuracy to Differentiate Patients with ALSfrom Patients with PMA: Area (CI)
NAAx 0.663 (0.510–0.816) 0.750 (0.582–0.918).016
Finger-tapping speedb 0.820 (0.709–0.932).001 0.764 (0.608–0.919).011
NAAx/mIns 0.712 (0.573–0.850).024 0.649 (0.463–0.836)a All patient groups included.b Finger-tapping speed: (L � R) / 2.
1804 van der Graaff � AJNR 31 � Nov-Dec 2010 � www.ajnr.org
PMAThe absence of a significant NAAx decrease and a significantmIns increase at baseline compared with controls is compati-ble with the concept of PMA being a pure lower motor neurondisorder, at least at this early stage of disease. In addition, wedemonstrated significantly decreased levels of NAAx in bothALS groups when compared directly with those measured inPMA. This could not be explained by a more benign course inPMA. Disease-progression rate at baseline did not differ sig-nificantly from that in ALS-L and ALS-B (Table 1), and thedecrease in the ALSFRS-R score and VC between baseline visitand follow-up after 6 months (Table 2) was similar to what wefound in both ALS groups.
With time, we found a significant decrease of NAAx inPMA and in none of the other groups, though the clinicalpicture remained purely restricted to the lower motor neuronin the 6 months of follow-up. This may suggest that subclini-cally, a process of corticomotoneuron degeneration does oc-cur, albeit at a slightly later stage of disease.
Delineation of PMA as a separate entity in the MND spec-trum remains debated. Several studies have provided clinicaland histologic evidence of upper motor neuron involvementin PMA.7,9 Six other MR spectroscopy studies included pa-tients with PMA among other patients with MND. Resultsvaried from a modest decrease14,38,39 in NAAx to normal find-ings13,16 in patients with PMA. One study included patientswith PMA as part of a larger group of “non-upper motor dis-ease patients,” not allowing specific conclusions with respectto PMA.15 Cohorts of patients with PMA were usually small(n � 2– 4).13,15,16 Mean disease duration was either un-known,14,15,38 or at least �2 years.15,38,39 Follow-up was per-formed in 1 study, in a small (n � 4) subset of included pa-tients with PMA.14 Only 1 study included measurement ofmIns in patients with PMA with unspecified disease duration,yielding no significant changes compared with controls.14
In conclusion, results of previous studies are difficult tocompare with those obtained in our study in which the PMAcohort was homogeneous with respect to disease duration. Weperformed a systematic follow-up, and these follow-up datasuggest onset of corticomotoneuron degeneration also inPMA, albeit at later stage of disease.
Clinical Findings and Their Relation to Metabolite LevelsLevels of NAAx and mIns correlated well with clinical vari-ables. Finger-tapping speed correlated more strongly withNAAx and mIns than did foot-tapping speed. This correlationmay well be related to the fact that the voxel was positioned ina part of the primary motor cortex where the motor functionof the arm/hand is represented.
A change in levels of NAAx with time did not correlatesignificantly with a change in any of the clinical variables.However, we found a strong inverse correlation between anincrease of mIns levels and a decrease of finger-tapping speedwith time, irrespective of diagnosis. This may imply that oncecorticomotoneuron degeneration has been initiated, glial hy-peractivity becomes the more important factor when diseaseprogresses, though we could not confirm this at the grouplevel, probably due to the small sample size per group.35
Finger-tapping speed was more accurate than the level ofNAAx in differentiating patients from controls and equally
accurate in differentiating patients with ALS from those withPMA, possibly reducing the clinical impact of MR spectros-copy. Measurement of finger- and foot-tapping speed is verysimple and can easily be used in daily practice. A recent studyshowed a strong correlation between finger-tapping speed andgray matter perfusion in patients with ALS.40 Although reli-ability and validity of finger- and foot-tapping speed have notbeen formally studied in adults, decreased foot-tapping speedwas found to be a more reliable, sensitive, and specific indica-tor of upper motor neuron dysfunction than the plantar ex-tensor response.41 It can also be used to monitor progressionof upper motor neuron dysfunction with time.25
ConclusionsIn this longitudinal single-voxel MR spectroscopy study of theprimary motor cortex, we focused on patients with well-de-fined MND phenotypes with a relatively short disease dura-tion and compared these phenotypes with healthy controlsand with patients with PLS. In PLS, metabolite changes weremost prominent, suggestive of more severe neuronal loss/dys-function and active glial involvement. We demonstrated cor-ticomotoneuron dysfunction in patients with recent-onsetALS-L and ALS-B compared with PMA at baseline. However,our follow-up data suggest that corticomotoneuron dysfunc-tion occurs also in PMA at a later stage. We found no evidencefor early glial hyperactivity in ALS or in PMA at the grouplevel.
Our study demonstrated that MR spectroscopy data areuseful in obtaining insight into the disease process at the levelof the upper motor neuron in various phenotypes of MND.
AcknowledgmentsWe thank Suzan Beyer for her assistance with the figures andDr M.C. de Rijk and Prof P.A. van Doorn for their help in therecruitment of patients.
References1. Czaplinski A, Yen AA, Simpson EP, et al. Predictability of disease progression
in amyotrophic lateral sclerosis. Muscle Nerve 2006;34:702– 082. Zoccolella S, Beghi E, Palagano G, et al. Analysis of survival and prognostic
factors in amyotrophic lateral sclerosis: a population-based study. J NeurolNeurosurg Psychiatry 2008;79:33–37
3. Chou SM, Norris FH. Amyotrophic lateral sclerosis: lower motor neuron dis-ease spreading to upper motor neurons. Muscle Nerve 1993;16:864 – 69
4. Eisen A. Motor neuron disease: a primary disorder of corticomotoneurons?Muscle Nerve 1995;18:1080 – 81
5. Pamphlett R, Kril J, Hng TM. Motor neuron disease: a primary disorder ofcorticomotoneurons? Muscle Nerve 1995;18:314 –18
6. Visser J, van den Berg-Vos RM, Franssen H, et al. Mimic syndromes in sporadiccases of progressive spinal muscular atrophy. Neurology 2002;58:1593–96
7. Ince PG, Evans J, Knopp M, et al. Corticospinal tract degeneration in the pro-gressive muscular atrophy variant of ALS. Neurology 2003;60:1252–58
8. Kim WK, Liu X, Sandner J, et al. Study of 962 patients indicates progressivemuscular atrophy is a form of ALS. Neurology 2009;73:1686 –92
9. Visser J, van den Berg-Vos RM, Franssen H, et al. Disease course and prognosticfactors of progressive muscular atrophy. Arch Neurol 2007;64:522–28
10. Gordon PH, Cheng B, Katz IB, et al. The natural history of primary lateralsclerosis. Neurology 2006;66:647–53
11. Pringle CE, Hudson AJ, Munoz DG, et al. Primary lateral sclerosis: clinicalfeatures, neuropathology and diagnostic criteria. Brain 1992;115(pt 2):495–520
12. Demougeot C, Garnier P, Mossiat C, et al. N-acetylaspartate, a marker of bothcellular dysfunction and neuronal loss: its relevance to studies of acute braininjury. J Neurochem 2001;77:408 –15
13. Pioro EP, Antel JP, Cashman NR, et al. Detection of cortical neuron loss inmotor neuron disease by proton magnetic resonance spectroscopic imagingin vivo. Neurology 1994;44:1933–38
AJNR Am J Neuroradiol 31:1799 – 806 � Nov-Dec 2010 � www.ajnr.org 1805
14. Block W, Karitzky J, Traber F, et al. Proton magnetic resonance spectroscopy ofthe primary motor cortex in patients with motor neuron disease: subgroupanalysis and follow-up measurements. Arch Neurol 1998;55:931–36
15. Chan S, Shungu DC, Douglas-Akinwande A, et al. Motor neuron diseases: com-parison of single-voxel proton MR spectroscopy of the motor cortex with MRimaging of the brain. Radiology 1999;212:763– 69
16. Gredal O, Rosenbaum S, Topp S, et al. Quantification of brain metabolites inamyotrophic lateral sclerosis by localized proton magnetic resonance spec-troscopy. Neurology 1997;48:878 – 81
17. Pohl C, Block W, Karitzky J, et al. Proton magnetic resonance spectroscopy ofthe motor cortex in 70 patients with amyotrophic lateral sclerosis. Arch Neurol2001;58:729 –35
18. Brand A, Richter-Landsberg C, Leibfritz D. Multinuclear NMR studies on theenergy metabolism of glial and neuronal cells. Dev Neurosci 1993;15:289 –98
19. Kalra S, Hanstock CC, Martin WR, et al. Detection of cerebral degeneration inamyotrophic lateral sclerosis using high-field magnetic resonance spectros-copy. Arch Neurol 2006;63:1144 – 48
20. De Stefano N, Filippi M, Miller D, et al. Guidelines for using proton MR spec-troscopy in multicenter clinical MS studies. Neurology 2007;69:1942–52
21. Pioro EP, Majors AW, Mitsumoto H, et al. 1H-MRS evidence of neurodegen-eration and excess glutamate � glutamine in ALS medulla. Neurology 1999;53:71–79
22. Brooks BR, Miller RG, Swash M, et al. El Escorial revisited: revised criteria forthe diagnosis of amyotrophic lateral sclerosis. Amyotroph Lateral Scler OtherMotor Neuron Disord 2000;1:293–99
23. Brugman F, Wokke JH, Scheffer H, et al. Spastin mutations in sporadic adult-onset upper motor neuron syndromes. Ann Neurol 2005;58:865– 69
24. Brugman F, Scheffer H, Wokke JH, et al. Paraplegin mutations in sporadicadult-onset upper motor neuron syndromes. Neurology 2008;71:1500 – 05
25. Kent-Braun JA, Walker CH, Weiner MW, et al. Functional significance of up-per and lower motor neuron impairment in amyotrophic lateral sclerosis.Muscle Nerve 1998;21:762– 68
26. Cedarbaum JM, Stambler N, Malta E, et al. The ALSFRS-R: a revised ALS func-tional rating scale that incorporates assessments of respiratory function—BDNF ALS Study Group (Phase III). J Neurol Sci 1999;169:13–21
27. Ellis CM, Simmons A, Jones DK, et al. Diffusion tensor MRI assesses cortico-spinal tract damage in ALS. Neurology 1999;53:1051–58
28. Naidich TP, Grant JL, Altman N, et al. The developing cerebral surface: pre-
liminary report on the patterns of sulcal and gyral maturation—anatomy,ultrasound, and magnetic resonance imaging. Neuroimaging Clin N Am 1994;4:201– 40
29. Provencher SW. Estimation of metabolite concentrations from localized invivo proton NMR spectra. Magn Reson Med 1993;30:672–79
30. Sarchielli P, Pelliccioli GP, Tarducci R, et al. Magnetic resonance imaging and1H-magnetic resonance spectroscopy in amyotrophic lateral sclerosis. Neu-roradiology 2001;43:189 –97
31. Czaplinski A, Yen AA, Appel SH. Amyotrophic lateral sclerosis: early predic-tors of prolonged survival. J Neurol 2006;253:1428 –36
32. Cima V, Logroscino G, D’Ascenzo C, et al. Epidemiology of ALS in Padovadistrict, Italy, from 1992 to 2005. Eur J Neurol 2009;16:920 –24. Epub 2009 Mar31
33. Czaplinski A, Yen AA, Simpson EP, et al. Slower disease progression and pro-longed survival in contemporary patients with amyotrophic lateral sclerosis:is the natural history of amyotrophic lateral sclerosis changing? Arch Neurol2006;63:1139 – 43
34. Zhai P, Pagan F, Statland J, et al. Primary lateral sclerosis: a heterogeneousdisorder composed of different subtypes? Neurology 2003;60:1258 – 65
35. Boillee S, Yamanaka K, Lobsiger CS, et al. Onset and progression in inheritedALS determined by motor neurons and microglia. Science 2006;312:1389 –92
36. Cwik VA, Hanstock CC, Allen PS, et al. Estimation of brainstem neuronal lossin amyotrophic lateral sclerosis with in vivo proton magnetic resonance spec-troscopy. Neurology 1998;50:72–77
37. Ellis CM, Simmons A, Andrews C, et al. A proton magnetic resonance spectro-scopic study in ALS: correlation with clinical findings. Neurology 1998;51:1104 – 09
38. Kaufmann P, Pullman SL, Shungu DC, et al. Objective tests for upper motorneuron involvement in amyotrophic lateral sclerosis (ALS). Neurology 2004;62:1753–57
39. Mitsumoto H, Ulug AM, Pullman SL, et al. Quantitative objective markers forupper and lower motor neuron dysfunction in ALS. Neurology 2007;68:1402–10
40. Rule RR, Schuff N, Miller RG, et al. Gray matter perfusion correlates withdisease severity in ALS. Neurology 2010;74:821–27
41. Miller TM, Johnston SC. Should the Babinski sign be part of the routine neu-rologic examination? Neurology 2005;65:1165– 68
1806 van der Graaff � AJNR 31 � Nov-Dec 2010 � www.ajnr.org