Embed Size (px)
Citation preview

THE POTENTIAL USE OF ECOLOGICAL SOLID WASTE
MANAGEMENT IN NKASI DISTRICT: A CASE OF NAMANYERE TOWN
COUNCIL
By
NZILANTUZU MAYUMA NKINGWA
REG.PG 201400249
A RESEARCH DISSERTATION SUBMITTED IN
PARTIAL FULFILLMENT OF THE REQUIREMENT OF MASTER OF
SCIENCES IN ENVIRONMENTAL STUDIES OF THE OPEN UNIVERSITY
OF TANZANIA
2018

CERTIFICATION
The undersigned certifies that he has read and hereby recommended for
acceptance by the Open University of Tanzania a dissertation entitled ‘the Potential
use of Ecological Solid Waste Management in Nkasi district council in a
fulfillment of the requirements for the Master of Science in environmental
Studies.
………………………………………………
Dr. Lawi Yohana
(Supervisor)
Date: ……………………………………
STATEMENT OF COPYRIGHT
“No part of this dissertation may be reproduced, stored in any retrieval system, or
transmitted in any form by any means, electronic, mechanical, photocopying,
recording or otherwise without prior written permission of the author or the Open
University of Tanzania in that behalf”.
ECLARATION BY THE CANDIDATE
I, Nzilantuzu Mayuma Nkingwa, declare that this dissertation is my own
original work and that it has not been presented and will not be presented to any
other University for a similar or any other degree award.

DEDICATION
This work is dedicated to my beloved Wife Josephine w. Nzilantuzu and my lovely
daughter Salome and Hollo and also sons Kilyabumu and Erick for their tolerance for
my absence at home with love and understanding. I do also single out my parents
whose contribution to my life is immense. I appreciate. To, them I am grateful.

ACKNOWLEDGEMENT
Firstly, I thank the Almighty God for his blessings, protection and guidance
throughout my study.
I wish to thank all academic staff of the Open University of Tanzania, whose
contribution and assistance has enabled the preparation of this dissertation possible.
Special thanks should go to Dr. Yohana Lawi, my supervisor for his tireless support
in providing constructive critics, guidance and encouragement during preparation of
this dissertation.
My heartfelt appreciation is also directed to the Nkasi district council particularly the
staff employees and community members for their facilitation of this study through
provision of data which made this study feasible.

ABSTRACT
The study sought to investigate the potential use of ecological Solid Waste
Management in Namanyere Township. Specifically this study intended to assess the
existing solid waste management practices, to identify the type of solid waste
generated and to develop the ecological solid waste management techniques in the
study area. Primary data were collected through questionnaires. and Observation
Descriptive research design was employed by using 100 respondents(50)employee
and (50)community respectively .and data were analyzed using a computer program
statistical package for social science.
The result showed that the major type of solid waste generated in a study area
originated from commercial area(50),residential area (46) and [4]from hospital .the
all of these were the main type of waste which contain organic and inorganic
matter ,toxic and hospital waste further more according to the findings the ecological
waste management approaches which can be employed in the study area are the
source reduction(6.9),composting(5.)),recycling(5.5)and re-uses(0.3)
It can be concluded that the existing practice of solid waste management in the study
area are ineffective and the ecological waste management method could be more
effective in dealing with solid waste management problems.
The study recommend that the introduction of small industries that will utilize the
recyclable wastes.
For effective collection of solid wastes there is a need for the Town council to invest
in transport services so as to insure that there is a reliable solid waste collection,
transportation and disposal of waste to dumping areas.

TABLE OF CONTENTSCERTIFICATION.......................................................................................................i
STATEMENT OF COPYRIGHT.............................................................................ii
DECLARATION BY THE CANDIDATE..............................................................iii
DEDICATION...........................................................................................................iv
ACKNOWLEDGEMENT.........................................................................................v
ABSTRACT...............................................................................................................vi
LIST OF TABLES.....................................................................................................xi
LIST OF FIGURES..................................................................................................xii
LIST OF ABBREVIATIONS.................................................................................xiii
CHAPTER ONE………………………………………………………………………....1
1.1 Introduction...........................................................................................................1
1.2 Background of the Study.....................................................................................1
1.3 Problem Statement ..............................................................................................4
1.4 Main objective.....................................................................................................5
1.5 Specific Objective................................................................................................5
1.6 Research Questions.............................................................................................5
1.7 Significance of the Study.....................................................................................5
1.8 Limitations of the study.......................................................................................6
1.9 Conceptual Framework........................................................................................6
1.10 Operational Definitions of Key Terms……………………………………….7
1.10.1 Ecology………………………………………………………………………..7
1.10.2 Ecological solid waste management…………………………………………..7

1.10.3 Solid waste…………………………………………………………………...9
CHAPTER TWO…………………………………………………………………..10
LITERATURE REVIEW........................................................................................10
2.1 Introduction.........................................................................................................10
2.2 Theoretical Literature Review............................................................................10
2.2.1 Solid waste management practices....................................................................10
2.4 The type of solid wastes generated…………………………………………….18
2.5 Ecological solid waste management techniques.................................................21
2.5.1 Source reduction................................................................................................21
2.5.2 Reuse................................................................................................................22
2.5.3 Recycling...........................................................................................................23
2.5.4 Composting and anaerobic digestion.................................................................23
2.5.5 Mechanical biological(MBT) treatment..........................................................25
2.5.6 Incineration........................................................................................................26
2.5.7 Mechanical heat treatment(MHT)...................................................................28
2.5.8 Land filling........................................................................................................29
CHAPTER THREE..................................................................................................31
RESEARCH METHODOLOGY............................................................................31
3.0 Introduction.........................................................................................................31
3.2 Research Design.................................................................................................31
3.3 Population of the study.......................................................................................32
3.4 Sample size.........................................................................................................32
3.5 Sampling techniques...........................................................................................33
3.6 Data collection Instruments...............................................................................33

3.7 Data analysis......................................................................................................34
CHAPTER FOUR………………………………………………………………….35
ANALYSIS AND DISCUSSION OF FINDINGS..................................................35
4.0 Introduction...........................................................................................................35
4.1 Demographic characteristics of respondents.....................................................35
4.1.1 Sex of respondents...........................................................................................35
4.1.2 Education level of respondents........................................................................36
4. 1.3 Working experience.......................................................................................36
4.2 Analysis and Discussion of Findings..................................................................37
4.2.1 Solid waste management practices..................................................................37
4.2.1.1 Local authority control waste collection schedules......................................37
4.2.1.4 Practices are mostly used in solid waste management................................38
4.2.1.2 Method/s for solid waste collection.............................................................40
4.2.1.3 The status of solid waste management......................................................41
4.2.2 The type of solid wastes generated..................................................................42
4.2.2.1 The main source of solid waste generation in the study area.......................42
4.2.2.2 Type of solid waste materials are generated in the study area.....................43
4.2.3 The ecological solid waste management techniques.......................................45
4.2.3.1 Relationship between technique mostly employed and ecological solid waste
management..................................................................................................46
4.2.3.2 The types of solid waste material incinerated in the study area..................48
4.2.3.3 The frequency of solid waste collection in the study area...........................49
4.2.3.4 Types of carriage used to move solid wastes...............................................50
CHAPTER FIVE......................................................................................................52

SUMMARY, CONCLUSION AND RECOMMENDATIONS............................52
5.0 Introduction........................................................................................................52
5.1 Summary...............................................................................................................52
5.2 Conclusions.........................................................................................................53
5.3 Recommendations..............................................................................................53
REFERENCES.........................................................................................................55
APPENDIX I……………………………………………………………………….62

LIST OF TABLES
Table 2.1: Types of solid wastes………………………………………………….20
Table: 3.1: Sample size……………………………………………………………32
Table 4.1: Sex of respondents …………………………………………………….34
Table 4.2: Education level of respondents ……………………………………….35
Table 4.3: Work period of respondents…………………………………………...36
Table 4.4: Local authority control waste collection schedules…………………....37
Table 4.5: Descriptive Statistics…………………………………………………...37
Table 4.6: Regression Coefficients……………………………………………….38
Table 4.7: The main source of solid waste generation in the study area………….42
Table 4.8: Descriptive Statistics…………………………………………………. 43
Table 4.9: Regression Coefficients………………………………………………45
Table 4.10: Descriptive Statistics…………………………………………………46
Table 4.11: Regression Coefficients……………………………………………..48

LIST OF FIGURES
Figure 1.1: Conceptual framework-----------------------------------------------------------6
Figure 2.1: The waste management hierarchy-------------------------------------------- 14
Figure 4.1: Method/s for solid waste collection-------------------------------------------40
Figure 4.2: The status of solid waste management--------------------------------------41
Figure 4.5: The types of solid waste material incinerated in the study area----------49
Figure 4.6: The frequency of solid waste collection in the study area-----------------50
Figure 4.7: Types of carriage used to move solid wastes-------------------------------52

LIST OF ABBREVIATIONS
AD Anaerobic digestion
C&D Construction and demolition
CHP Combined Heat and Power
CO2 Carbon dioxide
CDM Clean Development Mechanism
EPP Environmentally Preferable Purchasing
EEA European Environment Agency
ESCAP Economic and Social Commission for Asia and the Pacific
ISWM Integrated Solid Waste Management
MSW Municipal Solid Waste
MHT Mechanical heat treatment
MBT Mechanical Biological Treatment
RDF Refuse Derived Fuel
SPSS Statistical Package for Social Sciences
UNEP United Nations Environment Programme
UK United Kingdom

CHAPTER ONE
1.1 Introduction
This chapter presents the background of the problem, statement of the problem,
purpose of the study, research objectives, research questions, scope of the study,
significance of the study, limitations and delimitations of the study, operational
definitions of the key terms and organization of the study
1.2 Background of the Study
In recent decades the rapid growth of economic activities and population in the
developing countries and Namanyere Township inclusive, has caused an increased
consumption of natural resources that has led to much waste generation in some
areas (United Nations Environment Programme, 1999).
The term “waste” generally refers to “unwanted” for the person who discards it; a
product or material that does not have a value anymore for the first user and is thus
thrown away. But “unwanted” is subjective because the waste could have value to
another person in a different circumstance or even in a different culture. Today, there
are many large industries that operate primarily or exclusively using waste materials
like paper and metals as their industrial feed stocks (Scheinberg, 2001).
Integrated Solid Waste Management (ISWM) plan (UNEP, 2009) estimated that the
total amount of municipal solid waste (MSW) generated globally in 2006 reached
2.02 billion tones, representing a seven (7) percent annual increase since 2003. In
addition, it projected that the global generation of MSW will rise by 37.3 percent,

equivalent to approximately eight (8) percent increase per year between 2007 and
2011.
The current practice of collecting, processing and disposing municipal solid wastes is
also considered to be least efficient in most developing countries. The typical
problems are low collection coverage and irregular collection services, crude open
dumping and burning without air and water pollution control, the breading of flies
and pests, and the handling and control of informal waste picking or scavenging
activities (Bartone, 1995).
Although some cities do spend significant portions of their municipal revenues on
waste management (Bartone, 2000), they are often unable to keep pace with the
scope of the problem. Senkoro (2003) indicated that for many African countries, only
less than 30% of the urban population has access to proper and regular garbage
collection.
In developing countries, open dumpsites are the most common method of disposing
of waste (World Bank 2012). Dumping of mixed waste occurs alongside open
burning, grazing of stray animals and pollution of surface and groundwater by
hazardous substances such as leachate and gas (UNEP, 2011).
Dumpsites have been linked to many harmful health effects, including skin and eye
infections, respiratory problems, vector-borne diseases such as diarrhea, dysentery,
typhoid, hepatitis, cholera, malaria and yellow fever, high blood lead levels and
exposure to heavy metal poisoning (UNEP, 2011). However, in developing
countries, data on waste generation and composition are largely unreliable and

insufficient, seldom capturing system losses or informal activities (Jha et al.,2011;
UN-HABITAT, 2010). Without proper data it might be difficult to design sound
strategies or to make wise budget decisions on waste management (Wilson et
al.,2012).
Because of insufficient or lack of human and financial capacities to remedy the
situation unacceptable waste disposal has become a challenge in Africa and other
developing countries. About 20 to 80 percent of the solid waste in African cities is
disposed of by dumping in open spaces, water bodies, and surface drains as a result
of inadequate infrastructure and awareness. Municipal waste management should be
properly disposed of in order to safeguard the environment and human health as well
as the preservation of natural resources (United Nations Environment Programme,
1999).
Solid wastes have both a direct and an indirect impact on our environment and
welfare. Direct effects include the impact on animal and plant life and the effects on
human health and the environment. Indirect impacts are mostly long-term such as
climate change and ecosystem contamination that may have a profound impact on
some regions in the world, because people in these areas depend on some of the
natural systems for survival (Woodwell GM, 1970).
Unacceptable waste disposal leads to unsanitary environmental conditions that are
detrimental to human health. In situations where sanitary facilities, such as toilets, do
not exist or are inadequate, the health situation becomes exacerbated, when human
faeces are mixed with discarded waste. (Kjellen, 2001). Thus better management of

municipal solid waste can significantly curb green house gas emissions (EEA report,
2011).
1.3 Problem Statement.
The increasing urban growth and waste generation in most of the cities in developing
world have overwhelmed the capacity of the municipalities to provide adequate and
efficient waste management services resulting in gross urban environmental decay
(Medina, 2010).
The failure in municipal service delivery by national and local governments in many
cities of developing countries, Nkasi district inclusive has often been attributed to
inequitable resource allocation, low revenue collection, low service coverage,
mismanagement, low institutional capacities, corruption and lack of transparency and
accountability (Scheinberg) 2001.
However the environmental national policy objectives addresses provision of
community needs for environmental infrastructure, such as safe and efficient water
supplies, sewage treatment and waste disposal services; and promotion of other
health related programmes such as food hygiene, separation of toxic/hazardous
wastes and pollution control at the household level.( National Environmental
Policy )1997.
Despite the environmental national policy objectives state cleary, but still yet solid
waste management and waste disposal services are poorly delivered in township and
cities. This study attempts to investigate the potential use of ecological on solid
waste management at Namanyere township.
1.4 Main objective
The purpose of this study was to investigate the potential use of ecological Solid
Waste Management in Namanyere Township
1.5 Specific Objective
Specifically this study intended;
a) To assess the existing solid waste management practices in study area,
b) To identify the type of solid waste generated in the study area,
c) To propose the best ecological solid waste management techniques in the
study area.
1.6 Research Questions
The study was guided by the following research questions;
a) What practices is being done in solid waste management in study area?
b) What type of solid waste generated in the study area?
c) What ecological solid waste management techniques are employed in the
study area?
1.7 Significance of the Study
The results from this study will be essential to governmental agencies such as policy
makers and environmental and urban planners for ensure proper land management as
well as improved sanitary condition in the respective Nkasi district council at
Namanyere Town.

1.8 Limitations of the study
Financial constraints and reluctant among respondents in provision of relevant
information I was experienced during of this study to the respondents.
1.9 Conceptual Framework
Independent Variables Dependent Variable
Figure 1.1 Conceptual Frameworks
As shown on the figure 1.1, this study is based on the theory of human ecology. In
support of this theory, Ali (2009) argues that environmental problems result from the
interaction between the human society and ecological systems. The human system
Solid waste management practices
Reduce
Recycle
Reuse
Type of solid waste generated
Organic waste: Toxic waste: Recyclable: Hospital waste
Solid waste management techniques
Sanitary Landfill Incineration Composting Pyrolysis
SOLID WASTE
MANAGEMENT

destroys the ecological system through growing population requiring water, energy,
food and developmental space. All these anthropogenic activities lead to waste
generation for resources that are not properly utilized.
The model holds that mode for which solid waste management is practiced, type of
solid waste generated and solid waste management techniques employed have a
significant impact on effective solid waste management.
1.10 Operational Definitions of Key Terms
The following are the key terms that were used in the study.
1.10.1 Ecology
Is a branch of biology deal with relation and interaction between organism and their
environments including others organisms.
Refers to a human science there are many practical applications of ecology in
conservation biology, wetland management, natural resource management (agro
ecology, agriculture, forestry, agro forestry, and fisheries), and city planning (urban
ecology).
1.10.2 Ecological solid waste management
Municipal solid wastes (MSW) is often described as the waste that is produced from
residential and industrial (non-process wastes), commercial and institutional sources
with the exception of hazardous and universal wastes, construction and demolition
wastes, and liquid wastes (water, wastewater, industrial processes) (Tchobanoglous
& Kreith, 2002). MSW is defined through the Solid Waste-Resource Management

Regulations (1996) which state that MSW “..includes garbage, refuse, sludge,
rubbish, tailings, debris, litter and other discarded materials resulting from
residential, commercial, institutional and industrial activities which are commonly
accepted at a municipal solid waste management facility, but excludes wastes from
industrial activities regulated by an approval issued under the Nova Scotia
Environment Act” (SWRMR, 1996).
Materials which are organic or recyclable are excluded from this definition, and so
MSW in Nova Scotia is significantly different from that in many other jurisdictions.
This definition of MSW works together with a legislated landfill ban which prohibits
certain materials from landfill (Appendix C) to ensure that only certain materials are
entering landfills. Banned materials cannot be disposed of and are processed through
alternative methods (SWRM, 1996); typically recycling, reuse, or composting.
Construction and demolition (C&D) waste consists of materials which are normally
produced as a result of construction, demolition, or renovation projects and can be a
significant source of waste for all organizations in the ICI sector. According to the
Nova Scotia Solid Waste-Resource Management Regulations (1996), C&D
waste/debris “includes, but is not limited to, soil, asphalt, brick, mortar, drywall,
plaster, cellulose, fibreglass fibres, gyproc, lumber, wood, asphalt shingles, and
metals” .

Hazardous wastes are substances which are potentially hazardous to human health
and/or the environment. As such, they typically require special disposal techniques to
eliminate or reduce the hazards they pose (Meakin, 1992). Hazardous wastes are
handled differently across different provinces;
1.10.3 Solid waste
Solid waste according to Miller (1988) is any useless, unwanted, or discarded
material that is not liquid or gas. A great mixture of substances including fine dust,
cinder, metal, glass, paper and cardboard, textiles, vegetable materials and plastic
characterize. Solid waste Refers to all discarded household commercial waste, non-
hazardous institutional and industrial waste, street sweeping, construction debris,
agricultural waste and other non-hazardous and non-toxic solid waste.

CHAPTER TWO
LITERATURE REVIEW
2.1 Introduction
This chapter provides the theoretical literature review of the study.
2.2 Theoretical Literature Review
2.2.1 Solid waste management practices
Waste management practices cannot be uniform across regions and sectors because
individual waste management methods cannot deal with all potential waste materials
in a sustainable manner (Staniškis, 2005). Conditions vary; therefore, procedures
must also vary accordingly to ensure that these conditions can be successfully met.
Waste management systems must remain flexible in light of changing economic,
environmental and social conditions (McDougall et al., 2001; Scharfe, 2010).
In most cases, waste management is carried out by a number of processes, many of
which are closely interrelated; therefore it is logical to design holistic waste
management systems, rather than alternative and competing options (Staniškis,
2005). A variety of approaches have been developed to tackle waste issues. A well
designed framework can help managers address waste management issues in a cost-
effective and timely manner. It can spur the improvements of existing plans or aid in
the design of new ones (USEPA, 1995).
Integrated waste management (IWM) has emerged as a holistic approach to
managing waste by combining and applying a range of suitable techniques,
technologies and management programs to achieve specific objectives and goals

(McDougall et al., 2001; Tchobanoglous & Kreith, 2002). The concept of IWM arose
out of recognition that waste management systems are comprised of several
interconnected systems and functions, and has come to be known as “a framework of
reference for designing and implementing new waste management systems and for
analyzing and optimizing existing systems” (UNEP, 1996). Just as there is no
individual waste management method which is suitable for processing all waste in a
sustainable manner, there is no perfect IWM system (McDougall et al., 2001).
Individual IWM systems will vary across regions and organizations, but there are
some key features which characterize IWM:
Employing a holistic approach which assesses the overall
environmental burdens and economic costs of the system, allowing for
strategic planning;
Using a range of collection and treatment methods which focus on
producing less waste and in effectively managing waste which is still
produced;
Handling all materials in the solid waste stream rather than focusing
solely on specific materials or sources of materials (Hazardous materials
should be dealt with within the system, but in a separate stream)
Being environmentally effective through reducing the environmental
burdens such as emissions to air, land and water;

Being economically affordable by driving costs out and adopting a
market-oriented approach by creating customer-supplier relationships
with waste products that have end uses and can generate income;
Social acceptability by incorporating public participation and ensuring
individuals understand their role in the waste management system.
(McDougall et al., 2001)
Using a wide range of waste management options as part of a comprehensive
integrated waste management system allows for improved ability to adjust to
changing environmental, social and economic conditions (McDougall et al., 2001).
The three R’s are commonly used terms in waste management; they stand for
“reduce, reuse, and recycle”. As waste generation rates have risen, processing costs
increased, and available landfill space decreased, the three R`s have become a central
tenet in sustainable waste management efforts (El-Haggar, 2007; Seadon, 2006;
Suttibak & Nitivattananon, 2008; Tudor et al., 2011).
The concept of waste reduction, or waste minimization, involves redesigning
products or changing societal patterns of consumption, use, and waste generation to
prevent the creation of waste and minimize the toxicity of waste that is produced
(USEPA, 1995).
Common examples of waste reduction include using a reusable coffee mug instead of
a disposable one, reducing product packaging, and buying durable products which
can be repaired rather than replaced. Reduction can also be achieved in many cases
through reducing consumption of products, goods, and services (USEPA, 2010).

In many instances, reduction can be achieved through the reuse of products. Efforts
to take action to reduce waste before waste is actually produced can also be termed
pre-cycling (HRM, 2010). It is sometimes possible to use a product more than once
in its same form for the same purpose; this is known as reuse (USEPA, 1995).
Examples include using single-sided paper for notes, reusing disposable shopping
bags, or using boxes as storage containers (UC Davis, 2008). Reusing products
displaces the need to buy other products thus preventing the generation of waste.
Minimizing waste through reduction and reuse offers several advantages including:
saving the use of natural resources to form new products and the wastes produced in
the manufacturing processes; reducing waste generated from product disposal; and
reducing costs associated with waste disposal (USEPA, 2010).
Not all waste products can be displaced and even reusable products will eventually
need to be replaced. It is inevitable that waste will be created as a by-product of daily
human living (Kim, 2002), but in many cases it is possible for this waste to be
diverted and recycled into valuable new materials. Glass, plastic and paper products
are commonly collected and reformed into new materials and products.
Recycling products offer many of the benefits of waste reduction efforts (displacing
new material usage, reducing waste generated and the costs associated with disposal)
but recycling requires energy and the input of some new materials, thus placing it
lower on the waste hierarchy than reduction and reuse (UC Davis, 2008; USEPA,
2010).

Many waste management frameworks seek to incorporate the three R’s in some
capacity. In the UK, North America, throughout Europe and in parts of Asia, waste
hierarchies are being incorporated which promote the adoption and use of “reduce,
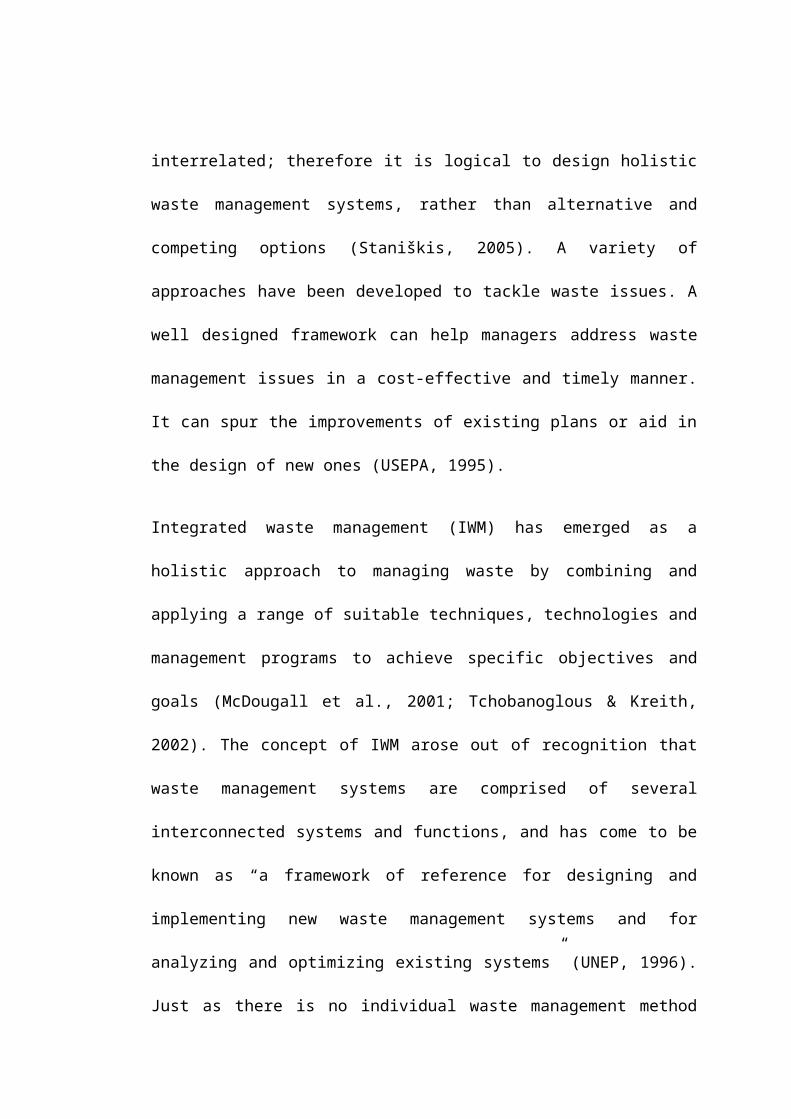
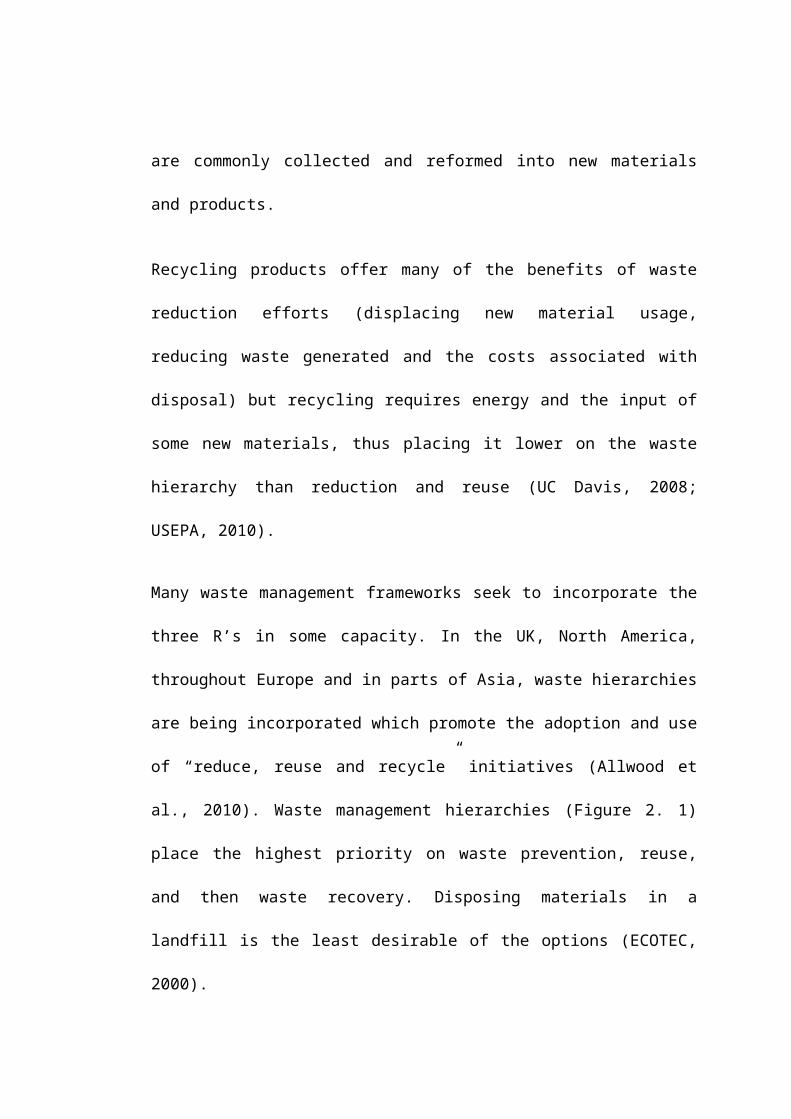
reuse and recycle” initiatives (Allwood et al., 2010). Waste management hierarchies
(Figure 2. 1) place the highest priority on waste prevention, reuse, and then waste
recovery. Disposing materials in a landfill is the least desirable of the options
(ECOTEC, 2000).
The waste management hierarchy is a generally accepted guiding principle for
prioritizing waste management practices to achieve minimum adverse environmental
and health impacts from wastes. The waste management hierarchy in Figure 2.1
shows the preferred order of waste management practice, from most to least
preferred.
Source reduction, reuse, and recycling are the best options for environment while
land filling is the least favored practice (Figure 2. 1).
The figure 2.1 shows preferred order of waste management practice.

Source reduction is the most preferred option since it avoids the generation of waste.
Reduction reduces or minimizes the quantity of waste before it reaches the waste
Stream. Source reduction could be achieved by improvements in product design,
Manufacture, Environmentally Preferable Purchasing (EPP), and use of materials or
Products (including package materials) to reduce the amount or toxicity of a product
or packaging.
Reuse is the second preferred option. It means that the discarded waste can be reused
in its original form or new products. For example, furniture, bikes, cloths, shoes,
books, etc. can be reused as second-hand products in manners of repairing, donating
or selling them.
Recycling follows source reduction and reuse in the waste management hierarchy.
Recycling (including composting) means that resources contained in the waste can be
recovered, and processed to other forms of products. Recycling can use recyclable
materials to produce new products, and mostly result in less energy or fewer
resources and provides economic benefits with less environmental impacts.
Resource recovery is the fourth preferred option. It refers to composting and
anaerobic/biogas digestion. Resource recovery is prior to incineration and land filling
since this method can achieve energy recovery from waste residues through certain
facilities that produce energy.
Incineration is last second option prior to landfilling. Incineration involves the
combustion of waste materials and converts the waste into ash, flue gas and heat. It is
important to remove hazardous, bulky or recyclable materials before combustion
since the ash mostly contains the inorganic substances of waste. The flue gases must

be cleaned of gaseous and particulate pollutants before they are dispersed into
atmosphere.
Land filling is the least preferred option for waste management. Historically, land
filling is the oldest and most common method of waste management which still
remains in many countries around the world. Land filling could cause a number of
adverse environmental and social impacts, such as air, water and soil pollution,
production of methane by decomposing organic waste and disease dissemination, etc.
The first step in waste management is to try and prevent the generation of waste by
reducing at source the waste produced. This is the prevention principal “avoidance of
waste” ( Adedipe et. al, 2005,).
And one of the best ways to reduce the amount of solid waste that must be disposed
of is to limit the consumption of raw materials (Sabir Syed, 2006). Reducing
packaging can reduce total waste produced and total resources used (benjamin,
2003). Reducing waste can also be through reducing the use of plastic bags, reducing
the use of plastic and paper plates, cups and plastic utensils, and consume more
reusable items.
Where reducing is not possible, the waste generated should be reused. Reuse is
preferable to recycling since the item doesn‟t need to be reprocessed. In addition to
environmental consideration, sensitive reuse schemes can have important social and
cultural benefits (UNEP, 2003).
In some developed countries such as Japan, Sweden, Belgium and Denmark, the
index of reuse of solid waste is over 90% (Lino and Ismail, 2012). Moreover, reusing
plays an acceptable role in developing countries. In China for example, in order to

avoid using plastic bags, the Chinese government has created a policy since 2008, to
pay for the plastic bags, and encourage using reusable bags. So, all supermarkets in
China sell the plastic bags which pushed people to reduce using it, and provide
reusable bags to use instead the plastic bags. Another example in developing
countries, refillable glass bottles are still widely used, and families routinely take the
empty bottles to grocery stores when they purchase beverages. If someone doesn‟t
bring an empty bottle when purchasing a beverage in a refillable bottle, must pay a
deposit equivalent to the cost of the bottle. This encourages the return of reusable
bottles, which is in parallel encouraging the reuse principle.
The reuse centers can also be used as means of creating employment for people with
problems in entering the job markets or suffering from long term unemployment. In
Japan and other industrial countries, “industry clusters” have been planned, where
the waste of one industry is the resource of another ( Adedipe et al, 2005).
Recycling is taking a product or material at the end of its useful life and turning it
into a usable raw material to make another product. It can be promoted by
encouraging separation at the source which can be achieved through financial
incentives, stimulation, legislation and rising of environmental awareness
(Athumuod 2005).
The recyclables have to be collected from many sources, including households,
business, and construction sites. Then these collected recyclables transported to a
materials recovery facility, where they are sorted and processed before being sent to
manufacturers.

According to European Environment Agency “EEA” report,( 2013), many European
countries increased the share of municipal waste recycling, and the highest rates are
in Austria, with 63 %, followed by Germany (62 %), Belgium (58 %), the
Netherlands (51 %) and Switzerland (51 %).
In order to insure the recycling of waste, China has established a number of recycling
and disposal waste cooperatives (Miao et al, 2012). Moreover, resource recycling of
domestic waste is a major strategy emerging in China, and it is an even more crucial
energy saving and environment friendly strategic emerging industry which will
continue to grow in the future. And there will be a vast market for second hand
materials in China. However, recycling is a manufacturing process, and therefore it
too has environmental impact but these impacts are less than landfill and
incineration, as well as they are less than producing new products with virgin
materials (Benjamin, 2003).
2.4 The type of solid wastes generated
According to Tchobanoglous et al (1993) the common methods of solid waste
disposal used in the early practices in solid waste management included, dumping on
land, canyons and mining pits, dumping in water, ploughing waste into the soil, and
feeding to hogs.
Momoh and Oladebeye (2010) opine that burning of waste is also common in towns
in Africa including dumping of waste in gutters, drains, dumping of waste by the
roadside, and on unauthorized dumping sites. Most of these cities turn to these
methods which they think is cheap and easy to get rid of solid waste. But Regassa et

al (2011) reported that this solid waste disposal need to be improved through use of
burnable materials to produce either electricity or heating water for hospitals and
schools.
UNEP, (2009) views composting as the biological decomposition of biodegradable
solid waste under controlled aerobic conditions to a state that is sufficiently stable for
handling and nuisance free storage of waste for agricultural and other uses. Puopiel,
(2010) describes composting at best as an option suited to contexts of limited
resources in developing countries and it’s highly adaptable.
It also facilitates and encourages separation at source of solid waste generation.
Thus, Zerbock (2003), observed that composting is a low-technology approach of
solid waste reduction and suited for developing countries since over 50% of solid
waste in developing countries is organic material.
In studies conducted by Tanskanen (2000), Wilson (2007) all revealed that ISWM
can effectively protect human health and the environment through proper
management of solid wastes.
Saharan Africa solid waste generation exceeds collection capacity (Jibril, Ibrahim,
2012) as shown in Tanzania, Zimbabwe, Zambia and Kenya. There is a sharp rise in
the amount of garbage generated by urban residents.
Daily life in industrialized nations can generate several pounds of solid waste per
consumer, not only directly in the home, but indirectly in factories that manufacture
goods purchased by consumers.

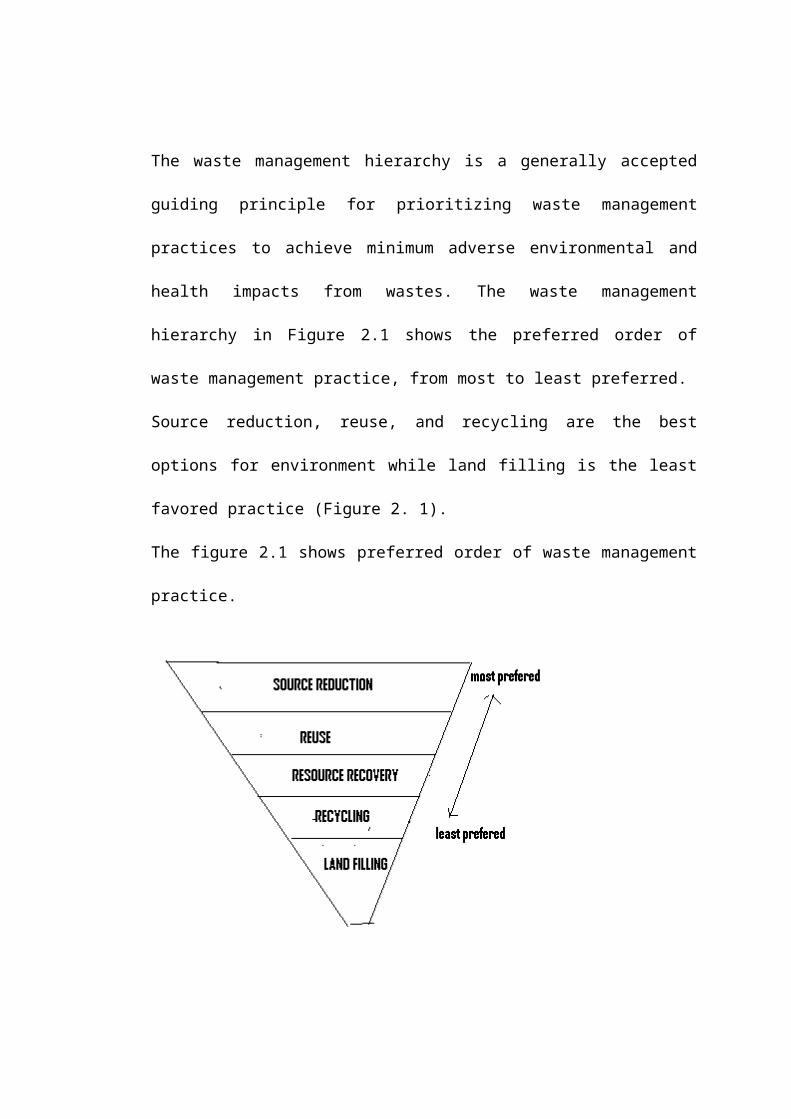
Garbage: many broad categories of garbage are:
i. Organic waste: kitchen waste, vegetables, flowers, leaves, fruits.
ii. Toxic waste: old medicines, paints, chemicals, bulbs, spray cans,
fertilizer and pesticide containers, batteries, shoe polish.
iii. Recyclable: paper, glass, metals, plastics.
iv. Hospital waste such as cloth with blood
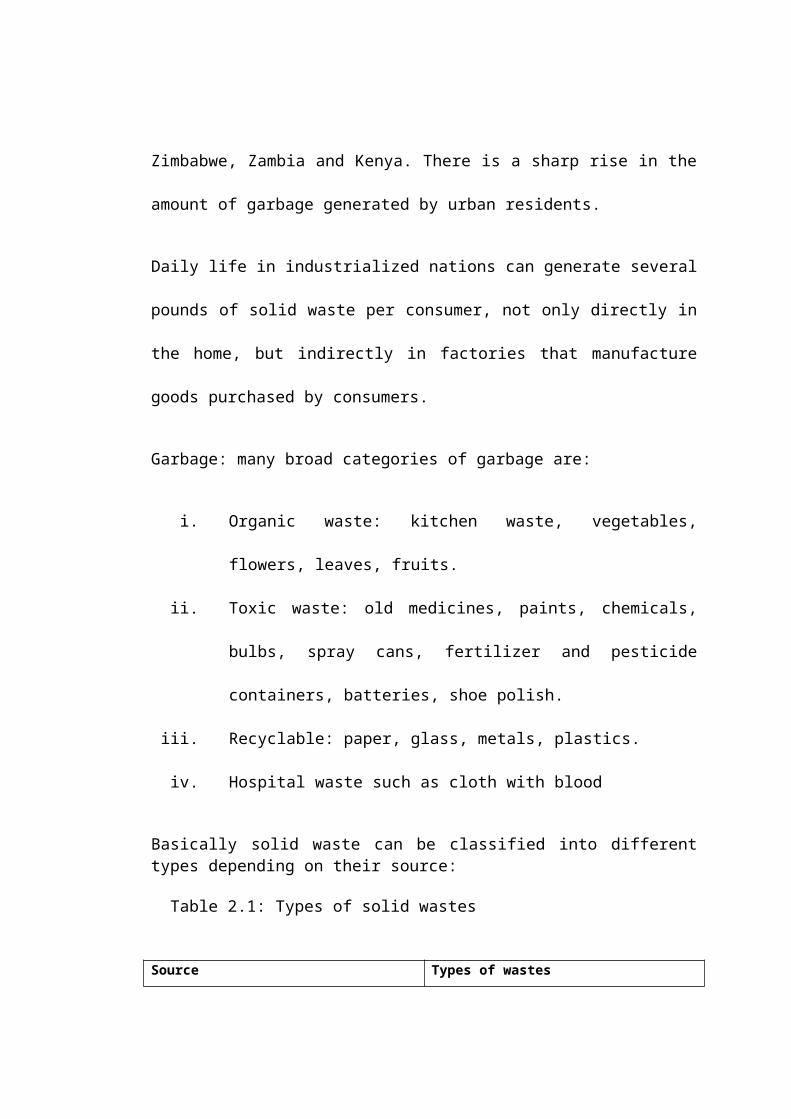
Basically solid waste can be classified into different types depending on their source:
Table 2.1: Types of solid wastes
Source Types of wastes
Residential Food wastes, paper,
cardboard, plastics, textiles,
yard wastes, wood, ashes,
street leaves, special wastes
(including bulky items,
consumer electronics, white
goods, universal waste) and
household hazardous waste.
Commercial Paper, cardboard, plastics,
wood, food wastes, glass,
metal wastes, ashes, special
wastes, hazardous wastes
Institutional Same as commercial, plus
biomedical
Industrial (non-process
wastes)
Same as commercial
Municipal Solid waste All of the preceding

Construction and Demolition Wood, steel, concrete,
asphalt paving, asphalt
roofing, gypsum board, rocks
and soils.
Industrial Same as commercial, plus
industrial process wastes,
scrap materials
Agricultural Spoiled food, agricultural
waste, hazardous waste
2.5 Ecological solid waste management techniques
Following the rapid expansion of wealth and products, many countries in the world
have responded to the importance of MSWM since the late 1970s. They have built
integrated management systems to handle the waste. An integrated waste
management system (IWMS) is viewed as the key for sustainable waste
management. The notion of IWMS is introduced by UNEP based on 3R (reduction,
reuse, recycling). More sustainable practice and alternative options of MSWM are
proposed to place conventional waste management approaches in order to achieve
sustainable development from long term perspective. The most common techniques
and processes are presented in the following.
2.5.1 Source reduction
Source reduction is also known as “waste minimization4” in some countries.
Changing manufacturing process to reduce the generation of hazardous wastes and
materials is referred to source reduction. Optimizing the use of raw materials, reusing
scrap material, improving quality control and process monitoring may also minimise
the amount of waste produced. In industrial sectors, the fewer the materials are used,
the less waste is produced; the less electricity is used, the less cost is used. In the
manufacturing process, resource reduction can most easily be done at the design
stage. For example, changing the design of product or package can make it easier to
recycle at the end of its lifespan. In some cases, improving product durability can
reduce waste and optimize the use of resources. Many developed countries have
designed environmental and ecological products in response to source reduction,
whereas in less developed countries, it has not been implemented. For the
households, buying fewer products and buying eco-labelled products that minimise
the use of packaging is a method to reduce the waste they create. Using electricity
thoughtfully by purchasing energy-saving products, turning off lights and equipment
when it is not needed can also achieve resource optimization.
2.5.2 Reuse
From a domestic perspective, lifestyle is a key factor for the possibility and potential
of reuse. For instance, people may always purchase new products to follow fashion
trends when their old products are still usable. Mending broken or worn items of
clothing or equipment is a good method to reduce unnecessary waste and to save
money. In many developed countries such as UK, US, Germany, France, Sweden,
second-hand shopping is very popular where people can buy used products at a low
price. This has largely reduced the purchasing of new products and extended the life
cycle of old usable products. However, there is few or no second-hand shop in
developing countries. For example, there are no formal second-hand shops in China
as the price of new product is not very high consequently, the demand and market for

second-hand products is low. Also, the lifespan, quality and durability of products
are quite low; therefore people prefer to buy new products instead of used products.
Because of this, the reuse rate of products is limited.
2.5.3 Recycling
Recycling differs from reuse in that recycling can make use of old products to
manufacture not only the same products but also new products from recovered
materials and other sources. To this extent, it is considered as the reuse of used
products to produce different forms of products. For example, used office paper can
be converted into new office paper or other forms of paper for different purposes
(e.g. cardboard). Recycling can also handle the items that are broken, worn out, or
unsuitable for reuse. Another form of recycling is the salvage of certain materials
(e.g. mercury) or complex products (e.g. batteries, electronic and electrical products)
because of their intrinsic value and hazardous nature. When throwing away a pack or
can, it is essential to remove any remaining substances, especially hazardous content
before the container can be recycled. In the UK, a life cycle analysis proposes that
where recycling schemes and systems are available, people can be proactive to
involve in recycling. To facilitate recycling, certain infrastructures such as collection,
drop-off sites, pay-back system and source sorting should be improved
2.5.4 Composting and anaerobic digestion
The rising concerns on landfill space limitations, there is a growing tendency to
recycle materials by means of composting, since composting systems can convert
biodegradable waste such as paper, food, garden waste and agricultural residues into

useful stable waste (Friends of the Earth, 2008; UNEP, 2010). Simple composting
facilities become effective and low-tech solutions for developing countries to handle
organic waste and produce high quality compost products that are beneficial to
agriculture.
Composted organic materials can be natural fertilizer to replace or reduce the need
for chemical fertilizers, improve soil structure, and control land erosion as well as
contribute to land reclamation. Recently, approximately 2,000 composting systems
were built to treat household organic waste in Europe. Home composting, the
practice of turning the garden waste into compost is considered as a method of waste
minimization. Moreover, composting is also applied . For instance, UN Economic
and Social Commission for Asia and the Pacific (ESCAP) endeavour to support the
development of composting facilities in Bangladesh, Pakistan and Viet Name
(UNESCAP, 2009). In India, around 9% of MSW is composted and composting has
largely benefited the agriculture.
Anaerobic digestion (AD) is an alternative to aerobic composting systems since it
can digest waste under anaerobic conditions (with little or no oxygen) to produce
biogas.
The biogas from AD plants can be burnt in a combined heat and power (CHP) plant
to generate heat or electricity or be used as vehicle fuel (Friends of the Earth, 2007).
In addition, the remaining residue “digestate” which is rich in N, P and K can be
used as a soil conditioner to fertilize land (Friends of the Earths, 2007; Scurlock,
2009). Concerning the climate impacts, composting and AD systems can reduce

green house emissions from manure and agricultural residue. Also, the generated
energy avoids the emission from energy generation can offset the emissions from
fossil fuel, and thus provide higher net carbon savings than composting (Friends of
the Earths, 2007). Furthermore, composting and AD products replace costly
manufactured fertilizer with digestate containing nitrogen and other nutrients. To
achieve sustainable composting and anaerobic digestion, it is essential to enhance
local community education and public awareness to ensure proper source separation
and material recycling.
2.5.5 Mechanical biological treatment (MBT)
MBT refers to an integration of waste management technologies such as material
recovery facilities and biological waste plants. MBTs can combine both mechanical
sorting (waste preparation and waste separation) and biological treatment processes
(aerobic bio-drying, aerobic in-vessel composting and anaerobic digestion). The
MBT plant was first built to reduce the environmental impacts of the landfilling
residual waste. It enables to separate and recover recyclable materials and reduce the
organic content in the residues (Juniper, 2005; Enviros, 2006; UNEP, 2010).
Bogner et al. (2007) proposed that the MBT process could reduce 90% of methane
that is generated by wastes from landfilling. MBT composted output can be used as
Refuse Derived Fuel (RDF) for incineration with energy recovery or co-combustion.
MBT technology for MSW stream is mostly found in Europe as the EU Landfill
Directive raises the landfilling cost and establishes regulatory incentives to support
the application of MBT (UNE.

The MBT plants in Europe are small scale and treating less than 20,000 tones of
MSW every year. UK is increasingly embracing the MBT technology in line with the
Landfill Directive and national recycling targets. Australia also vigorously embraces
MBT due to the rising landfill cost. The MBT technology is still relatively
uncommon in the rest of the world since the equipment for MBT plants are
sophisticated and expensive, thus it is not affordable and feasible solution for
developing countries or where landfilling is cheap
2.5.6 Incineration
Incineration is a criticized method for waste management and many experts argue
and dispute the sustainability of waste incineration. On the bright side, land filling
requires a large space while incineration has smaller spatial demands for lands . On a
global scale, incineration has relatively smaller climate impacts compared to land
filling, contributing 40 Mt CO2. EU considers energy generated from biogenic waste
by incinerators as non-fossil renewable energy as only the fossil CO2 is counted as
Green house emissions.
Landfills release large amounts of methane, whereas incineration avoids methane
emissions. Approximately 130 million tons of MSW are incinerated in 35 countries
In Europe, with its legislation against land filling; incinerators have been built to
replace land filling in the last decades. Sweden, France, the Netherlands and
Switzerland have very high rates of incineration (Bogner et al., 2007). The UK
government restricts landfilling9 to reduce the GHG emissions produced by landfills.
Therefore incineration as an alternative method plays a more important role in MSW
treatment and supply of energy (Youde, 2010).
On the negative side, the capital costs of building incineration systems are
substantially high for developing countries. More than half of the money spent on
incineration relates to air pollution control . Jones10 (2009) highlighted that building,
operating and maintaining incinerators require a long time to recover the initial
investment cost. To some countries, landfill is still the cheapest and easiest MSW
treatment technology. Regarding the potential of energy production from
incineration, researchers have different voices.
Argues that incineration recovers only 10% of the energy used to make the
products. States that many studies have estimated recyclable materials save three-
four times more energy than incineration. A combination of composting and
recycling can reduce 46 times more GHG gases than burning fossil fuels generated
electricity. “Zero Waste” supporters consider incineration and other waste treatment
technologies as barriers to recycling, and the waste resource is sacrificed by energy
recovery.
Although energy extracted from waste incineration has the potential to provide the
future energy with a large secure supply, waste incineration with energy recovery is
not widely accepted in Europe due to environmental concerns (Ipsen, 2005). Waste
incineration contributes to air pollution to a large extent as it releases bottom ash and
very toxic fly ash, heavy metals and dioxins emissions
State that incineration produce toxic ash and large volumes of smoke which contain
acid vapour and dioxins. Incineration is rejected by some OECD countries due to
local communities’ opposition for the concerns over the particle effects on health. To
reduce the adverse impacts of incineration, the high toxic ash must be safely
disposed of and fly ash trapped. According to Canada Federal Ministry for
Environment (2005), new governmental policies and laws have resulted in large
reduction in the amount of dioxins and furan emissions.
2.5.7 Mechanical heat treatment (MHT)
Mechanical heat treatment is a new technology for MSW processing. MHT
Processes are steam based technologies that use thermal treatment along with
mechanical processes. The latter involves mechanical sorting or pre-treatment
process that can be accomplished by a material recovery facility. MHT can separate
organic rich content of waste through biological processing, produce RDF to ensure
energy security, and extract materials13 for recycling and recovery (Defar, 2007).
The most common method for MHT is termed “autoclaving”, where waste is heated
by steam pressure, whereas the other method of MHT is a non-pressurized heat
treatment process, where waste is dried by externally applied heat. Autoclaving is
typically used to treat clinical (hospital) waste, since the processes also sanitize the
waste by killing microorganisms and reduce its moisture content. MHT can also be
used in conjunction with Mechanical Biological Treatment (MBT). However MHT
does not comprise biological degradation processes such as anaerobic digestion or
composting. So far, there is only a small track record on MHT application to MSW,

therefore more research and practical experiences should be reported on this method
(Defar, 2007).
2.5.8 Land filling
Landfilling is a significant and historically dominant waste management method.
Since traditional landfill fails the first three steps of the hierarchy a new focus is
given toon sustainable landfills . Several studies have been carried out and Allen
defines sustainable landfills as “The safe disposal of waste within a landfill, and its
subsequent degradation to the inert state in the shortest possible time span, by the
most financially efficient method available, and with minimal damage to the
environment”. The aim of sustainable landfill is to mitigate the environmental
impacts by reducing pollution, preventing leachate and closing poorly run and small
landfills . Energy gasification of methane from landfills can reduce the
environmental effects of GHG emissions by 95% .
Landfill bioreactor refers to adding moisture to wastes which increases natural
degradation impacts of organic wastes in the landfill, treating waste in a lifetime and
containing the products of degradation in a way (Kurian et al., 2004; Hudgins et al.,
2011).
Anaerobic landfill reactors have been built in Japan, and an aeration system has been
used in Austria since 1991 . From a life-cycle perspective, landfill bioreactors could
be the basis for a cost-effective sustainable solution to MSWM (Hudgins et al.,
2011). In the past, open dumps were used and they are still common practices in
many developing countries. Dry tomb landfill was introduced to eliminate the
leachate problems of open dumps. However, dry tomb landfilling is also criticized to
be unsustainable due to space demands every few years.

Furthermore, it needs monitoring of expanding potential environmental impacts in a
long term. The landfill gas contains methane (CH4) and carbon dioxide (CO2) both
of which are GHG gases. Landfill bioreactors can optimize methane recovery and
stabilize the organic materials quickly. About 20% of global anthropogenic methane
emissions are from landfills but landfill biogas could become a renewable energy
source which is eco-friendly and efficient. Landfill biogas could be an alternative
cheap fuel for heating purpose and could provide CO2 supplement for plant growth .
France has projected to use landfill gas forheating greenhouses and make nutrient
solutions to feed plant for few years.
The Clean Development Mechanism (CDM) project, under Kyoto Protocol also
provides opportunity for developing countries to implement landfill gas capture
scheme for a few years. It is estimated that 75% of “the produced methane” escape
across the cover soil (Hettiaratchi, 2003). In the aerobic landfill system, methane can
be collected and purified for sale or use in short time. Landfill bioreactors can not
only reduce the landfill emitted methane, but also produce more landfill gas within a
short time which can be harvested (Kurian et al., 2004).
Another advantage of landfill bioreactor is that waste stabilizes much faster than dry
tomb landfill system. For example, waste may not stabilize for thirty years in dry
tomb landfills, while less than ten years is needed in an anaerobic bioreactor. Once
the wastes are stabilized, aerobic landfills will be in state to allow waste mining.
Land mining can extract the recyclables, reuse the landfill space and extend the life
time of landfills (Kurian et al., 2004).

CHAPTER THREE
RESEARCH METHODOLOGY
3.0 Introduction
This chapter presents the research methodology that was used in this study. It further
provides the study location, research design, population of the study, sample size,
sampling techniques, data collection instruments and data analysis.
This study was conducted at Namanyere town council. The Namanyere town is
located and situated on the south west of Tanzania between lake Tanganyika and lake
Rukwa and lie between longitude 30 20’East and latitude 60 58” to 8017”.
Namanyere Town it is in within Nkasi District council, bordering by following ward
at southern part Isale ward and Lwafi game reserve, Northern part Paramawe and
Mashete ward, East Chala ward and Western part Mfili forest and Lwafi game
reserve.
According to the National population census conducted in 2002 and 2012 The
Namanyere Town council has a population increase from 31,380 people in 2002 up
to 38,362 people in 2012 and also the house hold increased from 6,225 in 2002 up
to7,455 in 2012 (Population census 2012).
3.2 Research Design
This study employed a descriptive research design. According to Jacobs, (2011),
descriptive research design involves a process of collecting data in order to answer
questions concerning the current status of the subject in the study. Descriptive

research design assisted the researcher to determine and report the way things are by
describing the possible responses from the surveyed respondents of the study.
3.3 Population of the study
The target population is that population to which the researcher wants to generalize
the results of the study. The target population of this study was consisted of
employees and community members of the surveyed district council.
3.4 Sample size
Rwegoshora (2006) defines sample size as a part of population which is studied in
order to make inferences about the whole population. The researcher selected 50
respondents drawn from different departments of the surveyed district council as
shown in Table 3.1.
Table: 3.1: Show Sample size
Category of respondents Number of Respondents %
Staff employees 50 50
Community members 50 50
Total 100 100
Source: Researcher (2015).

3.5 Sampling techniques
According to Kothari (2004) sampling procedure is the way of obtaining sample
from the population. The selection of the sample was based on random sampling
techniques. Staff employees were randomly selected from each of the departments.
This was used to select 50 respondents from different department of the surveyed
district council and 50 members from the community. According to Kahn (1986) this
method involves giving a chance to every respondent or member of the accessible
population, by placing the numbers in a container and then picking any number at
random.
3.6 Data collection Instruments
The data collection instrument that was used to collect data was questionnaire.
According to Kothari (2004), a questionnaire consists of a number of printed
questions for the respondents to answer on their own. Kahn (1986) recommends that
each item in the questionnaire should be developed to a specific objective of the
study. According to Nachmias (2006), questionnaires have got a number merits and
demerits. The merits include: The cost of using questionnaires being low compared
to other methods yet it can cover wider geographically dispersed samples at low cost.
Biasing error is minimized because respondents are not influenced by the researcher.
Questionnaires provide a high degree of anonymity for respondents. This is
especially more relevant when sensitive issues are involved. Being more convenient
to respondents since it gives them ample time to analyze the questions and then
answer them at their convenience.

3.7 Data analysis
Data was analyzed by using SPSS (Statistic Package for Social Sciences) computer
soft ware in which descriptive statistics was employed.

CHAPTER FOUR
ANALYSIS AND DISCUSSION OF FINDINGS
4.0 Introduction
This section presents the demographic characteristics of respondents. It further
presents the results of the study basing on the specific objectives which were; to
assess the existing solid waste management practices in study area, to identify the
type of solid waste generated in the study area, and to develop the ecological solid
waste management techniques in the study area.
4.1 Demographic characteristics of respondents
Demographic characteristics under this study included; Sex of respondents,
education level and work experience.
4.1.1 Sex of respondents
Table 4.1 shows the sex of surveyed respondents who were involved in this study.
The researcher’s intention was to get information regarding this study from both
sexes. The result showed that (75, 75%) of all respondents were males and (25, 25%)
of all respondents were females.
Table 4.1: Show Sex of respondents
Sex Frequency n Percent
Male 75 75.0Female 25 25.0Total 100 100.0
Source: Field survey 2015

4.1.2 Education level of respondents
Table 4.2 shows the education level of respondents who were involved in this study.
Education level was put into consideration by the researcher as it determines peoples
understanding of issues hand regarding the study topic.
The result showed that about (33, 33%) of all respondents attained a primary
education while (34, 34%) of all respondents attained a secondary education level,
(10,10%) of all respondents attained a diploma, (20,20%) of all respondents attained
a bachelor degree level and (03,03%) of all respondents attained a master degree
level. This implies that majority of respondents have low education level.
Table 4.2: Show Education level of respondents
Education level Frequency n=100 Percent
Primary education
Secondary education
33
34
33.0
34.0
Diploma 10 10.0
Bachelor Degree 20 20.0
Master degree 03 03.0
Total 100 100.0
Source: Field survey 2015
4. 1.3 Working experience
Figure 4.3 shows the work experience of respondents who was involved in this study.
Work experience was used to determine the experience of staff employees in their
respect field of work.
The result showed that about (02,04%) of all surveyed respondents have been
working for Less than 10 years, while (20,40%) of all surveyed respondents have
been working for more than 10-15 years and the remaining (28,56%) of all surveyed
respondents have been working for 15 years and above. This implies that majority of
surveyed staff employees have long working period in their respective field.
Table 4.3: Show Work period of respondents
Work period Frequency n Percent
Less than 10 years 04 04.0
10-15 years 40 40.015 years and above 56 56.0
Total 100 100.0
Source: Field survey 2015
4.2 Analysis and Discussion of Findings
4.2.1 Solid waste management practices
The first objective of the study was to assess the existing solid waste management
practices in study area. Questionnaires were administered by the researcher to 50
respondents who were the Staff employees.
4.2.1.1 Local authority control waste collection schedules
Table 4.4 shows the responses by surveyed staff employees on the Local authority
control waste collection schedules.
They were requested to state if the local authority has schedule collection for the
control of solid waste.

In their reply it was revealed that about 46 respondents out of 50 equivalents to 92%
of all surveyed Staff employees positively responded that, the local authority has a
solid waste collection control schedule. While (04, 08%) of all surveyed Staff
employees they responded negatively. This implies that the local authority has a solid
waste collection control schedule.
Table 4.4: Shown Local authority control waste collection schedules
Responses Frequency n Percent
Yes 92 92.0
No 08 08.0
Total 100 100.0Source: Field survey 2015
4.2.1.4 Practices are mostly used in solid waste management
Table 4.5 Show descriptive statistics for variable EWM
Table 4.5: Descriptive Statistics
Variables Mean Std. Deviation N
EWM .2299 1.87547 100
Recycle 7.4883 1.14236 100
Reuse 3.5648 29.89715 100
Reduce 6.5539 53.65346 100
Source: Authors’ SPSS output.
Table 4.5 above shows descriptive statistics for the variables. EWM (Ecological
Waste Management), Recycle, Reuse and Reduce have a positive mean value which

ranges from 0.2299 to 7.4883 in size. Reduce and Reuse have the highest standard
deviation of 29.89 and 53.65 respectively.
A multivariate regression model was applied to determine the relationship between
practices employed in solid wastes and ecological solid waste management. Multiple
linear regressions used in this model were (see table 4.6)
Table 4.6 Show the Regression Coefficients
Model
Un standardized
Coefficients
Standardized
coefficients t sig
B Std Error Beta
Constant
Recycle
Reuse
Reduce
.245
.140
.202
.217
.051
.038
.041
.024
.022
.004
.001
.054
5.420
4.134
4.232
4.084
.000
.005
.003
.000
a. Predictors: (Constant), Recycle, Reuse, Reduce
b. Dependent Variable: ecological solid waste management
The regression results presented in Table 4.6, reveal that reduce and recycle practices
have strong positive relationships with ecological wastes management. Given that the
t-Statistics of 4.084 and 4.134, this confirmation is strengthened with the perfect
significance at p-value 0.00 and 0.005. Our result is in line with the findings of
(Sabir Syed,2006) who argue that Reducing waste can be accomplished through
reducing the use of plastic bags, reducing the use of plastic and paper plates, cups
and plastic utensils, and consume more reusable items.

The finding however is also sought with (Miao et al, 2012) who assert that the
recyclables have to be collected from many sources, including households, business,
and construction sites and then transported to a materials recovery facility, where
they are sorted and processed before being sent to manufacturers.
4.2.1.2 Method/s for solid waste collection
Figure 4.1 shows the responses by surveyed staff employees on method/s for solid
waste collection. They were requested to state method/s used for solid waste
collection.
In their reply it was revealed that about 48 respondents out of 100equivalents to 48%
of all surveyed Staff employees responded that, collection point is the main method/s
used for solid waste collection. While (16, 32%) of all surveyed Staff employees
responded that old buckets and plastic bags are the common methods that are used
for collection of solid wastes and the remaining (10,20%) of all surveyed Staff
employees responded that collective waste containers are used to collect solid
wastes. This implies that collection point is the main method/s used for solid waste
collection employed by the local authority in the study area.

Figure 4.1: Show Method/s for solid waste collection
Collective waste con-tainers ; 10;
20%
Collection points ; 24; 48%
Old buckets and plastic
bags; 16; 32%
Chart Title
Source: Field survey 2015
4.2.1.3 The status of solid waste management
Figure 4.2 shows the responses by surveyed staff employees on the status of solid
waste management. They were requested to state the status of solid waste
management.
In their reply it was revealed that about 30 respondents out of 50 equivalents to 60%
of all surveyed Staff employees responded that, the status of solid waste management
is low, while [12, 24%) of all surveyed Staff employees responded that the status of
solid waste management is moderate and the remaining [08, 16%) of all surveyed
Staff employees responded that the status of solid waste management is high. This
implies that the status of solid waste management in the study area is low.

Figure 4.2: Show The status of solid waste management
Low Moderate High 0
5
10
15
20
25
30
30
12
8
Chart Title
Source: Field survey 2015
4.2.2 The type of solid wastes generated
The second objective was to identify the type of solid waste generated in the study
area.
4.2.2.1 The main source of solid waste generation in the study area.
Table 4.7 shows the responses by surveyed community members on the source of
solid waste generation in the study area. They requested to state the source of solid
waste generation in the study area.
In their reply it was revealed that about 25 respondents out of 50 equivalents to 50%
of all surveyed community members responded that, the main source of solid waste
generation is from Commercial/business area While (23,46%) of all surveyed
community members they responded that the main source of solid waste generation

is from residential areas. This implies that the main source of solid waste generation
is from Commercial/business and residential areas.
Table 4.7: The main source of solid waste generation in the study area
Responses Frequency n Percent
Commercial/business area 50 50.0
Institutions 04 04.0
Residential area 46 46.0
Total 100 100.0
Source: Field survey 2015
According to the Table 4.7, the main source of solid waste in the study area is from
commercial areas such as industries and market places. This finding (Scheinberg,
2001) who assert that today, there are many large industries that operate primarily or
exclusively using waste materials like paper and metals as their industrial feed stocks
4.2.2.2 Type of solid waste materials are generated in the study area
Table 4.8: show descriptive statistics for the variable EWM.
Variables Mean Std. Deviation N
EWM 0.05 0.016 100
Organic waste 11.97 0.36 100
Toxic waste 0.134 0.15 100
Recyclable 0.56 0.12 100
Hospital waste 5.14 0.404 100
Source: Authors’ SPSS output.
Table 4.8 above shows descriptive statistics for the variables. EWM (Ecological
Waste Management) Organic waste, Toxic waste, Recyclable waste and hospital
waste have a positive mean value which ranges from 0.05 to 11.97 in size. Organic
waste and hospital waste have the highest standard deviation of 11.97 and 5.14
respectively.
A multivariate regression model was applied to determine the relationship between
type of solid waste materials are generated and ecological solid waste management.
According to the presentation in Table 4.9, Organic waste and Hospital waste have a
positive slope of 1.40 and 2.05 which suggests a positive relationship between type
of wastes mostly generated and ecological solid waste management. Model is
statistically significant t-statistic at 3.042 and 3.232, with (p-value= 0.002, and
p=003).
This result is in line with the findings of Regassa et al (2011) who reported that
common solid wastes as kitchen waste, vegetables, flowers, leaves, fruits, old
medicines, paints, chemicals, bulbs, spray cans, fertilizer and pesticide containers,
batteries, shoe polish, paper, glass, metals, and plastics produced from various
sources.
This result also is in line with the findings of Momoh and Oladebeye (2010) who
opine that burning of waste is also common in towns in Africa including dumping of
waste in gutters, drains, dumping of waste by the roadside, and on unauthorized
dumping sites.
Lastly the result is in line with the findings of (Jibril, Ibrahim, Dodo, Sheelah and
Suleiman, 2012;Kaseva, 2005; Henry, 2006) who asserts that Saharan Africa solid
waste generation exceeds collection capacity as shown in Tanzania, Zimbabwe,
Zambia and Kenya. There is a sharp rise in the amount of garbage generated by
urban residents.
Table 4.9: Show the Regression Coefficients
Model
Un standardized
Coefficients
Standardized
coefficients t sig
B Std
Error
Beta
Constant
Organic waste
Toxic waste
Recyclable
Hospital waste
1.2
1.40
2.02
2.17
1.38
2.05
.120
.128
.121
.124
.127
.125
.234
.204
.200
.215
.224
.252
3.544
3.042
3.262
3.484
3.246
3.232
.000
.002
.04
.003
.006
.003
a. Predictors: (Constant), Organic waste, Toxic waste, Recyclable, Hospital
waste
b. Dependent Variable: ecological solid waste management
4.2.3 The ecological solid waste management techniques
The third and the last objective were to develop the ecological solid waste
management techniques.

4.2.3.1 Relationship between technique mostly employed and ecological solid
waste management
Table 4.10: Shows Descriptive Statistics For The Variables.
Variables Mean Std. Deviation N
EWM 0.05 0.023 100
Source reduction 6.97 0.56 100
Reuse 0.34 0.23 100
Recycling 5.56 0.32 100
Incineration 8.54 0.43 100
Land filling 5.56 0.58 100
Composting 5.14 0.40 100
Source: Authors’ SPSS output.
EWM (Ecological Waste Management) Source reduction, Reuse, Recycling ,
Incineration , Land filling and Composting have a positive mean value which ranges
from 0.05 to 8.54 in size. Source reduction and Incineration have the highest mean
of 6.97 and 8.54 respectively.
A multivariate regression model was applied to determine the relationship between
technique mostly employed and ecological solid waste management.
According to the presentation in Table 4.11, Source reduction, Incineration and
Reuse have a positive slope [ .640,.803 and.602] respectively which suggests a
positive relationship between techniques employed and ecological solid waste
management. Model is statistically significant t-statistic at[ 7.034, 12.432] and
11.733, with (p-value= 0.00, p=002 and.003 respectively).

Our result is in line with the findings of (Scott, 2005) who argue that, in the
manufacturing process, resource reduction can most easily be done at the design
stage. For example, changing the design of product or package can make it easier to
recycle at the end of its lifespan. In some cases, improving product durability can
reduce waste and optimize the use of resources.
Our result is also in line with the findings of (Youde, 2010) who asserts that
incineration as an alternative method plays a more important role in MSW treatment
and supply of energy (Youde, 2010).
Table 4.11: Show Regression Coefficients
Model
Un standardized
Coefficients
Standardized
coefficients t sig
B Std Error Beta
Constant
Source reduction
Reuse
Recycling
Composting
Incineration
Land filling
15.595
.640
.602
.817
.858
.803
.854
.585
.048
.051
.064
.057
.053
.074
.234
.904
1.401
1.054
1.514
1.432
1.425
26.641
7.034
11.733
23.484
13.199
12.432
13.543
.000
.000
.003
.004
.005
.002
.08
a. Predictors: (Constant), Source reduction, Reuse, Recycling, Composting, Incineration, Land filling
b. Dependent Variable: ecological solid waste management

4.2.3.2 The types of solid waste material incinerated in the study area
It show that the responses by surveyed staff employees and community members on
the types of solid waste material incinerated in the study area. They were requested
to state the types of solid waste material incinerated in the study area.
In their reply it was revealed that about 56 respondents out of 100 equivalents to 56%
of all surveyed respondents responded that, organic wastes are the type of waste
materials incinerated. While (34,34%) of all surveyed staff employees and
community members responded that toxic wastes were incinerated and (10,10) of all
surveyed staff employees and community members responded that recyclable. This
implies that organic wastes and toxic wastes are usually incinerated.
Figure 4.5: Show The types of solid waste material incinerated in the study area
Organic waste
5656%
Toxic waste
4444%
Recy-
clable 10
10%
Chart Title
Source: Field survey 2015

According to the presentation in the figure 4.5, it was found that organic wastes are
the type of solid wastes that are incinerated in the study area. This finding is
supported by the finding from the study of Momoh and Oladebeye (2010) who opine
that burning of waste is also common in towns in Africa.
4.2.3.3 The frequency of solid waste collection in the study area
Figure 4.7 shows the responses by surveyed staff employees and community
members on the frequency of Solid waste collection in the study area. They were
requested to state the frequency of solid waste collection in the study area.
In their reply it was revealed that about 48 respondents out of 100 equivalents to 48%
of all surveyed staff employees and community members responded that somewhat
solid wastes are collected. While (32, 32%) of all surveyed staff employees and
community members responded that rarely solid wastes are collected. This implies
that somewhat or rarely solid wastes are collected in the study area.
Figure 4.6: Show The frequency of solid waste collection in the study area
Rarely c
ollected
Somew
hat collec
ted
Freq
uently
colle
cted
01020
3248
20
Chart Title
Source: Field survey 2015

According to the presentation in the figure 4.4, it was found that solid wastes are
rarely and somewhat collected in the study area due to a number of factors such as
fund. This finding agrees with the report by the (United Nations Environment
Programme, 1999), this reports that because of insufficient or lack of human and
financial capacities to remedy the situation unacceptable waste disposal has become
a challenge in Africa and other developing countries. About 20 to 80 percent of the
solid waste in African cities is disposed of by dumping in open spaces, water bodies,
and surface drains as a result of inadequate infrastructure and awareness.
4.2.3.4 Types of carriage used to move solid wastes
Figure 4.7 shows the responses by surveyed staff employees and community
members on the types of carriage used to move solid wastes. They were requested to
state the types of carriage used to move solid wastes in the study area.
In their reply it was revealed that about 50 respondents out of 100 equivalents to 50%
of all surveyed staff employees and community members responded that wheel
barrows are commonly used to move solid waste. While [20.20%) of all surveyed
staff employees and community members said tractor with trailer,[ 20.20%) of all
surveyed staff employees and community members said ox-carts used and [10,10) of
all surveyed staff employees and community members said Lorries. This implies that
to large extent wheel barrows and oxcarts and tractor with trailer are mostly types of
carriage used to move solid waste.

Figure 4.7: Show Types of carriage used to move solid wastes
Lorries 10
10%
Wheel-barrows
5050%
Ox-carts 20
20%
Tractor with trailer
2020%
Source: Field survey 2015
According to the figure 4.7, it was found that types of carriage used to move solid
wastes include wheel barrow, oxcart and tractor with trailer these are carriages are
not effective means to collect solid wastes. The finding is supported by (Bartone,
1995) which show that the current practice of collecting, processing and disposing
municipal solid wastes is also considered to be least efficient in most developing
countries. The typical problems are low collection coverage and irregular collection
services, crude open dumping and burning without air and water pollution control,
the breading of flies and pests, and the handling and control of informal waste
picking or scavenging activities
CHAPTER FIVE
SUMMARY, CONCLUSION AND RECOMMENDATIONS
5.0 Introduction
This chapter provides the summary of the study from chapter four and it also gives
the conclusion and recommendations of the study based on the objectives of the
study.
5.1 Summary
This study sought to investigate the potential use of ecological Solid Waste
Management in Namanyere Township Specifically this study intended to assess the
existing solid waste management practices, to identify the type of solid waste
generated and to propose the ecological solid waste management techniques in the
study area.
The first objective was about to assess the existing solid waste management
practices. This study revealed that reduction and recycling are the main existing
ecological solid waste management.
The second objective was about to identify the type of solid waste generated. This
study revealed that organic, toxic, and recyclable are the main type of solid wastes
generated.
The third objective was about to propose the ecological solid waste management
techniques. This study revealed that incineration and source reduction are the main
employed techniques in solid waste management.

5.2 Conclusions
Basing on the findings this study found that;
There are some ecological solid waste management practices in the study
area. It can be concluded that reduction, reuse and recycling are the main
existing ecological solid waste management.
There are several types of solid wastes that are generated in the study area .It
can be conclude that ,Organic, toxic, and recyclable are the main type of solid
wastes generated.
We have to find and propose new ecological solid waste management
techniques in the study area. It can be concluded that incineration and source
reduction are the main employed techniques in solid waste management.
5.3 Recommendations
Basing on the findings, the following recommendations are made;
1) There is a need for better environmental officer to disseminated information on
the suitable and effective type of solid waste management practices to the
community as improper solid waste management hurts everyone.
2) Environmental management officers should develop, disseminate, and use
better financial tools, systems, and incentives that promote affordability,
fairness, and burden-sharing.

3) Since Organic, toxic, and recyclable are the main type of solid wastes
generated. There is s need to introduce small industries that will utilize the
recyclable wastes.
4) For effective collection of solid wastes there is a need for council town to
invest in transport services so as to ensure that there is a reliable solid waste
transportation from the sources to the dumping areas

REFERENCES
Bartone, C. R., 1995. The role of the private sector in developing countries: Keys to
success. Paper presented at ISWA Conference on Waste Management -Role
of the Private Sector, Singapore, and 24-25 September 1995.
Benjamin, 2003, Eight Great Myths of Recycling, Jane S. Shaw (Ed), PERC
Policy Series, Issue Number Ps-28, the Center for Free Market
Environmentalism, P:1-26.
Chang Jiang Yang,& Qian Yu, 2012, An Analytical Study on the Resource
Recycling Potentials of Urban and Rural Domestic Waste in China, The 7th
International Conference on Waste Management and Technology, Procedia
Environmental Sciences, Vol: 16, PP: 25-33.
Chung S. A, and Poon C. S, 1994, Waste Recycling in Hong Kong, Waste
Management and, PP: 21-32.
Ezeah, C. 2010. Analysis of Barriers and success Factors Affecting the Adoption of
sustainable Management of Municipal Solid Waste in Abuja, Nigeria,
Widerner University, Philadelphia, P.A USA.8).
EEA, 2011. Earnings jobs and innovation: the role of recycling in a green economy.
European Environment Agency, Copenhagen
http://www.eea.europa.eu/publications/earnings-jobs-and innovation-the
(accessed 10.10.13)
jarry, D. AND J.(1995). Collins Dictionary of Sociology. Glasgow Harper Collins
Publishers.

Jasem.M. Alhumoud, 2005. Municipal Solid Waste Recycling in the Gulf CO
Operation Council, Resources, Conservation and Recycling, Vol: 45, No:
2, PP: 142-158.
Jha, A. Singh &Gupta P. 2011. Sustainable Municipal Solid Waste Management in
low income group of cities: a Review. Tropical Ecology 52, 123-131.
Jibril D. J. Ibrahim A.S Dodo, Y.A. Sheelah S. &Suleiman A.S 2012. Integrated
Solid Solid Waste Management as a tool for effective sustainable practice
University Technology Malaysia, UTM Skudai, Johor Malaysia 13.
Kaseke, M. 2005. The use of deposit refundsas pollution control policy in urban
areas: the case of Zimbabwe. Paper prepared for Accounting for Urban
Environment Workshop: Tanzania, 10-15 January 2005.14) .
Kjellen, M. 2001. Health and environment. Stockholm: Swedish International
Development Cooperation AGENCY. Available at:
Kun Yue, 2012. Comparative Anlysis of Scrap Car Recycling Management and
Technology, Procedia Environmental Sciences, Vol: 16, PP: 44-50
Lino F.A. M, and Ismail K.A.R.2012. Analysis of Potential of Municipal Solid
Waste in Brazil, Environmental Development, Vol: 4, PP: 105-113
Martin M, Williams I.D & Clark M, 2006. Social Cultural and Structural Influences
on Household Waste Recycling, Vol: 48, No,4, PP: 357-395.
Medina, M.2010. “Solid Wastes, Poverty and the Environment in Developing
Country Cities: Challenges and Opportunities” United Nations
University, World Institute For Development Economics Research
Medina, Martin. 2007. The World’s Scavengers Salvaging for sustainable
Consumption. Altamira Press, Plymouth UK.

Miao Yu, & Qun Hui Wang, 2012. Research and Recycling Advancement of
Used Oil in China and all over the World, the 7th International Conference
on Waste Management and Technology, Procedia Environmental Sciences,
Vol: 16, PP: 239-243.
Ming Man,&Ming H. Wang, 2012. Persistent Toxic Substances Released from
Uncontrolled E-Waste Recycling and Actions for the future, Science of
the total Environment, Doi: 10-1016 J. SCITOTENV.
Momoh, J. J. & Oladebeye, D. H. 2010. Assessment of awareness of attitude and
willingness of people to participate in household solid waste recycling
United Nations Environment Programme, 1999.
N.O. Adedipe, M.K.C. Sridhar, and Joe Baker, 2005, Ecosystems and Human Well
Being Policy Responses, Chapter 10: Waste Management, Processing
and Detoxification, Millennium Ecosystem Assessment Series,
Edition 1, Island Press, PP.313-334 Operation Council,
Resources, Conservation and Recycling, Vol: 45, No: 2, PP: 142-
158.
Practical Action Southern Africa, (2006). Proceedings of the Emerging Issues in
Urban Waste Management Workshop. 10 February 2006 Harare. Harare:
Practical action Southern African 22.
programme in Ado-Eketi, Nigeria. Journal of Applied Sciences in
EnvironmentalSanitation18
Scheinberg, A., 2001. Integrated Sustainable Solid Waste Management-The
Concepts, Tools for Decision-makers. Experiences from Urban Waste
Expertise Programme (1995-2001).
Yinbing Wang, 1998, A pilot Ecological Engineering Project for Municipal Solid
Waste Reduction, Disinfection Regeneration and Industrialization in
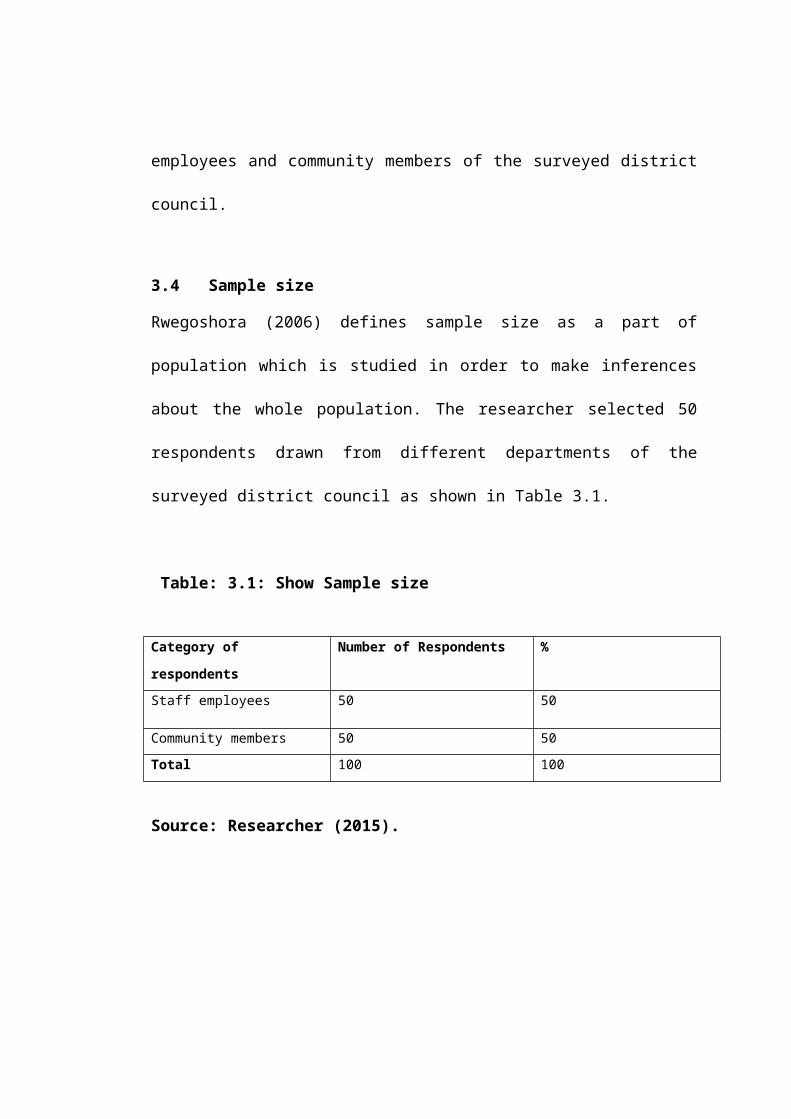
Guanghan City, China, Ecological Engineering, Vol: 11, No:1-4, pp 129-
138
Bartone, C. R., 1995. The role of the private sector in developing countries: Keys to
success. Paper presented at ISWA Conference on Waste Management -Role
of the Private Sector, Singapore, and 24-25 September 1995.
Chang Jiang Yang,& Qian Yu, 2012, An Analytical Study on the Resource
Recycling Potentials of Urban and Rural Domestic Waste in China, The 7th
International Conference on Waste Management and Technology, Procedia
Environmental Sciences, Vol: 16, PP: 25-33.
Chung S. A, and Poon C. S, 1994, Waste Recycling in Hong Kong, Waste
Management and Research, Vol: 12, No: 1, PP: 21-32.
Benjamin, 2003, Eight Great Myths of Recycling, Jane S. Shaw (Ed), PERC
Policy Series, Issue Number Ps-28, the Center for Free Market
Environmentalism, P:1-26.

Jasem M. Alhumoud, 2005, Municipal Solid Waste Recycling in the Gulf Co
Operation Council, Resources, Conservation and Recycling, Vol: 45, No: 2,
PP: 142-158.
Jibril D.J., Ibrahim A.S, Dodo, Y.A., Sheelah S., Integrated
Solid Waste Management As A Tool For Effective Sustainable Practice
Universiti Teknologi Malaysia, UTM Skudai, Johor Malaysia.13)
Kaseke, M. 2005. The use of deposit refundsas pollution control policy in urban
areas: the case of Zimbabwe. Paper prepared for Accounting for Urban
Environment Workshop: Tanzania, 10-15 January 2005.14) .
Momoh, J. J. & Oladebeye, D. H. 2010. Assessment of awareness of attitude and
willingness of people to participate in household solid waste recycling
United Nations Environment Programme, 1999.
programme in Ado-Eketi, Nigeria. Journal of Applied Sciences in
EnvironmentalSanitation18
.
Miao Yu, & Qun Hui Wang, 2012. Research and Recycling Advancement of
Used Oil in China and all over the World, the 7th International Conference
on Waste Management and Technology, Procedia Environmental Sciences,
Vol: 16, PP: 239-243.
N.O. Adedipe, M.K.C. Sridhar, and Joe Baker, 2005, Ecosystems and Human Well
Being Policy Responses, Chapter 10: Waste Management, Processing and
Detoxification, Millennium Ecosystem Assessment Series, Edition 1, Island
Press, PP.313-334
Scheinberg, A., 2001. Integrated Sustainable Solid Waste Management-The
Concepts, Tools for Decision-makers. Experiences from Urban Waste
Expertise Programme (1995-2001).

Yinbing Wang, 1998, A pilot Ecological Engineering Project for Municipal Solid
Waste Reduction, Disinfection Regeneration and Industrialization in
Guanghan City, China, Ecological Engineering, Vol: 11, No:1-4, pp 129-
138
Ezeah, C. 2010. Analysis of Barriers and success Factors Affecting the Adoption of
sustainable Management of Municipal Solid Waste in Abuja, Nigeria,
Widerner University, Philadelphia, P.A USA.8).
EEA, 2011. Earnings jobs and innovation: the role of recycling in a green economy.
European Environment Agency, Copenhagen
http://www.eea.europa.eu/publications/earnings-jobs-and innovation-the
(accessed 10.10.13)
jarry, D. AND J.(1995). Collins Dictionary of Sociology. Glasgow Harper Collins
Publishers.
Jasem.M. Alhumoud, 2005. Municipal Solid Waste Recycling in the Gulf CO
Operation Council, Resources, Conservation and Recycling, Vol: 45, No:
2, PP: 142-158.
Jha, A. Singh &Gupta P. 2011. Sustainable Municipal Solid Waste Management in
low income group of cities: a Review. Tropical Ecology 52, 123-131.
Jibril D. J. Ibrahim A.S Dodo, Y.A. Sheelah S. &Suleiman A.S 2012. Integrated
Solid Solid Waste Management as a tool for effective sustainable practice
University Technology Malaysia, UTM Skudai, Johor Malaysia 13.
Kjellen, M. 2001. Health and environment. Stockholm: Swedish International
Development Cooperation AGENCY. Available at:
http://www.sida.se/pdf/20012-health- and-environment-issues-paper.pdf,
Downloaded 12.03.2012.

Kun Yue, 2012. Comparative Anlysis of Scrap Car Recycling Management and
Technology, Procedia Environmental Sciences, Vol: 16, PP: 44-50
Lino F.A. M, and Ismail K.A.R.2012. Analysis of Potential of Municipal Solid
Waste in Brazil, Environmental Development, Vol: 4, PP: 105-113
Martin M, Williams I.D & Clark M, 2006. Social Cultural and Structural Influences
on Household Waste Recycling, Vol: 48, No,4, PP: 357-395.
Ming Man,&Ming H. Wang, 2012. Persistent Toxic Substances Released from
Uncontrolled E-Waste Recycling and Actions for the future, Science of
the total Environment, Doi: 10-1016 J. SCITOTENV.
Medina, M.2010. “Solid Wastes, Poverty and the Environment in Developing
Country Cities: Challenges and Opportunities” United Nations
University, World Institute For Development Economics Research
Medina, Martin. 2007. The World’s Scavengers Salvaging for sustainable
Consumption. Altamira Press, Plymouth UK.
Practical Action Southern Africa, (2006). Proceedings of the Emerging Issues in
Urban Waste Management Workshop. 10 February 2006 Harare. Harare:
Practical action Southern African 22.

APPENDIX I
QUESTIONNAIRE FOR STAFF EMPLOYEES AND COMMUNITY
MEMBERS
Dear respondent
The aim of this research is to identify the potential use of ecological Solid Waste
Management in Namanyere Township. You are kindly requested to assist the
undersigned student who pursues master degree of Science in Environmental study at
the Open University of Tanzania. Any information provided is strictly confidential
and will be used absolutely for the academic research purpose only.
Student name--------------------------------- Date-------------------------------------
A: DEMOGRAPHIC CHARACTERISTICS
i. Sex:
a) Male ( ) b) Female ( )

ii. Education Level;
a) Primary education ( )b) Secondary education ( )c) Bachelor Degree ( )d) Masters degree ( )
iii. Work experience
a) Less than 10 years ( )b) 10-15 years ( )c) 15 years and above ( )
B STUDY QUESTIONS
PART 1: THE EXISTING SOLID WASTE MANAGEMENT PRACTICES IN
STUDY AREA
i) Does the Local authority control waste collection schedules? Yes Noii) If yes, which of the following method/s for solid waste collection exist in the
study area?
a) Collective waste containers
b) Collection points
c) Old buckets
d) Plastic bags
iii) How would you rate the status of solid waste management exist in the
study area?
a) Low ( )b) Moderate ( )c) High ( )

iv) If the answer in (iii) is low, what would be the reasons among these;
a) Poor working facilities ( )
b) In adequate knowledge and skills in Solid waste management ( )
c) Lack of commitment, poor facilities and inadequate budget ( )
v) Which among the following practices are mostly used in solid waste
management in the study area?
a) Reduce ( )
b) Reuse ( )
c) Recycle ( )
PART II: THE TYPE OF SOLID WASTE GENERATED IN THE STUDY
AREA
vi) What is the main source of solid waste generation in the study area?
a) Commercial/ business area ( )
b) Institutions ( )
c) Residential area ( )
vii) How would you rate the frequency for which type of solid waste materials
are generated in the study area?
Types of materials generated Strongly
agree
Agree Disagree Strongly
disagree
Organic waste such as kitchen waste, vegetables, flowers, leaves, fruits are mostly generated
Toxic waste such as old medicines, paints, chemicals, bulbs, spray cans, fertilizer and pesticide containers, batteries, shoe polish are mostly generated
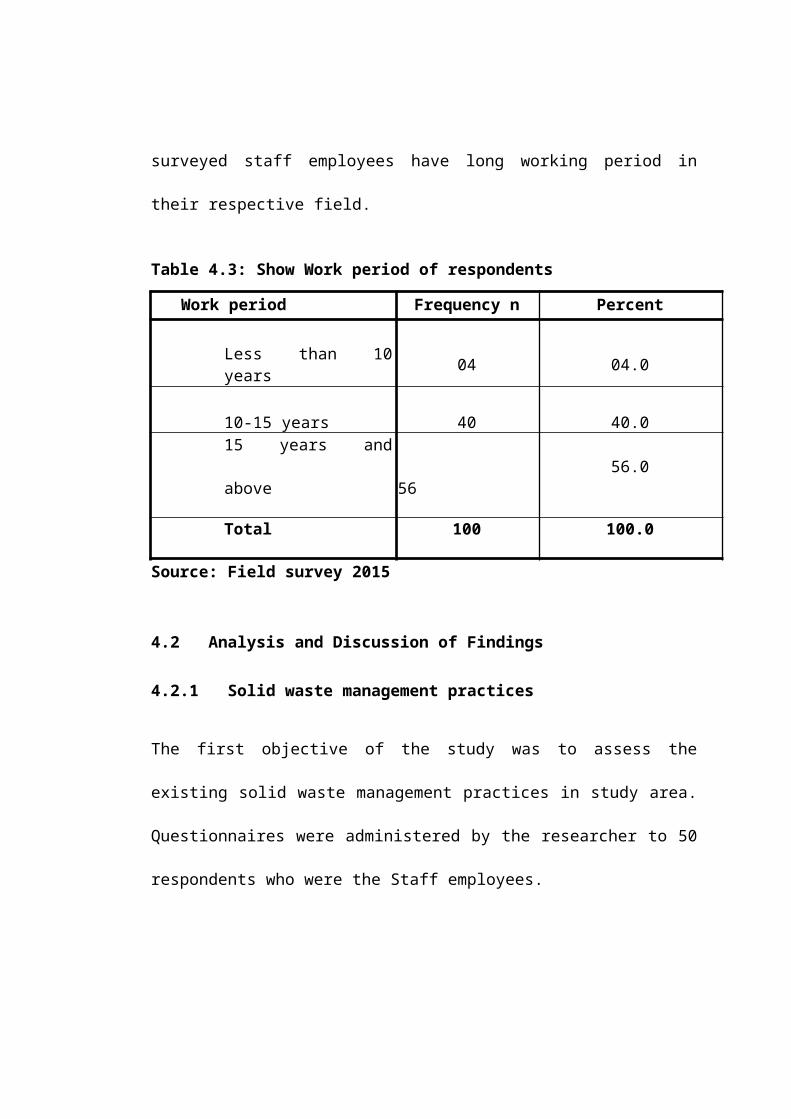
Recyclable such as paper, glass, metals, plastics are mostly generated Hospital waste such as cloth with blood are frequently generated
viii) What type of waste do you think is a problem in your compound?
a) Organic waste ( )b) Toxic waste ( )c) Recyclable ( ) d) Hospital waste ( )
PART III: THE ECOLOGICAL SOLID WASTE MANAGEMENT
TECHNIQUES IN THE STUDY AREA.
ix) What technique among these is mostly employed in ecological solid waste management in the study area?
a. Sanitary Land Filling ( )b. Incineration ( )c. Composting ( )d. Pyrolysis ( )
x) What are the types of solid waste material incinerated in the study area ?
a) Organic waste ( )b) Toxic waste ( )c) Recyclable ( ) d) Hospital waste ( )
xi) How do you rate the frequency of solid waste collection in the study area?
a) Not collected at all ( )b) Rarely collected ( )c) Somewhat collected ( )d) Frequently collected ( )
xii) Types of carriage used to move solid wastes
a. Lorries ( ) b. Wheel-barrows c. Ox-carts
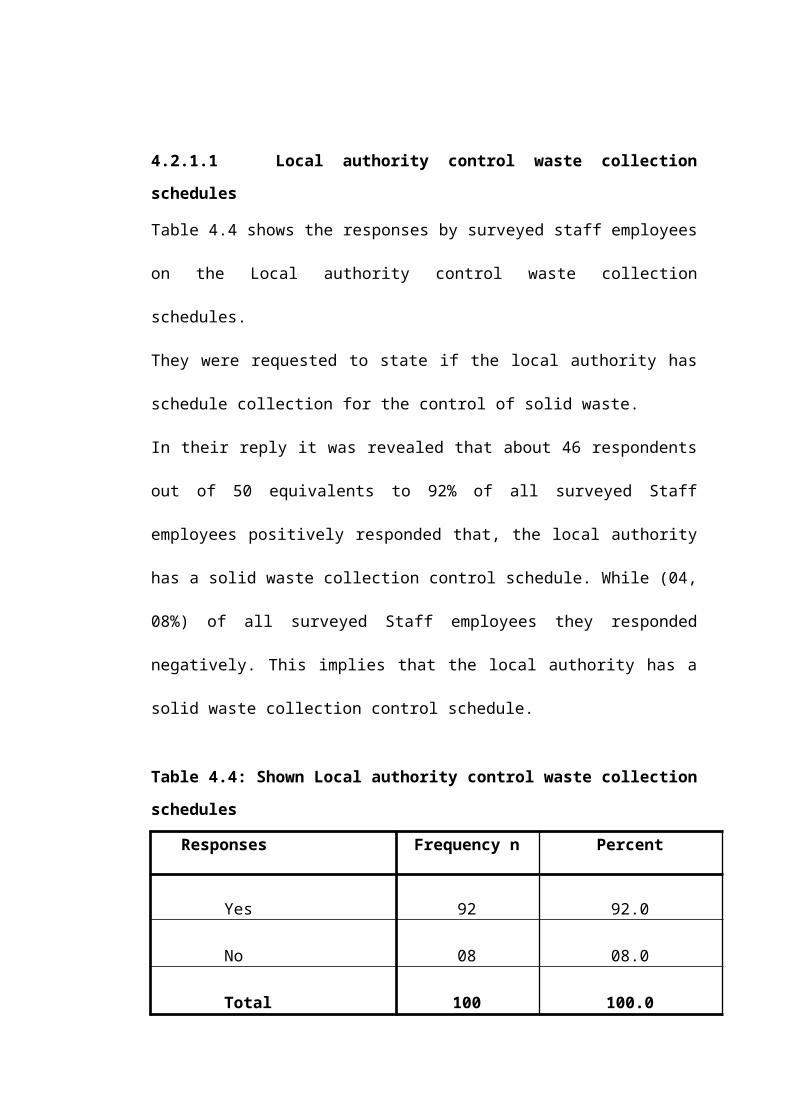
d. Tractor with trailer
THANK YOU FOR YOUR TIME AND COOPERATION


![priyanka new snop.[1]new.docx](https://img.pdfslide.us/doc/110x75/577cde151a28ab9e78ae5858/priyanka-new-snop1newdocx.jpg)