Embed Size (px)
Citation preview
MPSS Form No. 03-012 * Version 0 * 06 March 2015 File/Ref. No. MPRG-041015-06
FOREWORD
he primary objective of monetary policy is to promote a low and stable rate of inflation conducive to a balanced and sustainable economic growth. The adoption in January
2002 of the inflation targeting framework for monetary policy was aimed at helping to fulfill this objective.
One of the key features of inflation targeting is greater transparency, which means greater disclosure and communication by the BSP of its policy actions and decisions. This Inflation Report is published by the BSP as part of its transparency mechanisms under inflation targeting. The objectives of this Inflation Report are: (i) to identify the risks to price stability and discuss their implications for monetary policy; and (ii) to document the economic analysis behind the formulation of monetary policy and convey to the public the overall thinking behind the BSP’s decisions on monetary policy. The broad aim is to make monetary policy easier for the public to understand and enable them to better monitor the BSP’s commitment to the inflation target, thereby helping both in anchoring inflation expectations and encouraging informed debate on monetary policy issues.
The government’s target for annual headline inflation under the inflation targeting
framework has been lowered to 3.0 percent ± 1.0 percentage point (ppt) for 2015-2018 by the Development Budget Coordination Committee (DBCC). This is consistent with the desired disinflation path over the medium term, favorable trends in the structure of inflation, and expected higher capacity of the economy for growth under a low inflation environment.
The report is published on a quarterly basis, presenting a survey of the various factors
affecting inflation. These include recent price and cost developments, inflation expectations, prospects for aggregate demand and output, labor market conditions, monetary and financial market conditions, fiscal developments, and the international environment. A section is devoted to a discussion of monetary policy developments in the most recent quarter, as well as a comprehensive analysis of the BSP’s view of the inflation outlook for the policy horizon.
The Monetary Board approved this Inflation Report at its meeting on
16 April 2015.
AMANDO M. TETANGCO, JR. Governor
24 April 2015
T
List of Acronyms, Abbreviations, and Symbols AE Advanced economy AFF AHFF AMCs
Agriculture, Fishery, and Forestry Agriculture, Hunting, Forestry and Fishing Asset Management Companies
AP Asia Pacific AL Auto Loans BES BGC BIR
Business Expectations Survey Bonifacio Global City Bureau of Internal Revenue
BIS Bank for International Settlements BOC Bureau of Customs BOP BPO
Balance of Payments Business Process Outsourcing
BTr Bureau of the Treasury CAMPI Chamber of Automotive Manufacturers of the Philippines, Inc. CAR Capital Adequacy Ratio CBD Central Business District CCRs Credit Card Receivables CES Consumer Expectations Survey CDS Credit Default Swaps CI Confidence Index CPI DAA DDA DBCC DOF EIA
Consumer Price Index Deferred Accounting Adjustment Demand Deposit Account Development Budget Coordination Committee Department of Finance US Energy Information Administration
EM Emerging Market EMBI ERC
JP Morgan Emerging Market Bond Index Energy Regulatory Commission
EU European Union FAO FPI
Food and Agriculture Organization Food Price Index
GDP Gross Domestic Product GNI Gross National Income GRAM GS
Generation Rate Adjustment Mechanism Government Securities
ICERA Incremental Currency Exchange Rate Adjustment IEA International Energy Agency IMF International Monetary Fund IPP Independent Power Producer LFS Labor Force Survey LPG Liquefied Petroleum Gas LTFRB MB
Land Transportation Franchising and Regulatory Board Monetary Board
MEM Multi-Equation Model
MENA Middle East and North Africa Meralco Manila Electric Company MISSI Monthly Integrated Survey of Selected Industries MTP NBQBs
Major Trading Partner Non-Bank Financial Institutions with Quasi-Banking Functions
NCCP National Council for Commuters’ Protection NDA NEDA NEER
Net Domestic Assets National Economic and Development Authority Nominal Effective Exchange Rate
NFA Net Foreign Assets; National Food Authority NG NGCP
National Government National Grid Corporation of the Philippines
NPC National Power Corporation NPI Net Primary Income NPLs Non-performing loans O&O Offshoring and Outsourcing OECD Organization for Economic Cooperation and Development OPEC OF
Organization of the Petroleum Exporting Countries Overseas Filipinos
PSA PBR PMI PSALM
Philippine Statistics Authority Performance-Based Rate Purchasing Managers’ Index Power Sector Assets and Liabilities Management Corporation
PSEi Philippine Stock Exchange Composite Index PSIC Philippine Standard Industrial Classification R&I RB RDA
Rating and Investment Information Inc. Rural Banks Reserve Deposit Account
REER Real Effective Exchange Rate ROP Republic of the Philippines RP RR
Repurchase Reserve Requirement
RREL Residential and Real Estate Loans RRP RWA
Reverse Repurchase Risk Weighted Assets
SEM SMS
Single-Equation Model Short Message Service
SDA Special Deposit Account TCS TLP
Transportation, Communications, and Storage Total Loan Portfolio
U/KBs VAPI VOP
Universal/commercial banks Value of production index Volume of production index
WEO WESM
World Economic Outlook Wholesale Electricity Spot Market
THE MONETARY POLICY OF THE BANGKO SENTRAL NG PILIPINAS
The BSP Mandate The BSP’s main responsibility is to formulate and implement policy in the areas of money, banking and credit, with the primary objective of maintaining stable prices conducive to a balanced and sustainable economic growth in the Philippines. The BSP also aims to promote and preserve monetary stability and the convertibility of the national currency. Monetary Policy Instruments The BSP’s primary monetary policy instrument is its overnight reverse repurchase (RRP) or borrowing rate. Other instruments to implement the desired monetary policy stance to achieve the inflation target include (a) increasing/decreasing the reserve requirement; (b) encouraging/discouraging deposits in the special deposit account (SDA) facility by banks and trust entities of BSP-supervised financial institutions; (c) adjusting the rediscount rate on loans extended to banking institutions on a short-term basis against eligible collateral of banks’ borrowers; and (d) outright sales/purchases of the BSP’s holdings of government securities. Policy Target The BSP’s target for monetary policy uses the Consumer Price Index (CPI) or headline inflation rate, which is compiled and released to the public by the National Statistics Office (NSO). The policy target is set by the Development Budget Coordination Committee (DBCC)1 in consultation with the BSP. The inflation target for 2015-2018 was reduced to 3.0 percent ± 1.0 ppt.2 BSP’s Explanation Clauses These are the predefined set of acceptable circumstances under which an inflation-targeting central bank may fail to achieve its inflation target. These clauses reflect the fact that there are limits to the effectiveness of monetary policy and that deviations from the inflation target may sometimes occur because of factors beyond the control of the central bank. Under the inflation targeting framework of the BSP, these exemptions include inflation pressures arising from: (a) volatility in the prices of agricultural products; (b) natural calamities or events that affect a major part of the economy; (c) volatility in the prices of oil products; and (d) significant government policy changes that directly affect prices such as changes in the tax structure, incentives, and subsidies.
1 The DBCC, created under Executive Order (E.O.) No. 232 dated 14 May 1970, is an inter-agency committee tasked primarily to formulate the National Government's fiscal program. It is composed of the Office of the President (OP), Department of Budget and Management (DBM), National Economic and Development Authority (NEDA), and the Department of Finance (DOF). The BSP attends the Committee meetings as a resource agency.
2 The inflation target range for 2015-2018 was announced thru DBCC Resolution No.2015-1 dated 27 January 2015.
The Monetary Board The powers and functions of the BSP, such as the conduct of monetary policy and the supervision over the banking system, are exercised by its Monetary Board, which has seven members appointed by the President of the Philippines. Starting in 2012, the Monetary Board will hold eight (8) monetary policy meetings in a year to review and decide on the stance of monetary policy. Prior to 2012, monetary policy meetings were held every six weeks while prior to July 2006, meetings were held every four weeks during the 2002 – July 2006 period.
Chairman Amando M. Tetangco, Jr. Members Cesar V. Purisima
Alfredo C. Antonio
Felipe M. Medalla
Armando L. Suratos
Juan D. De Zuñiga, Jr.
Valentin A. Araneta
The Advisory Committee The Advisory Committee was established as an integral part of the institutional setting for inflation targeting. It is tasked to deliberate, discuss, and make recommendations on monetary policy to the Monetary Board. Like the Monetary Board, the Committee will meet eight times a year (beginning in January 2012) but may also meet between regular meetings, whenever deemed necessary.
Chairman Amando M. Tetangco, Jr. Governor
Members Diwa C. Guinigundo
Deputy Governor Monetary Stability Sector
Nestor A. Espenilla, Jr. Deputy Governor Supervision and Examination Sector
Ma. Ramona GDT Santiago
Assistant Governor Treasury Department
Francisco G. Dakila, Jr. Officer-In-Charge Monetary Policy Sub-sector

2015 SCHEDULE OF MONETARY POLICY MEETINGS, INFLATION REPORT PRESS CONFERENCE AND PUBLICATION OF MB HIGHLIGHTS
Period Advisory
Committee (AC) Meeting
Monetary Board (MB)
Meeting
MB Highlights Publication
Inflation Report (IR) Press
Conference
2
0
1
5
Jan 8 (Thu)
(11 Dec 2014 MB meeting)
23 (Fri)
(Q4 2014 IR)
Feb 6 (Fri)
(AC Meeting No. 1)
12 (Thu)
(MB Meeting No. 1)
Mar 20 (Fri)
(AC Meeting No. 2)
26 (Thu)
(MB Meeting No. 2)
12 (Thu)
(12 Feb 2015 MB meeting)
Apr 23 (Thu)
(26 Mar 2015 MB meeting)
24 (Fri)
(Q1 2015 IR)
May 8 (Fri)
(AC Meeting No. 3)
14 (Thu)
(MB Meeting No. 3)
Jun 19 (Fri)
(AC Meeting No. 4)
25 (Thu)
(MB Meeting No. 4)
11 (Thu)
(14 May 2015 MB meeting)
Jul 23 (Thu)
(25 Jun 2015 MB meeting)
24 (Fri)
(Q2 2015 IR)
Aug 7 (Fri)
(AC Meeting No. 5)
13 (Thu)
(MB Meeting No. 5)
Sep 18 (Fri)
(AC Meeting No. 6)
24 (Thu)
(MB Meeting No. 6)
10 (Thu)
(13 Aug 2015 MB meeting)
Oct 22 (Thu)
(24 Sep 2015 MB meeting)
23 (Fri)
(Q3 2015 IR)
Nov 6 (Fri)
(AC Meeting No. 7)
12 (Thu)
(MB Meeting No. 7)
Dec 11 (Fri)
(AC Meeting No. 8)
17 (Thu)
(MB Meeting No. 8)
10 (Thu)
(12 Nov 2015 MB meeting)
CONTENTS
Overview 1
I. Inflation and Real Sector Developments 3
Prices 3
Private Sector Economists’ Inflation Forecasts
5
Energy Prices 6
Power 7
Aggregate Demand and Supply 9
Aggregate Demand 9
Other Demand Indicators 11
Aggregate Supply 19
Labor Market Conditions 20
II. Monetary and Financial Market Conditions
21
Domestic Liquidity and Credit Conditions 21
Interest Rates 26
Financial Market Conditions
28
Banking System 31
Exchange Rate
35
III. Fiscal Developments IV. External Developments
37
38
V. Monetary Policy Developments
43
VI. Inflation Outlook 44
BSP Inflation Forecasts Risks to the Inflation Outlook
VII. Implications for the Monetary Policy Stance
Summary of Monetary Policy Decisions
44
48
51
54
1
OVERVIEW3
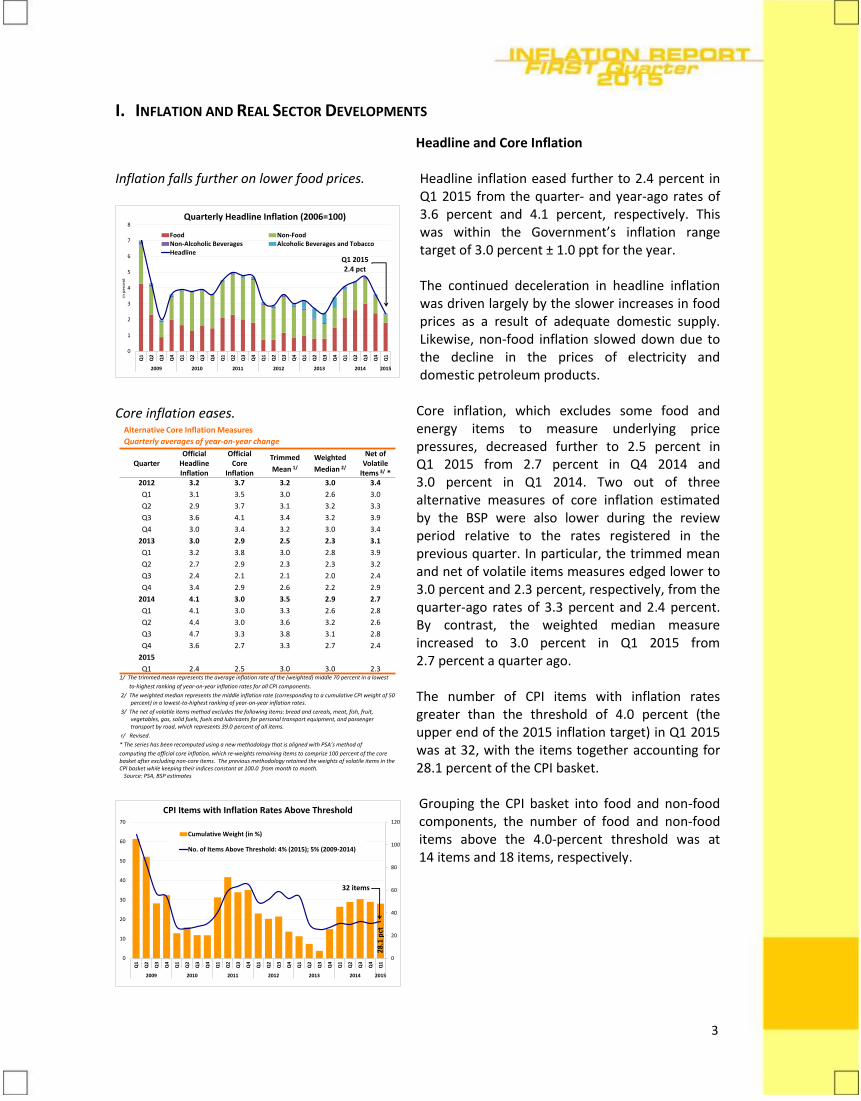
Inflation eases further. Headline inflation in Q1 2015 at 2.4 percent remained within the Government’s 2015 inflation target range of 3.0 percent ± 1.0 percentage point (ppt). This was lower relative to the quarter- and year-ago rates of 3.6 percent and 4.1 percent, respectively. The continued deceleration in headline inflation was driven largely by the slower increases in food prices as a result of adequate domestic supply. Likewise, non-food inflation slowed down due to the decline in the prices of electricity and domestic petroleum products. Core inflation decreased further to 2.5 percent in Q1 2015 from 2.7 percent in Q4 2014 and 3.0 percent in Q1 2014, pointing to limited underlying price pressures. Two out of the three alternative measures of core inflation estimated by the BSP, i.e. the trimmed mean and net of volatile items measures, were similarly lower during the review period relative to the rates registered in the previous quarter. The number of CPI items with inflation rates greater than the upper end of the 2015 inflation target meanwhile was 32, with the items together accounting for 28.1 percent of the CPI basket.
Inflation expectations remain anchored to the inflation target over the policy horizon. Results of the BSP’s survey of private sector economists for March 2015 yielded lower mean inflation forecasts for 2015-2016 relative to the results in December 2014. The analysts attributed their lower inflation expectations mainly to the decline of international oil prices. Similarly, the March 2015 Consensus Economics inflation forecast survey showed lower inflation forecast for 2015 at 2.7 percent and for 2016 at 3.5 percent.
Domestic demand conditions remain solid. The Philippine economy expanded by 6.9 percent in Q4 2014, higher compared to the quarter- and year-ago rates of 5.3 percent and 6.3 percent, respectively. The higher-than-expected growth during the quarter was supported by strong household consumption, robust exports growth, and accelerated government spending on the expenditure side. Meanwhile, the services and industry sectors continued to be the main drivers of growth on the production side. On an annual basis, the country’s output increased by 6.1 percent in 2014, within the government’s growth target of 6.0–7.0 percent for the year and remains above its long-term average growth. Trends in higher-frequency demand indicators likewise point to sustained economic upturn in the near term. Vehicle sales continued to post double-digit growth on brisk consumer spending amid attractive financing packages, while the composite Purchasing Managers’ Index (PMI) remained on an uptrend, firmly above the 50-point expansion threshold. Business and consumer sentiment also indicate generally favorable perception on domestic economic conditions, supporting the view that the growth impetus remains strong amid robust credit growth and steady improvements in employment conditions. At the same time, domestic demand is likely to receive a further boost from the government’s commitment to ramp up public spending as well as anticipated campaign-related spending in preparation for the 2016 elections.
Global economic prospect are improving gradually, but growth conditions continue to vary across regions. The economic momentum in the US remained firm, supported by sustained gains in labor market conditions. In Japan, a modest expansion was noted, reflecting the waning effects of the consumption tax hike in April 2014. Some growth was also seen in the euro area owing largely to firming domestic demand and the gradual strengthening of external trade. By contrast, growth conditions in major emerging markets (EMs), particularly in China and India, continued to be generally soft. Meanwhile, the global inflation environment remains benign, reflecting the broadly subdued outlook for international commodity prices, particularly oil. The price of oil is expected to remain soft in the near term amid the current imbalance between ample global production and weak global demand.
3 The analysis contained in this report is based on information as of 27 March 2015.
2
Domestic financial market conditions are generally favorable. The continued manageable inflation environment, higher-than-expected output growth in Q4 2014, and reports of strong corporate earnings boosted investor optimism during the review quarter. Policy actions of various central banks overseas were generally aimed at supporting domestic economic activity and guarding against downside risks to inflation. These included the European Central Bank’s (ECB) move to launch its expanded asset purchase program, which has also helped prop up market sentiment in the region. Meanwhile, the US Federal Reserve (US Fed) dropped the word “patient” from its forward guidance, but revealed a more cautious outlook, resulting in the scaling back of market expectations of how fast US authorities would move to tighten monetary policy. Consequently, strong buying momentum was observed in the local stock market, propelling the Philippine Stock Exchange Composite Index (PSEi) near the 8000-point mark in end-March 2015, while investor appetite for local government securities (GS) remains healthy as evidenced by the continued large oversubscription in the scheduled GS auctions. Bond spreads meanwhile increased marginally, indicating relatively stable sentiment toward Philippine sovereign debt papers, owing largely to positive perception of the country’s firm macroeconomic fundamentals. The Philippine banking system also remained sound and resilient, marked by sustained growth in assets, lending, and deposits, with capital adequacy ratios comfortably above the BSP’s and Bank for International Settlements’ (BIS) prescribed levels. Bank lending standards for both loans to enterprises and household were broadly unchanged during the quarter, indicating that banks continue to prudently manage their risks.
The BSP maintains monetary policy settings. The BSP decided to keep its key policy interest rates at 4.0 percent for the overnight borrowing or reverse repurchase (RRP) facility and 6.0 percent for the overnight lending or repurchase (RP) facility. The interest rates on term RRPs, RPs, and special deposit accounts (SDA) were also kept steady. The reserve requirement ratios were left unchanged as well. The said policy decisions were based on the assessment that the inflation environment continued to be manageable, with the risks to the inflation outlook broadly balanced and inflation expectations remaining well-anchored to the inflation target band over the policy horizon. Current monetary policy settings remain appropriate in view of the emerging outlook for domestic inflation and demand conditions. The latest outlook for inflation shows a lower but within-target path over the policy horizon, owing mainly to the continued easing in oil prices as well as the lower-than-assumed actual wage increase for NCR. Risks to the inflation outlook continue to be broadly balanced, supporting the overall assessment of a manageable inflation environment. Pending petitions for utility rate adjustments and the potential power shortages are nevertheless seen to pose upside risks to the baseline inflation forecasts. Meanwhile, downside risks could stem from slower-than-expected global economic activity and pending petitions for transport fare reductions. Inflation pressures appear to be modest on the whole as evidenced by the further easing of headline inflation and other price indicators. At the same time, imported commodity prices, particularly oil and cereals, are expected to remain subdued as a result of favorable global supply conditions. Inflation expectations also remain well-contained, while domestic economic activity continues to expand at a solid pace as private domestic demand is expected to continue to deliver positive impulses to the economy, underpinned by ample liquidity and broad-based credit expansion. Improved government spending should also further support resilience of domestic demand. Meanwhile, the outlook for global economic growth as well as shifts in foreign monetary policy, especially in major advanced economies (AEs), could be an important consideration in the quarters ahead to the extent that they can influence inflation expectations and market sentiment at home. Going forward, the BSP will remain attentive to evolving price and output developments and stand ready to undertake preemptive policy actions as necessary to safeguard its price and financial stability objectives.
3
I. INFLATION AND REAL SECTOR DEVELOPMENTS
Inflation falls further on lower food prices.
0
1
2
3
4
5
6
7
8
Q1
Q2
Q3
Q4
Q1
Q2
Q3
Q4
Q1
Q2
Q3
Q4
Q1
Q2
Q3
Q4
Q1
Q2
Q3
Q4
Q1
Q2
Q3
Q4
Q1
2009 2010 2011 2012 2013 2014 2015
in p
erce
nt
Quarterly Headline Inflation (2006=100)
Food Non-FoodNon-Alcoholic Beverages Alcoholic Beverages and TobaccoHeadline
Q1 20152.4 pct
Core inflation eases. Alternative Core Inflation Measures
Quarterly averages of year-on-year change
QuarterOfficial
Headline Inflation
Official Core
Inflation
Trimmed
Mean 1/
Weighted
Median 2/
Net of Volatile
Items 3/ *2012
Q1
Q2
Q3
Q4
2013
Q1
Q2
Q3
Q4
2014
Q1
Q2
Q3
Q4
2015
Q1
3.2
3.1
2.9
3.6
3.0
3.0
3.2
2.7
2.4
3.4
4.1
4.1
4.4
4.7
3.6
2.4
3.7
3.5
3.7
4.1
3.4
2.9
3.8
2.9
2.1
2.9
3.0
3.0
3.0
3.3
2.7
2.5
3.2
3.0
3.1
3.4
3.2
2.5
3.0
2.3
2.1
2.6
3.5
3.3
3.6
3.8
3.3
3.0
3.0
2.6
3.2
3.2
3.0
2.3
2.8
2.3
2.0
2.2
2.9
2.6
3.2
3.1
2.7
3.0
3.4
3.0
3.3
3.9
3.4
3.1
3.9
3.2
2.4
2.9
2.7
2.8
2.6
2.8
2.4
2.31/ The trimmed mean represents the average inflation rate of the (weighted) middle 70 percent in a lowest
to-highest ranking of year-on-year inflation rates for all CPI components.
2/ The weighted median represents the middle inflation rate (corresponding to a cumulative CPI weight of 50 percent) in a lowest-to-highest ranking of year-on-year inflation rates.
3/ The net of volatile items method excludes the following items: bread and cereals, meat, fish, fruit, vegetables, gas, solid fuels, fuels and lubricants for personal transport equipment, and passenger transport by road, which represents 39.0 percent of all items.
r/ Revised.
* The series has been recomputed using a new methodology that is aligned with PSA’s method of
computing the official core inflation, which re-weights remaining items to comprise 100 percent of the core basket after excluding non-core items. The previous methodology retained the weights of volatile items in the CPI basket while keeping their indices constant at 100.0 from month to month.
Source: PSA, BSP estimates
0
20
40
60
80
100
120
0
10
20
30
40
50
60
70
Q1
Q2
Q3
Q4
Q1
Q2
Q3
Q4
Q1
Q2
Q3
Q4
Q1
Q2
Q3
Q4
Q1
Q2
Q3
Q4
Q1
Q2
Q3
Q4
Q1
2009 2010 2011 2012 2013 2014 2015
CPI Items with Inflation Rates Above Threshold
Cumulative Weight (in %)
No. of Items Above Threshold: 4% (2015); 5% (2009-2014)
32 items
Headline and Core Inflation Headline inflation eased further to 2.4 percent in Q1 2015 from the quarter- and year-ago rates of 3.6 percent and 4.1 percent, respectively. This was within the Government’s inflation range target of 3.0 percent ± 1.0 ppt for the year. The continued deceleration in headline inflation was driven largely by the slower increases in food prices as a result of adequate domestic supply. Likewise, non-food inflation slowed down due to the decline in the prices of electricity and domestic petroleum products.
Core inflation, which excludes some food and energy items to measure underlying price pressures, decreased further to 2.5 percent in Q1 2015 from 2.7 percent in Q4 2014 and 3.0 percent in Q1 2014. Two out of three alternative measures of core inflation estimated by the BSP were also lower during the review period relative to the rates registered in the previous quarter. In particular, the trimmed mean and net of volatile items measures edged lower to 3.0 percent and 2.3 percent, respectively, from the quarter-ago rates of 3.3 percent and 2.4 percent. By contrast, the weighted median measure increased to 3.0 percent in Q1 2015 from 2.7 percent a quarter ago. The number of CPI items with inflation rates greater than the threshold of 4.0 percent (the upper end of the 2015 inflation target) in Q1 2015 was at 32, with the items together accounting for 28.1 percent of the CPI basket. Grouping the CPI basket into food and non-food components, the number of food and non-food items above the 4.0-percent threshold was at 14 items and 18 items, respectively.
4
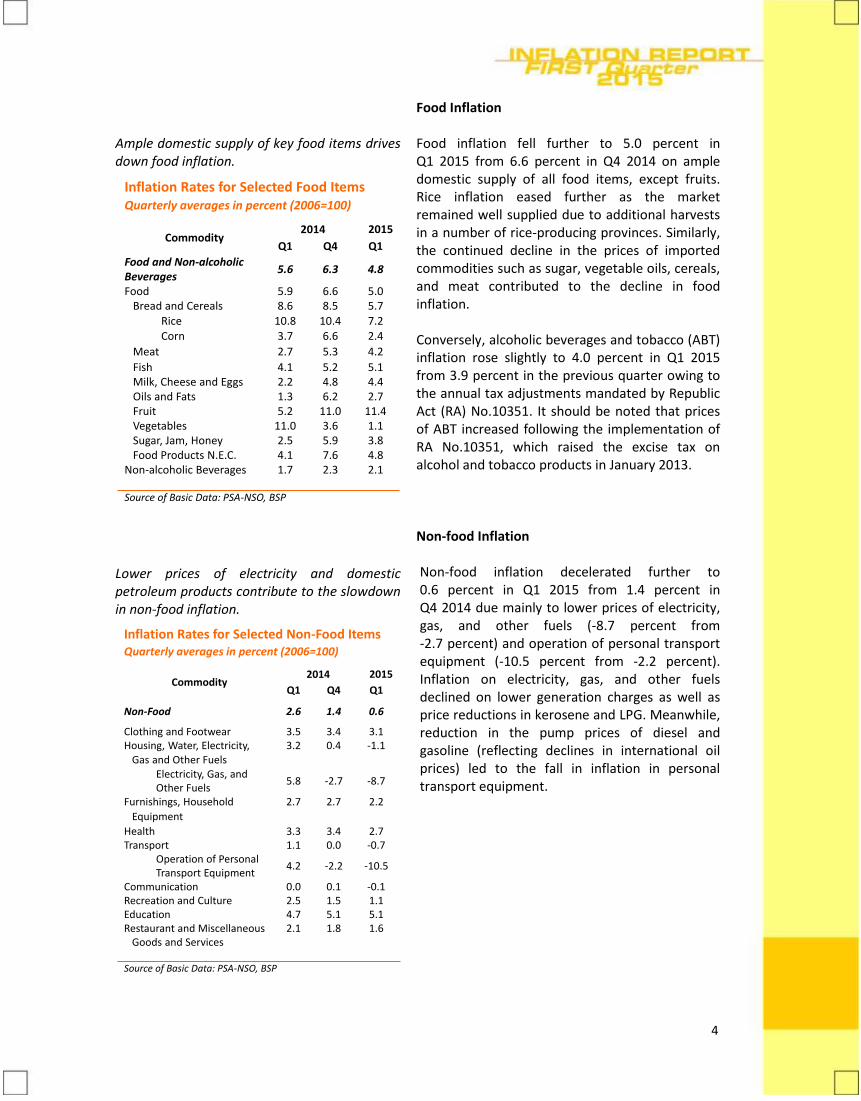
Ample domestic supply of key food items drives down food inflation.
Inflation Rates for Selected Food ItemsQuarterly averages in percent (2006=100)
Commodity2014 2015
Q1 Q4 Q1
Food and Non-alcoholic Beverages
5.6 6.3 4.8
Food 5.9 6.6 5.0Bread and Cereals 8.6 8.5 5.7
Rice 10.8 10.4 7.2Corn 3.7 6.6 2.4
Meat 2.7 5.3 4.2
Fish 4.1 5.2 5.1Milk, Cheese and Eggs 2.2 4.8 4.4Oils and Fats 1.3 6.2 2.7Fruit 5.2 11.0 11.4Vegetables 11.0 3.6 1.1Sugar, Jam, Honey 2.5 5.9 3.8Food Products N.E.C. 4.1 7.6 4.8
Non-alcoholic Beverages 1.7 2.3 2.1
Source of Basic Data: PSA-NSO, BSP
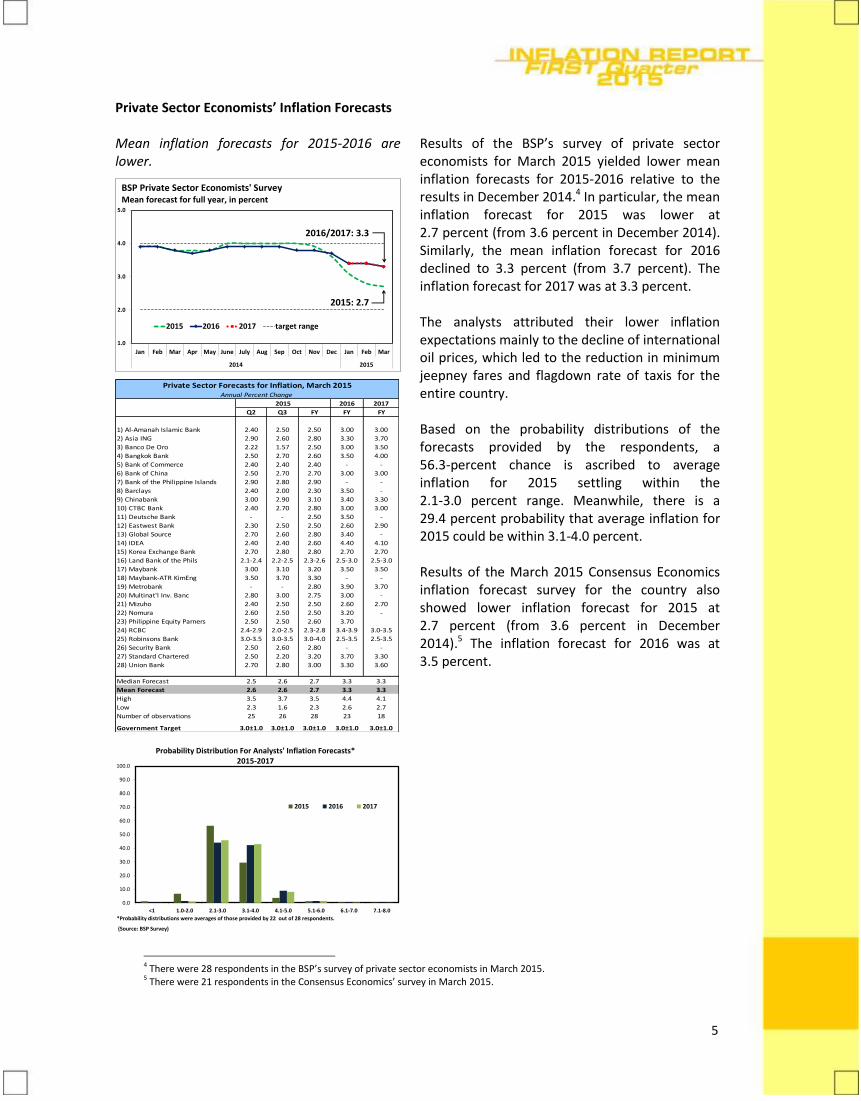
Lower prices of electricity and domestic petroleum products contribute to the slowdown in non-food inflation.
Inflation Rates for Selected Non-Food ItemsQuarterly averages in percent (2006=100)
Commodity2014 2015
Q1 Q4 Q1
Non-Food 2.6 1.4 0.6
Clothing and Footwear 3.5 3.4 3.1Housing, Water, Electricity, 3.2 0.4 -1.1
Gas and Other FuelsElectricity, Gas, and Other Fuels
5.8 -2.7 -8.7
Furnishings, Household 2.7 2.7 2.2
Equipment
Health 3.3 3.4 2.7Transport 1.1 0.0 -0.7
Operation of Personal Transport Equipment
4.2 -2.2 -10.5
Communication 0.0 0.1 -0.1Recreation and Culture 2.5 1.5 1.1Education 4.7 5.1 5.1Restaurant and Miscellaneous 2.1 1.8 1.6
Goods and Services
Source of Basic Data: PSA-NSO, BSP
Food Inflation
Food inflation fell further to 5.0 percent in Q1 2015 from 6.6 percent in Q4 2014 on ample domestic supply of all food items, except fruits. Rice inflation eased further as the market remained well supplied due to additional harvests in a number of rice-producing provinces. Similarly, the continued decline in the prices of imported commodities such as sugar, vegetable oils, cereals, and meat contributed to the decline in food inflation. Conversely, alcoholic beverages and tobacco (ABT) inflation rose slightly to 4.0 percent in Q1 2015 from 3.9 percent in the previous quarter owing to the annual tax adjustments mandated by Republic Act (RA) No.10351. It should be noted that prices of ABT increased following the implementation of RA No.10351, which raised the excise tax on alcohol and tobacco products in January 2013. Non-food Inflation Non-food inflation decelerated further to 0.6 percent in Q1 2015 from 1.4 percent in Q4 2014 due mainly to lower prices of electricity, gas, and other fuels (-8.7 percent from -2.7 percent) and operation of personal transport equipment (-10.5 percent from -2.2 percent). Inflation on electricity, gas, and other fuels declined on lower generation charges as well as price reductions in kerosene and LPG. Meanwhile, reduction in the pump prices of diesel and gasoline (reflecting declines in international oil prices) led to the fall in inflation in personal transport equipment.
5
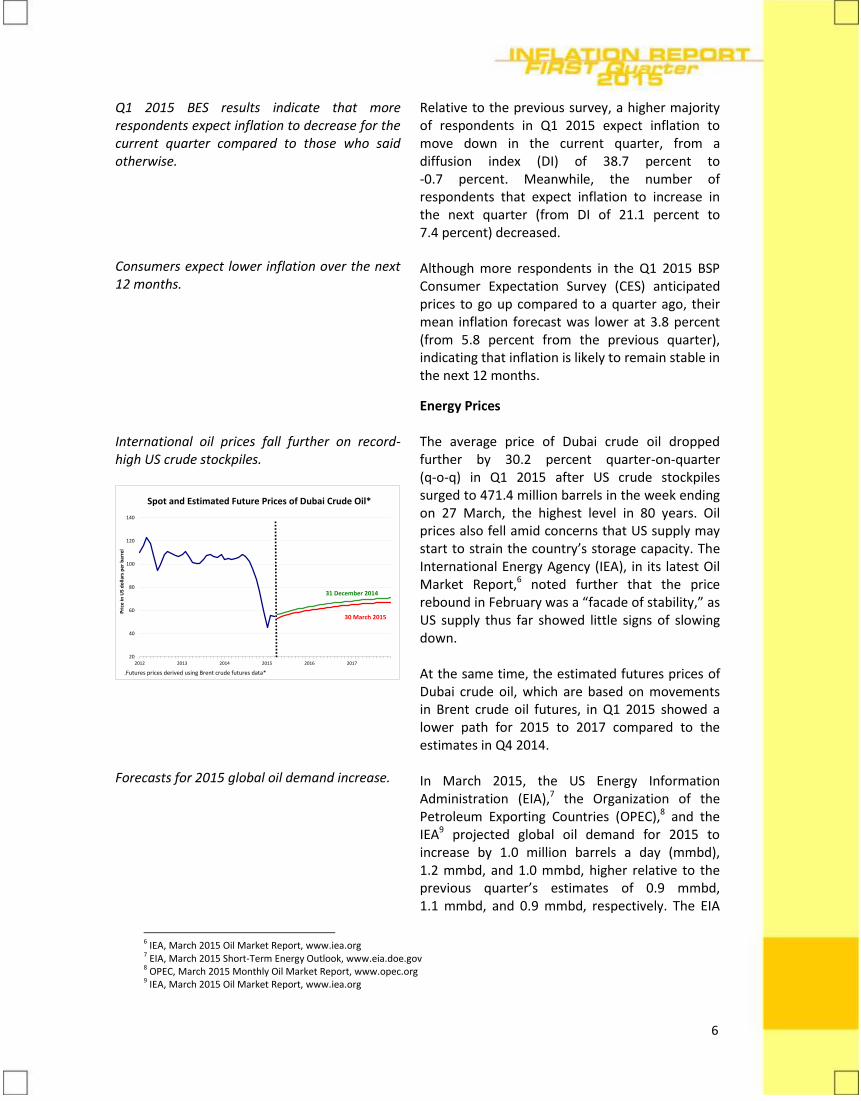
Private Sector Economists’ Inflation Forecasts Mean inflation forecasts for 2015-2016 are lower.
1.0
2.0
3.0
4.0
5.0
Jan Feb Mar Apr May June July Aug Sep Oct Nov Dec Jan Feb Mar
2014 2015
2015 2016 2017 target range
BSP Private Sector Economists' Survey Mean forecast for full year, in percent
2015: 2.7
2016/2017: 3.3
2017
Q2 Q3 FY FY FY
1) Al-Amanah Islamic Bank 2.40 2.50 2.50 3.00 3.00
2) Asia ING 2.90 2.60 2.80 3.30 3.70
3) Banco De Oro 2.22 1.57 2.50 3.00 3.50
4) Bangkok Bank 2.50 2.70 2.60 3.50 4.00
5) Bank of Commerce 2.40 2.40 2.40 - -
6) Bank of China 2.50 2.70 2.70 3.00 3.00
7) Bank of the Philippine Islands 2.90 2.80 2.90 - -
8) Barclays 2.40 2.00 2.30 3.50 -
9) Chinabank 3.00 2.90 3.10 3.40 3.30
10) CTBC Bank 2.40 2.70 2.80 3.00 3.00
11) Deutsche Bank - - 2.50 3.50 -
12) Eastwest Bank 2.30 2.50 2.50 2.60 2.90
13) Global Source 2.70 2.60 2.80 3.40 -
14) IDEA 2.40 2.40 2.60 4.40 4.10
15) Korea Exchange Bank 2.70 2.80 2.80 2.70 2.70
16) Land Bank of the Phils 2.1-2.4 2.2-2.5 2.3-2.6 2.5-3.0 2.5-3.0
17) Maybank 3.00 3.10 3.20 3.50 3.50
18) Maybank-ATR KimEng 3.50 3.70 3.30 - -
19) Metrobank - - 2.80 3.90 3.70
20) Multinat'l Inv. Banc 2.80 3.00 2.75 3.00 -
21) Mizuho 2.40 2.50 2.50 2.60 2.70
22) Nomura 2.60 2.50 2.50 3.20 -
23) Philippine Equity Parners 2.50 2.50 2.60 3.70
24) RCBC 2.4-2.9 2.0-2.5 2.3-2.8 3.4-3.9 3.0-3.5
25) Robinsons Bank 3.0-3.5 3.0-3.5 3.0-4.0 2.5-3.5 2.5-3.5
26) Security Bank 2.50 2.60 2.80 - -
27) Standard Chartered 2.50 2.20 3.20 3.70 3.30
28) Union Bank 2.70 2.80 3.00 3.30 3.60
Median Forecast 2.5 2.6 2.7 3.3 3.3
Mean Forecast 2.6 2.6 2.7 3.3 3.3
High 3.5 3.7 3.5 4.4 4.1
Low 2.3 1.6 2.3 2.6 2.7
Number of observations 25 26 28 23 18
Government Target 3.0±1.0 3.0±1.0 3.0±1.0 3.0±1.0 3.0±1.0
20162015
Annual Percent Change
Private Sector Forecasts for Inflation, March 2015
0.0
10.0
20.0
30.0
40.0
50.0
60.0
70.0
80.0
90.0
100.0
<1 1.0-2.0 2.1-3.0 3.1-4.0 4.1-5.0 5.1-6.0 6.1-7.0 7.1-8.0
Probability Distribution For Analysts' Inflation Forecasts*2015-2017
2015 2016 2017
*Probability distributions were averages of those provided by 22 out of 28 respondents.
(Source: BSP Survey)
Results of the BSP’s survey of private sector economists for March 2015 yielded lower mean inflation forecasts for 2015-2016 relative to the results in December 2014.4 In particular, the mean inflation forecast for 2015 was lower at 2.7 percent (from 3.6 percent in December 2014). Similarly, the mean inflation forecast for 2016 declined to 3.3 percent (from 3.7 percent). The inflation forecast for 2017 was at 3.3 percent. The analysts attributed their lower inflation expectations mainly to the decline of international oil prices, which led to the reduction in minimum jeepney fares and flagdown rate of taxis for the entire country. Based on the probability distributions of the forecasts provided by the respondents, a 56.3-percent chance is ascribed to average inflation for 2015 settling within the 2.1-3.0 percent range. Meanwhile, there is a 29.4 percent probability that average inflation for 2015 could be within 3.1-4.0 percent. Results of the March 2015 Consensus Economics inflation forecast survey for the country also showed lower inflation forecast for 2015 at 2.7 percent (from 3.6 percent in December 2014).5 The inflation forecast for 2016 was at 3.5 percent.
4 There were 28 respondents in the BSP’s survey of private sector economists in March 2015. 5 There were 21 respondents in the Consensus Economics’ survey in March 2015.
6
Q1 2015 BES results indicate that more respondents expect inflation to decrease for the current quarter compared to those who said otherwise. Consumers expect lower inflation over the next 12 months.
Relative to the previous survey, a higher majority of respondents in Q1 2015 expect inflation to move down in the current quarter, from a diffusion index (DI) of 38.7 percent to -0.7 percent. Meanwhile, the number of respondents that expect inflation to increase in the next quarter (from DI of 21.1 percent to 7.4 percent) decreased. Although more respondents in the Q1 2015 BSP Consumer Expectation Survey (CES) anticipated prices to go up compared to a quarter ago, their mean inflation forecast was lower at 3.8 percent (from 5.8 percent from the previous quarter), indicating that inflation is likely to remain stable in the next 12 months.
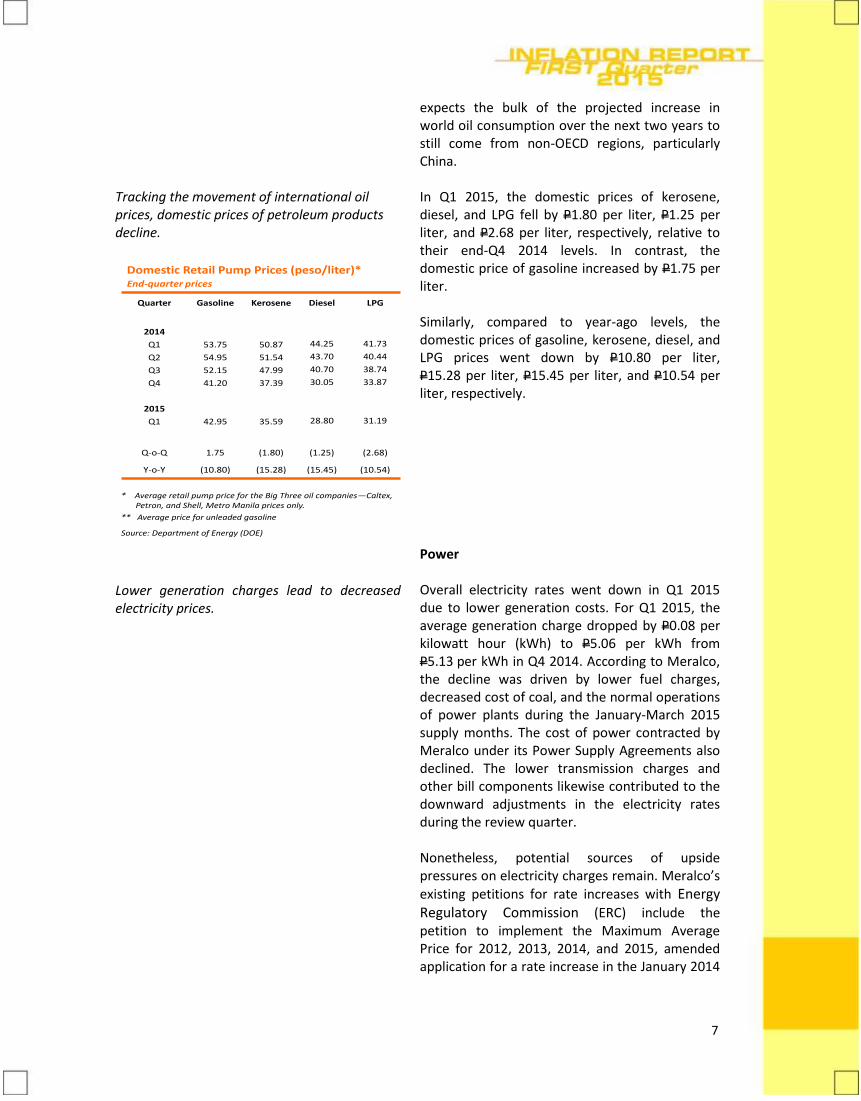
International oil prices fall further on record-high US crude stockpiles.
20
40
60
80
100
120
140
2012 2013 2014 2015 2016 2017
Pri
ce in
US
do
llars
per
bar
rel
Spot and Estimated Future Prices of Dubai Crude Oil*
*Futures prices derived using Brent crude futures data.
31 December 2014
30 March 2015
Forecasts for 2015 global oil demand increase.
Energy Prices The average price of Dubai crude oil dropped further by 30.2 percent quarter-on-quarter (q-o-q) in Q1 2015 after US crude stockpiles surged to 471.4 million barrels in the week ending on 27 March, the highest level in 80 years. Oil prices also fell amid concerns that US supply may start to strain the country’s storage capacity. The International Energy Agency (IEA), in its latest Oil Market Report,6 noted further that the price rebound in February was a “facade of stability,” as US supply thus far showed little signs of slowing down. At the same time, the estimated futures prices of Dubai crude oil, which are based on movements in Brent crude oil futures, in Q1 2015 showed a lower path for 2015 to 2017 compared to the estimates in Q4 2014. In March 2015, the US Energy Information Administration (EIA),7 the Organization of the Petroleum Exporting Countries (OPEC),8 and the IEA9 projected global oil demand for 2015 to increase by 1.0 million barrels a day (mmbd), 1.2 mmbd, and 1.0 mmbd, higher relative to the previous quarter’s estimates of 0.9 mmbd, 1.1 mmbd, and 0.9 mmbd, respectively. The EIA
6 IEA, March 2015 Oil Market Report, www.iea.org 7 EIA, March 2015 Short-Term Energy Outlook, www.eia.doe.gov 8 OPEC, March 2015 Monthly Oil Market Report, www.opec.org 9 IEA, March 2015 Oil Market Report, www.iea.org
7
Tracking the movement of international oil prices, domestic prices of petroleum products decline.
Domestic Retail Pump Prices (peso/liter)*End-quarter prices
Quarter Gasoline Kerosene Diesel LPG
2014
Q1
Q2
Q3
Q4
2015
Q1
53.75
54.95
52.15
41.20
42.95
50.87
51.54
47.99
37.39
35.59
44.25
43.70
40.70
30.05
28.80
41.73
40.44
38.74
33.87
31.19
Q-o-Q 1.75 (1.80) (1.25) (2.68)
Y-o-Y (10.80) (15.28) (15.45) (10.54)
* Average retail pump price for the Big Three oil companies—Caltex, Petron, and Shell, Metro Manila prices only.
** Average price for unleaded gasoline
Source: Department of Energy (DOE)
Lower generation charges lead to decreased electricity prices.
expects the bulk of the projected increase in world oil consumption over the next two years to still come from non-OECD regions, particularly China. In Q1 2015, the domestic prices of kerosene, diesel, and LPG fell by P1.80 per liter, P1.25 per liter, and P2.68 per liter, respectively, relative to their end-Q4 2014 levels. In contrast, the domestic price of gasoline increased by P1.75 per liter. Similarly, compared to year-ago levels, the domestic prices of gasoline, kerosene, diesel, and LPG prices went down by P10.80 per liter, P15.28 per liter, P15.45 per liter, and P10.54 per liter, respectively. Power Overall electricity rates went down in Q1 2015 due to lower generation costs. For Q1 2015, the average generation charge dropped by P0.08 per kilowatt hour (kWh) to P5.06 per kWh from P5.13 per kWh in Q4 2014. According to Meralco, the decline was driven by lower fuel charges, decreased cost of coal, and the normal operations of power plants during the January-March 2015 supply months. The cost of power contracted by Meralco under its Power Supply Agreements also declined. The lower transmission charges and other bill components likewise contributed to the downward adjustments in the electricity rates during the review quarter. Nonetheless, potential sources of upside pressures on electricity charges remain. Meralco’s existing petitions for rate increases with Energy Regulatory Commission (ERC) include the petition to implement the Maximum Average Price for 2012, 2013, 2014, and 2015, amended application for a rate increase in the January 2014
8
Water rates increase on higher foreign exchange costs.
billing (consisting of incremental fuel costs and deferred generation cost to be collected monthly for six months); and petitions for the refund of generation over/under recovery (GOUR), transmission over/under recovery (TOUR), system loss over/under recovery (SLOUR), and lifeline subsidy over/under recovery (LSOUR) for the period January-December 2011. In addition, the Power Sector Assets and Liabilities Management’s (PSALM) has several pending petitions with ERC for the recovery of True-Up Adjustments of Fuel and Purchased Power Costs (TAFPPC), Foreign Exchange Related Costs (TAFxA) and Purchased Power Costs and Foreign Exchange Related Costs by the National Power Corporation (NPC), and NPC’s Stranded Debt portion of the universal charge. Likewise, the National Grid Corporation of the Philippines (NGCP) also filed several petitions to recover connection charges and residual sub-transmission charges for 2011-2013 and the costs of repair on damages caused by force majeure events such as earthquake, flooding, landslides, and lightning incidents that struck the country in 2011-2012. Meanwhile, the Department of Energy (DOE) noted that rates are expected to increase during the summer months of 2015 (April and May) due to the scheduled Malampaya10 facility shutdown. To help abate the looming power shortage, the House of the Representatives and the Senate are expected to issue a joint resolution to grant emergency power to the President. Meanwhile, electricity rates are expected to increase as power plants relying on natural gas will be compelled to shift to more expensive liquid fuel as they are dependent on the natural gas Malampaya supplies. Water All-in-water tariff by both Maynilad Water Services, Inc. (MWSI) and Manila Water Company, Inc. (MWCI) increased by 1.1 percent and
10 The Malampaya Deep Water Gas-to-Power Project is a joint undertaking of the National Government and the private sector, spearheaded by the Department of Energy, developed and operated by Shell Philippines Exploration B.V. (SPEX) on behalf of the joint venture partners Chevron Malampaya LLC and the PNOC Exploration Corporation. The Malampaya project harnesses natural gas (as an alternative for imported fuel) from the deepwater reservoir northwest of Palawan, which provides 2,700 megawatts of electricity for the country’s domestic and industrial power requirements.Malampaya supplies up to 40 percent of natural gas requirement of the three power plants in Luzon. The plant held its maintenance shutdown from 11 November to 10 December 2013.
9
3.1 percent, respectively, in Q1 2015 as a result of the adjustment to cover foreign exchange costs (i.e. foreign currency differential adjustment or FCDA). The Metropolitan Waterworks and Sewerage System-Regulatory Office (MWSS-RO) reported that the Q1 2015 FCDA by MWSI and MWCI are P0.38 per cubic meter and P0.36 per cubic meter, respectively.
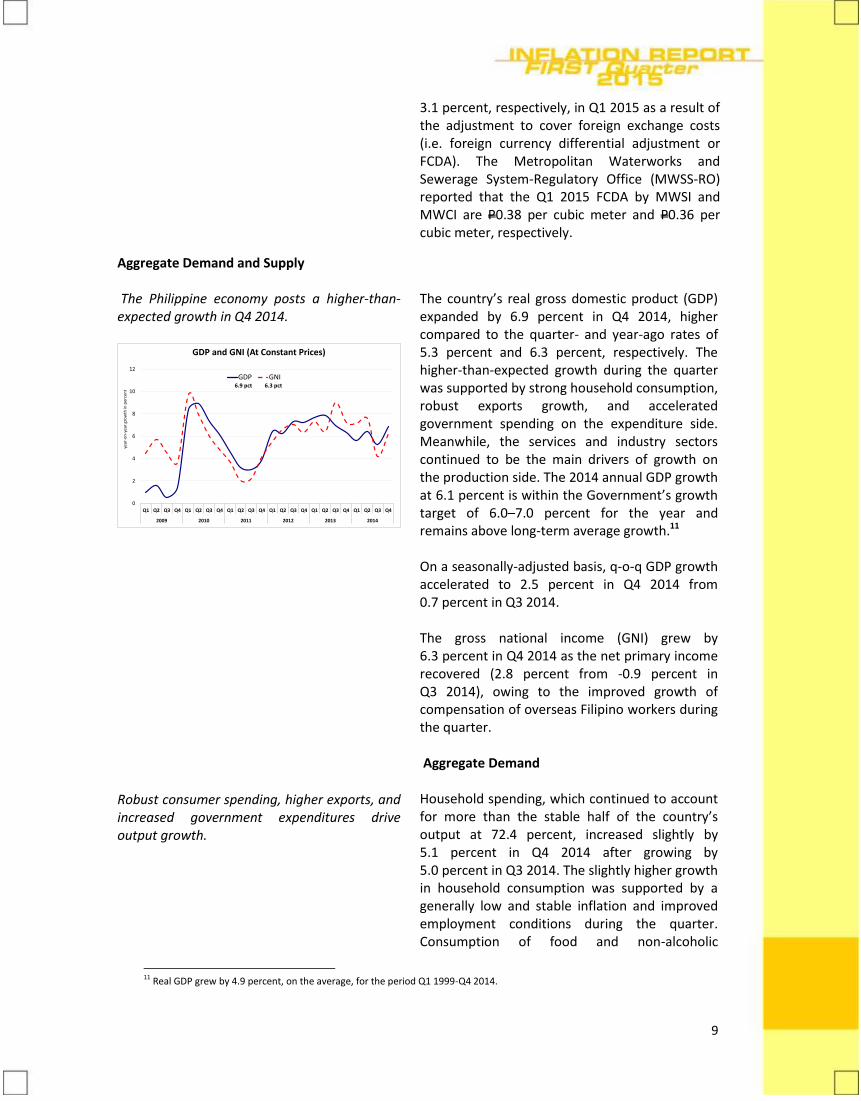
Aggregate Demand and Supply The Philippine economy posts a higher-than-expected growth in Q4 2014.
0
2
4
6
8
10
12
Q1 Q2 Q3 Q4 Q1 Q2 Q3 Q4 Q1 Q2 Q3 Q4 Q1 Q2 Q3 Q4 Q1 Q2 Q3 Q4 Q1 Q2 Q3 Q4
2009 2010 2011 2012 2013 2014
year
-on
-yea
r gr
ow
th in
per
cen
t
GDP and GNI (At Constant Prices)
GDP GNI6.9 pct 6.3 pct
Robust consumer spending, higher exports, and increased government expenditures drive output growth.
The country’s real gross domestic product (GDP) expanded by 6.9 percent in Q4 2014, higher compared to the quarter- and year-ago rates of 5.3 percent and 6.3 percent, respectively. The higher-than-expected growth during the quarter was supported by strong household consumption, robust exports growth, and accelerated government spending on the expenditure side. Meanwhile, the services and industry sectors continued to be the main drivers of growth on the production side. The 2014 annual GDP growth at 6.1 percent is within the Government’s growth target of 6.0–7.0 percent for the year and remains above long-term average growth.11
On a seasonally-adjusted basis, q-o-q GDP growth accelerated to 2.5 percent in Q4 2014 from 0.7 percent in Q3 2014.
The gross national income (GNI) grew by 6.3 percent in Q4 2014 as the net primary income recovered (2.8 percent from -0.9 percent in Q3 2014), owing to the improved growth of compensation of overseas Filipino workers during the quarter. Aggregate Demand Household spending, which continued to account for more than the stable half of the country’s output at 72.4 percent, increased slightly by 5.1 percent in Q4 2014 after growing by 5.0 percent in Q3 2014. The slightly higher growth in household consumption was supported by a generally low and stable inflation and improved employment conditions during the quarter. Consumption of food and non-alcoholic
11 Real GDP grew by 4.9 percent, on the average, for the period Q1 1999-Q4 2014.
10
-40
-30
-20
-10
0
10
20
30
40
50
60
Q1 Q2 Q3 Q4 Q1 Q2 Q3 Q4 Q1 Q2 Q3 Q4 Q1 Q2 Q3 Q4 Q1 Q2 Q3 Q4 Q1 Q2 Q3 Q4
2009 2010 2011 2012 2013 2014
year
-on
-yea
r gr
ow
th in
per
cen
t
GDP-Expenditure (At Constant Prices)
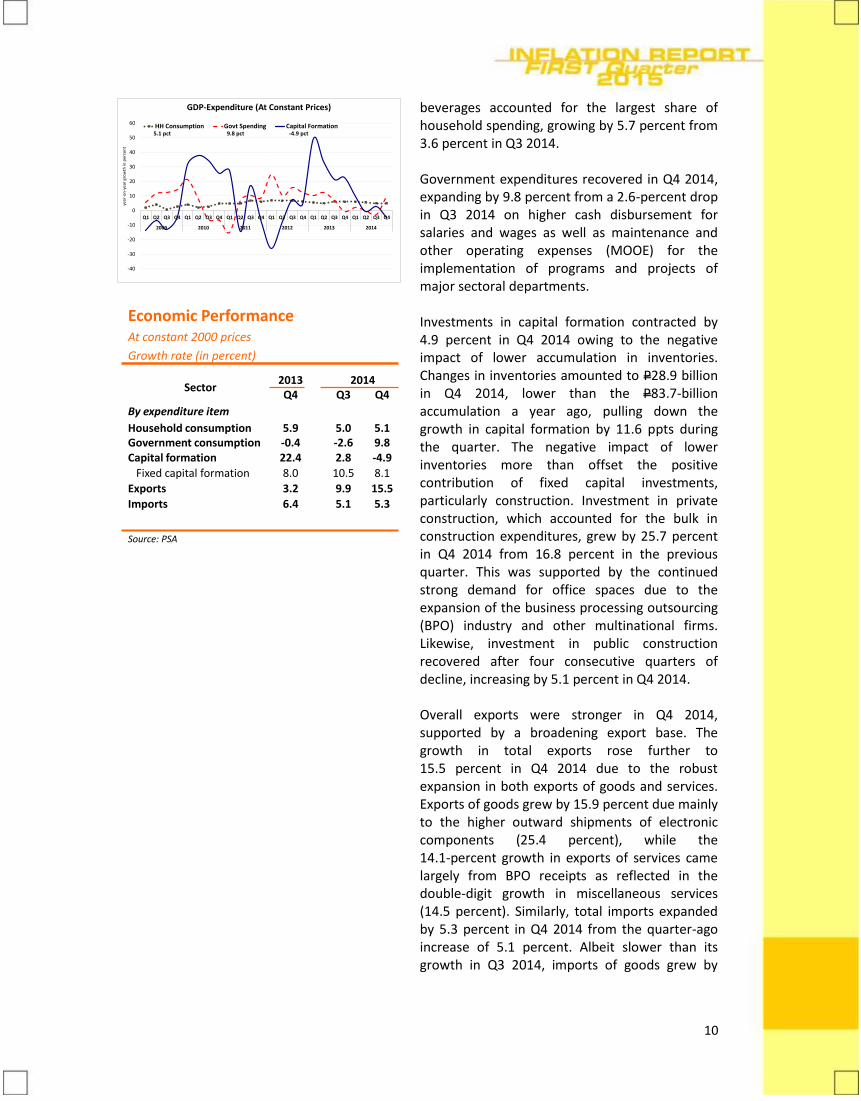
HH Consumption Govt Spending Capital Formation5.1 pct 9.8 pct -4.9 pct
Economic PerformanceAt constant 2000 prices
Growth rate (in percent)
Sector 2013 2014Q4 Q3 Q4
By expenditure item
Household consumption 5.9 5.0 5.1Government consumption -0.4 -2.6 9.8Capital formation 22.4 2.8 -4.9
Fixed capital formation 8.0 10.5 8.1
Exports 3.2 9.9 15.5
Imports 6.4 5.1 5.3
Source: PSA
beverages accounted for the largest share of household spending, growing by 5.7 percent from 3.6 percent in Q3 2014. Government expenditures recovered in Q4 2014, expanding by 9.8 percent from a 2.6-percent drop in Q3 2014 on higher cash disbursement for salaries and wages as well as maintenance and other operating expenses (MOOE) for the implementation of programs and projects of major sectoral departments. Investments in capital formation contracted by 4.9 percent in Q4 2014 owing to the negative impact of lower accumulation in inventories. Changes in inventories amounted to P28.9 billion in Q4 2014, lower than the P83.7-billion accumulation a year ago, pulling down the growth in capital formation by 11.6 ppts during the quarter. The negative impact of lower inventories more than offset the positive contribution of fixed capital investments, particularly construction. Investment in private construction, which accounted for the bulk in construction expenditures, grew by 25.7 percent in Q4 2014 from 16.8 percent in the previous quarter. This was supported by the continued strong demand for office spaces due to the expansion of the business processing outsourcing (BPO) industry and other multinational firms. Likewise, investment in public construction recovered after four consecutive quarters of decline, increasing by 5.1 percent in Q4 2014. Overall exports were stronger in Q4 2014, supported by a broadening export base. The growth in total exports rose further to 15.5 percent in Q4 2014 due to the robust expansion in both exports of goods and services. Exports of goods grew by 15.9 percent due mainly to the higher outward shipments of electronic components (25.4 percent), while the 14.1-percent growth in exports of services came largely from BPO receipts as reflected in the double-digit growth in miscellaneous services (14.5 percent). Similarly, total imports expanded by 5.3 percent in Q4 2014 from the quarter-ago increase of 5.1 percent. Albeit slower than its growth in Q3 2014, imports of goods grew by
11
3.6 percent on higher inward shipments of mineral fuels and artificial resins. Meanwhile, the growth in imports of services increased further to 10.8 percent on higher travel and miscellaneous services.
Recent indicators of activity remain generally positive. Implied land values continue to trend higher.
Other Demand Indicators
Trends in higher-frequency demand indicators likewise point to sustained economic upturn in the near term. Vehicle sales continued to post double-digit growth on brisk consumer spending amid attractive financing packages, while the composite PMI remained on an uptrend, firmly above the 50-point expansion threshold. Business and consumer sentiment also indicate generally favorable perception on domestic economic conditions, supporting the view that the growth impetus remains strong amid robust credit growth and steady improvements in employment conditions. At the same time, domestic demand is likely to receive a further boost from the government’s commitment to ramp up public spending as well as anticipated spending in preparation for the 2016 elections. Property Prices Land Values, Metro Manila
Data from Colliers International indicated that implied land values12 in the Makati CBD and Ortigas Center appreciated in Q4 2014 from quarter- and year-ago levels. Implied land values in the Makati CBD reached P440,000/sq.m. in Q4 2014, higher by 1.1 percent and 28.8 percent relative to the levels recorded in Q3 2014 and Q4 2013, respectively. Similarly, implied land values in the Ortigas Center rose by 2.9 percent q-o-q and 9.6 percent year-on-year (y-o-y) to P158,500/sq.m. Land values in the Makati CBD were slightly above their 1997 levels in nominal terms, but only about 45.6 percent of their 1997 levels in real terms. Meanwhile, land values in the Ortigas Center were lower than their comparable levels in 1997 in both nominal and real terms by about 81.3 percent and 35.8 percent, respectively.
12 In the absence of reported closed transactions, implied land values based on trends are used by Colliers International to monitor prices.
12
Office vacancy rate increases slightly amid continued strong demand for office space. Residential vacancy rate is broadly unchanged on increased occupancy of high-rise residential units. Office rental values rise further. Residential rental values increase slightly.
Vacancy Rates, Metro Manila The office vacancy rate in the Makati CBD increased slightly to 2.0 percent in Q4 2014 from the previous quarter level of 1.9 percent. However, the office vacancy rate in Q4 2014 was lower than the 2.3 percent recorded a year ago due to continued strong office demand in the Makati CBD. Office vacancy rate is estimated by Colliers to narrow further to 1.6 percent in Q4 2015. The residential vacancy rate in the Makati CBD was broadly steady at 8.1 percent in Q4 2014 relative to quarter-ago level. Nonetheless, the residential vacancy rate in Q4 2014 was lower than the year-ago level of 9.8 percent due to the strong take-up of Grades A and B high-rise residential projects. According to Colliers, the residential vacancy rate in the Makati CBD is expected to rise to 10.7 percent in Q4 2015 as more residential units will be completed by 2015. Rental Values, Metro Manila13 Monthly Grade A office14 rents in the Makati CBD reached P850/sq.m. in Q4 2014, representing an increase of 1.2 percent from the previous quarter.
Similarly, monthly Grade A office rents in the Makati CBD were higher by 9.3 percent relative to Q4 2013. Office rental values for Grade A offices were slightly above their 1997 levels in nominal terms. In real terms, office rental values were about 48.2 percent of the comparable levels in 1997.
Monthly rents for luxury three-bedroom condominium units in the Makati CBD rose to P838/sq.m. in Q4 2014 or a 0.9 percent growth from the previous quarter. Likewise, monthly rents for the 3-bedroom segment were higher by 4.0 percent compared to the year-ago levels. Residential rental values for luxury three-bedroom high-rise units were above their 1997 levels in nominal terms but were only about 77.6 percent of their 1997 levels in real terms.
13 Housing rentals account for 13.8 percent of the 2006-based CPI basket. The NSO only surveys rentals ranging from around P300-P10,000/month to compute rent inflation. However, the rental values discussed in this section pertain to high-end rented properties, which may be considered as indicators of wealth and demand. 14 Grade A refers to office space with capital values between P65,000 and P75,000/sq.m.
13
Capital values for office and residential buildings are higher.
Capital Values, Metro Manila Capital values15 for office buildings in the Makati CBD in Q4 2014 were higher in nominal terms than their quarter- and year-ago levels. Grade A office capital values in the Makati CBD rose to P98,000/sq.m., higher by 1.7 percent and by 9.4 percent compared to the quarter- and year-ago levels, respectively. Grade A office capital values were also higher than the 1997 levels in nominal terms. Nevertheless, in real terms, office capital values were about 54.3 percent of the comparable levels in 1997. Capital values for luxury residential buildings16 in Makati CBD in Q4 2014 increased from their quarter- and year-ago levels. Average prices for three-bedroom luxury residential condominium units increased by 1.2 percent q-o-q and 7.1 percent y-o-y. Capital values for luxury residential buildings were above their 1997 levels in nominal terms. In real terms, residential capital values were about 65.2 percent of the comparable levels in 1997.
Strong vehicle sales reflect brisk consumer spending.
Vehicle Sales Vehicle sales17 posted a double-digit growth in the first two months of 2015. Vehicle sales grew by 21.1 percent y-o-y from a 30.3 percent growth recorded in Q4 2014. According to CAMPI, the brisk growth in car sales was driven by sustained strong demand that is supported by attractive financing packages offered by industry players. Passenger car sales from CAMPI members grew by 40.6 percent y-o-y in January-February 2015, accruing to a total of 15,349 from 10,918 units sold in the same period in 2014.
15 Probable price that the property would have fetched if sold on the date of the valuation. The valuation includes imputed land and building value. 16 In terms of location, luxury residential units are located within the CBD core and have quality access to/from and have superior visibility from the main avenue. Meanwhile, in terms of general finish, luxury residential units have premium presentation and maintenance. 17 Vehicle sales data is gathered on a monthly basis by the Chamber of Automotive Manufacturers of the Philippines (CAMPI). CAMPI represents the local assemblers and manufacturers of vehicle units in the Philippine automotive industry. The following are the active members of CAMPI: (1) Asian Carmakers Corp., (2) CATS Motors, Inc., (3) Columbian Autocar Corp., (4) Honda Cars Philippines, Inc., (5) Isuzu Philippines Corp., (6) Mitsubishi Motors Philippines Corp., (7) Nissan Motor Philippines Corp., (8) Suzuki Philippines Inc., (9) Toyota Motor Philippines Corp. and (10) Universal Motors Corp.
14
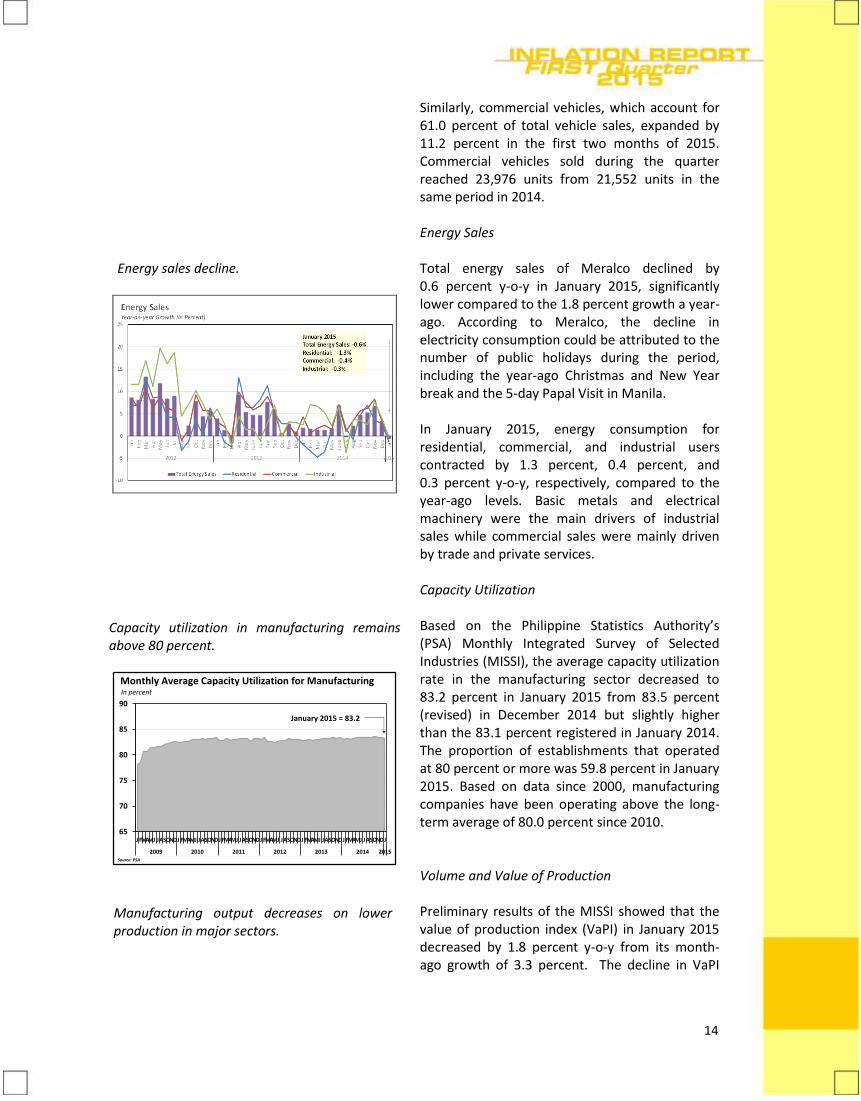
Energy sales decline.
Capacity utilization in manufacturing remains above 80 percent.
65
70
75
80
85
90
J FMAMJ JASONDJ FMAMJ JASONDJ FMAMJ JASONDJ FMAMJ JASONDJ FMAMJ JASONDJ FMAMJ JASONDJ
2009 2010 2011 2012 2013 2014 2015
Monthly Average Capacity Utilization for ManufacturingIn percent
January 2015 = 83.2
Source: PSA Manufacturing output decreases on lower production in major sectors.
Similarly, commercial vehicles, which account for 61.0 percent of total vehicle sales, expanded by 11.2 percent in the first two months of 2015. Commercial vehicles sold during the quarter reached 23,976 units from 21,552 units in the same period in 2014. Energy Sales
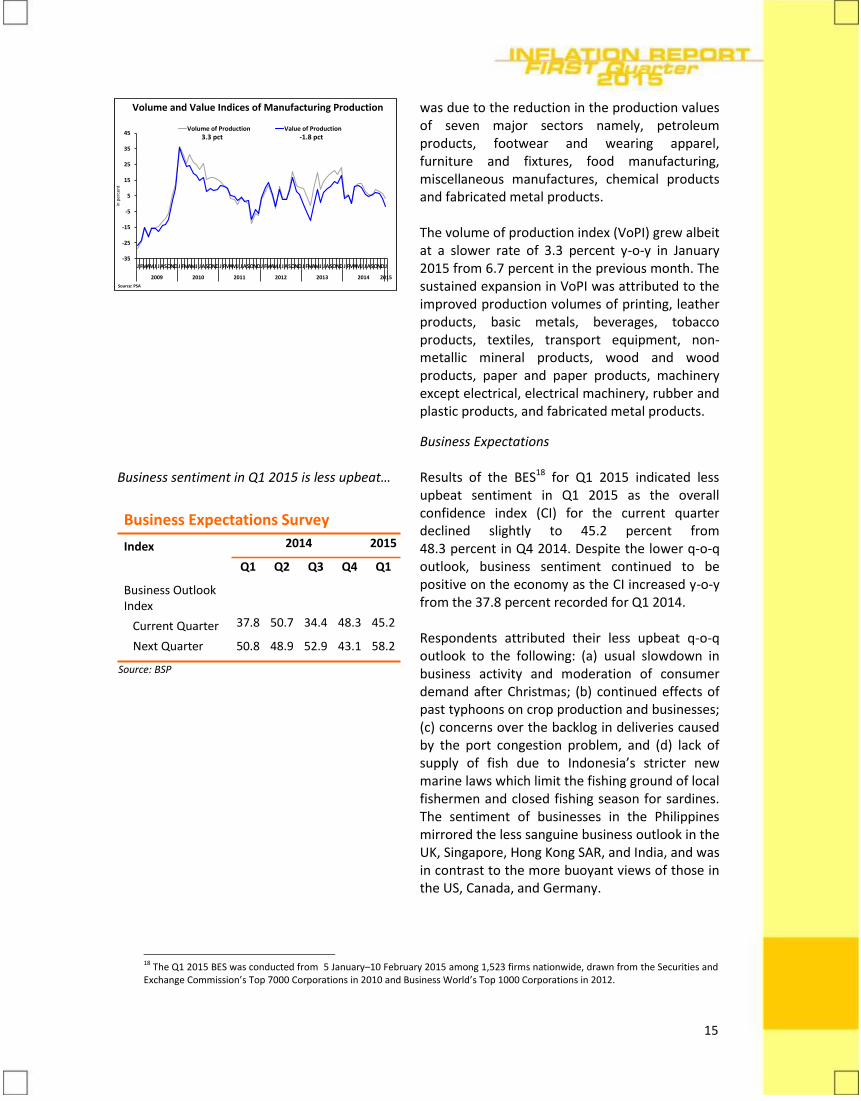
Total energy sales of Meralco declined by 0.6 percent y-o-y in January 2015, significantly lower compared to the 1.8 percent growth a year-ago. According to Meralco, the decline in electricity consumption could be attributed to the number of public holidays during the period, including the year-ago Christmas and New Year break and the 5-day Papal Visit in Manila. In January 2015, energy consumption for residential, commercial, and industrial users contracted by 1.3 percent, 0.4 percent, and 0.3 percent y-o-y, respectively, compared to the year-ago levels. Basic metals and electrical machinery were the main drivers of industrial sales while commercial sales were mainly driven by trade and private services. Capacity Utilization Based on the Philippine Statistics Authority’s (PSA) Monthly Integrated Survey of Selected Industries (MISSI), the average capacity utilization rate in the manufacturing sector decreased to 83.2 percent in January 2015 from 83.5 percent (revised) in December 2014 but slightly higher than the 83.1 percent registered in January 2014. The proportion of establishments that operated at 80 percent or more was 59.8 percent in January 2015. Based on data since 2000, manufacturing companies have been operating above the long-term average of 80.0 percent since 2010. Volume and Value of Production Preliminary results of the MISSI showed that the value of production index (VaPI) in January 2015 decreased by 1.8 percent y-o-y from its month-ago growth of 3.3 percent. The decline in VaPI
15
-35
-25
-15
-5
5
15
25
35
45
J FMAMJ J ASONDJ FMAMJ J ASONDJ FMAMJ J ASONDJ FMAMJ J ASONDJ FMAMJ J ASONDJ FMAMJ J ASONDJ
2009 2010 2011 2012 2013 2014 2015
in p
erce
nt
Volume of Production Value of Production
Source: PSA
Volume and Value Indices of Manufacturing Production
3.3 pct -1.8 pct
was due to the reduction in the production values of seven major sectors namely, petroleum products, footwear and wearing apparel, furniture and fixtures, food manufacturing, miscellaneous manufactures, chemical products and fabricated metal products. The volume of production index (VoPI) grew albeit at a slower rate of 3.3 percent y-o-y in January 2015 from 6.7 percent in the previous month. The sustained expansion in VoPI was attributed to the improved production volumes of printing, leather products, basic metals, beverages, tobacco products, textiles, transport equipment, non-metallic mineral products, wood and wood products, paper and paper products, machinery except electrical, electrical machinery, rubber and plastic products, and fabricated metal products.
Business sentiment in Q1 2015 is less upbeat…
Business Expectations Survey
Index 2014 2015
Q1 Q2 Q3 Q4 Q1
Business Outlook Index
Current Quarter 37.8 50.7 34.4 48.3 45.2
Next Quarter 50.8 48.9 52.9 43.1 58.2
Source: BSP
Business Expectations Results of the BES18 for Q1 2015 indicated less upbeat sentiment in Q1 2015 as the overall confidence index (CI) for the current quarter declined slightly to 45.2 percent from 48.3 percent in Q4 2014. Despite the lower q-o-q outlook, business sentiment continued to be positive on the economy as the CI increased y-o-y from the 37.8 percent recorded for Q1 2014. Respondents attributed their less upbeat q-o-q outlook to the following: (a) usual slowdown in business activity and moderation of consumer demand after Christmas; (b) continued effects of past typhoons on crop production and businesses; (c) concerns over the backlog in deliveries caused by the port congestion problem, and (d) lack of supply of fish due to Indonesia’s stricter new marine laws which limit the fishing ground of local fishermen and closed fishing season for sardines. The sentiment of businesses in the Philippines mirrored the less sanguine business outlook in the UK, Singapore, Hong Kong SAR, and India, and was in contrast to the more buoyant views of those in the US, Canada, and Germany.
18 The Q1 2015 BES was conducted from 5 January–10 February 2015 among 1,523 firms nationwide, drawn from the Securities and Exchange Commission’s Top 7000 Corporations in 2010 and Business World’s Top 1000 Corporations in 2012.
16
…but turns more optimistic in Q2 2015.
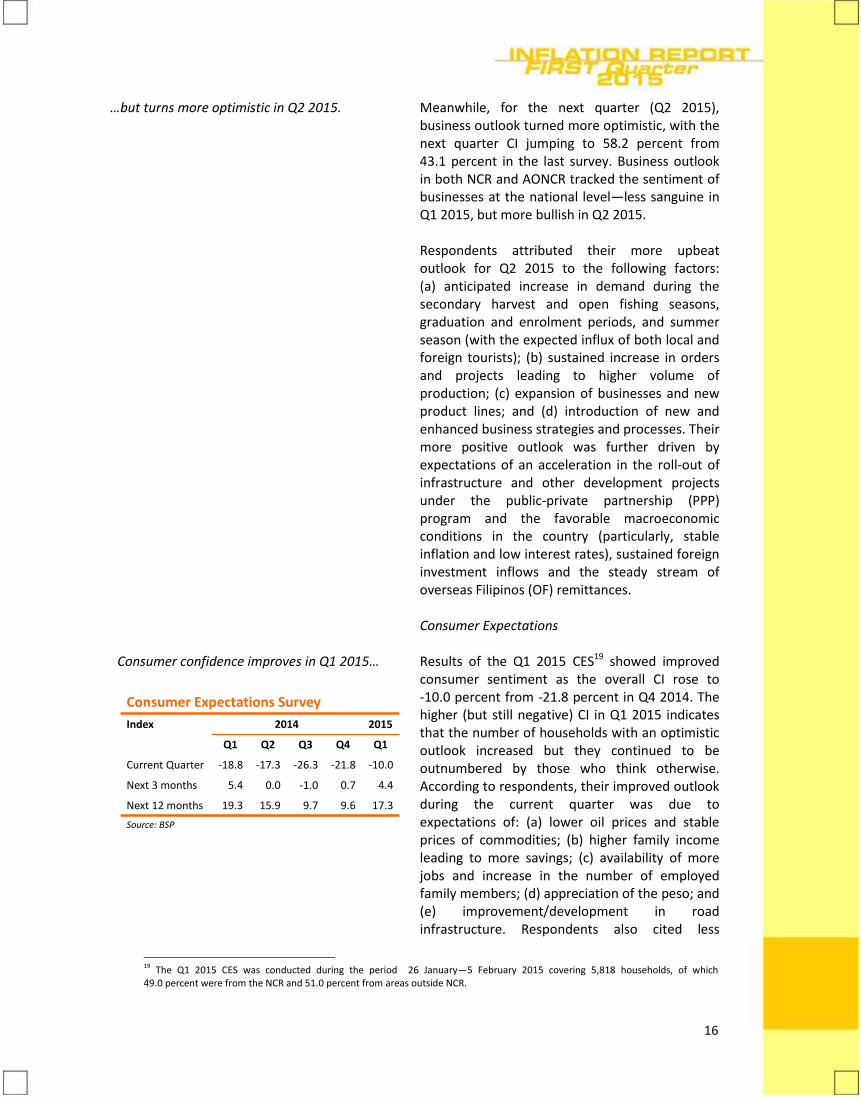
Consumer confidence improves in Q1 2015…
Consumer Expectations Survey
Index 2014 2015
Q1 Q2 Q3 Q4 Q1
Current Quarter -18.8 -17.3 -26.3 -21.8 -10.0
Next 3 months 5.4 0.0 -1.0 0.7 4.4
Next 12 months 19.3 15.9 9.7 9.6 17.3
Source: BSP
Meanwhile, for the next quarter (Q2 2015), business outlook turned more optimistic, with the next quarter CI jumping to 58.2 percent from 43.1 percent in the last survey. Business outlook in both NCR and AONCR tracked the sentiment of businesses at the national level—less sanguine in Q1 2015, but more bullish in Q2 2015. Respondents attributed their more upbeat outlook for Q2 2015 to the following factors: (a) anticipated increase in demand during the secondary harvest and open fishing seasons, graduation and enrolment periods, and summer season (with the expected influx of both local and foreign tourists); (b) sustained increase in orders and projects leading to higher volume of production; (c) expansion of businesses and new product lines; and (d) introduction of new and enhanced business strategies and processes. Their more positive outlook was further driven by expectations of an acceleration in the roll-out of infrastructure and other development projects under the public-private partnership (PPP) program and the favorable macroeconomic conditions in the country (particularly, stable inflation and low interest rates), sustained foreign investment inflows and the steady stream of overseas Filipinos (OF) remittances. Consumer Expectations Results of the Q1 2015 CES19 showed improved consumer sentiment as the overall CI rose to -10.0 percent from -21.8 percent in Q4 2014. The higher (but still negative) CI in Q1 2015 indicates that the number of households with an optimistic outlook increased but they continued to be outnumbered by those who think otherwise. According to respondents, their improved outlook during the current quarter was due to expectations of: (a) lower oil prices and stable prices of commodities; (b) higher family income leading to more savings; (c) availability of more jobs and increase in the number of employed family members; (d) appreciation of the peso; and (e) improvement/development in road infrastructure. Respondents also cited less
19 The Q1 2015 CES was conducted during the period 26 January—5 February 2015 covering 5,818 households, of which 49.0 percent were from the NCR and 51.0 percent from areas outside NCR.
17
…as well as for the next quarter and the year ahead.
calamities, less corruption in the government, and more assistance from government such as the Pantawid Pamilyang Pilipino Program (4Ps), as factors for their improving outlook. The sentiment of consumers in the Philippines mirrored the improved outlook of consumers in the euro area, Indonesia, Japan, South Korea, and Taiwan but was in contrast to the steady outlook in the United Kingdom and the less optimistic views of consumers in Australia, China, Thailand, and the United States for Q1 2015. For the next quarter (Q2 2015) and the year ahead, consumer sentiment continued to be more favorable as the next quarter CI increased and remained in the positive territory at 4.4 percent (from 0.7 percent in the previous quarter’s survey), while the year ahead CI jumped to 17.3 percent (from 9.6 percent in the previous quarter’s survey). This indicated that the number of consumers with favorable views increased and exceeded those with unfavorable views.
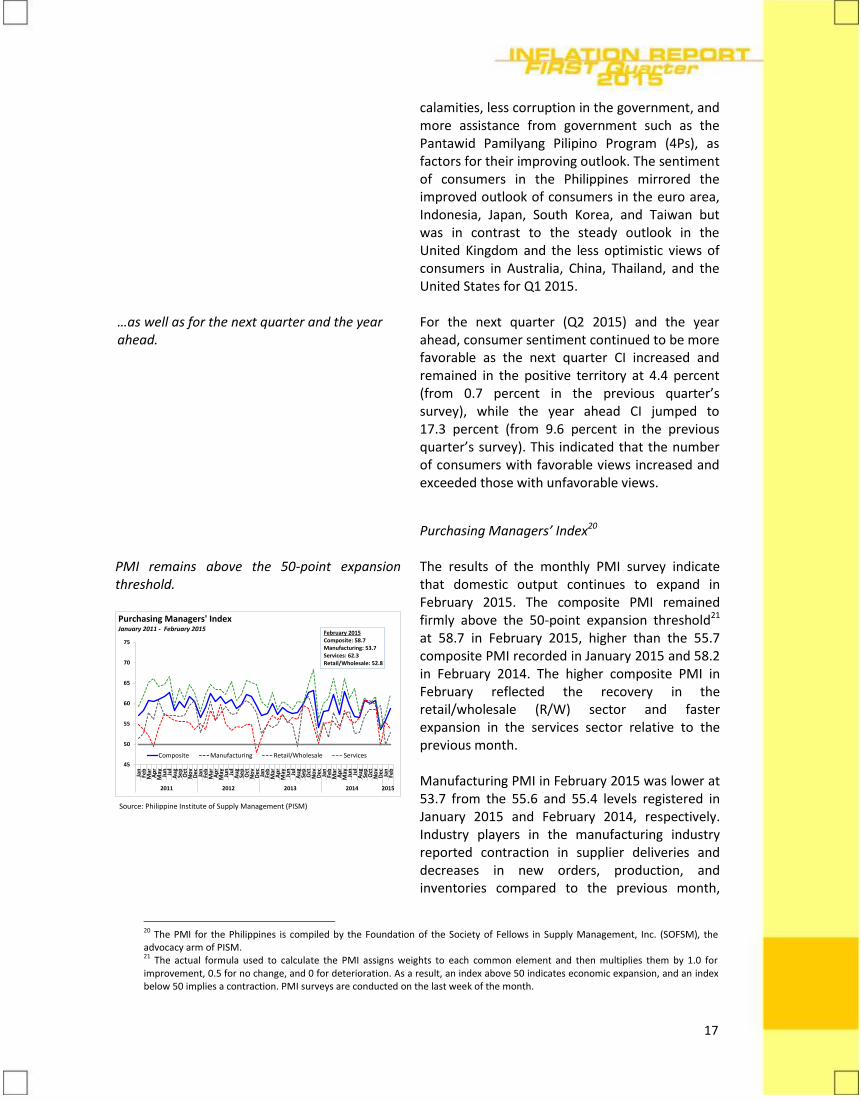
PMI remains above the 50-point expansion threshold.
45
50
55
60
65
70
75
Jan
Feb
Mar
Ap
rM
ay Jun
Jul
Au
gSe
pO
ctN
ov
De
cJa
nFe
bM
arA
pr
May Jun
Jul
Au
gSe
pO
ctN
ov
De
cJa
nFe
bM
arA
pr
May Jun
Jul
Au
gSe
pO
ctN
ov
De
cJa
nFe
bM
arA
pr
May Jun
Jul
Au
gSe
pO
ctN
ov
De
cJa
nFe
b
2011 2012 2013 2014 2015
Composite Manufacturing Retail/Wholesale Services
Purchasing Managers' IndexJanuary 2011 - February 2015
February 2015Composite: 58.7Manufacturing: 53.7Services: 62.3Retail/Wholesale: 52.8
Purchasing Managers’ Index20 The results of the monthly PMI survey indicate that domestic output continues to expand in February 2015. The composite PMI remained firmly above the 50-point expansion threshold21 at 58.7 in February 2015, higher than the 55.7 composite PMI recorded in January 2015 and 58.2 in February 2014. The higher composite PMI in February reflected the recovery in the retail/wholesale (R/W) sector and faster expansion in the services sector relative to the previous month. Manufacturing PMI in February 2015 was lower at 53.7 from the 55.6 and 55.4 levels registered in January 2015 and February 2014, respectively. Industry players in the manufacturing industry reported contraction in supplier deliveries and decreases in new orders, production, and inventories compared to the previous month,
20 The PMI for the Philippines is compiled by the Foundation of the Society of Fellows in Supply Management, Inc. (SOFSM), the advocacy arm of PISM. 21 The actual formula used to calculate the PMI assigns weights to each common element and then multiplies them by 1.0 for improvement, 0.5 for no change, and 0 for deterioration. As a result, an index above 50 indicates economic expansion, and an index below 50 implies a contraction. PMI surveys are conducted on the last week of the month.
Source: Philippine Institute of Supply Management (PISM)
18
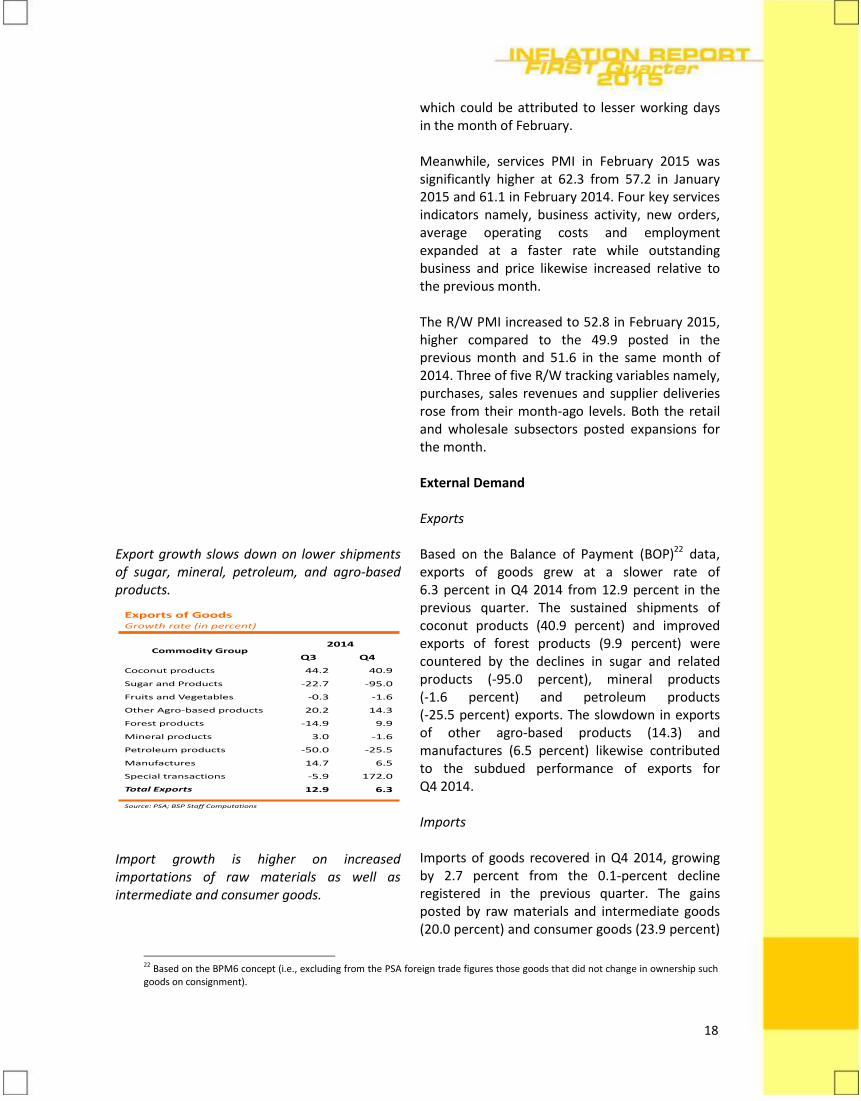
Export growth slows down on lower shipments of sugar, mineral, petroleum, and agro-based products.
Exports of GoodsGrowth rate (in percent)
Commodity Group2014
Q3 Q4
Coconut products 44.2 40.9
Sugar and Products -22.7 -95.0
Fruits and Vegetables -0.3 -1.6
Other Agro-based products 20.2 14.3
Forest products -14.9 9.9
Mineral products 3.0 -1.6
Petroleum products -50.0 -25.5
Manufactures 14.7 6.5
Special transactions -5.9 172.0
Total Exports 12.9 6.3
Source: PSA; BSP Staff Computations Import growth is higher on increased importations of raw materials as well as intermediate and consumer goods.
which could be attributed to lesser working days in the month of February. Meanwhile, services PMI in February 2015 was significantly higher at 62.3 from 57.2 in January 2015 and 61.1 in February 2014. Four key services indicators namely, business activity, new orders, average operating costs and employment expanded at a faster rate while outstanding business and price likewise increased relative to the previous month. The R/W PMI increased to 52.8 in February 2015, higher compared to the 49.9 posted in the previous month and 51.6 in the same month of 2014. Three of five R/W tracking variables namely, purchases, sales revenues and supplier deliveries rose from their month-ago levels. Both the retail and wholesale subsectors posted expansions for the month. External Demand Exports Based on the Balance of Payment (BOP)22 data, exports of goods grew at a slower rate of 6.3 percent in Q4 2014 from 12.9 percent in the previous quarter. The sustained shipments of coconut products (40.9 percent) and improved exports of forest products (9.9 percent) were countered by the declines in sugar and related products (-95.0 percent), mineral products (-1.6 percent) and petroleum products (-25.5 percent) exports. The slowdown in exports of other agro-based products (14.3) and manufactures (6.5 percent) likewise contributed to the subdued performance of exports for Q4 2014. Imports Imports of goods recovered in Q4 2014, growing by 2.7 percent from the 0.1-percent decline registered in the previous quarter. The gains posted by raw materials and intermediate goods (20.0 percent) and consumer goods (23.9 percent)
22 Based on the BPM6 concept (i.e., excluding from the PSA foreign trade figures those goods that did not change in ownership such goods on consignment).
19
Imports of GoodsGrowth rate (in percent)
Commodity Group2014
Q3 Q4
Capital Goods -4.1 -12.3
Raw Materials & Intermediate Goods
-10.0 20.0
Mineral Fuels & Lubricants 15.2 -17.5
Consumer Goods 17.2 23.9
Special Transactions -9.1 -53.8
Total Imports -0.1 2.7
Source: PSA; BSP Staff Computations
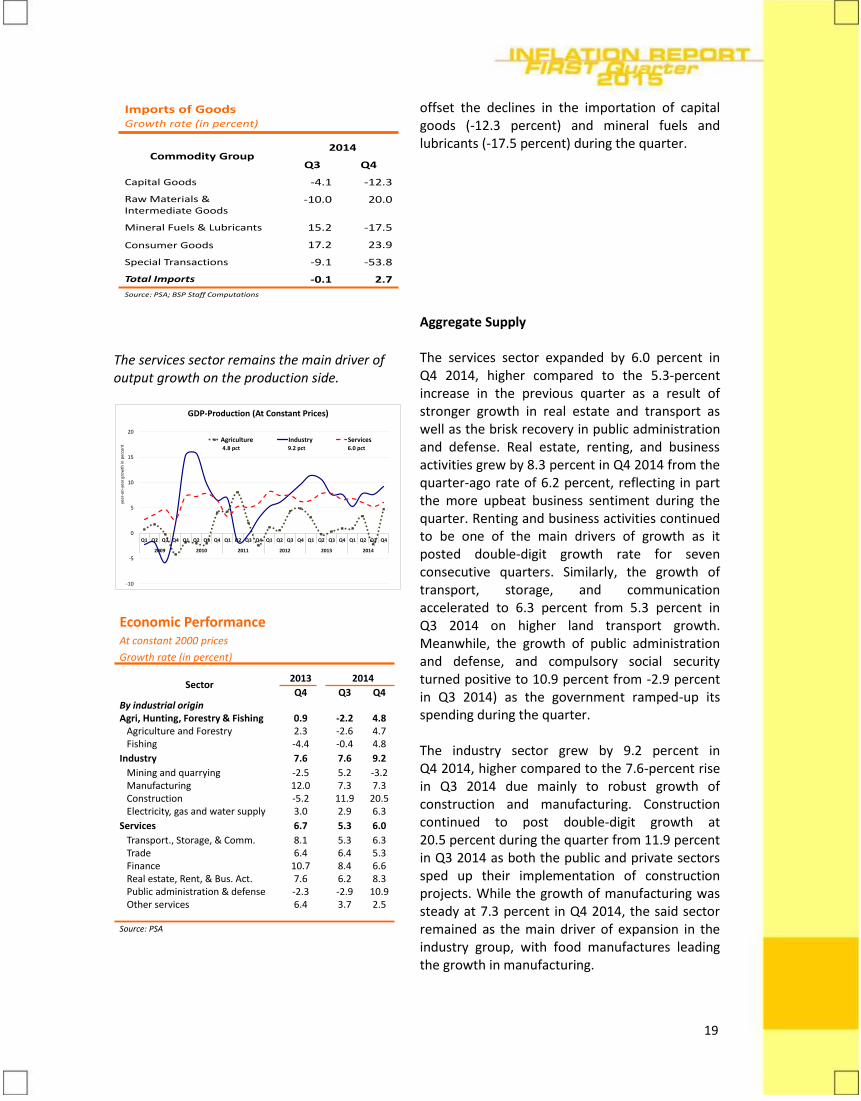
The services sector remains the main driver of output growth on the production side.
-10
-5
0
5
10
15
20
Q1 Q2 Q3 Q4 Q1 Q2 Q3 Q4 Q1 Q2 Q3 Q4 Q1 Q2 Q3 Q4 Q1 Q2 Q3 Q4 Q1 Q2 Q3 Q4
2009 2010 2011 2012 2013 2014
year
-on
-yea
r gr
ow
th in
per
cen
t
GDP-Production (At Constant Prices)
Agriculture Industry Services4.8 pct 9.2 pct 6.0 pct
Economic PerformanceAt constant 2000 prices
Growth rate (in percent)
Sector 2013 2014
Q4 Q3 Q4By industrial originAgri, Hunting, Forestry & Fishing 0.9 -2.2 4.8
Agriculture and Forestry 2.3 -2.6 4.7Fishing -4.4 -0.4 4.8
Industry 7.6 7.6 9.2
Mining and quarrying -2.5 5.2 -3.2Manufacturing 12.0 7.3 7.3Construction -5.2 11.9 20.5Electricity, gas and water supply 3.0 2.9 6.3
Services 6.7 5.3 6.0
Transport., Storage, & Comm. 8.1 5.3 6.3Trade 6.4 6.4 5.3Finance 10.7 8.4 6.6Real estate, Rent, & Bus. Act. 7.6 6.2 8.3Public administration & defense -2.3 -2.9 10.9Other services 6.4 3.7 2.5
Source: PSA
offset the declines in the importation of capital goods (-12.3 percent) and mineral fuels and lubricants (-17.5 percent) during the quarter. Aggregate Supply The services sector expanded by 6.0 percent in Q4 2014, higher compared to the 5.3-percent increase in the previous quarter as a result of stronger growth in real estate and transport as well as the brisk recovery in public administration and defense. Real estate, renting, and business activities grew by 8.3 percent in Q4 2014 from the quarter-ago rate of 6.2 percent, reflecting in part the more upbeat business sentiment during the quarter. Renting and business activities continued to be one of the main drivers of growth as it posted double-digit growth rate for seven consecutive quarters. Similarly, the growth of transport, storage, and communication accelerated to 6.3 percent from 5.3 percent in Q3 2014 on higher land transport growth. Meanwhile, the growth of public administration and defense, and compulsory social security turned positive to 10.9 percent from -2.9 percent in Q3 2014) as the government ramped-up its spending during the quarter. The industry sector grew by 9.2 percent in Q4 2014, higher compared to the 7.6-percent rise in Q3 2014 due mainly to robust growth of construction and manufacturing. Construction continued to post double-digit growth at 20.5 percent during the quarter from 11.9 percent in Q3 2014 as both the public and private sectors sped up their implementation of construction projects. While the growth of manufacturing was steady at 7.3 percent in Q4 2014, the said sector remained as the main driver of expansion in the industry group, with food manufactures leading the growth in manufacturing.
20
The agriculture, hunting, forestry and fishery (AHFF) rebounded in Q4 2014, expanding by 4.8 percent after declining by 2.2 percent in the previous quarter. The sector’s recovery was attributed largely to the higher output of palay (6.8 percent from -10.0 percent in Q3 2014) and corn (26.8 percent from -5.8 percent) due, in turn, to favorable weather conditions along with the increased usage of high-yielding seed varieties. Fishing output likewise increased to 4.8 percent from 0.4-percent decline in Q3 2014 due in part to expansion in the production of fish varieties like skipjack and yellowfin tuna.
Labor Market Conditions
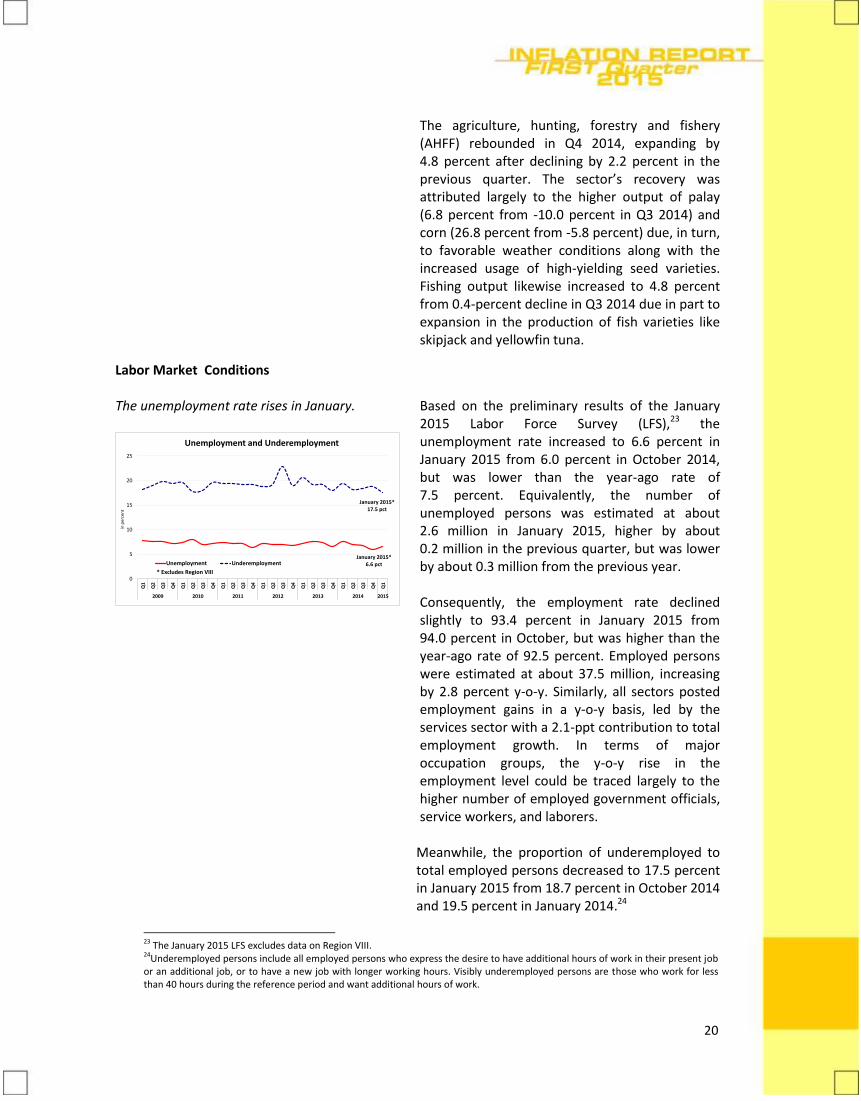
The unemployment rate rises in January.
January 2015*6.6 pct
January 2015*17.5 pct
0
5
10
15
20
25
Q1
Q2
Q3
Q4
Q1
Q2
Q3
Q4
Q1
Q2
Q3
Q4
Q1
Q2
Q3
Q4
Q1
Q2
Q3
Q4
Q1
Q2
Q3
Q4
Q1
2009 2010 2011 2012 2013 2014 2015
in p
erce
nt
Unemployment and Underemployment
Unemployment Underemployment
* Excludes Region VIII
Based on the preliminary results of the January 2015 Labor Force Survey (LFS),23 the unemployment rate increased to 6.6 percent in January 2015 from 6.0 percent in October 2014, but was lower than the year-ago rate of 7.5 percent. Equivalently, the number of unemployed persons was estimated at about 2.6 million in January 2015, higher by about 0.2 million in the previous quarter, but was lower by about 0.3 million from the previous year. Consequently, the employment rate declined slightly to 93.4 percent in January 2015 from 94.0 percent in October, but was higher than the year-ago rate of 92.5 percent. Employed persons were estimated at about 37.5 million, increasing by 2.8 percent y-o-y. Similarly, all sectors posted employment gains in a y-o-y basis, led by the services sector with a 2.1-ppt contribution to total employment growth. In terms of major occupation groups, the y-o-y rise in the employment level could be traced largely to the higher number of employed government officials, service workers, and laborers.
Meanwhile, the proportion of underemployed to total employed persons decreased to 17.5 percent in January 2015 from 18.7 percent in October 2014 and 19.5 percent in January 2014.24
23 The January 2015 LFS excludes data on Region VIII. 24Underemployed persons include all employed persons who express the desire to have additional hours of work in their present job or an additional job, or to have a new job with longer working hours. Visibly underemployed persons are those who work for less than 40 hours during the reference period and want additional hours of work.
21
II. MONETARY AND FINANCIAL MARKET CONDITIONS
Domestic Liquidity and Credit Conditions Domestic liquidity growth decelerates.
...but bank lending continues to expand strongly.
The growth in money supply or M3 decelerated to 8.5 percent in February 2015 from 11.3 percent in end-Q4 2014. Money supply continued to expand due mainly to the sustained demand for credit. Domestic claims increased by 10.0 percent in February, slower than the 17.8-percent increase at end-Q4 2014, as bank lending decelerated. Meanwhile, public sector credit declined by 4.5 percent in February following an expansion of 19.4 percent at the end of the previous quarter largely as a result of the increase in the deposits of the National Government (NG) with the BSP.
The growth in net foreign assets (NFA) was faster at 7.3 percent y-o-y in February from 5.0 percent in end-Q4 2014. The NFA of banks increased as banks’ foreign assets expanded, while their foreign liabilities contracted. Banks’ foreign assets rose due mainly to the growth in their foreign loans and receivables, investments in marketable debt securities, and deposits with other banks, while banks’ foreign liabilities decreased on account of lower placements made by foreign banks with their local branches.
At the same time, the deceleration in M3 growth in February 2015 could be attributed in part to the increase in placements of trust entities in the BSP’s SDA facility relative to a year ago. The slower M3 growth during the month also reflects statistical base effects associated with the significant increase in domestic liquidity a year ago following the operational adjustments involving access of trust entities to the BSP SDA facility, which were completed in November 2013. As of February 2015, outstanding loans of commercial banks, net of banks’ reverse repurchase (RRP) placements with the BSP, grew by 15.2 percent y-o-y relative to the 19.9 percent and 20.0 percent growth posted at end-Q4 2014 and end-Q1 2014, respectively. The continued expansion of bank lending was driven largely by loans to the following productive
22
sectors: manufacturing; wholesale and retail trade; real estate, renting, and business services; electricity, gas and water; financial intermediation; and, transportation, storage and communication. Meanwhile, loans for household consumption grew by 21.1 percent as of February 2015, the same as the 21.1 percent growth posted in end-Q4 2014 and higher than 11.7 percent expansion registered at end-Q1 2014. Credit Standards
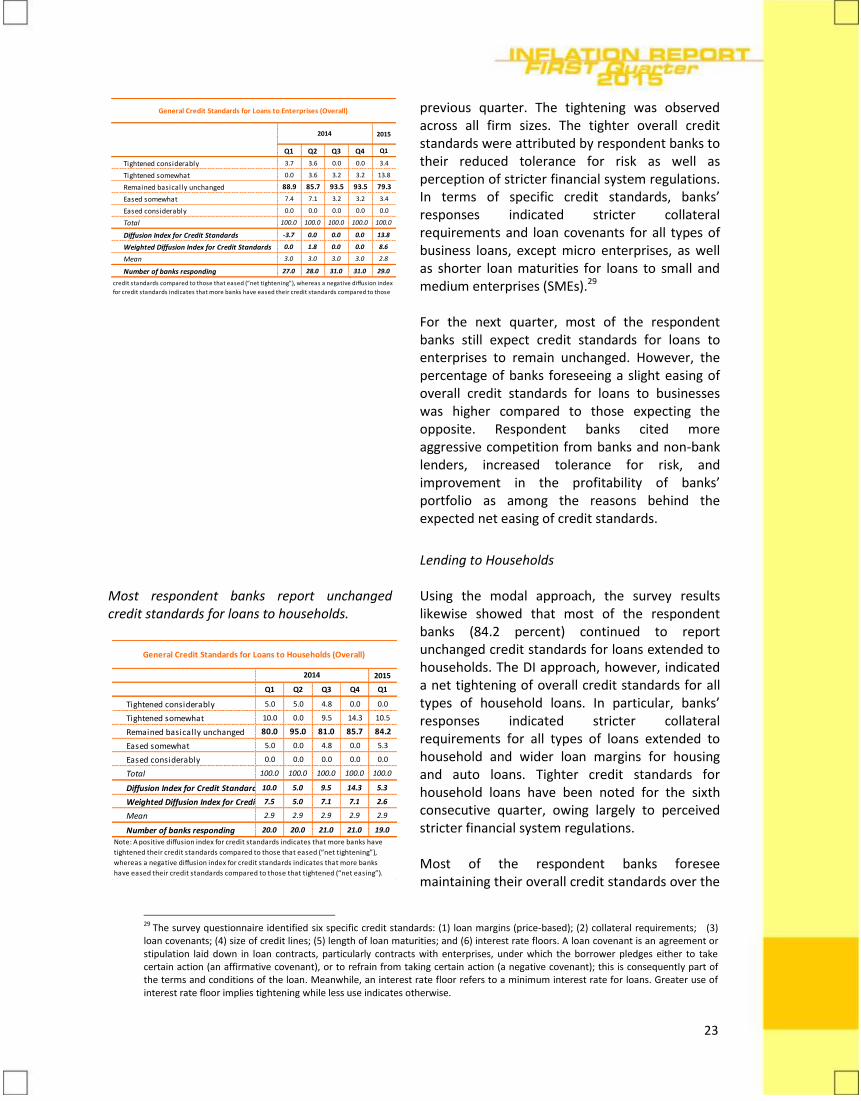
Most respondent banks maintain credit standards for loans to enterprises.
Preliminary results of the Q1 2015 Senior Bank Loan Officers’ Survey (SLOS)25 showed that most of the respondent banks maintained their credit standards for loans to both enterprises and households during the quarter based on the modal approach.26 This is the 24th consecutive quarter since Q2 2009 that the majority of banks reported broadly unchanged credit standards.
The diffusion index (DI) approach,27,28 however, pointed to a net tightening of overall credit standards for loans to both enterprises and households in Q1 2015 with the corresponding DIs recorded at 13.8 percent and 5.3 percent, respectively. In the previous quarter, DI-based results for corporate lending were unchanged, while credit standards for loans to households showed a net tightening. Lending to Enterprises Most banks (79.3 percent of banks that responded to the question) indicated that credit standards for loans to enterprises were kept steady during the quarter using the modal approach. However, based on the DI approach, credit standards for loans to enterprises showed a net tightening in line with expectations in the
25 The survey consists of questions on loan officers’ perceptions relating to the overall credit standards of universal/commercial banks (U/KBs) in the Philippines, as well as to factors affecting the supply of and demand for loans by both enterprises and households. Survey questionnaires were sent to all commercial banks, except for one bank that requested not to be included in the survey since it does not engage in corporate and retail lending. Thirty-three banks responded to the current survey representing a response rate of 94.3 percent. As of December 2014, U/KB loans accounted for about 86.6 percent of the banking system’s total outstanding loans. 26 In the modal approach, the results of the survey are analyzed by looking at the option with the highest share of responses. 27 In the diffusion index approach, a positive diffusion index (DI) for credit standards indicates that the proportion of banks that have tightened their credit standards are greater compared to those that eased (“net tightening”), whereas a negative DI for credit standards indicates that more banks have eased their credit standards compared to those that tightened (“net easing”). 28 From Q1 2010 to Q4 2012 survey rounds, the BSP used largely the DI approach in the analysis of survey results. Beginning in Q1 2013, the BSP used both the modal and DI approaches in assessing the results of the survey.
23
2015
Q1 Q2 Q3 Q4 Q1
Tightened considerably 3.7 3.6 0.0 0.0 3.4
Tightened somewhat 0.0 3.6 3.2 3.2 13.8
Remained basically unchanged 88.9 85.7 93.5 93.5 79.3
Eased somewhat 7.4 7.1 3.2 3.2 3.4
Eased considerably 0.0 0.0 0.0 0.0 0.0
Total 100.0 100.0 100.0 100.0 100.0
Diffusion Index for Credit Standards -3.7 0.0 0.0 0.0 13.8
Weighted Diffusion Index for Credit Standards 0.0 1.8 0.0 0.0 8.6
Mean 3.0 3.0 3.0 3.0 2.8
Number of banks responding 27.0 28.0 31.0 31.0 29.0
General Credit Standards for Loans to Enterprises (Overall)
2014
Note: A positive diffusion index for credit standards indicates that more banks have tightened their
credit standards compared to those that eased (“net tightening”), whereas a negative diffusion index
for credit standards indicates that more banks have eased their credit standards compared to those
previous quarter. The tightening was observed across all firm sizes. The tighter overall credit standards were attributed by respondent banks to their reduced tolerance for risk as well as perception of stricter financial system regulations. In terms of specific credit standards, banks’ responses indicated stricter collateral requirements and loan covenants for all types of business loans, except micro enterprises, as well as shorter loan maturities for loans to small and medium enterprises (SMEs).29 For the next quarter, most of the respondent banks still expect credit standards for loans to enterprises to remain unchanged. However, the percentage of banks foreseeing a slight easing of overall credit standards for loans to businesses was higher compared to those expecting the opposite. Respondent banks cited more aggressive competition from banks and non-bank lenders, increased tolerance for risk, and improvement in the profitability of banks’ portfolio as among the reasons behind the expected net easing of credit standards.
Most respondent banks report unchanged credit standards for loans to households.
2015
Q1 Q2 Q3 Q4 Q1
Tightened considerably 5.0 5.0 4.8 0.0 0.0
Tightened somewhat 10.0 0.0 9.5 14.3 10.5
Remained basically unchanged 80.0 95.0 81.0 85.7 84.2
Eased somewhat 5.0 0.0 4.8 0.0 5.3
Eased considerably 0.0 0.0 0.0 0.0 0.0
Total 100.0 100.0 100.0 100.0 100.0
Diffusion Index for Credit Standards 10.0 5.0 9.5 14.3 5.3
Weighted Diffusion Index for Credit Standards7.5 5.0 7.1 7.1 2.6
Mean 2.9 2.9 2.9 2.9 2.9
Number of banks responding 20.0 20.0 21.0 21.0 19.0
Note: A positive diffusion index for credit standards indicates that more banks have
tightened their credit standards compared to those that eased (“net tightening”),
whereas a negative diffusion index for credit standards indicates that more banks
have eased their credit standards compared to those that tightened (“net easing”).
General Credit Standards for Loans to Households (Overall)
2014
Lending to Households Using the modal approach, the survey results likewise showed that most of the respondent banks (84.2 percent) continued to report unchanged credit standards for loans extended to households. The DI approach, however, indicated a net tightening of overall credit standards for all types of household loans. In particular, banks’ responses indicated stricter collateral requirements for all types of loans extended to household and wider loan margins for housing and auto loans. Tighter credit standards for household loans have been noted for the sixth consecutive quarter, owing largely to perceived stricter financial system regulations. Most of the respondent banks foresee maintaining their overall credit standards over the
29 The survey questionnaire identified six specific credit standards: (1) loan margins (price-based); (2) collateral requirements; (3) loan covenants; (4) size of credit lines; (5) length of loan maturities; and (6) interest rate floors. A loan covenant is an agreement or stipulation laid down in loan contracts, particularly contracts with enterprises, under which the borrower pledges either to take certain action (an affirmative covenant), or to refrain from taking certain action (a negative covenant); this is consequently part of the terms and conditions of the loan. Meanwhile, an interest rate floor refers to a minimum interest rate for loans. Greater use of interest rate floor implies tightening while less use indicates otherwise.
24
Loan demand from both enterprises and households is unchanged.
next quarter. However, some banks still expect overall credit standards to tighten slightly for credit card, auto, and personal/salary loans due largely to expectations of continued strict financial system regulations and banks’ reduced tolerance for risk. Loan demand Responses to the survey question on loan demand indicated that the majority of the respondent banks continued to see unchanged overall demand for loans from both enterprises and households. Using the DI approach, however, a net increase in overall demand30 for loans from both enterprises and households was continued to be observed. The net increase in loan demand of firms was attributed by banks to clients’ improved outlook on the economy as well as increased inventory and accounts receivable financing needs of borrower firms, among others. Meanwhile, the net increase in overall demand for household loans reflected higher housing investment, lower interest rates, and more attractive financing terms offered by banks. Looking ahead, most of the respondent banks expect unchanged loan demand for loans to firms. However, a larger proportion of respondents expect overall demand for loans to increase further in the next quarter relative to those who indicated the opposite. The expected net increase in loan demand by firms was attributed by respondent banks to the higher inventory and working capital financing needs of borrower firms along with the improved economic outlook of clients. At the same time, banks’ responses pointed to an increase in demand for household loans over the next quarter based on both the modal and DI approaches. Expectations of higher household consumption, banks’ more attractive financing terms, and lower interest rates were cited by respondent banks as key factors behind the anticipated increase in demand for household loans.
30 The “DI for loan demand” refers to the percentage difference between banks reporting an increase in loan demand and banks reporting a decrease. A positive DI for loan demand indicates that more banks reported an increase in loan demand compared to those stating the opposite, whereas a negative DI for loan demand implies that more banks reported a decrease in loan demand compared to those reporting an increase.
25
Credit standards for commercial real estate loans are steady.
Special Questions on Commercial Real Estate Loans
Most of the respondent banks (78.9 percent) in Q1 2015 indicated unchanged overall credit standards for commercial real estate loans using the modal approach. However, based on the DI approach, a net tightening of overall credit standards was noted for commercial real estate loans for the 11th consecutive quarter. The net tightening of overall credit standards for commercial real estate loans was attributed by respondent banks to perceived stricter oversight of banks’ real estate exposure along with banks’ reduced tolerance for risk, among others. In particular, respondent banks reported wider loan margins along with stricter collateral requirements and loan covenants for commercial real estate loans. Demand for commercial real estate loans was also unchanged in Q1 2015 based on the modal approach. A number of banks, however, indicated increased demand for the said type of loan on the back of clients’ improved economic outlook as well as increased inventory and fixed-capital investment needs of clients. For the next quarter, most of the respondent banks expect to maintain their credit standards for commercial real estate loans. However, banks that anticipate a tightening of their credit standards outnumbered those expecting the opposite. In terms of demand for this type of loan, although most of the respondent banks anticipate generally steady loan demand, a number of banks expect demand for commercial real estate loans to continue increasing in the following quarter. Similarly, credit standards for housing loans extended to households showed net tightening in Q1 2015 based on the DI approach. The tighter credit standards for housing loans were attributed by respondent banks to perceived stricter financial system regulations. Banks’ responses showed wider loan margins and stricter collateral requirements for housing loans. At the same time, results continued to show increased demand for housing loans in Q1 2015 using the DI approach.
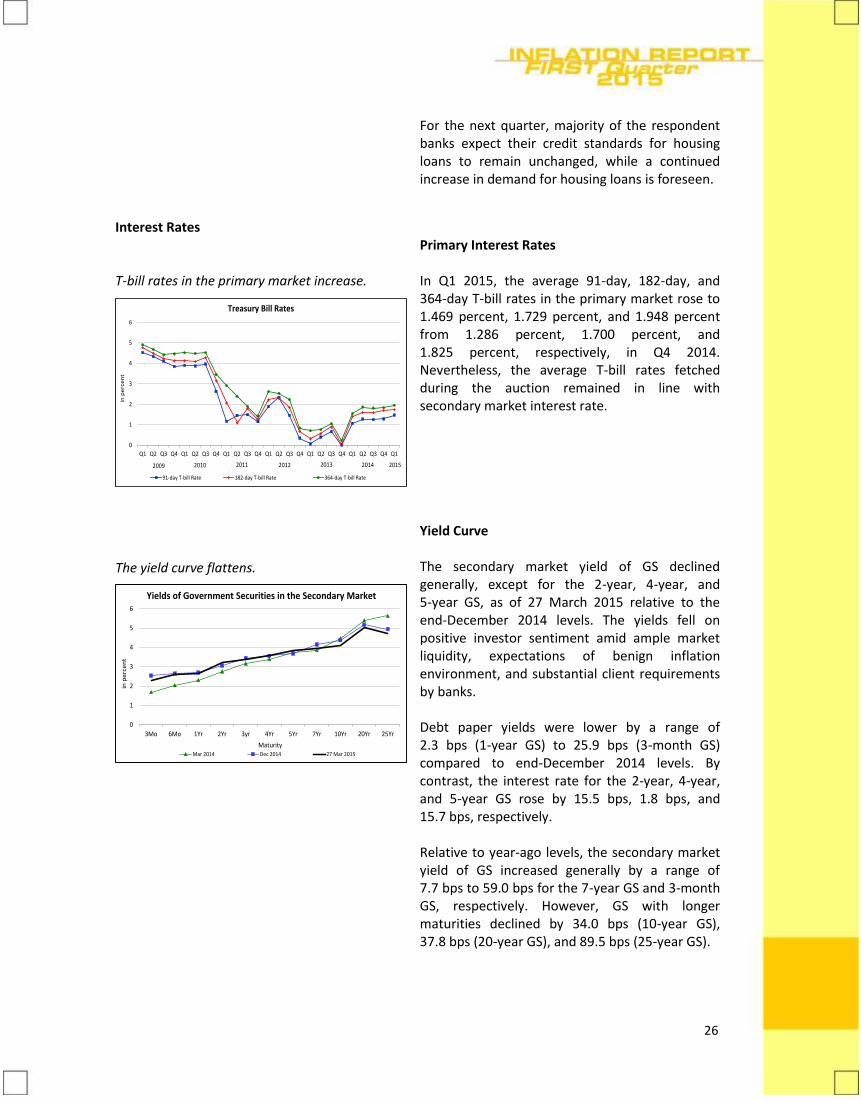
26
For the next quarter, majority of the respondent banks expect their credit standards for housing loans to remain unchanged, while a continued increase in demand for housing loans is foreseen.
Interest Rates T-bill rates in the primary market increase.
0
1
2
3
4
5
6
Q1 Q2 Q3 Q4 Q1 Q2 Q3 Q4 Q1 Q2 Q3 Q4 Q1 Q2 Q3 Q4 Q1 Q2 Q3 Q4 Q1 Q2 Q3 Q4 Q1
91-day T-bill Rate 182-day T-bill Rate 364-day T-bill Rate
2011
Treasury Bill Rates
2010 2012
in p
erc
en
t
2013 20142009 2015
The yield curve flattens.
0
1
2
3
4
5
6
3Mo 6Mo 1Yr 2Yr 3yr 4Yr 5Yr 7Yr 10Yr 20Yr 25Yr
Mar 2014 Dec 2014 27 Mar 2015
Yields of Government Securities in the Secondary Market
Maturity
in p
erc
en
t
Primary Interest Rates In Q1 2015, the average 91-day, 182-day, and 364-day T-bill rates in the primary market rose to 1.469 percent, 1.729 percent, and 1.948 percent from 1.286 percent, 1.700 percent, and 1.825 percent, respectively, in Q4 2014. Nevertheless, the average T-bill rates fetched during the auction remained in line with secondary market interest rate. Yield Curve The secondary market yield of GS declined generally, except for the 2-year, 4-year, and 5-year GS, as of 27 March 2015 relative to the end-December 2014 levels. The yields fell on positive investor sentiment amid ample market liquidity, expectations of benign inflation environment, and substantial client requirements by banks. Debt paper yields were lower by a range of 2.3 bps (1-year GS) to 25.9 bps (3-month GS) compared to end-December 2014 levels. By contrast, the interest rate for the 2-year, 4-year, and 5-year GS rose by 15.5 bps, 1.8 bps, and 15.7 bps, respectively. Relative to year-ago levels, the secondary market yield of GS increased generally by a range of 7.7 bps to 59.0 bps for the 7-year GS and 3-month GS, respectively. However, GS with longer maturities declined by 34.0 bps (10-year GS), 37.8 bps (20-year GS), and 89.5 bps (25-year GS).
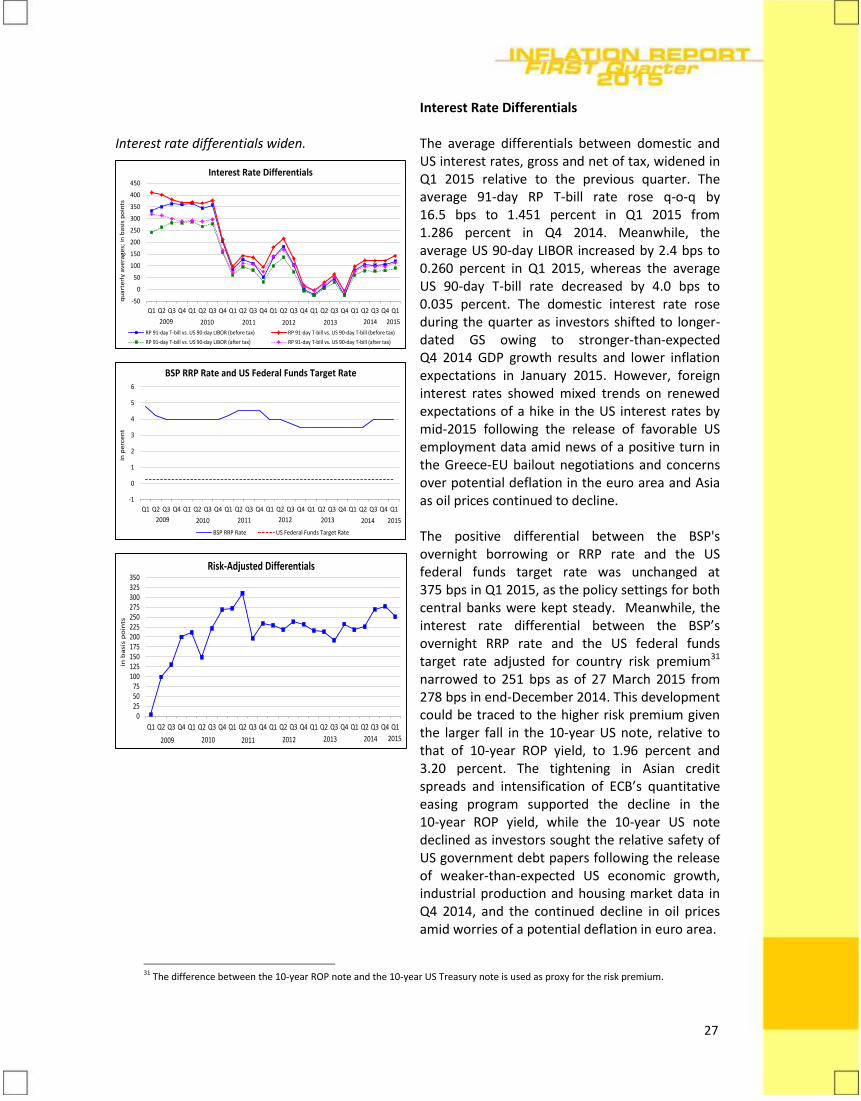
27
Interest rate differentials widen.
-50
0
50
100
150
200
250
300
350
400
450
Q1 Q2 Q3 Q4 Q1 Q2 Q3 Q4 Q1 Q2 Q3 Q4 Q1 Q2 Q3 Q4 Q1 Q2 Q3 Q4 Q1 Q2 Q3 Q4 Q1
RP 91-day T-bill vs. US 90-day LIBOR (before tax) RP 91-day T-bill vs. US 90-day T-bill (before tax)
RP 91-day T-bill vs. US 90-day LIBOR (after tax) RP 91-day T-bill vs. US 90-day T-bill (after tax)
Interest Rate Differentials
2010 2011 2012
qu
art
erl
y a
ve
rag
es;
in b
asi
s p
oin
ts
2013 20142009 2015
-1
0
1
2
3
4
5
6
Q1 Q2 Q3 Q4 Q1 Q2 Q3 Q4 Q1 Q2 Q3 Q4 Q1 Q2 Q3 Q4 Q1 Q2 Q3 Q4 Q1 Q2 Q3 Q4 Q1
BSP RRP Rate US Federal Funds Target Rate
2010 2011 2012
BSP RRP Rate and US Federal Funds Target Rate
in p
erc
en
t
2013 20142009 2015
0255075
100125150175200225250275300325350
Q1 Q2 Q3 Q4 Q1 Q2 Q3 Q4 Q1 Q2 Q3 Q4 Q1 Q2 Q3 Q4 Q1 Q2 Q3 Q4 Q1 Q2 Q3 Q4 Q1
Risk-Adjusted Differentials
2010 2011 2012
in b
asi
s p
oin
ts
2013 20142009 2015
Interest Rate Differentials The average differentials between domestic and US interest rates, gross and net of tax, widened in Q1 2015 relative to the previous quarter. The average 91-day RP T-bill rate rose q-o-q by 16.5 bps to 1.451 percent in Q1 2015 from 1.286 percent in Q4 2014. Meanwhile, the average US 90-day LIBOR increased by 2.4 bps to 0.260 percent in Q1 2015, whereas the average US 90-day T-bill rate decreased by 4.0 bps to 0.035 percent. The domestic interest rate rose during the quarter as investors shifted to longer-dated GS owing to stronger-than-expected Q4 2014 GDP growth results and lower inflation expectations in January 2015. However, foreign interest rates showed mixed trends on renewed expectations of a hike in the US interest rates by mid-2015 following the release of favorable US employment data amid news of a positive turn in the Greece-EU bailout negotiations and concerns over potential deflation in the euro area and Asia as oil prices continued to decline. The positive differential between the BSP's overnight borrowing or RRP rate and the US federal funds target rate was unchanged at 375 bps in Q1 2015, as the policy settings for both central banks were kept steady. Meanwhile, the interest rate differential between the BSP’s overnight RRP rate and the US federal funds target rate adjusted for country risk premium31 narrowed to 251 bps as of 27 March 2015 from 278 bps in end-December 2014. This development could be traced to the higher risk premium given the larger fall in the 10-year US note, relative to that of 10-year ROP yield, to 1.96 percent and 3.20 percent. The tightening in Asian credit spreads and intensification of ECB’s quantitative easing program supported the decline in the 10-year ROP yield, while the 10-year US note declined as investors sought the relative safety of US government debt papers following the release of weaker-than-expected US economic growth, industrial production and housing market data in Q4 2014, and the continued decline in oil prices amid worries of a potential deflation in euro area.
31 The difference between the 10-year ROP note and the 10-year US Treasury note is used as proxy for the risk premium.
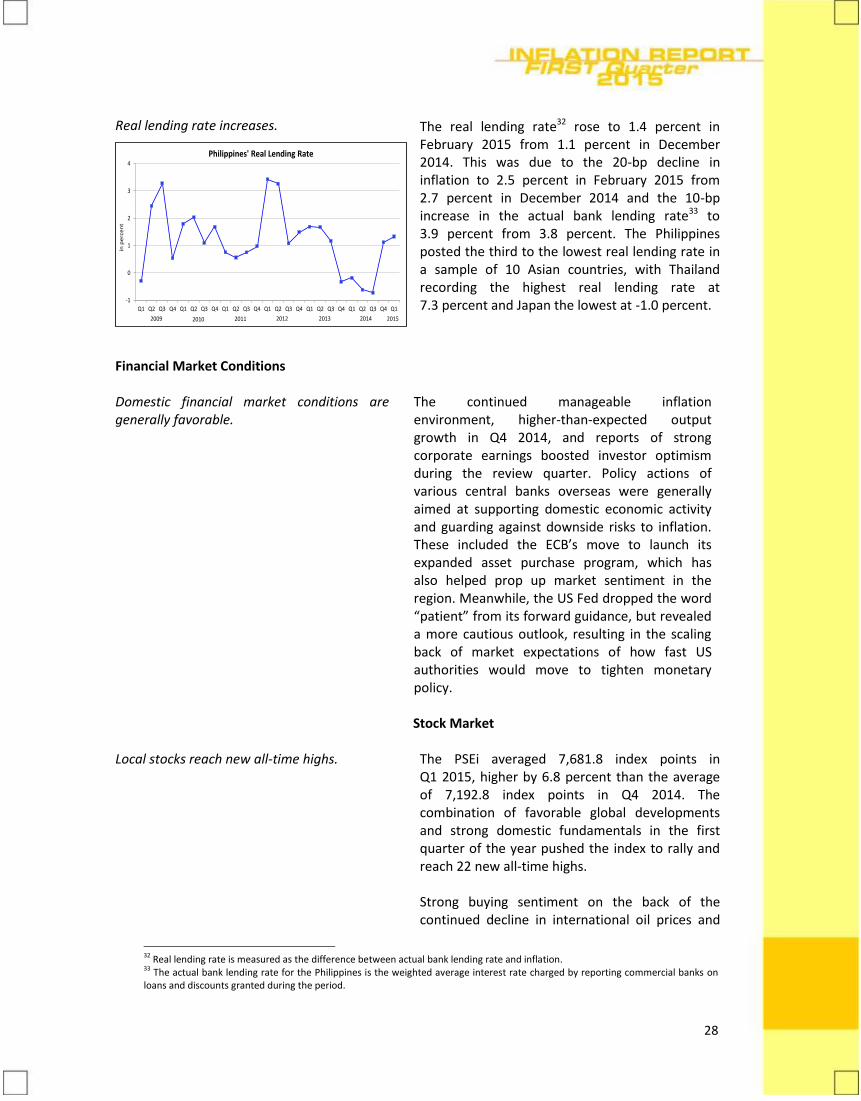
28
Real lending rate increases.
-1
0
1
2
3
4
Q1 Q2 Q3 Q4 Q1 Q2 Q3 Q4 Q1 Q2 Q3 Q4 Q1 Q2 Q3 Q4 Q1 Q2 Q3 Q4 Q1 Q2 Q3 Q4 Q1
2010
Philippines' Real Lending Rate
2011 2012
in p
erc
en
t
2013 20142009 2015
The real lending rate32 rose to 1.4 percent in February 2015 from 1.1 percent in December 2014. This was due to the 20-bp decline in inflation to 2.5 percent in February 2015 from 2.7 percent in December 2014 and the 10-bp increase in the actual bank lending rate33 to 3.9 percent from 3.8 percent. The Philippines posted the third to the lowest real lending rate in a sample of 10 Asian countries, with Thailand recording the highest real lending rate at 7.3 percent and Japan the lowest at -1.0 percent.
Financial Market Conditions Domestic financial market conditions are generally favorable. Local stocks reach new all-time highs.
The continued manageable inflation environment, higher-than-expected output growth in Q4 2014, and reports of strong corporate earnings boosted investor optimism during the review quarter. Policy actions of various central banks overseas were generally aimed at supporting domestic economic activity and guarding against downside risks to inflation. These included the ECB’s move to launch its expanded asset purchase program, which has also helped prop up market sentiment in the region. Meanwhile, the US Fed dropped the word “patient” from its forward guidance, but revealed a more cautious outlook, resulting in the scaling back of market expectations of how fast US authorities would move to tighten monetary policy. Stock Market
The PSEi averaged 7,681.8 index points in Q1 2015, higher by 6.8 percent than the average of 7,192.8 index points in Q4 2014. The combination of favorable global developments and strong domestic fundamentals in the first quarter of the year pushed the index to rally and reach 22 new all-time highs. Strong buying sentiment on the back of the continued decline in international oil prices and
32 Real lending rate is measured as the difference between actual bank lending rate and inflation. 33 The actual bank lending rate for the Philippines is the weighted average interest rate charged by reporting commercial banks on loans and discounts granted during the period.
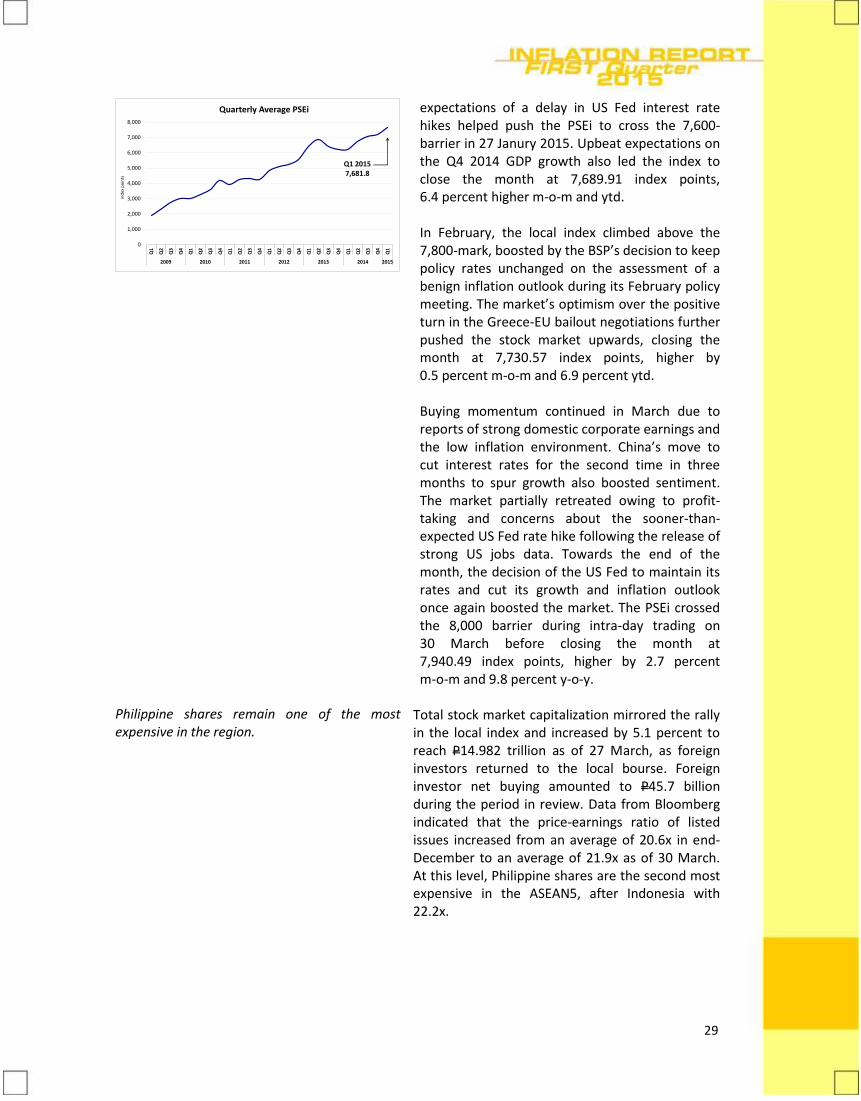
29
0
1,000
2,000
3,000
4,000
5,000
6,000
7,000
8,000
Q1
Q2
Q3
Q4
Q1
Q2
Q3
Q4
Q1
Q2
Q3
Q4
Q1
Q2
Q3
Q4
Q1
Q2
Q3
Q4
Q1
Q2
Q3
Q4
Q1
2009 2010 2011 2012 2013 2014 2015
ind
ex p
oin
ts
Quarterly Average PSEi
Q1 20157,681.8
Philippine shares remain one of the most expensive in the region.
expectations of a delay in US Fed interest rate hikes helped push the PSEi to cross the 7,600-barrier in 27 Janury 2015. Upbeat expectations on the Q4 2014 GDP growth also led the index to close the month at 7,689.91 index points, 6.4 percent higher m-o-m and ytd. In February, the local index climbed above the 7,800-mark, boosted by the BSP’s decision to keep policy rates unchanged on the assessment of a benign inflation outlook during its February policy meeting. The market’s optimism over the positive turn in the Greece-EU bailout negotiations further pushed the stock market upwards, closing the month at 7,730.57 index points, higher by 0.5 percent m-o-m and 6.9 percent ytd. Buying momentum continued in March due to reports of strong domestic corporate earnings and the low inflation environment. China’s move to cut interest rates for the second time in three months to spur growth also boosted sentiment. The market partially retreated owing to profit-taking and concerns about the sooner-than-expected US Fed rate hike following the release of strong US jobs data. Towards the end of the month, the decision of the US Fed to maintain its rates and cut its growth and inflation outlook once again boosted the market. The PSEi crossed the 8,000 barrier during intra-day trading on 30 March before closing the month at 7,940.49 index points, higher by 2.7 percent m-o-m and 9.8 percent y-o-y.
Total stock market capitalization mirrored the rally in the local index and increased by 5.1 percent to reach P14.982 trillion as of 27 March, as foreign investors returned to the local bourse. Foreign investor net buying amounted to P45.7 billion during the period in review. Data from Bloomberg indicated that the price-earnings ratio of listed issues increased from an average of 20.6x in end-December to an average of 21.9x as of 30 March. At this level, Philippine shares are the second most expensive in the ASEAN5, after Indonesia with 22.2x.
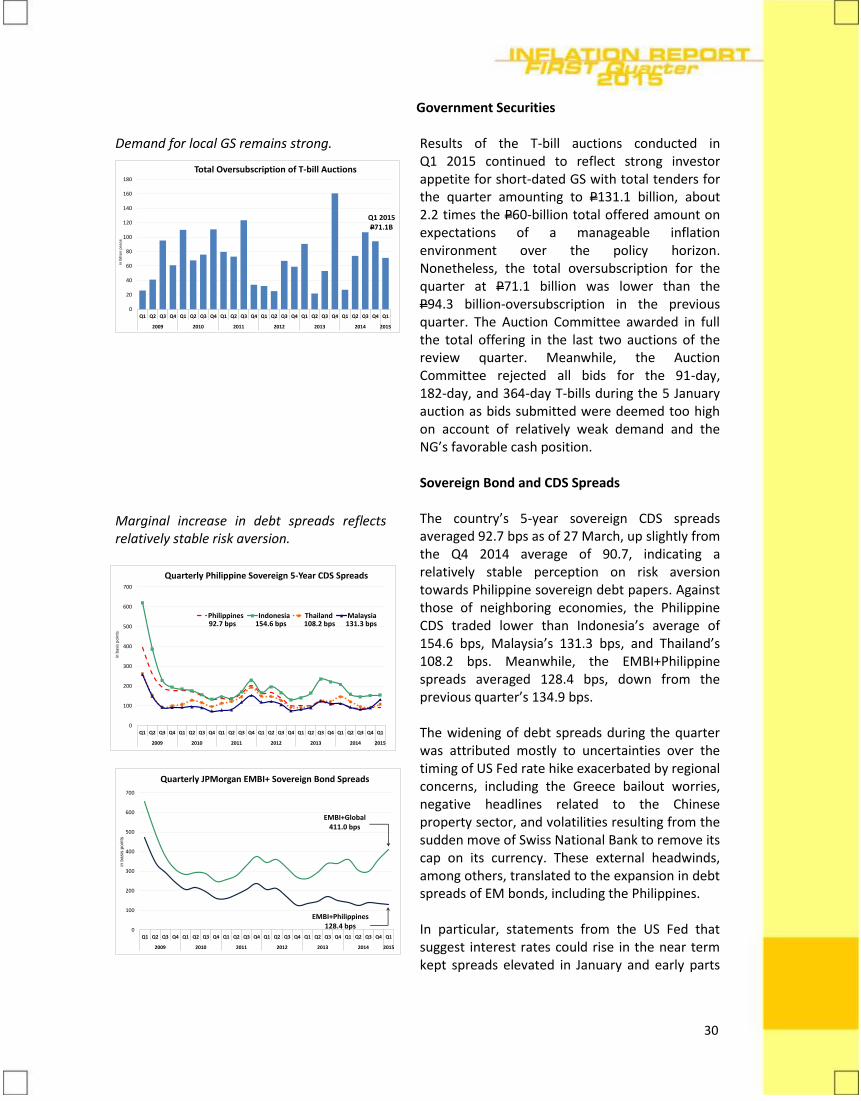
30
Demand for local GS remains strong.
0
20
40
60
80
100
120
140
160
180
Q1 Q2 Q3 Q4 Q1 Q2 Q3 Q4 Q1 Q2 Q3 Q4 Q1 Q2 Q3 Q4 Q1 Q2 Q3 Q4 Q1 Q2 Q3 Q4 Q1
2009 2010 2011 2012 2013 2014 2015
in b
illio
n p
esos
Total Oversubscription of T-bill Auctions
Q1 2015P71.1B
Marginal increase in debt spreads reflects relatively stable risk aversion.
0
100
200
300
400
500
600
700
Q1 Q2 Q3 Q4 Q1 Q2 Q3 Q4 Q1 Q2 Q3 Q4 Q1 Q2 Q3 Q4 Q1 Q2 Q3 Q4 Q1 Q2 Q3 Q4 Q1
2009 2010 2011 2012 2013 2014 2015
in b
asis
po
ints
Quarterly Philippine Sovereign 5-Year CDS Spreads
Philippines Indonesia Thailand Malaysia92.7 bps 154.6 bps 108.2 bps 131.3 bps
0
100
200
300
400
500
600
700
Q1 Q2 Q3 Q4 Q1 Q2 Q3 Q4 Q1 Q2 Q3 Q4 Q1 Q2 Q3 Q4 Q1 Q2 Q3 Q4 Q1 Q2 Q3 Q4 Q1
2009 2010 2011 2012 2013 2014 2015
in b
asis
po
ints
Quarterly JPMorgan EMBI+ Sovereign Bond Spreads
EMBI+Philippines128.4 bps
EMBI+Global411.0 bps
Government Securities Results of the T-bill auctions conducted in Q1 2015 continued to reflect strong investor appetite for short-dated GS with total tenders for the quarter amounting to P131.1 billion, about 2.2 times the P60-billion total offered amount on expectations of a manageable inflation environment over the policy horizon. Nonetheless, the total oversubscription for the quarter at P71.1 billion was lower than the P94.3 billion-oversubscription in the previous quarter. The Auction Committee awarded in full the total offering in the last two auctions of the review quarter. Meanwhile, the Auction Committee rejected all bids for the 91-day, 182-day, and 364-day T-bills during the 5 January auction as bids submitted were deemed too high on account of relatively weak demand and the NG’s favorable cash position. Sovereign Bond and CDS Spreads
The country’s 5-year sovereign CDS spreads averaged 92.7 bps as of 27 March, up slightly from the Q4 2014 average of 90.7, indicating a relatively stable perception on risk aversion towards Philippine sovereign debt papers. Against those of neighboring economies, the Philippine CDS traded lower than Indonesia’s average of 154.6 bps, Malaysia’s 131.3 bps, and Thailand’s 108.2 bps. Meanwhile, the EMBI+Philippine spreads averaged 128.4 bps, down from the previous quarter’s 134.9 bps. The widening of debt spreads during the quarter was attributed mostly to uncertainties over the timing of US Fed rate hike exacerbated by regional concerns, including the Greece bailout worries, negative headlines related to the Chinese property sector, and volatilities resulting from the sudden move of Swiss National Bank to remove its cap on its currency. These external headwinds, among others, translated to the expansion in debt spreads of EM bonds, including the Philippines. In particular, statements from the US Fed that suggest interest rates could rise in the near term kept spreads elevated in January and early parts
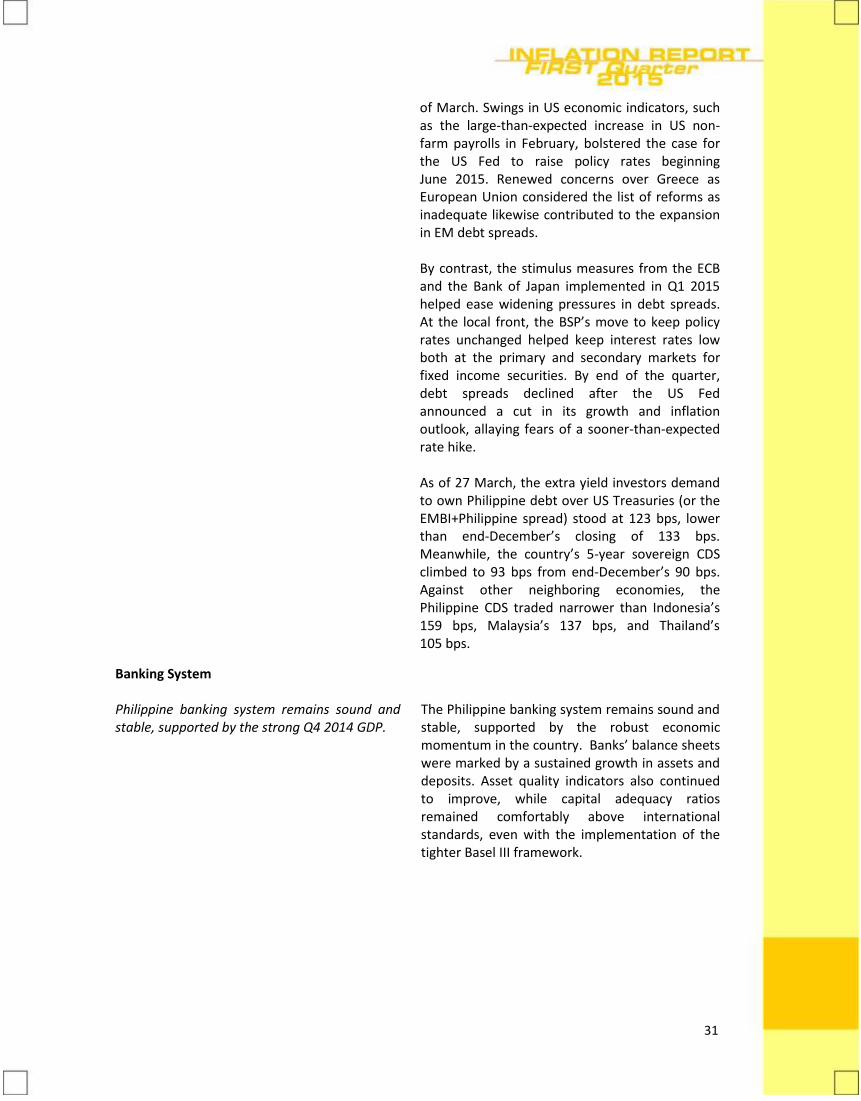
31
of March. Swings in US economic indicators, such as the large-than-expected increase in US non-farm payrolls in February, bolstered the case for the US Fed to raise policy rates beginning June 2015. Renewed concerns over Greece as European Union considered the list of reforms as inadequate likewise contributed to the expansion in EM debt spreads. By contrast, the stimulus measures from the ECB and the Bank of Japan implemented in Q1 2015 helped ease widening pressures in debt spreads. At the local front, the BSP’s move to keep policy rates unchanged helped keep interest rates low both at the primary and secondary markets for fixed income securities. By end of the quarter, debt spreads declined after the US Fed announced a cut in its growth and inflation outlook, allaying fears of a sooner-than-expected rate hike. As of 27 March, the extra yield investors demand to own Philippine debt over US Treasuries (or the EMBI+Philippine spread) stood at 123 bps, lower than end-December’s closing of 133 bps. Meanwhile, the country’s 5-year sovereign CDS climbed to 93 bps from end-December’s 90 bps. Against other neighboring economies, the Philippine CDS traded narrower than Indonesia’s 159 bps, Malaysia’s 137 bps, and Thailand’s 105 bps.
Banking System Philippine banking system remains sound and stable, supported by the strong Q4 2014 GDP.
The Philippine banking system remains sound and stable, supported by the robust economic momentum in the country. Banks’ balance sheets were marked by a sustained growth in assets and deposits. Asset quality indicators also continued to improve, while capital adequacy ratios remained comfortably above international standards, even with the implementation of the tighter Basel III framework.
32
U/KBs account for the largest share in the resource base.
Savings Mobilization
Savings and time deposits remained the primary sources of funds for the banking system. Banks’ total deposits34 as of end-December 2014 amounted to P6.7 trillion, 5.0 percent higher than the quarter-ago level of P6.4 trillion. The modest growth could be attributed in part to the observed return of investors’ funds to the BSP SDA facility following the fine-tuning measures in the access of trust entities to the said BSP liquidity window in 2013.35 Savings deposits registered a 3.7 percent growth, continuing to account for nearly half of the funding base of banks. Demand and time deposits, on the other hand, expanded q-o-q by 3.8 percent and 8.6 percent, respectively.36 Meanwhile, foreign currency deposits (FCD) owned by residents grew by 3.3 percent to P1.3 trillion as of end-December 2014 relative to the level posted last quarter.37 Institutional Developments Total resources of the banking system rose by 7.4 percent to P11.5 trillion as of end-December 2014 from quarter-ago and 11.8 percent from year-ago levels. The increase could be traced to the growth in loans, financial assets, and equity investments. Universal and commercial banks (U/KBs) accounted for more than 90 percent of the total resources of the banking system. As a percent of GDP, total resources slightly increased to 91.2 percent in Q4 2014 relative to the 87.2 percent posted in the previous quarter. The number of banking institutions (head offices) fell to 648 as of end-December 2014 from the quarter- and year-ago levels of 652 and 673, respectively, indicating continued consolidation of banks as well as the exit of weaker players in the banking system. By banking classification, banks (head offices) consisted of 36 U/KBs, 69 thrift banks (TBs), and 543 rural banks (RBs). Meanwhile, the operating network (head offices
34 This refers to the total peso-denominated deposits of the banking system. 35 Interest rate on special deposit accounts was raised twice by 25 basis points in 2014 (June and September). 36 The domestic liquidity or M3 growth in December 2014 partly reflects statistical base effects associated with the significant increase in domestic liquidity a year ago of 31.8 percent, following the operational adjustments involving access of trust entities to the BSP SDA facility, which were completed in November 2013. Along with the savings, time and demand deposits, M3 includes currency in circulation and deposit substitutes. 37 M4 is the sum of M3 and FCD-Residents.
33
Asset quality of Philippine banks continues to improve.
and branches/agencies) of the banking system increased to 10,361 in end-Q4 2014 from 10,207 in Q3 2014 and 9,935 during the same period last year due mainly to the rise in the number of bank branches. The Philippine banking system’s gross non-performing loan (GNPL) ratio improved to 2.3 percent as of end-December 201438 relative to the previous quarter’s 2.6 percent.39 Banks’ initiatives to improve their asset quality along with prudent lending regulations helped bring the GNPL ratio to a level below its pre-Asian crisis at around 3.5 percent.40 The Q4 2014 GNPL ratio reflected the combined favorable impact of the GNPL contraction of 2.9 percent q-o-q from P138.7 billion to P134.7 billion, and the banking system’s TLP expansion of 7.6 percent q-o-q from P5.4 trillion to P5.8 trillion. Similarly, the net non-performing loan (NNPL) ratio improved slightly to 0.60 percent from 0.63 percent in end-September 2014. In computing for the NNPLs, specific allowances for credit losses41 on TLP are deducted from the GNPLs. The said allowances decreased to P99.9 billion in Q4 2014 from the P104.7 billion posted a quarter ago. The Philippine banking system’s GNPL ratio of 2.3 percent was at par with Indonesia, but higher relative to South Korea (1.5 percent), Thailand (2.2 percent), and Malaysia (1.2 percent).42 The loan exposures of banks remained adequately covered as the banking system’s NPL coverage ratio improved slightly to 119.8 percent as of end-December 2014 from 117.2 percent in end-September 2014. The ratio is indicative of banks’ continued compliance with the loan-loss
38 On 16 October 2012, the BSP amended banks’ reporting standard for NPLs. Beginning with the January 2013 reports, banks have been required to report their “gross” NPLs and their “net” NPLs. Gross NPLs represent the actual level of NPL without any adjustment for loans treated as “loss” and fully provisioned. Net NPLs is just the gross NPLs less specific allowance for credit losses on TLP (Circular No. 772, series of 2012). The new reporting standard was driven by the BSP’s intent to be more transparent as it gives a fuller picture of the gross amount of NPLs and the full extent of allowances for probable losses. Under the previous framework, NPLs were reported net of loans considered as “loss” but fully provisioned for. 39 For comparative purposes, computations for periods prior to January 2013 are aligned with Circular No. 772. Certain ratios were rounded-off to the nearest hundredths to show marginal movements. 40 The 3.5 percent NPL ratio was based from the pre-2013 definition. 41 This type of provisioning applies to loan accounts classified under loans especially mentioned (LEM), substandard-secured loans, substandard-unsecured loans, doubtful accounts and loans considered as loss accounts. 42 Sources: Various central bank websites, IMF and financial stability reports, Indonesia (commercial banks, Q3 2014); Malaysia (banking system [impaired loans/net loans], Q4 2014); Thailand (commercial banks, Q4 2014); and South Korea (domestic banks, Q4 2014).
34
Banks remain adequately capitalized amid tighter capital requirements.
provisioning requirements of the BSP to ensure adequate buffers against potential credit losses. Compliance with the BSP capital framework for U/KBs under the Basel III framework43 took effect in 1 January 2014. The new Basel III regime incorporates adjustments to the treatment of bank capital in ways that enhance the use of the CAR as a prudential measure. The CARs of universal and commercial banks (U/KBs) stood at 16.3 percent on solo basis and 17.0 percent on consolidated basis at end-September 2014. These CAR figures were both higher than the 15.9 percent (solo basis) and 16.7 percent (consolidated basis) recorded in end-June last year. The industry’s capital base continues to be driven by Common Equity Tier 1 (CET 1), which is the highest quality among instruments eligible as bank capital. The CET 1 of U/KBs represented 13.7 percent and 14.5 percent of risk weighted assets (RWAs) on solo and consolidated bases, respectively. Meanwhile, the banks’ Tier 1 ratios, composed of common equity and qualified capital instruments, stood at 13.9 percent on solo basis and 14.7 percent on consolidated basis. The Q3 2014 increase in the CAR of U/KBs was due to the capital raising activities of domestic banks, additional capital infusion of foreign banks to their local branches, and earnings generated. This enabled the banks to increase their total qualifying capital by 5.7 percent q-o-q to P932.2 billion from P882.2 billion in Q2 2014. The U/KBs RWA also rose by 3.2 percent due to increase in lending to the corporate sector. The CAR of U/KBs on a consolidated basis at 17.0 percent was higher than those of Malaysia (15.2 percent), Thailand (16.5 percent), and South Korea (13.9 percent), but lower compared to that of Indonesia (19.5 percent).44
43 Basel III no longer counts towards “bank capital” those Basel II-compliant capital instruments that do not have the feature of loss absorbency. Loss absorbency refers to the ability of bank-eligible capital instruments other than common equity to behave and act in the same way as common equity shares at the point where the bank takes losses and becomes non-viable. In addition, Basel III now deducts from capital the investments of banks in non-allied undertakings, defined benefit pension fund assets, goodwill and other intangible assets. 44 Sources: Various central bank websites, IMF and financial stability reports, Indonesia (commercial banks, Q3 2014); Thailand (commercial banks, Q4 2014); Malaysia (banking system, Q4 2014); and Korea (bank holding companies, Q3 2014).
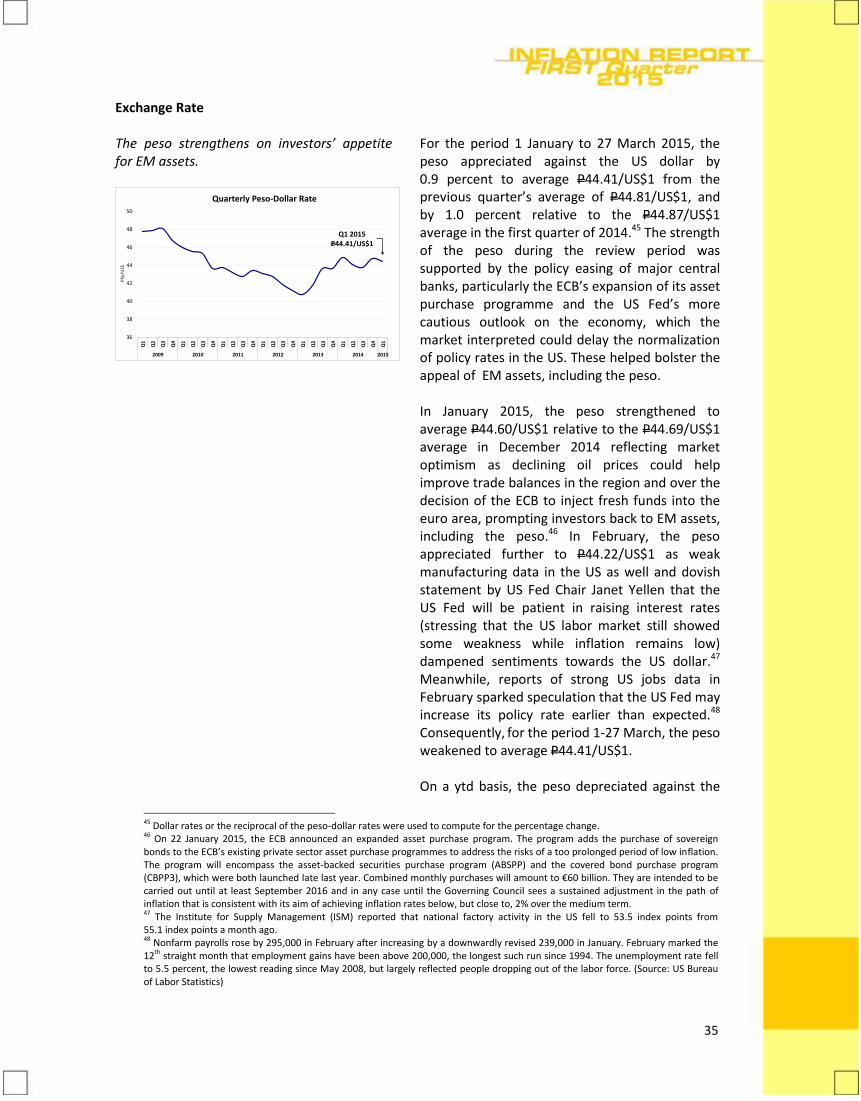
35
Exchange Rate The peso strengthens on investors’ appetite for EM assets.
36
38
40
42
44
46
48
50
Q1
Q2
Q3
Q4
Q1
Q2
Q3
Q4
Q1
Q2
Q3
Q4
Q1
Q2
Q3
Q4
Q1
Q2
Q3
Q4
Q1
Q2
Q3
Q4
Q1
2009 2010 2011 2012 2013 2014 2015
Ph
p/U
S$
Quarterly Peso-Dollar Rate
Q1 2015P44.41/US$1
For the period 1 January to 27 March 2015, the peso appreciated against the US dollar by 0.9 percent to average P44.41/US$1 from the previous quarter’s average of P44.81/US$1, and by 1.0 percent relative to the P44.87/US$1 average in the first quarter of 2014.45 The strength of the peso during the review period was supported by the policy easing of major central banks, particularly the ECB’s expansion of its asset purchase programme and the US Fed’s more cautious outlook on the economy, which the market interpreted could delay the normalization of policy rates in the US. These helped bolster the appeal of EM assets, including the peso.
In January 2015, the peso strengthened to average P44.60/US$1 relative to the P44.69/US$1 average in December 2014 reflecting market optimism as declining oil prices could help improve trade balances in the region and over the decision of the ECB to inject fresh funds into the euro area, prompting investors back to EM assets, including the peso.46 In February, the peso appreciated further to P44.22/US$1 as weak manufacturing data in the US as well and dovish statement by US Fed Chair Janet Yellen that the US Fed will be patient in raising interest rates (stressing that the US labor market still showed some weakness while inflation remains low) dampened sentiments towards the US dollar.47 Meanwhile, reports of strong US jobs data in February sparked speculation that the US Fed may increase its policy rate earlier than expected.48 Consequently, for the period 1-27 March, the peso weakened to average P44.41/US$1.
On a ytd basis, the peso depreciated against the
45 Dollar rates or the reciprocal of the peso-dollar rates were used to compute for the percentage change. 46 On 22 January 2015, the ECB announced an expanded asset purchase program. The program adds the purchase of sovereign bonds to the ECB’s existing private sector asset purchase programmes to address the risks of a too prolonged period of low inflation. The program will encompass the asset-backed securities purchase program (ABSPP) and the covered bond purchase program (CBPP3), which were both launched late last year. Combined monthly purchases will amount to €60 billion. They are intended to be carried out until at least September 2016 and in any case until the Governing Council sees a sustained adjustment in the path of inflation that is consistent with its aim of achieving inflation rates below, but close to, 2% over the medium term. 47 The Institute for Supply Management (ISM) reported that national factory activity in the US fell to 53.5 index points from 55.1 index points a month ago. 48 Nonfarm payrolls rose by 295,000 in February after increasing by a downwardly revised 239,000 in January. February marked the 12th straight month that employment gains have been above 200,000, the longest such run since 1994. The unemployment rate fell to 5.5 percent, the lowest reading since May 2008, but largely reflected people dropping out of the labor force. (Source: US Bureau of Labor Statistics)
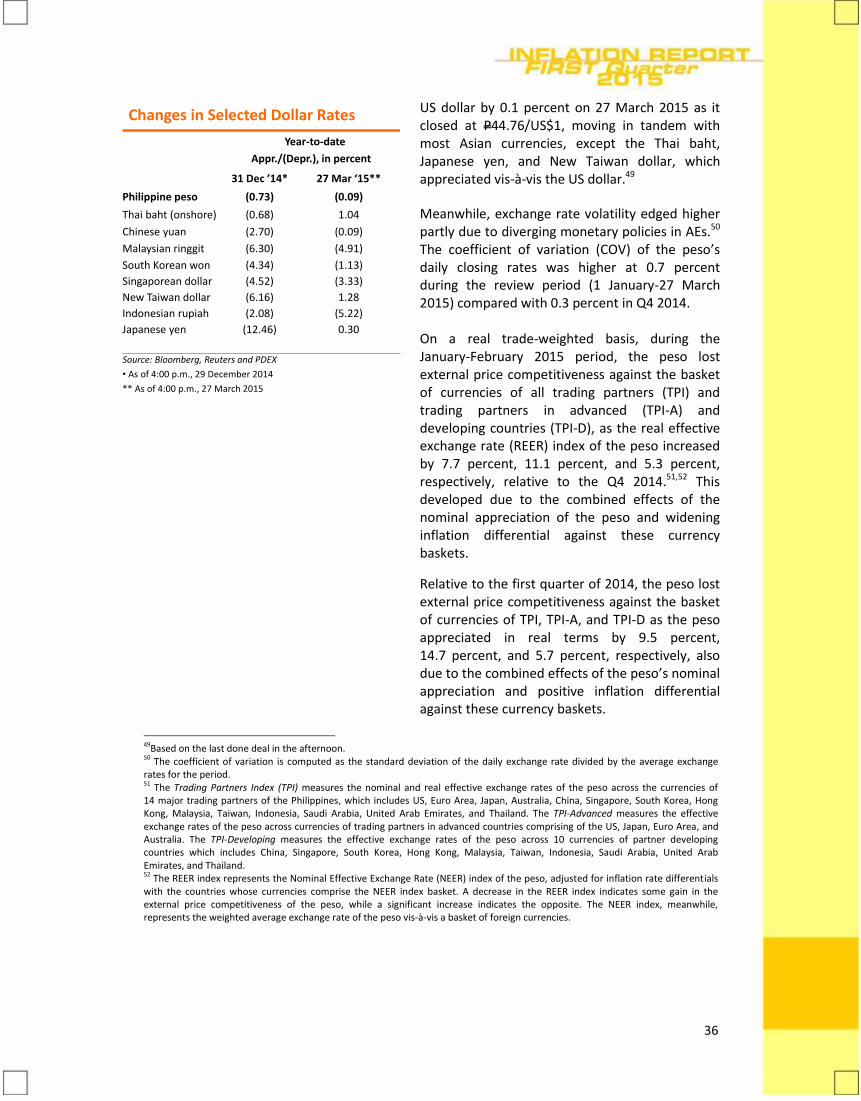
36
Changes in Selected Dollar Rates
Year-to-date
Appr./(Depr.), in percent
31 Dec ’14* 27 Mar ‘15**
Philippine peso (0.73) (0.09)
Thai baht (onshore) (0.68) 1.04
Chinese yuan (2.70) (0.09)
Malaysian ringgit (6.30) (4.91)
South Korean won (4.34) (1.13)
Singaporean dollar (4.52) (3.33)
New Taiwan dollar (6.16) 1.28
Indonesian rupiah (2.08) (5.22)
Japanese yen (12.46) 0.30
Source: Bloomberg, Reuters and PDEX
• As of 4:00 p.m., 29 December 2014
** As of 4:00 p.m., 27 March 2015
US dollar by 0.1 percent on 27 March 2015 as it closed at P44.76/US$1, moving in tandem with most Asian currencies, except the Thai baht, Japanese yen, and New Taiwan dollar, which appreciated vis-à-vis the US dollar.49 Meanwhile, exchange rate volatility edged higher partly due to diverging monetary policies in AEs.50 The coefficient of variation (COV) of the peso’s daily closing rates was higher at 0.7 percent during the review period (1 January-27 March 2015) compared with 0.3 percent in Q4 2014.
On a real trade-weighted basis, during the January-February 2015 period, the peso lost external price competitiveness against the basket of currencies of all trading partners (TPI) and trading partners in advanced (TPI-A) and developing countries (TPI-D), as the real effective exchange rate (REER) index of the peso increased by 7.7 percent, 11.1 percent, and 5.3 percent, respectively, relative to the Q4 2014.51,52 This developed due to the combined effects of the nominal appreciation of the peso and widening inflation differential against these currency baskets.
Relative to the first quarter of 2014, the peso lost external price competitiveness against the basket of currencies of TPI, TPI-A, and TPI-D as the peso appreciated in real terms by 9.5 percent, 14.7 percent, and 5.7 percent, respectively, also due to the combined effects of the peso’s nominal appreciation and positive inflation differential against these currency baskets.
49Based on the last done deal in the afternoon. 50 The coefficient of variation is computed as the standard deviation of the daily exchange rate divided by the average exchange rates for the period. 51 The Trading Partners Index (TPI) measures the nominal and real effective exchange rates of the peso across the currencies of 14 major trading partners of the Philippines, which includes US, Euro Area, Japan, Australia, China, Singapore, South Korea, Hong Kong, Malaysia, Taiwan, Indonesia, Saudi Arabia, United Arab Emirates, and Thailand. The TPI-Advanced measures the effective exchange rates of the peso across currencies of trading partners in advanced countries comprising of the US, Japan, Euro Area, and Australia. The TPI-Developing measures the effective exchange rates of the peso across 10 currencies of partner developing countries which includes China, Singapore, South Korea, Hong Kong, Malaysia, Taiwan, Indonesia, Saudi Arabia, United Arab Emirates, and Thailand. 52 The REER index represents the Nominal Effective Exchange Rate (NEER) index of the peso, adjusted for inflation rate differentials with the countries whose currencies comprise the NEER index basket. A decrease in the REER index indicates some gain in the external price competitiveness of the peso, while a significant increase indicates the opposite. The NEER index, meanwhile, represents the weighted average exchange rate of the peso vis-à-vis a basket of foreign currencies.
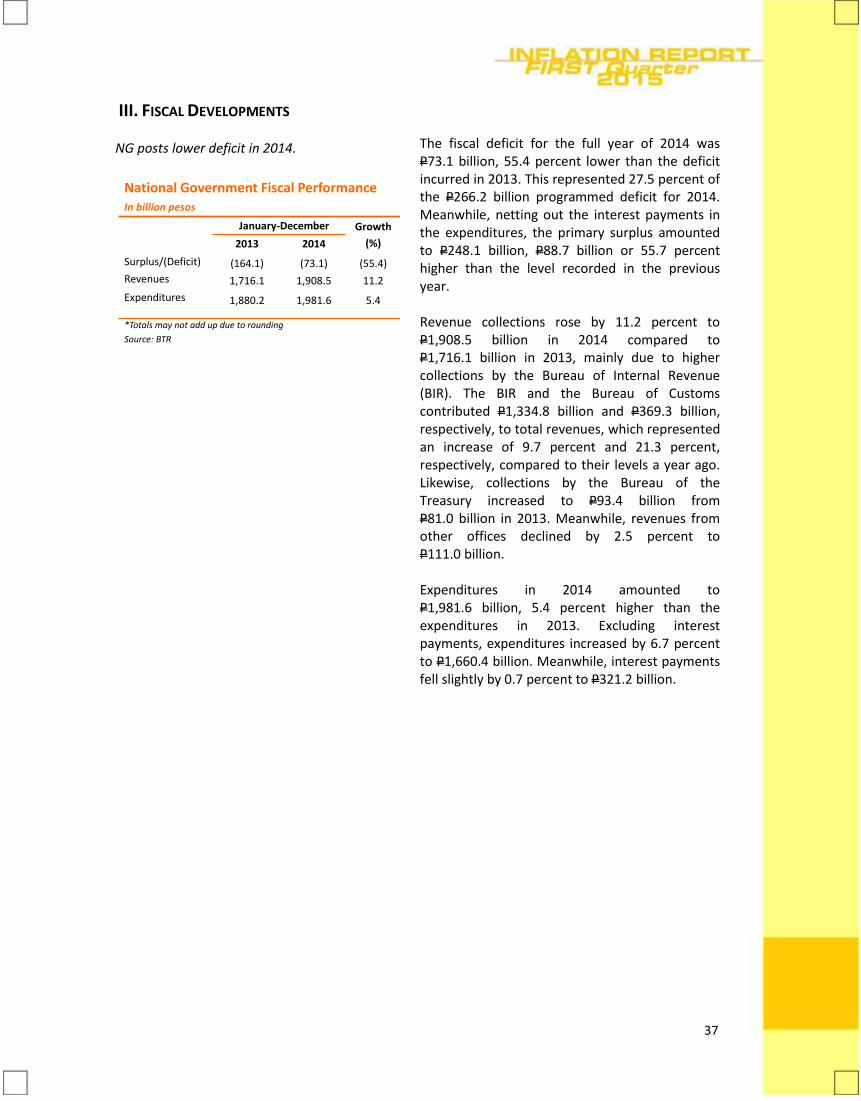
37
III. FISCAL DEVELOPMENTS NG posts lower deficit in 2014.
National Government Fiscal PerformanceIn billion pesos
January-December Growth
(%)2013 2014
Surplus/(Deficit) (164.1) (73.1) (55.4)
Revenues 1,716.1 1,908.5 11.2
Expenditures 1,880.2 1,981.6 5.4
*Totals may not add up due to rounding
Source: BTR
The fiscal deficit for the full year of 2014 was P73.1 billion, 55.4 percent lower than the deficit incurred in 2013. This represented 27.5 percent of the P266.2 billion programmed deficit for 2014. Meanwhile, netting out the interest payments in the expenditures, the primary surplus amounted to P248.1 billion, P88.7 billion or 55.7 percent higher than the level recorded in the previous year. Revenue collections rose by 11.2 percent to P1,908.5 billion in 2014 compared to P1,716.1 billion in 2013, mainly due to higher collections by the Bureau of Internal Revenue (BIR). The BIR and the Bureau of Customs contributed P1,334.8 billion and P369.3 billion, respectively, to total revenues, which represented an increase of 9.7 percent and 21.3 percent, respectively, compared to their levels a year ago. Likewise, collections by the Bureau of the Treasury increased to P93.4 billion from P81.0 billion in 2013. Meanwhile, revenues from other offices declined by 2.5 percent to P111.0 billion. Expenditures in 2014 amounted to P1,981.6 billion, 5.4 percent higher than the expenditures in 2013. Excluding interest payments, expenditures increased by 6.7 percent to P1,660.4 billion. Meanwhile, interest payments fell slightly by 0.7 percent to P321.2 billion.
38
IV. EXTERNAL DEVELOPMENTS Overall global economic activity improves. Economic growth in the US remains firm.
Growth in the US remains firm, while economic activity in the euro area and Japan appears to have improved. Meanwhile growth in major emerging markets, particularly in China and India, continues to be modest. The JP Morgan Global All-Industry Output Index rose to 53.9 in February from 53.0 in January, signaling a faster rate of expansion in both the manufacturing and services sectors due to faster inflows of new orders. Output growth continued to be strong in Ireland, the UK, and the US. Economic activity in the euro area and in major emerging markets, particularly in China, India, and Brazil, likewise improved. By contrast, economic activity remained weak in Japan, while the output contraction in Russia deepened.53 Meanwhile, the global inflation environment remains benign, reflecting a broadly subdued outlook on international commodity prices. The price of oil, in particular, is likely to remain soft in the near term amid a glut in global supply. Real GDP increased by 2.2 percent q-o-q in Q4 2014, slower than the 5.0-percent expansion recorded in the previous quarter. On a y-o-y basis, real output growth was likewise slower at 2.4 percent compared to 2.7 percent in Q4 2013. The deceleration during the quarter reflected an increase in imports, a downturn in federal government spending, and a deceleration in nonresidential fixed investment.54 The manufacturing PMI eased to 52.9 in February 2015 from 53.5 in January.55 Business sentiment remained generally upbeat as domestic demand stayed firm, although some respondents reported increasing concern over the potential adverse
53 JP Morgan Global Manufacturing & Services PMI, http://www.markiteconomics.com/Survey/PressRelease.mvc/febc72758d7e4f4da8961c17c008d1f9 54 US Bureau of Economic Analysis, “National Income and Product Accounts Gross Domestic Product: Fourth Quarter and Annual 2014 (Second Estimate),” news release, 27 March 2015. http://www.bea.gov/newsreleases/national/gdp/2015/pdf/gdp4q14_3rd.pdf 55 Institute for Supply Management, “February 2015 Manufacturing ISM Report On Business”, 2 March 2015, http://www.ism.ws/ISMReport/MfgROB.cfm.
39
Various indicators point to improvements in economic activity in the euro area.
impact of the congestion in West Coast ports on trade and retail activity.56 The CPI rose by 0.2 percent on a m-o-m, seasonally adjusted basis in February as the indices for shelter, energy (including gasoline), and food items increased. Meanwhile, the unemployment rate eased further to 5.5 percent in February from 5.7 percent in January. Total nonfarm payroll employment increased by 295,000 in February, with gains noted in food services and drinking places, professional and business services, construction, health care, and transportation and warehousing.
Measures of consumer confidence continued to indicate a generally optimistic outlook by households on account of favorable prospects for employment. The Conference Board Consumer Confidence Index rose to 101.3 in March from 98.8 in the previous month,57 while the Thomson-Reuters/University of Michigan Index of Consumer Sentiment declined slightly to 93.0 in March from 95.4 in February.58 On a q-o-q basis, real GDP expanded by 0.3 percent in Q4 2014, slightly faster than the 0.2-percent increase in the previous quarter. On a y-o-y basis, real GDP growth was likewise faster at 0.9 percent in Q4 2014 compared to 0.8 percent in Q3 2014.59 The composite PMI for the euro area rose from 53.3 in February 2015 to 54.1 in March, its highest level since May 2011, as overall growth in new business accelerated.60 Strong output growth was recorded across the region, particularly in Germany. The rate of output expansion also continued to improve in France. However, concerns over the economic and political conditions in Russia and Greece persist.
56 The port congestion is due to labor disputes between West Coast dockworkers and port terminal operators. Various news reports indicate that a tentative deal between the parties had been reached in late February 2015 after nine months of negotiations. In the meantime, delayed or rerouted shipments are expected to weigh down on trade and exports performance. 57 “The Conference Board Consumer Confidence Index Declines.” 24 February 2015. http://www.conference-board.org/data/consumerconfidence.cfm 58 “Consumers Remain Optimistic.” 27 February 2015. http://press.sca.isr.umich.edu/press/press_release 59 Eurostat news release 42/2015 dated 6 March 2015. 60 Markit Eurozone Composite PMI (flash estimate), http://www.markiteconomics.com/Survey/PressRelease.mvc/f969e097835f4ead892757c62f709814
40
Output growth rises slightly in Japan. Economic activity in China remains soft.
The European Commission’s Economic Sentiment Indicator for the euro area increased to 103.9 in March from 102.3 in the previous month, driven mainly by the improvement in consumer sentiment owing to more favorable assessments of broad economic conditions and employment prospects. Sentiment among managers in retail trade, services, construction, and industry was similarly more favorable.61 The seasonally adjusted unemployment rate declined to 11.3 percent in February from 11.4 percent in January.62 Meanwhile, prices declined at a slower pace of 0.1 percent in March from 0.3 percent in February.63 Deflationary pressures were noted to have eased owing to higher wages and rising import costs resulting from the depreciation of the euro. On a q-o-q basis, real GDP increased by 0.4 percent in Q4 2014 after falling by 0.7 percent in the previous quarter.64 However, real GDP contracted by 0.8 percent y-o-y in Q4 2014, following the 1.4-percent decline in Q3 2014. The q-o-q growth during the quarter reflected the waning effects of the decline in demand, especially for durable consumer goods, following the consumption tax hike. Meanwhile, the seasonally adjusted manufacturing PMI eased to 50.4 in March 2015 from 51.6 in February, indicating sustained but slower growth in output. New export orders increased as the yen depreciated.65 Inflation declined to 2.2 percent y-o-y in February from 2.4 percent y-o-y in January. The seasonally adjusted unemployment rate decreased to 3.5 percent in February from 3.6 percent in January. Real GDP grew by 7.3 percent y-o-y in Q4 2014, the same pace as in Q3 2014. Meanwhile, the seasonally adjusted manufacturing PMI declined
61 European Commission. http://ec.europa.eu/economy_finance/db_indicators/surveys/documents/2015/esi_2015_03_en.pdf 62 Eurostat news release 57/2015 dated 31 March 2015. 63 Flash estimate only. Eurostat news release 58/2015 dated 31 March 2015. 64 Second estimates by the Department of National Accounts, Economic and Social Research Institute, Cabinet Office. http://www.esri.cao.go.jp/jp/sna/data/data_list/sokuhou/files/2014/qe144_2/pdf/jikei_1.pdf 65 Markit/JMMA Japan Manufacturing PMI (flash estimate), http://www.markiteconomics.com/Survey/PressRelease.mvc/f8c440b1bcca4e76b3f2d6ec4a5d3e37
41
Growth conditions in India improve modestly. Major central banks adjust their monetary policy settings due to lower oil prices and subdued domestic growth conditions.
to 49.2 in March 2015 from 50.7 a month earlier, signaling a decline in new domestic orders.66 Inflation rose to 1.4 percent in February from 0.8 percent in the previous month. The prices of food, particularly eggs, fresh fruits and vegetables, and grains, drove inflation during the month. Real GDP increased by 5.3 percent y-o-y in Q3 2014, slower than the 5.7-percent expansion in the previous quarter, as unfavorable weather conditions constrained agricultural production. Industrial production likewise slowed down amid weak domestic demand. Meanwhile, the composite PMI rose slightly to 53.5 in February 2015 from 53.3 in January, as new businesses in the services sector increased while new orders and output in the manufacturing sector moderated.67 CPI inflation rose to 5.4 percent in February from 5.2 percent a month earlier. A number of central banks decided to adjust their monetary policy settings during the quarter to help support domestic economic activity and guard against downside risks to inflation owing to the sharp decline in international oil prices. On 15 January 2015, the Reserve Bank of India (RBI) lowered the policy repo rate by 25 bps to 7.75 percent to support economic growth amid signs of cooling inflation. The RBI cut the policy repo rate by another 25 bps on 4 March 2015. On 21 January 2015, the Bank of Canada reduced its overnight rate by 25 bps to 0.75 percent in response to the sharp drop in oil prices, which the Bank considered to contribute negatively to growth and inflation in Canada. On 28 January 2015, the Monetary Authority of Singapore reduced the slope of the Singapore Dollar NEER policy from 2 percent to 1 percent to slow the appreciation of the Singaporean dollar.
66 HSBC China Manufacturing PMI (flash estimate), http://www.markiteconomics.com/Survey/PressRelease.mvc/36e42fb4a12a4d8f94bf449e38ef2b2e 67 HSBC India Services PMI (with Composite PMI Data), http://www.markiteconomics.com/Survey/PressRelease.mvc/eeb6a39f0bb440cab83591f4036e264b
42
On 22 January 2015, the ECB launched its quantitative easing program—the Expanded Asset Purchase Program—to help counter potential adverse impact of weaker-than-expected inflation outturns on the formation of inflation expectations, as the potential for second-round effects of low oil prices on wage- and price-setting was assessed to have increased. On 3 February, the Reserve Bank of Australia decided to reduce the cash rate by 25 bps to 2.25 percent to help support domestic demand as growth remained below trend. On 17 February, Bank Indonesia lowered its BI rate by 25 bps to 7.5 percent amid a manageable inflation environment, with inflation expected to settle at the lower end of the 4.0 percent ± 1 ppt range in 2015 and 2016.
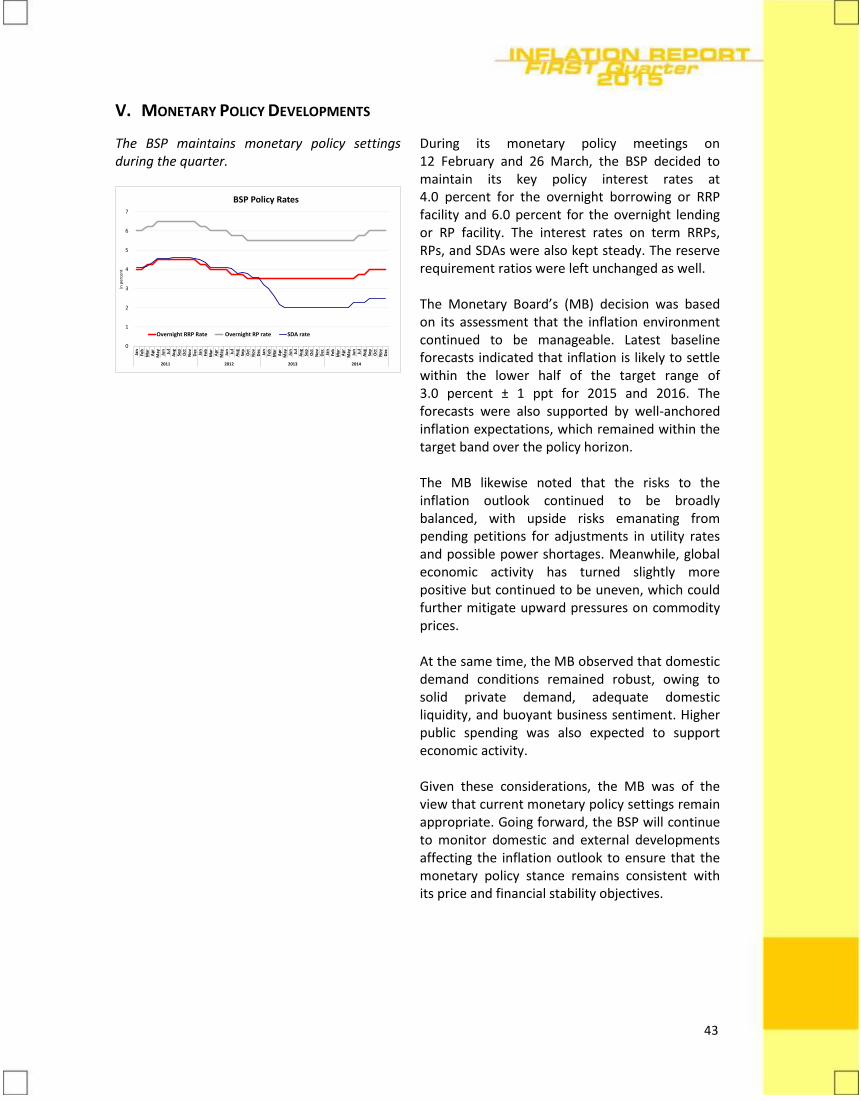
43
V. MONETARY POLICY DEVELOPMENTS
The BSP maintains monetary policy settings during the quarter.
0
1
2
3
4
5
6
7
Jan
Feb
Mar
Ap
rM
ay Jun
Jul
Au
gSe
pO
ctN
ov
Dec Jan
Feb
Mar
Ap
rM
ay Jun
Jul
Au
gSe
pO
ctN
ov
Dec Jan
Feb
Mar
Ap
rM
ay Jun
Jul
Au
gSe
pO
ctN
ov
Dec Jan
Feb
Mar
Ap
rM
ay Jun
Jul
Au
gSe
pO
ctN
ov
Dec
2011 2012 2013 2014
in p
erce
nt
BSP Policy Rates
Overnight RRP Rate Overnight RP rate SDA rate
During its monetary policy meetings on 12 February and 26 March, the BSP decided to maintain its key policy interest rates at 4.0 percent for the overnight borrowing or RRP facility and 6.0 percent for the overnight lending or RP facility. The interest rates on term RRPs, RPs, and SDAs were also kept steady. The reserve requirement ratios were left unchanged as well. The Monetary Board’s (MB) decision was based on its assessment that the inflation environment continued to be manageable. Latest baseline forecasts indicated that inflation is likely to settle within the lower half of the target range of 3.0 percent ± 1 ppt for 2015 and 2016. The forecasts were also supported by well-anchored inflation expectations, which remained within the target band over the policy horizon. The MB likewise noted that the risks to the inflation outlook continued to be broadly balanced, with upside risks emanating from pending petitions for adjustments in utility rates and possible power shortages. Meanwhile, global economic activity has turned slightly more positive but continued to be uneven, which could further mitigate upward pressures on commodity prices. At the same time, the MB observed that domestic demand conditions remained robust, owing to solid private demand, adequate domestic liquidity, and buoyant business sentiment. Higher public spending was also expected to support economic activity. Given these considerations, the MB was of the view that current monetary policy settings remain appropriate. Going forward, the BSP will continue to monitor domestic and external developments affecting the inflation outlook to ensure that the monetary policy stance remains consistent with its price and financial stability objectives.
44
VI. INFLATION OUTLOOK
BSP Inflation Forecasts Results of the BSP’s latest forecasting exercises indicate within-target inflation over the policy horizon.
Inflation is expected to remain manageable over the policy horizon. The latest BSP baseline forecasts point to within-target inflation over the next two years. The inflation projections are lower compared to the previous quarter owing mainly to the continued easing in oil prices as well as the lower-than-assumed actual wage increase. The forecasts also suggest that inflation could settle below the midpoint of the 3.0 percent ± 1.0 ppt target range in 2015-2016. Demand Conditions Key indicators continue to suggest robust domestic demand. Real GDP grew by 6.1 percent in 2014, well within the revised DBCC target range of 6.0–7.0 percent, driven mainly by resilient private demand and improved external trade position. Other real sector indicators also attest to the strength of economic activity in the country. In particular, there have been improvements in labor market conditions, while manufacturing indices suggest sustained expansion in production. The unemployment rate is lower compared to its level a year ago, based on the results of the January 2015 LFS. At the same time, more than half of all major manufacturing sectors continued to operate above 80 percent of their capacity. The composite PMI also rose in February 2015 to its highest level since November 2014. At the same time, BSP-conducted surveys suggest that households and businesses remain optimistic in their outlook for the local economy. In particular, next quarter expectations are upbeat with the anticipated pick-up in the economic activity during the summer season. Secondary harvest, open fishing season, influx of both local and foreign tourists as well as expansion of businesses and introduction of new product lines are anticipated to support real sector activity during the summer months.
45
Favorable supply prospects point to manageable inflation environment.
Supply Conditions Commodity prices are expected to remain manageable, owing largely to favorable supply conditions. Food inflation is likely to remain benign over the near term on expectations of ample harvests. Similarly, oil prices are expected to remain below 2014 levels as current oil market fundamentals are expected to persist over the near term. However, some upside pressures could emerge. The emergence of a weak El Niño in the first half of the year could affect harvest. In the oil market, some gradual increase is anticipated as the oil market rebalances. Similarly, the possibility of a sharp rebound in oil prices cannot not be fully discounted given the sizeable uncertainty on how supply may respond to prices. The Food and Agriculture Organization (FAO) forecasts world cereal production to reach a new record high of 2,541.8 million tonnes in 2014, 0.8 percent higher than last year’s harvest of 2,522.2 million tonnes. The FAO forecasts global cereal stocks available for 2015 to reach 630.5 million tonnes, 49.7 million tonnes (8.6 percent) higher than the level last year. This projected global stock is the largest inventory level registered in the last 15 years. As a result of the build-up of inventories, the global stocks-to-use ratio could settle at a 13-year high of 25.4 percent on account of significant rise in wheat and coarse grain stocks.68 In the domestic front, the PSA anticipates Q1 2015 palay harvests to be at 4.46 million tonnes, 0.15 million tonnes (3.5 percent) higher than the production level in the same period a year ago. Meanwhile, corn production could increase by 0.15 million tonnes (6.6 percent) to 2.43 million tonnes in Q1 2015.69 Meanwhile, forecasts from the Climate Prediction Center of the US National Oceanic and Atmospheric Administration (NOAA) and International Research Institute for Climate and
68 FAO, Cereal Supply and Demand Brief, 5 March 2015, available online at http://www.fao.org 69 PSA, Updates on Rice and Corn Forecasts, 9 March 2015, available online at http://www.bas.gov.ph
46
Output gap estimate remains positive.
Society (IRI) indicate 50–60 percent chance of an El Niño weather anomaly in the first five months of the year. Thereafter, forecasts suggest an increasing probability of a return to ENSO-neutral conditions. Meanwhile, the Philippine Atmospheric, Geophysical and Astronomical Services Administration (PAGASA) announced the onset of weak El Niño conditions in the country. This can have an impact on rainfall patterns and result in warmer air temperatures over the coming months. While the local weather bureau estimates that the country could experience the normal number of tropical cyclones for the year, weak El Niño conditions can result in tropical cyclones with more erratic patterns and higher intensity.70 Less favorable weather conditions can also have an adverse impact on agricultural production for the year. Meanwhile, international oil prices have decreased significantly compared to the previous quarter’s level as the market remains well-supplied. Consequently, domestic pump prices declined markedly compared to the previous quarter. Looking ahead, futures prices of oil as well as forecasts by multilateral agencies suggest that oil prices are likely to remain below 2014 levels. However, some gradual increase is projected as the oil market rebalances. In particular, the current low oil prices may discourage new unconventional oil projects, triggering a reduction in global oil surplus. Oil prices will remain under pressure particularly in the first half of 2015 as the global oil market remains oversupplied. These downward pressures should become less pronounced in the second half of 2015 owing to supply and demand responses to prices. As such, futures prices of oil suggest a modest uptrend going into 2H 2015 onwards. Likewise, the current IMF oil price forecasts suggest a moderate upward trajectory. Meanwhile, the World Bank expects oil prices to remain relatively low and to recover modestly beginning 2016. The balance of demand and supply conditions as captured by the output gap (or the difference
70PAGASA, Weak El Niño in Progress, 12 March 2015, available online at http://pagasa.dost.gov.ph
47
between actual and potential output), provides an indication of potential inflationary pressures in the near term. Inflation tends to rise (fall) when demand for goods and services exerts pressure on the economy’s ability to produce goods and services, i.e., when the output gap is positive (negative). Given the latest GDP data, preliminary estimates by the BSP show a higher positive output gap in Q4 2014 relative to the previous quarter. The output gap widened as the q‐o‐q expansion in the actual output outpaced the growth in potential output during the review period.71 Key assumptions used to generate the BSP’s inflation forecasts The BSP's baseline inflation forecasts generated from the BSP’s single equation model (SEM) and the multi‐equation model (MEM) are based on the following assumptions:
1) BSP’s overnight RRP rate at 4.00 percent from April 2015 to December 2016;
2) BSP’s reserve requirement at 20.0 percent from April 2015 to December 2016;
3) NG fiscal deficits for 2015 to 2016, which are consistent with the DBCC-approved estimates;
4) Dubai crude oil price assumptions, the trend of which is consistent with the trend of the futures prices of oil in the international market;
5) Increase in nominal wage of 3.2 percent in April 2015 and 5.6 percent in March 2016;
6) Real GDP growth are endogenously determined in the BSP’s MEM; and
7) Foreign exchange rate are endogenously determined in the BSP’s MEM through the purchasing power parity and interest rate parity relationships.
71Based on the seasonally-adjusted GDP growth
48
Risks to the Inflation Outlook
The current fan chart suggests that the inflation path has shifted downwards, but remains within target. The risks to the inflation outlook are broadly balanced.
The risks to the inflation outlook may be presented graphically through a fan chart. The fan chart depicts the probability of different inflation outcomes based on the central projection (corresponding to the baseline forecast of the BSP) and the risks surrounding the inflation outlook. Compared to the previous inflation report, the latest fan chart presents a downward shift in the inflation path for 2015 and 2016. The lower inflation projections in the latest report could be attributed mainly to the significant decline in oil prices and the lower-than-assumed actual wage hike. The latest central inflation projections indicate that inflation would likely settle below the midpoint of the 3.0 percent ± 1.0 ppt inflation target range for 2015–2016. Barring adverse shocks, inflation is expected to remain low in 2015, near the low-end of the target range. Thereafter, the forecast path suggests a modest uptrend into 2016, but still remaining within the lower half of the target range. The latest fan chart also shows that there are uncertainties further out as shown by the widening bands of the chart over time. The BSP’s review of current price trends and risks to future inflation suggests that the distribution of risks of the inflation outlook is broadly balanced. This assessment is captured in the latest fan chart by the relatively balanced bands above and below the central projection. Potential adjustments in electricity given pending petitions and looming power shortage during the summer months of 2015 represent upside risks to inflation, while slower global economic activity and pending petitions for transport fare reduction pose downside risk to inflation. The possibility of power outages could raise generation prices. Reports suggest that the
49
country has thin power reserves and outages could occur during peak times in the summer months of 2015. Should the outages materialize, production costs would likely increase, potentially resulting in manufacturing delays. These could cause inflationary pressures. Moreover, the pending petition of Meralco on the December 2013 rate adjustment, which is still under the temporary restraining order of the Supreme Court, continues to pose upside risk to inflation forecasts. The possibility of slower global economic growth could imply weaker demand-related price pressures. Ongoing economic uncertainty and risk of deflation in the euro area, potentially bumpy US Fed exit with the wide divergence between market expectations and the US Fed’s own forward guidance, and soft growth conditions in China represent downside risks to the global outlook. Moreover, the pending petition before the LTFRB to lower nationwide fares of buses could further pull down inflation. The petition for buses constitutes a 20.0 percent (or P2.00) reduction for the first five kilometers and 18.9 percent (or P0.35) reduction for every succeeding kilometer from P1.85 to P1.50.
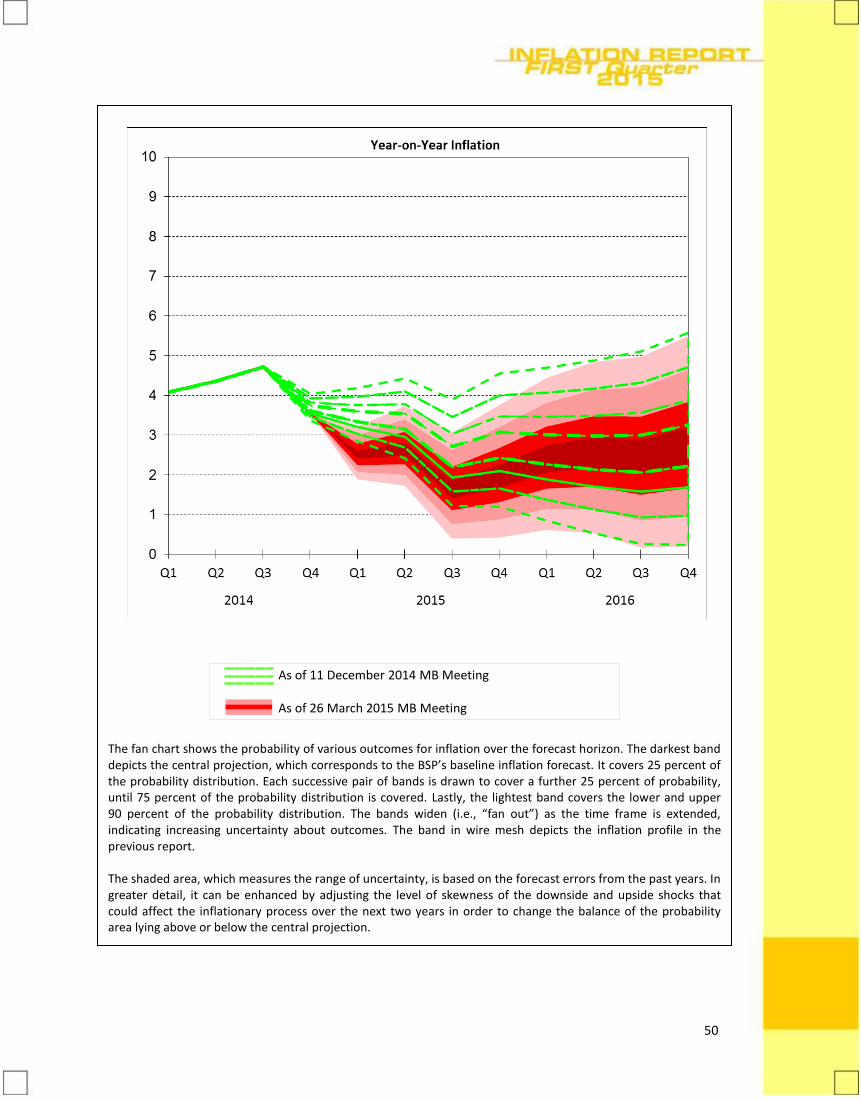
50
As of 11 December 2014 MB Meeting
As of 26 March 2015 MB Meeting
The fan chart shows the probability of various outcomes for inflation over the forecast horizon. The darkest band depicts the central projection, which corresponds to the BSP’s baseline inflation forecast. It covers 25 percent of the probability distribution. Each successive pair of bands is drawn to cover a further 25 percent of probability, until 75 percent of the probability distribution is covered. Lastly, the lightest band covers the lower and upper 90 percent of the probability distribution. The bands widen (i.e., “fan out”) as the time frame is extended, indicating increasing uncertainty about outcomes. The band in wire mesh depicts the inflation profile in the previous report. The shaded area, which measures the range of uncertainty, is based on the forecast errors from the past years. In greater detail, it can be enhanced by adjusting the level of skewness of the downside and upside shocks that could affect the inflationary process over the next two years in order to change the balance of the probability area lying above or below the central projection.
51
VII. IMPLICATIONS FOR THE MONETARY POLICY STANCE
The average headline inflation is projected to be within the inflation target range over the policy horizon.
Inflation expectations reflected in forecast surveys of private sector economists are well within the target band over the policy horizon.
Headline inflation and other price indicators ease further.
The latest average baseline forecasts show that the inflation rates could settle below the midpoint of the 3.0 percent ± 1.0 ppt inflation target range for 2015–2016. The baseline inflation projections are also lower compared to the previous report owing mainly to the continued easing in oil prices as well as lower-than-assumed actual wage increase. Risks to the inflation outlook continue to be broadly balanced. Pending petitions for utility rate adjustments and the potential power shortages are seen to pose upside risks to the baseline inflation forecasts. Meanwhile, downside risks could stem from slower-than-expected global economic activity and pending petitions for transport fare reductions.
Preliminary results of the BSP’s survey of private sector economists for March 2015 yielded lower mean inflation forecasts for 2015-2016, supporting the assessment of within-target inflation outlook. Meanwhile, inflation forecast for 2017 is close to the mid-point of the target range. Results of the March 2015 Consensus Economics inflation forecast survey for the country also showed lower inflation forecasts for 2015 and slightly above the mid-point of the target range for 2016.
In Q1 2015, the headline inflation decelerated to 2.4 percent from 3.6 percent in the previous quarter. Similarly, core inflation along with two of the three alternative measures of core inflation estimated by the BSP was lower in Q1 2015 relative to the previous quarter. Food inflation eased further as most food items, particularly rice and vegetables, posted lower price increases due to ample domestic supply. Likewise, non-food inflation decreased due to lower prices of electricity and domestic petroleum products.
Imported commodity prices are expected to remain subdued. In Q1 2015, international oil prices fall further on record-high US crude stockpiles. Moreover, the FAO forecasts global
52
Indicators for domestic demand remain firm. Global economic prospects have improved slightly.
cereal stocks available for 2015 to be the largest inventory level registered in the last 15 years. Domestic economic activity continued to expand above long-term average in Q4 2014. On the supply side, growth in 2014 was supported by services and industry, particularly manufacturing. On the demand side, economic activity was driven by resilient private domestic demand and improved external trade position. Meanwhile, various economic indicators point to continued economic upturn in the first quarter. Results of the Q1 2015 business expectations surveys showed positive confidence in the first half of 2015. Results of the recent consumer expectations survey also showed improved consumer sentiment for Q1 2015 and for the next 12 months. Likewise, the monthly survey of purchasing managers suggests that the Philippine economy was still in an expansion phase. At the same time, the lower unemployment rate in January 2015 relative to its level a year ago indicates gradual improvements in labor market conditions, which can provide further boost to domestic demand. Thus, private domestic demand is expected to continue to deliver positive impulses to the economy. Sustained and broad-based expansion in bank lending is expected to continue to underpin domestic economic activity. Improved government spending should also further support stable domestic demand.
Growth in the US remains firm, underpinned by sustained gains in labor market conditions. Economic activity in the euro area and Japan appears to have improved, but growth in major EMs, particularly in China and India, continues to be modest. The risk of deflation also remains a concern, particularly in the euro area and Japan. With regard to central bank policy actions, a number of central banks had adjusted policy settings in recent months to address the effect of lower oil prices and to support economic growth. The ECB loosened further its monetary policy settings in March 2015 with the expanded asset
53
On balance, current monetary policy settings remain appropriate in view of the emerging outlook for inflation and demand conditions.
purchase program. By contrast, the US Fed dropped the word “patient” from its interest rate forward guidance, but revealed a more cautious outlook, resulting in the scaling back of market expectations on how fast authorities would move to tighten monetary policy. The latest outlook for inflation shows a lower but within-target path over the policy horizon. Inflation expectations remain well-contained, while domestic activity continues to expand at a solid pace amid adequate liquidity and sustained broad-based credit growth. Meanwhile, imported commodity prices are expected to be manageable, reflecting favorable global supply conditions. The outlook for global economic growth as well as shifts in foreign monetary policies especially in major AE central banks could be an important consideration over the quarters ahead to the extent that they can influence inflation expectations and market sentiment at home. Going forward, the BSP remains attentive to evolving price and output developments and stands ready to undertake preemptive policy actions as necessary to safeguard its price and financial stability objectives.
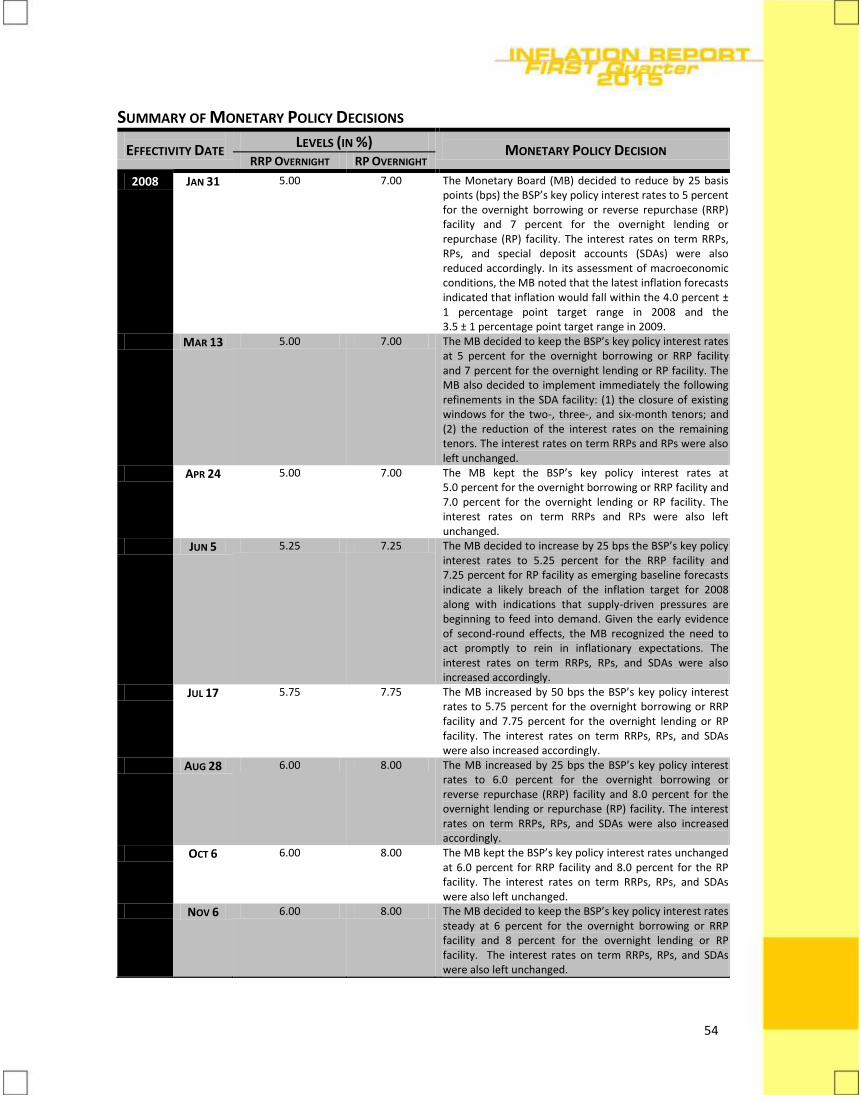
54
SUMMARY OF MONETARY POLICY DECISIONS
EFFECTIVITY DATE LEVELS (IN %)
MONETARY POLICY DECISION RRP OVERNIGHT RP OVERNIGHT
2008 JAN 31 5.00 7.00 The Monetary Board (MB) decided to reduce by 25 basis points (bps) the BSP’s key policy interest rates to 5 percent for the overnight borrowing or reverse repurchase (RRP) facility and 7 percent for the overnight lending or repurchase (RP) facility. The interest rates on term RRPs, RPs, and special deposit accounts (SDAs) were also reduced accordingly. In its assessment of macroeconomic conditions, the MB noted that the latest inflation forecasts indicated that inflation would fall within the 4.0 percent ± 1 percentage point target range in 2008 and the 3.5 ± 1 percentage point target range in 2009.
MAR 13 5.00 7.00 The MB decided to keep the BSP’s key policy interest rates at 5 percent for the overnight borrowing or RRP facility and 7 percent for the overnight lending or RP facility. The MB also decided to implement immediately the following refinements in the SDA facility: (1) the closure of existing windows for the two-, three-, and six-month tenors; and (2) the reduction of the interest rates on the remaining tenors. The interest rates on term RRPs and RPs were also left unchanged.
APR 24 5.00 7.00 The MB kept the BSP’s key policy interest rates at 5.0 percent for the overnight borrowing or RRP facility and 7.0 percent for the overnight lending or RP facility. The interest rates on term RRPs and RPs were also left unchanged.
JUN 5 5.25 7.25 The MB decided to increase by 25 bps the BSP’s key policy interest rates to 5.25 percent for the RRP facility and 7.25 percent for RP facility as emerging baseline forecasts indicate a likely breach of the inflation target for 2008 along with indications that supply-driven pressures are beginning to feed into demand. Given the early evidence of second-round effects, the MB recognized the need to act promptly to rein in inflationary expectations. The interest rates on term RRPs, RPs, and SDAs were also increased accordingly.
JUL 17 5.75 7.75 The MB increased by 50 bps the BSP’s key policy interest rates to 5.75 percent for the overnight borrowing or RRP facility and 7.75 percent for the overnight lending or RP facility. The interest rates on term RRPs, RPs, and SDAs were also increased accordingly.
AUG 28 6.00 8.00 The MB increased by 25 bps the BSP’s key policy interest rates to 6.0 percent for the overnight borrowing or reverse repurchase (RRP) facility and 8.0 percent for the overnight lending or repurchase (RP) facility. The interest rates on term RRPs, RPs, and SDAs were also increased accordingly.
OCT 6 6.00 8.00 The MB kept the BSP’s key policy interest rates unchanged at 6.0 percent for RRP facility and 8.0 percent for the RP facility. The interest rates on term RRPs, RPs, and SDAs were also left unchanged.
NOV 6 6.00 8.00 The MB decided to keep the BSP’s key policy interest rates steady at 6 percent for the overnight borrowing or RRP facility and 8 percent for the overnight lending or RP facility. The interest rates on term RRPs, RPs, and SDAs were also left unchanged.
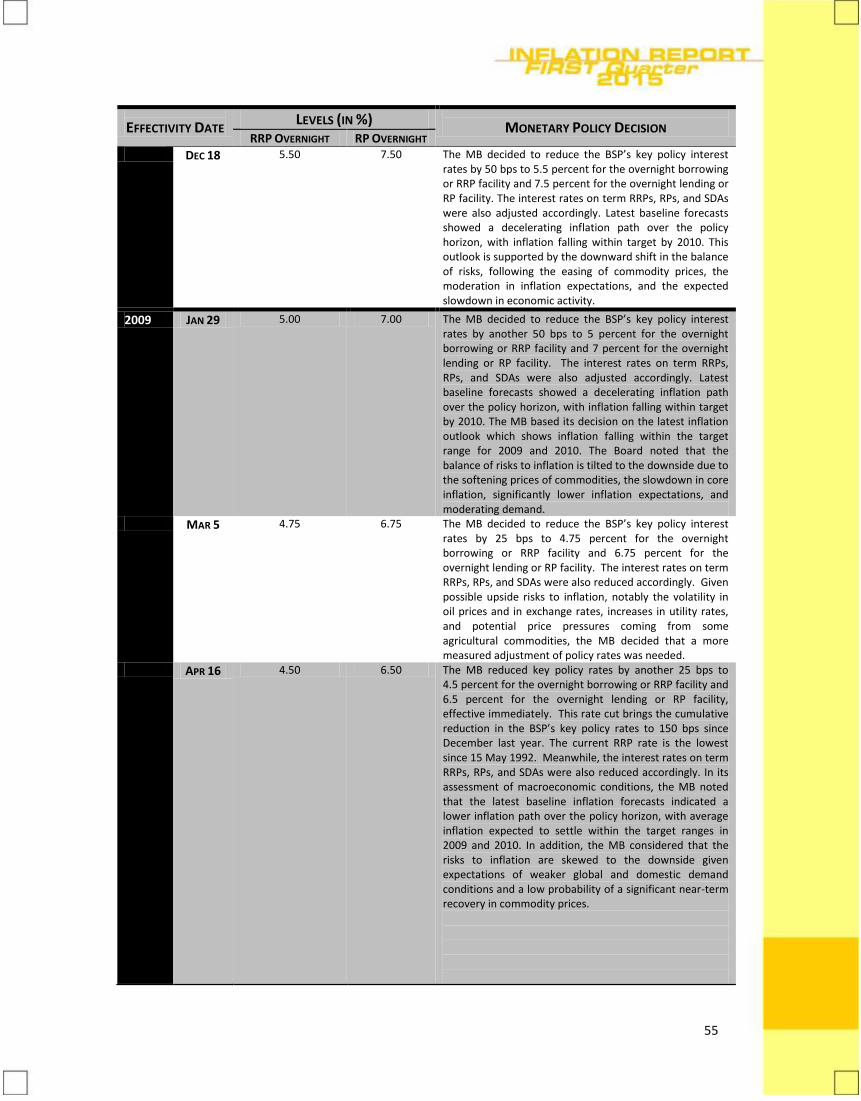
55
EFFECTIVITY DATE LEVELS (IN %)
MONETARY POLICY DECISION RRP OVERNIGHT RP OVERNIGHT
DEC 18 5.50 7.50 The MB decided to reduce the BSP’s key policy interest rates by 50 bps to 5.5 percent for the overnight borrowing or RRP facility and 7.5 percent for the overnight lending or RP facility. The interest rates on term RRPs, RPs, and SDAs were also adjusted accordingly. Latest baseline forecasts showed a decelerating inflation path over the policy horizon, with inflation falling within target by 2010. This outlook is supported by the downward shift in the balance of risks, following the easing of commodity prices, the moderation in inflation expectations, and the expected slowdown in economic activity.
2009 JAN 29 5.00 7.00 The MB decided to reduce the BSP’s key policy interest rates by another 50 bps to 5 percent for the overnight borrowing or RRP facility and 7 percent for the overnight lending or RP facility. The interest rates on term RRPs, RPs, and SDAs were also adjusted accordingly. Latest baseline forecasts showed a decelerating inflation path over the policy horizon, with inflation falling within target by 2010. The MB based its decision on the latest inflation outlook which shows inflation falling within the target range for 2009 and 2010. The Board noted that the balance of risks to inflation is tilted to the downside due to the softening prices of commodities, the slowdown in core inflation, significantly lower inflation expectations, and moderating demand.
MAR 5 4.75 6.75 The MB decided to reduce the BSP’s key policy interest rates by 25 bps to 4.75 percent for the overnight borrowing or RRP facility and 6.75 percent for the overnight lending or RP facility. The interest rates on term RRPs, RPs, and SDAs were also reduced accordingly. Given possible upside risks to inflation, notably the volatility in oil prices and in exchange rates, increases in utility rates, and potential price pressures coming from some agricultural commodities, the MB decided that a more measured adjustment of policy rates was needed.
APR 16 4.50 6.50 The MB reduced key policy rates by another 25 bps to 4.5 percent for the overnight borrowing or RRP facility and 6.5 percent for the overnight lending or RP facility, effective immediately. This rate cut brings the cumulative reduction in the BSP’s key policy rates to 150 bps since December last year. The current RRP rate is the lowest since 15 May 1992. Meanwhile, the interest rates on term RRPs, RPs, and SDAs were also reduced accordingly. In its assessment of macroeconomic conditions, the MB noted that the latest baseline inflation forecasts indicated a lower inflation path over the policy horizon, with average inflation expected to settle within the target ranges in 2009 and 2010. In addition, the MB considered that the risks to inflation are skewed to the downside given expectations of weaker global and domestic demand conditions and a low probability of a significant near-term recovery in commodity prices.
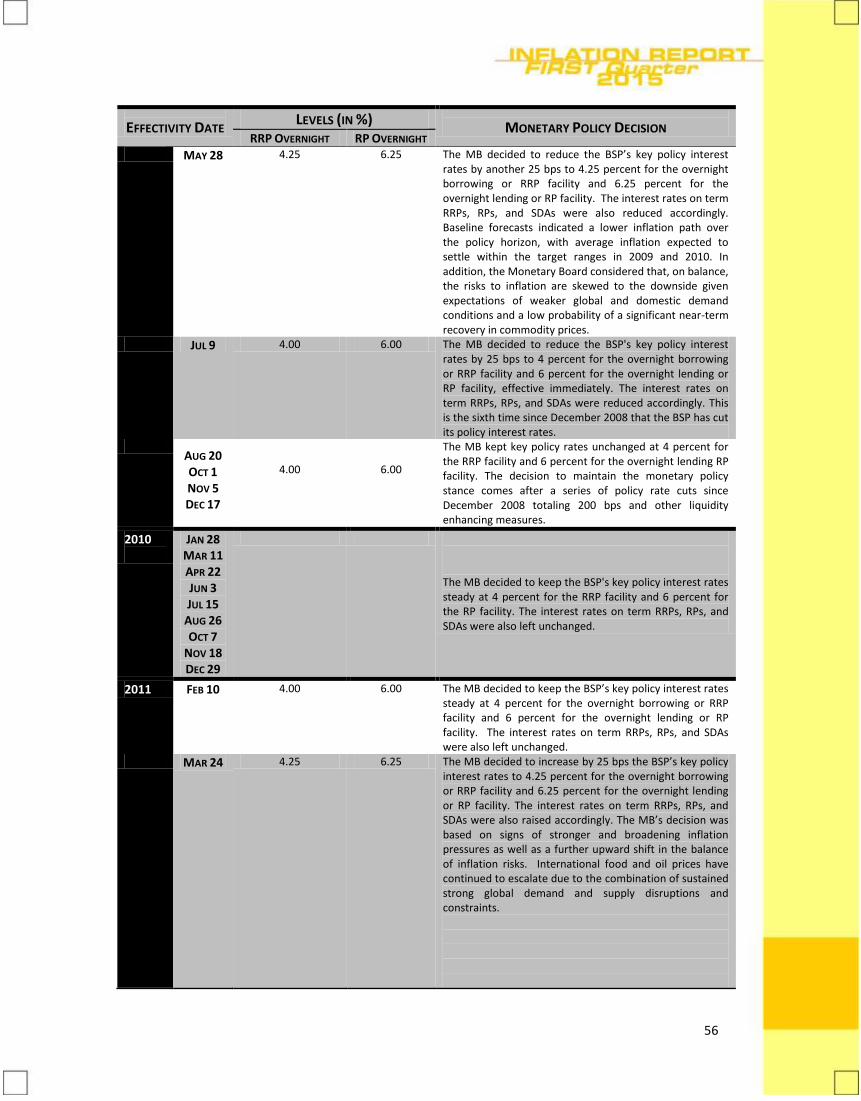
56
EFFECTIVITY DATE LEVELS (IN %)
MONETARY POLICY DECISION RRP OVERNIGHT RP OVERNIGHT
MAY 28 4.25 6.25 The MB decided to reduce the BSP’s key policy interest rates by another 25 bps to 4.25 percent for the overnight borrowing or RRP facility and 6.25 percent for the overnight lending or RP facility. The interest rates on term RRPs, RPs, and SDAs were also reduced accordingly. Baseline forecasts indicated a lower inflation path over the policy horizon, with average inflation expected to settle within the target ranges in 2009 and 2010. In addition, the Monetary Board considered that, on balance, the risks to inflation are skewed to the downside given expectations of weaker global and domestic demand conditions and a low probability of a significant near-term recovery in commodity prices.
JUL 9 4.00 6.00 The MB decided to reduce the BSP's key policy interest rates by 25 bps to 4 percent for the overnight borrowing or RRP facility and 6 percent for the overnight lending or RP facility, effective immediately. The interest rates on term RRPs, RPs, and SDAs were reduced accordingly. This is the sixth time since December 2008 that the BSP has cut its policy interest rates.
AUG 20 OCT 1 NOV 5 DEC 17
4.00
6.00
The MB kept key policy rates unchanged at 4 percent for the RRP facility and 6 percent for the overnight lending RP facility. The decision to maintain the monetary policy stance comes after a series of policy rate cuts since December 2008 totaling 200 bps and other liquidity enhancing measures.
2010
JAN 28 MAR 11 APR 22 JUN 3 JUL 15
AUG 26 OCT 7
NOV 18 DEC 29
The MB decided to keep the BSP's key policy interest rates steady at 4 percent for the RRP facility and 6 percent for the RP facility. The interest rates on term RRPs, RPs, and SDAs were also left unchanged.
2011 FEB 10 4.00 6.00 The MB decided to keep the BSP’s key policy interest rates steady at 4 percent for the overnight borrowing or RRP facility and 6 percent for the overnight lending or RP facility. The interest rates on term RRPs, RPs, and SDAs were also left unchanged.
MAR 24 4.25 6.25 The MB decided to increase by 25 bps the BSP’s key policy interest rates to 4.25 percent for the overnight borrowing or RRP facility and 6.25 percent for the overnight lending or RP facility. The interest rates on term RRPs, RPs, and SDAs were also raised accordingly. The MB’s decision was based on signs of stronger and broadening inflation pressures as well as a further upward shift in the balance of inflation risks. International food and oil prices have continued to escalate due to the combination of sustained strong global demand and supply disruptions and constraints.
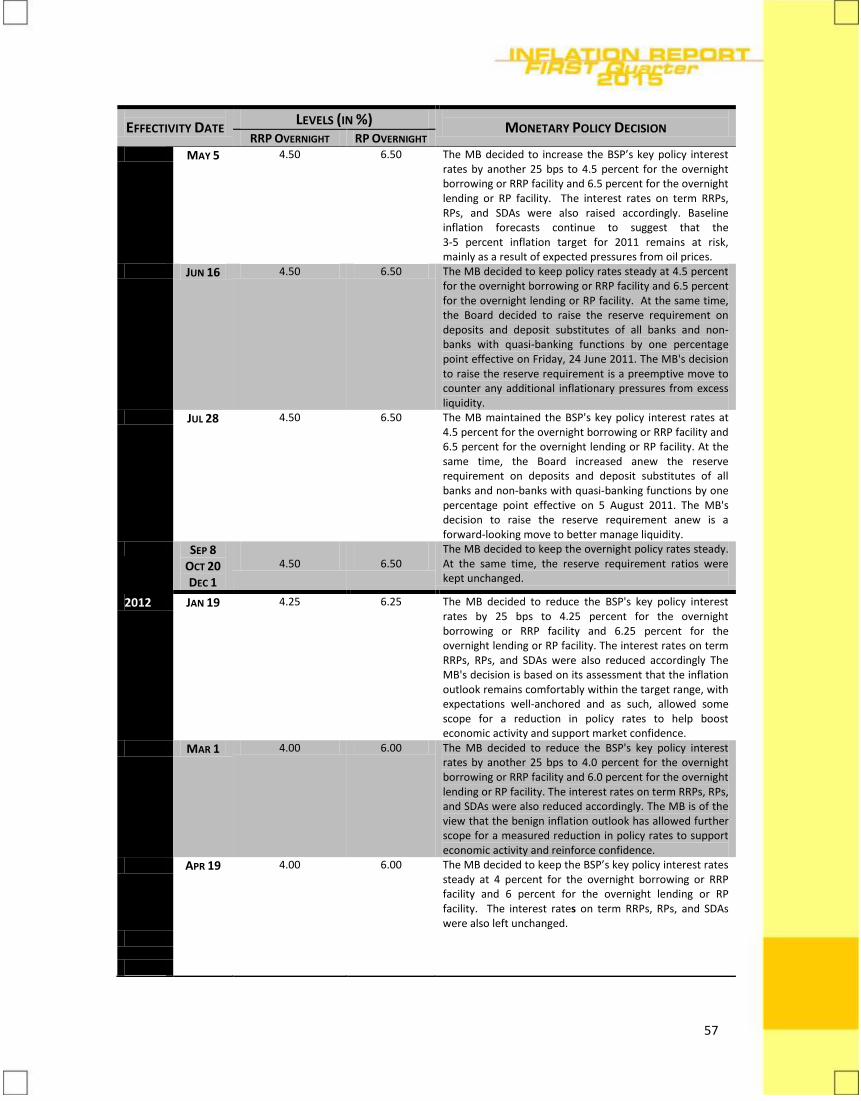
57
EFFECTIVITY DATE LEVELS (IN %)
MONETARY POLICY DECISION RRP OVERNIGHT RP OVERNIGHT
MAY 5 4.50 6.50 The MB decided to increase the BSP’s key policy interest rates by another 25 bps to 4.5 percent for the overnight borrowing or RRP facility and 6.5 percent for the overnight lending or RP facility. The interest rates on term RRPs, RPs, and SDAs were also raised accordingly. Baseline inflation forecasts continue to suggest that the 3-5 percent inflation target for 2011 remains at risk, mainly as a result of expected pressures from oil prices.
JUN 16 4.50 6.50 The MB decided to keep policy rates steady at 4.5 percent for the overnight borrowing or RRP facility and 6.5 percent for the overnight lending or RP facility. At the same time, the Board decided to raise the reserve requirement on deposits and deposit substitutes of all banks and non-banks with quasi-banking functions by one percentage point effective on Friday, 24 June 2011. The MB's decision to raise the reserve requirement is a preemptive move to counter any additional inflationary pressures from excess liquidity.
JUL 28 4.50 6.50 The MB maintained the BSP's key policy interest rates at 4.5 percent for the overnight borrowing or RRP facility and 6.5 percent for the overnight lending or RP facility. At the same time, the Board increased anew the reserve requirement on deposits and deposit substitutes of all banks and non-banks with quasi-banking functions by one percentage point effective on 5 August 2011. The MB's decision to raise the reserve requirement anew is a forward-looking move to better manage liquidity.
SEP 8 OCT 20 DEC 1
4.50
6.50
The MB decided to keep the overnight policy rates steady. At the same time, the reserve requirement ratios were kept unchanged.
2012 JAN 19
4.25 6.25 The MB decided to reduce the BSP's key policy interest rates by 25 bps to 4.25 percent for the overnight borrowing or RRP facility and 6.25 percent for the overnight lending or RP facility. The interest rates on term RRPs, RPs, and SDAs were also reduced accordingly The MB's decision is based on its assessment that the inflation outlook remains comfortably within the target range, with expectations well-anchored and as such, allowed some scope for a reduction in policy rates to help boost economic activity and support market confidence.
MAR 1 4.00 6.00 The MB decided to reduce the BSP's key policy interest rates by another 25 bps to 4.0 percent for the overnight borrowing or RRP facility and 6.0 percent for the overnight lending or RP facility. The interest rates on term RRPs, RPs, and SDAs were also reduced accordingly. The MB is of the view that the benign inflation outlook has allowed further scope for a measured reduction in policy rates to support economic activity and reinforce confidence.
APR 19 4.00 6.00 The MB decided to keep the BSP’s key policy interest rates steady at 4 percent for the overnight borrowing or RRP facility and 6 percent for the overnight lending or RP facility. The interest rates on term RRPs, RPs, and SDAs were also left unchanged.
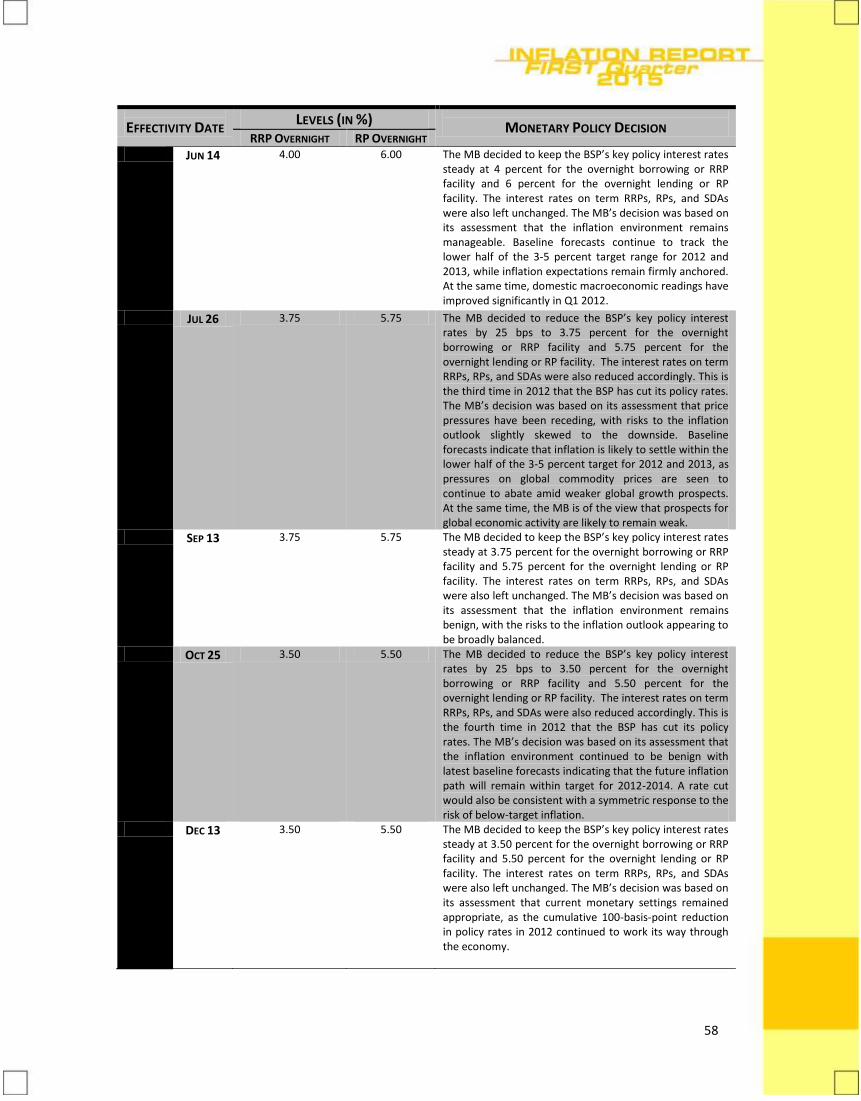
58
EFFECTIVITY DATE LEVELS (IN %)
MONETARY POLICY DECISION RRP OVERNIGHT RP OVERNIGHT
JUN 14 4.00 6.00 The MB decided to keep the BSP’s key policy interest rates steady at 4 percent for the overnight borrowing or RRP facility and 6 percent for the overnight lending or RP facility. The interest rates on term RRPs, RPs, and SDAs were also left unchanged. The MB’s decision was based on its assessment that the inflation environment remains manageable. Baseline forecasts continue to track the lower half of the 3-5 percent target range for 2012 and 2013, while inflation expectations remain firmly anchored. At the same time, domestic macroeconomic readings have improved significantly in Q1 2012.
JUL 26 3.75 5.75 The MB decided to reduce the BSP’s key policy interest rates by 25 bps to 3.75 percent for the overnight borrowing or RRP facility and 5.75 percent for the overnight lending or RP facility. The interest rates on term RRPs, RPs, and SDAs were also reduced accordingly. This is the third time in 2012 that the BSP has cut its policy rates. The MB’s decision was based on its assessment that price pressures have been receding, with risks to the inflation outlook slightly skewed to the downside. Baseline forecasts indicate that inflation is likely to settle within the lower half of the 3-5 percent target for 2012 and 2013, as pressures on global commodity prices are seen to continue to abate amid weaker global growth prospects. At the same time, the MB is of the view that prospects for global economic activity are likely to remain weak.
SEP 13 3.75 5.75 The MB decided to keep the BSP’s key policy interest rates steady at 3.75 percent for the overnight borrowing or RRP facility and 5.75 percent for the overnight lending or RP facility. The interest rates on term RRPs, RPs, and SDAs were also left unchanged. The MB’s decision was based on its assessment that the inflation environment remains benign, with the risks to the inflation outlook appearing to be broadly balanced.
OCT 25 3.50 5.50 The MB decided to reduce the BSP’s key policy interest rates by 25 bps to 3.50 percent for the overnight borrowing or RRP facility and 5.50 percent for the overnight lending or RP facility. The interest rates on term RRPs, RPs, and SDAs were also reduced accordingly. This is the fourth time in 2012 that the BSP has cut its policy rates. The MB’s decision was based on its assessment that the inflation environment continued to be benign with latest baseline forecasts indicating that the future inflation path will remain within target for 2012-2014. A rate cut would also be consistent with a symmetric response to the risk of below-target inflation.
DEC 13 3.50 5.50 The MB decided to keep the BSP’s key policy interest rates steady at 3.50 percent for the overnight borrowing or RRP facility and 5.50 percent for the overnight lending or RP facility. The interest rates on term RRPs, RPs, and SDAs were also left unchanged. The MB’s decision was based on its assessment that current monetary settings remained appropriate, as the cumulative 100-basis-point reduction in policy rates in 2012 continued to work its way through the economy.
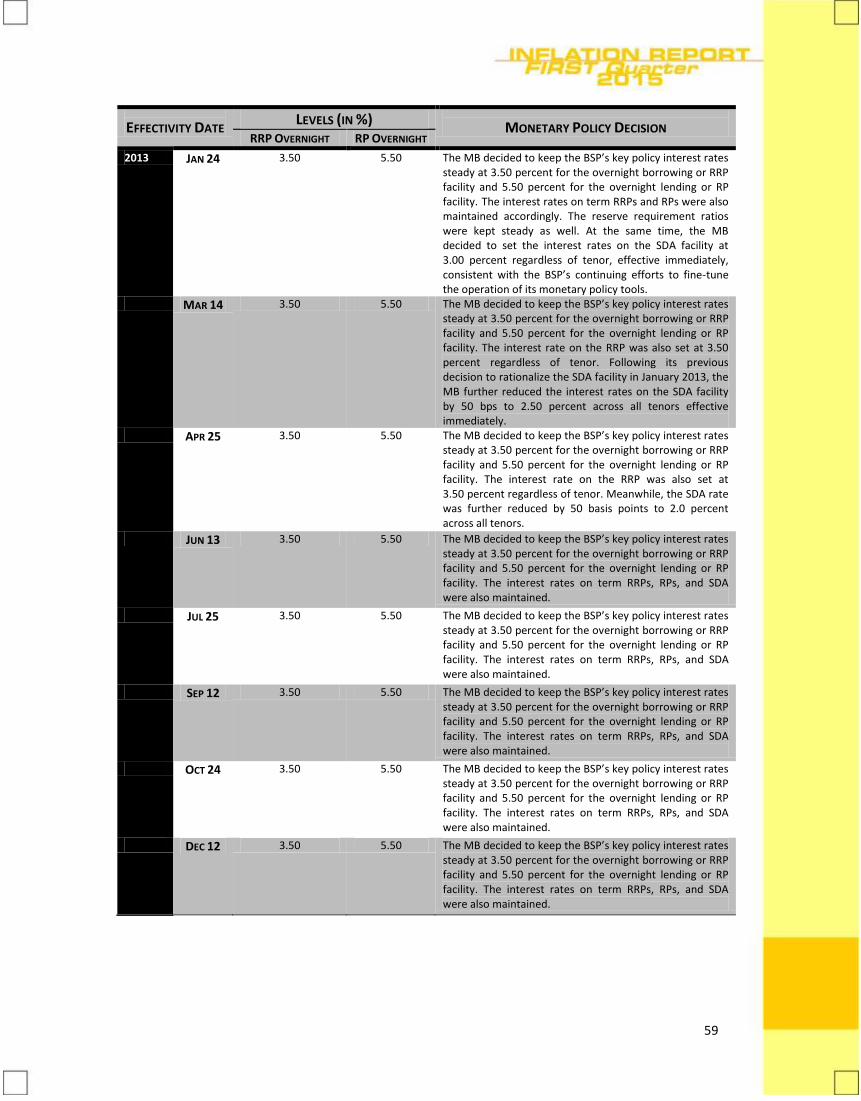
59
EFFECTIVITY DATE LEVELS (IN %)
MONETARY POLICY DECISION RRP OVERNIGHT RP OVERNIGHT
2013 JAN 24 3.50 5.50 The MB decided to keep the BSP’s key policy interest rates steady at 3.50 percent for the overnight borrowing or RRP facility and 5.50 percent for the overnight lending or RP facility. The interest rates on term RRPs and RPs were also maintained accordingly. The reserve requirement ratios were kept steady as well. At the same time, the MB decided to set the interest rates on the SDA facility at 3.00 percent regardless of tenor, effective immediately, consistent with the BSP’s continuing efforts to fine-tune the operation of its monetary policy tools.
MAR 14 3.50 5.50 The MB decided to keep the BSP’s key policy interest rates steady at 3.50 percent for the overnight borrowing or RRP facility and 5.50 percent for the overnight lending or RP facility. The interest rate on the RRP was also set at 3.50 percent regardless of tenor. Following its previous decision to rationalize the SDA facility in January 2013, the MB further reduced the interest rates on the SDA facility by 50 bps to 2.50 percent across all tenors effective immediately.
APR 25 3.50 5.50 The MB decided to keep the BSP’s key policy interest rates steady at 3.50 percent for the overnight borrowing or RRP facility and 5.50 percent for the overnight lending or RP facility. The interest rate on the RRP was also set at 3.50 percent regardless of tenor. Meanwhile, the SDA rate was further reduced by 50 basis points to 2.0 percent across all tenors.
JUN 13 3.50 5.50 The MB decided to keep the BSP’s key policy interest rates steady at 3.50 percent for the overnight borrowing or RRP facility and 5.50 percent for the overnight lending or RP facility. The interest rates on term RRPs, RPs, and SDA were also maintained.
JUL 25 3.50 5.50 The MB decided to keep the BSP’s key policy interest rates steady at 3.50 percent for the overnight borrowing or RRP facility and 5.50 percent for the overnight lending or RP facility. The interest rates on term RRPs, RPs, and SDA were also maintained.
SEP 12 3.50 5.50 The MB decided to keep the BSP’s key policy interest rates steady at 3.50 percent for the overnight borrowing or RRP facility and 5.50 percent for the overnight lending or RP facility. The interest rates on term RRPs, RPs, and SDA were also maintained.
OCT 24 3.50 5.50 The MB decided to keep the BSP’s key policy interest rates steady at 3.50 percent for the overnight borrowing or RRP facility and 5.50 percent for the overnight lending or RP facility. The interest rates on term RRPs, RPs, and SDA were also maintained.
DEC 12 3.50 5.50 The MB decided to keep the BSP’s key policy interest rates steady at 3.50 percent for the overnight borrowing or RRP facility and 5.50 percent for the overnight lending or RP facility. The interest rates on term RRPs, RPs, and SDA were also maintained.
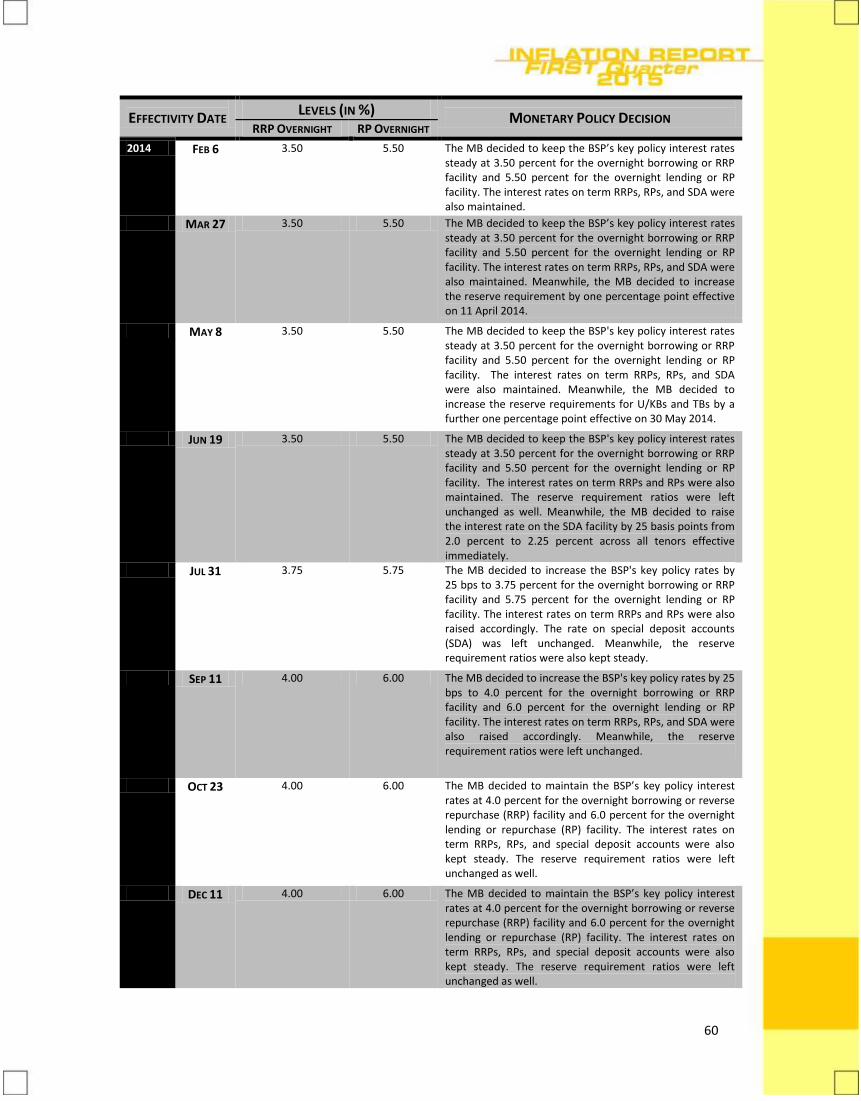
60
EFFECTIVITY DATE LEVELS (IN %)
MONETARY POLICY DECISION RRP OVERNIGHT RP OVERNIGHT
2014 FEB 6 3.50 5.50 The MB decided to keep the BSP’s key policy interest rates steady at 3.50 percent for the overnight borrowing or RRP facility and 5.50 percent for the overnight lending or RP facility. The interest rates on term RRPs, RPs, and SDA were also maintained.
MAR 27 3.50 5.50 The MB decided to keep the BSP’s key policy interest rates steady at 3.50 percent for the overnight borrowing or RRP facility and 5.50 percent for the overnight lending or RP facility. The interest rates on term RRPs, RPs, and SDA were also maintained. Meanwhile, the MB decided to increase the reserve requirement by one percentage point effective on 11 April 2014.
MAY 8 3.50 5.50 The MB decided to keep the BSP's key policy interest rates steady at 3.50 percent for the overnight borrowing or RRP facility and 5.50 percent for the overnight lending or RP facility. The interest rates on term RRPs, RPs, and SDA were also maintained. Meanwhile, the MB decided to increase the reserve requirements for U/KBs and TBs by a further one percentage point effective on 30 May 2014.
JUN 19 3.50 5.50 The MB decided to keep the BSP's key policy interest rates steady at 3.50 percent for the overnight borrowing or RRP facility and 5.50 percent for the overnight lending or RP facility. The interest rates on term RRPs and RPs were also maintained. The reserve requirement ratios were left unchanged as well. Meanwhile, the MB decided to raise the interest rate on the SDA facility by 25 basis points from 2.0 percent to 2.25 percent across all tenors effective immediately.
JUL 31 3.75 5.75 The MB decided to increase the BSP's key policy rates by 25 bps to 3.75 percent for the overnight borrowing or RRP facility and 5.75 percent for the overnight lending or RP facility. The interest rates on term RRPs and RPs were also raised accordingly. The rate on special deposit accounts (SDA) was left unchanged. Meanwhile, the reserve requirement ratios were also kept steady.
SEP 11 4.00 6.00 The MB decided to increase the BSP's key policy rates by 25 bps to 4.0 percent for the overnight borrowing or RRP facility and 6.0 percent for the overnight lending or RP facility. The interest rates on term RRPs, RPs, and SDA were also raised accordingly. Meanwhile, the reserve requirement ratios were left unchanged.
OCT 23 4.00 6.00 The MB decided to maintain the BSP’s key policy interest rates at 4.0 percent for the overnight borrowing or reverse repurchase (RRP) facility and 6.0 percent for the overnight lending or repurchase (RP) facility. The interest rates on term RRPs, RPs, and special deposit accounts were also kept steady. The reserve requirement ratios were left unchanged as well.
DEC 11 4.00 6.00 The MB decided to maintain the BSP’s key policy interest rates at 4.0 percent for the overnight borrowing or reverse repurchase (RRP) facility and 6.0 percent for the overnight lending or repurchase (RP) facility. The interest rates on term RRPs, RPs, and special deposit accounts were also kept steady. The reserve requirement ratios were left unchanged as well.
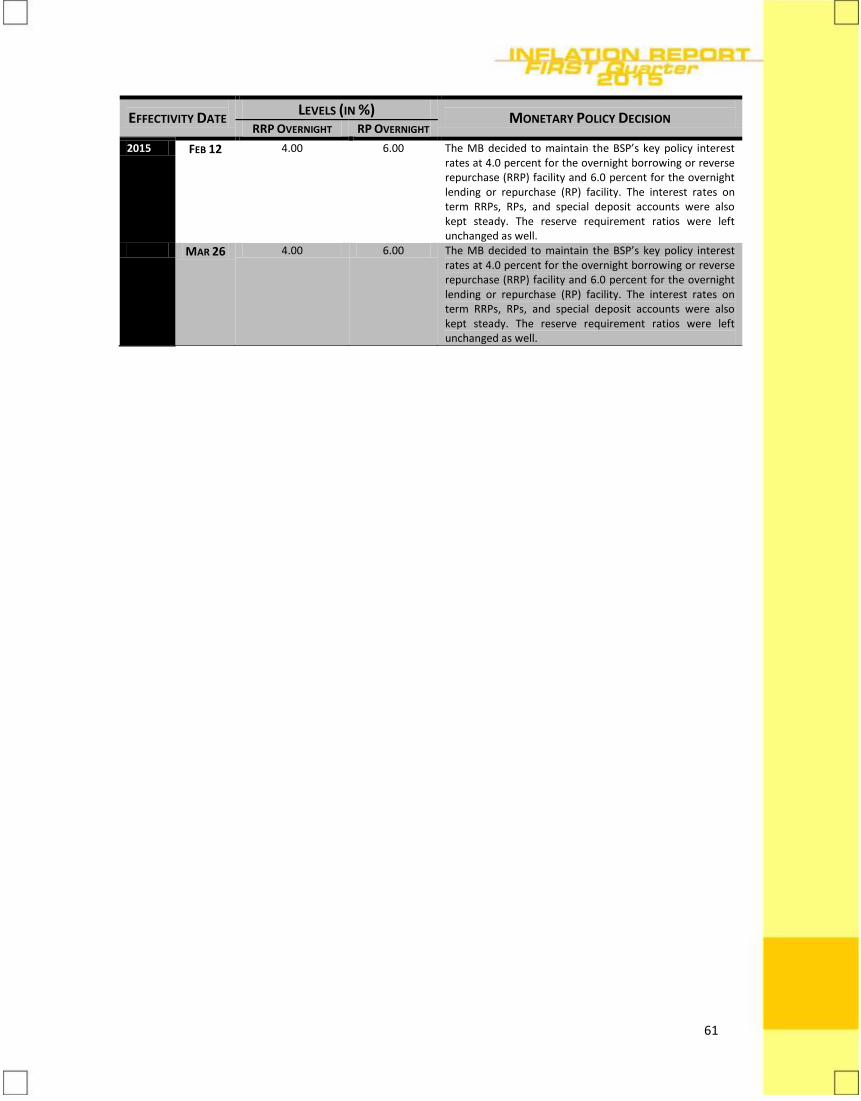
61
EFFECTIVITY DATE LEVELS (IN %)
MONETARY POLICY DECISION RRP OVERNIGHT RP OVERNIGHT
2015 FEB 12 4.00 6.00 The MB decided to maintain the BSP’s key policy interest rates at 4.0 percent for the overnight borrowing or reverse repurchase (RRP) facility and 6.0 percent for the overnight lending or repurchase (RP) facility. The interest rates on term RRPs, RPs, and special deposit accounts were also kept steady. The reserve requirement ratios were left unchanged as well.
MAR 26 4.00 6.00 The MB decided to maintain the BSP’s key policy interest rates at 4.0 percent for the overnight borrowing or reverse repurchase (RRP) facility and 6.0 percent for the overnight lending or repurchase (RP) facility. The interest rates on term RRPs, RPs, and special deposit accounts were also kept steady. The reserve requirement ratios were left unchanged as well.
The BSP Inflation Report is published every quarter by the Bangko Sentral ng Pilipinas. The report is available as a complete document in pdf format, together with other general information about inflation targeting and the monetary policy of the BSP, on the BSP’s website:
www.bsp.gov.ph/monetary/inflation.asp If you wish to receive an electronic copy of the latest BSP Inflation Report, please send an e-mail to [email protected]. The BSP also welcomes feedback from readers on the contents of the Inflation Report as well as suggestions on how to improve the presentation. Please send comments and suggestions to the following addresses:
By post: BSP Inflation Report
c/o Department of Economic Research Bangko Sentral ng Pilipinas
A. Mabini Street, Malate, Manila Philippines 1004
By e-mail: [email protected]