Embed Size (px)
Citation preview
8/9/2019 MPRA Paper 56190
http://slidepdf.com/reader/full/mpra-paper-56190 1/18
Munich Personal RePEc Archive
Volatility Spillovers in Emerging Markets
During the Global Financial Crisis:
Diagonal BEKK Approach
Irem Erten and Murat B. Tuncel and Nesrin Okay
Financial Engineering Program, Bogazici University, Department of
Management, Financial Engineering Program, Bogazici University
May 2012
Online at http://mpra.ub.uni-muenchen.de/56190/
MPRA Paper No. 56190, posted 28. May 2014 08:23 UTC
8/9/2019 MPRA Paper 56190
http://slidepdf.com/reader/full/mpra-paper-56190 2/18
JEL classification: C22; G14; G15
Abstract
The fundamental aim of the paper is to analyze the presence and magnitude of the volatility
transmissions in emerging markets, namely India, Hungary, Poland, Turkey and Brazil prior to,
and during the latest financial turmoil. Using weekly returns of stock market indices from 2005
to 2011, the study applies Multivariate BEKK Methodology. The empirical results indicate that
there exist significant volatility spillover eff ects for all five countries, though the spillovers are
not homogeneous across the pairs. Results exhibit very large GARCH and relatively low ARCH
eff ects. The study provides evidence of high level of financial integration in emerging markets.
From an investor perspective, one important implication is that adding stocks from di ff erent
emerging markets to a porfolio does not lead to risk reduction.
Keywords: Volatility Spillovers; Diagonal BEKK; Multivariate GARCH; Equity Markets
1. Introduction
The global financial landscape has changed. Weaker restrictions on capital mobility, tech-
nological advances and globalization of the world economy have given rise to highly integrated
financial markets. With rapid transmission of news, changes in a particular market can im-pact returns and / or volatilities of other markets. Therefore, in order to design eff ective portfolio
allocation and hedging decisions, it is crucial to analyze the co-movement dynamics between
international stock markets.
The linkages between global equity markets have been studied extensively in recent years.
There exists substantial evidence in the literature that large and developed markets like the U.S.
∗Corresponding author∗∗Principal corresponding author
Email addresses: [email protected]
(I. Erten), [email protected]
(M.B. Tuncel),[email protected] (N. Okay)
Preprint submitted to Emerging Markets Review May 29, 2012
May 2012
Volatility Spillovers in Emerging Markets During the Global
Financial Crisis: Diagonal BEKK Approach
I. Ertena,∗∗, M.B. Tuncela,∗, N. Okayb,∗
a Financial Engineering Program, Bo ğ aziçi University, Bebek 34342, Istanbul, Turkeyb Department of Management, Financial Engineering Program, Bo ğ aziçi University, Bebek 34342, Istanbul, Turkey

8/9/2019 MPRA Paper 56190
http://slidepdf.com/reader/full/mpra-paper-56190 3/18
impact smaller markets. Many studies have also found evidence of high level of financial inte-
gration between developed countries. However, the dynamics of integration are far less studied
for the emerging world. Are developing-country equity markets highly integrated, i.e. do there
exist return and volatility spillovers between them? Based on Markowitz and Sharpe-Lintners
diversification principle, diversifying in emerging markets would only be beneficial if their stock
markets do not move together1
The contribution of this paper is that it examines the presence and magnitude of return and
volatility transmissions in the equity markets of India, Hungary, Poland, Turkey and Brazil prior
to, and during the latest financial crisis. Using weekly returns of stock market indices from 2005
to 2011, a Five-Variate Diagonal BEKK Methodology is applied. These particular countries are
chosen because they are fast-growing, and attract a rising number of investors. According to
the data obtained from the World Federation of Exchanges (2011), Brazil has the highest global
market cap (2.74%), followed by India (2.65%), Turkey (0.52%), Poland (0.35%), and Hungary
(0.06%). As for their market performances, Polish and Turkish markets coped with the crisis
relatively better than the rest due to their traditional banking system and limited exposure to the
subprime mortgages.
By analyzing the linkages between equity markets of diff erent sizes and in diff erent regions,
this study intends to provide a deeper understanding of the volatility transmission mechanism in
the emerging world during the latest crisis. The rest of the paper is structured as follows: Section
II reviews the previous literature and Section IV describes the methodology. Section V presents
the data and empirical results and Section VI concludes.
2. Literature Review
There is a growing body of empirical literature that studies the transmission of volatility ininternational stock markets. Most researchers find that:
1. significant comovements are observed in world stock markets
2. correlations and volatility spillovers across stock markets rise in times of financial crisis
Such studies employ empirical strategies such as Grangers (1969) causality test, Sims (1980) vec-
tor autoregressive models, Engle and Grangers (1987) cointegration test and the ARCH / GARCH
methodology. In recent years, multivariate GARCH models have been extensively used to ana-
lyze the comovements of stock markets and volatility spillovers.
The majority of the studies that employ multivariate GARCH models investigate the meanand volatility spillovers between developed and emerging markets. For example, Worthington
and Higgs (2001) examine the transmission of equity returns and volatility among three devel-
oped markets (Hong Kong, Japan and Singapore) and six emerging markets (Indonesia, Korea,
Malaysia, the Philippines, Taiwan and Thailand). The results of the multivariate GARCH model
generally indicate large and positive mean and volatility spillovers, and higher own volatility
spillovers than cross volatility spillovers. Similarly, Li and Majerowska (2008) explores the
linkages among the stock markets in Warsaw, Budapest, Frankfurt and the U.S. By using a four-
variable asymmetric GARCH-BEKK model, they find evidence of return and volatility spillovers
1The Comovements in International Stock Markets: New Evidence From Latin American Emerging Countries, Arouri,
Bellalah and Nguyen(2008).
2
8/9/2019 MPRA Paper 56190
http://slidepdf.com/reader/full/mpra-paper-56190 4/18
from the developed to the emerging markets while he shows that the magnitude of volatility link-
ages is small. Also, Grosvenor and Greenidge (2010) analyze the co-movements of the regional
stock markets of Jamaica, Trinidad, Barbaros and NYSE. With a multivariate GARCH model,
they conclude that significant spillovers exist between each of the regional exchanges, as well as
from the NYSE. Finally, Sariannidis, Konteos and Drimbetas (2010) analyze the volatility link-
ages between India, Singapore and Hong Kong from 1997 to 2005. Using a multivariate GARCH
model, they prove that these markets show a strong GARCH eff ect and are highly integrated.
Some researchers, however, move their attention to analyzing the volatility linkages in equity
markets during the latest crisis. Specifically, Frank and Hesse (2009) explore the financial co-
movements between advanced economies and emerging markets during the subprime mortgage
turmoil. They estimate a multivariate GARCH model and suggest that interlinkages between
advanced economies and EM financial indicators have been highly correlated and seen sharp
increases during the crisis period. In the same direction, Sun and Zhang (2009) investigate the
spillovers of the United States to China and Hong Kong for the period 2005-2008. Using both
univariate and multivariate GARCH models, they find volatility spillovers from United States
to China and Hong Kong, with spillovers from U.S. to Hong Kong being more persistant than
those to China. At the same time, the conditional correlation between China and Hong Kong
outweighs their conditional correlations with United States because of the growing financial in-
tegration between these two countries.
In addition, there exist studies that focus exclusively on the co-movements of stock markets
in emerging countries. Beirne, Caporale, Schulze-Ghattas and Spagnolo (2010) estimate trivari-
ate GARCH(1,1)-in-mean models for 41 emerging markets in Asia, Europe, Latin America, and
the Middle East. They find evidence of mean spillovers in emerging Asia and Latin America,
and spillovers in variance in emerging Europe. They also detect cross-market GARCH-in-mean
eff ects. Also, Bhar and Nikolova (2009) examine the level of integration of the BRIC equity mar-
kets (Brazil, Russia, India, China) with their respective regions and the world. Using a bivariateEGARCH model, they demonstrate that India shows the highest level of regional and global inte-
gration among the BRIC countries, followed by Brazil, Russia, and China. Lastly, Fedorova and
Saleem (2010), using a bivariate GARCH-BEKK model, find evidence of mean and volatility
linkages between the Eastern European emerging equity markets (Poland, Hungary, and Czech
Republic) and Russia.
3. Econometric Methodology
Diagonal Bekk Model
First, the following mean equations are estimated for each market’s own returns and the re-
turns of other markets lagged one period:
RT = α + DRT −1 + ρ × PCH ( E MBI ) + σ × PCH ( MS CI ) (1)
where PCH(EMBI) and PCH(MSCI) denote the percentage change in EMBI and MSCI indexes,
respectively.
3

8/9/2019 MPRA Paper 56190
http://slidepdf.com/reader/full/mpra-paper-56190 5/18
Next, the Diagonal BEKK methodology is employed in order to assess the volatility spillover
eff ects between the five markets. Diagonal BEKK (Engle and Kroner, 1995) is a multivariate
GARCH model that permits the explicit and dynamic parametrization of conditional covariances.
It reduces the number of parameters estimated by restricting the parameter matrices to be diago-
nal and addresses the difficulty with VECH by ensuring that the conditional covariance matrix is
always positive definite. The general Diagonal BEKK Equation is given as:
H t = C C + A(Ξt −1Ξt −1) A + B( H t −1) B (2)
where H t is an nxn conditional variance-covariance matrix, C is an upper triangular matrix of
parameters, Ξt −1 is an nx1 disturbance vector, and A and B are nxn diagonal parameter matrices.
A trivariate Diagonal BEKK model can be described as follows.
Let be Ω an 3x3 matrix and equal to the C C . The C C matrix equals:
Ω = C C
=
c11 0 0
c12 c22 0
c13 c23 c33
c11 c12 c13
0 c22 c23
0 0 c33
=
c2
11 c11c12 c11c13
c11c12 c122c222 c12c13 + c22c23
c11c13 c12c13 + c22c23 c132c232c33
(3)
The H t matrix can be represented as:
H t =
h11,t h12,t h13,t
h21,t h22,t h23,t
h31,t h32,t h33,t
(4)
Finally, the equation becomes:
h11,t h12,t h13,t
h21,t h22,t h23,t
h31,t h32,t h33,t
=
Ω11,t Ω12,t Ω13,t
Ω21,t Ω22,t Ω23,t
Ω31,t Ω32,t Ω33,t
+
a11 0 0
0 a22 0
0 0 a33
u1,t −1
u2,t −1
u3,t −1
u1,t −1
u2,t −1
u3,t −1
a11 0 0
0 a22 0
0 0 a33
+
b11 0 0
0 b22 0
0 0 b33
h11,t −1 h12,t −1 h13,t −1
h21,t −1 h22,t −1 h23,t −1
h31,t −1 h32,t −1 h33,t −1
b11 0 0
0 b22 0
0 0 b33
(5)
4

8/9/2019 MPRA Paper 56190
http://slidepdf.com/reader/full/mpra-paper-56190 6/18
Thus, each conditional variance and covariance equation are represented as:
h11,t = Ω11 + a211u2
1,t −1 + b211h11,t −1 (6)
h12,t = Ω12 + a11a12u1,t −1u2,t −1 + b11b22h12,t −1 (7)
h13,t = Ω13 + a11a33u1,t −1u3,t −1 + b11b33h13,t −1 (8)
h22,t = Ω22 + a222u2
2,t −1 + b222h22,t −1 (9)
h23,t = Ω23 + a22a33u2,t −1u3,t −1 + b22b33h23,t −1 (10)
h33,t = Ω33 + a233u2
3,t −1 + b233h33,t −1 (11)
Under the assumption of conditional normality, the parameters of the multivariate GARCH
models of any of the above specifications can be estimated by maximizing the log-likelihood
function:
l(θ ) = −T N
2 −
1
2
T
t =1
log | H t | + Ξt H −1
t −1Ξt
(12)
This study employs a 5-variate Diagonal BEKK Specification. The conditional mean and
variance-covariances are estimated simultaneously with a system of five equations.
4. Data and Empirical Results
4.1. Data
The data employed in this study are the weekly closing prices of the IMKB 100 Stock Ex-
change of Turkey, the Warsaw Stock Exchange of Poland, the Budapest Stock Exchange of
Hungary, the Bombay Stock Exchange of India, and the Bovespa Stock Exchange of Brazil.
In addition, Morgan Stanley Capital International World Stock Index and JP Morgan Emerg-
ing Market Bond Index are used as exogenous variables. The data set covers the period from
01 / 01 / 2005 to 20 / 03 / 2011 and contains 326 observations for each series. The data are obtained
from Thompson Reuters Data Provider . The weekly returns are computed as the diff erence of
the natural logarithm of two consecutive weekly prices, i.e. Rt = ln( Pt
Pt −1
).
5

8/9/2019 MPRA Paper 56190
http://slidepdf.com/reader/full/mpra-paper-56190 7/18
Table 1: Variables
Index Definition
XU100P Istanbul Stock Exchange IMKB100 Price Index Series
WIGP Warsaw Stock Exchange Price Index Series
BUXP Budapest Stock Exchange Price Index Series
BVSPP Brazil Stock Exchange Bovespa Price Index Series
BSE100P Bombay Stock Exchange Price Index Series
MSCI Morgan Stanley Capital International World Stock Index
EMBI JP Morgan Emerging Market Bond Index
Table 2: Weekly Stock Market Returns from 2005 to 2011
XU100P WIGP BUXP BVSPP BSE100P MSCI EMBI
Mean 0.0030 0.0019 0.0013 0.0029 0.0031 0.0037 -0.0004
Median 0.0072 0.0046 0.0031 0.0071 0.0084 0.0056 -0.0069Maximum 0.1576 0.1158 0.1516 0.1684 0.1522 0.0663 0.3622
Minimum -0.1927 -0.171 -0.2689 -0.2233 -0.1851 -0.1139 -0.2646
Std.Dev. 0.0417 0.0324 0.0411 0.0402 0.0384 0.0236 0.0591
Skewness -0.4477 -0.7021 -1.0137 -0.6381 -0.6049 -1.2394 1.1204
Kurtosis 5.2328 5.9508 9.4039 7.5656 5.8292 7.1855 10.4682
Jarque-Bera 78.6082 145.0559 612.8956 305.2549 128.6030 321.4199 825.7968
J.B.Probability 0.0000 0.0000 0.0000 0.0000 0.0000 0.0000 0.0000
Sum 0.963400 0.6054 0.4079 0.9580 1.0005 1.2222 -0.1182
Sum Sq.Dev. 0.5643 0.3407 0.5491 0.5242 0.4796 0.1804 1.1340
Observations 326 326 326 326 326 326 326
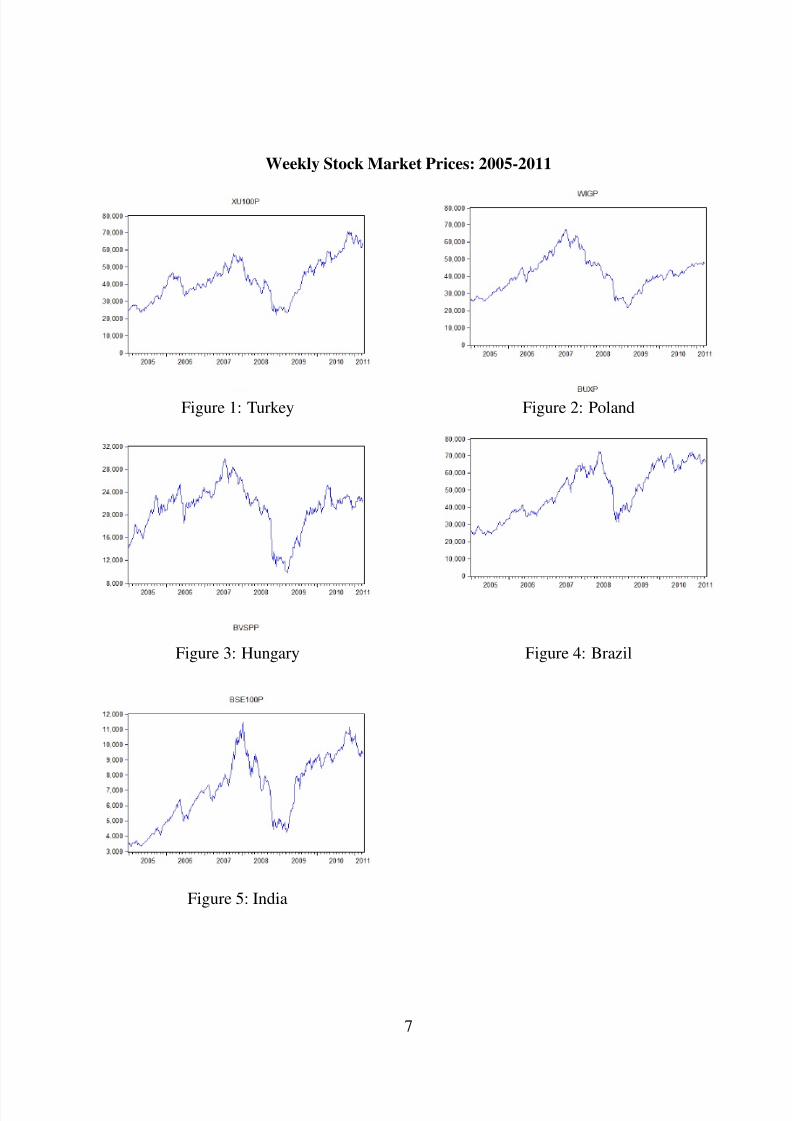
4.2. Descriptive Statistics
Descriptive statistics for each market return between 01 / 01 / 2005 and 20 / 03 / 2011 are reported
in Table 2. Distributional properties of weekly returns seem to be non-normal. Jarque-Bera esti-
mates normality of distribution, P-value of Jarque-Bera test is significant at 1% in all cases, we
reject the null hypothesis of normality. All stock markets are negatively skewed and kurtosis ex-
ceeds 4, demonstrating a leptokurtic distribution. Plots of weekly stock market prices and returns
for each country are illustrated below.All return series display volatility clustering and leverage
eff ects, making ARCH models applicable.
6
8/9/2019 MPRA Paper 56190
http://slidepdf.com/reader/full/mpra-paper-56190 8/18
Weekly Stock Market Prices: 2005-2011
Figure 1: Turkey Figure 2: Poland
Figure 3: Hungary Figure 4: Brazil
Figure 5: India
7

8/9/2019 MPRA Paper 56190
http://slidepdf.com/reader/full/mpra-paper-56190 9/18
Weekly Stock Market Returns: 2005-2011
Figure 6: Turkey Figure 7: Poland
Figure 8: Hungary Figure 9: Brazil
Figure 10: India
8

8/9/2019 MPRA Paper 56190
http://slidepdf.com/reader/full/mpra-paper-56190 10/18
4.3. The Mean Return Spillovers
Results of conditional mean return equations are reported in Table 3. Diagonal parameters
d 11, d 33 and d 44, are statistically significant, suggesting that the returns of Turkey, Hungary and
Brazil are dependent on their first lags. These own mean spillovers are high and negative, indi-
cating a downward drift in these markets. Diagonal parameters d 22 and d 55 are insignificant in
case of Poland and India, showing that their returns do not depend on their own previous returns.
Table 3: Estimated Coefficients for Conditional Mean Return Equations
Coefficient St. Error Coefficient St. Error Coefficient St. Error
TURKEY=1 POLAND=2 HUNGARY(i=3)
α 0.002187 0.002034 0.001055 0.001564 0.000295 0.002039
d i1 -0.163461** 0.082626 0.064806 0.093038 0.063197 0.079361
d i2 -0.023624 0.048670 0.006868 0.072740 0.062937 0.065150
d i3 0.062975 0.064695 0.095646 0.097867 -0.141629* 0.077275d i4 -0.020588 0.055875 0.101086 0.079266 -0.000234 0.064327
d i5 0.044716 0.064866 0.033614 0.086434 0.044716 0.490600
EMBI -0.341556*** 0.036355 -0.250988*** 0.031914 -0.346673*** 0.029758
MSCI 0.262875** 0.111551 0.299431*** 0.082526 0.272067*** 0.100737
BRAZIL(i=4) INDIA=5
α 0.001741 0.001659 0.001757 0.001933
d i1 -0.001956 0.067991 0.121950* 0.066514
d i2 0.004706 0.059416 0.053407 0.044304
d i3 0.127614* 0.071137 -0.021193 0.065248
d i4 -0.171623*** 0.061121 0.056783 0.051411d i5 0.061906 0.063261 -0.060930 0.063663
EMBI -0.349677*** 0.026032 -0.249651*** 0.031927
MSCI 0.439765*** 0.087702 0.266691*** 0.097258
1 Notes: *significant at level of 10%,**significant at level of 5%, *** significant at level of 1%.
Cross-mean spillovers are insignificant in all models, except for d 51, India to Turkey(0.1219)
and d 43, Brazil to Hungary(0.1276). The results mean that highest cap markets, India and Brazil,
have positive spillover eff ects on the smaller markets of Turkey and Hungary, respectively. Next,
Wald Test is performed for each country, in order to test the null hypothesis that mean spillovers
from other markets equal zero. The null cannot be rejected for all markets, except for Hungary.
Hence, only Hungarian returns are significantly aff ected by lagged returns of other emerging
markets. Insignificant cross mean spill-overs show that Turkey, Poland, India and Brazil markets
are not influenced by the local events in other markets.
In contrast, there exist returns spillovers from EMBI and MSCI to all five exchanges. The
coefficient of EMBI—which represents the performance of government bonds in emerging coun-
tries is negative and highly significant for all countries. Hence bond markets have a highly nega-
tive eff ect on emerging market stock returns. One possible explanation is that investors demand
higher rates of interest in times of volatility; therefore, high bond returns follow low stock prices.
9

8/9/2019 MPRA Paper 56190
http://slidepdf.com/reader/full/mpra-paper-56190 11/18
On the other hand, the coefficient of MSCI—a common benchmark for global stock funds—
is positive and significant. Emerging market stock returns seem to be positively correlated with
global markets as information about global economic conditions get transmitted into the pricing
process of regional stocks. Mean eff ects originating from global stock and bond markets are
considerably larger than those originating from lagged mean returns. These results suggest that
emerging markets are highly susceptible to global markets. Moreover, they derive their correla-
tion from global, rather than domestic events.
4.4. The Volatility Spillovers
Conditional variance-covariance equations eff ectively capture the volatility and cross volatil-
ity among the five stock markets because most coefficients are statistically significant(Table 4).
Specifically, conditional variances-covariances implied by the Diagonal BEKK Specification are
presented below.
h11,t = 0.000204 + 0.026012 21,t −1 + 0.781443h11,t −1 (13)
h12,t = 4.430574e − 05 − 0.00991 1,t −1 2,t −1 + 0.872133h12,t −1 (14)
h13,t = 7.397949e − 05 + 0.022939 1,t −1 3,t −1 + 0.822285h13,t −1 (15)
h14,t = 4.154376e − 05 + 0.040308 1,t −1 4,t −1 + 0.837378h14,t −1 (16)
h15,t = 3.927877e − 05 + 0.041227 1,t −1 5,t −1 + 0.839813h15,t −1 (17)
h22,t = 1.534778e − 05 + 0.003775 22,t −1 + 0.973348h22,t −1 (18)
h23,t = 3.972925e − 05 − 0.008739 2,t −1 3,t −1 + 0.917715h23,t −1 (19)
h24,t = 1.854278e − 05 − 0.015356 2,t −1 4,t −1 + 0.934559h24,t −1 (20)
h25,t = 1.596628e − 05 − 0.015706 2,t −1 5,t −1 + 0.937277h25,t −1 (21)
h33,t = 0.000114 + 0.020229 23,t −1 + 0.865261h33,t −1 (22)
h34,t = 2.950726e − 05 + 0.035546 3,t −1 4,t −1 + 0.881142h34,t −1 (23)
h35,t = 2.415015e − 05 + 0.036357 3,t −1 5,t −1 + 0.883704h35,t −1 (24)
h44,t = 3.221746e − 05 + 0.06246 24,t −1 + 0.897315h44,t −1 (25)
h45,t = 1.356436e − 05 + 0.063884 4,t −1 5,t −1 + 0.899925h45,t −1 (26)
h55,t = 3.490055e − 05 + 0.065341 25,t −1 + 0.902542h55,t −1 (27)
From these empirical results we conclude a strong evidence of GARCH eff ect and the pres-ence of a weaker ARCH eff ect. Equations show a statistically significant covariation in shocks,
which depends more on its lags than on past errors. Consequently, market shocks are influenced
by past information which is common to the respective markets.
Own-volatility spillovers(ARCH eff ects) are positive and significant for all five exchanges.
The spillover eff ect is higher for India(0.0653) and Brazil(0.0624) than for Turkey(0.026), Hun-
gary(0.02), and Poland(0.02). These coefficients show the volatility persistence for each market
in terms of its own past errors. As for cross-volatility eff ects, past innovations in India have
greatest influence in future volatility of other developing market returns. In the case of India,
Brazil has the greatest influence on its future volatility. The cross-volatility spillovers are higher
than own-volatility spillovers in all markets except for India.
10

8/9/2019 MPRA Paper 56190
http://slidepdf.com/reader/full/mpra-paper-56190 12/18
Therefore, past volatility shocks in other emerging markets have greater eff ect on future
volatility than domestic volatility shocks in case of Turkey, Poland, Hungary and Brazil. These
results suggest that India is the least vulnerable market to outside shocks.
Table 4: Estimated Coefficients for
Conditional Variance-CovarianceEquations
Coefficient St. Error
C(1,1) 0.000204 0.000149
C(1,2) 4.43E-05 2.80E-05
C(1,3) 7.40E-05* 4.19E-05
C(1,4) 4.15E-05 2.60E-05
C(1,5) 3.93E-05 2.59E-05
C(2,2) 1.53E-05*** 5.58E-06
C(2,3) 3.97E-05* 2.26E-05C(2,4) 1.85E-05** 7.68E-06
C(2,5) 1.60E-05*** 5.95E-06
C(3,3) 0.000114 8.07E-05
C(3,4) 2.95E-05* 1.56E-05
C(3,5) 2.42E-05* 1.26E-05
C(4,4) 3.22E-05** 2.15E-05
C(4,5) 1.36E-05** 6.70E-06
C(5,5) 3.49E-05* 1.95E-05
A(1,1) 0.161282** 0.072931
A(2,2) -0,061443 0.032368
A(3,3) 0.142230*** 0.054074
A(4,4) 0.249920*** 0.064238
A(5,5) 0.255619*** 0.051757
B(1,1) 0.883993*** 0.083833
B(2,2) 0.986584*** 0.005333
B(3,3) 0.930194*** 0.048982
B(4,4) 0.947267*** 0.027734
B(5,5) 0.950022*** 0.019674
1 Notes: *significant at level of 10%,**significant at level of 5%,
*** significant at level of 1%.
The lagged own-volatility persistence(GARCH eff ects) is Poland(0.9733), India(0.9025),
Brazil(0.8973), Hungary(0.8653) and Turkey(0.7814). These results suggest that Poland de-
rives more of its volatility persistence from within the domestic market, while Turkey derives
more of its volatility persistence from outside the domestic market. Moreover, the own volatility
spillover eff ects for five exchanges do not remain within a tight range. This further implies that
each emerging market faces a diff erent risk-return profile and diff erent levels of vulnerability tooutside conditions.
11

8/9/2019 MPRA Paper 56190
http://slidepdf.com/reader/full/mpra-paper-56190 13/18
For Turkey the lagged cross-volatility persistence ranges from 0.8721(Poland) to 0.8223
(Hungary), and in Poland it goes from 0.9373 (India) to 0.8721(Turkey). Conversely, in Hun-
gary the cross-volatility persistence varies between 0.9177(Poland) and 0.8223(Turkey), while
in Brazil it goes from 0.9346(Poland) to 0.8374(Turkey), and in India from 0.9373(Poland) to
0.8398(Turkey). Hence, in terms of cross-volatility persistence, the least influential market in the
study is Turkey while the most influential would appear to be Poland. On the other hand, past
volatility shocks in India have greatest eff ect on the future volatility of Poland.
It is an important finding here that although cross-volatility persistence is heterogeneous for
five exchanges, least and most influential markets remain the same. Moreover, the order of influ-
ence does not depend on the size nor the market cap. Influence of lagged covariance on future
covariance is found positive for all pairs and coefficients range from 0.8223 (Turkey-Hungary)
to 0.9373(India-Poland). The analysis implies that the magnitude of cross volatility persistence
is not directly linked to geography or economic relations between the countries. It can be due to
the level of integration of the market to rest of the world.
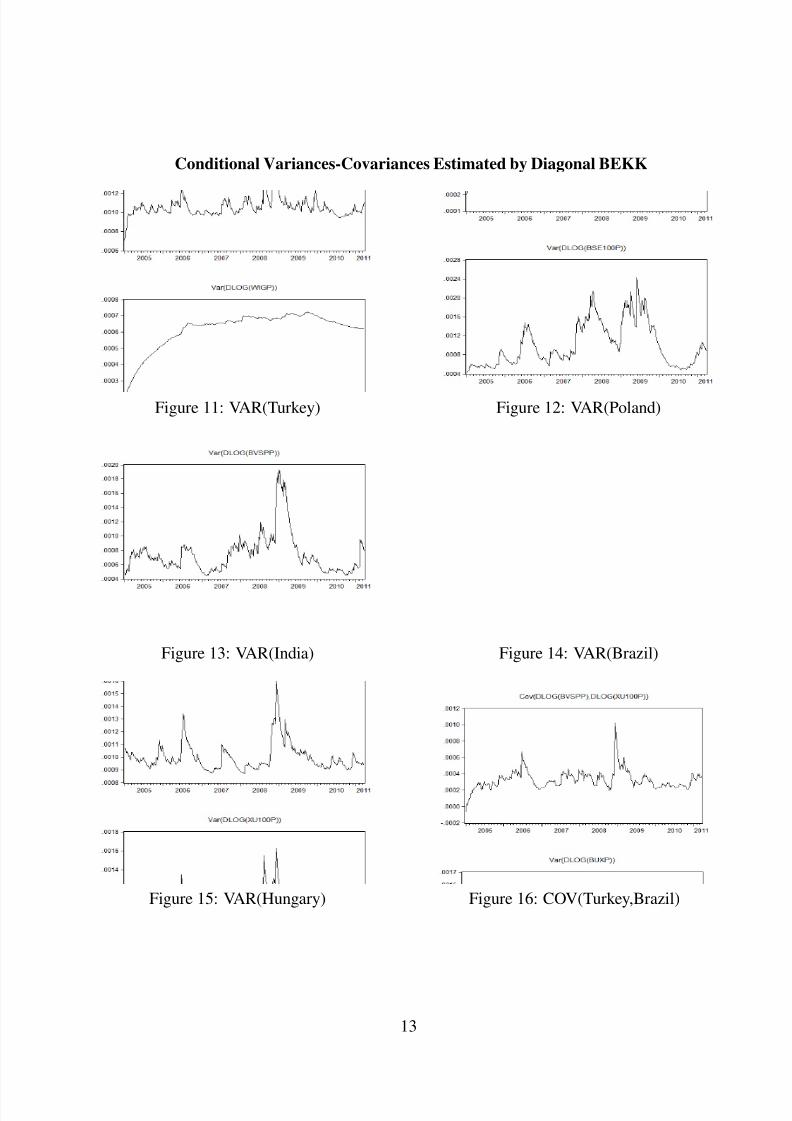
The plots for the conditional variances-covariances estimated by the Diagonal BEKK Model
are illustrated below. They suggest that the comovements of the stock markets display an ex-
tremely volatile trend for the study period. Moreover, the conditional correlations show sharp
increases at some point during 2008-2009 for each pair of countries. This provides evidence that
examined emerging markets are highly integrated and that volatility spillovers rise during global
crisis.
Finally, the Ljung-Box Q statistics show no evidence of autocorrelation in the standardized
residuals (Table 5). It can be concluded that the conditional mean return equations are correctly
specified with the diagonal BEKK GARCH model.
Table 5: Portmanteau Test using Standard Residuals
Lags Q-Stat Prob. Adj Q-Stat Prob. df
1 5.222543 1.0000 5.239175 1.0000 25
2 39.85245 0.8473 40.09036 0.8407 50
3 63.66125 0.8217 64.12809 0.8104 75
4 93.62364 0.6603 94.47584 0.6371 100
5 121.7574 0.5654 123.0634 0.5322 125
6 166.3136 0.1716 168.4847 0.1436 150
7 194.5329 0.1485 197.3454 0.1185 175
8 227.5072 0.0885 231.1790 0.0646 2009 244.2449 0.1804 248.4090 0.1360 225
10 275.6288 0.1274 280.8218 0.0877 250
11 297.3430 0.1695 303.3218 0.1157 275
12 326.1059 0.1438 333.2237 0.0907 300
1 Null hypothesis: No residual autocorrelation up to lag h2 Orthogonalization: Cholesky(Lutkepohl)
12
8/9/2019 MPRA Paper 56190
http://slidepdf.com/reader/full/mpra-paper-56190 14/18
Conditional Variances-Covariances Estimated by Diagonal BEKK
Figure 11: VAR(Turkey) Figure 12: VAR(Poland)
Figure 13: VAR(India) Figure 14: VAR(Brazil)
Figure 15: VAR(Hungary) Figure 16: COV(Turkey,Brazil)
13

8/9/2019 MPRA Paper 56190
http://slidepdf.com/reader/full/mpra-paper-56190 15/18
Figure 17: COV(Turkey,Poland) Figure 18: COV(Turkey,India)
Figure 19: COV(Turkey,Poland) Figure 20: COV(Turkey,India)
Figure 21: COV(Turkey,Hungary) Figure 22: COV(Poland,Hungary)
14

8/9/2019 MPRA Paper 56190
http://slidepdf.com/reader/full/mpra-paper-56190 16/18
Figure 23: COV(Poland,Brazil) Figure 24: COV(Poland,India)
Figure 25: COV(Hungary,Brazil) Figure 26: COV(Hungary,India)
Figure 27: COV(Brazil,India)
15

8/9/2019 MPRA Paper 56190
http://slidepdf.com/reader/full/mpra-paper-56190 17/18
5. Conclusion
Mean equations show that emerging markets are strongly linked to global markets during
the study period. For all systems, coefficients for EMBI and MSCI are high and significant.
Conversely, cross-mean spillovers are insignificant for most equations. Moreover, own mean
spillover coefficients are negative and significant only for Turkey, Hungary and Brazil, suggest-
ing that their stock returns have been highly volatile, alternating, and negatively linked to oneperiod lagged returns. Overall, mean equation analysis indicates that emerging countries derive
their volatility from global, rather than their domestic markets.
In conditional variance-covariance equations, there exist significant and strong volatility
spillover eff ects for all five emerging markets. Magnitude of the estimates is not homogeneous
across countries but remains within a relatively tight range. Influence of lagged covariance on
future covariance is found to be positive in all estimations and is extremely high with values
often greater than 85%. Hence the Diagonal BEKK Model exhibits very large GARCH and rel-
atively low ARCH eff ects. Comovement across emerging markets does not appear to be directly
linked to geography or economic relations between the countries due to financial globalization
and integration.One important implication of this study is that adding stocks only from these five emerging
markets will not diversify away portfolio risk. Investors must diversify their portfolios employ-
ing not only emerging, but also developed market stocks. Correlations and volatility spillover
eff ects between emerging and developed stock markets must be studied and taken into account.
The last but not the least, the high level of financial integration may weaken emerging mar-
kets against external shocks. Decision makers in the emerging world must now design policies
not only looking at domestic estimates, but also by considering the fact that emerging markets are
now highly linked both among each other and with the global markets. Hence, global financial
landscape has changed, and the emerging world is no exception.
6. References
Beirne, J. Caporale, G. M., Schulze-Ghattas, M., and Spagnolo, N. (2010). Global and Regional Spillovers in Emerging
Stock Markets: A Multivariate GARCH-in-Mean Analysis, Emerging Markets Review, 11(3), pp. 250-260, Septem-
ber.
Bhar, R., and Nikolova, B. (2009). Return, volatility spillovers and dynamic correlation in the BRIC equity markets: An
analysis using a bivariate EGARCH framework. Global Finance Journal, 19(3), pp. 203-218.
Brooks, C. (2008). Introductory Econometrics for Finance, Second Edition, Cambridge: Cambridge University Press,
UK.
Chuang, I-Y., Lu, J-R., and Tswei, K. (2007). Interdependence of international equity variances: Evidence from EastAsian Markets. Emerging Markets Review, 8, pp. 311-327.
Cuthbertson, K., Hall, S. G., and Taylor, M. P. (1992). Applied Econometric Techniques.
Engle, R. F. (2000). Arch Selected Readings, Oxford University Press, New York, United States.
Fayyad, A., and Daly, K.. (2011). International Transmission of Stock Returns: Mean and Volatility Spillover Eff ects in
the Emerging Markets of the GCC Countries, the Developed Markets of UK&USA and Oil. International Research
Journal of Finance and Economics, 67. Retrieved from http: // www.eurojournals.com / finance.htm.
Fedorova, E., and Saleem, K. (2010). Volatility Spillovers between Stock and Currency Markets: Evidence from Emerg-
ing Eastern Europe, Czech Journal of Economics and Finance (Finance a uver), Charles University Prague, Faculty
of Social Sciences, 60(6), pp. 519-533, December.
Forbes, K. J., and Rigobon, R. (2002) No Contagion, Only Interdependence: Measuring Stock Markets Comovements,
The Journal of Finance, LVII(5), October.
Frank, N. And Hesse, H. (2009). Financial Spillovers to Emerging Markets during the Global Financial Crisis, Czech Journal of Economics and Finance, Charles University Prague, Faculty of Social Sciences, 59(6), pp. 507-521, De-
cember.
16

8/9/2019 MPRA Paper 56190
http://slidepdf.com/reader/full/mpra-paper-56190 18/18
Grosvenor, T., and Greenidge, K. Stock Market Volatility Spillover from Developed Markets to Regional Markets. (2010).
Conference paper, 42nd Annual Monetary Studies Conference Financial Stability, Crisis Preparedness and Risk Man-
agement in the Caribbean, November 9-12, Trinidad and Tobago.
Iqbal, M. J., Rafique, S., Abrar, A., Jamil, N., Shah, A. A., and Satti, A. H. (2012). Volatility Linkages between Equity
Markets of Pakistan, India, Singapore and Hong Kong: A GARCH BEKK Approach, Journal of Economics and
Behavioral Studies, 4(1), pp. 47-54, January.
Li, H. and Majerowska, E. (2008). Testing stock market linkages for Poland and Hungary: A multivariate GARCH
approach, Research in International Business and Finance, 22(3), pp. 247-266, September.Sariannidis, N., Konteos, G., and Drimbetas, E. (2010). Volatility Linkages among India, Hong Kong and
Singapore Stock Markets, International Research Journal of Finance and Economics, 58. Retrieved from
http: // www.eurojournals.com / finance.htm.
Tao, S., and Xiaojing, Z. (2009). Spillovers of the U.S. Subprime Financial Turmoil to Mainland China and Hong Kong
SAR: Evidence from Stock Markets: IMF Working Papers 9 / 166, pp. 1-42.
Worthington, H., and Higgs, H. (2004). Transmission of Equity Returns and Volatility in Asian Developed and Emerging
Markets: A Multivariate Garch Analysis, International Journal of Finance and Economics 9(1): pp. 71-80.
Worthington, A. and Higgs, H. (2001). A multivariate GARCH analysis of equity returns and volatility in Asian equity
markets, School of Economics and Finance Discussion Papers and Working Papers Series, School of Economics and
Finance, Queensland University of Technology.