Embed Size (px)
Citation preview

© 2017 STR, Inc. All Rights Reserved. Any reprint, use or republication of all or a part of this presentation without the prior written approval of STR, Inc. or STR Global, Ltd. trading as STR (collectively “STR”) is strictly prohibited. Any such reproduction shall specifically credit STR as the source. This presentation is based on data collected by STR. No strategic advice or marketing recommendation is intended or implied.
MPI Nashville ChapterMonthly Meeting – Embassy Suites Cool SpringsSeptember 20, 2017
Veronica Andrews
Director, Digital Data Solutions
@STR_Data

© 2017 STR. All Rights Reserved.
Agenda Industry Update
Pipeline
Nashville Market Performance
Segmentation Insights
Forecasts
Hotel F&B Performance

© 2017 STR. All Rights Reserved.
A few of notes
before we begin…

© 2017 STR. All Rights Reserved.
We are nowOne Brand

© 2017 STR. All Rights Reserved.
Notable Calendar Shifts Impacting Lodging Performance Data in 2017:
Easter From March to April (affects Q1/Q2)
Jewish Holidays From October to September (affects Q3/Q4)
Notable Market Level Events / Comps:
Super Bowl: From San Francisco To Houston
San Francisco: Super Bowl Shift and Moscone Center Renovation
Los Angeles: Porter Ranch Gas Leak
Washington, D.C.: Inauguration & Women’s March (January 2016)
Philadelphia: DNC (July 2016)
Cleveland: RNC (July 2016)
East Tennessee: Wild Fires (November 2016)
East Coast: Hurricane Matthew (October 2016)
Texas/Florida: Hurricanes Harvey and Irma (August/September 2017)
© 2017 STR. All Rights Reserved. U.S. Industry Performance

© 2017 STR. All Rights Reserved.
August 2017 YTD: Demand Growth Continues To Hold
% Change
Room Supply 1.8%
Room Demand 2.4%
Occupancy (*Record*) 67.1% 0.5%
A.D.R. $127 2.1%
RevPAR $85 2.7%
Room Revenue 4.5%
Total US Results - August 2017 YTD

© 2017 STR. All Rights Reserved.
August YTD 2017: New Supply Hits NYC, Miami.
Market OCC %ADR % Change Influenced By
Washington, DC-MD-VA 74.0 5.5 Inauguration / Women’s March
Nashville, TN 74.8 5.3 Bachelorette Parties
Seattle, WA 79.4 4.7
Phoenix, AZ 69.1 4.4
Detroit, MI 67.5 4.3
Houston, TX 62.1 -0.9
New Supply
(Watch for future Harvey Impact)
New York, NY 85.3 -1.8 New Supply
San Francisco/San Mateo, CA 84.1 -2.0
Superbowl L 2016 / Moscone Center
Closed April - August
Philadelphia, PA-NJ 68.8 -3.5 DNC 2016
Miami/Hialeah, FL 78.7 -3.7 New Supply*August 2017 YTD ADR % Change in Top 25: 5 Best / 5 Worst Performing ADR Growth Markets

© 2017 STR. All Rights Reserved.
August 2017 12MMA: Steady RevPAR Growth
Total US Results - August 2017 12MMA
% Change
Room Supply 1.8%
Room Demand 2.4%
Occupancy (*Record*) 65.7% 0.6%
A.D.R. $126 2.4%
RevPAR $83 3.0%
Room Revenue 4.8%

Rooms Revenue($)
Rooms Available(supply)
($)
RevPAR
What Defines Success?

© 2017 STR. All Rights Reserved.
US Industry RevPAR Growth: Erratic Monthly Numbers,But Overall Current Trend Is Steady
-4
0
4
8
12
16
20
2015 2016 2017
Monthly 12MMA
*Total U.S. - RevPAR % Change by month and 12MMA, 1/2015 – 8/2017

© 2017 STR. All Rights Reserved.
Nashville, TN Market RevPAR Growth: Erratic Monthly Numbers; Overall Downward Trend…
-4
0
4
8
12
16
20
2015 2016 2017
Monthly 12MMA
*Nashville, TN Market - RevPAR % Change by month and 12MMA, 1/2015 – 8/2017

© 2017 STR. All Rights Reserved.
Demand Growth Stronger Than Expected.
-0.8
-4.7
-7.1
7.7
-8
-4
0
4
8
1990 2000 2010
Supply % Change
Demand % Change
Total U.S., Supply & Demand % Change, 12 MMA 1/1990 – 8/2017

© 2017 STR. All Rights Reserved.
Nashville, TN Supply Growth Begins to Outpace Demand Growth.
3.5
-3.7
-8.8
4.8
2.4
-10
-5
0
5
10
15
1990 1995 2000 2005 2010 2015
Supply % Change
Demand % Change
Nashville, TN Market Supply & Demand % Change, 12 MMA 1/2002 – 8/2017

© 2017 STR. All Rights Reserved.
Pipeline

© 2017 STR. All Rights Reserved.
US Pipeline: I/C Growth Still Strong(But Growth Rates Used to be 30%+)
Phase 2017 2016 % Change
In Construction 192 170 13%
Final Planning 220 198 11%
Planning 178 174 2%
Under Contract 590 542 9%
*Total US Pipeline, by Phase, ‘000s Rooms, August 2017 and 2016
13%

© 2017 STR. All Rights Reserved. *Total US Pipeline; Rooms In Construction, in ‘000s; 1/2006 – 7/2017
0
50
100
150
200
250
2006 2008 2010 2012 2014 2016
Low: May ‘1150K
August‘17192K
High:Dec ‘07
211K
19K
I/C Pipeline Is Growing But Still Below Prior PeakTh
ou
san
ds

© 2017 STR. All Rights Reserved.
Limited Service Construction Is The Name Of The Game
8.9
26.4
61.3 63.0
9.92.5
20.2
Luxury Upper Upscale Upscale Upper Midscale Midscale Economy Unaffiliated
*US Pipeline, Rooms In Construction , ‘000s Rooms, by Scale, August 2017
65%

© 2017 STR. All Rights Reserved.
Pipeline: Top 26 Markets Have 48% Of All Rooms I/C
92.399.8
83.3
136.6
76.3
101.7
Top 26 Markets Rest of US
In Construction Final Planning Planning
*US Pipeline, Rooms (‘000s), Top 26 Markets vs. All Other Markets, August 2017
BNA Mkt:5.4 6.2 3.4
© 2017 STR. All Rights Reserved.
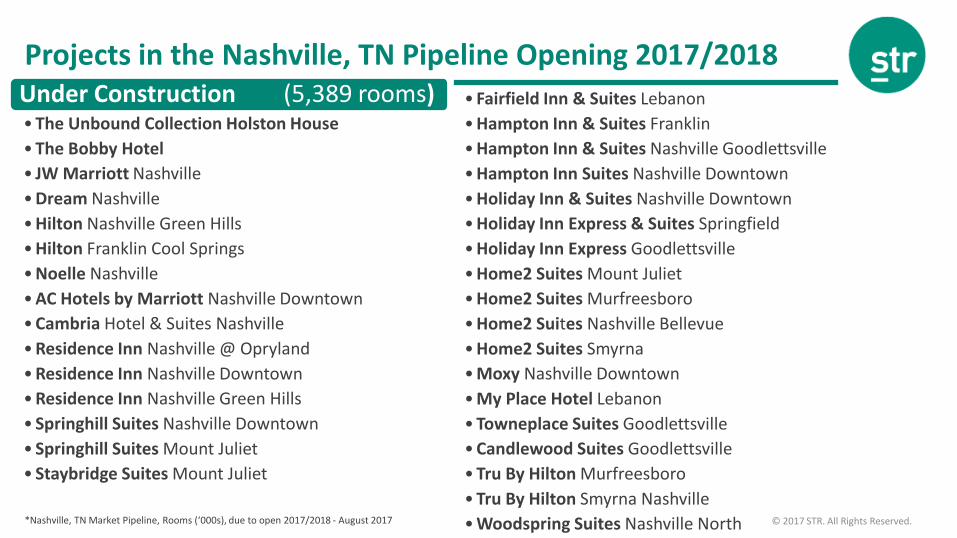
Projects in the Nashville, TN Pipeline Opening 2017/2018Under Construction (5,389 rooms)• The Unbound Collection Holston House
• The Bobby Hotel
• JW Marriott Nashville
• Dream Nashville
• Hilton Nashville Green Hills
• Hilton Franklin Cool Springs
• Noelle Nashville
• AC Hotels by Marriott Nashville Downtown
• Cambria Hotel & Suites Nashville
• Residence Inn Nashville @ Opryland
• Residence Inn Nashville Downtown
• Residence Inn Nashville Green Hills
• Springhill Suites Nashville Downtown
• Springhill Suites Mount Juliet
• Staybridge Suites Mount Juliet
• Fairfield Inn & Suites Lebanon
• Hampton Inn & Suites Franklin
• Hampton Inn & Suites Nashville Goodlettsville
• Hampton Inn Suites Nashville Downtown
• Holiday Inn & Suites Nashville Downtown
• Holiday Inn Express & Suites Springfield
• Holiday Inn Express Goodlettsville
• Home2 Suites Mount Juliet
• Home2 Suites Murfreesboro
• Home2 Suites Nashville Bellevue
• Home2 Suites Smyrna
• Moxy Nashville Downtown
• My Place Hotel Lebanon
• Towneplace Suites Goodlettsville
• Candlewood Suites Goodlettsville
• Tru By Hilton Murfreesboro
• Tru By Hilton Smyrna Nashville
• Woodspring Suites Nashville North*Nashville, TN Market Pipeline, Rooms (‘000s), due to open 2017/2018 - August 2017

© 2017 STR. All Rights Reserved.
Nashville, TN Market Performance

© 2017 STR. All Rights Reserved.

© 2017 STR. All Rights Reserved.
Nashville, TNMarket
Market Share of Supply
Hotels 345
Rooms 40,557
STR Sample 89%
Key Statistics
%ch
OCC 73.8% -1.0%
ADR $139.28 5.3%
RevPAR $102.84 4.3%
Rm Rev $1.499B 7.9%
Supply 14.6M 3.5%
Demand 10.8M 2.4% Nashville, TN Market Performance – August 2017 12MMA

© 2017 STR. All Rights Reserved.
CBDAirport
I-24 Murfreesboro
I-65 N
Brentwood/Franklin
Other Areas
Occupancy
73.8%
-1.0%81% - 0.6%
72% - 2.0%
74.6% - 1.5% 71.4% - 1.1%
67.9% + 2.4%
68.8% - 3.1%
Nashville, TN Submarket Occupancy Performance – August 2017 12MMA

© 2017 STR. All Rights Reserved.
CBDAirport
I-24 Murfreesboro
I-65 N
Brentwood/Franklin
Other Areas
ADR
$139.28
+5.3%$215 + 5.3%
$135 + 3.6%
$122 + 1.3% $85 + 2.8%
$89 + 10.5%
$82 + 7.2%
Nashville, TN Submarket Average Daily Rate Performance – August 2017 12MMA

© 2017 STR. All Rights Reserved.
CBDAirport
I-24 Murfreesboro
I-65 N
Brentwood/Franklin
Other Areas
RevPAR
$102.84
+4.3%$175 + 4.6%
$98 + 1.5%
$91 - 0.2% $60 + 1.7%
$60 + 13.1%
$56 + 4.0%
Nashville, TN Submarket RevPAR Performance – August 2017 12MMA

© 2017 STR. All Rights Reserved.
Airport
Brentwood/Franklin
Central Business District
I-24 Murfreesboro
I-65 North
Other Areas
Nashville, TN Market
Recap: Nashville, TN Market Performance by Submarket
-2.0% 3.6% 1.5%
-1.5% 1.3% -0.2%
-0.6% 5.3% 4.6%
-1.1% 2.8% 1.7%
2.4% 10.5% 13.1%
-3.1% 7.2% 4.0%
-1.0% 5.3% 4.3%
Occupancy ADR RevPAR
Nashville, TN Market and Submarkets – Occupancy, ADR & RevPAR - August 2017 12MMA % Change

© 2017 STR. All Rights Reserved.
Day Of Week Patterns

© 2017 STR. All Rights Reserved.
Nashville, TN Market – 3 Year Occupancy by Day of Week12MMA
56.8
70.0
77.277.2
74.7
79.9
81.0
73.8
0.0
25.0
50.0
75.0
100.0
Sun Mon Tue Wed Thu Fri Sat
Total 3 Yr Sep 14 - Aug 15 Sep 15 - Aug 16 Sep 16 - Aug 17

© 2017 STR. All Rights Reserved.
$121
$127
$132 $133 $131
$137
$139
$132
$128
$134
$139 $139 $137
$145
$148
$139
$110.00
$130.00
$150.00
Sun Mon Tue Wed Thu Fri Sat Total Year
Total 3 Yr Sep 14 - Aug 15 Sep 15 - Aug 16 Sep 16 - Aug 17
Nashville, TN – 3 Year ADR by Day of Week12MMA

© 2017 STR. All Rights Reserved.
$69
$89
$102 $102
$98
$109
$113
$97
+$5
+$5
+$6 +$6
+$5
+$5
+$7
+$5
$60.00
$80.00
$100.00
$120.00
Sun Mon Tue Wed Thu Fri Sat Total YearTotal 3 Yr Sep 14 - Aug 15 Sep 15 - Aug 16 Sep 16 - Aug 17
Nashville, TN Market – 3 Year RevPAR by Day of Week12MMA
+$ *RevPAR premium compared to 3 year average

© 2017 STR. All Rights Reserved.
Group Trends

© 2017 STR. All Rights Reserved.
63.9%
32.2%
20%
30%
40%
50%
60%
70%
20
05
20
06
20
07
20
08
20
09
20
10
20
11
20
12
20
13
20
14
20
15
20
16
20
17
Transient Mix Group Mix
US Industry Group and Transient Mix12MMA Luxury and Upper-Upscale Classes
Total US Group and Transient Mix, Occupied Rooms12MMA, January 2005 – August 2017, *Luxury & Upper Upscale Classes Only

© 2017 STR. All Rights Reserved.
48.0%
49.5%
20%
30%
40%
50%
60%
70%
20
05
20
06
20
07
20
08
20
09
20
10
20
11
20
12
20
13
20
14
20
15
20
16
20
17
Transient Mix Group Mix
Nashville, TN Market Group and Transient Mix 12MMA Luxury and Upper-Upscale Classes
Nashville, TN Market Group and Transient Mix, Occupied Rooms12MMA, January 2005 – August 2017, *Luxury & Upper Upscale Classes Only

© 2017 STR. All Rights Reserved.
$219
$194
$125
$150
$175
$200
$225
$250
20
05
20
06
20
07
20
08
20
09
20
10
20
11
20
12
20
13
20
14
20
15
20
16
20
17
Transient ADR Group ADR
US Industry Group and Transient ADRs12MMA Luxury and Upper-Upscale Classes
Total US Group and Transient ADRs12MMA, January 2005 – July 2017, *Luxury & Upper Upscale Classes Only
7.8%
11.4%

© 2017 STR. All Rights Reserved.
$218
$190
$100
$125
$150
$175
$200
$225
20
05
20
06
20
07
20
08
20
09
20
10
20
11
20
12
20
13
20
14
20
15
20
16
20
17
Transient ADR Group ADR
Nashville, TN Market Group and Transient ADRs12MMA Luxury and Upper-Upscale Classes
Nashville, TN Market Group and Transient ADRs12MMA, January 2005 – August 2017, *Luxury & Upper Upscale Classes Only
1.3%
14.3%

© 2017 STR. All Rights Reserved.
What markets do you consider “hot” destinations?

© 2017 STR. All Rights Reserved.
Convention Center Submarkets2016 Group Demand Variance vs. Prior Peak
Was
hin
gto
n D
C
Las
Ve
gas
Ne
w Y
ork
San
Fra
nci
sco
Bo
sto
n
Ch
icag
o
San
An
ton
io
Mia
mi B
eac
h
Ph
ilad
elp
hia
Tam
pa
Seat
tle
Ch
arlo
tte
St. L
ou
is
Salt
Lak
e C
ity
An
ahe
im
Ro
sem
on
t
Ho
ust
on
San
Jo
se
Lou
isvi
lle
Atl
anta
Fort
Lau
de
rdal
e
Min
ne
apo
lis
Cle
vela
nd
Pit
tsb
urg
h
Po
rtla
nd
Bal
tim
ore
Dal
las
Ph
oe
nix
De
nve
r
Los
An
gele
s
Ne
w O
rle
ans
San
Die
go
Nas
hvi
lle
Ind
ian
apo
lis
Au
stin
Orl
and
o
-500
-400
-300
-200
-100
0
100
200
300
400
500
Gro
up
Ro
om
Nig
hts
(0
00
s)
New Convention Center Hotel
Developing Convention Center HotelProposed Convention Center Hotel
Net Loss of 300,000 Group Room Nights

© 2017 STR. All Rights Reserved.
Top 5 Projects In Construction By Meeting Space
Project Name MarketProjected
Opening DateRoom Count
Total SqFtMeeting Space
Gaylord Rockies Hotel & Conference Center Denver 12/12/2018 1500 400,000
Fairmont Austin Austin 09/30/2017 1048 107,000
Hyatt Regency Seattle Seattle 06/30/2018 1260 100,000
Omni Louisville Louisville 03/31/2018 600 70,000
JW Marriott Nashville Nashville 07/01/2018 533 60,000
1
2
3
45

© 2017 STR. All Rights Reserved.
2017 / 2018 Forecasts

© 2017 STR. All Rights Reserved.
Total United States Key Performance Indicator Outlook(% Change vs. Prior Year) 2017F – 2018F
Outlook
2017Forecast
2018Forecast
Supply 2.0% 2.1%
Demand 2.0% 1.9%
Occupancy 0.0% -0.2%
ADR 2.3% 2.5%
RevPAR 2.3% 2.3%

© 2017 STR. All Rights Reserved.
Total United StatesChain Scale Key Performance Indicator Outlook 2017F by Chain Scale
2017 Year End Outlook
Chain ScaleOccupancy
(% chg)ADR
(% chg)RevPAR(% chg)
Luxury -0.2% 2.3% 2.1%
Upper Upscale -0.2% 2.0% 1.8%
Upscale -0.9% 1.8% 1.0%
Upper Midscale -0.4% 1.7% 1.3%
Midscale 0.1% 2.1% 2.2%
Economy 0.2% 2.2% 2.5%
Independent 0.4% 2.8% 3.3%
Total United States 0.0% 2.3% 2.3%

© 2017 STR. All Rights Reserved.
Total United StatesChain Scale Key Performance Indicator Outlook 2018F by Chain Scale
2018 Year End Outlook
Chain ScaleOccupancy
(% chg)ADR
(% chg)RevPAR(% chg)
Luxury -0.1% 2.6% 2.5%
Upper Upscale -0.2% 2.4% 2.2%
Upscale -0.8% 2.0% 1.2%
Upper Midscale -0.6% 2.0% 1.4%
Midscale -0.3% 2.1% 1.8%
Economy -0.2% 2.1% 1.9%
Independent 0.0% 2.7% 2.6%
Total United States -0.2% 2.5% 2.3%

© 2017 STR. All Rights Reserved.
2017 Year End RevPAR ForecastTop North American Markets, August 2017 Forecast (Markets sorted alphabetically)
-5% to 0% 0% to 5% 5% to 10% Houston, TX Anaheim-Santa Ana, CA Montreal, QC
Miami-Hialeah, FL Atlanta, GA Norfolk-Virginia Beach, VAMinneapolis-St. Paul, MN-WI Boston, MA Seattle, WA
New Orleans, LA Chicago, IL Toronto, ON
San Francisco-San Mateo, CA Dallas, TX Vancouver, BC
Denver, CO Washington, DC-MD-VADetroit, MI
Los Angeles-Long Beach, CA
Nashville, TN
New York, NY
Oahu Island, HI
Orlando, FL
Philadelphia, PA-NJ
Phoenix, AZ
San Diego, CA
St. Louis, MO-IL
Tampa-St. Petersburg, FL
Note: RevPAR Forecast numbers are based on local currency

© 2017 STR. All Rights Reserved. Note: RevPAR Forecast numbers are based on local currency; markets sorted alphabetically
2018 Year End RevPAR ForecastTop North American Markets, August 2017 Forecast
© 2017 STR. All Rights Reserved.
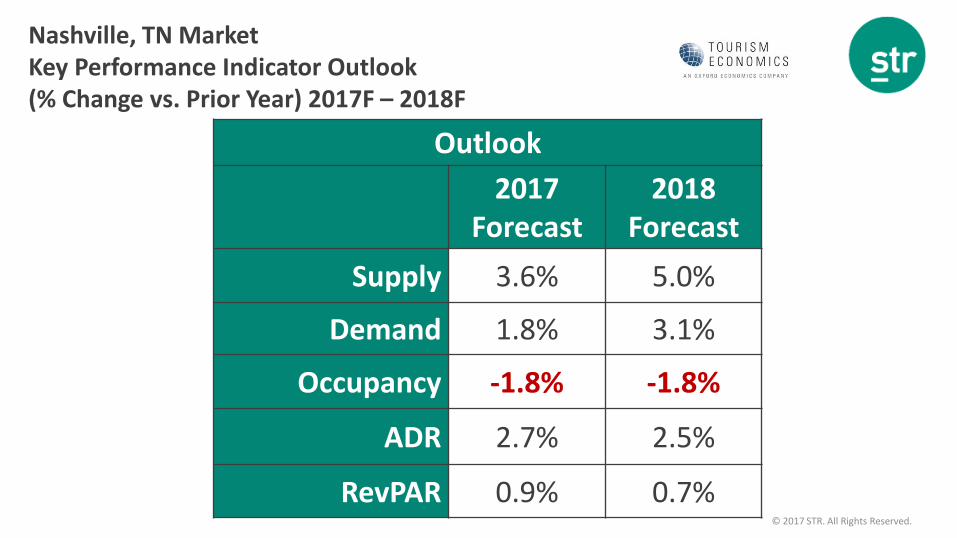
Nashville, TN MarketKey Performance Indicator Outlook(% Change vs. Prior Year) 2017F – 2018F
Outlook
2017Forecast
2018Forecast
Supply 3.6% 5.0%
Demand 1.8% 3.1%
Occupancy -1.8% -1.8%
ADR 2.7% 2.5%
RevPAR 0.9% 0.7%

© 2017 STR. All Rights Reserved.
Food for Thought…

© 2017 STR. All Rights Reserved.
Total U.S. F&B Performance
+2.0%+1.4%
-3.6%
+1.4% +1.5%
Catering & Banquets
RevPAS
F&B Venues Rev/Avail
Seat
In-Room Dining Rev/Occ Room
Total F&B
RevPOR
Total F&B
Revenue
Total U.S. F&B Performance – June 2017 12MMA

© 2017 STR. All Rights Reserved.
0.0%
2.0%
4.0%
6.0%
8.0%
10.0%
2015 2016 2017
Hu
nd
red
s
Total F&B RevPOR C&B RevPAS
C&B RevPAS Outpaces Total F&B RevPOR Growth
U.S. Properties – 12MMA Percent Change, January 2015 – June 2017 Catering & Banquets Revenue Per Available SqFt %ch, F&B Revenue Per Occupied Room %ch*Participating and Eligible Luxury & Upper Upscale Classes Only

© 2017 STR. All Rights Reserved.
C&B RevPAS by Class
Food Beverage Other
Luxury $0.67 +1.0% $0.12 +1.2% $0.39 +0.4%
Upper Upscale $0.40 +3.3% $0.05 +3.5% $0.23 +1.1%
Upscale $0.15 -0.7% $0.02 -4.6% $0.09 +1.3%
Total $0.44 +2.5% $0.07 +2.5% $0.25 +0.9%
Catering & Banquets RevPAS by Class with Percent ChangeJune 2017 12MMA

© 2017 STR. All Rights Reserved.
C&B Revenue per Group Roomnight
$35
$4
$22
Upscale
$158
$29
$91
Luxury
Food Beverage Other
$96
$12
$54
Upper Upscale
Catering & Banquets Revenue Contribution per Group Roomnight, by ClassJune 2017 12MMA
$163
$279
$61

© 2017 STR. All Rights Reserved.
Questions?

© 2017 STR, Inc. All Rights Reserved. Any reprint, use or republication of all or a part of this presentation without the prior written approval of STR, Inc. or STR Global, Ltd. trading as STR (collectively “STR”) is strictly prohibited. Any such reproduction shall specifically credit STR as the source. This presentation is based on data collected by STR. No strategic advice or marketing recommendation is intended or implied.
Thank You
Veronica Andrews
Director, Digital Data Solutions
@STR_Data