Embed Size (px)
Citation preview

Re-Use of Mine Waste Materials Amended with Fly Ash in Transportation Earthworks Projects
MPC 17-332 | M. H. Gorakhki, S.A. Alhomair, and C.S. Bareither
Colorado State University North Dakota State University South Dakota State University
University of Colorado Denver University of Denver University of Utah
Utah State UniversityUniversity of Wyoming
A University Transportation Center sponsored by the U.S. Department of Transportation serving theMountain-Plains Region. Consortium members:

RE-USE OF MINE WASTE MATERIALS AMENDED WITH FLY ASH IN
TRANSPORTATION EARTHWORK PROJECTS
Mohammad H. Gorakhki
Sultan A. Alhomair
Christopher A. Bareither
Department of Civil and Environmental Engineering
Colorado State University
Fort Collins, Colorado
October 2017
Acknowledgements
Financial support for this study was provided in part by the Mountain Plains Consortium awarded to
North Dakota State University through the U.S. Department of Transportation. The opinions, findings,
conclusions, or recommendations expressed herein are those of the authors and do not necessarily
represent the views of the Mountain Plains Consortium, North Dakota State University, or Colorado State
University.
Disclaimer
The contents of this report reflect the views of the authors, who are responsible for the facts and the
accuracy of the information presented. This document is disseminated under the sponsorship of the
Department of Transportation, University Transportation Centers Program, in the interest of information
exchange. The United States Government assumes no liability for the contents or use thereof.
NDSU does not discriminate in its programs and activities on the basis of age, color, gender expression/identity, genetic information, marital status, national origin, participation in lawful off-campus activity, physical or mental disability, pregnancy, public assistance status, race, religion, sex, sexual orientation, spousal relationship to current employee, or veteran status, as applicable. Direct inquiries to Vice Provost for Title IX/ADA Coordinator, Old Main 201, NDSU Main Campus, 701-231-7708, [email protected].
ABSTRACT
The objectives of this study were to assess geotechnical properties of mine waste amended with fly ash
and evaluate reuse of fly ash amended mine waste as road construction material. Three types of fly ash
and one type of cement were used as cementitious binder. Natural and synthetic (i.e., laboratory prepared)
mine tailings were used as mine wastes to assess the effects of tailings properties and solids content on
hydraulic and mechanical behavior of fly-ash amended materials. The influence of fly ash-amendment on
hydraulic conductivity of mine tailings was attributed to (i) molding water content and (ii) plasticity of the
mine tailings. Unconfined compressive strength increased with an increase in tailings particle size, solids
content, and/or increase in CaO-to-SiO2 ratio of fly ash for amended mine tailings. The compressibility of
mine tailings decreased with an increase in fly ash content and an increase in CaO content and CaO-to-
SiO2 ratio of fly ash, which resulted in more effective bonding between particles. Fly as-amended mine
wastes were shown to have hydraulic and mechanical properties suitable for transportation earthwork
applications.

TABLE OF CONTENTS
1. HYDRAULIC CONDUCTIVITY OF FLY ASH-AMENDED MINE TAILINGS ....................... 1
1.1 Introduction .................................................................................................................................. 1 1.2 Background ................................................................................................................................... 2 1.3 Materials and Methods ................................................................................................................. 3
1.3.1 Materials .......................................................................................................................... 3 1.3.1.1 Mine Tailings .................................................................................................... 3 1.3.1.2 Fly Ash ............................................................................................................. 4 1.3.1.3 Mixtures of Tailings and Fly Ash ..................................................................... 4
1.3.2 Compaction Tests ............................................................................................................ 5 1.3.3 Hydraulic Conductivity Experiments .............................................................................. 5
1.4 Results .......................................................................................................................................... 7 1.4.1 Hydraulic Conductivity Testing ...................................................................................... 7 1.4.2 Hydraulic Conductivity of Fly Ash-Amended Tailings .................................................. 7
1.4.2.1 Low-Plasticity Silt Tailings .............................................................................. 8 1.4.2.2 Low Plasticity Clay Tailings ............................................................................ 9
1.4.3 Evaluation of Curing Time and Fly Ash Type .............................................................. 10 1.4.4 Practical Implications .................................................................................................... 11
2. UNCONFINED COMPRESSIVE STRENGTH OF SYNTHETIC AND NATURAL
MINE TAILINGS AMENDED WITH FLY ASH AND CEMENT ............................................. 23
2.1 Introduction ................................................................................................................................ 23 2.2 Materials and Methods ............................................................................................................... 24
2.2.1 Materials ........................................................................................................................ 24 2.2.1.1 Mine Tailings .................................................................................................. 24 2.2.1.2 Cementitious Binders ..................................................................................... 25
2.2.2 Slump Tests ................................................................................................................... 26 2.2.3 Unconfined Compression Strength Tests ...................................................................... 26
2.3 Results ........................................................................................................................................ 27 2.3.1 Unconfined Compressive Strength ................................................................................ 27
2.3.1.1 Unconfined Compressive Strength of Pure Synthetic Tailings ...................... 27 2.3.1.2 Unconfined Compressive Strength of Fly Ash-Amended Synthetic
Tailings ........................................................................................................... 27 2.3.2 Multivariate Regression Analysis .................................................................................. 30
2.3.2.1 Model Development ....................................................................................... 30 2.3.2.2 Validation of the Prediction Model ................................................................ 31
2.3.3 Practical Implications .................................................................................................... 33
3. COMPRESSION BEHAVIOR OF MINE TAILINGS AMENDED WITH
CEMENTITIOUS BINDERS ............................................................................................................ 50
3.1 Introduction ................................................................................................................................ 50 3.2 Materials and Methods ............................................................................................................... 51
3.2.1 Materials ........................................................................................................................ 51 3.2.1.1 Mine Tailings .................................................................................................. 51 3.2.1.2 Cementitious Binders ..................................................................................... 52
3.2.2 Compression Testing ..................................................................................................... 53

3.3 Results ........................................................................................................................................ 54 3.3.1 Compression Behavior of Specimens Cured with No Applied Vertical Stress ............. 54
3.3.1.1 Effect of Physical Properties .......................................................................... 55 3.3.1.2 Effect of Curing Time ..................................................................................... 56 3.3.1.3 Effect of Fly Ash Chemical Composition ...................................................... 58
3.3.2 Compression Behavior for Specimens Cured Under Applied Vertical Stress ............... 58 3.3.3 Natural Tailings ............................................................................................................. 59
4. SUMMARY AND CONCLUSION ................................................................................................... 78
4.1 Hydraulic Conductivity .............................................................................................................. 78 4.2 Unconfined Compressive Strength ............................................................................................. 78 4.3 Compressibility ........................................................................................................................... 79
5. REFERENCES ................................................................................................................................... 81

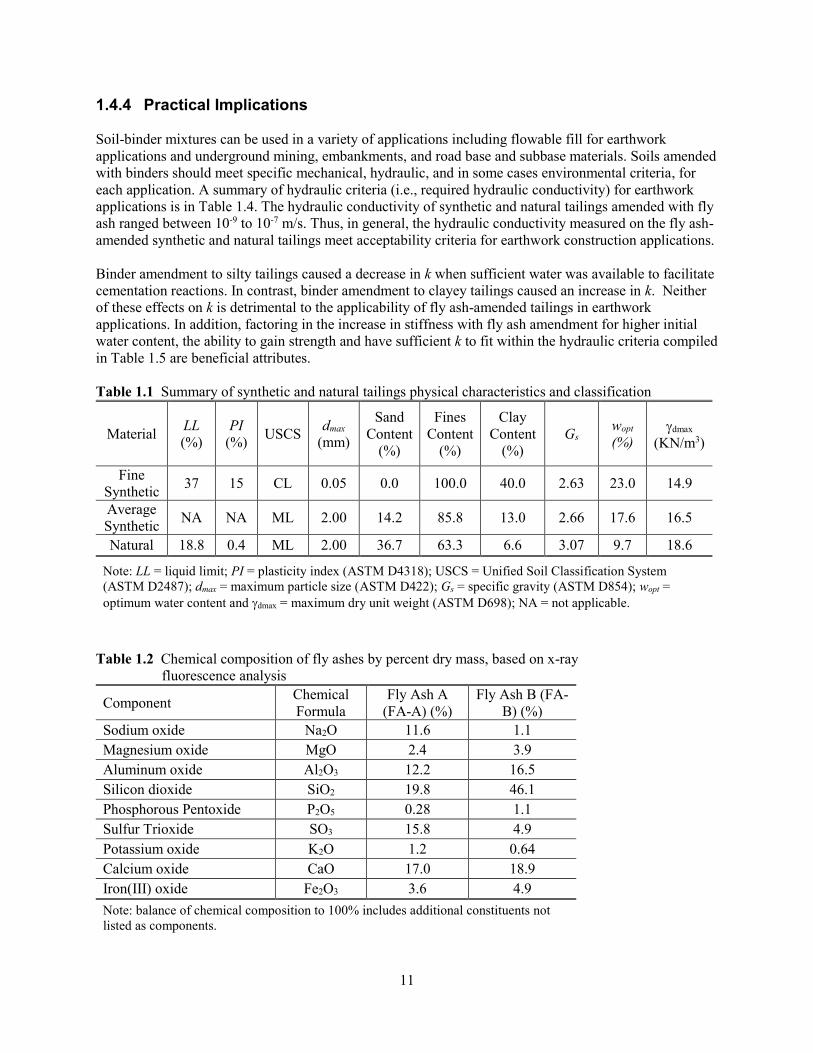
LIST OF TABLES Table 1.1 Summary of synthetic and natural tailings physical characteristics and classification. ............ 11
Table 1.2 Chemical composition of fly ashes by percent dry mass, based on x-ray fluorescence
analysis. ..................................................................................................................................... 11
Table 1.3 Initial and final specimen properties and average final hydraulic conductivity for
experiments conducted on average synthetic tailings, fine synthetic tailings, and natural
tailings with and without fly ash. .............................................................................................. 12
Table 1.4 Initial and final specimen properties and average final hydraulic conductivity for
experiments conducted on average synthetic tailings, fine synthetic tailings, and natural
tailings with and without fly ash (continued). ........................................................................... 11
Table 1.5 Hydraulic conductivity (k) criteria for acceptability of earthen materials in earthwork
construction applications........................................................................................................... 13
Table 2.1 Summary of synthetic and natural tailings physical characteristics and classification. ............ 34
Table 2.2 Chemical composition of fly ashes and cement by percent dry mass based on x-ray
fluorescence analysis................................................................................................................. 34
Table 2.3 Summary of unconfined compressive strength (UCS) tests conducted on synthetic
tailings specimens amended with fly ash or cement. ................................................................ 35
Table 2.4 Summary of unconfined compressive strength (UCS) tests conducted on natural tailings
amended with fly ash or cement. .............................................................................................. 36
Table 3.1 Summary of waste rock and tailings physical characteristics and classification. ..................... 60
Table 3.2 Chemical composition by percent (%) mass for fly ash and cement based on X-ray
fluorescence analysis................................................................................................................. 60
Table 3.3 Summary of specimen properties and compression parameters of synthetic and natural
tailings with and without binder amendment. ........................................................................... 61
Table 3.4 Summary of specimen properties and compression parameters of synthetic and natural
tailings amended with binder and cured under an applied vertical stress. ................................ 62
Table 3.5 Summary of specimen properties and compression parameters of synthetic and natural
tailings amended with fly ash. ................................................................................................... 62
LIST OF FIGURES Figure 1.1 Schematics of (a) unamended and (b) binder-amended tailings (or soils) based on a
soil matrix that is either coarser-grained and/or non-plastic or finer-grained and
containing clay particles (i.e., exhibits some plasticity). ..................................................... 14
Figure 1.2 Particle-size distribution for natural tailings, average synthetic tailings, fine
synthetic tailings, and the upper-bound, lower-bound, and average from compiled
mine tailings particle-size distributions (Qiu and Sego 2001; Morris and Williams
2005; Khalili et al. 2005; Wickland and Wilson 2005; Wickland et al. 2006;
Bussière 2007; Khalili et al. 2010; Wickland et al. 2010). .................................................. 15
Figure 1.3 Compaction curves of unamended natural tailings and fly ash-amended natural
tailings with 5%, 10%, and 15% addition of Fly ash A (FA-A), based on dry mass.
Compaction curves were fitted with a third-order polynomial, based on Howell et
al. (1997). The coefficient of determination (R2) represents the fit of the polynomial
to compaction data. .............................................................................................................. 16
Figure 1.4 Schematic of the hydraulic conductivity test setup. ............................................................. 17
Figure 1.5 Temporal relationships of hydraulic conductivity and ratio of outflow-to-inflow for
unamended (a) average synthetic tailings, (b) fine synthetic tailings, and (c) natural
tailings prepared at an initial target water content of 11%. .................................................. 18
Figure 1.6 Relationship between hydraulic conductivity (k) and initial molding water content
(wi) for unamended and all fly ash-amended (a) average synthetic tailings, (b) fine
synthetic tailings, and (c) natural tailings. Fly ash-amended tailings include
materials mixed with Fly Ash A (FA-A) or Fly Ash B (FA-B) and cured for either
7 days or 28 days. ................................................................................................................. 19
Figure 1.7 Relationships between (a) normalized hydraulic conductivity (kB/k0) and water to
binder ratio (W/B) for all fly ash-amended tailings specimens evaluated in this
study, and (b) kB/k0 versus W/B for tests conducted as part of this study and data
compiled from literature. Dashed lines capture general trends in kB/k0 versus W/B
relationships and the question mark (?) designates outliers in the data. .............................. 20
Figure 1.8 Relationships between the change in void ratio and initial molding water content
for (a) average synthetic tailings, (b) fine synthetic tailings, and (c) natural tailings.
Change in void ratio computed as the difference between final and initial void
ratios [-Δe = -(ef – ei)]. ......................................................................................................... 21
Figure 1.9 One-to-one plots of hydraulic conductivity of amended tailings (a) cured for 28
days versus those cured for 7 days, and (b) that were cured with Fly ash B (FA-B)
versus those cured with Fly ash A (FA-A)........................................................................... 22
Figure 2.1 Particle-size distributions for (a) average, coarse, and fine synthetic mine tailings
prepared for this study and (b) fine garnet, coarse garnet, and copper natural
tailings. The upper, lower, and average tailings particle-size distributions shown in
both plots are based on a compilation from literature (Qiu and Sego 2001; Morris
and Williams 2005; Khalili and Wijewickreme 2008; Wickland and Wilson 2005;
Wickland et al. 2006; Bussière 2007; Khalili et al. 2010; Wickland et al. 2010). ............... 37

Figure 2.2 Ternary phase diagram of chemical composition of common binders (Popovics
1970; Tariq 2012) and fly ash A (FA-A), fly ash B (FA-B), and cement (CEM)
used in this study. Tabulated values represent the total mass fraction of chemical
components of the fly ashes and cement used in the ternary diagram, percent of
each constituent plotted in the diagram, and calcium oxide to silica ratio
(CaO/SiO2). .......................................................................................................................... 38
Figure 2.3 Relationship between slump and solids content (SC) or water content for synthetic
tailings prepared to different levels of dewatering: thickened tailings – SC < 70%;
paste tailings – 70% < SC < 85%; filtered tailings – SC > 85%. ......................................... 39
Figure 2.4 Relationship between axial stress and axial strain for unconfined compression
strength tests non-fly ash amended (SC-90-N) and fly ash amended (SC-90-FA-
A10 and SC-90-FA-B10) synthetic mine tailings. ............................................................... 40
Figure2.5 Relationship between unconfined compressive strength (UCS) and solids content
or water content for non-amended synthetic tailings specimens. Note: UCS = 0 kPa
corresponds to slurry materials that were not self-supporting and had no capacity to
carry an axial load. ............................................................................................................... 41
Figure 2.6 Unconfined compressive strength (UCS) of fine, average, and coarse synthetic
tailings with no fly ash (No FA) and amended with 10% Fly Ash A (FA-A10), 10%
Fly Ash B (FA-B10), a mixture of 10% Fly Ash A and 10% FA-B (FA-A10+B10)
and 20% Fly Ash B (FA-B20). Unconfined compressive strengths are show for
synthetic tailings prepared to solids contents (SC) of (a) 90%, (b) 80%, and (c)
70%. ..................................................................................................................................... 42
Figure 2.7 Relationships between unconfined compressive strength and (a) water-to-binder
ratio (W/B) and (b) porosity-to-volumetric portion of binder (n/Bv) for fly ash-
amended synthetic tailings specimens. Nomenclature notes: SA = average synthetic
tailings; SF = fine synthetic tailings; SC = coarse synthetic tailings; FA-A = Fly
Ash A; FA-B = Fly Ash B; 10 and 20 are percent fly ash amendments by dry mass. ......... 43
Figure 2.8 Comparison of unconfined compressive strength (UCS) of fine, average, and coarse
synthetic tailings amended with Fly Ash B (FA-B) versus UCS of fine, average,
and coarse synthetic tailings amended with Fly Ash A (FA-A): (a) 10% FA-B
versus 10% FA-A and (b) 20% FA-B versus 10% FA-A plus 10% FA-B. ......................... 44
Figure 2.9 Comparison between unconfined compressive strength predicted using the
regression model developed based on the synthetic tailings experiments (Eq. 3.1)
and unconfined compressive strength measured on the synthetic tailings. .......................... 45
Figure 2.10 Unconfined compressive strength (UCS) of natural tailings prepared to solids
contents (SC) of (a) 70% and (b) 80% and amended with 10% of Fly Ash A, 10%
of Fly Ash B, and 10% cement. ........................................................................................... 46
Figure 2.11 Comparison between unconfined compressive strength (UCS) predicted using the
regression model developed in this study, based on the synthetic tailings
experiments (Eq. 3.1) and UCS measured on natural tailings in this study as well as
low plasticity soils (i.e., liquid limit < 50%) compiled from literature [note: Theresa
Soil plotted from Tastan et al. (2011) and CL soil plotted from Senol et al. (2012)].
Average bias was computed as the arithmetic average of predicted minus measured. ........ 47
Figure 2.12 Comparison between unconfined compressive strength (UCS) predicted using the
regression model developed in this study based on the synthetic tailings
experiments (Eq. 3.1) and UCS for high plasticity soils (i.e., liquid limit ≥ 50%)
compiled from literature. Average bias was computed as the arithmetic average of
predicted minus measured. ................................................................................................... 48
Figure 2.13 Schematic of a typical roadway cross-section with common earthworks identified
and tabulated mechanical criteria for road construction materials and cemented
paste backfill used in mining applications. .......................................................................... 49
Figure3.1 Particle-size-distribution of compiled range and average particle-size distributions
for mine tailings compiled from Qiu and Sego (2001), Morris and Williams (2005),
Khalili et al. (2005), Wickland and Wilson (2005), Wickland et al. (2006) Bussière
(2007), Khalili et al. (2010), and Wickland et al. (2011), (a) synthetic tailings, and
(b) natural tailings. ............................................................................................................... 63
Figure 3.2 Ternary phase diagram of chemical composition of common binders and
composition table of cement and fly ashes used in this study (Popovics 1970;
Conner 1990; Tariq 2012) and binder used in this study. .................................................... 64
Figure 3.3 Relationships of (a) void ratio versus time and (b) void ratio at 24-h versus vertical
effective stress for specimen fine synthetic tailings prepared at a solids content of
70%, Fly Ash A amendment of 8.5%, and curing time = 7 days (FS17). Data in (a)
are for a vertical stress increase of 50 kPa and final vertical effective stress = 83
kPa. Identification of the breaking stress was based on the Casagrande method for
pre-consolidation stress. ....................................................................................................... 65
Figure 3.4 Temporal trends of void ratio and pore water pressure in fine synthetic tailings
specimens prepared at 70% solids contents with (a) no binder amendment (FS15),
(b) 8.5% Fly Ash A amendment (FS17), and (c) 8.5% cement amendment (FS22). ........... 66
Figure 3.5 Void ratio at the end of 24 hours versus vertical effective stress relationships for
fine synthetic tailings prepared at 70% solids content with 8.5% Fly Ash A (FA-A)
(FS17), 8.5% Fly Ash C (FA-C) (FS20), 8.5% cement (FS29), and no binder
addition (FS Tailings) (FS15). ............................................................................................. 67
Figure 3.6 Effect of fly ash content on compression behavior of mine tailings amended with
fly ash (a) effect of fly ash content on breaking stress of fine synthetic tailings; (b)
effect of fly ash content on breaking stress of average synthetic tailings; (c) effect
of fly ash content on compression index of fine synthetic tailings; and (d) effect of
fly ash content on compression index of average synthetic tailings. ................................... 68
Figure 3.7 Relationship between compression index (Cc) and breaking stress (σ’B) for average
synthetic tailings (AST) and fine synthetic tailings (FST) amended with fly ash A
(FA-A), fly ash C (FA-C), and cement (CEM). ................................................................... 69
Figure 3.8 Relationship between breaking stress (σ’B) and porosity-to-volumetric portion of
binder (n/Bv) for synthetic tailings specimens amended with FA-A. Nomenclature
notes: AST = average synthetic tailings; FST = fine synthetic tailings; t = curing
time....................................................................................................................................... 70
Figure 3.9 Comparison between breaking stress determined for average synthetic tailings and
breaking stress determined for fine synthetic and average synthetic tailings for
specimens prepared at similar solids contents, water-to-binder ratios (W/B), and
curing times. ......................................................................................................................... 71
Figure 3.10 Effect of curing time on compression behavior of mine tailings amended with fly
ash (a) effect of curing time on breaking stress of fine synthetic tailings; (b) effect
of curing time on breaking stress of average synthetic tailings; (c) effect of curing
time on compression index of fine synthetic tailings; and (d) effect of curing time
on compression index of average synthetic tailings. ............................................................ 72
Figure 3.11 Comparison of compression behavior for (a) average synthetic tailings and (b) fine
synthetic tailings for specimens amended with Fly Ash A, and prepared at a solids
content = 70%, water-to-binder ratio = 5, and at cured for tc = 0.1 day, 7 days, and
28 days. ................................................................................................................................ 73
Figure 3.12 Comparisons of (a) breaking stress and (b) compression index for average and
synthetic tailings amended with Fly Ash C and Fly Ash B and prepared to different
water-to-binder ratios (W/B) and curing for 0.1 day, 7 days, and 28 days. ......................... 74
Figure 3.13 Relationships between void ratio and vertical effective stress (σ'v) for (a) fine
synthetic tailings and (b) average synthetic tailings cured under σ'v ranging from 0
to 100 kPa. All specimens were amended with Fly Ash A and cured for 7 days
under the applied stress (Table 3.4). .................................................................................... 75
Figure 3.14 Relationships between (a) breaking stress and (b) compression index versus applied
vertical effective stress during curing for fine synthetic tailings and average
synthetic tailings. ................................................................................................................. 76
Figure 3.15 Relationship between breaking stress (σ'B) and ratio porosity-to-volumetric portion
of binder (n/Bv) for fly ash-amended natural tailings specimens and fly ash-
amended synthetic tailings that were cured for 7 days. Nomenclature notes: NSA =
natural soda ash tailings; NFG = natural fine garnet tailings; NP200G = natural fine
garnet tailings passing a No. 200 sieve; NCu = natural copper tailings; FA-A = Fly
Ash A; FA-B = Fly Ash B; and FA-C = Fly Ash C. ............................................................ 77
EXECUTIVE SUMMARY
The objectives of this study were to evaluate the effect of fly ash amendment on geotechnical properties
of mine tailings, and assess applicability of using the amended mine waste as earthwork construction
material, such as road subbase and subgrade, unpaved roadways, embankments, and fills. Natural and
synthetic (i.e., laboratory prepared) mine tailings were used to assess the effects of tailings particle-size
and tailings solids content. Three types of off-specification fly ashes and Type I-II Portland cement were
used as cementitious binders. This report was prepared in four sections: (i) Section 1 evaluates hydraulic
conductivity of tailings-fly ash mixtures; (ii) Section 2 evaluates unconfined compressive strength of
tailings-binder mixtures; (iii) Section 3 evaluates compressibility of tailings-binder mixtures; and (iv)
Section 4 summarizes geotechnical properties of tailings-binder mixtures, based on results reported in
Sections 1, 2, and 3.
The objective of Section 1 was to evaluate the effect of fly ash addition on hydraulic conductivity (k) of
mine tailings. Mine tailings used in this section were categorized as synthetic tailings and natural tailings;
two synthetic tailings were developed via blending commercially-available soils, and natural tailings were
collected from a garnet mine located in the United States. Two fly ashes were used that had sufficient
calcium oxide (CaO) content (17% and 18.9%) to generate pozzolanic activity. Hydraulic conductivity
was measured on pure tailings and fly ash-amended tailings in flexible-wall permeameters. Fly ash was
added to mine tailings to constitute 10% dry mass of the mixture, and specimens were cured for 7 and 28
days. The influence of fly ash-amendment on k of mine tailings was attributed to (i) molding water
content and (ii) plasticity of the mine tailings. Tailings that classified as low-plasticity silts with clay
contents less than 15% exhibited a decrease in k when amended with fly ash and prepared wet of optimum
water content (wopt). Tailings classified as low-plasticity clay exhibited a one-order magnitude increase in
k with addition of fly ash for materials prepared dry or near wopt. The decrease in k for silty tailings was
attributed to formation of cementitious bonds that obstructed flow paths, whereas the increase in k for
clayey tailings was attributed to agglomeration of clay particles and an overall increase in average pore
size. Results also indicated that the effect of curing time on k is more pronounced during the early stages
of curing (≤ 7 d), as there was negligible difference between k for 7-d and 28-d cured specimens.
The objectives of Section 2 were to evaluate the effect of binder amendment on the unconfined
compression strength (UCS) of mine tailings and assess applicability of using amended materials in
earthworks. Natural and synthetic mine tailings were used to assess the effects of tailings particle-size and
tailings solids content on UCS. Two types of off-specification fly ashes and Type I-II Portland cement
were used as cementitious binders. Tailings and fly ash mixtures were prepared at 70%, 80%, and 90%
solids content and amended with 10% or 20% binder. Unconfined compression strength tests were
conducted on specimens cured for 7 days. In general, UCS increased with an increase in tailings particle
size, solids content, and/or increase in CaO-to-SiO2 ratio of fly ash for amended tailings specimens. A
multivariate regression model was developed to predict UCS of tailings amended with fly ash as a
function of (i) tailings water content, (ii) water-to-binder ratio, and (iii) CaO-to-SiO2 ratio of fly ash. The
model was developed using data from synthetic tailings specimens and validated via tests on natural
tailings and data compiled from literature. The model is applicable for estimating the UCS of candidate
fly ash-amended hard rock mine tailings and low plasticity soils (i.e., liquid limit < 50). The UCS of high
plasticity materials was under-predicted with the model.
The objective of Section 3 was to evaluate the effect of fly ash amendment on the compression behavior
of mine tailings. Natural and synthetic mine tailings were used to assess the effects of tailings
composition and tailings solids content on compressibility. Three types of off-specification fly ashes and
Type I-II Portland cement were used as cementitious binders. Tailings-fly ash mixtures were prepared at
solids content of 60% to 75% (water content = 33% to 67%), water-to-binder ratios of 2.5 and 5, and were
cured for 0.1 day (2 hours), 7 days, and 28 days. Bi-linear compression curves on semi-log plots were
observed in most of the binder-amended tailings specimens. The break in slope on the compression curve
was identified as the breaking stress, whereupon cementitious bonds were broken. The breaking stress
increased with an increase in fly ash content, which was attributed to a lower water-to-binder ratio and
void volume-to-binder volume ratio that produced more effective particle bonding. Breaking stress also
increased with an increase in CaO content and CaO-to-SiO2 ratio of fly ash, which resulted in more
effective bonding between particles. The effect of curing time on the breaking stress of fly ash amended
specimens was characterized by (i) an increase in breaking stress via increase in curing time and
cementitious bond formation or (ii) a constant breaking stress with curing time due to competing
mechanisms during loading. Specimens cured under a vertical stress showed an increase in breakings
stress with applied load water removal prior to cementitious bond formation that reduced the water-to-
binder ratio and led to more effective cementation.
1
1. HYDRAULIC CONDUCTIVITY OF FLY ASH-AMENDED MINE TAILINGS1 1.1 Introduction
Improving roadway construction and initiating new transportation-related construction projects requires a
broad array of earthwork construction, such as road subbase and subgrade, unpaved roadways,
embankments, and fills. Each of these earthwork projects requires earthen materials (e.g., soil or crushed
rock) constructed in a manner to obtain optimal engineering performance. The reuse of industrial waste
and by-products, such as mine waste (i.e., mine waste rock and tailings) and coal combustion by-products
(CCBs), has the potential to aid transportation-related construction needs, while decreasing energy
consumption, raw material use, and greenhouse gas emissions (Hudson-Edwards et al. 2011).
Mine operations produce considerable quantities of waste materials during ore extraction processes. Mine
tailings are one of the most ubiquitous mine wastes. These materials typically are fine-grained with high
water contents (low solids contents) disposed as slurry in impoundment facilities (Bussière 2007; Blight
2010). The management of mine tailings can require considerable land area, present physical stability
challenges related to low shear strength, and environmental contamination challenges related to acid
generation (Aubertin et al. 1996; Bussière 2007). There is increasing interest in reusing mine waste
amended with cementitious materials (e.g., fly ash or cement) in earthwork construction projects due to
challenges facing mine waste disposal (Misra et al. 1996; Godbout et al. 2007).
Amended mine tailings with a cementitious binder have been used as cemented paste backfill (CPB) in
underground mining to fill cavities (ranging from 15 to 40 m in lateral extent and up to 100-m tall) to
enhance local and global stability. The mechanical, hydraulic, and environmental behavior of CPB has
been investigated by numerous researchers (Zou and Li 1999; Belem et al. 2001; Benzaazoua et al. 2004;
Fall et al. 2005, 2008; Kesimal et al. 2005; Klein and Simon 2006; Yeheyis et al. 2009; Zhang et al. 2011;
Ghirian and Fall 2015). In general, addition of a cementitious binder can increase strength, reduce
hydraulic conductivity, increase pH of the effluent, and stabilize heavy metals present in mine tailings.
The other relevant reuse application of mine tailings amended with cementitious binders is in
transportation earthworks. Swami et al. (2007) and Qian et al. (2011) both report successful construction
and operation of full-scale road subbases with cement-amended mine tailings. Engineering performance
of the cement-amended tailings was assessed via mechanical properties (e.g., unconfined compression
strength and California bearing ratio); however, these studies did not report on the hydraulic properties of
the amended mine tailings. Most research has been focused on understanding factors affecting the
mechanical properties of tailings-binder mixtures (e.g., Kesimal et al. 2004; Benzaazoua et al. 2004; Fall
et al. 2005; Mahmood and Mulligan 2010; Yilmaz et al. 2011), and only a limited number of studies have
focused on understanding factors affecting hydraulic conductivity of tailings-binder mixtures. Recent
work has focused on the effects of water-to-binder ratio (Godbout et al. 2007; Fall et al. 2009) and curing
time (Belem et al. 2001; Godbout et al. 2007; Fall et al. 2009; El Mkadmi et al. 2013; Ghirian and Fall
2013) on the hydraulic properties of fly ash-amended mine tailings.
Fly ash is a widely used CCB due to the pozzolanic properties of the material and ability to serve as a
primary or supplemental cementitious binder. The addition of fly ash to earthen materials has been shown
effective in improving mechanical and hydraulic properties for applications in geotechnical engineering
(Ferguson 1993; Ghosh and Subbarao 1998; Edil et al. 2002, 2006; Bin-Shafique et al. 2004;
1 Alhomair, S.A., Gorakhki, M.H., and Bareither, C.A. (2017). Hydraulic conductivity of fly ash-amended mine tailings,
Geotechnical and Geological Engineering, 35(1), 243-261, DOI 10.1007/s10706-016-0101-z.

2
Trzebiatowski et al. 2004; Arora and Aydilek 2005; Kim et al. 2005; Senol et al. 2006; Ahmaruzzaman
2010; Amadi 2011; Tastan et al 2011; Phanikumar and Shankar 2016). However, there has been limited
research to evaluate the coupled effects of fly ash amendment and physical characteristics of mine tailings
on hydraulic conductivity.
The objective of this study was to evaluate the effect of fly ash amendment on hydraulic conductivity of
mine tailings. In particular, water content of mine tailings is a critical characteristic to evaluate as most
mine tailings are generated at high water contents and subsequent dewatering techniques can be used to
modify mine tailings over a broad range of water contents. Understanding how water content influences
the mechanical and hydraulic properties of fly ash-amended mine tailings, and coupling this
understanding to tailings and fly ash characteristics, will improve reuse potential of these materials in
earthwork construction.
1.2 Background
Schematics of binder-amended and non-binder amended soil or tailings with coarser and finer particle-
sizes are shown in Figure 1.1. The presence of a cementitious binder (e.g., fly ash or cement) results in
formation of calcium silicate hydrate and calcium aluminate silicate hydrate gel (i.e., cementitious bonds)
between soil or tailings particles (Paulini 1990; Tastan et al. 2011). Total porosity and pore-size
distribution are key parameters that control hydraulic conductivity (k) of porous materials. In coarser-
grained, unamended materials (Figure 1.1a), larger pore spaces (macro-pores) between adjacent particles
provide an enhanced ability to convey fluid relative to finer-grained, uncemented materials that have
smaller pore sizes (micro-pores).
The formation of cementitious bonds creates new solid material in a binder-amended soil or tailings
specimen (Figure 1.1b) with potential to decrease or increase k. For fine-grained materials containing
clay, the formation of cementation products will agglomerate clay particles into a cluster known as “clay
agglomeration.” The agglomeration of clay particles increases the average pore size to create a macro-
pore structure (Figure 1.1b), which causes an increase in k (Tay and Goh 1991). For coarse-grained
materials and non-plastic fines, the formation of cementation products will bind solid particles, which can
decrease the average pore size and develop additional micro-pore structure (Figure 1.1b) that decreases k
(Quang and Chai 2015). Key factors shown to influence k of tailings-binder mixtures include (i) water-to-
binder (W/B) ratio, (ii) binder content, and (iii) curing time.
Bin-Shafique et al. (2004) investigated the effect of water content on reactivity of fly ash-amended silty
soils and reported the highest cementitious activity and strength gain for specimens compacted at
optimum water content (wopt) with no delay in hydration and 1% wet of wopt for specimens compacted 2
hours after hydration. Excess water present in the fly ash-amended soils that does not participate in
cementitious bond formation was reported to increase porosity and create a larger pore-size network that
increased k. Similarly, Fall et al. (2009) conducted experiments on silty tailings-cement mixtures with
three W/Bs (i.e., cement content = 5% and water contents = 23%, 34%, and 45%) and reported that excess
available water can increase k by approximately one order of magnitude. Cementitious binders can be
non-reactive in clayey specimens compacted dry of wopt, because most of the water adsorbs to clay
particles and leaves limited available water to react and generate cementitious bonds.
Godbout et al. (2007) evaluated the effect of different binder contents (1% and 4.5%) on k of mine
tailings (82% silt) prepared at a constant water content (w = 32%). A larger reduction in k was measured
for the higher binder content, which was attributed to enhanced microstructure development with
formation of cementitious bonds that reduced void volume and obstructed the flow paths. Xenidis et al.
(2002) also investigated the effect of varying fly ash addition (10%, 18%, 31%, and 63%, by dry mass) on
3
k of sulfate-rich tailings prepared at constant water content. Hydraulic conductivity decreased three orders
of magnitude with an increase in fly ash content from 0% to 63%, due to more cementitious bonding that
enhanced blockage of flow paths through the amended specimens.
In contrast, Goh and Tay (1993) reported that an increase in binder content mixed with soft marine clay
(primarily kaolin) increased k by three orders of magnitude. In a similar study, Deb and Pal (2014)
reported that k of silty clay soil increased up to 20 times with an increase in fly ash content from 0% to
30% when prepared wopt. Similar effects of binder addition on k of marine clay have also been reported by
Show et al. (2003). These studies attributed the increase in k of fly ash-amended clayey soils to (i)
agglomeration of clay particles, (ii) binder hydration and cementation on the overall soil structure, and
(iii) an increase in overall particle size due to adding rounded, silt-size fly ash particles. Results in Goh
and Tay (1993) suggest that clay agglomeration is the dominant mechanism contributing to an increase in
k.
The effect of curing time has been evaluated by Belem et al. (2001), Godbout et al. (2007), and Fall et al.
(2009). These researchers used a broad range of materials and binders to evaluate whether longer binder
hydration times led to changes in k. All researchers reported that k changed relative to the unamended
materials during the first seven days of hydration and subsequent increases in hydration time yielded
negligible effect on k due to near complete binder hydration within seven days.
1.3 Materials and Methods
1.3.1 Materials 1.3.1.1 Mine Tailings
Two types of tailings were used in this study: (i) one type of natural mine tailings and (ii) two synthetic
tailings. Natural and synthetic tailings were used to develop comparisons with literature on fly ash-
amended tailings and soils that are used beneficially in earthwork construction applications.
Commercially-available soils were used to create two synthetic mine tailings that represent typical
particle-size distributions (PSDs) and plasticity of actual hard-rock mine tailings. Natural tailings were
collected from a garnet mine located in the state of New York. Garnet tailings were separated into fine
and coarse fractions at the mine using a hydrocyclone for subsequent reuse in mine site earthworks (e.g.,
tailings dams). The fine fraction (i.e., fine-garnet) of the bulk mine tailings was used in this study. A
compilation of relevant characteristics for the tailings is in Table 1.1. Geotechnical characterization of
synthetic tailings included mechanical sieve and hydrometer (ASTM D422, ASTM 2007), Atterberg
limits (ASTM D4318, ASTM 2014a), specific gravity (ASTM D854, ASTM 2014b), and standard-effort
compaction (ASTM D698, ASTM 2014c). Physical characterization of natural (fine garnet) tailings was
adopted from Jehring and Bareither (2016), with exception of compaction parameters.
The average, upper-bound, and lower-bound PSDs based on a compilation of eight hard-rock mine
tailings from literature are shown in Figure 1.2. Two types of synthetic tailings were used in this study: (i)
fine synthetic tailings – created to represent the upper-bound PSD and (ii) average synthetic tailings –
created to represent the average PSD (Figure 1.2). The PSDs in Figure 1.2 indicate that close replication
was achieved for both synthetic mine tailings. These synthetic tailings were created via mixing angular
sand from road base material with a maximum particle diameter of 2 mm, silica silt (US silica, USA), and
kaolin (Thiele Kaolin Company, USA). The use of synthetic mine tailings was to control material
variability (e.g., mineralogy, pore fluid chemistry, angularity) and capture a range in geotechnical
characteristics.
4
1.3.1.2 Fly Ash
Two types of fly ash were used in this study. Fly ash A (FA-A) was collected from Stanton Station, which
is a 190-MW power plant in Stanton, North Dakota, and fly ash B (FA-B) was obtained from Platte River
Power Authority, which operates a 280-MW power plant near Fort Collins, Colorado. Chemical
compositions of the fly ashes were measured with x-ray fluorescence (XRF) and the results are listed in
Table 1.2. The XRF analysis of FA-A was performed with a Philips 1600/10 Simultaneous Wavelength
Dispersive Unit by Mineralogy-INC (Tulsa, Oklahoma), whereas XRF information for FA-B was
obtained from the power plant. Fly ashes were classified based on ASTM C618 (ASTM 2015) and Tastan
et al. (2011), and both classified as off-specification (off-spec) fly ash. The off-spec designation only
means that the fly ashes do not formally classify as either Class C or Class F, and off-spec fly ashes can
yield effective self-cementing behavior. Lime (CaO), which is a primary component responsible for
cementitious reactions, accounted for 17% of FA-A and 18.9% of FA-B (Table 1.2).
Janz and Johansson (2002) introduced the CaO-to-SiO2 ratio as a potential indicator for cementitious
bond formation, where an increase in this ratio corresponds to a material with enhanced cementitious
potential. For FA-A, the CaO-to-SiO2 ratio was 0.86, which was higher than the CaO-to-SiO2 ratio (0.41)
in FA-B. Tastan et al. (2011) reported that the highest pozzolanic behavior of fly ashes used in their
study was observed for CaO-to-SiO2 ratios between 0.5 and 1.0. Thus, the potential to form cementitious
bonds for FA-A was anticipated to be more pronounced relative to FA-B based on the CaO-to-SiO2 ratio.
1.3.1.3 Mixtures of Tailings and Fly Ash
Tailings typically are generated at low solids content (SC = solid mass / total mass) ranging from 25-45%
as a function of ore processing. These low SC tailings can be dewatered to reclaim water for subsequent
ore processing and create materials that are more geotechnically stable for final disposal in tailing
impoundments or for use in earthwork construction applications. Bussière (2007) identified three ranges
of SCs that correspond to different levels of tailings dewatering: (i) thickened tailings – SC ranging from
50-70%, (ii) paste tailings – SC ranging from 70-85%, and (iii) filtered tailings – SC greater than 85%.
Synthetic and natural tailings were mixed with tap water to create mixtures with target SCs of 70%, 80%,
and 90%, which corresponded to approximate initial water contents (wi) of 40%, 25%, and 11%,
respectively. Chemical characteristics of the tap water used in all mixtures were pH = 6.9 and electrical
conductivity (EC) = 13 mS/m. The SCs used in this study were selected to provide a range of potential
dewatering levels at a given mine as progressive dewatering from thickened to paste to filtered tailings
requires additional time, energy, and economic investment. Fly ash-amended natural and synthetic
tailings were created with fly ash contents of 10% on a dry mass basis. This fly ash content was adopted
based on Edil et al. (2002) who report that 10% fly ash amendments are common in field-construction.
Thus, the range of SCs selected for this study combined with a single, relevant percent fly ash amendment
yielded target W/B ratios of 1, 2.5, and 4. This variability in specimen properties was selected to evaluate
the effect of tailings dewatering levels and tailings composition on hydraulic conductivity of fly ash-
amended materials.
All pure tailings and fly ash-amended hydraulic conductivity specimens were prepared initially from dry
tailings. Synthetic tailings were prepared to the target PSD (Figure 1.2) in a dry state and natural tailings
were air-dried and ground with a rubber pestle to break all clods. Fly ash-amended tailings mixtures were
first mixed dry with the appropriate percent contribution of fly ash and then mixed with tap water (Senol
et al. 2006) in a 20-liter bucket and allowed to hydrate for 2 hours. This procedure was used to simulate a
typical duration between hydration and compaction in field-scale construction (Edil et al. 2006; Senol et
al. 2006). Additionally, ACAA (2003) specifies a maximum elapsed time of 2 hours between moistening
a soil-fly ash mixture and compaction. Following compaction or placement of fly ash-amended tailings in
5
the PVC molds, the entire mold and specimen were sealed in polyethylene bags and allowed to cure for
seven or 28 days prior to testing. Curing was completed in a room with 100% relative humidity and
temperature of 21 ̊C in accordance with prior research (Mohamed et al. 2002; Bin Shafique et al. 2006;
Edil et al. 2006; Senol et al. 2006; Godbout et al. 2007).
1.3.2 Compaction Tests
Compaction tests were completed on all three tailings in accordance with standard-effort compaction
procedures in 101.6-mm-diameter compaction molds (Method B in ASTM D698, ASTM 2014c). The
maximum dry unit weight (dmax) and optimum water content (wopt) for each unamended tailings are in
Table 1.1. These properties were determined via fitting a third-order polynomial to the compaction curves
in accordance with Howell et al. (1997). Compaction characteristics for the unamended tailings exhibit
anticipated effects of material composition on dmax and wopt, where an increase in sand and silt content
and corresponding decrease in plasticity shifted compaction curves to higher dmax and lower wopt (Holtz et
al. 2011). The higher dmax for natural tailings relative to both synthetic tailings was also due to a higher
Gs (Table 1.1).
A series of compaction tests using the natural tailings was completed with varying fly ash amendment of
FA-A to assess how fly ash amendment influences dmax and wopt. Compaction curves for natural tailings
and natural tailings amended with 5%, 10%, and 15% FA-A (based on dry mass) are shown in Figure 1.3.
Compaction curves for the fly ash-amended natural tailings all plot slightly to the right of the pure natural
tailings (Figure 1.3), suggesting that a modest increase in wopt may be anticipated with addition of fly ash.
However, there was no clear trend between increasing fly ash content and dmax or wopt.
1.3.3 Hydraulic Conductivity Experiments
Hydraulic conductivity tests were done on pure tailings and fly ash-amended tailings. Hydraulic
conductivity was measured in flexible-wall permeameters using a constant head method (Method A) in
accordance with ASTM D 5084 (ASTM 2010). A schematic of a hydraulic conductivity setup is shown in
Figure 1.4. Each experimental setup consisted of a permeameter, headwater (influent) accumulator,
tailwater (effluent) accumulator, and an elevated water reservoir to control cell pressure. A manifold was
connected to the elevated reservoir so multiple permeameters could be pressurized with the same cell
pressure.
Cell pressure was controlled via the water level in the reservoir (Figure 1.4) and set at a target pressure of
15 kPa to simulate anticipated near surface field conditions in transportation earthwork projects (Ghosh
and Subbaro 1998; Bin-Shafique et al. 2006). Headwater and tailwater accumulators used for measuring
influent and effluent volumes consisted of 38-mm inner diameter clear acrylic tubes with platens and O-
rings at each end. Constant head loss across a given specimen was maintained via a Mariotte tube in the
headwater accumulator and an elevated exit tube in the tailwater accumulator (Figure 1.4). The hydraulic
gradient was approximately 10 (head loss ≈ 1.3 m) in all experiments. This hydraulic gradient was in
agreement with ASTM D5084 (ASTM 2010) based on an assumed k of 10-7 to 10-9 m/s for the pure
tailings. The hydraulic gradient in transportation earthwork applications is expected to be approximately
one; however, a larger hydraulic gradient was used to decrease test duration.
Hydraulic conductivity tests on tailings and tailings amended with fly ash were performed in 101.6-mm-
diameter flexible-wall permeameters. Tap water (EC = 13 mS/m and pH = 6.9) was used within the
permeameters to apply cell pressure and in the permeant fluid to represent field conditions (Ghosh and
Subbarao 1998; Fall et al. 2009). Environmental compatibility of leachate from mine tailings and fly ash
mixtures was also evaluated on the effluent water (Alhomair 2016), but is not included here. Visible air
6
bubbles were flushed from the drainage tubes prior to testing, and permeation was conducted upward
through the specimen to aid in removing entrapped air bubbles. Backpressure was not applied to represent
field conditions (Benson and Daniel 1990), but final saturation was computed following completion of all
tests. Filter paper and porous stones were placed on the top and bottom of a specimen. All porous stones
were soaked in tap water and all specimens were separated from the cell pressure fluid via conventional
latex membranes sealed with O-rings.
Permeation of a given hydraulic conductivity specimen was executed until the following termination
criteria were achieved for at least four consecutive measurements (ASTM D 5084; Daniel 1994): (i) ratio
of effluent volume to influent volume (Vout/Vin) was between 0.75 and 1.25 and (ii) k was within ± 25% of
the geometric mean k for k ≥ 1 x 10⁻¹⁰ m/s. The majority of specimens were permeated until net outflow
equated at least three pore volumes of flow (PVF), with exception of specimens prepared with fine
synthetic tailings that necessitated longer testing times due to lower hydraulic conductivity (< 1x10⁻⁹ m/s)
of the kaolin clay. The pore volume of a given specimen was determined with respect to the porosity
achieved during specimen preparation. Testing times were extended after meeting ASTM termination
criteria to evaluate if temporal trends existed for k. After terminating a given experiment, final water
content measurements were conducted. The computed final degree of saturation (Sf) was between 90%
and 99% for the majority of the test specimens. In certain cases, saturation criteria were not met (i.e.,
some specimens yielded Sf < 95% or Sf > 105%). However, all experiments were conducted in the same
manner and all specimens are considered sufficiently saturated to yield representative hydraulic
conductivity values.
Hydraulic conductivity specimens consisting of tailings alone and fly ash-tailings mixtures were prepared
in 101.6-mm-diameter by 116.4-mm-tall PVC molds. All materials were prehydrated and then either
compacted or poured into the PVC molds, depending on consistency of the material; lower SC specimens
were slurry materials and were poured into the molds, whereas higher SC specimens were soil-like and
were compacted with standard-effort energy (ASTM D698, ASTM 2014c). The PVC molds containing
slurry materials were vibrated following deposition of the slurry to promote air removal and increase
specimen density. The inner sidewall of the PVC molds was lubricated with Vaseline® prior to specimen
preparation to reduce friction and help facilitate extrusion of the specimens following curing (Jiang et al.
2016). All specimens had height-to-diameter ratios (H/D) of approximately 1.0, which was in agreement
with hydraulic conductivity testing recommendations in Daniel (1994).
Pure tailings specimens at low solids contents (i.e., average synthetic and natural tailings at SC = 80% and
70%, and fine synthetic tailings at SC = 70%) exhibited slurry consistency and were not possible to test in
flexible-wall permeameters because the slurried specimens slumped following removal of a split mold.
Therefore, a technique was adopted from Malusis et al. (2009) whereby an acrylic cylinder was placed on
the outside of the flexible membrane to avoid slumping of the slurried specimens via providing rigid
lateral support for the soft material. A smaller flexible-wall specimen, with length and diameter = 71.1
mm, was used to accommodate the acrylic mold. A small annulus between the inside of the acrylic mold
and latex membrane of the test specimen allowed pressurized water to be in direct contact with the
flexible membrane encasing the test specimen such that these slurried specimens were subjected to the
same 15 kPa confining pressure as the conventional flexible-wall specimens.
A check on k measured with this alternative technique was conducted using average synthetic tailings at a
SC = 90%. The k measured in the 101.6-mm-diameter flexible-wall permeameter was 5.6x10⁻⁸ m/s and k
measured in the 71.1-mm-diameter flexible-wall apparatus with external acrylic mold was 5.7x10⁻⁸ m/s.
Thus, k determined with this alternative hydraulic conductivity measurement technique was assumed
equivalent to k measured in the larger diameter flexible-wall permeameters and are compared directly to
each other in this study.
7
1.4 Results
The results of all hydraulic conductivity tests conducted on unamended and fly ash-amended average
synthetic, fine synthetic, and natural tailings are in Table 1.3. The initial and final void ratios (ei and ef),
water contents (wi and wf), and degree of saturations (Si and Sf) are provided for all test specimens. In
some cases, Sf was greater than 100%, which is not reasonable. These high values of Sf resulted from
difficulty in accurately measuring total volume of some specimens after disassembling the test cells.
However, specimens with Sf > 100 % were assumed fully saturated. A compilation of all experimental
data from the hydraulic conductivity tests as well as effluent leachate chemistry is in Alhomair (2016).
1.4.1 Hydraulic Conductivity Testing
Temporal trends of k and Vout/Vin for unamended average synthetic, fine synthetic, and natural tailings
prepared at a SC ≈ 90% (wi ≈ 11%) are shown in Figure 1.5. Minor fluctuations in k and Vout/Vin were
observed in the early stages of testing, and both parameters subsequently stabilized. All specimens met
ASTM D5084 termination criteria and were subsequently permeated several additional PVFs to evaluate
any temporal trends in hydraulic behavior. The k for each tailings specimen reported in Table 1.3 are
representative of the last four consecutive k measurements for a given experiment. As shown in Figure
1.5, ASTM termination criteria were met prior to terminating a given experiment and evaluation of a final
average k. In all experiments, the difference between the final average k and k based on ASTM
termination criteria was less than ± 1x10⁻⁹ m/s, and equal to 1x10⁻¹⁰ m/s (10%), on average. The final
average k of each experiment was adopted here as the representative k for each material tested in this
study.
1.4.2 Hydraulic Conductivity of Fly Ash-Amended Tailings
The hydraulic conductivity of synthetic and natural tailings-fly ash mixtures was evaluated using three
SCs to represent three levels of tailings dewatering (i.e., SC ≈ 70%, 80%, and 90%, which coincided
approximately with target wi ≈ 40%, 25%, and 11%, respectively) and all were amended with 10% fly
ash, based on dry mass. These test specifications resulted in target W/Bs of 1, 2.5, and 4. Compilations of
k versus initial molding water content (wi) for average synthetic, fine synthetic, and natural tailings are
shown in Figure 1.6. The wopt identified in Figure 1.6 are representative of unamended tailings (Table
1.1). Bin-Shafique et al. (2004) and Deb and Pal (2014) reported no difference in wopt between binder-
amended and non-binder amended silty clay soils, and Lee et al. (2014) reported a modest decrease in
dmax and wopt with addition of fly ash to silty tailings. Thus, for practical purposes, wopt from unamended
tailings and were taken as approximate wopt for the fly ash-amended tailings based on literature and the
compaction evaluation in Figure 1.3. Data in Figure 1.6 include tailings amended with FA-A and FA-B
and specimens cured for 7 days and 28 days.
The k versus wi of all unamended tailings (synthetic and natural) exhibited anticipated behavior relative to
wopt. Hydraulic conductivity of the average synthetic tailings (Figure 1.6a) and fine synthetic tailings
(Figure 1.6b) decreased when transitioning from a dry to wet of wopt condition, which is consistent with
an enhanced ability to remold clods with an increase in water content (Mitchell et al. 1965; Benson and
Daniel 1990; Daniel and Benson 1990). This remolding results in a more micro-pore dominated structure
with increased tortuosity (Shackelford and Moore 2013) that decreases k. Subsequent increase in wi for
average and fine synthetic tailings from 25% to 40% increased void ratio of the tailings and increased k
(Table 1.3).
8
A similar effect of increasing k with continuous increase in wi and ei can be observed for natural tailings
in Figure 1.6c. The low water content, unamended natural tailings specimen (wi ≈ 11%) was compacted
slightly wet of wopt, which yielded the lowest k. Subsequent increases in wi increased ei from 0.57 to 0.63
and 0.65 (Table 1.3) and yielded a corresponding increase in k. Thus, variability in k of the unamended
tailings can be explained via anticipated effects of molding water content on hydraulic conductivity.
The effect of fly ash-amendment on k of mine tailings was dependent on (i) the initial molding water
content of the mixture (wi) and (ii) solid particle composition of the tailings. The first mechanism is
identical to the effect of wi on k described for the unamended tailings. The range of wi for the fly ash-
amended tailings coincided with mixtures that were prepared dry of wopt, near wopt, or wet of wopt. The
effect of wi relative to wopt on k differed between tailings that were low-plasticity silts (i.e., average
synthetic tailings and natural tailings) and tailings that classified as a low-plasticity clay (i.e., fine
synthetic tailings). Mechanistic effects on k were evaluated via these two factors and the W/B of the as-
prepared tailings-fly ash mixture.
1.4.2.1 Low-Plasticity Silt Tailings
The k versus wi relationships for the four different fly ash-amended average synthetic tailings are shown
in Figure 1.6a. These four fly ash treatments corresponded to two different types of fly ash (FA-A and
FA-B) and two curing times (7 days and 28 days). In general, the k versus wi trends for all four fly ash
treatments exhibited a similar trend to the unamended tailings. Hydraulic conductivity decreased when
water content increased from dry to wet of optimum, and subsequent increase in water content increased
k. Additionally, there were no distinct differences between trends or magnitude of k for the four different
fly ash treatments.
The k versus wi relationships for the four different fly ash-amended natural tailings are shown in Figure
1.6c. All four fly ash-amended specimens at wi ≈ 11% can be assumed compacted near to wopt, based on
wopt of unamended natural tailings of 10% and modest increase in wopt for natural tailings amended with
10% fly ash (Figure 1.3). The two higher wi (≈ 25 and 40%) corresponded to conditions considerably wet
of wopt. Similar to the unamended tailings, all k measurements for the fly ash-amended natural tailings
were lowest for specimens compacted near wopt and k increased with increasing water content (Figure
1.6c).
The synthetic average tailings included 13% clay-sized particles, but exhibited no plasticity (Table 1.1).
The natural tailings had a lower clay content (6.6%) and negligible plasticity. Thus, in the average
synthetic tailings and natural tailings the clay-sized particles were primarily non-clay minerals and both
can be referred to as silty tailings. The effect of fly ash amendment on k was similar for the average
synthetic tailings and natural tailings, which was attributed to similarity in tailings particle
characterization.
A relationship between k of the fly ash-amended tailings (kB) normalized to the k of unamended tailings
(k0) versus W/B for all experiments conducted in this study is shown in Figure 1.7a. The normalized k
(i.e., kB/k0) for the average synthetic and natural tailings (i.e., silty tailings) exhibit scatter about kB/k0 ≈
1.0 for W/B ≈ 1 and kB/k0 were all less than 1.0 for W/B ≈ 2.5 and 4 (Figure 1.7a). The average synthetic
tailings prepared at wi ≈ 11% (SC ≈ 90%; W/B ≈ 1) were prepared approximately 5% dry of wopt and
natural tailings prepared at the same initial conditions were approximately at wopt. The limited influence
of fly ash on k of the average synthetic and natural tailings at wi ≈ 11% was attributed to the low-
reactivity of fly ash hydration to generate cementitious bonds as both tailings and fly ash particles
competed for the limited available water (Bin-Shafique et al. 2004). The one outlier in Figure 1.7a is for
the average synthetic tailings prepared at W/B ≈ 1, amended with FA-A, and cured for 7 days.
9
Average synthetic tailings and natural tailings prepared at wi ≈ 25% and 40% exhibited a reduction in k
with addition of fly ash relative to the unamended condition (Figures 1.6a and 1.6c). Additionally, in
both tailings k reduced more for specimens prepared at wi ≈ 25% (W/B ≈ 2.5) compared to specimens
prepared at wi ≈ 40% (W/B ≈ 4). Hydraulic conductivity of the fly ash-amended average synthetic tailings
decreased, on average, by a factor of 3.0 for specimens prepared at W/B ≈ 2.5 and by a factor of 1.8 for
W/B ≈ 4 (Figure 1.7a). Larger reductions of approximately 5.0 and 2.0 were observed for natural tailings
prepared at W/B ≈ 2.5 and 4, respectively (Figure 1.7a). This reduction in k was attributed to development
of cementitious bonds that likely decreased the pore size distribution and/or increased tortuosity. The
smaller reduction in k for the average synthetic and natural tailings at W/B ≈ 4 (i.e., highest wi ≈ 40%) was
attributed to reduced effectiveness in cementitious bond formation due to an increase in available water
and increase in spacing between the particles (i.e., higher ei).
A compilation of kB/k0 versus W/B for fly ash-amended materials from literature are shown in Figure 1.7b.
Data compiled from literature were separated with respect to silty and clayey materials (i.e., tailings or
soil) identified in this study. Similar trends in the effect of fly ash-amendment on k of low-plasticity silty
materials are observed in data from Godbout et al. (2007) and Fall et al. (2009), where the addition of fly
ash typically decreased k.
The development of cementitious bonds for the aforementioned fly ash-amended synthetic average
tailings and natural tailings specimens was qualitatively confirmed via the ability to extrude intact
specimens following curing, whereas the unamended tailings were slurry and non-self-supporting. An
increased stiffness of the fly ash-amended specimens via cementitious bond formation was also supported
by the relative change in void ratio of the unamended and amended specimens as shown in Figure 1.8.
The change in void ratio (-Δe) was computed as the difference between final void ratio at the end of a
given hydraulic conductivity test (ef) and initial void ratio for the as-prepared specimens (ei). The -Δe
increased for all silty tailings specimens with an increase in wi. The -Δe for the unamended average
synthetic (Figure 1.8a) and natural tailings (Figure 1.8c) decreased with addition of fly ash for all
specimens prepared at wi ≈ 25%. This reduction in -Δe was attributed to increased specimen stiffness due
to cementitious bond formation.
The reduction in -Δe for both unamended silty tailings specimens prepared at wi ≈ 40% was more
pronounced for specimens amended with FA-A versus FA-B (Figures 1.8a and 1.8c). Fly ash A had a
larger CaO/SiO2 ratio and was anticipated to have more pozzolanic potential and be more effective in
development of cementitious bonds. This enhanced pozzolanic potential of FA-A versus FA-B is
supported by the lower -Δe at higher wi of the silty tailings.
1.4.2.2 Low Plasticity Clay Tailings
The relationships between k versus wi for the four different fly ash-amended fine synthetic tailings are
shown in Figure 1.6b. These k versus wi relationships exhibit similar trends to the unamended tailings,
where a reduction in k was observed for all fly ash treatments when wi increased from 11% to 25%. This
reduction was attributed to more effective remolding of tailings and fly ash clods as water content shifted
from a dry of wopt to wet of wopt condition (Mitchell et al. 1965; Benson and Daniel 1990; Daniel and
Benson 1990). A subsequent increase in k from wi ≈ 25% to wi ≈ 40% was observed for all fly ash
treatments except FA-A cured for 28 days. This increase in k was attributed to an increase in overall
specimen void ratio with an increase in molding water content (Table 1.3). The continued decrease in k
for the fine synthetic tailings specimen amended with FA-A and cured for 28 days may be due to more
effective development of cementitious bonds with additional curing time. However, a definitive reason
for this trend relative to the other fly ash-amended materials was not identified.
10
All kB/k0 for the fly ash-amended fine synthetic tailings were greater than 1.0 and indicate that the
addition of fly ash to clayey tailings resulted in an increase in k relative to an unamended condition
(Figure 1.7a). This effect of fly ash amendment on k of clayey tailings was attributed to agglomeration of
clay particles via addition of a cementitious binder that likely decreased tortuosity and increased k. The
ratio of kB/k0 was approximately 10 for wi ≈ 11% and 25%, and reduced to 3.4, on average, with an
increase in wi to 40%. The one exception was for the fine synthetic tailings at W/B ≈ 1, amended with FA-
A, and cured for 28 days, which did not exhibit as a pronounced increase in k as the other tailings with
addition of fly ash. Thus, the effect of fly ash-amendment on k of clay-rich tailings diminished with an
increase in water content wet of wopt. This behavior is similar to that observed for silty tailings, and can be
attributed to larger void ratios and larger pore spaces with additional water present that reduced
effectiveness of cementitious bonds to reduce k relative to an unamended condition. Similar observations
on the effects of cementitious binder addition and agglomeration of clay particles have been reported in
literature as shown in Figure 1.7b.
The development of cementitious bonds in the fine synthetic tailings was qualitatively supported by the
ability to extrude intact, fly ash-amended specimens for mixtures prepared at wi ≈ 40%, whereas, the
unamended material was slurry and non-self-supporting. The reduction in -Δe of the fine synthetic
tailings was negligible for all amended and unamended specimens prepared at wi ≈ 11% and 25% (Figure
1.8b). The absence of volume change following application of a 15 kPa confining pressure was due to
specimen preparation dry and near wopt, which corresponds to molding water contents that typically yield
high strength (e.g., Mitchell et al. 1965). However, the -Δe for fine synthetic tailings specimens prepared
at wi ≈ 40% was lower for specimens amended with fly ash relative to the unamended tailings (Figure
1.8b). Additionally, for a given curing time (7 days or 28 days) specimens amended with FA-A yielded
lower -Δe relative to specimens amended with FA-B, which agrees with observations made for silty
tailings and further supports that FA-A was more effective in generating cementitious bonds relative to
FA-B.
1.4.3 Evaluation of Curing Time and Fly Ash Type
A comparison between k of fly ash-amended tailings cured for 28 days versus 7 days is shown in Figure
1.9a and a comparison between k of tailings amended with FA-B versus FA-A is shown in Figure 1.9b.
These 1:1 plots include both synthetic and natural tailings. In general, all data points in Figures 1.9a and
1.9b plot near the 1:1 lines and there is no discernable impact of either curing time or fly ash type on k of
the fly ash-amended tailings evaluated in this study.
The negligible effect of an increase in curing time from 7-28 days on k of fly ash-amended tailings was
anticipated, based on findings reported in literature (Belem et al. 2001; Godbout et al. 2007; Fall et al.
2009). The limited influence of curing time was attributed to the majority of cementitious bond formation
occurring within the first 7 days following hydration. Subsequent increases in curing time yielded limited
further development of cementitious bonds, and thus, limited change in hydraulic conductivity.
The negligible effect of fly ash type on k was not anticipated, as past research has demonstrated a greater
reduction in k of binder-amended materials via enhanced development of cementitious bonds (e.g.,
Godbout et al. 2007). A comparison between CaO/SiO2 for FA-A (0.86) versus FA-B (0.41) suggests that
FA-A was a more effective cementitious binder based on observed pozzolanic activity by Tastan et al.
(2011) for fly ash with CaO/SiO2 between 0.5 and 1.0. Additionally, less volume change occurred for
high water content specimens following application of the 15 kPa confining pressure for tailings amended
with FA-A (Figure 1.8). Although FA-A had more favorable cementitious characteristics and was
observed to lead to stiffer specimens, there was no distinguishable effect of fly ash type on k of the
amended tailings.
11
1.4.4 Practical Implications
Soil-binder mixtures can be used in a variety of applications including flowable fill for earthwork
applications and underground mining, embankments, and road base and subbase materials. Soils amended
with binders should meet specific mechanical, hydraulic, and in some cases environmental criteria, for
each application. A summary of hydraulic criteria (i.e., required hydraulic conductivity) for earthwork
applications is in Table 1.4. The hydraulic conductivity of synthetic and natural tailings amended with fly
ash ranged between 10-9 to 10-7 m/s. Thus, in general, the hydraulic conductivity measured on the fly ash-
amended synthetic and natural tailings meet acceptability criteria for earthwork construction applications.
Binder amendment to silty tailings caused a decrease in k when sufficient water was available to facilitate
cementation reactions. In contrast, binder amendment to clayey tailings caused an increase in k. Neither
of these effects on k is detrimental to the applicability of fly ash-amended tailings in earthwork
applications. In addition, factoring in the increase in stiffness with fly ash amendment for higher initial
water content, the ability to gain strength and have sufficient k to fit within the hydraulic criteria compiled
in Table 1.5 are beneficial attributes.
Table 1.1 Summary of synthetic and natural tailings physical characteristics and classification
Material LL
(%)
PI
(%) USCS
dmax
(mm)
Sand
Content
(%)
Fines
Content
(%)
Clay
Content
(%)
Gs wopt
(%) dmax
(KN/m3)
Fine
Synthetic 37 15 CL 0.05 0.0 100.0 40.0 2.63 23.0 14.9
Average
Synthetic NA NA ML 2.00 14.2 85.8 13.0 2.66 17.6 16.5
Natural 18.8 0.4 ML 2.00 36.7 63.3 6.6 3.07 9.7 18.6
Note: LL = liquid limit; PI = plasticity index (ASTM D4318); USCS = Unified Soil Classification System
(ASTM D2487); dmax = maximum particle size (ASTM D422); Gs = specific gravity (ASTM D854); wopt =
optimum water content and dmax = maximum dry unit weight (ASTM D698); NA = not applicable.
Table 1.2 Chemical composition of fly ashes by percent dry mass, based on x-ray
fluorescence analysis
Component Chemical
Formula
Fly Ash A
(FA-A) (%)
Fly Ash B (FA-
B) (%)
Sodium oxide Na2O 11.6 1.1
Magnesium oxide MgO 2.4 3.9
Aluminum oxide Al2O3 12.2 16.5
Silicon dioxide SiO2 19.8 46.1
Phosphorous Pentoxide P2O5 0.28 1.1
Sulfur Trioxide SO3 15.8 4.9
Potassium oxide K2O 1.2 0.64
Calcium oxide CaO 17.0 18.9
Iron(III) oxide Fe2O3 3.6 4.9
Note: balance of chemical composition to 100% includes additional constituents not
listed as components.
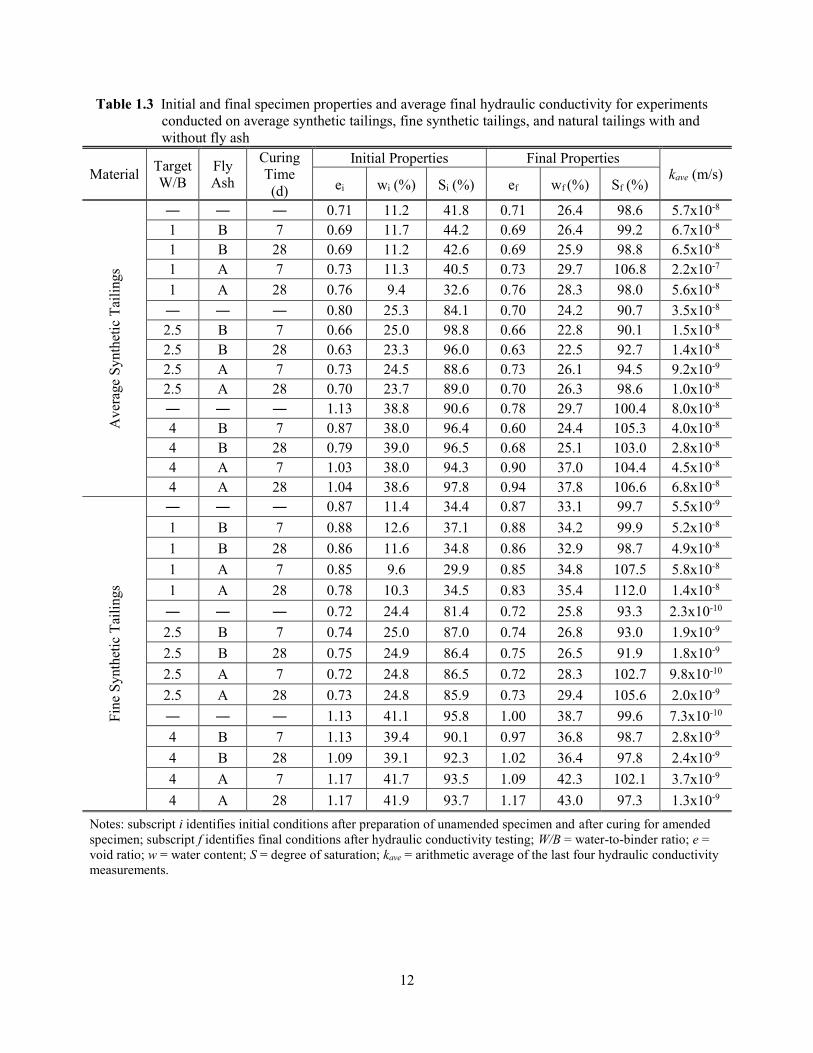
12
Table 1.3 Initial and final specimen properties and average final hydraulic conductivity for experiments
conducted on average synthetic tailings, fine synthetic tailings, and natural tailings with and
without fly ash
Material Target
W/B
Fly
Ash
Curing
Time
(d)
Initial Properties Final Properties kave (m/s)
ei wi (%) Si (%) ef wf (%) Sf (%)
Aver
age
Sy
nth
etic
Tai
ling
s
― ― ― 0.71 11.2 41.8 0.71 26.4 98.6 5.7x10⁻⁸
1 B 7 0.69 11.7 44.2 0.69 26.4 99.2 6.7x10⁻⁸
1 B 28 0.69 11.2 42.6 0.69 25.9 98.8 6.5x10⁻⁸
1 A 7 0.73 11.3 40.5 0.73 29.7 106.8 2.2x10⁻⁷
1 A 28 0.76 9.4 32.6 0.76 28.3 98.0 5.6x10⁻⁸
― ― ― 0.80 25.3 84.1 0.70 24.2 90.7 3.5x10⁻⁸
2.5 B 7 0.66 25.0 98.8 0.66 22.8 90.1 1.5x10⁻⁸
2.5 B 28 0.63 23.3 96.0 0.63 22.5 92.7 1.4x10⁻⁸
2.5 A 7 0.73 24.5 88.6 0.73 26.1 94.5 9.2x10⁻⁹
2.5 A 28 0.70 23.7 89.0 0.70 26.3 98.6 1.0x10⁻⁸
― ― ― 1.13 38.8 90.6 0.78 29.7 100.4 8.0x10⁻⁸
4 B 7 0.87 38.0 96.4 0.60 24.4 105.3 4.0x10⁻⁸
4 B 28 0.79 39.0 96.5 0.68 25.1 103.0 2.8x10⁻⁸
4 A 7 1.03 38.0 94.3 0.90 37.0 104.4 4.5x10⁻⁸
4 A 28 1.04 38.6 97.8 0.94 37.8 106.6 6.8x10⁻⁸
Fin
e S
ynth
etic
Tai
lings
― ― ― 0.87 11.4 34.4 0.87 33.1 99.7 5.5x10⁻⁹
1 B 7 0.88 12.6 37.1 0.88 34.2 99.9 5.2x10⁻⁸
1 B 28 0.86 11.6 34.8 0.86 32.9 98.7 4.9x10⁻⁸
1 A 7 0.85 9.6 29.9 0.85 34.8 107.5 5.8x10⁻⁸
1 A 28 0.78 10.3 34.5 0.83 35.4 112.0 1.4x10⁻⁸
― ― ― 0.72 24.4 81.4 0.72 25.8 93.3 2.3x10⁻¹⁰
2.5 B 7 0.74 25.0 87.0 0.74 26.8 93.0 1.9x10⁻⁹
2.5 B 28 0.75 24.9 86.4 0.75 26.5 91.9 1.8x10⁻⁹
2.5 A 7 0.72 24.8 86.5 0.72 28.3 102.7 9.8x10⁻¹⁰
2.5 A 28 0.73 24.8 85.9 0.73 29.4 105.6 2.0x10⁻⁹
― ― ― 1.13 41.1 95.8 1.00 38.7 99.6 7.3x10⁻¹⁰
4 B 7 1.13 39.4 90.1 0.97 36.8 98.7 2.8x10⁻⁹
4 B 28 1.09 39.1 92.3 1.02 36.4 97.8 2.4x10⁻⁹
4 A 7 1.17 41.7 93.5 1.09 42.3 102.1 3.7x10⁻⁹
4 A 28 1.17 41.9 93.7 1.17 43.0 97.3 1.3x10⁻⁹
Notes: subscript i identifies initial conditions after preparation of unamended specimen and after curing for amended
specimen; subscript f identifies final conditions after hydraulic conductivity testing; W/B = water-to-binder ratio; e =
void ratio; w = water content; S = degree of saturation; kave = arithmetic average of the last four hydraulic conductivity
measurements.
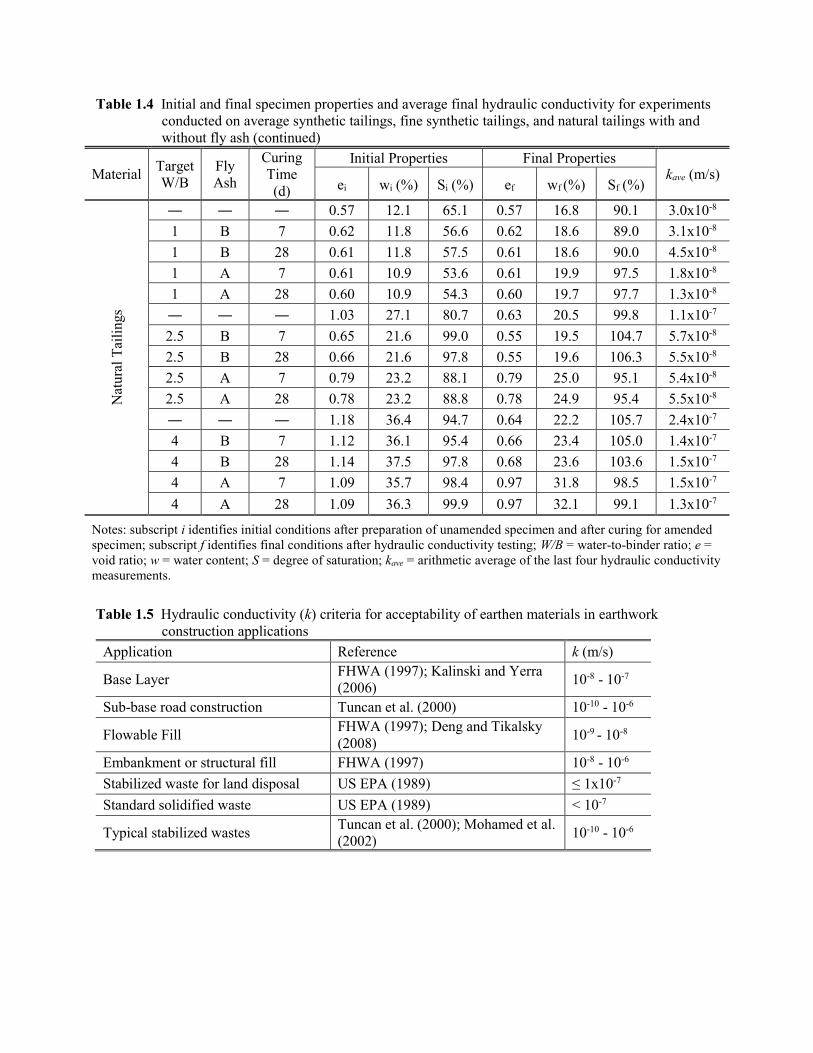
Table 1.4 Initial and final specimen properties and average final hydraulic conductivity for experiments
conducted on average synthetic tailings, fine synthetic tailings, and natural tailings with and
without fly ash (continued)
Material Target
W/B
Fly
Ash
Curing
Time
(d)
Initial Properties Final Properties kave (m/s)
ei wi (%) Si (%) ef wf (%) Sf (%)
Nat
ura
l T
aili
ngs
― ― ― 0.57 12.1 65.1 0.57 16.8 90.1 3.0x10⁻⁸
1 B 7 0.62 11.8 56.6 0.62 18.6 89.0 3.1x10⁻⁸
1 B 28 0.61 11.8 57.5 0.61 18.6 90.0 4.5x10⁻⁸
1 A 7 0.61 10.9 53.6 0.61 19.9 97.5 1.8x10⁻⁸
1 A 28 0.60 10.9 54.3 0.60 19.7 97.7 1.3x10⁻⁸
― ― ― 1.03 27.1 80.7 0.63 20.5 99.8 1.1x10⁻⁷
2.5 B 7 0.65 21.6 99.0 0.55 19.5 104.7 5.7x10⁻⁸
2.5 B 28 0.66 21.6 97.8 0.55 19.6 106.3 5.5x10⁻⁸
2.5 A 7 0.79 23.2 88.1 0.79 25.0 95.1 5.4x10⁻⁸
2.5 A 28 0.78 23.2 88.8 0.78 24.9 95.4 5.5x10⁻⁸
― ― ― 1.18 36.4 94.7 0.64 22.2 105.7 2.4x10⁻⁷
4 B 7 1.12 36.1 95.4 0.66 23.4 105.0 1.4x10⁻⁷
4 B 28 1.14 37.5 97.8 0.68 23.6 103.6 1.5x10⁻⁷
4 A 7 1.09 35.7 98.4 0.97 31.8 98.5 1.5x10⁻⁷
4 A 28 1.09 36.3 99.9 0.97 32.1 99.1 1.3x10⁻⁷
Notes: subscript i identifies initial conditions after preparation of unamended specimen and after curing for amended
specimen; subscript f identifies final conditions after hydraulic conductivity testing; W/B = water-to-binder ratio; e =
void ratio; w = water content; S = degree of saturation; kave = arithmetic average of the last four hydraulic conductivity
measurements.
Table 1.5 Hydraulic conductivity (k) criteria for acceptability of earthen materials in earthwork
construction applications
Application Reference k (m/s)
Base Layer FHWA (1997); Kalinski and Yerra
(2006) 10-8 - 10-7
Sub-base road construction Tuncan et al. (2000) 10-10 - 10-6
Flowable Fill FHWA (1997); Deng and Tikalsky
(2008) 10-9 - 10-8
Embankment or structural fill FHWA (1997) 10-8 - 10-6
Stabilized waste for land disposal US EPA (1989) ≤ 1x10⁻⁷
Standard solidified waste US EPA (1989) < 10-7
Typical stabilized wastes Tuncan et al. (2000); Mohamed et al.
(2002) 10-10 - 10-6
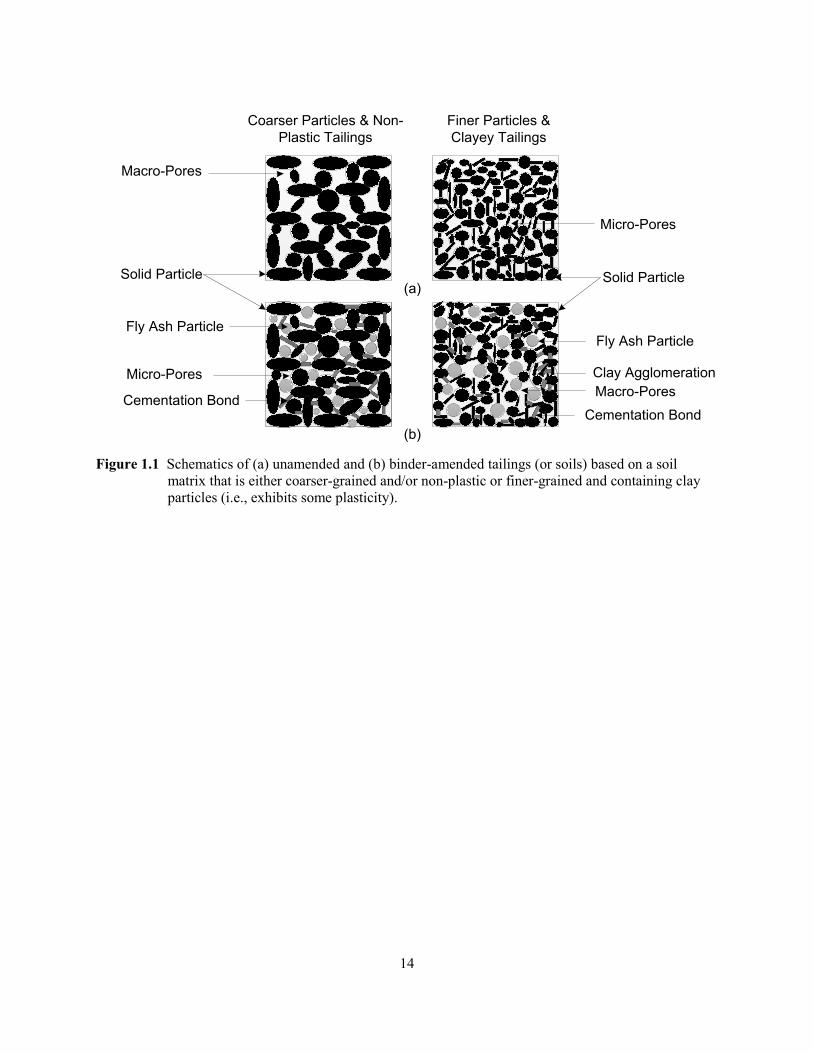
14
Coarser Particles & Non-
Plastic Tailings
Finer Particles &
Clayey Tailings
(a)
(b)
Solid Particle
Fly Ash Particle
Macro-Pores
Micro-Pores
Solid Particle
Cementation Bond
Fly Ash Particle
Clay Agglomeration
Cementation Bond
Macro-Pores
Micro-Pores
Figure 1.1 Schematics of (a) unamended and (b) binder-amended tailings (or soils) based on a soil
matrix that is either coarser-grained and/or non-plastic or finer-grained and containing clay
particles (i.e., exhibits some plasticity).
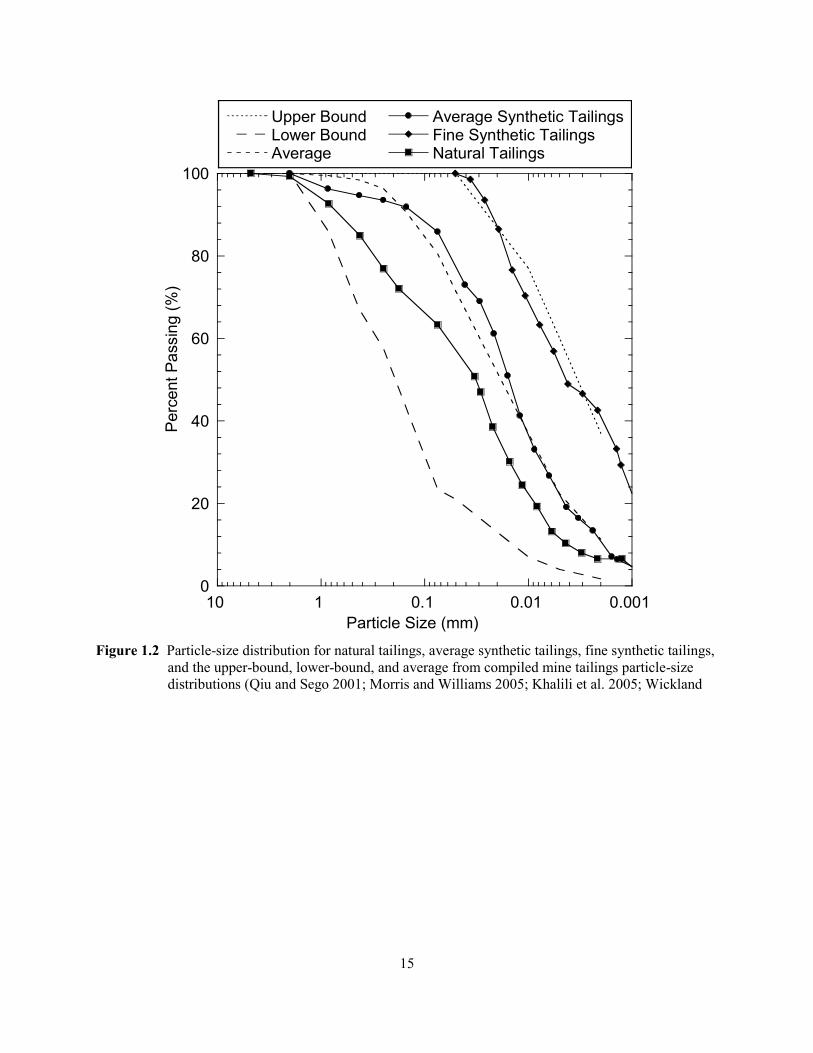
15
0
20
40
60
80
100
Upper BoundLower BoundAverage
Average Synthetic Tailings
Natural TailingsFine Synthetic Tailings
0.0010.010.1110
Perc
en
t P
assin
g (
%)
Particle Size (mm)
Figure 1.2 Particle-size distribution for natural tailings, average synthetic tailings, fine synthetic tailings,
and the upper-bound, lower-bound, and average from compiled mine tailings particle-size
distributions (Qiu and Sego 2001; Morris and Williams 2005; Khalili et al. 2005; Wickland
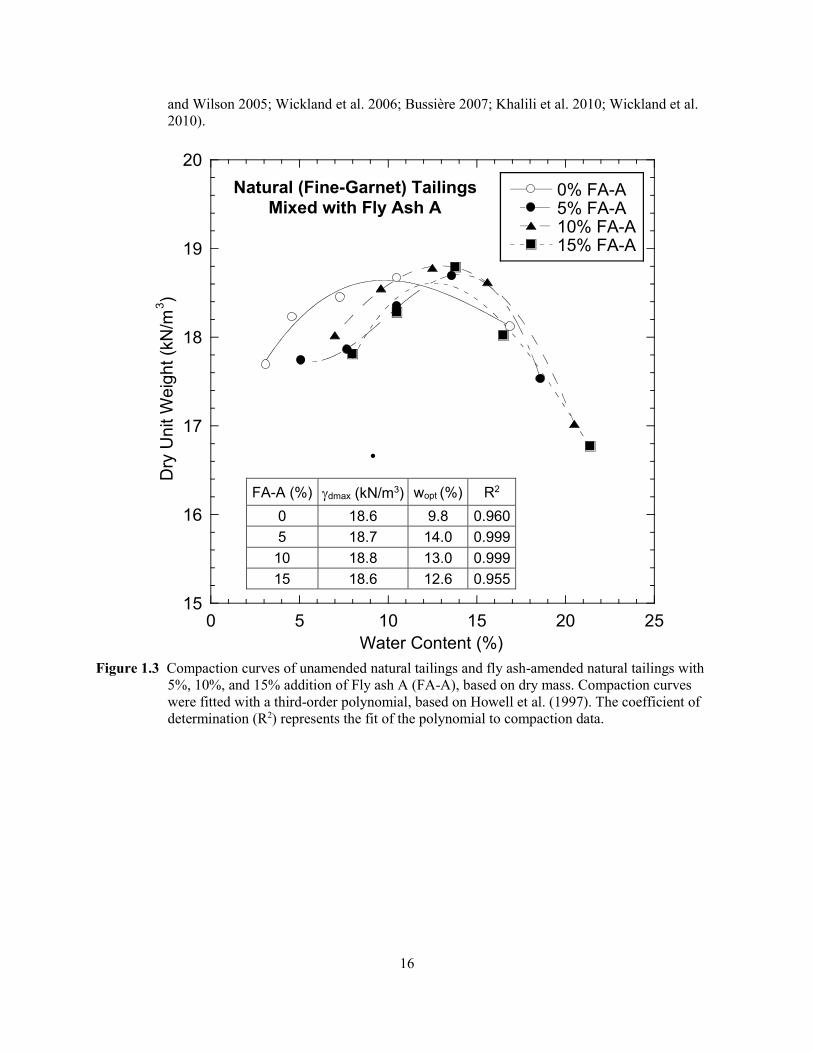
16
and Wilson 2005; Wickland et al. 2006; Bussière 2007; Khalili et al. 2010; Wickland et al.
2010).
15
16
17
18
19
20
0 5 10 15 20 25
0% FA-A5% FA-A10% FA-A15% FA-A
Dry
Un
it W
eig
ht (k
N/m
3)
Water Content (%)
Natural (Fine-Garnet) Tailings
Mixed with Fly Ash A
Figure 1.3 Compaction curves of unamended natural tailings and fly ash-amended natural tailings with
5%, 10%, and 15% addition of Fly ash A (FA-A), based on dry mass. Compaction curves
were fitted with a third-order polynomial, based on Howell et al. (1997). The coefficient of
determination (R2) represents the fit of the polynomial to compaction data.
FA-A (%) dmax (kN/m3) wopt (%) R2
0 18.6 9.8 0.960
5 18.7 14.0 0.999
10 18.8 13.0 0.999
15 18.6 12.6 0.955
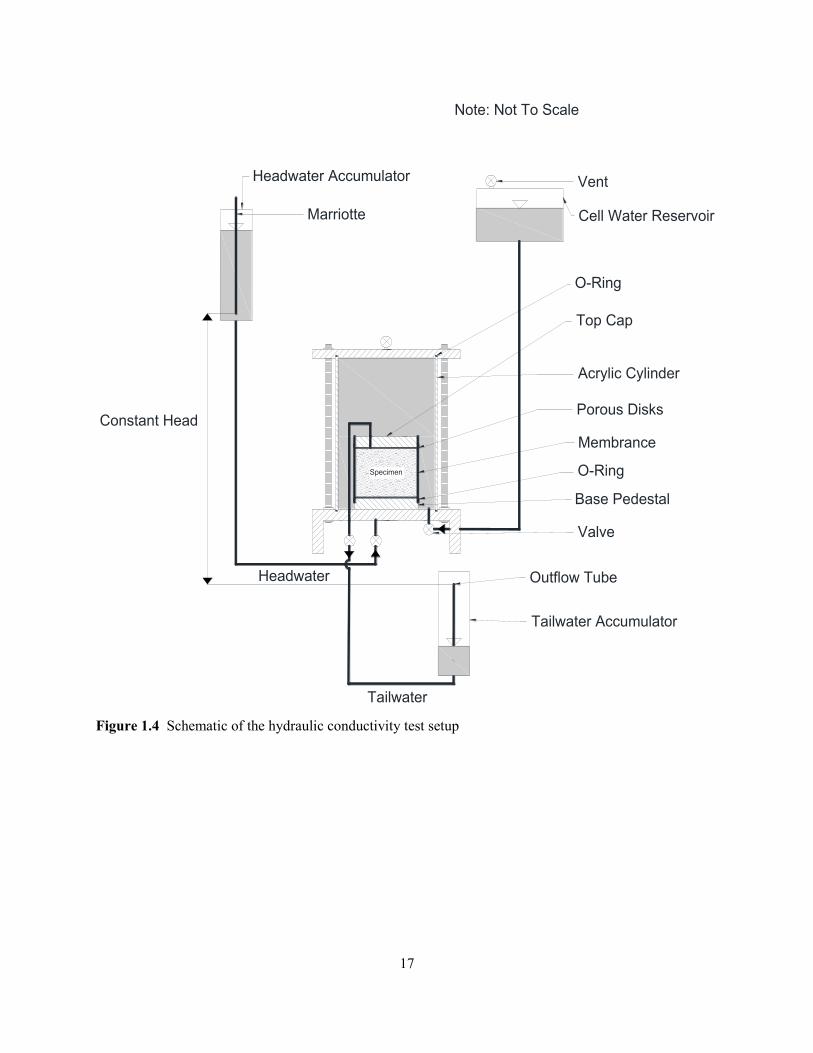
17
Figure 1.4 Schematic of the hydraulic conductivity test setup
Specimen
Cell Water Reservoir
Headwater Accumulator
Top Cap
Acrylic Cylinder
Membrance
O-Ring
Porous Disks
O-Ring
Base Pedestal
Headwater
Vent
Tailwater Accumulator
Marriotte
Valve
Tailwater
Outflow Tube
Note: Not To Scale
Constant Head

18
10-8
10-7
0.0
0.5
1.0
1.5
2.0
k
Vout
/ Vin
Hydra
ulic
Cond
uctivity, k (
m/s
)R
atio
of O
utflo
w-to
-Inflo
w, V
out / V
in
Average k
ASTM Termination Criteria Average Synthetic
Tailings
(a)
10-9
10-8
10-7
0.0
0.5
1.0
1.5
2.0
k
Vout
/Vin
Hyd
rau
lic C
on
du
ctivi
ty,k
(m
/s)
Ra
tio o
f Ou
tflow
-to-In
flow
, Vo
ut / V
in
Average k
ASTM Termination Criteria
Fine Synthetic
Tailings
(b)
10-8
10-7
0.0
0.5
1.0
1.5
2.0
0 5 10 15 20
k
Vout
/ Vin
Hyd
raulic
Co
ndu
ctivity,
k (
m/s
)R
atio
of O
utflo
w-to
-Inflo
w, V
out / V
in
Elapsed Time (d)
Average k
ASTM Termination Criteria
Natural Tailings (c)
Figure 1.5 Temporal relationships of hydraulic conductivity and ratio of outflow-to-inflow for
unamended (a) average synthetic tailings, (b) fine synthetic tailings, and (c) natural tailings
prepared at an initial target water content of 11%.
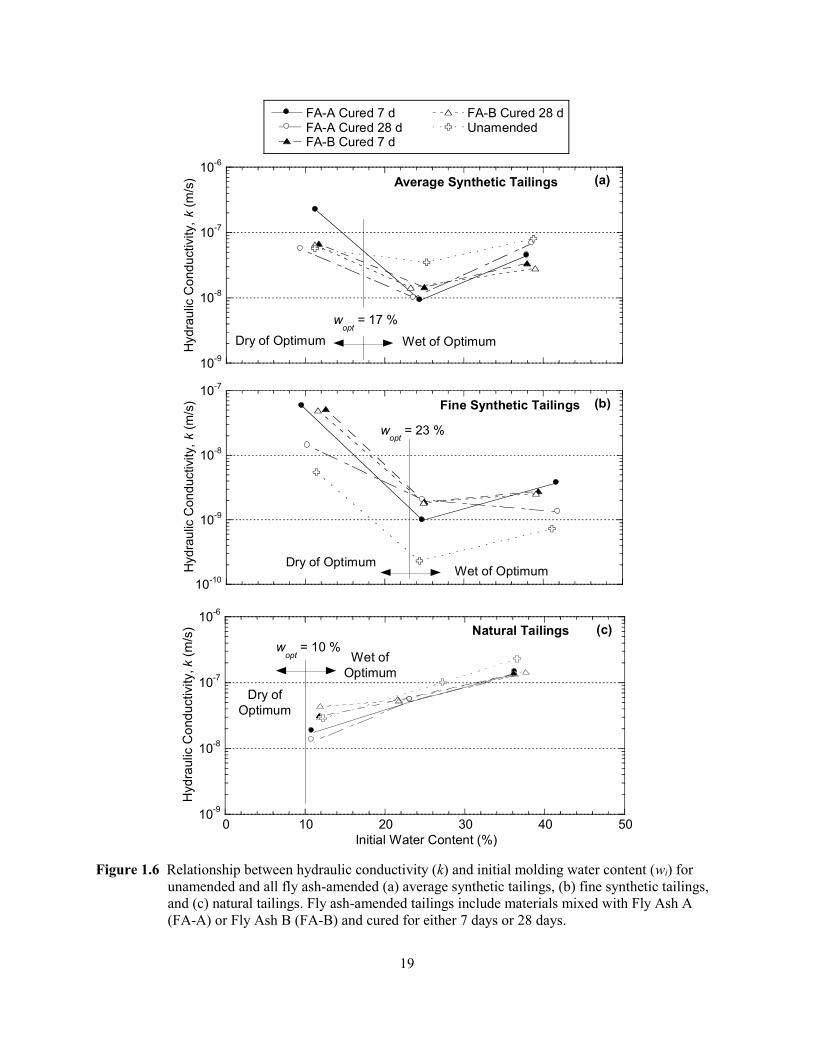
19
10-9
10-8
10-7
10-6
FA-A Cured 7 dFA-A Cured 28 dFA-B Cured 7 d
FA-B Cured 28 dUnamended
Hyd
rau
lic C
on
du
ctivity,
k (
m/s
)
wopt
= 17 %
Wet of OptimumDry of Optimum
Average Synthetic Tailings (a)
10-10
10-9
10-8
10-7
Hyd
rau
lic C
on
du
ctivity,
k (
m/s
)
wopt
= 23 %
Wet of OptimumDry of Optimum
Fine Synthetic Tailings (b)
10-9
10-8
10-7
10-6
0 10 20 30 40 50
Hyd
raulic
Co
nd
uctivity, k (
m/s
)
Initial Water Content (%)
wopt
= 10 %
Natural Tailings (c)
Wet of
Optimum
Dry of
Optimum
Figure 1.6 Relationship between hydraulic conductivity (k) and initial molding water content (wi) for
unamended and all fly ash-amended (a) average synthetic tailings, (b) fine synthetic tailings,
and (c) natural tailings. Fly ash-amended tailings include materials mixed with Fly Ash A
(FA-A) or Fly Ash B (FA-B) and cured for either 7 days or 28 days.

20
0.1
1
10
0 1 2 3 4 5
Average Synthetic Fine Synthetic Natural
Fly
Ash-A
mended H
ydra
ulic
Conductivity /
Una
mended
Hydra
ulic
Conductivity (
kB /
Ko)
Water to Binder Ratio (W/B)
Open symbols = silty tailings
Solid symbols = clayey tailings
?
(a)
0.1
1
10
0 2 4 6 8 10 12 14 16
Average SyntheticFine SyntheticNaturalGodbout et al. (2007)Fall et al. (2009)Deb and Pal (2014)Tay and Goh (1991)
Fly
Ash-A
men
de
d H
ydra
ulic
Co
nd
uctivity /
Unam
ended H
ydra
ulic
Conductivity (
kB /
Ko)
Water to Binder Ratio (W/B)
Open symbols = silty materials
Solid symbols = clayey materials
(b)
Figure 1.7 Relationships between (a) normalized hydraulic conductivity (kB/k0) and water to binder ratio
(W/B) for all fly ash-amended tailings specimens evaluated in this study, and (b) kB/k0 versus
W/B for tests conducted as part of this study and data compiled from literature. Dashed lines
capture general trends in kB/k0 versus W/B relationships and the question mark (?) designates
outliers in the data.
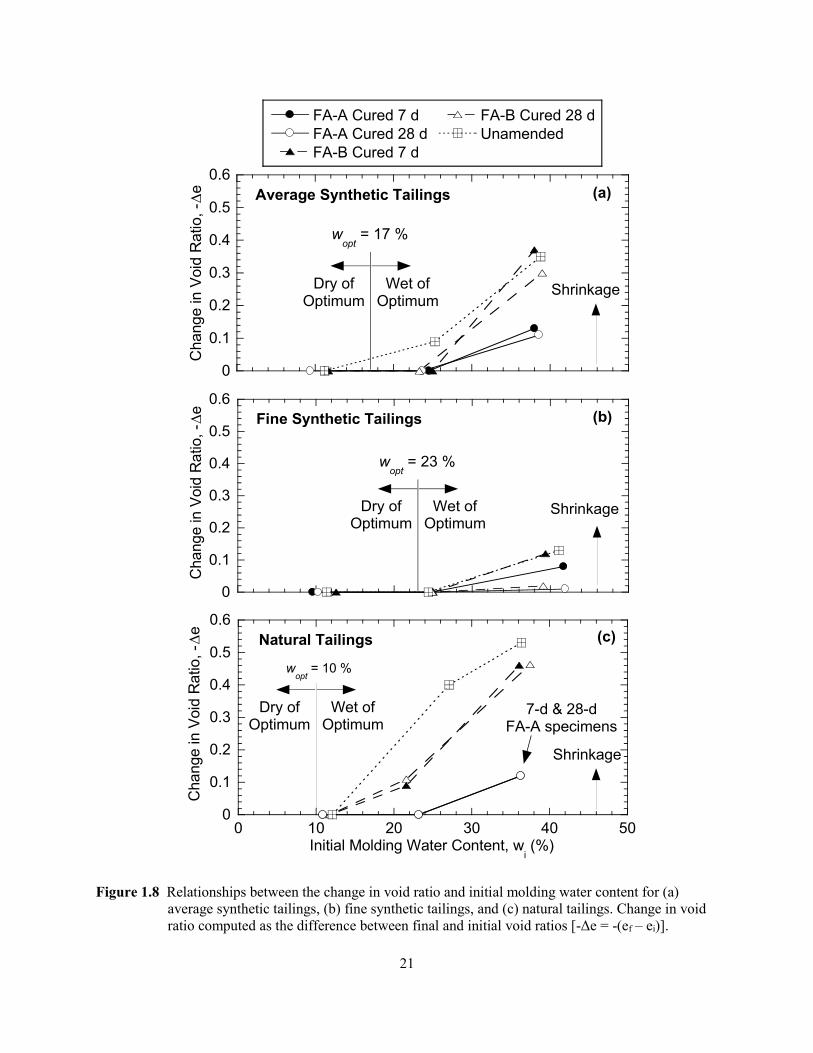
21
0
0.1
0.2
0.3
0.4
0.5
0.6
FA-A Cured 7 d
FA-A Cured 28 d
FA-B Cured 7 d
FA-B Cured 28 d
Unamended
Cha
ng
e in
Void
Ra
tio
, -
e
wopt
= 17 %
Wet ofOptimum
Dry ofOptimum
Average Synthetic Tailings (a)
Shrinkage
0
0.1
0.2
0.3
0.4
0.5
0.6
wopt
= 23 %
Cha
ng
e in
Void
Ra
tio, -
e
Fine Synthetic Tailings (b)
Wet ofOptimum
Dry ofOptimum
Shrinkage
0
0.1
0.2
0.3
0.4
0.5
0.6
0 10 20 30 40 50
Change in V
oid
Ratio, -
e
Initial Molding Water Content, wi (%)
wopt
= 10 %
Natural Tailings (c)
Wet ofOptimum
Dry ofOptimum
7-d & 28-dFA-A specimens
Shrinkage
Figure 1.8 Relationships between the change in void ratio and initial molding water content for (a)
average synthetic tailings, (b) fine synthetic tailings, and (c) natural tailings. Change in void
ratio computed as the difference between final and initial void ratios [-Δe = -(ef – ei)].

22
10-10
10-9
10-8
10-7
10-6
10-10
10-9
10-8
10-7 10
-6
AST+ FA-AAST+ FA-BFST+ FA-AFST+ FA-BNT+ FA-ANT+ FA-B
Hydra
ulic C
on
ductivity for
28 d
Curing (
m/s
)
Hydraulic Conductivity for 7 d Curing (m/s)
(a)
10:1
1:1
1:10
10-10
10-9
10-8
10-7
10-6
10-10
10-9
10-8
10-7 10
-6
AST + 7 dAST + 28 dFST + 7 dFST + 28 dNT + 7 dNT + 28 d
Hydra
ulic
Conductivity w
ith F
A-B
(m
/s)
Hydraulic Conductivity with FA-A (m/s)
(b)
10:1
1:1
1:10
Figure 1.9 One-to-one plots of hydraulic conductivity of amended tailings (a) cured for 28 days versus
those cured for 7 days, and (b) that were cured with Fly ash B (FA-B) versus those cured with
Fly ash A (FA-A).
23
2. UNCONFINED COMPRESSIVE STRENGTH OF SYNTHETIC AND NATURAL MINE TAILINGS AMENDED WITH FLY ASH AND CEMENT2
2.1 Introduction
Improving roadways and initiating new transportation-related projects includes a broad array of
earthworks, such as road subbase and subgrade, unpaved roadways, embankments, and fills. Each of
these earthworks requires earthen materials (e.g., soil, crushed rock, etc.) that are incorporated into the
design to obtain the desired engineering performance. The Federal Highway Administration (FHWA) has
identified that the use of recycled materials, such as coal combustion by-products (CCBs), mine waste
(mine waste rock and tailings), blast furnace slag, municipal solid waste combustion ash, reclaimed
concrete pavement, and scrap tires, has potential to aid transportation-related construction needs
(Schroeder 1994; Chesner et al. 1998). Reusing industrial wastes and byproducts can decrease energy
consumption, raw material use, and greenhouse gas emissions (Hudson-Edwards et al. 2011).
Mining operations produce considerable volumes of waste materials during ore extraction processes. The
two predominant waste materials that require short- and long-term management are tailings and waste
rock (e.g., Bussière 2007; Blight 2010). Tailings typically are fine grained and have high water contents
(low solids contents), whereas waste rock generally is gravel- to cobble-sized material with some sand
and fines. Management of mine tailings in impoundment facilities can be challenging due to variability in
physical and chemical properties of the tailings (Bussière 2007). There is increasing interest in reusing
mine waste amended with cementitious materials (e.g., fly ash or cement) in earth construction projects
due to challenges accompanying mine waste disposal (Misra and Mehta 1996; Godbout et al. 2007).
Amending mine tailings with a cementitious binder has been used as cemented paste backfill (CPB) in
underground mining to fill cavities (ranging from 15 to 40 m in lateral extent and up to 100-m tall) and
enhance local and global stability. The mechanical, hydraulic, and environmental behavior of CPB has
been investigated by numerous researchers (Zou and Li 1999; Belem et al. 2000; Fall et al. 2005; Kesimal
et al. 2005; Klein and Simon 2006; Ouellet et al. 2006; Ouellet et al. 2007; Benzaazoua et al. 2008;
Ercikidi et al. 2009; Yeheyis et al. 2009; Nasir and Fall 2010; Zhang et al. 2011; Ercikidi et al. 2013). In
general, addition of a cementitious binder to mine tailings has been shown to increase strength, reduce
hydraulic conductivity, increase pH of effluent, and stabilize heavy metals.
The use of mine tailings amended with binders in the construction of roadways has been investigated by
Swami et al. (2007), Mahmood and Mulligan (2010), and Qian et al. (2011). Mahmood and Mulligan
(2010) investigated the unconfined compressive strength (UCS) of six mine tailings mixed with Type Ι
Portland cement. Specimens were prepared at different water contents and a constant cement content to
evaluate the effect of water-to-binder (W/B) ratio. Unconfined compressive strength of the cement-
modified tailings ranged from 0.5 to 9.6 MPa for W/B ranging between 0.3 and 1.1. The authors did not
report a unique correlation between UCS and W/B, which suggests that compositional differences
between the six mine tailing may have contributed to variability in the UCS measurements.
Qian et al. (2011) evaluated the mechanical performance of cement-stabilized granite tailings and cement-
stabilized crushed stone as road subbase material. The UCS of tailings increased with an increase in
cement addition and was 5.8 MPa for 6% cement amendment (by dry mass). Split tensile strength (i.e.,
2 Gorakhki, M.H. and Bareither, C.A. (2017). Unconfined compressive strength of mine tailings amended with fly ash, Journal of
Geotechnical and Geoenvironmental Engineering, 143(7), 1-14, 10.1061/(ASCE)GT.1943-5606.0001678.
24
cylindrical specimens loaded along the diameter to measure tensile strength), UCS, and static and
dynamic moduli were comparable for cement-stabilized crushed stone and cement-stabilized tailings,
which implied that cement-stabilized tailings had suitable strength for road subbase application. Qian et
al. (2011) also reported that the physical performance (e.g., UCS, compaction, smoothness, number of
cracks, etc.) of a 20.4-km-long highway subbase in China that was constructed with 4%-cement amended
tailings was comparable to subbases constructed with traditional materials, and also met roadway
specifications immediately following and 2-yr after construction.
Swami et al. (2007) investigated the potential use of cement-amended kimberlite tailings as road
construction materials in India. Mixtures of cement-amended tailings met the UCS and California
Bearing Ratio requirements for base and subbase material according to construction standards. A 1-km
field test section of base course constructed with the cement-amended kimberlite tailings met standard
requirements for durability 0.5 yr and 1 yr after construction.
These past studies demonstrated that cement-amended tailings can be suitable for road construction.
However, the effect of tailings characteristics and water content on the UCS of tailings amended with
different binders (e.g., fly ash) has received little attention. In particular, fly ash is an attractive binder as
fly ash is a common CCB used in geotechnical applications in the U.S. due to pozzolanic properties and
high availability from coal combustion (ACAA 2015; Park et al. 2014). The use of cementitious binders
as a soil-amendment has been evaluated by numerous researchers (e.g., Trzebniatowski et al. 2004; Arora
and Aydilek 2005; Edil et al. 2006; Consoli et al. 2007; Consoli et al. 2009; Tastan et al. 2011; Vizcarra
et al. 2011; Bose 2012; Senol et al. 2012; Rosa et al. 2016), and this collection of work was used as a
baseline to assess the applicability of creating and using binder-amended mine tailings in earthworks.
The objectives of this study were to (i) assess the effect of mine tailings properties (e.g., particle size and
water content) and fly ash addition on the UCS of fly ash-amended mine tailings and (ii) assess
applicability of the mixtures for use as earth construction materials. The first objective was completed
using three synthetic mine tailings prepared from laboratory-controlled materials to more effectively
isolate material differences between tailings. The second objective was evaluated via comparison to UCS
requirements for different earth construction materials. Additionally, an empirical equation was
developed from a multivariate regression analysis to predict UCS of fly ash-amended tailings. This
equation was validated via UCS tests conducted on natural tailings as well as relevant data compiled from
literature.
2.2 Materials and Methods
2.2.1 Materials
2.2.1.1 Mine Tailings
Two types of mine tailings were used in this study: (i) synthetic tailings and (ii) natural tailings. Synthetic
tailings were created from laboratory-controlled materials [i.e., angular sand from road base material,
silica flour (US silica, USA), and kaolin clay (Thiele Kaolin Company, USA)] to capture a range in
geotechnical characteristics of mine tailings. Natural tailings were collected from a copper mine in
Arizona, USA and a garnet mine in New York, USA. Two fractions of garnet tailings were collected as a
hydrocyclone is used at the garnet mine to segregate tailings for subsequent reuse in mine site earthworks
(e.g., tailings dams). Geotechnical characterization of all tailings included mechanical sieve and
hydrometer (ASTM D422, ASTM 2007), Atterberg limits (ASTM D4318, ASTM 2014a), specific gravity
(ASTM D854, ASTM 2014b), and standard-effort compaction (ASTM D698, ASTM 2014c).

25
The average, upper-bound, and lower-bound particle-size distributions (PSD) of eight different hard rock
mine tailings are shown in Figures 2.1a and 2.1b along with the synthetic (Figure 2.1a) and natural
(Figure 2.1b) tailings used in this study. Synthetic tailings were created to approximate the average,
upper-bound, and lower-bound PSDs in Figure 2.1a, and close replication was achieved in all three cases.
The PSDs shown in Figure 2.1b indicate that the natural tailings ranged between average and coarse
synthetic tailings (Figure 2.1b).
A summary of geotechnical characteristics for the synthetic and natural tailings is in Table 2.1. Hard rock
mine tailings typically classify as low plasticity silts (liquid limit, LL < 50 %) (Aubertin et al. 1996;
Wickland and Wilson 2005; Bussière 2007; Daliri et al. 2014). The LL of all synthetic and natural
tailings in this study was ≤ 37, which compares well to literature. The Unified Soil Classification of the
synthetic and natural tailings all differ from one another (Table 2.1), which indicates that a range of
material characteristics representative of hard rock mine tailings was captured in this study. Compaction
tests were completed primarily to identify the optimum water content (wopt), which was used as a
reference point to assess the effect of molding water content on water availability during formation of
cementitious bonds.
2.2.1.2 Cementitious Binders
Two types of fly ash and one type of cement were used as binders. Fly Ash A (FA-A) was obtained from
Stanton Station, which is a 190-MW power plant in North Dakota, USA. Fly Ash B (FA-B) was obtained
from Platte River Power Authority power plant, which is a 280-MW power plant in Colorado, USA.
Type I-II Portland cement was used as this material was readily available to the researchers; this cement
had basic properties of Type I and Type II cements.
The chemical composition of fly ash and cement was measured with x-ray fluorescence (XRF) and results
are listed in Table 2.2. The XRF analysis of FA-A was performed with a Philips 1600/10 Simultaneous
Wavelength Dispersive Unit by Mineralogy-INC (Tulsa, Oklahoma, USA), whereas XRF information for
FA-B and cement were obtained from the power plant and cement producer, respectively. Fly ash was
classified based on ASTM C618 (ASTM 2015a) and Tastan et al. (2011), and both FA-A and FA-B
classified as off-specification (i.e., off-spec). The off-spec designation only indicates that the fly ashes do
not formally classify as Class C or F, and does not infer cementitious behavior. Lime (CaO), which is the
main component required for cementitious bond formation, accounted for 17% of FA-A and 18.9% of
FA-B.
The relative composition of CaO + MgO, SiO2, and Al2O3 + Fe2O3 for the two fly ashes and cement used
in this study are shown in the ternary plot in Figure 2.2. Janz and Johansson (2002) introduced the CaO-
to-SiO2 ratio as an indicator for potential pozzolanic reaction and Odadjima et al. (1995) introduced CaO-
to-[Al2O3+SiO2] ratio as an indicator for potential to form cementitious bonds. In FA-A, CaO-to-SiO2
ratio (0.86) and CaO-to-[Al2O3+SiO2] (0.53) were higher than CaO-to-SiO2 ratio (0.41) and CaO-to-
[Al2O3+SiO2] (0.30) in FA-B. Fly Ash A had a more favorable relative composition of the key chemical
compounds required for cementitious bond formation compared to FA-B, which suggested that the
cementitious behavior of FA-A should be more effective compared to FA-B. Thus, regardless of the
larger percent by dry mass composition of all chemical components required for cementitious behavior in
FA-B compared to FA-A, the relative makeup of the cementitious constituents in FA-A was higher. The
cement used in this study plots within the anticipated range of cements and has higher cementitious
properties in comparison with FA-A and FA-B (Figure 2.2).
26
2.2.2 Slump Tests
Mine tailings generated at ore processing plants typically contain low solids content (SC) and high water
content (w) due to ore extraction processes (Bussière 2007). Dewatering of mine tailings often is
conducted to reclaim water for subsequent ore processing, and Bussière (2007) reported the following
levels of dewatered tailings: (i) thickened tailings = SC from 50 – 70% and w from 43 to 100%, (ii) paste
tailings = SC from 70 – 85% and w from 18 to 43%, and (iii) filtered tailings = SC > 85% and w < 8%.
Natural tailings typically are dewatered for use in earthwork applications. Thus, both synthetic and natural
tailings were prepared to SCs of 70%, 80%, and 90% in this study to represent a range of dewatering from
thickened to filtered tailings. These SCs also yielded a range of W/B ratios for a given percent binder
amendment.
Slump cone tests were conducted on fine, average, and coarse synthetic tailings prepared to three target
SCs (70%, 80%, and 90%) following ASTM C143 (ASTM 2015b). Each slump cone specimen was
prepared in three layers of equal volume and each layer was tamped 25 times. Relationships between
slump and solids content for the three synthetic tailings are shown in Figure 2.3. All three synthetic
tailings tested at SC = 90% yielded a slump of zero, which corresponds to a specimen that remained
completely intact with no vertical deformation (Figure 2.3). In contrast, coarse and average synthetic
tailings were slurries at SC = 70% and deformed completely to yield a slump of 300 mm. An increase in
slump corresponds to a more slurried material that has lower strength to remain erect once the external
slump cone used to form the specimen is removed. Slump values were higher (i.e., more vertical
deformation under self-weight) for specimens with larger particle-size prepared at the same SC. This
trend in slump for synthetic tailings was attributed to an increase in soil suction with a decrease in particle
size for materials prepared to the same water content (e.g., Lu and Likos 2004; Fredlund et al. 2012). A
higher soil suction corresponds to a higher effective stress that enables a specimen to remain intact and
yield a lower slump.
2.2.3 Unconfined Compression Strength Tests
Unconfined compression strength tests were conducted on tailings alone and on binder-amended tailings
in accordance with ASTM D5102 (ASTM 2009). All UCS specimens were prepared in 102-mm-diameter
by 203-mm-tall PVC split molds. Mixtures were compacted or poured into the PVC molds depending on
material consistency; i.e., lower SC (higher w) specimens were slurry-like and were poured into the
molds, whereas higher SC (lower w) specimens were soil-like and were compacted with standard effort.
PVC molds containing slurried materials were vibrated to promote air removal and increase specimen
density. Following specimen preparation within the PVC molds, the entire specimen including the mold
was wrapped in plastic to prevent evaporation and allowed to cure for 7 days at a temperature of 25 °C
and relative humidity of approximately 100% as recommended by Senol et al. (2006).
Unconfined compressive strength tests were conducted at an axial strain rate of 1 %/min (ASTM D5102,
ASTM 2009) using a Geotest S5760 load frame with axial load capacity of 20 kN. A 25-kN S-type load
cell (25 ± 0.005 kN; ELE Int., Bedfordshire, UK) with external signal conditioner (CCT 100; Omega
Engr. Inc., Stamford, CT, USA) was used to measure axial force and a linear position transducer (76.2 ±
0.02 mm; GeoTac, Houston, TX, USA) was used to measure axial displacement. Force and displacement
transducers were monitored via a National Instruments data acquisition board (UCS-6009) controlled with
LabVIEW software.
In-situ fly ash- and cement-amended soils typically are compacted 1-2 hours after preparing the mixture
and moistening the material (Edil et al. 2006). A delay between hydrating a binder-amended mixture and
compaction can decrease strength of the mixture due to breakage of cementitious bonds during
27
compaction. ACAA (2003) specifies a maximum delay of two hours between moistening the soil-fly ash
mixture and compaction. Based on these recommendations, compaction of the UCS specimens prepared
in this study was performed two hours after adding binder to a specimen and hydrating to simulate field
conditions.
2.3 Results
2.3.1 Unconfined Compressive Strength
A summary of all UCS tests conducted on synthetic tailings, with and without binder amendment, is in
Table 2.3. All percent binder amendments listed in Table 2.3, and those referenced throughout this paper,
are based on dry mass. Examples of stress-strain relationships for unamended and amended coarse
synthetic tailings prepared at a SC = 90% are shown in Figure 2.4. The UCS was selected as the
maximum axial stress applied to a given specimen. The fly ash-amended specimens (10% FA-A and 10%
FA-B) exhibited an initial stiffer response to loading and attainment of a larger UCS relative to the
unamended specimen. Additionally, the specimen modified with FA-A exhibited a much more
pronounced strength gain relative to FA-B, which is an artifact of more effective cementitious bonds
formed via FA-A relative to FA-B (described subsequently). Both the amended and unamended data sets
in Figure 2.4 exhibit strain-softening behavior following attainment of a maximum axial stress. Stress-
strain behavior shown in Figure 2.4 is representative of the UCS experiments conducted as part of this
study.
2.3.1.1 Unconfined Compressive Strength of Pure Synthetic Tailings
The relationship between UCS of pure synthetic tailings specimens (i.e., no binder amendment) as a
function of SC and water content is shown in Figure 2.5. Data in Figure 2.5 support a trend of increasing
UCS with increasing SC or decreasing water content. A decrease in water content (increase in SC) can
increase soil suction and correspondingly increase effective stress as long as water menisci remain
connected between adjacent particles (e.g., Lu and Likos 2004; Fredlund et al. 2012). The largest UCS of
the unamended synthetic tailings was measured for SC = 90% for all three synthetic tailings (Figure 2.5).
Although moisture retention properties of the synthetic tailings were not measured, UCS data suggest that
the progressive increase in SC from 70% to 90% corresponded to an increase in soil suction and effective
stress that increased UCS (Figure 2.5). Similarly, the increase in SC from 80% to 90% for the average and
coarse synthetic tailings resulted in the development of effective stress such that the UCS was measurable
(Figure 2.5).
Fine synthetic tailings prepared at SC = 70% and average and coarse synthetic tailings prepared at SC =
70% and 80% yielded no measurable UCS (Figure 2.5). The non-self-supporting behavior of these
specimens agrees with slump tests conducted on the synthetic tailings (Figure 2.3) whereby slumps > 10
mm coincided with specimens that yielded a UCS of essentially zero.
2.3.1.2 Unconfined Compressive Strength of Fly Ash-Amended Synthetic Tailings
The UCS of fly ash-amended synthetic tailings is shown in Figure 2.6 as a function of SC and type of
synthetic tailings. The UCS of unamended tailings is included in Figure 2.6 for comparison. The UCS of
fly ash-amended synthetic tailings can be explained via three mechanisms: (i) the availability of water to
react with fly ash and generate cementitious bonds; (ii) replacement of angular tailings particles with
rounded fly ash particles; and (iii) chemical composition of the binder and overall potential to generate
cementitious bonds. The first mechanism is primarily related to the impact of tailings particle size on the
availability of free water to react with fly ash and form cementitious bonds that can lead to enhanced
28
UCS. This mechanism is discussed via relationships to optimum water content (wopt) of the pure synthetic
tailings and W/B ratios. The second mechanism of material replacement relates to the addition of rounded
fly ash particles that can reduce interlocking between angular tailings particles. This mechanism was
observed to decrease UCS. The third mechanism is related to the difference in chemical composition of
the binders, whereby the enhancement of UCS relative to a no-binder condition corresponded to
cementitious potential of a binder, which is related to chemical composition.
2.3.1.2.1 Water Availability
Specimens were prepared to target SCs. Fly ash was added to more appropriately simulate anticipated
field operations. As a result, water initially adsorbed to tailings particles may result in limited water
available to participate in cementitious reactions (Bin-Shafique et al. 2004). Powers and Brownyard
(1948) and Jensen and Hansen (2001) report that water present in soil-cement mixtures can be classified
into three groups: (i) capillary water, which is free water within the pore space; (ii) gel water, which is
physically-bonded water; and (iii) chemically-bonded water, which is water incorporated in cementitious
bonds. Physically and chemically bonded water are a function of chemical composition of the binder.
Free water is mobile water retained in the void space of the specimen. The ideal water content of a binder-
amended specimen is the sum of chemically- and physically-bonded water, where no free water exists.
However, the optimum W/B is not only a function of chemical composition of the binder, but also a
function of water available to react with the binder.
Bin-Shafique et al. (2004) investigated the effect of molding water content on UCS of fly ash-amended
soils and reported that the highest UCS were obtained for specimens compacted at wopt with no delay in
hydration and 1% wet of wopt for specimens compacted 2-h after hydration. Synthetic tailings specimens
prepared at SC = 90% coincided with water contents that were 12% dry of wopt for fine synthetic tailings,
6.5% dry of wopt for average synthetic tailings, and 2.5% wet of wopt for coarse synthetic tailings. These
comparisons are based on an assumption that the wopt of fly ash-amended low-plasticity material does not
differ considerably from wopt of unamended low plasticity soil (Senol et al. 2006; Deb and Pal 2014).
Accounting for this assumption, available water to react with fly ash in the 90% SC specimens was low in
fine synthetic tailings, whereas more water was available in the average and coarse synthetic tailings. The
formation of cementitious bonds and increase in UCS was evident in coarse and average synthetic tailings
at SC = 90% that were amended with FA-A (Figure 2.6a). However, the addition of FA-B did not yield a
consistent trend of enhanced UCS, which was attributed to chemical characteristics of the fly ash
(described subsequently).
The increase in water content for average and coarse synthetic tailings prepared at a SC = 80% and 70%
relative to SC = 90% resulted in no measureable UCS for unamended specimens (Figure 2.5, and Figures
2.6b and 2.6c). However, the addition of FA-A to average and coarse synthetic tailings generated
cementitious bonds and resulted in measureable UCS for these two low SCs. The UCS of average and
coarse synthetic tailings amended with FA-B was measureable for a SC = 80%, which indicates that FA-B
had some cementitious potential to enhance UCS relative to an unamended condition (Figure 2.6b). The
increase in water content to a SC = 70% resulted in complete strength loss in both the average and coarse
synthetic tailings amended with FA-B. However, formation of cementitious bonds in the fine synthetic
tailings at SC = 70% is supported by the measurable UCS of all fly ash-amended specimens relative to
zero UCS for unamended fine synthetic tailings (Figure 2.6c).
The relationship between UCS of fly ash-amended synthetic tailings as a function of W/B is shown in
Figure 2.7a. Data plotted in Figure 2.7a include all UCS experiments conducted on fly ash-amended
synthetic tailings (Table 2.3) and support a trend of decreasing UCS with increasing W/B. Data in Figure
2.7a are segregated into two groups: (i) synthetic tailings specimens amended either completely or
partially with FA-A and (ii) synthetic tailings specimens amended completely with FA-B. Logarithmic
29
regression lines included for each group in Figure 2.7a are statistically significant and indicate similar
trends of decreasing UCS with increasing W/B. The enhanced UCS for specimens amended with FA-A
relative to FA-B was consistent among materials evaluated in this study and was attributed to the
difference in chemical composition of the two fly ashes (discussed subsequently).
A decrease in W/B for tests conducted in this study corresponded to either an increase in SC and
corresponding decrease in w, or an increase in percentage of fly ash (Table 2.3). The decrease in w was
shown to increase UCS of unamended synthetic tailings (Figure 2.5) and similarly increase the UCS on
fly ash-amended specimens (e.g., increase in UCS for a given synthetic tailings and percent fly ash
amendment in Figure 2.6). The increase in fly ash from 10% to 20% for a given synthetic tailings and SC
generally corresponded to an increase in UCS (Figure 2.6). However, this trend likely would have been
strengthened with experiments that included 20% FA-A, which was not possible due to limitations on the
mass of available material. Regardless, data collected in this study support the general trend of increasing
UCS with increasing percent fly ash amendment that has been demonstrated by others (e.g., Bin-Shafique
et al. 2004; Edil et al. 2006; Senol et al. 2006; Tastan et al. 2011).
The relationship between UCS of fly ash-amended synthetic tailings and the ratio of porosity to
volumetric binder content (n/Bv) is shown in Figure 2.7b. The n/Bv parameter is representative of the ratio
of void volume to binder volume in a given specimen and has been evaluated as a predictor of binder-
amended UCS (e.g., Consoli et al. 2007; Consoli et al. 2009). Trendlines included for both FA-A and FA-
B data sets in Figure 2.7b are statistically significant and indicate that UCS decreases with increasing
n/Bv. An increase in n/Bv corresponds to either an increase in porosity for a constant binder volume or a
decrease in binder volume for a given soil porosity. In both cases, the fraction of void volume filled with
cementitious binder decreases as n/Bv increases, which supports the decreasing trend with UCS. The
trendlines included in Figures 2.7a and 2.7b show similar trends of UCS as a function of W/B and n/Bv.
The increase in statistical significance for the UCS- n/Bv relationship was attributed to a broader range in
the magnitude of n/Bv (~ 0-12) versus W/B (~ 0-5), and both relationships are effective in explaining
variability in UCS of binder-amended mine tailings as a function of material properties.
2.3.1.2.2 Material Replacement
The UCS of all fine synthetic tailings specimens prepared at SC = 90% and amended with FA-A and FA-
B were approximately the same (Figure 2.6a). This similarity in UCS was attributed to the low amount of
available water, considering the as-prepared water content coincided with 12% dry of wopt, which limited
water available to generate cementitious bonds. The modest reduction in UCS for the fly ash-amended
specimens was attributed to reduced particle interlocking as rounded fly ash particles replaced a fraction
of the angular tailings particles. Similar, but more pronounced effects of this mechanism of strength
reduction via material replacement were observed for fine synthetic tailings prepared at SC = 80% (Figure
2.6b). The UCS of all fly ash-amended fine synthetic tailings at SC = 80% were less than the UCS of the
unamended specimen. Considering that the fine synthetic specimens at SC = 80% were prepared 2% dry
of wopt and sufficient water was likely not available for pozzolanic reactions, the reduced UCS of the fly
ash-amended specimens was attributed to the replacement of tailings particles with rounded fly ash
particles.
This same mechanism of strength loss due to material replacement supports the modest reduction in UCS
for average synthetic tailings prepared at SC = 90% and amended with FA-B (Figure 2.6a). The
unamended average synthetic tailings specimen was prepared at 6.5% dry of wopt, which suggests there
may be a limitation on available water to generate cementitious bonds. The increase in UCS for average
tailings amended with FA-A indicates that some water was available for the pozzolanic reactions to
generate cementation. However, considering the weakly cementing behavior of FA-B, the inclusion of
rounded fly ash particles to average synthetic tailings at SC = 90% had more potential to decrease UCS
30
via material replacement versus enhancing strength via cementation. These competing mechanisms are
supported by the decrease in UCS, as the percent contribution of FA-B was increased from 10% to 20%,
which led to a more pronounced reduction in UCS via increased material replacement.
2.3.1.2.3 Fly Ash Chemical Composition
Comparisons between the UCS of fine, average, and coarse synthetic tailings amended with 10% FA-B
and 10% FA-A are shown in Figure 2.8a. Comparisons between the UCS of fine, average, and coarse
synthetic tailings amended with 20% FA-B and 10% FA-A plus 10% FA-B (i.e., 20% total fly ash
amendment) are shown in Figure 2.8b. Data points in Figure 2.8 are differentiated based on tailings type
(fine, average, and coarse) as well as SC (70, 80, and 90%). All data in Figure 2.8a plot below the 1:1
line. Similarly, all data in Figure 2.8b plot below the 1:1 line with the exception of fine synthetic tailings
at SC = 90%. These comparisons indicate that the UCS of synthetic tailings amended with FA-A was
greater than the UCS of synthetic tailings amended with FA-B. The one exception was discussed
previously in regards to the lack of available water in fine synthetic tailings prepared to a SC = 90%,
which actually resulted in reduced UCS relative to the unamended material (Figure 2.6a).
The two fly ashes used in this study had comparable CaO contents (FA-A = 17 % and FA-B = 18.9 %).
However, the CaO/SiO2 ratio was 0.86 for FA-A and 0.41 for FA-B. Tastan et al. (2011) investigated the
UCS of three organic soils amended with six different fly ashes and reported higher UCS for specimens
amended with fly ash that had CaO/SiO2 ratios between 0.5 and 1.0 as compared to lower ratios. The
higher CaO/SiO2 ratio for FA-A yielded more pronounced pozzolanic activity and resulted in higher UCS
via cementitious bond formation relative to FA-B. This observation was consistent for both the 10% fly
ash (Figure 2.8a) and 20% fly ash (Figure 2.8b) amendment comparisons.
The UCS of synthetic tailings specimens prepared at SC = 80% and 10% Portland cement amendment are
listed in Table 2.3. The UCS of cement-amended synthetic tailings ranged between approximately 1810
kPa and 2190 kPa. This increase in UCS relative to unamended specimens was considerably larger
compared to specimens amended with fly ash. This enhanced UCS was anticipated based on the
CaO/SiO2 ratio of the cement (Figure 2.2) and these UCSs agree with UCS of cement-amended mine
tailings reported in previous studies (e.g., Swami et al. 2007; Mahmood and Mulligan 2010).
2.3.2 Multivariate Regression Analysis
2.3.2.1 Model Development
A multivariate regression analysis was used to develop an empirical relationship to predict UCS, based on
relevant physical characteristics of tailings and fly ash. Regression analysis was preferred relative to other
prediction methods due to the simplicity with which a regression equation can be applied, the ability to
ensure statistical significance of each independent variable, and the clarity with which physical
significance between dependent and independent variables can be evaluated. Forward, backward, and
stepwise regressions were performed. Forward stepwise regression begins with no independent variables
and sequentially adds variables to a model in order of their significance in predicting the dependent
variable. Backward stepwise regression begins with all independent variables and sequentially removes
variables from a model that are least significant in predicting the dependent variable. A general stepwise
regression is a modified version of forward regression, where a backward step follows each forward step.
Independent variables are added (forward and stepwise model selections) or removed (backward and
stepwise model selections) until only those variables that are statistically significant remain in the model.
All regression analyses were conducted in SAS® University Edition (SAS Institute Inc., Cary, NC, USA)
and a significance level of 0.05 was used to evaluate statistical significance of each independent variable.
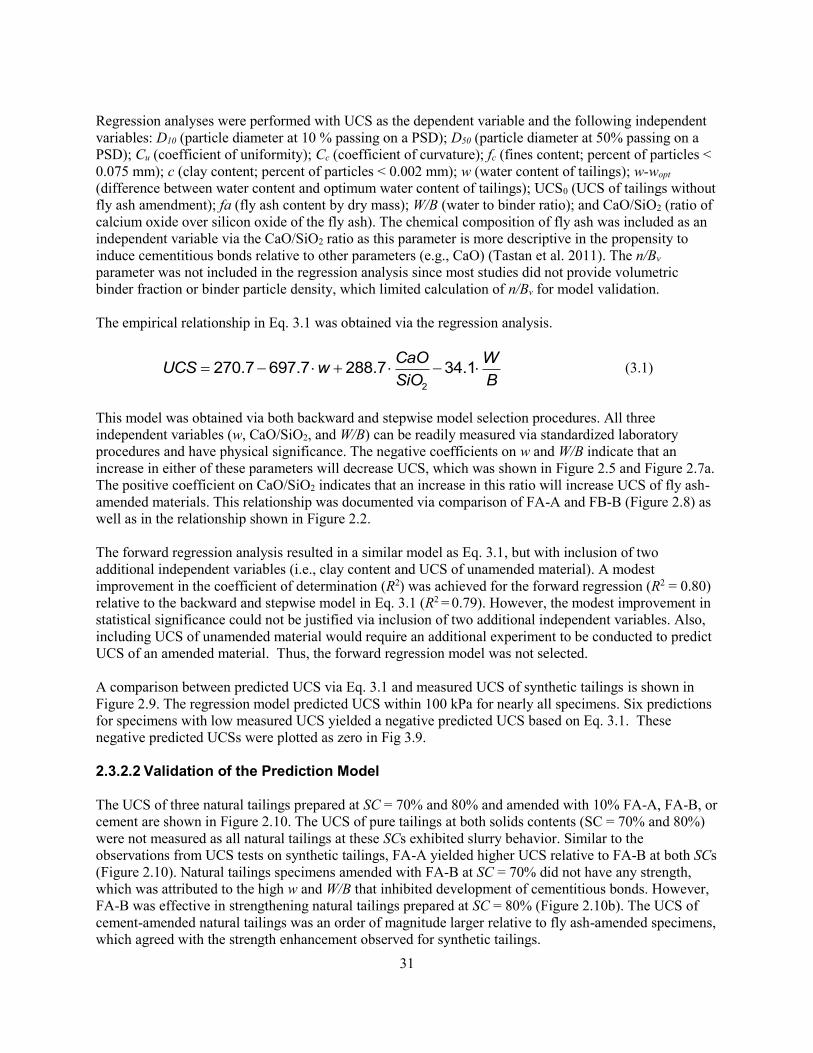
31
Regression analyses were performed with UCS as the dependent variable and the following independent
variables: D10 (particle diameter at 10 % passing on a PSD); D50 (particle diameter at 50% passing on a
PSD); Cu (coefficient of uniformity); Cc (coefficient of curvature); fc (fines content; percent of particles <
0.075 mm); c (clay content; percent of particles < 0.002 mm); w (water content of tailings); w-wopt
(difference between water content and optimum water content of tailings); UCS0 (UCS of tailings without
fly ash amendment); fa (fly ash content by dry mass); W/B (water to binder ratio); and CaO/SiO2 (ratio of
calcium oxide over silicon oxide of the fly ash). The chemical composition of fly ash was included as an
independent variable via the CaO/SiO2 ratio as this parameter is more descriptive in the propensity to
induce cementitious bonds relative to other parameters (e.g., CaO) (Tastan et al. 2011). The n/Bv
parameter was not included in the regression analysis since most studies did not provide volumetric
binder fraction or binder particle density, which limited calculation of n/Bv for model validation.
The empirical relationship in Eq. 3.1 was obtained via the regression analysis.
2
270.7 697.7 288.7 34.1CaO W
UCS wSiO B
(3.1)
This model was obtained via both backward and stepwise model selection procedures. All three
independent variables (w, CaO/SiO2, and W/B) can be readily measured via standardized laboratory
procedures and have physical significance. The negative coefficients on w and W/B indicate that an
increase in either of these parameters will decrease UCS, which was shown in Figure 2.5 and Figure 2.7a.
The positive coefficient on CaO/SiO2 indicates that an increase in this ratio will increase UCS of fly ash-
amended materials. This relationship was documented via comparison of FA-A and FB-B (Figure 2.8) as
well as in the relationship shown in Figure 2.2.
The forward regression analysis resulted in a similar model as Eq. 3.1, but with inclusion of two
additional independent variables (i.e., clay content and UCS of unamended material). A modest
improvement in the coefficient of determination (R2) was achieved for the forward regression (R2 = 0.80)
relative to the backward and stepwise model in Eq. 3.1 (R2 = 0.79). However, the modest improvement in
statistical significance could not be justified via inclusion of two additional independent variables. Also,
including UCS of unamended material would require an additional experiment to be conducted to predict
UCS of an amended material. Thus, the forward regression model was not selected.
A comparison between predicted UCS via Eq. 3.1 and measured UCS of synthetic tailings is shown in
Figure 2.9. The regression model predicted UCS within 100 kPa for nearly all specimens. Six predictions
for specimens with low measured UCS yielded a negative predicted UCS based on Eq. 3.1. These
negative predicted UCSs were plotted as zero in Fig 3.9.
2.3.2.2 Validation of the Prediction Model
The UCS of three natural tailings prepared at SC = 70% and 80% and amended with 10% FA-A, FA-B, or
cement are shown in Figure 2.10. The UCS of pure tailings at both solids contents (SC = 70% and 80%)
were not measured as all natural tailings at these SCs exhibited slurry behavior. Similar to the
observations from UCS tests on synthetic tailings, FA-A yielded higher UCS relative to FA-B at both SCs
(Figure 2.10). Natural tailings specimens amended with FA-B at SC = 70% did not have any strength,
which was attributed to the high w and W/B that inhibited development of cementitious bonds. However,
FA-B was effective in strengthening natural tailings prepared at SC = 80% (Figure 2.10b). The UCS of
cement-amended natural tailings was an order of magnitude larger relative to fly ash-amended specimens,
which agreed with the strength enhancement observed for synthetic tailings.

32
Comparisons of predicted UCS versus measured UCS for natural tailings evaluated in this study and data
compiled from literature are in Figures 2.11 and 2.12. All UCS predictions were made via Eq. 3.1. Data
compiled from Senol et al. (2002), Trzebniatowski et al. (2004), Tastan et al. (2011), Bose (2012), and
Senol et al. (2012) are based on fly ash-amended soils. Data included in Figure 2.11 are for low plasticity
soils and tailings that have LL < 50, whereas data included in Figure 2.12 are for high plasticity soils with
LL > 50. Additionally, data compiled from literature only were included that had UCS < 400 kPa to
coincide with the UCS range based on the synthetic tailings experiments used to generate the regression
equation.
The regression model in Eq. 3.1 predicted UCS within 100 kPa for nearly all low plasticity specimens
compiled from literature and this study (≈ 90% of measured UCS are within ± 100 kPa of predicted UCS
in Figure 2.11). The average bias for UCS predicted with Eq. 3.1 for data compiled in Figure 2.11 was -
6.3 kPa (bias computed as predicted minus measured UCS). The narrower range of predicted UCS for
natural tailings from this study (± 85 kPa) compared with data compiled from literature (± 175 kPa) was
attributed to using the same fly ash and UCS procedures as used to create the prediction model. The
model in Eq. 3.1 is applicable for assessing a potential range of UCS for candidate low plasticity mine
tailings and fly ashes in earthwork constructions. However, additional testing and analysis is needed to
refine the model, and direct prediction of UCS via Eq. 3.1 should be completed with engineering
judgement.
In general, the UCS of high plasticity materials was under-estimated by nearly 100 kPa with the
regression model (i.e., average bias = - 92.3 kPa in Figure 2.12). This underestimation primarily was
attributed to higher as-prepared w for high plasticity soils that led to a reduction in predicted UCS due to
the large negative coefficient on w in Eq. 3.1. The regression model in Eq. 3.1 was created based on low
plasticity materials with wopt ranging from approximately 9% to 23% (synthetic tailings). The wopt of
materials in Figure 2.11 (low plasticity soils) ranged between 0% and 28%, whereas wopt of materials in
Figure 2.12 (high plasticity soils) ranged between 21% and 48%; as a result, low plasticity soils are wet of
optimum or slurry in the wopt range of high plasticity soils. This water content constraint with the model
underestimated UCS of high plasticity soils.
Tastan et al. (2011) developed the following model for UCS of fly ash-amended soils:
2
0
2 2
320 795 573 125,673 6 25 33OC
a mix
CaO CaOUCS e f UCS pH
SiO SiO
(3.2)
where OC is organic content of soil, pHmix is pH of soil-fly ash mixture, and all other parameters are as
defined previously. This model was developed based on UCS measured on three soils with OC ranging
between 5% and 27% and clay content ranging from 15% to 55%. Specimens were prepared with 10%,
20%, and 30% amendment of six different fly ashes with CaO/SiO2 ranging from 0.09 to 1.15. Eq. 3.2
was used to predict UCS of synthetic tailings amended with fly ash in this study considering OC = 0. The
UCS of mixtures prepared at SC = 90% for all synthetic tailings and SC = 80% for fine synthetic tailings
was over-estimated by one order of magnitude, whereas UCS of mixtures prepared at SC = 70% for all
synthetic tailings and 80% for average and coarse synthetic tailings yielded negative values. These
inaccurate UCS predictions were attributed to the inclusion of UCS0, which was substantial for all
synthetic tailings at SC = 90% and fine synthetic tailings at SC = 80%, whereas UCS0 was near zero for
most synthetic tailings prepared at SC = 70% and 80% (Figure 2.6).
33
The inaccurate prediction of fly ash-amended specimens in this study via Eq. 3.2 and under-prediction of
high plasticity soils compiled from literature via Eq. 3.1 (Figure 2.12) suggests that two models may be
needed to predict UCS of fly ash-amended specimens; i.e., one model for low plasticity materials and
another model for high plasticity materials. Further investigation is needed to develop a model to predict
the UCS of fly ash-amended high plasticity tailings and/or evaluate the feasibility of developing a single,
holistic UCS prediction model for the broad range of plasticity encountered in soils, mine tailings, and
other geomaterials.
2.3.3 Practical Implications
The focus of this study was to evaluate the UCS of hard rock mine tailings amended with fly ash. Hard
rock mine tailings generally classify as low plasticity with LL ranging between 15 and 35% (Aubertin et
al. 1996; Wickland and Wilson 2005; Daliri et al. 2014). The empirical model developed using synthetic
mine tailings (Eq. 3.1) encompassed the range of plasticity and particle size anticipated in most hard rock
mining operations and was shown applicable to provide preliminary estimates of the UCS of natural mine
tailings and low plasticity soils compiled from literature (Figure 2.11). The model is applicable for
estimating the UCS of candidate fly ash-amended hard rock mine tailings and fly ash-amended low
plasticity soils. However, engineering judgement should be used when extrapolating the model beyond
the parameter ranges used for development and additional testing should be considered to quantify the
UCS of actual materials to be used in design.
A schematic of transportation earthworks and the corresponding UCS ranges required for earthen
materials used in these earthworks is shown in Figure 2.13. Also listed in Figure 2.13 are UCS criteria for
relevant applications of mine tailings in cemented paste backfill. Earthen materials amended with binders
generally are required to meet specific mechanical, hydraulic, and in some cases environmental criteria
for each application. These requirements often differ from one application to the other (Figure 2.13). The
UCS of synthetic and natural tailings amended with fly ash ranged between 0 to 590 kPa and the UCS of
tailings amended with cement ranged between 1050 to 2190 kPa. The UCS of tailings amended with fly
ash did not meet UCS requirements for base or sub-base of roadways. However, the UCS of tailings
amended with Portland cement in SC = 80% was sufficient for road sub-base construction. Tailings
prepared at a SC = 90% and amended with FA-A, and specimens prepared with Portland cement at all
SCs met the UCS requirements for use in flowable fill and cemented paste backfill. Thus, there are
varieties of earthwork applications in which fly ash amended mine tailings are suitable, and further
modification of the SC, fly ash content, and/or other relevant parameters may render them suitable for
additional applications.
Creating a sustainable geomaterial from two waste materials (e.g., mine waste and fly ash) for use in
earthwork construction should not have negative impacts on the natural environment. A companion study
(Alhomair 2016; Alhomair et al. 2016) was conducted to assess hydraulic conductivity and effluent
leachate chemistry on a broad range of the fly ash-amended synthetic and natural tailings discussed
herein. Leachate chemistry was evaluated to quantify the concentration of heavy metals (e.g., chromium,
copper, cadmium, silver), and peak measured concentrations were compared to maximum contaminant
levels (U.S. EPA 1993) and toxicity limits (U.S. EPA 1986) for drinking water. All heavy metal
concentrations were below the toxicity limits with exception of chromium and copper for some tailings
specimens amended with FA-A. No universal relationships were observed between exceedance of metal
concentration levels for drinking water among the different mine tailings and fly ashes used in this study.
Thus, there may be environmental constraints on reusing certain mine tailings and/or fly ashes in
earthwork construction and specific environmental tests should be completed on candidate materials.
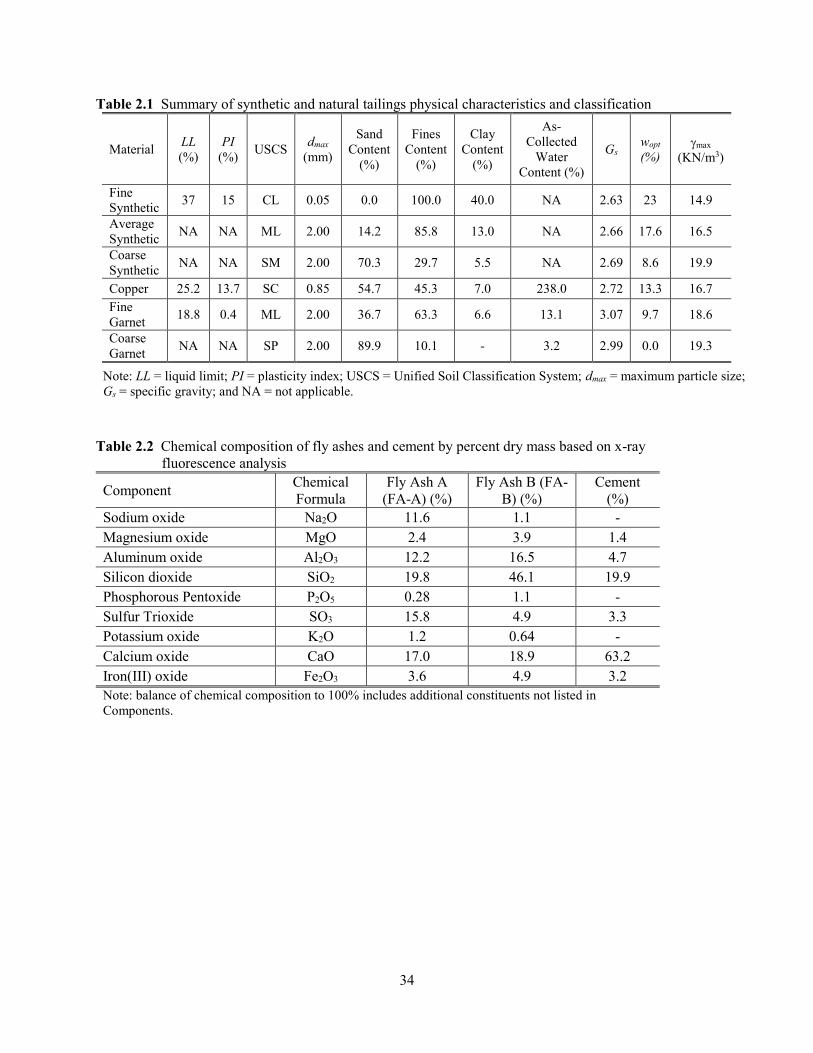
34
Table 2.1 Summary of synthetic and natural tailings physical characteristics and classification
Material LL
(%)
PI
(%) USCS
dmax
(mm)
Sand
Content
(%)
Fines
Content
(%)
Clay
Content
(%)
As-
Collected
Water
Content (%)
Gs wopt
(%) max
(KN/m3)
Fine
Synthetic 37 15 CL 0.05 0.0 100.0 40.0 NA 2.63 23 14.9
Average
Synthetic NA NA ML 2.00 14.2 85.8 13.0 NA 2.66 17.6 16.5
Coarse
Synthetic NA NA SM 2.00 70.3 29.7 5.5 NA 2.69 8.6 19.9
Copper 25.2 13.7 SC 0.85 54.7 45.3 7.0 238.0 2.72 13.3 16.7
Fine
Garnet 18.8 0.4 ML 2.00 36.7 63.3 6.6 13.1 3.07 9.7 18.6
Coarse
Garnet NA NA SP 2.00 89.9 10.1 - 3.2 2.99 0.0 19.3
Note: LL = liquid limit; PI = plasticity index; USCS = Unified Soil Classification System; dmax = maximum particle size;
Gs = specific gravity; and NA = not applicable.
Table 2.2 Chemical composition of fly ashes and cement by percent dry mass based on x-ray
fluorescence analysis
Component Chemical
Formula
Fly Ash A
(FA-A) (%)
Fly Ash B (FA-
B) (%)
Cement
(%)
Sodium oxide Na2O 11.6 1.1 -
Magnesium oxide MgO 2.4 3.9 1.4
Aluminum oxide Al2O3 12.2 16.5 4.7
Silicon dioxide SiO2 19.8 46.1 19.9
Phosphorous Pentoxide P2O5 0.28 1.1 -
Sulfur Trioxide SO3 15.8 4.9 3.3
Potassium oxide K2O 1.2 0.64 -
Calcium oxide CaO 17.0 18.9 63.2
Iron(III) oxide Fe2O3 3.6 4.9 3.2
Note: balance of chemical composition to 100% includes additional constituents not listed in
Components.

35
Table 2.3 Summary of unconfined compressive strength (UCS) tests conducted on synthetic tailings
specimens amended with fly ash or cement
Name Tailings Solids
Content (%)
Saturation
(%) Porosity
Binder
Type
Binder
Content (%)
Water-to-
Binder Ratio
UCS
(kPa)
SF-90-N F 90 34 0.46 - 0 - 303
SA-90-N A 90 42 0.41 - 0 - 298
SC-90-N C 90 83 0.26 - 0 - 209
SF-80-N F 80 81 0.45 - 0 - 214
SA-80-N A 80 94 0.41 - 0 - 0
SC-80-N C 80 96 0.41 - 0 - 0
SF-70-N F 70 98 0.53 - 0 - 0
SA-70-N A 70 94 0.55 - 0 - 0
SC-70-N C 70 97 0.54 - 0 - 0
SF-90-FA-A10 F 90 39 0.43 FA-A 10 1.1 276
SA-90-FA-A10 A 90 36 0.45 FA-A 10 1.1 371
SC-90-FA-A10 C 90 89 0.25 FA-A 10 1.1 553
SF-80-FA-A10 F 80 86 0.43 FA-A 10 2.5 180
SA-80-FA-A10 A 80 93 0.42 FA-A 10 2.5 304
SC-80-FA-A10 C 80 98 0.41 FA-A 10 2.5 315
SF-70-FA-A10 F 70 93 0.55 FA-A 10 4.3 93
SA-70-FA-A10 A 70 96 0.54 FA-A 10 4.3 123
SC-70-FA-A10 C 70 100 0.54 FA-A 10 4.3 112
SF-90-FA-B10 F 90 35 0.45 FA-B 10 1.1 260
SA-90-FA-B10 A 90 45 0.39 FA-B 10 1.1 272
SC-90-FA-B10 C 90 79 0.27 FA-B 10 1.1 228
SF-80-FA-B10 F 80 84 0.44 FA-B 10 2.5 59
SA-80-FA-B10 A 80 95 0.41 FA-B 10 2.5 72
SC-80-FA-B10 C 80 100 0.40 FA-B 10 2.5 72
SF-70-FA-B10 F 70 95 0.54 FA-B 10 4.3 15
SA-70-FA-B10 A 70 95 0.54 FA-B 10 4.3 0
SC-70-FA-B10 C 70 99 0.54 FA-B 10 4.3 0
SF-90-FA-B20 F 90 37 0.43 FA-B 20 0.55 275
SA-90-FA-B20 A 90 47 0.38 FA-B 20 0.55 250
SC-90-FA-B20 C 90 83 0.26 FA-B 20 0.55 333
SF-80-FA-B20 F 80 81 0.44 FA-B 20 1.25 89
SA-80-FA-B20 A 80 95 0.41 FA-B 20 1.25 112
SC-80-FA-B20 C 80 96 0.41 FA-B 20 1.25 78
SF-70-FA-B20 F 70 97 0.53 FA-B 20 2.15 18
SA-70-FA-B20 A 70 98 0.53 FA-B 20 2.15 0
SC-70-FA-B20 C 70 100 0.53 FA-B 20 2.15 0
SF-90-FA-A10+B10 F 90 38 0.43 FA-A&B 20 0.55 281
SA-90-FA-A10+B10 A 90 47 0.38 FA-A&B 20 0.55 460
SC-90-FA-A10+B10 C 90 87 0.25 FA-A&B 20 0.55 590
SF-80-FA-A10+B10 F 80 80 0.45 FA-A&B 20 1.25 165
SA-80-FA-A10+B10 A 80 95 0.41 FA-A&B 20 1.25 269
SC-80-FA-A10+B10 C 80 94 0.41 FA-A&B 20 1.25 290
SF-70-FA-A10+B10 F 70 96 0.54 FA-A&B 20 2.15 116
SA-70-FA-A10+B10 A 70 98 0.54 FA-A&B 20 2.15 110
SC-70-FA-A10+B10 C 70 100 0.53 FA-A&B 20 2.15 120
SF-80-CEM10 F 80 84 0.26 CEM 10 2.5 1812
SA-80-CEM10 A 80 100 0.23 CEM 10 2.5 2187
SC-80-CEM10 C 80 99 0.23 CEM 10 2.5 2112
Specimen nomenclature: S = synthetic; F = fine; A = average; C = coarse; 70, 80, and 90 = solids contents; FA-A = fly ash A; FA-B = fly
ash B; CEM = cement; 10 and 20 are binder content.

36
Table 2.4 Summary of unconfined compressive strength (UCS) tests conducted on natural tailings
amended with fly ash or cement
Name Tailings
Solids
Content
(%)
Saturation
(%) Porosity
Binder
Type
Binder
Content
(%)
Water-to-
Binder
Ratio
UCS
(kPa)
NCu-80-FA-A10 Cu 80 92 0.42 FA-A 10 2.5 212
NCG-80-FA-A10 CG 80 95 0.44 FA-A 10 2.5 178
NFG-80-FA-A10 FG 80 100 0.43 FA-A 10 2.5 196
NCu-70-FA-A10 Cu 70 98 0.54 FA-A 10 4.3 135
NCG-70-FA-A10 CG 70 98 0.57 FA-A 10 4.3 141
NFG-70-FA-A10 FG 70 99 0.56 FA-A 10 4.3 121
NCu-80-FA-B10 Cu 80 92 0.44 FA-B 10 2.5 139
NCG-80-FA-B10 CG 80 95 0.42 FA-B 10 2.5 20
NFG-80-FA-B10 FG 80 100 0.42 FA-B 10 2.5 106
NCu-70-FA-B10 Cu 70 100 0.54 FA-B 10 4.3 0
NCG-70-FA-B10 CG 70 100 0.56 FA-B 10 4.3 0
NFG-70-FA-B10 FG 70 ― ― FA-B 10 4.3 0
NCu-80-CEM10 Cu 80 ― ― CEM 10 2.5 1540
NCG-80-CEM10 CG 80 91 0.46 CEM 10 2.5 1438
NFG-80-CEM10 FG 80 100 0.43 CEM 10 2.5 1800
NCu-70-CEM10 Cu 70 ― ― CEM 10 4.3 1105
NCG-70-CEM10 CG 70 100 0.57 CEM 10 4.3 1250
NFG-70-CEM10 FG 70 100 0.56 CEM 10 4.3 1061
Specimen nomenclature: N = natural; Cu = copper; CG = coarse garnet; FG = fine garnet; 70 and 80 = solids
contents; FA-A = fly ash A; FA-B = fly ash B; CEM = cement; and 10 = percent my mass binder content
Note: ― = calculations not possible due to measurement errors

37
0
20
40
60
80
100
Tailings UpperTailings LowerTailings Average
Average SyntheticCoarse SyntheticFine Synthetic
0.0010.010.1110
Pe
rce
nt
Pa
ssin
g (
%)
(a)
Particle Size (mm)
0
20
40
60
80
100
0.0010.010.1110
Tailings UpperTailings LowerTailings Average
Fine GarnetCoarse GarnetCopper
Pe
rce
nt
Pa
ssin
g (
%)
Particle Size (mm)
(b)
Figure 2.1 Particle-size distributions for (a) average, coarse, and fine synthetic mine tailings prepared for
this study and (b) fine garnet, coarse garnet, and copper natural tailings. The upper, lower,
and average tailings particle-size distributions shown in both plots are based on a compilation
from literature (Qiu and Sego 2001; Morris and Williams 2005; Khalili and Wijewickreme
2008; Wickland and Wilson 2005; Wickland et al. 2006; Bussière 2007; Khalili et al. 2010;
Wickland et al. 2010).
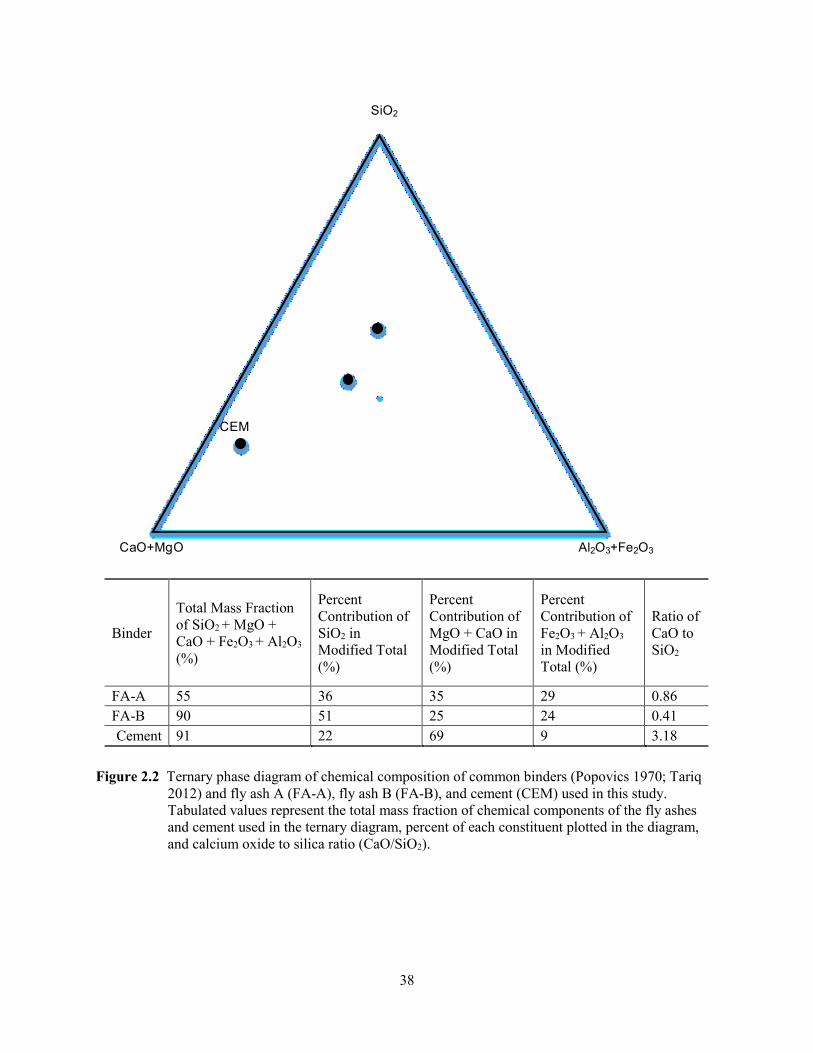
38
Fly Ash
Natural
Pozzolans
High alumina
cement
Blast
furnace
slag
Lime
Portland
Cement
Cement
Klin dust
FA-B
FA-A
Al2O3+Fe2O3CaO+MgO
SiO2
`
CEM
Figure 2.2 Ternary phase diagram of chemical composition of common binders (Popovics 1970; Tariq
2012) and fly ash A (FA-A), fly ash B (FA-B), and cement (CEM) used in this study.
Tabulated values represent the total mass fraction of chemical components of the fly ashes
and cement used in the ternary diagram, percent of each constituent plotted in the diagram,
and calcium oxide to silica ratio (CaO/SiO2).
Binder
Total Mass Fraction
of SiO2 + MgO +
CaO + Fe2O3 + Al2O3
(%)
Percent
Contribution of
SiO2 in
Modified Total
(%)
Percent
Contribution of
MgO + CaO in
Modified Total
(%)
Percent
Contribution of
Fe2O3 + Al2O3
in Modified
Total (%)
Ratio of
CaO to
SiO2
FA-A 55 36 35 29 0.86
FA-B 90 51 25 24 0.41
Cement 91 22 69 9 3.18

39
0
100
200
300
60 70 80 90 100
FineAverageCoarse
0224467
Slu
mp
(m
m)
Solids Content (%)
Water Content (%)
Thickened Tailings
Paste Tailings
Filtered Tailings
Figure 2.3 Relationship between slump and solids content (SC) or water content for synthetic tailings
prepared to different levels of dewatering: thickened tailings – SC < 70%; paste tailings –
70% < SC < 85%; filtered tailings – SC > 85%.

40
0
200
400
600
0 0.02 0.04 0.06 0.08 0.1
SC-90-N
SC90-FA-A10
SC90-FA-B10
Axia
l S
tress (
kP
a)
Axial Strain (m/m)
UCS = 553 kPa
UCS = 209 kPa
UCS = 228 kPa
Figure 2.4 Relationship between axial stress and axial strain for unconfined compression strength tests
non-fly ash amended (SC-90-N) and fly ash amended (SC-90-FA-A10 and SC-90-FA-B10)
synthetic mine tailings.

41
0
100
200
300
400
60 70 80 90 100
FineAverageCoarse
0224467
Uncon
fined C
om
pre
ssiv
e S
treng
th (
kP
a)
Solids Content (%)
Water Content (%)
Thickened Tailings
Paste Tailings
Filtered Tailings
Figure 2.5 Relationship between unconfined compressive strength (UCS) and solids content or water
content for non-amended synthetic tailings specimens. Note: UCS = 0 kPa corresponds to
slurry materials that were not self-supporting and had no capacity to carry an axial load.
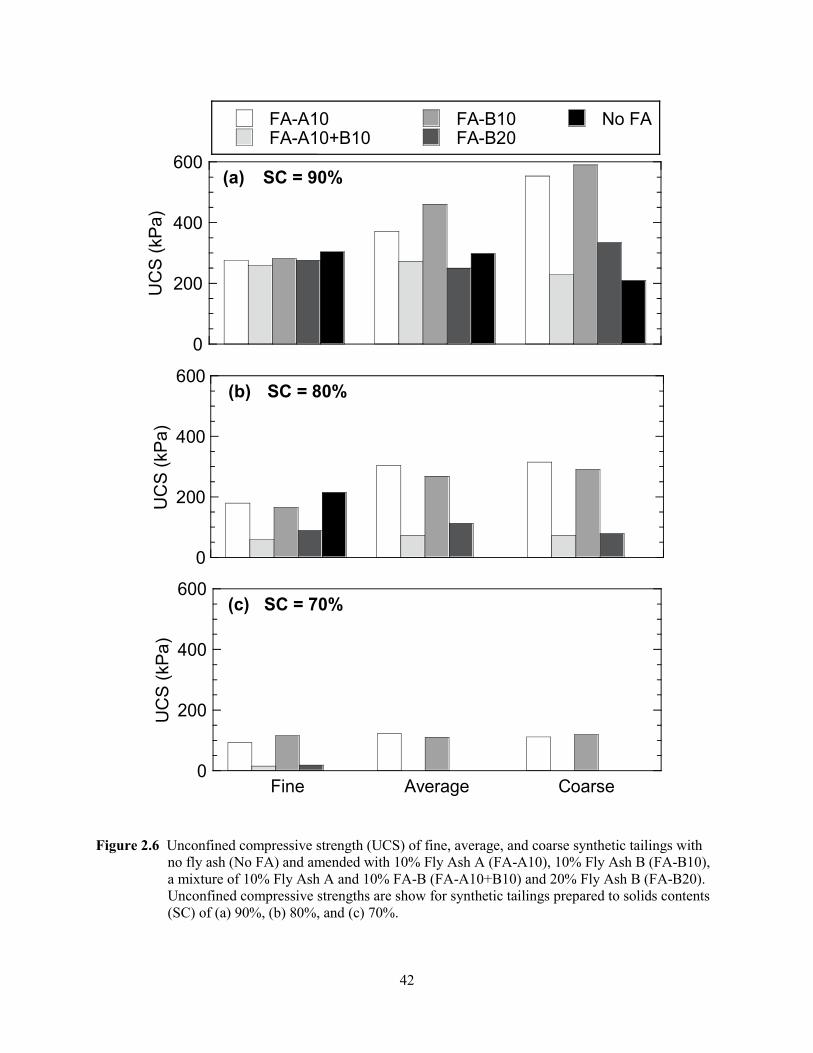
42
0
200
400
600
FA-A10FA-A10+B10
FA-B10FA-B20
No FA
UC
S (
kP
a)
SC = 90%(a)
0
200
400
600
UC
S (
kP
a)
SC = 80%(b)
0
200
400
600
Fine Average Coarse
UC
S (
kP
a)
SC = 70%(c)
Figure 2.6 Unconfined compressive strength (UCS) of fine, average, and coarse synthetic tailings with
no fly ash (No FA) and amended with 10% Fly Ash A (FA-A10), 10% Fly Ash B (FA-B10),
a mixture of 10% Fly Ash A and 10% FA-B (FA-A10+B10) and 20% Fly Ash B (FA-B20).
Unconfined compressive strengths are show for synthetic tailings prepared to solids contents
(SC) of (a) 90%, (b) 80%, and (c) 70%.
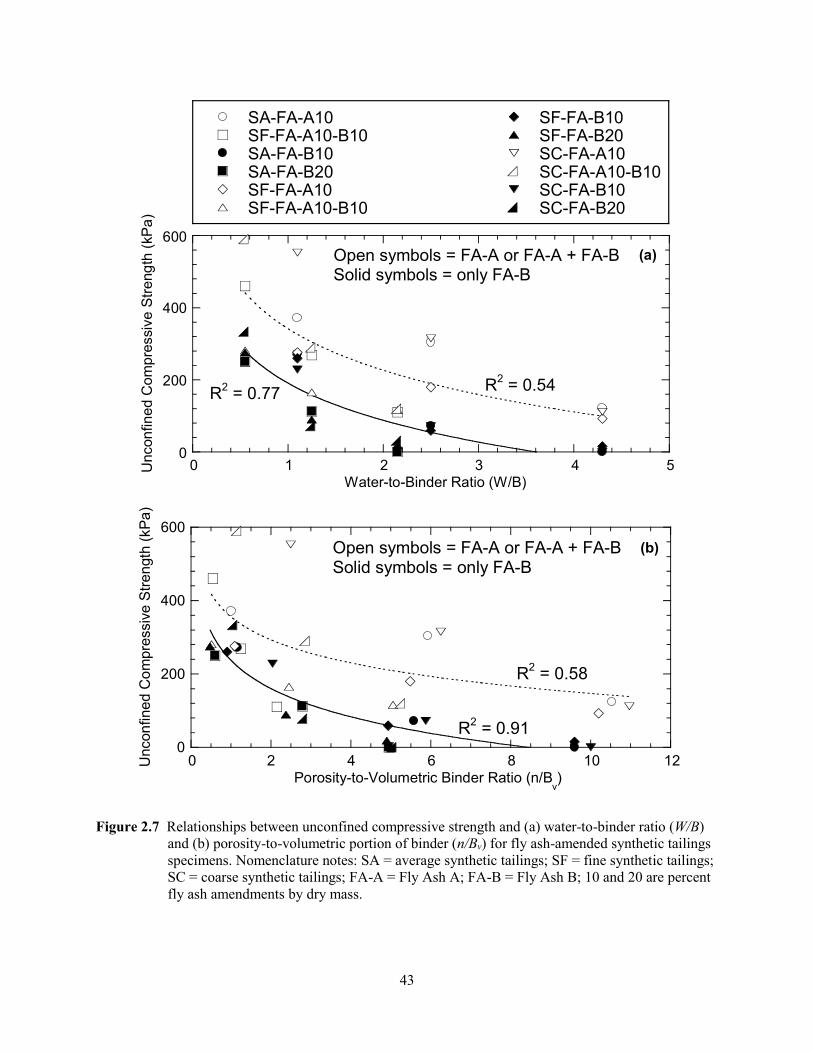
43
0
200
400
600
0 1 2 3 4 5
SA-FA-A10SF-FA-A10-B10SA-FA-B10SA-FA-B20SF-FA-A10SF-FA-A10-B10
SF-FA-B10SF-FA-B20SC-FA-A10SC-FA-A10-B10SC-FA-B10SC-FA-B20
Uncon
fin
ed
Co
mp
ressiv
e S
tre
ng
th (
kP
a)
Water-to-Binder Ratio (W/B)
Open symbols = FA-A or FA-A + FA-BSolid symbols = only FA-B
R2 = 0.54
R2 = 0.77
(a)
0
200
400
600
0 2 4 6 8 10 12Unconfined C
om
pre
ssiv
e S
tren
gth
(kP
a)
Porosity-to-Volumetric Binder Ratio (n/Bv)
R2 = 0.58
R2 = 0.91
(b)Open symbols = FA-A or FA-A + FA-BSolid symbols = only FA-B
Figure 2.7 Relationships between unconfined compressive strength and (a) water-to-binder ratio (W/B)
and (b) porosity-to-volumetric portion of binder (n/Bv) for fly ash-amended synthetic tailings
specimens. Nomenclature notes: SA = average synthetic tailings; SF = fine synthetic tailings;
SC = coarse synthetic tailings; FA-A = Fly Ash A; FA-B = Fly Ash B; 10 and 20 are percent
fly ash amendments by dry mass.

44
0
200
400
600
0 200 400 600
Fine
Average
Coarse
UC
S o
f S
ynth
etic T
aili
ngs w
ith 1
0%
FA
-B (
kP
a)
(a)
UCS of Synthetic Tailings with 10% FA-A (kPa)
10% Fly Ash Amendment
Symbols:Large = 90% SCMedium = 80% SCSmall = 70% SC
0
200
400
600
0 200 400 600
FineCoarseAverage
UC
S o
f S
yn
the
tic T
aili
ng
s w
ith
20
% F
A-B
(kP
a)
UCS of Synthetic Tailings with 10% FA-A + 10% FA-B (kPa)
(b) 20% Fly Ash Amendment
Symbols:Large = 90% SCMedium = 80% SCSmall = 70% SC
Figure 2.8 Comparison of unconfined compressive strength (UCS) of fine, average, and coarse synthetic
tailings amended with Fly Ash B (FA-B) versus UCS of fine, average, and coarse synthetic
tailings amended with Fly Ash A (FA-A): (a) 10% FA-B versus 10% FA-A and (b) 20% FA-
B versus 10% FA-A plus 10% FA-B.

45
0
200
400
600
0 200 400 600
Pre
dic
ted
Un
co
nfine
d C
om
pre
ssiv
e S
tre
ngth
(kP
a)
Measured Unconfined Compressive Strength (kPa)
R2 = 0.79
Figure 2.9 Comparison between unconfined compressive strength predicted using the regression model
developed based on the synthetic tailings experiments (Eq. 3.1) and unconfined compressive
strength measured on the synthetic tailings.
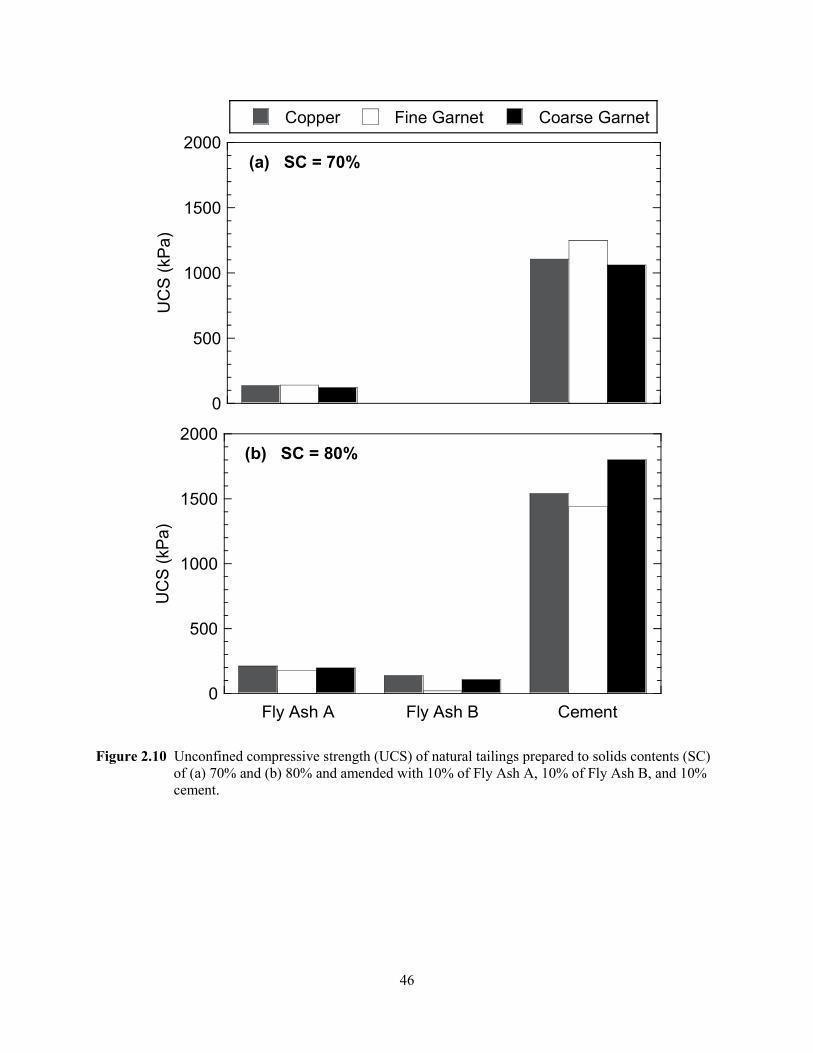
46
0
500
1000
1500
2000
Copper Fine Garnet Coarse Garnet
UC
S (
kP
a)
(a) SC = 70%
0
500
1000
1500
2000
UC
S (
kP
a)
(b) SC = 80%
Fly Ash A Fly Ash B Cement
Figure 2.10 Unconfined compressive strength (UCS) of natural tailings prepared to solids contents (SC)
of (a) 70% and (b) 80% and amended with 10% of Fly Ash A, 10% of Fly Ash B, and 10%
cement.
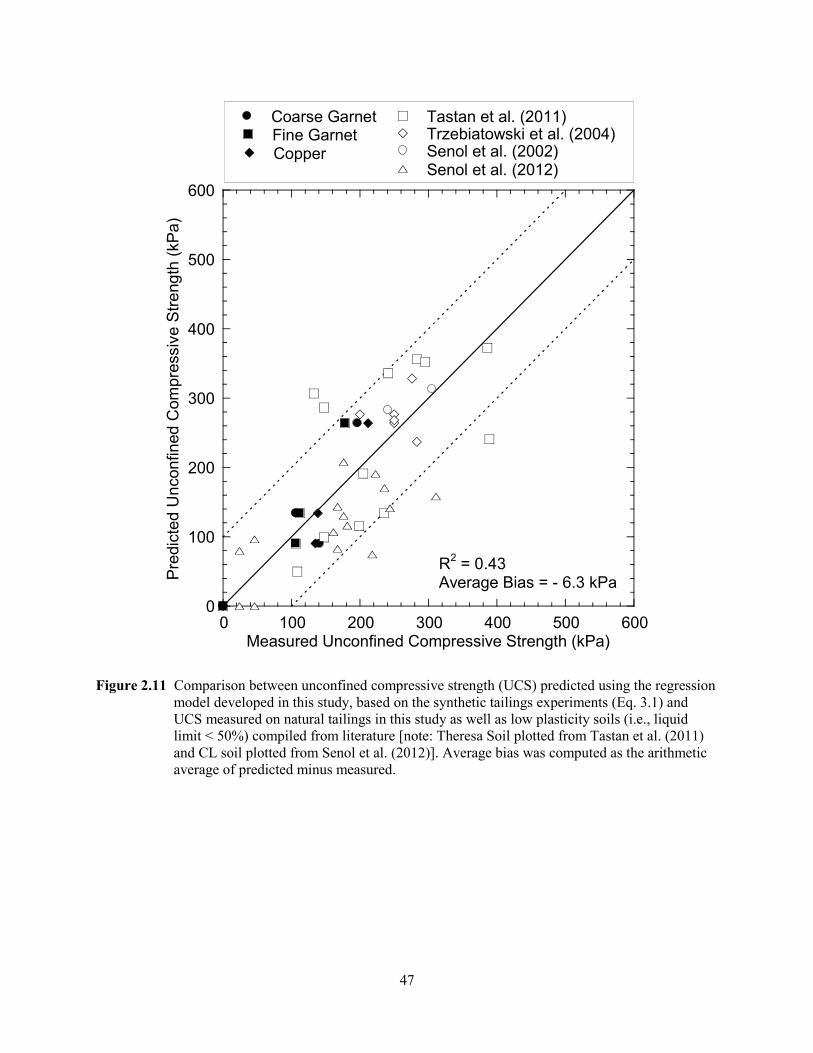
47
0
100
200
300
400
500
600
0 100 200 300 400 500 600
Senol et al. (2002)
Coarse GarnetFine GarnetCopper
Tastan et al. (2011)Trzebiatowski et al. (2004)
Senol et al. (2012)P
redic
ted
Un
con
fin
ed
Com
pre
ssiv
e S
tre
ng
th (
kP
a)
Measured Unconfined Compressive Strength (kPa)
R2 = 0.43
Average Bias = - 6.3 kPa
Figure 2.11 Comparison between unconfined compressive strength (UCS) predicted using the regression
model developed in this study, based on the synthetic tailings experiments (Eq. 3.1) and
UCS measured on natural tailings in this study as well as low plasticity soils (i.e., liquid
limit < 50%) compiled from literature [note: Theresa Soil plotted from Tastan et al. (2011)
and CL soil plotted from Senol et al. (2012)]. Average bias was computed as the arithmetic
average of predicted minus measured.
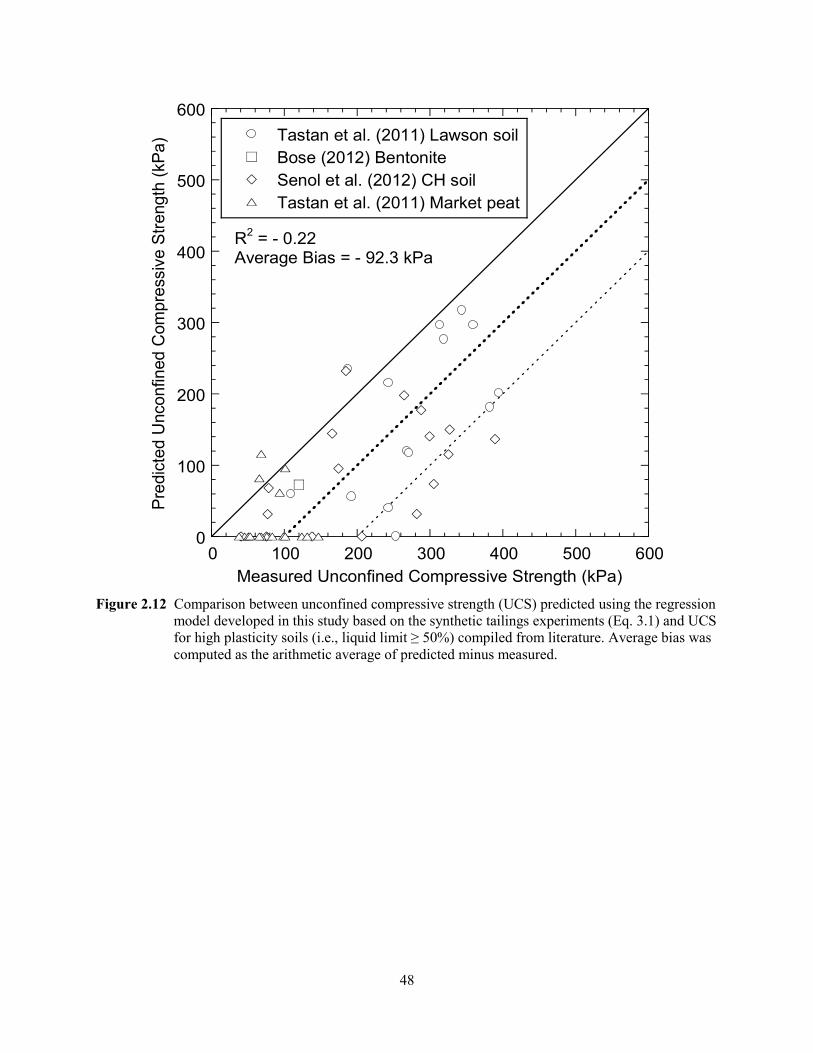
48
0
100
200
300
400
500
600
0 100 200 300 400 500 600
Tastan et al. (2011) Lawson soil
Bose (2012) Bentonite
Senol et al. (2012) CH soil
Tastan et al. (2011) Market peat
Pre
dic
ted U
nconfined
Com
pre
ssiv
e S
trength
(kP
a)
Measured Unconfined Compressive Strength (kPa)
R2 = - 0.22
Average Bias = - 92.3 kPa
Figure 2.12 Comparison between unconfined compressive strength (UCS) predicted using the regression
model developed in this study based on the synthetic tailings experiments (Eq. 3.1) and UCS
for high plasticity soils (i.e., liquid limit ≥ 50%) compiled from literature. Average bias was
computed as the arithmetic average of predicted minus measured.
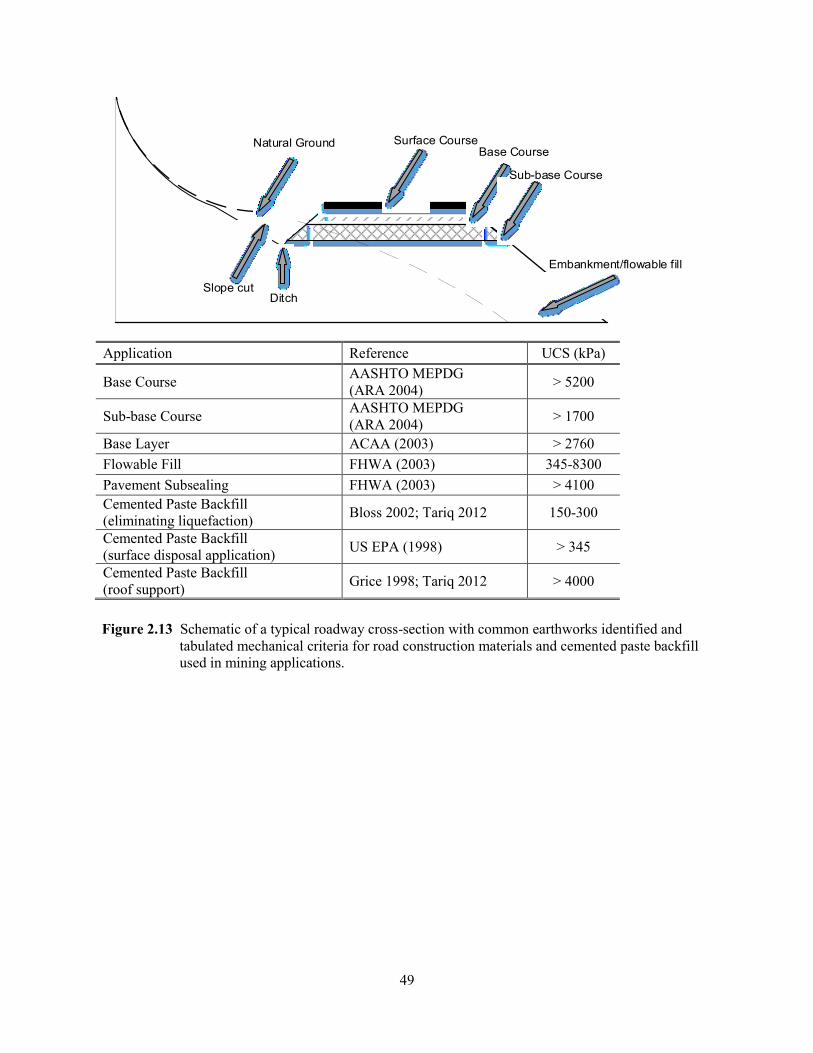
49
Natural Ground Surface CourseBase Course
Sub-base Course
Embankment/flowable fill
DitchSlope cut
Application Reference UCS (kPa)
Base Course AASHTO MEPDG
(ARA 2004) > 5200
Sub-base Course AASHTO MEPDG
(ARA 2004) > 1700
Base Layer ACAA (2003) > 2760
Flowable Fill FHWA (2003) 345-8300
Pavement Subsealing FHWA (2003) > 4100
Cemented Paste Backfill
(eliminating liquefaction) Bloss 2002; Tariq 2012 150-300
Cemented Paste Backfill
(surface disposal application) US EPA (1998) > 345
Cemented Paste Backfill
(roof support) Grice 1998; Tariq 2012 > 4000
Figure 2.13 Schematic of a typical roadway cross-section with common earthworks identified and
tabulated mechanical criteria for road construction materials and cemented paste backfill
used in mining applications.
50
3. COMPRESSION BEHAVIOR OF MINE TAILINGS AMENDED WITH CEMENTITIOUS BINDERS3
3.1 Introduction
Earthwork construction, such as roads, embankments, and fills, requires earthen materials (e.g., soil,
crushed rock, etc.) designed for specific engineering performance. The Federal Highway Administration
has identified that the use of recycled materials, such as coal combustion by-products (CCBs), mine waste
(mine waste rock and tailings), blast furnace slag, municipal solid waste combustion ash, reclaimed
concrete pavement, and scrap tires, has potential to aid earth construction needs (Schroeder 1994; Chesner
et al. 1998). Reuse of industrial waste and byproducts is particularly attractive to decrease energy
consumption, raw material use, and greenhouse gas emissions (Hudson-Edwards et al. 2011).
Mining is an industry that generates considerable volumes of waste materials during ore extraction
processes. The two predominant waste materials that require short- and long-term management are
tailings and waste rock (e.g., Bussière 2007; Blight 2010). Tailings typically are fine grained and have
high water contents (low solids contents); waste rock generally is gravel- to cobble-sized material with
some sand and fines. Disposal and management of mine tailings can be challenging due to variability in
physical and chemical properties of the tailings, potential release of contamination to surface and ground
water (Bussière 2007), and failure of tailings dams (Davies 2002; Bowker et al. 2015). The risks
associated with tailings storage and long-term management in impoundment facilities highlights the
importance of finding alternative methods for mine tailings management.
Mine tailings dewatering is commonly done to improve the mechanical properties of tailings. There are
three common levels of dewatered tailings: (i) thickened tailings, which increases solids content (SC) to
50-70%; (ii) paste tailings, which increases SC to 70-85%; and (iii) filtered tailings, which increases SC
above 85% (Bussière 2007). Progressive dewatering from thickened to paste to filtered tailings requires
additional time, energy, and financial investment. Thickened and paste tailings contain sufficient water
that can prolong consolidation and limit strength gain within reasonable timeframes for earthwork
construction. The addition of cementitious binder has been shown to improve the mechanical properties
of mine tailings and fine-grained soils.
Incorporating mine tailings in earthwork applications provides an alternative to circumvent disposal and
long-term management. There is increasing interest in reusing dewatered mine tailings amended with
cementitious binders (e.g., fly ash or cement) in earthwork construction projects (e.g., Misra et al. 1996;
Godbout et al. 2007). The potential to reuse mine tailings in earthwork construction with fly ash, a
prevalent industrial by-product with self-cementing behavior, promotes sustainable management of
industrial wastes.
Amending dewatered mine tailings with cementitious binders has been used as cemented paste backfill
(CPB) in underground mining to fill cavities (ranging from 15 to 40 m in lateral extent and up to 100-m
tall) and enhance local and global stability. The mechanical, hydraulic, and environmental behavior of
CPB has been investigated by numerous researchers (Zou and Li 1999; Belem et al. 2000; Fall et al.
2005; Kesimal et al. 2005; Klein and Simon 2006; Ouellet et al. 2006; Ouellet et al. 2007; Benzaazoua et
al. 2008; Ercikidi et al. 2009; Yeheyis et al. 2009; Nasir and Fall 2010; Zhang et al. 2011; Ercikidi et al.
2013). In general, addition of a cementitious binder has been shown to increase strength, reduce hydraulic
conductivity, increase pH of effluent, and stabilize heavy metals present in mine tailings.
3 Gorakhki, M.H. and Bareither, C.A. Compression behavior of mine tailings amended with cementitious binders, Geotechnical
and Geological Engineering, online 13 July 2017, 10.1007/s10706-017-0299-4.
51
Compressibility of high water content soils and tailings amended with a cementitious binder has been the
focus of recent studies (e.g., Nalbantoglu and Tuncer 2001; Horpibulsuk et al. 2005; Duraisamy et al.
2009; Yilmaz et al. 2010; Bobet et al. 2011; Fahey et al. 2011; Federico et al. 2015; Yilmaz et al. 2015).
Horpibulsuk et al. (2005) investigated the effect of cement addition on compression of soft clay (liquid
limit = 120%) at water contents ranging from 150% to 250%. They reported limited vertical deformation
with increasing vertical stress followed by a transition to larger deformations after reaching a certain
stress level. This transition in compression was linked to a threshold stress level referred to as the
breaking stress (σ'B), which coincided with breakage of cementitious bonds in the cement-amended clay.
Bobet et al. (2011) evaluated compressibility of a highly organic soil (organic content = 40% to 60%, by
dry mass) amended with cement in constant rate-of-strain and traditional consolidation tests. They
reported that settlement decreased with an increase in cement content due to an increase in σ'B. However,
they reported an approximately equal compression index (Cc) for cement-amended soil and natural soil
under vertical stress > σ'B. Federico et al. (2015) evaluated compressibility of a high plasticity clay (LL =
55%) amended with cement and cement-lime mixture. They reported that σ'B was approximately 1.5
times the unconfined compressive strength (UCS) for similarly prepared mixtures. Federico et al. (2015)
reported the binder content was the most important parameter that affected compressibility of highly
compressible soils.
Yilmaz et al. (2015) evaluated the efficacy of three binders (slag; Portland cement; and mixture of slag
and Portland cement) on reducing compressibility of mine tailings for specimens cured under stress (SC =
81%; fines content ≈ 70%). Secimens were cured for 0, 1, 3, and 7 daysunder stresses up to 400 kPa.
Reduction in Cc was reported with an increase in binder content and/or curing time. Rotta et al. (2003)
reported similar positive correspondence between σ'B, cement content, and stress applied during curing
for non-plastic silty sand mixed with cement.
These past studies have demonstrated that the addition of Portland cement and lime can decrease
compression of mine tailings and highly compressible soils at high water contents. However, the effects
of cementitious by-products (e.g., fly ash), material characteristics (e.g., particle-size and plasticity), and
water content on the compression behavior of mine tailings has received limited attention. These factors
are important to enhancing a mechanistic understanding of tailings-fly ash mixtures to promote beneficial
reuse of these waste by-products in earthwork projects. The objectives of this study were to (i) assess the
coupled effects of tailings properties, tailings water content, fly ash addition, and curing time on the
compression behavior of fly ash-amended mine tailings and (ii) assess the effect of applied stress during
curing on compressibility. The second objective was included to expand the relevance of this study to fly
ash-amended mine tailings in CPB applications.
3.2 Materials and Methods
3.2.1 Materials
3.2.1.1 Mine Tailings
Two types of mine tailings were used in this study—synthetic tailings and natural tailings. A compilation
of geotechnical characteristics of these materials is in Table 3.1. Synthetic tailings were created from
laboratory-controlled materials (i.e., angular sand from road base material, silica flour (US silica, USA),
and kaolin clay (Thiele Kaolin Company, USA)] to capture a range in geotechnical characteristics of mine
tailings. Natural tailings were collected from a (i) copper mine in Arizona, (ii) soda ash mine in
Wyoming, and (iii) garnet mine in New York. Two fractions of garnet tailings were collected as a
hydrocyclone is used at the garnet mine to segregate tailings for subsequent reuse in mine site earthworks
(e.g., tailings dams). The finer fraction of the garnet tailings (fine-garnet tailings), which represents

52
overflow material from the hydrocyclone, was used in this study. A portion of the fine-garnet tailings was
processed via wet sieving through a No. 200 sieve to produce a tailings material with a finer-grained
particle distribution; this laboratory-processed material is referred to as NP200G. Geotechnical
characterization of all tailings included mechanical sieve and hydrometer (ASTM D422, ASTM 2007),
Atterberg limits (ASTM D4318, ASTM 2014), and specific gravity (ASTM D854, ASTM 2014).
The average, upper-bound, and lower-bound particle-size distributions (PSD) of eight different hard rock
mine tailings are shown in Figures 3.1a and 3.1b along with the synthetic tailings (Figure 3.1a) and
natural tailings (Figure 3.1b). Synthetic tailings were created to approximate the average and upper-bound
PSDs in Figure 3.1a. Particle-size distributions of the fine and average synthetic tailings are also shown in
Figure 3.1a and close replication was achieved in both cases. Synthetic mine tailings representative of the
lower-bound PSD in Figure 3.1a classified predominantly as sand and were not evaluated in this study as
the focus was on compression behavior of finer-grained materials.
Particle-size distributions of the natural tailings are shown in Figure 3.1b. The compilation of PSDs from
literature indicates that the copper and fine-garnet mine tailings ranged between the average and lower-
bound. Soda ash and NP200G ranged between the average and upper-bound PSDs (Figure 3.1b). The
liquid limits (LL) of synthetic and natural tailings ranged between 0 to 37% (Table 3.1), which was in the
typical range of hard rock mine tailings (0 to 40%) (e.g., Aubertin et al. 1996; Qiu and Sego 2001;
Wickland and Wilson 2005; Daliri et al. 2014).
3.2.1.2 Cementitious Binders
Three types of fly ash and one type of cement were used as cementitious binders. Fly Ash A (FA-A) was
obtained from Stanton Station, North Dakota, which operates a 190-MW power plant. Fly Ash B (FA-B)
was obtained from Platte River Power Authority, Colorado, which operates a 280-MW power plant. Fly
Ash C (FA-C) was obtained from Coal Creek Station, North Dakota, which operates an 1100-MW power
plant. Type I-II Portland cement was made available for this study and had basic properties of Type I and
Type II cements (Day et al. 2013).
Chemical composition of the fly ashes and cement are listed in Table 3.2. Chemical composition of FA-A
and FA-C were measured via x-ray fluorescence with a Philips 1600/10 Simultaneous Wavelength
Dispersive Unit by Mineralogy-INC (Tulsa, Oklahoma, USA), whereas chemical composition of cement
and FA-B were obtained from the cement producer and power plant, respectively. Fly ashes were
classified based on ASTM C618 (ASTM 2003) and Tastan et al. (2011), and all three fly ashes classified
as off-specification (off-spec). The off-spec designation only implies that the fly ashes did not formally
classify as Class C or F. Off-spec fly ashes can yield self-cementing behavior, and lime (i.e., calcium
oxide, CaO), which is the main component responsible for cementitious reactions, accounted for 17% of
FA-A, 12% of FA-C, and 18.9% of FA-B (Table 3.2).
The relative composition of calcium oxide plus magnesium oxide (CaO + MgO), silicon dioxide (SiO2),
and aluminum oxide plus ferric oxide (Al2O3 + Fe2O3) for the fly ashes and cement are shown in the
ternary plot in Figure 3.2. Janz and Johansson (2002) introduced the CaO-to-SiO2 ratio (CaO/SiO2) as an
indicator for pozzolanic reaction of binders. In FA-A, the CaO/SiO2 (0.86) was higher than the CaO/SiO2
(0.41) in FA-B. Fly Ash C had the lowest CaO/SiO2 (0.25) in comparison with the other two fly ashes.
Fly Ash A had a more favorable relative composition of the key chemical compounds required for
formation of cementitious products (i.e., calcium silicate hydrate and calcium aluminate silicate hydrate)
compared to FA-B and FA-C, which implied that FA-A would be more effective as a cementitious binder.
The cement plotted in the ternary plot in Figure 3.2 in the anticipated range of cements and had high
cementitious properties in comparison with fly ashes.
53
3.2.2 Compression Testing
One-dimensional compression tests were performed in conventional fixed-ring consolidation cells on
unamended tailings and fly ash-amended tailings in accordance with ASTM D2435 (ASTM 2014). All
specimens were prepared via initially mixing tailings with de-aired water and then adding the required
binder quantity (if applicable) to the slurried tailings. Water-to-binder ratios (W/B) of 2.5 and 5 were
targeted for tailings prepared to different SCs as these W/Bs are common for CPBs (Kesimal et al. 2005).
Fine synthetic tailings were prepared to target SCs of 60% and 70% (w = 67% and 43%, respectively) to
create a slurry that approximated dewatering levels in thickened tailings (SC = 60 %) and paste tailings
(SC = 70%). Average synthetic tailings and natural mine tailings were prepared to target SCs of 70% (w =
43%) and 75% (w = 33%). These tailings were not prepared at a lower SC as a decrease in SC (increase
in w) resulted in segregation of solids and water.
All unamended tailings, tailings-fly ash mixtures, and tailings-cement mixtures were tested in
consolidation rings with an inside diameter of 63.5 mm and height of 25.4 mm. All initial specimens were
in slurry form and poured into the consolidation rings. Following deposition of the slurried materials, all
consolidation rings were vibrated to promote air removal. Water content measurements were conducted
on remaining slurried material and were used in conjunction with final specimen dimensions and total
mass to determine initial dry density, void ratio, and saturation. All specimens within the consolidation
rings were sealed in polyethylene bags to prevent evaporation and allowed to cure for 0.1 day (2 hours), 7
days, and 28 days at a temperature of 25°C and relative humidity of approximately 100% as
recommended by Senol et al. (2006).
Consolidation rings containing the specimens were placed in oedometers after curing and low-weight
porous disks were placed on top of the specimens. The porous disks were machined from a single piece of
polyethylene and had a mass of 30-50 g that resulted in a low vertical stress (σ < 0.16 kPa) applied to the
specimen. These porous disks were effective for evaluating compression behavior of slurried materials.
Vertical deformation was recorded for all specimens and pore water pressure was measured for select
specimens. Vertical loads were applied incrementally every 24 hours following Method A in ASTM
D2435 (ASTM 2014).
An additional consolidation test series was performed to evaluate the effect of applied vertical effective
stress (σ'v) during curing on the compression behavior of fly ash-amended tailings. These tests were used
to simulate actual conditions that exist in CPB. Cemented-paste backfill is injected into mine cavities in
slurry form such that water expulsion due to loading and pozzolanic reactions that generate cementitious
bonds occur simultaneously.
Specimens prepared to evaluate the effect of σ'v during curing on compression behavior were prepared
identical to the previously described specimens. However, no lag time was allowed between specimen
preparation and application of σ'v. Applied vertical effective stresses of 10, 60, and 100 kPa were
achieved via an initial 10 kPa load applied immediately after specimen preparation and subsequent loads
approximately doubled every 15 min to allow excess pore water pressure dissipation. Thus, final σ'v = 60
kPa and 100 kPa were achieved in 45 and 60 minutes, respectively, following addition of binder to the
tailings slurry. The cementitious bonds generated from pozzolanic reactions initiate within 1 hr to 1 d at
standard temperature and pressure (Kurtis 2007; Pacheco-Torgal et al. 2014). Thus, all vertical loading in
this test series was targeted before cementitious bond formation initiated.
The applied loads were left in-place for 7 days and then all specimens were unloaded. Specimens
subsequently were loaded incrementally. Environmental conditions of temperature and humidity were
approximately similar between specimens cured with and without an applied σ'v. Specimens cured under
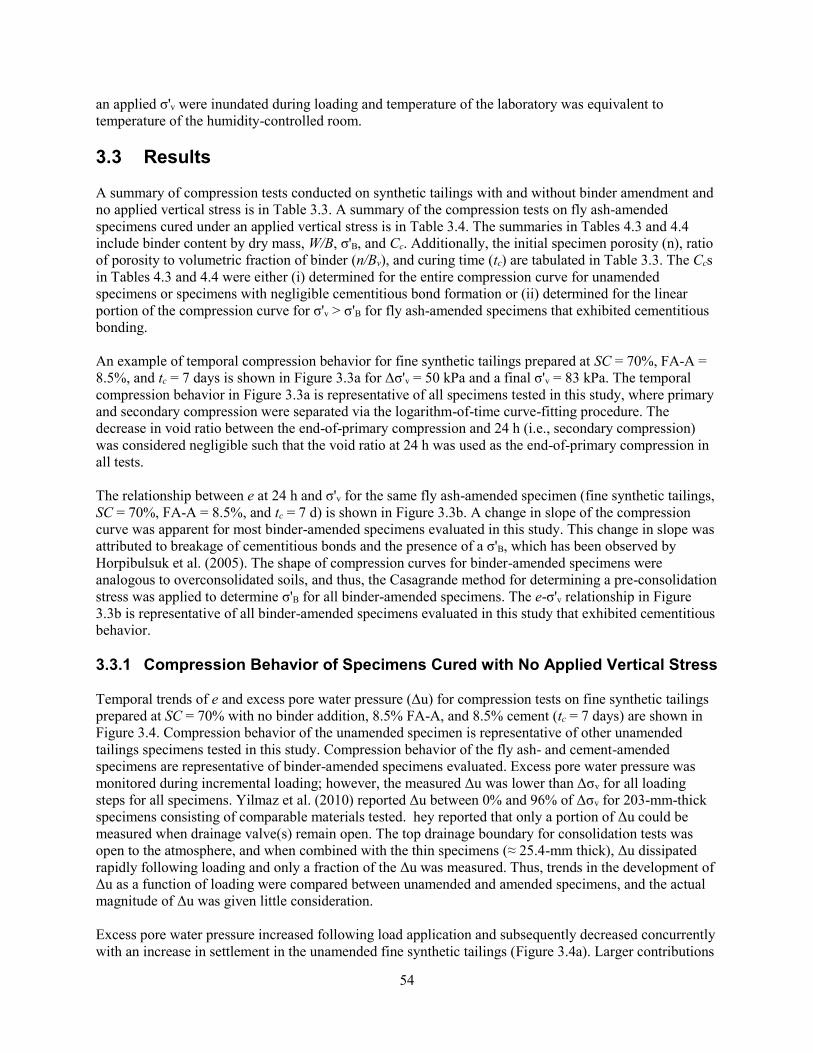
54
an applied σ'v were inundated during loading and temperature of the laboratory was equivalent to
temperature of the humidity-controlled room.
3.3 Results
A summary of compression tests conducted on synthetic tailings with and without binder amendment and
no applied vertical stress is in Table 3.3. A summary of the compression tests on fly ash-amended
specimens cured under an applied vertical stress is in Table 3.4. The summaries in Tables 4.3 and 4.4
include binder content by dry mass, W/B, σ'B, and Cc. Additionally, the initial specimen porosity (n), ratio
of porosity to volumetric fraction of binder (n/Bv), and curing time (tc) are tabulated in Table 3.3. The Ccs
in Tables 4.3 and 4.4 were either (i) determined for the entire compression curve for unamended
specimens or specimens with negligible cementitious bond formation or (ii) determined for the linear
portion of the compression curve for σ'v > σ'B for fly ash-amended specimens that exhibited cementitious
bonding.
An example of temporal compression behavior for fine synthetic tailings prepared at SC = 70%, FA-A =
8.5%, and tc = 7 days is shown in Figure 3.3a for Δσ'v = 50 kPa and a final σ'v = 83 kPa. The temporal
compression behavior in Figure 3.3a is representative of all specimens tested in this study, where primary
and secondary compression were separated via the logarithm-of-time curve-fitting procedure. The
decrease in void ratio between the end-of-primary compression and 24 h (i.e., secondary compression)
was considered negligible such that the void ratio at 24 h was used as the end-of-primary compression in
all tests.
The relationship between e at 24 h and σ'v for the same fly ash-amended specimen (fine synthetic tailings,
SC = 70%, FA-A = 8.5%, and tc = 7 d) is shown in Figure 3.3b. A change in slope of the compression
curve was apparent for most binder-amended specimens evaluated in this study. This change in slope was
attributed to breakage of cementitious bonds and the presence of a σ'B, which has been observed by
Horpibulsuk et al. (2005). The shape of compression curves for binder-amended specimens were
analogous to overconsolidated soils, and thus, the Casagrande method for determining a pre-consolidation
stress was applied to determine σ'B for all binder-amended specimens. The e-σ'v relationship in Figure
3.3b is representative of all binder-amended specimens evaluated in this study that exhibited cementitious
behavior.
3.3.1 Compression Behavior of Specimens Cured with No Applied Vertical Stress
Temporal trends of e and excess pore water pressure (Δu) for compression tests on fine synthetic tailings
prepared at SC = 70% with no binder addition, 8.5% FA-A, and 8.5% cement (tc = 7 days) are shown in
Figure 3.4. Compression behavior of the unamended specimen is representative of other unamended
tailings specimens tested in this study. Compression behavior of the fly ash- and cement-amended
specimens are representative of binder-amended specimens evaluated. Excess pore water pressure was
monitored during incremental loading; however, the measured Δu was lower than Δσv for all loading
steps for all specimens. Yilmaz et al. (2010) reported Δu between 0% and 96% of Δσv for 203-mm-thick
specimens consisting of comparable materials tested. hey reported that only a portion of Δu could be
measured when drainage valve(s) remain open. The top drainage boundary for consolidation tests was
open to the atmosphere, and when combined with the thin specimens (≈ 25.4-mm thick), Δu dissipated
rapidly following loading and only a fraction of the Δu was measured. Thus, trends in the development of
Δu as a function of loading were compared between unamended and amended specimens, and the actual
magnitude of Δu was given little consideration.
Excess pore water pressure increased following load application and subsequently decreased concurrently
with an increase in settlement in the unamended fine synthetic tailings (Figure 3.4a). Larger contributions
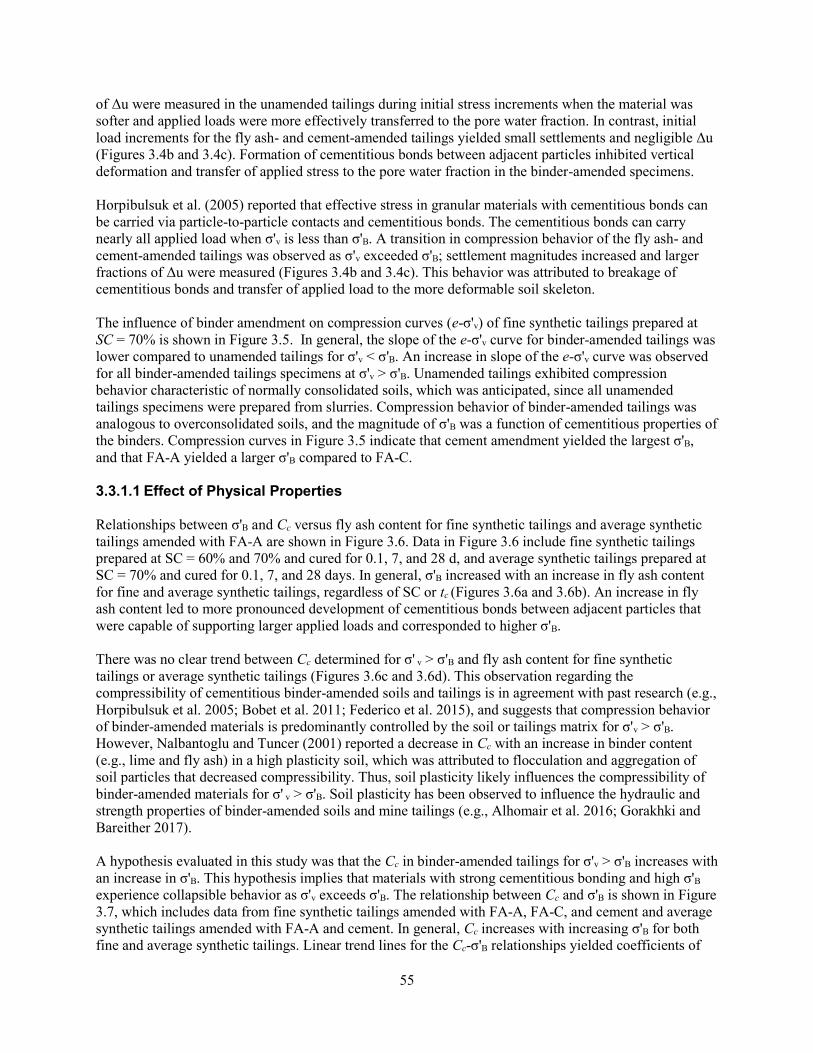
55
of Δu were measured in the unamended tailings during initial stress increments when the material was
softer and applied loads were more effectively transferred to the pore water fraction. In contrast, initial
load increments for the fly ash- and cement-amended tailings yielded small settlements and negligible Δu
(Figures 3.4b and 3.4c). Formation of cementitious bonds between adjacent particles inhibited vertical
deformation and transfer of applied stress to the pore water fraction in the binder-amended specimens.
Horpibulsuk et al. (2005) reported that effective stress in granular materials with cementitious bonds can
be carried via particle-to-particle contacts and cementitious bonds. The cementitious bonds can carry
nearly all applied load when σ'v is less than σ'B. A transition in compression behavior of the fly ash- and
cement-amended tailings was observed as σ'v exceeded σ'B; settlement magnitudes increased and larger
fractions of Δu were measured (Figures 3.4b and 3.4c). This behavior was attributed to breakage of
cementitious bonds and transfer of applied load to the more deformable soil skeleton.
The influence of binder amendment on compression curves (e-σ'v) of fine synthetic tailings prepared at
SC = 70% is shown in Figure 3.5. In general, the slope of the e-σ'v curve for binder-amended tailings was
lower compared to unamended tailings for σ'v < σ'B. An increase in slope of the e-σ'v curve was observed
for all binder-amended tailings specimens at σ'v > σ'B. Unamended tailings exhibited compression
behavior characteristic of normally consolidated soils, which was anticipated, since all unamended
tailings specimens were prepared from slurries. Compression behavior of binder-amended tailings was
analogous to overconsolidated soils, and the magnitude of σ'B was a function of cementitious properties of
the binders. Compression curves in Figure 3.5 indicate that cement amendment yielded the largest σ'B,
and that FA-A yielded a larger σ'B compared to FA-C.
3.3.1.1 Effect of Physical Properties
Relationships between σ'B and Cc versus fly ash content for fine synthetic tailings and average synthetic
tailings amended with FA-A are shown in Figure 3.6. Data in Figure 3.6 include fine synthetic tailings
prepared at SC = 60% and 70% and cured for 0.1, 7, and 28 d, and average synthetic tailings prepared at
SC = 70% and cured for 0.1, 7, and 28 days. In general, σ'B increased with an increase in fly ash content
for fine and average synthetic tailings, regardless of SC or tc (Figures 3.6a and 3.6b). An increase in fly
ash content led to more pronounced development of cementitious bonds between adjacent particles that
were capable of supporting larger applied loads and corresponded to higher σ'B.
There was no clear trend between Cc determined for σ' v > σ'B and fly ash content for fine synthetic
tailings or average synthetic tailings (Figures 3.6c and 3.6d). This observation regarding the
compressibility of cementitious binder-amended soils and tailings is in agreement with past research (e.g.,
Horpibulsuk et al. 2005; Bobet et al. 2011; Federico et al. 2015), and suggests that compression behavior
of binder-amended materials is predominantly controlled by the soil or tailings matrix for σ'v > σ'B.
However, Nalbantoglu and Tuncer (2001) reported a decrease in Cc with an increase in binder content
(e.g., lime and fly ash) in a high plasticity soil, which was attributed to flocculation and aggregation of
soil particles that decreased compressibility. Thus, soil plasticity likely influences the compressibility of
binder-amended materials for σ' v > σ'B. Soil plasticity has been observed to influence the hydraulic and
strength properties of binder-amended soils and mine tailings (e.g., Alhomair et al. 2016; Gorakhki and
Bareither 2017).
A hypothesis evaluated in this study was that the Cc in binder-amended tailings for σ'v > σ'B increases with
an increase in σ'B. This hypothesis implies that materials with strong cementitious bonding and high σ'B
experience collapsible behavior as σ'v exceeds σ'B. The relationship between Cc and σ'B is shown in Figure
3.7, which includes data from fine synthetic tailings amended with FA-A, FA-C, and cement and average
synthetic tailings amended with FA-A and cement. In general, Cc increases with increasing σ'B for both
fine and average synthetic tailings. Linear trend lines for the Cc-σ'B relationships yielded coefficients of
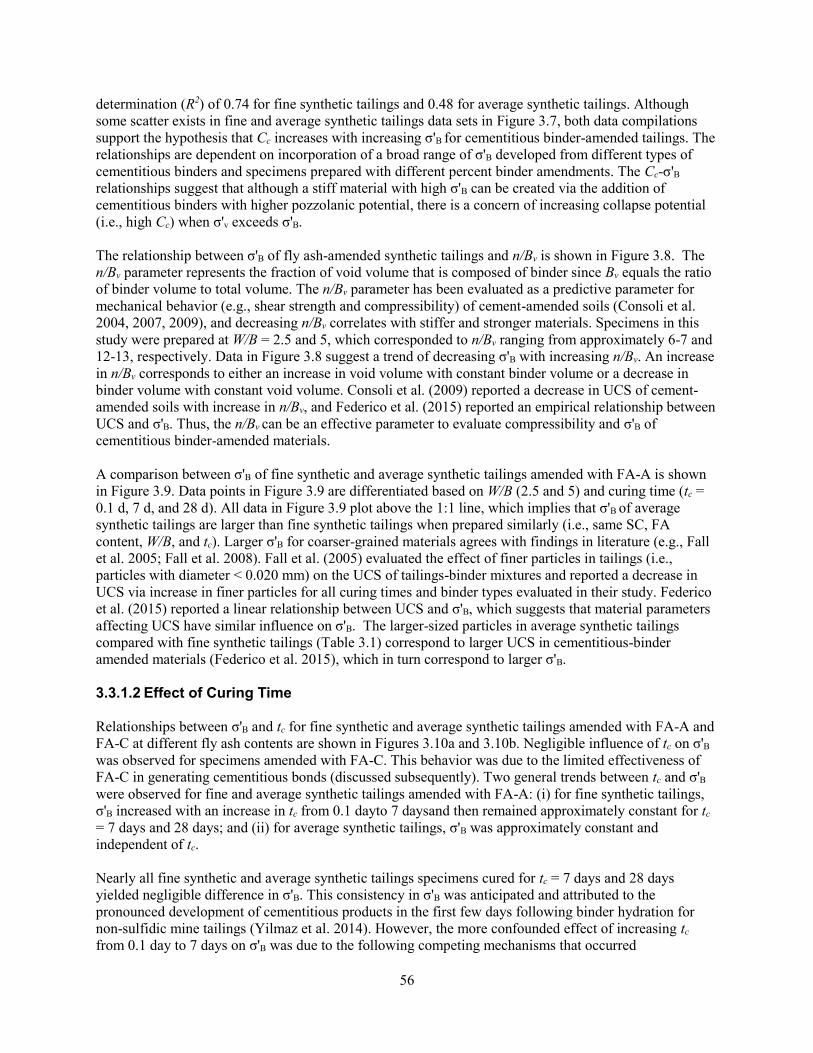
56
determination (R2) of 0.74 for fine synthetic tailings and 0.48 for average synthetic tailings. Although
some scatter exists in fine and average synthetic tailings data sets in Figure 3.7, both data compilations
support the hypothesis that Cc increases with increasing σ'B for cementitious binder-amended tailings. The
relationships are dependent on incorporation of a broad range of σ'B developed from different types of
cementitious binders and specimens prepared with different percent binder amendments. The Cc-σ'B
relationships suggest that although a stiff material with high σ'B can be created via the addition of
cementitious binders with higher pozzolanic potential, there is a concern of increasing collapse potential
(i.e., high Cc) when σ'v exceeds σ'B.
The relationship between σ'B of fly ash-amended synthetic tailings and n/Bv is shown in Figure 3.8. The
n/Bv parameter represents the fraction of void volume that is composed of binder since Bv equals the ratio
of binder volume to total volume. The n/Bv parameter has been evaluated as a predictive parameter for
mechanical behavior (e.g., shear strength and compressibility) of cement-amended soils (Consoli et al.
2004, 2007, 2009), and decreasing n/Bv correlates with stiffer and stronger materials. Specimens in this
study were prepared at W/B = 2.5 and 5, which corresponded to n/Bv ranging from approximately 6-7 and
12-13, respectively. Data in Figure 3.8 suggest a trend of decreasing σ'B with increasing n/Bv. An increase
in n/Bv corresponds to either an increase in void volume with constant binder volume or a decrease in
binder volume with constant void volume. Consoli et al. (2009) reported a decrease in UCS of cement-
amended soils with increase in n/Bv, and Federico et al. (2015) reported an empirical relationship between
UCS and σ'B. Thus, the n/Bv can be an effective parameter to evaluate compressibility and σ'B of
cementitious binder-amended materials.
A comparison between σ'B of fine synthetic and average synthetic tailings amended with FA-A is shown
in Figure 3.9. Data points in Figure 3.9 are differentiated based on W/B (2.5 and 5) and curing time (tc =
0.1 d, 7 d, and 28 d). All data in Figure 3.9 plot above the 1:1 line, which implies that σ'B of average
synthetic tailings are larger than fine synthetic tailings when prepared similarly (i.e., same SC, FA
content, W/B, and tc). Larger σ'B for coarser-grained materials agrees with findings in literature (e.g., Fall
et al. 2005; Fall et al. 2008). Fall et al. (2005) evaluated the effect of finer particles in tailings (i.e.,
particles with diameter < 0.020 mm) on the UCS of tailings-binder mixtures and reported a decrease in
UCS via increase in finer particles for all curing times and binder types evaluated in their study. Federico
et al. (2015) reported a linear relationship between UCS and σ'B, which suggests that material parameters
affecting UCS have similar influence on σ'B. The larger-sized particles in average synthetic tailings
compared with fine synthetic tailings (Table 3.1) correspond to larger UCS in cementitious-binder
amended materials (Federico et al. 2015), which in turn correspond to larger σ'B.
3.3.1.2 Effect of Curing Time
Relationships between σ'B and tc for fine synthetic and average synthetic tailings amended with FA-A and
FA-C at different fly ash contents are shown in Figures 3.10a and 3.10b. Negligible influence of tc on σ'B
was observed for specimens amended with FA-C. This behavior was due to the limited effectiveness of
FA-C in generating cementitious bonds (discussed subsequently). Two general trends between tc and σ'B
were observed for fine and average synthetic tailings amended with FA-A: (i) for fine synthetic tailings,
σ'B increased with an increase in tc from 0.1 dayto 7 daysand then remained approximately constant for tc
= 7 days and 28 days; and (ii) for average synthetic tailings, σ'B was approximately constant and
independent of tc.
Nearly all fine synthetic and average synthetic tailings specimens cured for tc = 7 days and 28 days
yielded negligible difference in σ'B. This consistency in σ'B was anticipated and attributed to the
pronounced development of cementitious products in the first few days following binder hydration for
non-sulfidic mine tailings (Yilmaz et al. 2014). However, the more confounded effect of increasing tc
from 0.1 day to 7 days on σ'B was due to the following competing mechanisms that occurred
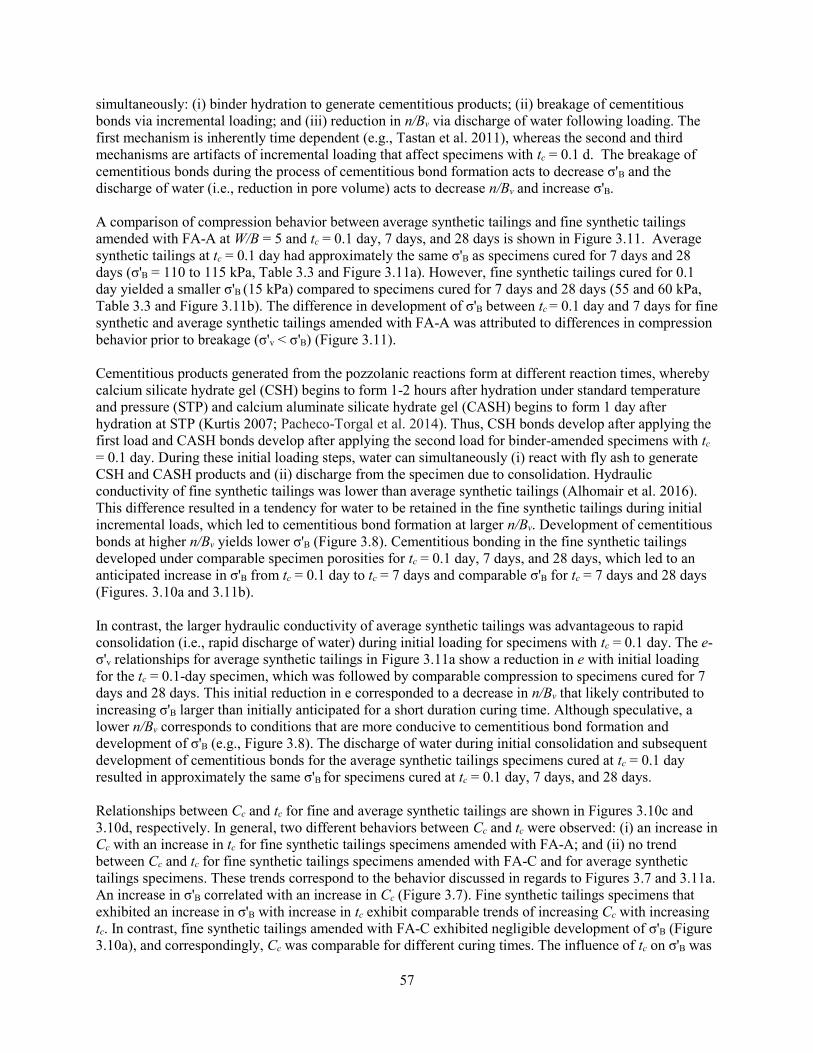
57
simultaneously: (i) binder hydration to generate cementitious products; (ii) breakage of cementitious
bonds via incremental loading; and (iii) reduction in n/Bv via discharge of water following loading. The
first mechanism is inherently time dependent (e.g., Tastan et al. 2011), whereas the second and third
mechanisms are artifacts of incremental loading that affect specimens with tc = 0.1 d. The breakage of
cementitious bonds during the process of cementitious bond formation acts to decrease σ'B and the
discharge of water (i.e., reduction in pore volume) acts to decrease n/Bv and increase σ'B.
A comparison of compression behavior between average synthetic tailings and fine synthetic tailings
amended with FA-A at W/B = 5 and tc = 0.1 day, 7 days, and 28 days is shown in Figure 3.11. Average
synthetic tailings at tc = 0.1 day had approximately the same σ'B as specimens cured for 7 days and 28
days (σ'B = 110 to 115 kPa, Table 3.3 and Figure 3.11a). However, fine synthetic tailings cured for 0.1
day yielded a smaller σ'B (15 kPa) compared to specimens cured for 7 days and 28 days (55 and 60 kPa,
Table 3.3 and Figure 3.11b). The difference in development of σ'B between tc = 0.1 day and 7 days for fine
synthetic and average synthetic tailings amended with FA-A was attributed to differences in compression
behavior prior to breakage (σ'v < σ'B) (Figure 3.11).
Cementitious products generated from the pozzolanic reactions form at different reaction times, whereby
calcium silicate hydrate gel (CSH) begins to form 1-2 hours after hydration under standard temperature
and pressure (STP) and calcium aluminate silicate hydrate gel (CASH) begins to form 1 day after
hydration at STP (Kurtis 2007; Pacheco-Torgal et al. 2014). Thus, CSH bonds develop after applying the
first load and CASH bonds develop after applying the second load for binder-amended specimens with tc
= 0.1 day. During these initial loading steps, water can simultaneously (i) react with fly ash to generate
CSH and CASH products and (ii) discharge from the specimen due to consolidation. Hydraulic
conductivity of fine synthetic tailings was lower than average synthetic tailings (Alhomair et al. 2016).
This difference resulted in a tendency for water to be retained in the fine synthetic tailings during initial
incremental loads, which led to cementitious bond formation at larger n/Bv. Development of cementitious
bonds at higher n/Bv yields lower σ'B (Figure 3.8). Cementitious bonding in the fine synthetic tailings
developed under comparable specimen porosities for tc = 0.1 day, 7 days, and 28 days, which led to an
anticipated increase in σ'B from tc = 0.1 day to tc = 7 days and comparable σ'B for tc = 7 days and 28 days
(Figures. 3.10a and 3.11b).
In contrast, the larger hydraulic conductivity of average synthetic tailings was advantageous to rapid
consolidation (i.e., rapid discharge of water) during initial loading for specimens with tc = 0.1 day. The e-
σ'v relationships for average synthetic tailings in Figure 3.11a show a reduction in e with initial loading
for the tc = 0.1-day specimen, which was followed by comparable compression to specimens cured for 7
days and 28 days. This initial reduction in e corresponded to a decrease in n/Bv that likely contributed to
increasing σ'B larger than initially anticipated for a short duration curing time. Although speculative, a
lower n/Bv corresponds to conditions that are more conducive to cementitious bond formation and
development of σ'B (e.g., Figure 3.8). The discharge of water during initial consolidation and subsequent
development of cementitious bonds for the average synthetic tailings specimens cured at tc = 0.1 day
resulted in approximately the same σ'B for specimens cured at tc = 0.1 day, 7 days, and 28 days.
Relationships between Cc and tc for fine and average synthetic tailings are shown in Figures 3.10c and
3.10d, respectively. In general, two different behaviors between Cc and tc were observed: (i) an increase in
Cc with an increase in tc for fine synthetic tailings specimens amended with FA-A; and (ii) no trend
between Cc and tc for fine synthetic tailings specimens amended with FA-C and for average synthetic
tailings specimens. These trends correspond to the behavior discussed in regards to Figures 3.7 and 3.11a.
An increase in σ'B correlated with an increase in Cc (Figure 3.7). Fine synthetic tailings specimens that
exhibited an increase in σ'B with increase in tc exhibit comparable trends of increasing Cc with increasing
tc. In contrast, fine synthetic tailings amended with FA-C exhibited negligible development of σ'B (Figure
3.10a), and correspondingly, Cc was comparable for different curing times. The influence of tc on σ'B was

58
confounded by competing mechanisms of specimen consolidation and binder hydration (discussed
previously); no definitive trends between Cc and tc were observed for average synthetic tailings (Figure
3.11b). Further investigation is needed to evaluate the effect of curing time on compressibility behavior of
mine tailings, particularly for σ'v > σ'B.
3.3.1.3 Effect of Fly Ash Chemical Composition
Comparison between σ'B for fine and average synthetic tailings amended with FA-A and FA-C are shown
in Figure 3.12a. Data in Figure 3.12 are differentiated based on W/B (2.5 and 5) and curing time (0.1 day,
7 days, and 28 days). Fine and average synthetic tailings prepared at SC = 60% and amended with FA-C
did not exhibit a σ'B, which is why the majority of data in Figure 3.12a plot along the x-axis. Although
some synthetic tailings specimens prepared at SC = 70% and amended with FA-C exhibited a σ'B, all data
in Figure 3.12a plot below the 1:1 line. This contrast in σ'B between FA-A and FA-C was attributed to
greater pozzolanic potential of FA-A, which was observed in regard to the position of each fly ash in the
ternary plot in Figure 3.2. FA-A plotted between Portland cement and typical fly ash, whereas FA-C
plotted in the range of typical fly ash. The higher CaO and larger CaO/SiO2 of FA-A in comparison with
FA-C resulted in more pronounced generation of cementitious bonds. This pozzolanic behavior has been
observed in previous research (e.g., Janz and Johnson 2002; Tastan et al. 2011).
The effect of fly ash type on Cc of fine and average synthetic tailings specimens prepared with similar
initial conditions is shown in Figure 3.12b. Although the majority of the data plot close to 1:1 line, the
data indicate that Cc for tailings amended with FA-A were larger than Cc for tailings amended with FA-C.
This observation is attributed to more favorable pozzolanic potential of FA-A that led to larger σ'B and
subsequently larger Cc for σ'v > σ'B. The data points that plot furthest from the 1:1 line are for fine
synthetic tailings amended with 27% fly ash and cured for 7 days and 28 days. These two specimens
yielded high σ'B when amended with FA-A (σ'B = 90 and 100 kPa) and σ'B = 0 kPa when amended with
FA-C.
3.3.2 Compression Behavior for Specimens Cured Under Applied Vertical Stress
The compression analysis for fly ash-amended materials cured under an applied vertical load included
both fine and average synthetic tailings (Table 3.4). The fine synthetic tailings specimens were prepared
at SC = 60%, amended with 13% FA-A (W/B = 5), and cured under σ'v = 0, 10, 60, and 100 kPa (Table
3.4). This range of σ'v is representative of tailings-fly ash mixtures at depths between 0 m to 18 m in a
saturated tailings deposit. The average synthetic tailings specimens were prepared at SC = 70%, amended
with 17 % FA-A (W/B = 2.5), and cured under σv = 0, 10, and 60 kPa (Table 3.4). This range of σ'v is
representative of tailings-fly ash mixtures at depths between 0 m to 9 m within a saturated tailings
deposit.
The e-σ'v relationships for fine synthetic tailings and average synthetic tailings cured for tc = 7 days under
different σ'v are shown in Figures 3.13a and 3.13b. The initial e plotted in Figures 3.13a and 3.13b for the
lowest σ'v correspond to the e after curing for 7 days and subsequently unloading the specimens. Vertical
stress was applied on each specimen within 1 hour following mixing and preparation of the specimens.
This short duration of loading was achieved prior to formation of cementitious bonds and resulted in
compression and expulsion of pore water. As expected, all specimens compressed under an applied σ'v
such that the initial e after curing decreased with increase in σ'v. Limited compression was observed for
all fine and average synthetic tailings specimens for the first load increment, which supports the
development of σ'B in all specimens.
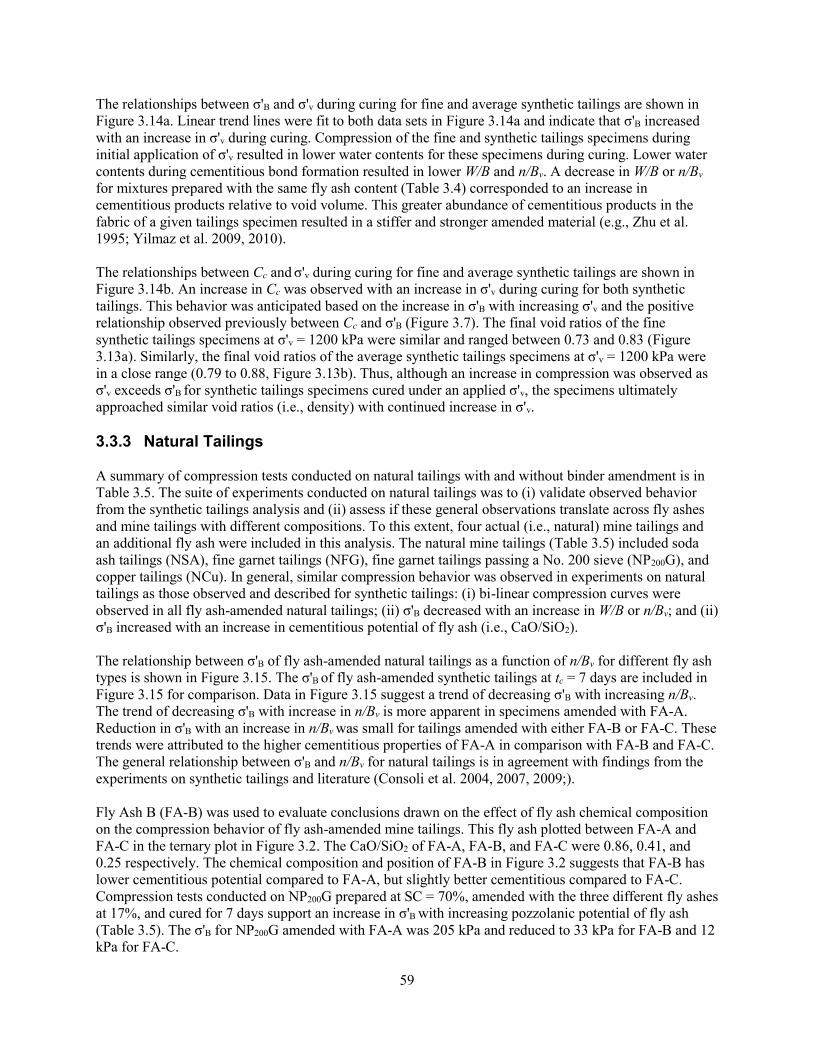
59
The relationships between σ'B and σ'v during curing for fine and average synthetic tailings are shown in
Figure 3.14a. Linear trend lines were fit to both data sets in Figure 3.14a and indicate that σ'B increased
with an increase in σ'v during curing. Compression of the fine and synthetic tailings specimens during
initial application of σ'v resulted in lower water contents for these specimens during curing. Lower water
contents during cementitious bond formation resulted in lower W/B and n/Bv. A decrease in W/B or n/Bv
for mixtures prepared with the same fly ash content (Table 3.4) corresponded to an increase in
cementitious products relative to void volume. This greater abundance of cementitious products in the
fabric of a given tailings specimen resulted in a stiffer and stronger amended material (e.g., Zhu et al.
1995; Yilmaz et al. 2009, 2010).
The relationships between Cc and σ'v during curing for fine and average synthetic tailings are shown in
Figure 3.14b. An increase in Cc was observed with an increase in σ'v during curing for both synthetic
tailings. This behavior was anticipated based on the increase in σ'B with increasing σ'v and the positive
relationship observed previously between Cc and σ'B (Figure 3.7). The final void ratios of the fine
synthetic tailings specimens at σ'v = 1200 kPa were similar and ranged between 0.73 and 0.83 (Figure
3.13a). Similarly, the final void ratios of the average synthetic tailings specimens at σ'v = 1200 kPa were
in a close range (0.79 to 0.88, Figure 3.13b). Thus, although an increase in compression was observed as
σ'v exceeds σ'B for synthetic tailings specimens cured under an applied σ'v, the specimens ultimately
approached similar void ratios (i.e., density) with continued increase in σ'v.
3.3.3 Natural Tailings
A summary of compression tests conducted on natural tailings with and without binder amendment is in
Table 3.5. The suite of experiments conducted on natural tailings was to (i) validate observed behavior
from the synthetic tailings analysis and (ii) assess if these general observations translate across fly ashes
and mine tailings with different compositions. To this extent, four actual (i.e., natural) mine tailings and
an additional fly ash were included in this analysis. The natural mine tailings (Table 3.5) included soda
ash tailings (NSA), fine garnet tailings (NFG), fine garnet tailings passing a No. 200 sieve (NP200G), and
copper tailings (NCu). In general, similar compression behavior was observed in experiments on natural
tailings as those observed and described for synthetic tailings: (i) bi-linear compression curves were
observed in all fly ash-amended natural tailings; (ii) σ'B decreased with an increase in W/B or n/Bv; and (ii)
σ'B increased with an increase in cementitious potential of fly ash (i.e., CaO/SiO2).
The relationship between σ'B of fly ash-amended natural tailings as a function of n/Bv for different fly ash
types is shown in Figure 3.15. The σ'B of fly ash-amended synthetic tailings at tc = 7 days are included in
Figure 3.15 for comparison. Data in Figure 3.15 suggest a trend of decreasing σ'B with increasing n/Bv.
The trend of decreasing σ'B with increase in n/Bv is more apparent in specimens amended with FA-A.
Reduction in σ'B with an increase in n/Bv was small for tailings amended with either FA-B or FA-C. These
trends were attributed to the higher cementitious properties of FA-A in comparison with FA-B and FA-C.
The general relationship between σ'B and n/Bv for natural tailings is in agreement with findings from the
experiments on synthetic tailings and literature (Consoli et al. 2004, 2007, 2009;).
Fly Ash B (FA-B) was used to evaluate conclusions drawn on the effect of fly ash chemical composition
on the compression behavior of fly ash-amended mine tailings. This fly ash plotted between FA-A and
FA-C in the ternary plot in Figure 3.2. The CaO/SiO2 of FA-A, FA-B, and FA-C were 0.86, 0.41, and
0.25 respectively. The chemical composition and position of FA-B in Figure 3.2 suggests that FA-B has
lower cementitious potential compared to FA-A, but slightly better cementitious compared to FA-C.
Compression tests conducted on NP200G prepared at SC = 70%, amended with the three different fly ashes
at 17%, and cured for 7 days support an increase in σ'B with increasing pozzolanic potential of fly ash
(Table 3.5). The σ'B for NP200G amended with FA-A was 205 kPa and reduced to 33 kPa for FA-B and 12
kPa for FA-C.
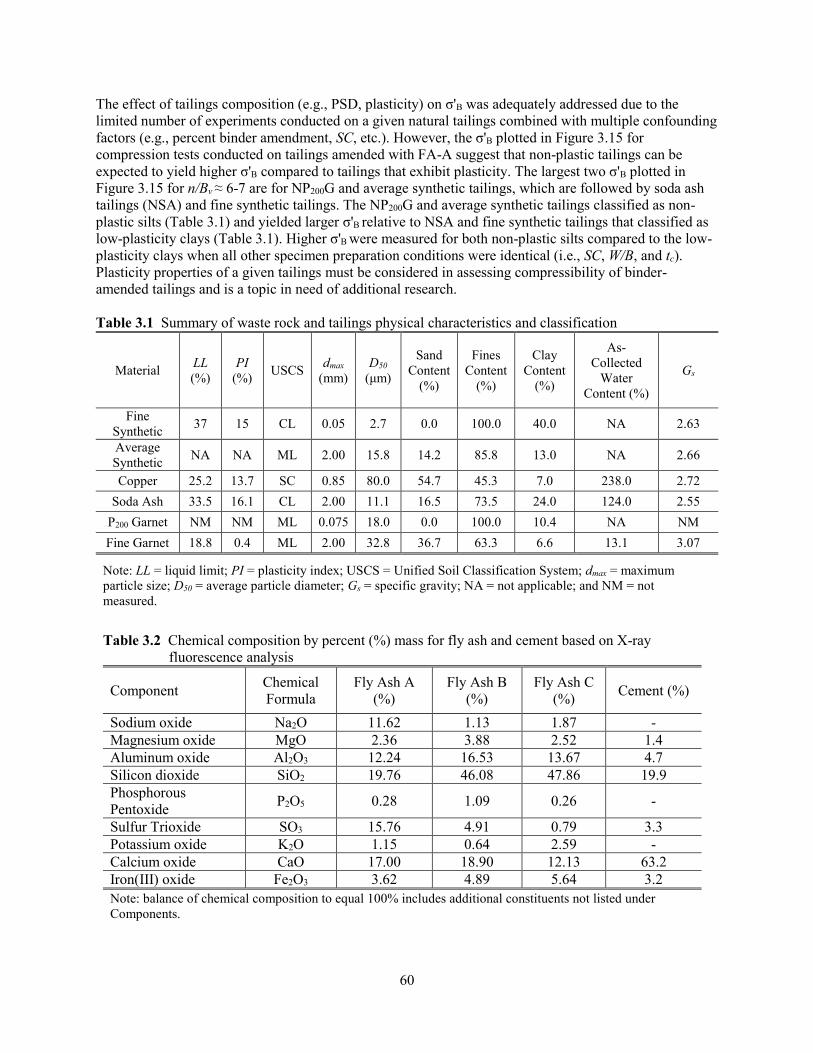
60
The effect of tailings composition (e.g., PSD, plasticity) on σ'B was adequately addressed due to the
limited number of experiments conducted on a given natural tailings combined with multiple confounding
factors (e.g., percent binder amendment, SC, etc.). However, the σ'B plotted in Figure 3.15 for
compression tests conducted on tailings amended with FA-A suggest that non-plastic tailings can be
expected to yield higher σ'B compared to tailings that exhibit plasticity. The largest two σ'B plotted in
Figure 3.15 for n/Bv ≈ 6-7 are for NP200G and average synthetic tailings, which are followed by soda ash
tailings (NSA) and fine synthetic tailings. The NP200G and average synthetic tailings classified as non-
plastic silts (Table 3.1) and yielded larger σ'B relative to NSA and fine synthetic tailings that classified as
low-plasticity clays (Table 3.1). Higher σ'B were measured for both non-plastic silts compared to the low-
plasticity clays when all other specimen preparation conditions were identical (i.e., SC, W/B, and tc).
Plasticity properties of a given tailings must be considered in assessing compressibility of binder-
amended tailings and is a topic in need of additional research.
Table 3.1 Summary of waste rock and tailings physical characteristics and classification
Material LL
(%)
PI
(%) USCS
dmax
(mm)
D50
(μm)
Sand
Content
(%)
Fines
Content
(%)
Clay
Content
(%)
As-
Collected
Water
Content (%)
Gs
Fine
Synthetic 37 15 CL 0.05 2.7 0.0 100.0 40.0 NA 2.63
Average
Synthetic NA NA ML 2.00 15.8 14.2 85.8 13.0 NA 2.66
Copper 25.2 13.7 SC 0.85 80.0 54.7 45.3 7.0 238.0 2.72
Soda Ash 33.5 16.1 CL 2.00 11.1 16.5 73.5 24.0 124.0 2.55
P200 Garnet NM NM ML 0.075 18.0 0.0 100.0 10.4 NA NM
Fine Garnet 18.8 0.4 ML 2.00 32.8 36.7 63.3 6.6 13.1 3.07
Note: LL = liquid limit; PI = plasticity index; USCS = Unified Soil Classification System; dmax = maximum
particle size; D50 = average particle diameter; Gs = specific gravity; NA = not applicable; and NM = not
measured.
Table 3.2 Chemical composition by percent (%) mass for fly ash and cement based on X-ray
fluorescence analysis
Component Chemical
Formula
Fly Ash A
(%)
Fly Ash B
(%)
Fly Ash C
(%) Cement (%)
Sodium oxide Na2O 11.62 1.13 1.87 -
Magnesium oxide MgO 2.36 3.88 2.52 1.4
Aluminum oxide Al2O3 12.24 16.53 13.67 4.7
Silicon dioxide SiO2 19.76 46.08 47.86 19.9
Phosphorous
Pentoxide P2O5 0.28 1.09 0.26 -
Sulfur Trioxide SO3 15.76 4.91 0.79 3.3
Potassium oxide K2O 1.15 0.64 2.59 -
Calcium oxide CaO 17.00 18.90 12.13 63.2
Iron(III) oxide Fe2O3 3.62 4.89 5.64 3.2
Note: balance of chemical composition to equal 100% includes additional constituents not listed under
Components.
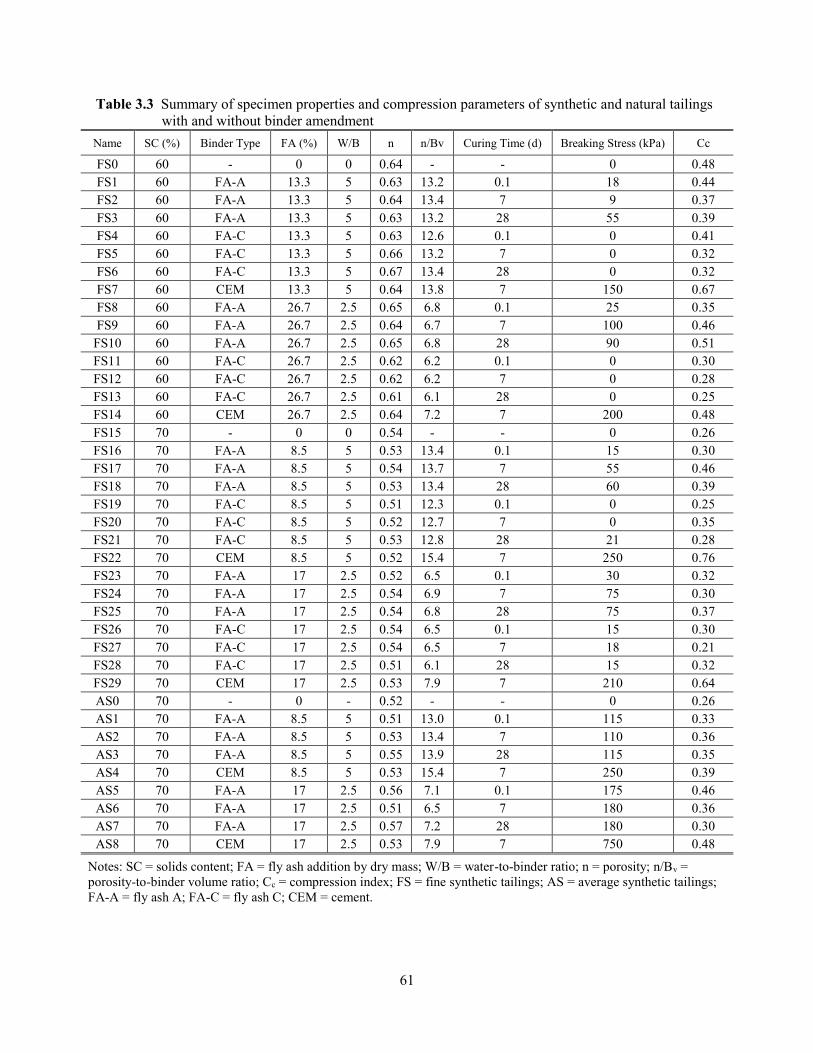
61
Table 3.3 Summary of specimen properties and compression parameters of synthetic and natural tailings
with and without binder amendment
Name SC (%) Binder Type FA (%) W/B n n/Bv Curing Time (d) Breaking Stress (kPa) Cc
FS0 60 - 0 0 0.64 - - 0 0.48
FS1 60 FA-A 13.3 5 0.63 13.2 0.1 18 0.44
FS2 60 FA-A 13.3 5 0.64 13.4 7 9 0.37
FS3 60 FA-A 13.3 5 0.63 13.2 28 55 0.39
FS4 60 FA-C 13.3 5 0.63 12.6 0.1 0 0.41
FS5 60 FA-C 13.3 5 0.66 13.2 7 0 0.32
FS6 60 FA-C 13.3 5 0.67 13.4 28 0 0.32
FS7 60 CEM 13.3 5 0.64 13.8 7 150 0.67
FS8 60 FA-A 26.7 2.5 0.65 6.8 0.1 25 0.35
FS9 60 FA-A 26.7 2.5 0.64 6.7 7 100 0.46
FS10 60 FA-A 26.7 2.5 0.65 6.8 28 90 0.51
FS11 60 FA-C 26.7 2.5 0.62 6.2 0.1 0 0.30
FS12 60 FA-C 26.7 2.5 0.62 6.2 7 0 0.28
FS13 60 FA-C 26.7 2.5 0.61 6.1 28 0 0.25
FS14 60 CEM 26.7 2.5 0.64 7.2 7 200 0.48
FS15 70 - 0 0 0.54 - - 0 0.26
FS16 70 FA-A 8.5 5 0.53 13.4 0.1 15 0.30
FS17 70 FA-A 8.5 5 0.54 13.7 7 55 0.46
FS18 70 FA-A 8.5 5 0.53 13.4 28 60 0.39
FS19 70 FA-C 8.5 5 0.51 12.3 0.1 0 0.25
FS20 70 FA-C 8.5 5 0.52 12.7 7 0 0.35
FS21 70 FA-C 8.5 5 0.53 12.8 28 21 0.28
FS22 70 CEM 8.5 5 0.52 15.4 7 250 0.76
FS23 70 FA-A 17 2.5 0.52 6.5 0.1 30 0.32
FS24 70 FA-A 17 2.5 0.54 6.9 7 75 0.30
FS25 70 FA-A 17 2.5 0.54 6.8 28 75 0.37
FS26 70 FA-C 17 2.5 0.54 6.5 0.1 15 0.30
FS27 70 FA-C 17 2.5 0.54 6.5 7 18 0.21
FS28 70 FA-C 17 2.5 0.51 6.1 28 15 0.32
FS29 70 CEM 17 2.5 0.53 7.9 7 210 0.64
AS0 70 - 0 - 0.52 - - 0 0.26
AS1 70 FA-A 8.5 5 0.51 13.0 0.1 115 0.33
AS2 70 FA-A 8.5 5 0.53 13.4 7 110 0.36
AS3 70 FA-A 8.5 5 0.55 13.9 28 115 0.35
AS4 70 CEM 8.5 5 0.53 15.4 7 250 0.39
AS5 70 FA-A 17 2.5 0.56 7.1 0.1 175 0.46
AS6 70 FA-A 17 2.5 0.51 6.5 7 180 0.36
AS7 70 FA-A 17 2.5 0.57 7.2 28 180 0.30
AS8 70 CEM 17 2.5 0.53 7.9 7 750 0.48
Notes: SC = solids content; FA = fly ash addition by dry mass; W/B = water-to-binder ratio; n = porosity; n/Bv =
porosity-to-binder volume ratio; Cc = compression index; FS = fine synthetic tailings; AS = average synthetic tailings;
FA-A = fly ash A; FA-C = fly ash C; CEM = cement.
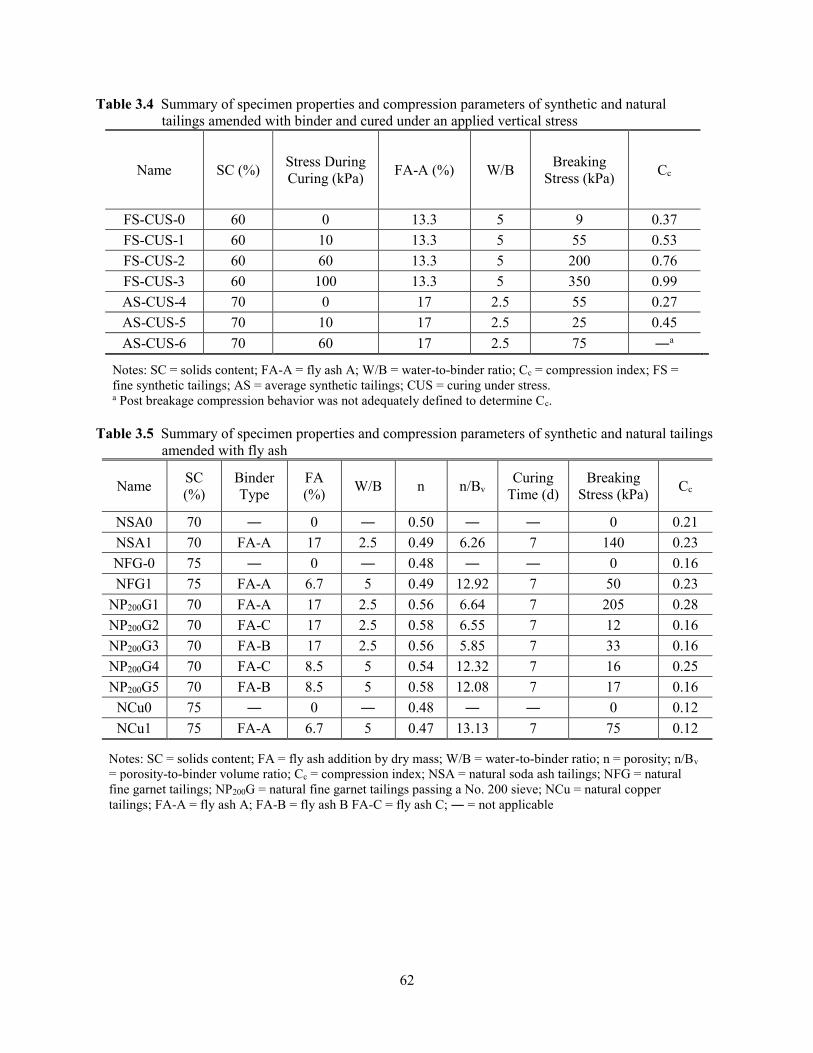
62
Table 3.4 Summary of specimen properties and compression parameters of synthetic and natural
tailings amended with binder and cured under an applied vertical stress
Name SC (%) Stress During
Curing (kPa) FA-A (%) W/B
Breaking
Stress (kPa) Cc
FS-CUS-0 60 0 13.3 5 9 0.37
FS-CUS-1 60 10 13.3 5 55 0.53
FS-CUS-2 60 60 13.3 5 200 0.76
FS-CUS-3 60 100 13.3 5 350 0.99
AS-CUS-4 70 0 17 2.5 55 0.27
AS-CUS-5 70 10 17 2.5 25 0.45
AS-CUS-6 70 60 17 2.5 75 ―a
Notes: SC = solids content; FA-A = fly ash A; W/B = water-to-binder ratio; Cc = compression index; FS =
fine synthetic tailings; AS = average synthetic tailings; CUS = curing under stress. a Post breakage compression behavior was not adequately defined to determine Cc.
Table 3.5 Summary of specimen properties and compression parameters of synthetic and natural tailings
amended with fly ash
Name SC
(%)
Binder
Type
FA
(%) W/B n n/Bv
Curing
Time (d)
Breaking
Stress (kPa) Cc
NSA0 70 ― 0 ― 0.50 ― ― 0 0.21
NSA1 70 FA-A 17 2.5 0.49 6.26 7 140 0.23
NFG-0 75 ― 0 ― 0.48 ― ― 0 0.16
NFG1 75 FA-A 6.7 5 0.49 12.92 7 50 0.23
NP200G1 70 FA-A 17 2.5 0.56 6.64 7 205 0.28
NP200G2 70 FA-C 17 2.5 0.58 6.55 7 12 0.16
NP200G3 70 FA-B 17 2.5 0.56 5.85 7 33 0.16
NP200G4 70 FA-C 8.5 5 0.54 12.32 7 16 0.25
NP200G5 70 FA-B 8.5 5 0.58 12.08 7 17 0.16
NCu0 75 ― 0 ― 0.48 ― ― 0 0.12
NCu1 75 FA-A 6.7 5 0.47 13.13 7 75 0.12
Notes: SC = solids content; FA = fly ash addition by dry mass; W/B = water-to-binder ratio; n = porosity; n/Bv
= porosity-to-binder volume ratio; Cc = compression index; NSA = natural soda ash tailings; NFG = natural
fine garnet tailings; NP200G = natural fine garnet tailings passing a No. 200 sieve; NCu = natural copper
tailings; FA-A = fly ash A; FA-B = fly ash B FA-C = fly ash C; ― = not applicable

63
0
20
40
60
80
100
Tailings Upper
Tailings Lower
Tailings Average
Average Synthetic Tailings
Fine Synthetic Tailings
Perc
ent P
assin
g (
%)
(a)
0
20
40
60
80
100
0.0010.010.1110
Fine-GarnetCopper Soda AshP200-Garnet
Tailings UpperTailings LowerTailings Average
Pe
rcen
t P
assin
g (
%)
Particle Size (mm)
(b)
Figure 3.1 Particle-size-distribution of compiled range and average particle-size distributions for mine
tailings compiled from Qiu and Sego (2001), Morris and Williams (2005), Khalili et al.
(2005), Wickland and Wilson (2005), Wickland et al. (2006) Bussière (2007), Khalili et al.
(2010), and Wickland et al. (2011), (a) synthetic tailings, and (b) natural tailings.
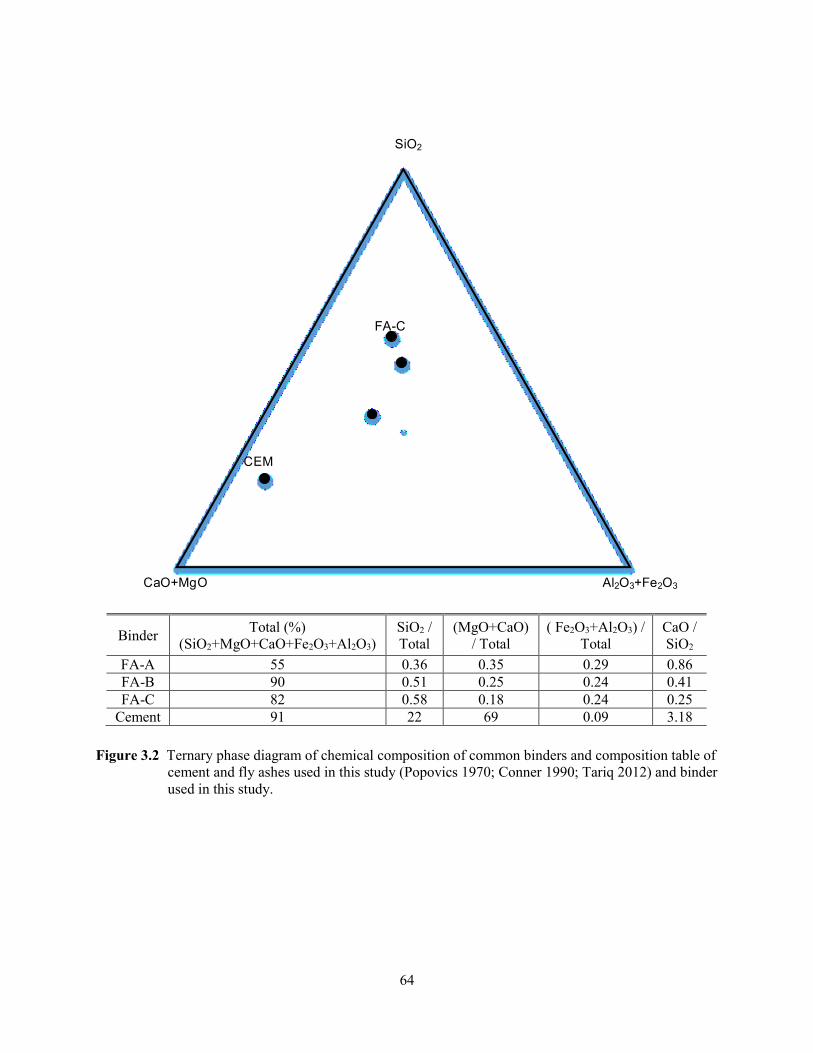
64
Fly Ash
Natural
Pozzolans
High alumina
cement
Blast
furnace
slag
Lime
Portland
Cement
Cement
Kiln dust
FA-B
FA-A
Al2O3+Fe2O3CaO+MgO
SiO2
`
CEM
FA-C
Figure 3.2 Ternary phase diagram of chemical composition of common binders and composition table of
cement and fly ashes used in this study (Popovics 1970; Conner 1990; Tariq 2012) and binder
used in this study.
Binder Total (%)
(SiO2+MgO+CaO+Fe2O3+Al2O3)
SiO2 /
Total
(MgO+CaO)
/ Total
( Fe2O3+Al2O3) /
Total
CaO /
SiO2
FA-A 55 0.36 0.35 0.29 0.86
FA-B 90 0.51 0.25 0.24 0.41
FA-C 82 0.58 0.18 0.24 0.25
Cement 91 22 69 0.09 3.18

65
0.95
1.00
1.05
0.1 1 10 100 1000
Vo
id R
atio
Time (min)
Difference between void ratio atend of primary compression and 24 hr
Tangent to primary compression
Tangent to secondary compression
End of primaryconsolidation
(a)
0.2
0.4
0.6
0.8
1.0
1.2
1 10 100 1000
Void
Ratio
at 2
4 h
Vertical Effective Stress (kPa)
Breaking Stress:
'B = 55 kPa
(b)
Figure 3.3 Relationships of (a) void ratio versus time and (b) void ratio at 24-h versus vertical effective
stress for specimen fine synthetic tailings prepared at a solids content of 70%, Fly Ash A
amendment of 8.5%, and curing time = 7 days (FS17). Data in (a) are for a vertical stress
increase of 50 kPa and final vertical effective stress = 83 kPa. Identification of the breaking
stress was based on the Casagrande method for pre-consolidation stress.
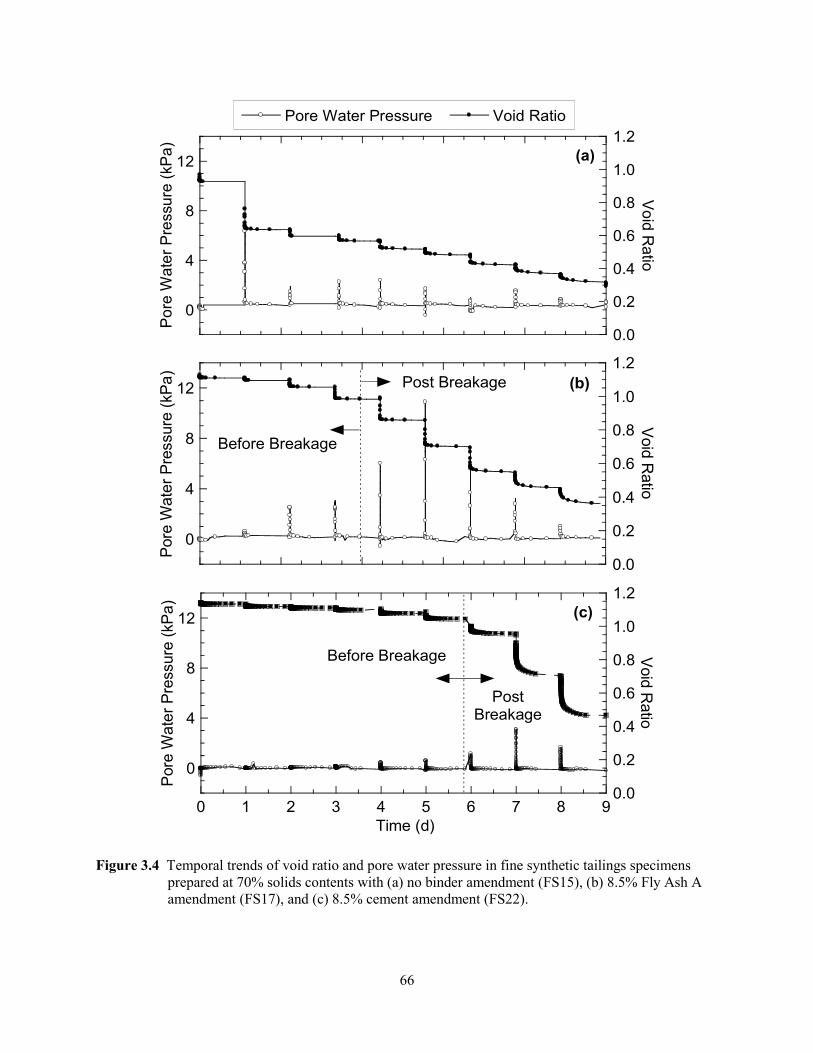
66
0
4
8
12
0.0
0.2
0.4
0.6
0.8
1.0
1.2
Pore Water Pressure Void Ratio
Po
re W
ate
r P
ressu
re (
kP
a)
Vo
id R
atio
(a)
0
4
8
12
0.0
0.2
0.4
0.6
0.8
1.0
1.2
Pore
Wate
r P
ressure
(kP
a)
Void
Ratio
(b)Post Breakage
Before Breakage
0
4
8
12
0.0
0.2
0.4
0.6
0.8
1.0
1.2
0 1 2 3 4 5 6 7 8 9
Pore
Wate
r P
ressure
(kP
a)
Void
Ratio
Time (d)
(c)
PostBreakage
Before Breakage
Figure 3.4 Temporal trends of void ratio and pore water pressure in fine synthetic tailings specimens
prepared at 70% solids contents with (a) no binder amendment (FS15), (b) 8.5% Fly Ash A
amendment (FS17), and (c) 8.5% cement amendment (FS22).

67
0.3
0.6
0.9
1.2
1 10 100 1000
FS Tailings
FA-C
FA-A
Cement
Void
Ratio
Vertical Effective Stress (kPa)
Figure 3.5 Void ratio at the end of 24 hours versus vertical effective stress relationships for fine
synthetic tailings prepared at 70% solids content with 8.5% Fly Ash A (FA-A) (FS17), 8.5%
Fly Ash C (FA-C) (FS20), 8.5% cement (FS29), and no binder addition (FS Tailings) (FS15).
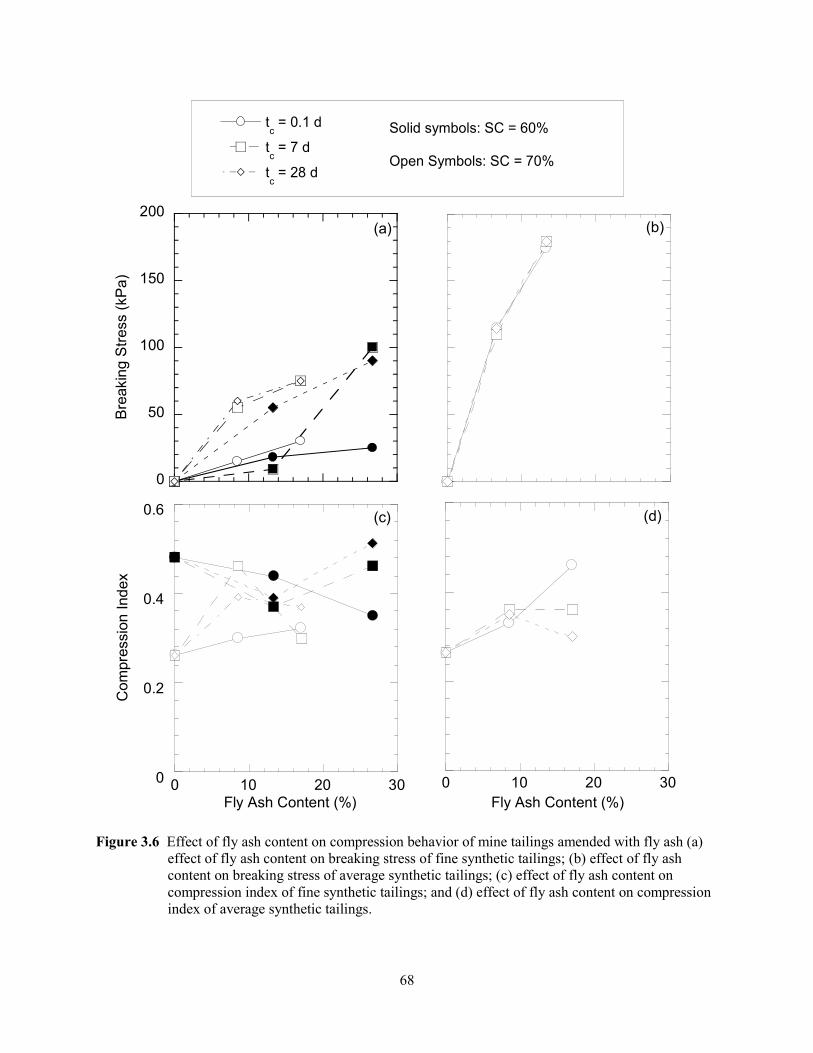
68
tc = 0.1 d
tc = 7 d
tc = 28 d
Solid symbols: SC = 60%
Open Symbols: SC = 70%
Figure 3.6 Effect of fly ash content on compression behavior of mine tailings amended with fly ash (a)
effect of fly ash content on breaking stress of fine synthetic tailings; (b) effect of fly ash
content on breaking stress of average synthetic tailings; (c) effect of fly ash content on
compression index of fine synthetic tailings; and (d) effect of fly ash content on compression
index of average synthetic tailings.
0
50
100
150
200
Bre
akin
g S
tress (
kP
a)
(a) (b)
0
0.2
0.4
0.6
0 10 20 30
Com
pre
ssio
n I
nd
ex
Fly Ash Content (%)
(c)
0 10 20 30
Fly Ash Content (%)
(d)

69
0
0.2
0.4
0.6
0.8
0 200 400 600 800
AST-FA-A
AST-CEM
FST-FA-A
FST-FA-C
FST-CEMC
om
pre
ssio
n I
nd
ex (
Cc)
Breaking Stress (B')
Fine synthetic tailings
R2 = 0.74
Average synthetic tailings
R2 = 0.48
Figure 3.7 Relationship between compression index (Cc) and breaking stress (σ’B) for average synthetic
tailings (AST) and fine synthetic tailings (FST) amended with fly ash A (FA-A), fly ash C
(FA-C), and cement (CEM).
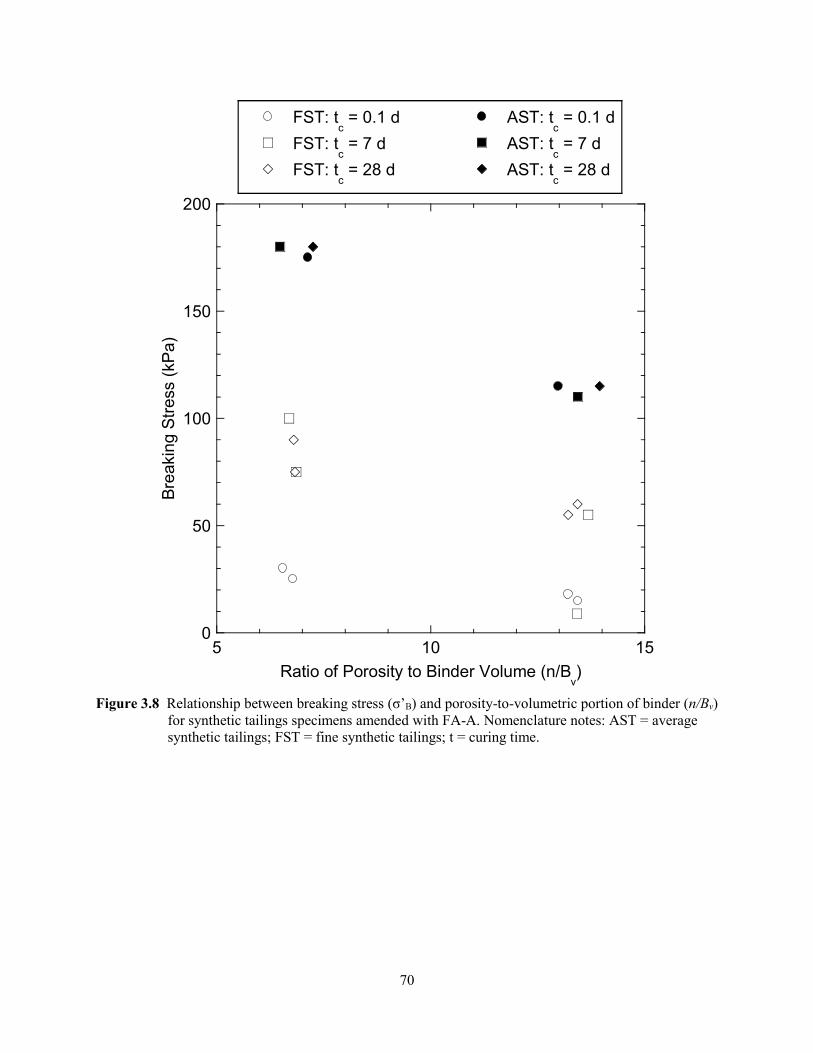
70
0
50
100
150
200
5 10 15
FST: tc = 0.1 d
FST: tc = 7 d
FST: tc = 28 d
AST: tc = 0.1 d
AST: tc = 7 d
AST: tc = 28 d
Bre
akin
g S
tre
ss (
kP
a)
Ratio of Porosity to Binder Volume (n/Bv)
Figure 3.8 Relationship between breaking stress (σ’B) and porosity-to-volumetric portion of binder (n/Bv)
for synthetic tailings specimens amended with FA-A. Nomenclature notes: AST = average
synthetic tailings; FST = fine synthetic tailings; t = curing time.
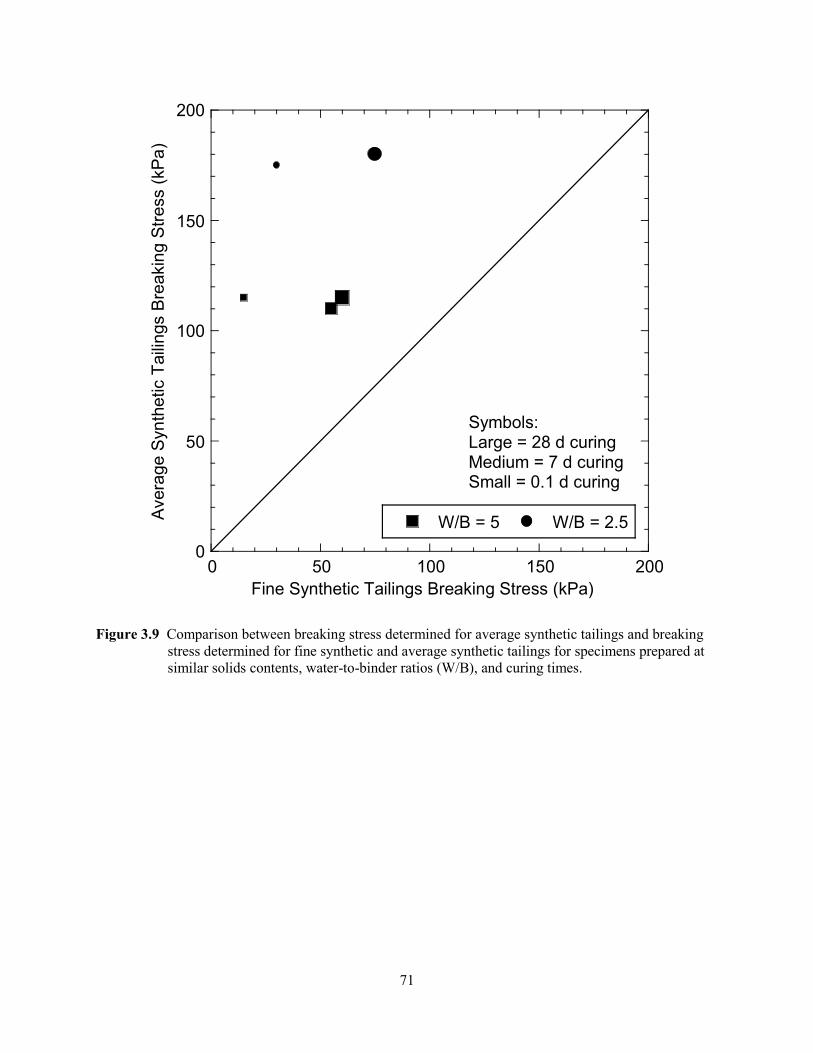
71
0
50
100
150
200
0 50 100 150 200
W/B = 5 W/B = 2.5Avera
ge S
yn
thetic T
aili
ngs B
reakin
g S
tress (
kP
a)
Fine Synthetic Tailings Breaking Stress (kPa)
Symbols:Large = 28 d curingMedium = 7 d curingSmall = 0.1 d curing
Figure 3.9 Comparison between breaking stress determined for average synthetic tailings and breaking
stress determined for fine synthetic and average synthetic tailings for specimens prepared at
similar solids contents, water-to-binder ratios (W/B), and curing times.

72
Figure 3.10 Effect of curing time on compression behavior of mine tailings amended with fly ash
(a) effect of curing time on breaking stress of fine synthetic tailings; (b) effect of curing time
on breaking stress of average synthetic tailings; (c) effect of curing time on compression
index of fine synthetic tailings; and (d) effect of curing time on compression index of
average synthetic tailings.
0
50
100
150
200
FA = 13.3%
FA = 26.6%
FA = 8.5%
FA = 17%
Bre
akin
g S
tre
ss (
kP
a)
(a)
Open Symbols: FA-A
Closed Symbols: FA-C
(b)
0
0.2
0.4
0.6
0 10 20 30
Com
pre
ssio
n In
dex
Curing Time (d)
(c)
0 10 20 30
Curing Time (d)
(d)

73
0.2
0.4
0.6
0.8
1.0
1.2
tc = 0.1 d t
c = 7 d t
c = 28 d
Void
Ratio
(a)
Range of 'B
Initial consolidationfor t
c = 0.1 d specimen
Average Synthetic Tailings
0.2
0.4
0.6
0.8
1.0
1.2
1 10 100 1000
Void
Ratio
Vertical Effective Stress (kPa)
'B for t
c = 0.1 d
(b)
Fine Synthetic Tailings
'B for t
c = 7 & 28 d
Figure 3.11 Comparison of compression behavior for (a) average synthetic tailings and (b) fine synthetic
tailings for specimens amended with Fly Ash A, and prepared at a solids content = 70%,
water-to-binder ratio = 5, and at cured for tc = 0.1 day, 7 days, and 28 days.

74
0
25
50
75
100
0 25 50 75 100
W/B = 5
W/B = 2.5
Bre
akin
g S
tress (
kP
a)
- F
ly A
sh C
Breaking Stress (kPa) - Fly Ash A
(a)
Symbols:Large = 28 d curingMedium = 7 d curingSmall = 0.1 d curing
0.0
0.2
0.4
0.6
0.0 0.2 0.4 0.6
W/B = 5
W/B = 2.5
Com
pre
ssio
n I
nde
x -
Fly
Ash
C
Compression Index - Fly Ash A
(b)
Symbols:Large = 28 d curingMedium = 7 d curingSmall = 0.1 d curing
FIigure 3.12 Comparisons of (a) breaking stress and (b) compression index for average and synthetic
tailings amended with Fly Ash C and Fly Ash B and prepared to different water-to-binder
ratios (W/B) and curing for 0.1 day, 7 days, and 28 days.
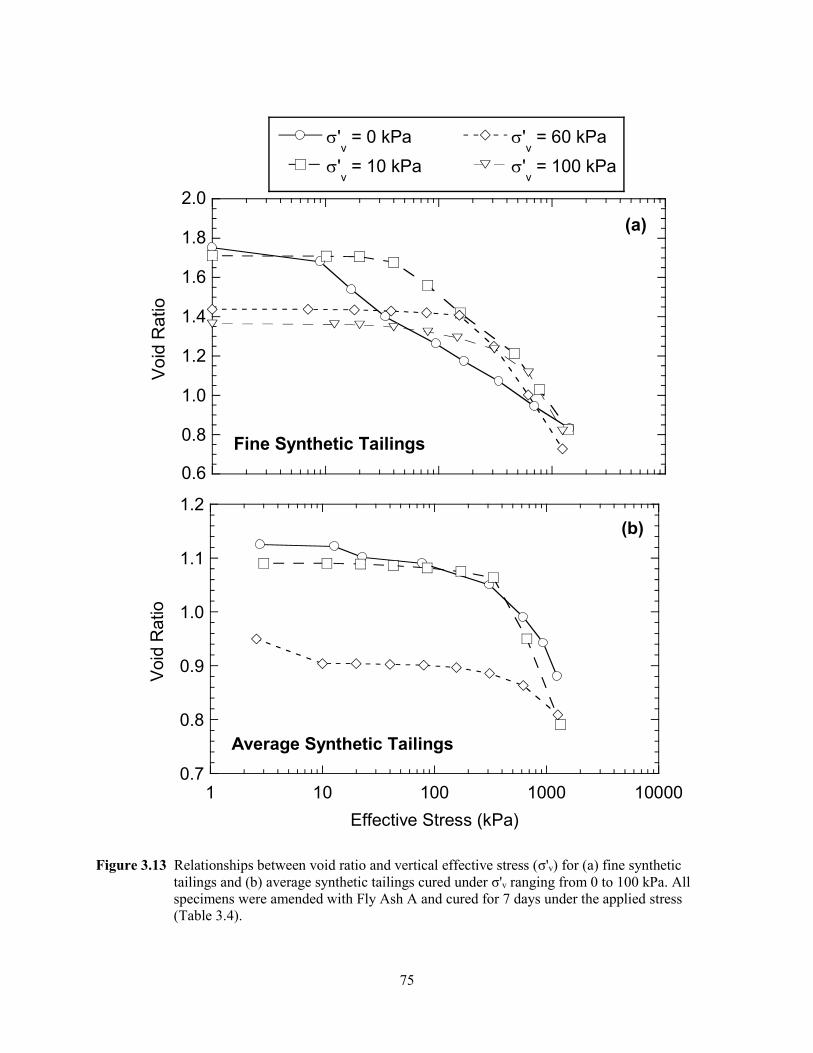
75
'v = 0 kPa
'v = 10 kPa
'v = 60 kPa
'v = 100 kPa
0.6
0.8
1.0
1.2
1.4
1.6
1.8
2.0
Void
Ratio
(a)
Fine Synthetic Tailings
0.7
0.8
0.9
1.0
1.1
1.2
1 10 100 1000 10000
Void
Ratio
Effective Stress (kPa)
(b)
Average Synthetic Tailings
Figure 3.13 Relationships between void ratio and vertical effective stress (σ'v) for (a) fine synthetic
tailings and (b) average synthetic tailings cured under σ'v ranging from 0 to 100 kPa. All
specimens were amended with Fly Ash A and cured for 7 days under the applied stress
(Table 3.4).
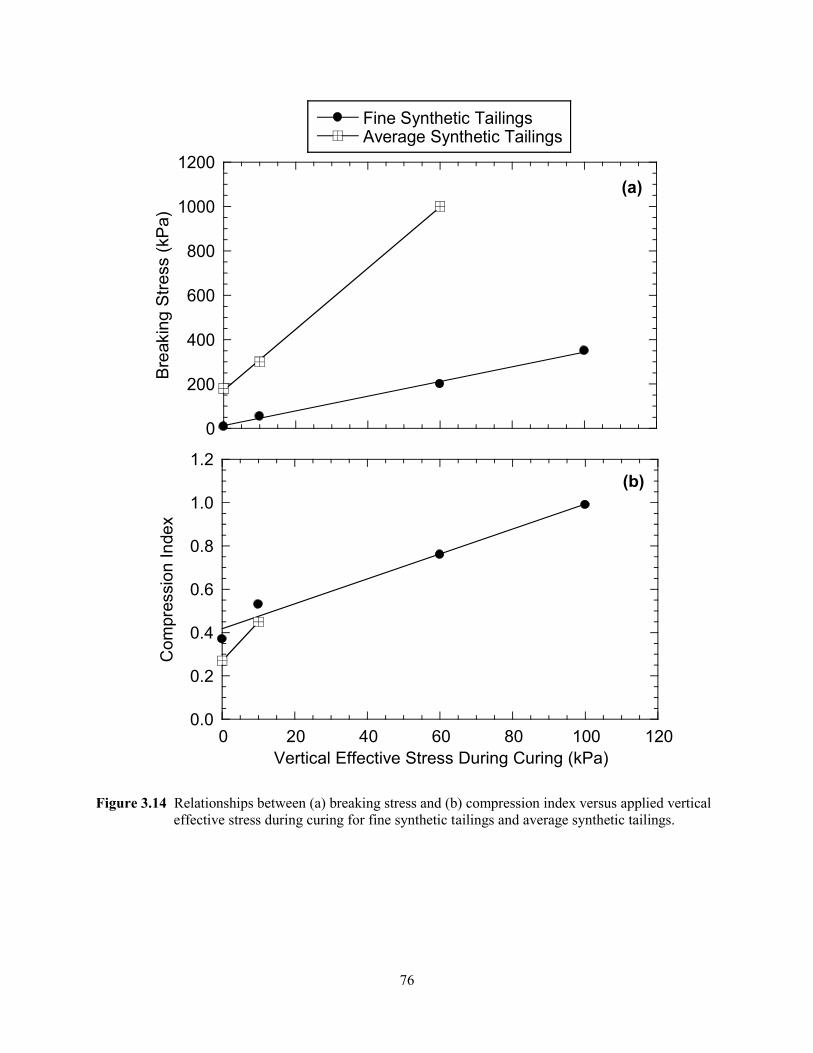
76
0
200
400
600
800
1000
1200
Fine Synthetic TailingsAverage Synthetic Tailings
Bre
akin
g S
tress (
kP
a)
(a)
0.0
0.2
0.4
0.6
0.8
1.0
1.2
0 20 40 60 80 100 120
Co
mpre
ssio
n I
nde
x
Vertical Effective Stress During Curing (kPa)
(b)
Figure 3.14 Relationships between (a) breaking stress and (b) compression index versus applied vertical
effective stress during curing for fine synthetic tailings and average synthetic tailings.

77
0
50
100
150
200
250
5 10 15
FA-A FA-B FA-CB
reakin
g S
tress (
kP
a)
Ratio of Porosity-to-Volumetric Portion of Binder (n/Bv)
Symbols:Solid = natural tailingsOpen + small = fine synthetic tailingsOpen + large = average synthetic tailings
NSA
NP200
G
NP200
G
NP200
G
NP200
G
NCu
NFG
Figure 3.15 Relationship between breaking stress (σ'B) and ratio porosity-to-volumetric portion of binder
(n/Bv) for fly ash-amended natural tailings specimens and fly ash-amended synthetic tailings
that were cured for 7 days. Nomenclature notes: NSA = natural soda ash tailings; NFG =
natural fine garnet tailings; NP200G = natural fine garnet tailings passing a No. 200 sieve;
NCu = natural copper tailings; FA-A = Fly Ash A; FA-B = Fly Ash B; and FA-C = Fly Ash
C.
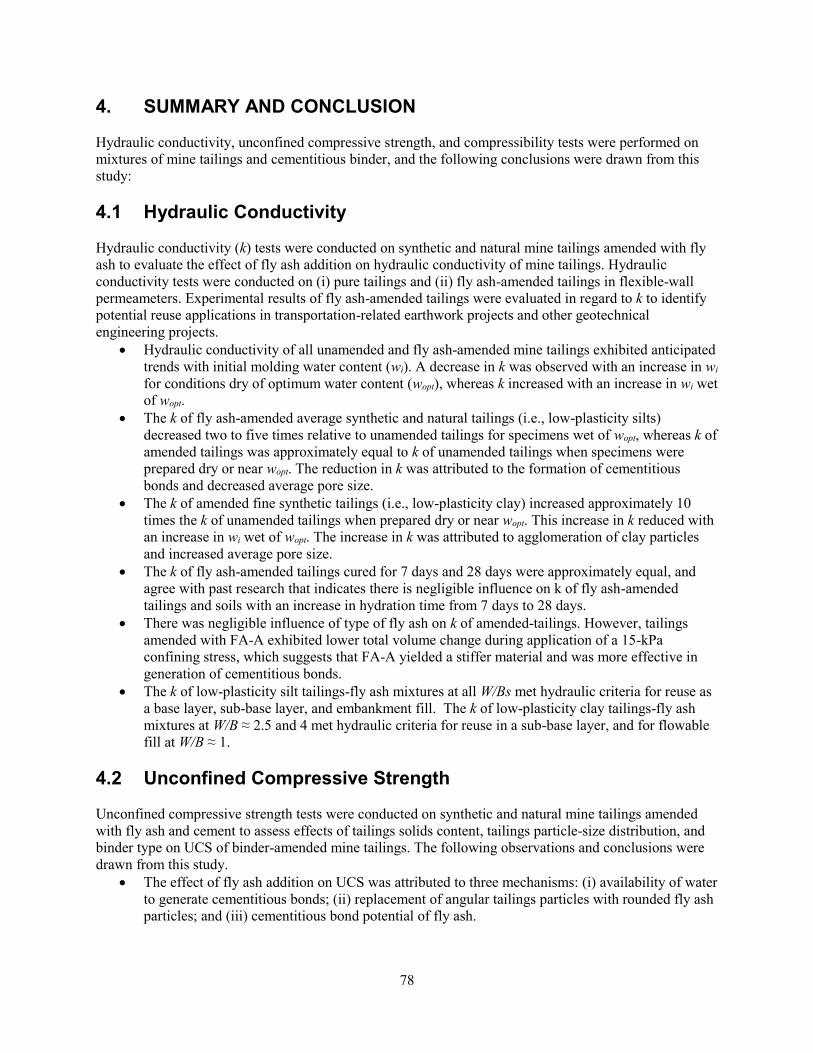
78
4. SUMMARY AND CONCLUSION
Hydraulic conductivity, unconfined compressive strength, and compressibility tests were performed on
mixtures of mine tailings and cementitious binder, and the following conclusions were drawn from this
study:
4.1 Hydraulic Conductivity
Hydraulic conductivity (k) tests were conducted on synthetic and natural mine tailings amended with fly
ash to evaluate the effect of fly ash addition on hydraulic conductivity of mine tailings. Hydraulic
conductivity tests were conducted on (i) pure tailings and (ii) fly ash-amended tailings in flexible-wall
permeameters. Experimental results of fly ash-amended tailings were evaluated in regard to k to identify
potential reuse applications in transportation-related earthwork projects and other geotechnical
engineering projects.
Hydraulic conductivity of all unamended and fly ash-amended mine tailings exhibited anticipated
trends with initial molding water content (wi). A decrease in k was observed with an increase in wi
for conditions dry of optimum water content (wopt), whereas k increased with an increase in wi wet
of wopt.
The k of fly ash-amended average synthetic and natural tailings (i.e., low-plasticity silts)
decreased two to five times relative to unamended tailings for specimens wet of wopt, whereas k of
amended tailings was approximately equal to k of unamended tailings when specimens were
prepared dry or near wopt. The reduction in k was attributed to the formation of cementitious
bonds and decreased average pore size.
The k of amended fine synthetic tailings (i.e., low-plasticity clay) increased approximately 10
times the k of unamended tailings when prepared dry or near wopt. This increase in k reduced with
an increase in wi wet of wopt. The increase in k was attributed to agglomeration of clay particles
and increased average pore size.
The k of fly ash-amended tailings cured for 7 days and 28 days were approximately equal, and
agree with past research that indicates there is negligible influence on k of fly ash-amended
tailings and soils with an increase in hydration time from 7 days to 28 days.
There was negligible influence of type of fly ash on k of amended-tailings. However, tailings
amended with FA-A exhibited lower total volume change during application of a 15-kPa
confining stress, which suggests that FA-A yielded a stiffer material and was more effective in
generation of cementitious bonds.
The k of low-plasticity silt tailings-fly ash mixtures at all W/Bs met hydraulic criteria for reuse as
a base layer, sub-base layer, and embankment fill. The k of low-plasticity clay tailings-fly ash
mixtures at W/B ≈ 2.5 and 4 met hydraulic criteria for reuse in a sub-base layer, and for flowable
fill at W/B ≈ 1.
4.2 Unconfined Compressive Strength
Unconfined compressive strength tests were conducted on synthetic and natural mine tailings amended
with fly ash and cement to assess effects of tailings solids content, tailings particle-size distribution, and
binder type on UCS of binder-amended mine tailings. The following observations and conclusions were
drawn from this study.
The effect of fly ash addition on UCS was attributed to three mechanisms: (i) availability of water
to generate cementitious bonds; (ii) replacement of angular tailings particles with rounded fly ash
particles; and (iii) cementitious bond potential of fly ash.

79
The UCS of unamended tailings and fly ash-amended tailings decreased with a decrease in solids
content (i.e., increase in water content). The UCS of non-fly ash amended synthetic tailings at 70
and 80% solids content were zero because specimens were slurry. The UCS of fly ash-amended
synthetic tailings decreased with an increase in the water-to-binder ratio and increase in ratio of
porosity to volumetric binder content.
A reduction in UCS was observed for fine and average synthetic tailings amended with fly ash
that were prepared dry of optimum water content. In these specimens, fly ash exhibited negligible
cementitious potential due to low water availability or low reactivity. The reduction in UCS was
attributed to reduced particle-to-particle interlocking due to the replacement of angular tailings
particles with spherical fly ash particles.
A more pronounced increase in UCS was observed for tailings amended with higher CaO/SiO2
fly ash. The more reactive fly ash in this study, FA-A, had lower total mass contribution of
cementitious reagents relative to FA-B; however, FA-A had a more favorable balance of chemical
constituents (e.g., higher CaO/SiO2) that led to the more pronounced cementitious potential and
UCS enhancement.
A multivariate regression model was developed to predict UCS of tailings amended with fly ash
as a function of tailings water content, water-to-binder ratio, and CaO/SiO2 ratio of fly ash. The
model yielded an R2 = 0.43 when used to predict UCS of low plasticity (LL < 50%) natural
tailings and fly ash-amended soil data compiled from literature. This model is applicable to
estimate the UCS of candidate fly ash-mine tailings mixtures; however, engineering judgment
should accompany use of the prediction tool in practice.
The multivariate regression model under-estimated the UCS of high plasticity soils by 100 kPa.
Thus, the model is not applicable to high plasticity soils and further investigation is needed to
develop a universal UCS model both low- and high-plasticity geomaterials amended with fly ash.
High solids content mine tailings (SC = 80% to 90%) amended with higher pozzolanic potential
fly ash (FA-A) yielded UCS that supported reuse applicability as flowable fill and cemented paste
backfill. The UCS of cement-amended tailings support reuse of these materials as road subbase
materials.
4.3 Compressibility
One-dimensional compression tests were conducted on synthetic and natural mine tailings amended with
cementitious binders (fly ash or cement) to assess the effect of binder amendment on tailings
compressibility. Experiments were conducted with synthetic tailings to assess compression behavior with
and without an applied vertical stress during curing and on natural tailings, to assess similarity in
compression behavior between synthetic and natural mine tailings. The following conclusions were drawn
from this study.
The breaking stress (σ'B), identified as the change in slope of the compression curve at which
cementitious bonds are broken, increased with increasing cementitious binder potential. The slope
of the compression curve (Cc) for vertical effective stress (σ'v) > σ'B increased with increasing σ'B,
and positive correlations between σ'B and Cc were identified for both average and fine synthetic
tailings for the range of cementitious binders used in this study.
A more pronounced increase in σ'B with increasing fly ash content was observed for tailings
amended with fly ash characterized by higher CaO/SiO2. Additionally, all tailings and fly ashes
used in this study supported a trend of increasing σ'B with decreasing ratio of porosity to
volumetric fraction of binder (n/Bv). The n/Bv ratio decreased with an increase in solids content
(i.e., lower porosity) or increase in the percent binder amendment by dry mass.
The effect of curing time on development of σ'B differed between the average and fine synthetic
tailings amended with FA-A. An increase in σ'B with an increase in curing time was observed for
fine synthetic tailings, whereas a constant σ'B was measured regardless of curing time for average

80
synthetic tailings. This behavior was attributed to water removal during the early stages of
loading for average synthetic tailings that decreased n/Bv and led to more effective cementation.
Breaking stress increased with an increase in applied σ'v during curing for fine and average
synthetic tailings. These positive correlations were also attributed to water removal and reduction
in n/Bv that enhanced cementitious bond formation. The Cc increased with an increase in σ'v
during curing, which was due to an increase in σ'B and relatively high void ratio of a given
specimen at the time of breakage.
Soil plasticity was observed to influence the σ'B such that larger σ'B were measured for synthetic
and natural tailings that classified as non-plastic silts as compared to those tailings that classified
as low-plasticity clays.

81
5. REFERENCES
ACAA. (2003). Fly Ash Facts for Highway Engineers. American Coal Ash Association, Federal Highway
Administration, Washington D.C., FHWA-IF-03-019.
ACAA. (2015). Sustainable Construction with Coal Combustion Products, American Coal Ash
Association (ACAA) Educational Foundation, Nov. 2015, Farmington Hill, MI, USA, www.acaa-
usa.org.
Ahmaruzzaman, M. (2010). A review on the utilization of fly ash. Progress in Energy and Combustion
Science, 36(3), 327-363.
Alhomair, S, A., (2016). Hydraulic conductivity of fly ash-amended mine tailings. M.Sc. thesis,
Department of Civil and Environmental Engineering, Colorado State University, Fort Collins,
Colorado.
Alhomair, S. A., Gorakhki, M. H., and Bareither, C. A. (2016). Hydraulic conductivity of fly ash-
amended mine tailings, Geotechnical and Geological Engineering, doi:10.1007/s10706-016-0101-z.
Amadi, A. A. (2011). Hydraulic conductivity tests for evaluating compatibility of lateritic soil—fly ash
mixtures with municipal waste leachate, Geotechnical and Geological Engineering, 29(3), 259-265.
Arora, S., and Aydilek, A. H. (2005). Class F fly-ash-amended soils as highway base materials. Journal
of Materials in Civil Engineering, 17(6), 640-649.
ASTM. (2007). Standard test method for particle-size analysis of soils. D 422-63, West Conshohocken,
PA.
ASTM. (2009). Standard test methods for unconfined compressive strength of compacted soil-lime
mixtures. D 5102, West Conshohocken, PA.
ASTM (2010). Standard test methods for measurement of hydraulic conductivity of saturated porous
materials using a flexible wall permeameter, ASTM D5084, ASTM International, West Conshohocken,
PA.
ASTM. (2011). Standard test methods for one-dimensional consolidation properties of soils using
incremental loading. D2435-11, West Conshohocken, PA.
ASTM (2011). Standard practice for classification of soils for engineering purposes (Unified Soil
Classification System), ASTM D 2487, ASTM International West Conshohocken, PA.
ASTM. (2014a). Standard test methods for liquid limit, plastic limit, and plasticity index of soils. D4318-
10, West Conshohocken, PA.
ASTM. (2014b). Standard test methods for specific gravity of soil solids by water pycnometer. D854-14,
West Conshohocken, PA.
ASTM. (2014c). Standard test methods for laboratory compaction characteristics of soil using standard
effort (12400ft-lbf/ft3 (600 kN-m/m3)). D698-12, West Conshohocken, PA.
82
ASTM. (2015a). Standard specification for coal fly ash and raw or calcined natural pozzolan for use in
concrete. C618-15, West Conshohocken, PA.
ASTM. (2015b). Standard test methods for slump of hydraulic-cement concrete. C143, West
Conshohocken, PA.
Aubertin, M., Bussière, B., and Chapuis, R. P. (1996). Hydraulic conductivity of homogenized tailings
from hard rock mines, Canadian Geotechnical Journal, 33(3), 470-482.
Belem, T., Benzaazoua, M., and Bussière, B. (2000). Mechanical behavior of cemented paste backfill,
In Proc. of 53rd Canadian Geotechnical Conference, 373-380.
Benson, C. and Daniel, D. (1990). Influence of clods on the hydraulic conductivity of compacted clay,
Journal of Geotechnical Engineering, 116(8), 1231-1248.
Benzaazoua, M., Fall, M., and Belem, T. (2004). A contribution to understanding the hardening process of
cemented paste fill, Minerals Engineering 17 (2), 141– 152.
Benzaazoua, M., Bussière, B., Demers, I., Aubertin, M., Fried, É. and Blier, A. (2008). Integrated mine
tailings management by combining environmental desulphurization and cemented paste backfill:
Application to mine Doyon, Quebec, Canada, Minerals Engineering, 21(4), 330-340.
Bin-Shafique, S., Edil, T.B., Benson, C.H. and Senol, A. (2004). Incorporating a fly-ash stabilized layer
into pavement design, Proc. of the ICE-Geotechnical Engineering, 157(4), 239-249.
Blight, G. (2010). Geotechnical Engineering for Mine Waste Storage Facilities, CRC Press, Taylor &
Francis Group, London, UK.
Bloss, M. (2002) Below ground disposal (mine backfill), Jewell R.J., Fourie A.B., Lord E.R., (Ed.) Paste
and Thickened Tailings: A Guide, University of Western Australia, Nedlands, Western Australia,
103-126.
Bobet, A., Hwang, J., Johnston, C. T. (2011). One-dimensional consolidation behavior of cement-treated
organic soil, Canadian Geotechnical Journal, 48(7), 1100-1115.
Bose, B. (2012). Geo engineering properties of expansive soil stabilized with fly ash, Electronic Journal
of Geotechnical Engineering, 17, 1339-1353.
Bowker, L. N., & Chambers, D. M. (2015). The Risk, Public Liability, & Economics of Tailings Storage
Facility Failures. Earthwork Act.
Bussière, B. (2007). Hydro-geotechnical properties of hard rock tailings from metal mines and emerging
geo-environmental disposal approaches, Canadian Geotechnical Journal, 44(9), 1019-1052.
Chesner, W.H., Collins, R.J. and MacKay, M.H. (1998). User guidelines for waste and by-product
materials in pavement construction (No. FHWA-RD-97-148).
Consoli, N. C., Montardo, M. D., and Prietto, P. F. M. (2004) Effect of materials properties on the
behavior of sand-cement-fiber composites, Ground Improvement, 8(2), 77-90.
83
Consoli, N. C., Foppa, D., Festugato, L., and Heineck, K. S. (2007). Key parameters for strength control
of artificially cemented soils, Journal of Geotechnical and Geoenvironmental Engineering, 133(2),
197-205.
Consoli, N. C., Cruz, R. C., Floss, M. F., and Festugato, L. (2009). Parameters controlling tensile and
compressive strength of artificially cemented sand, Journal of Geotechnical and Geoenvironmental
Engineering, 136(5), 759-763.
Daliri, F., Kim, H., Simms, P. and Sivathayalan, S. (2014). Impact of desiccation on monotonic and cyclic
shear strength of thickened gold tailings, Journal of Geotechnical and Geoenvironmental
engineering, 140(9), 1-13.
Daniel, D. and Benson, C. (1990). Water content-density criteria for compacted soil liners, Journal of
Geotechnical Engineering, 116, 1811-1830.
Daniel, D. E. (1994). State-of-the-Art: Laboratory hydraulic conductivity tests for saturated soils, ASTM
STP 1142, D. E. Daniel and S. J. Trautwein (Eds.), American Society for Testing and Materials,
Philadelphia, 30-78.
Davies, M. P. (2002). Tailings impoundment failure: are geotechnical engineers listening. Geotechnical
News, September, 31-36.
Day, K., Aldred, J., and Hudson, B. (2013). Concrete mix design, quality control and specification, CRC
Press, Taylor & Francis Group, London, UK.
Deb, P. S., and Pal, S. K. (2014). Effect of fly ash on geotechnical properties of local soil-fly ash mixed
samples, International Journal of Research in Engineering and Technology. 507-516.
Deng, A. and Tikalsky, P. J. (2008). Geotechnical and leaching properties of flowable fill incorporating
waste foundry sand, Waste Management, 28(11), 2161-2170.
Duraisamy, Y., Huat, B. B., and Muniandy, R. (2009). Compressibility behavior of fibrous peat
reinforced with cement columns, Geotechnical and Geological Engineering, 27(5), 619-629.
Edil, T. B., Benson, C. H., Bin Shafique, S., Tanyu, B. F., Kim, W. H., and Senol, A. (2002). Field
evaluation of construction alternatives for roadway over soft subgrade. Geo Eng. Rep. No. 02-04, Dept.
of Civil and Environmental Engineering, Univ. of Wisconsin-Madison, Madison, WI.
Edil, T.B., Acosta, H.A. and Benson, C.H. (2006). Stabilizing soft fine-grained soils with fly ash, Journal
of Materials in Civil Engineering, 18(2), 283-294.
El Mkadmi, N., Aubertin, M., and Li, L. (2013). Effect of drainage and sequential filling on the behavior
of backfill in mine stopes, Canadian Geotechnical Journal, 51(1), 1-15.
Ercikdi, B., Kesimal, A., Cihangir, F., Deveci, H. and Alp, İ. (2009). Cemented paste backfill of sulphide-
rich tailings: Importance of binder type and dosage, Cement and Concrete Composites, 31(4), 268-
274.
Ercikdi, B., Baki, H. and İzki, M. (2013). Effect of desliming of sulphide-rich mill tailings on the long-
term strength of cemented paste backfill, Journal of Environmental Management, 115, 5-13.
84
Fahey, M., Helinski, M., and Fourie, A. (2011). Development of specimen curing procedures that account
for the influence of effective stress during curing on the strength of cemented mine backfill,
Geotechnical and Geological Engineering, 29(5), 709-723.
Fall, M., Benzaazoua, M. and Ouellet, S. (2005). Experimental characterization of the influence of
tailings fineness and density on the quality of cemented paste backfill, Minerals Engineering, 18(1),
41-44.
Fall, M., Benzaazoua, M., and Saa, E. (2008). Mix proportioning of underground cemented paste backfill,
International Journal of Tunneling and Underground Construction, 23, 80-90.
Fall, M., Adrien, D., Célestin, J.C., Pokharel, M., and Touré, M. (2009). Saturated hydraulic conductivity
of cemented paste backfill, Minerals Engineering, 22, 1307-1317.
Federico, A., Vitone, C., and Murianni, A. (2015). On the mechanical behavior of dredged submarine
clayey sediments stabilized with lime or cement. Canadian Geotechnical Journal. 52(12), 2030-2040.
Ferguson, G. (1993). Use of self-cementing fly ashes as a soil stabilization agent, Geotechnical Special
Publication No. 36, ASCE, 1-14.
FHWA. (2003) Fly ash facts for highway engineers. Federal Highway Administration, US Department of
Transportation, Washington DC, FHWA-IF-03-019
Fredlund, D. G., Rahardjo, H., and Fredlund, M. D. (2012). Unsaturated Soil Mechanics in Engineering
Practice, John Wiley & Sons, Inc., Hoboken, New Jersey, USA.
Ghirian, A. and Fall, M. (2013). Coupled thermo-hydro-mechanical–chemical behavior of cemented paste
backfill in column experiments. Part I: physical, hydraulic and thermal processes and characteristics,
Engineering Geology, 164, 195-207.
Ghirian, A. and Fall, M. (2015). Coupled behavior of cemented paste backfill at early ages, Geotechnical
and Geological Engineering, 33(5), 1141-1166.
Ghosh, A. and Subbarao, C. (1998). Hydraulic conductivity and leachate characteristics of stabilized fly
ash, Journal of Environmental Engineering, 124(9), 812-820.
Gorakhki, M.H. and Bareither, C.A. (2017). Unconfined compressive strength of mine tailings amended
with fly ash, Journal of Geotechnical and Geoenvironmental Engineering, 143(7), 1-14.
Godbout, J., Bussière, B. and Belem, T. (2007). Evolution of cemented paste backfill saturated hydraulic
conductivity at early curing time, OttawaGeo, Canadian Geotechnical Society, 2230-2236.
Goh, A. T., and Tay, J. H. (1993). Municipal solid-waste incinerator fly ash for geotechnical
applications, Journal of Geotechnical Engineering, 119(5), 811-825.
Grice, T. (1998) Underground mining with backfill, Proceedings of 2nd Annual Summit, Mine Tailings
Disposal Systems. Brisbane, Australian, Australasian Institute of Mining and Metallurgy, Carlton
South, Australia.
Holtz, R. D., Kovacs, W. D., and Sheehan, T. C. (2011). An Introduction to Geotechnical Engineering,
2nd Ed., Prentice Hall, New York.

85
Horpibulsuk, S., Norihiko, M., and Nagaraj, T.S., (2005). Clay–water/cement ratio identity for cement
admixed soft clays. Journal of Geotechnical and Geoenvironmental Engineering, 131(2), 187-192.
Howell, J. L., Shackelford, C. D., Amer, N. H., and Stem, R. T. (1997). Compaction of sand-processed
clay soil mixtures, Geotechnical Testing Journal, 20(4), 443-458.
Hudson-Edwards, K. A., Jamieson, H. E., and Lottermoser, B. G. (2011). Mine wastes: past, present,
future, Elements, 7(6), 375-380.
Janz, M. and Johansson, S.E. (2002). The function of different binding agents in deep stabilization, 9th
Report of Swedish Deep Stabilization Research Centre, Linkoping, Sweden.
Jehring, M. M. and Bareither, C. A. (2016). Tailings composition effects on shear strength behavior of co-
mixed mine waste rock and tailings, Acta Geotechnica, published online 23 Jan. 2016, 1-20.
Jensen, O.M. and Hansen, P.F. (2001). Water-entrained cement-based materials: I. principles and
theoretical background, Cement and Concrete Research. 31(4), 647-654.
Jiang, N. J., Du, Y. J., Liu, S. Y., Wei, M. L., Horpibulsuk, S., and Arulrajah, A. (2016). Multi-scale
laboratory evaluation of the physical, mechanical, and microstructural properties of soft highway
subgrade soil stabilized with calcium carbide residue, Canadian Geotechnical Journal,
doi:10.1139/cgj-2015-0245.
Kesimal, A., Yilmaz, E., and Ercikdi, B. (2004) Evaluation of paste backfill mixtures consisting of sulphide-
rich mill tailings and varying cement contents, Cement and Concrete Research, 34, 1817-1822
Kesimal, A., Yilmaz, E., Ercikdi, B., Alp, I., and Deveci, H. (2005). Effect of properties of tailings and
binder on the short-and long-term strength and stability of cemented paste backfill, Materials
Letters, 59(28), 3703-3709.
Khalili, A., Wijewickreme, D., and Wilson, G. W. (2005). Some observations on the mechanical response
of mixtures of mine waste and tailings. In Proc. 58th Canadian Geotechnical Conference, Saskatoon,
Sask,18-21.
Khalili, A. and Wijewickreme, D. (2008). New slurry displacement method for reconstitution of highly
gap-graded specimens for laboratory element testing, Geotechnical Testing Journal, 31(5), 424-432.
Khalili, A., Wijewickreme, D., and Wilson, W. (2010). Mechanical response of highly gap-graded
mixtures of waste rock and tailings. Part I: Monotonic shear response, Canadian Geotechnical
Journal, 47(5), 552-565.
Kesimal, A., Yilmaz, E., Ercikdi, B., Alp, I. and Deveci, H. (2005). Effect of properties of tailings and
binder on the short-and long-term strength and stability of cemented paste backfill, Materials
Letters, 59(28), 3703-3709.
Kim, B., Prezzi, M., and Salgado, R. (2005). Geotechnical properties of fly and bottom ash mixtures for
use in highway embankments, Journal of Geotechnical and Geoenvironmental Engineering, 131(7),
914-924.
86
Klein, K. and Simon, D. (2006). Effect of specimen composition on the strength development in
cemented paste backfill, Canadian Geotechnical Journal, 43(3), 310-324.
Kurtis, K. (2007). Structure of the hydrated cement paste, School of Civil Engineering, Georgia Institute
of Technology, Atlanta, GA, USA.
Lee, J. K., Shang, J. Q., and Jeong, S. (2014). Thermo-mechanical properties and microfabric of fly ash-
stabilized gold tailings, Journal of Hazardous Materials, 276, 323-331.
Lu, N., and Likos, W. J. (2004). Unsaturated Soil Mechanics, Wiley & Sons, Inc., Hoboken, New Jersey,
USA.
Mahmood, A.A. and Mulligan, C.N. (2010). Investigation of the use of mine tailings for unpaved road
base. Proc. Annual International Conference on Soils, Sediments, Water and Energy, 12(1), 107-117.
Malusis, M. A., Barben, E. J., and Evans, J. C. (2009). Hydraulic conductivity and compressibility of soil-
bentonite backfill amended with activated carbon, Journal of Geotechnical and Geoenvironmental
Engineering, 135(5), 664-672.
Misra, M., Yang, K. and Mehta, R.K. (1996). Application of fly ash in the agglomeration of reactive mine
tailings, Journal of Hazardous Materials, 51(1), 181-192.
Mitchell, J. K., Hooper, D. R., and Campanella, R. G. (1965). Permeability of compacted clay. Soil and
Foundation Design, 92, 41-66.
Mohamed, A. M. O., Hossein, M., and Hassani, F.P. (2002). Hydro-mechanical evaluation of stabilized
mine tailings, Environmental Geology 41(7), 749-759.
Morris, P.H. and Williams, D.J. (1997). Results of field trials of co-disposal of coarse and fine coal waste,
Transactions of the Institution of Mining and Metallurgy, 106, A38-A41.
Nalbantoglu, Z., and Tuncer, E. R. (2001). Compressibility and hydraulic conductivity of a chemically
treated expansive clay, Canadian Geotechnical Journal, 38(1), 154-160.
Nasir, O. and Fall, M. (2010). Coupling binder hydration, temperature and compressive strength
development of underground cemented paste backfill at early ages. Tunneling and Underground
Space Technology, 25(1), 9-20.
Odadjima, H., Noto, S., Nishikawa, J., and Yamazaki, T. (1995). Cement stabilization of peaty ground
with consideration of organic matter, Proc. International Workshop on the Engineering
Characteristics and Behavior of Peat, Sapporo, 131-141.
Ouellet, S., Bussière, B., Mbonimpa, M., Benzaazoua, M. and Aubertin, M. (2006). Reactivity and
mineralogical evolution of an underground mine sulphidic cemented paste backfill, Minerals
engineering, 19(5), 407-419.
Ouellet, S., Bussière, B., Aubertin, M. and Benzaazoua, M. (2007). Microstructural evolution of cemented
paste backfill: Mercury intrusion porosimetry test results, Cement and Concrete Research, 37(12),
1654-1665.
87
Pacheco-Torgal, F., Labrincha, J., Leonelli, C., Palomo, A. and Chindaprasit, P. eds., 2014. Handbook of
Alkali-Activated Cements, Mortars and Concretes. Elsevier.
Park, J.H., Edraki, M., Mulligan, D. and Jang, H.S. (2014). The application of coal combustion by-
products in mine site rehabilitation, Journal of Cleaner Production, 84, 761-772.
Paulini, P. (1990). Reaction mechanisms of concrete admixtures, Cement and Concrete Research, 20(6),
910-918.
Phanikumar, B. R. and Shankar, M. U. (2016) Studies on hydraulic conductivity of fly ash-stabilized
expansive clay liners, Geotechnical and Geological Engineering, 1-14.
Popovics, S. (1970). Concrete Making Materials, McGraw-Hill, New York, NY, USA.
Powers, T.C. and Brownyard, T.L. (1948). Studies of the physical properties of hardened Portland cement
paste, Bull. 22, Res. Lab. of Portland Cement Association, Skokie, IL, U.S.A., reprinted from J. Am.
Concr. Inst. (Proc.), 43.
Qian, G., Huang, T. and Bai, S. (2011). Use of cement-stabilized granite mill tailings as pavement
subbase, Journal of Materials in Civil Engineering, 23(11), 1575-1578.
Qiu, Y. and Sego, D. C. (2001). Lab properties of mine tailings, Canadian Geotechnical Journal 38(1),
183-190.
Quang, N. D. and Chai, J. C. (2015). Permeability of lime- and cement-treated clayey soils, Canadian
Geotechnical Journal, 52(9), 1221-1227.
Rosa, M. G., Cetin, B., Edil, T. B., and Benson, C. H. (2016). Development of a test procedure for freeze-
thaw durability of geomaterials stabilized with fly ash, Geotechnical Testing Journal, 39(6), 1-16.
Rotta, G. V., Consoli, N. C., Prietto, P. D. M., Coop, M. R., and Graham, J. (2003). Isotropic yielding in
an artificially cemented soil cured under stress, Geotechnique, 53(5), 493-502.
Schroeder, R.L. (1994). The use of recycled materials in highway construction, Public Roads, 58(2).
Senol, A., Bin-Shafique, M.S., Edil, T.B. and Benson, C.H. (2002). Use of class C fly ash for stabilization
of soft subgrade. Proc. of the Fifth International Congress on Advances in Civil Engineering, Istanbul
Technical University, Turkey.
Senol, A., Edil, T.B., Bin-Shafique, M.S., Acosta, H.A. and Benson, C.H. (2006). Soft subgrades’
stabilization by using various fly ashes, Resources, Conservation and Recycling, 46(4), 365-376.
Senol, A., Etminan, E. and Olgun, C.G. (2012). Stabilization of clayey soils using fly ash and
homopolymer polypropylene. Proc. Geocongress 2012, American Society of Civil Engineers, 3929-
3938.
Shackelford, C. D. and Moore, S. M. (2013). Fickian diffusion of radionuclides for engineered containment
barriers: Diffusion coefficients, porosities, and complicating issues, Engineering Geology, 152(1), 133-
147
88
Show, K. Y., Tay, J. H., and Goh, A. T. (2003). Reuse of incinerator fly ash in soft soil
stabilization, Journal of Materials in Civil Engineering, 15(4), 335-343.
Swami, R., Pundhir, N. and Mathur, S. (2007). Kimberlite tailings: a road construction material, Journal
of the Transportation Research Board, 131-134.
Tariq, A. (2012). Synergistic and Environmental Benefits of Using Cement Kiln Dust With Slag and Fly
Ash in Cemented Paste Tailings, PhD Dissertation, Civil and Environmental Engineering, The
University of Western Ontario, London, Ontario, Canada.
Tastan, E.O., Edil, T.B., Benson, C.H. and Aydilek, A.H. (2011). Stabilization of organic soils with fly
ash, Journal of Geotechnical and Geoenvironmental Engineering, 137(9), 819-833.
Tay, J. H., and Goh, A. T. (1991). Engineering properties of incinerator residue, Journal of
Environmental Engineering, 117(2), 224-235.
Trzebiatowski, B., Edil, T., and Benson, C. (2004). Case Study of Subgrade Stabilization Using Fly Ash:
State Highway 32, Port Washington, Wisconsin, Beneficial Reuse of Waste Materials in Geotechnical
and Transportation Applications, GSP No. 127, A. Aydilek and J. Wartman, eds., ASCE, Reston,
VA, 123-136.
Tuncan, A., Tuncan, M., and Koyuncu, H. (2000). Use of petroleum contaminated drilling wastes as sub-
base material for road construction, Waste Management and Research, 18(5), 489-505.
USEPA (1989). Stabilization/solidification of CERCLA and RCRA wastes: physical tests, chemical
testing procedures, technology screening, and field activities, United States Environmental Protection
Agency, EPA/625/6-89/022, Risk Reduction Engineering Laboratory, Cincinnati.
Vizcarra, G.O.C., Casagrande, M.D.T., and da Motta, L. M. G. (2013). Applicability of municipal solid
waste incineration ash on base layers of pavements. Journal of Materials in Civil Engineering, 26(6),
1-7.
Wickland, B.E. and Wilson, G.W. (2005). Self-weight consolidation of mixtures of mine waste rock and
tailings, Canadian Geotechnical Journal, 42(2), 327-339.
Wickland, B.E., Wilson, G.W., Wijewickreme, D., and Klein B. (2006). Design and evaluation of
mixtures of mine waste rock and tailings, Canadian Geotechnical Journal, 43, 928-945.
Wickland, B.E., Wilson, G.W. and Wijewickreme, D. (2010). Hydraulic conductivity and consolidation
response of mixtures of mine waste rock and tailings, Canadian Geotechnical Journal, 47(4), 472-
485.
Xenidis, A., Mylona, E., and Paspaliaris, I. (2002) Potential use of lignite fly ash for the control of acid
generation from sulphidic wastes, Waste Management 22 (6), 631-641.
Yeheyis, M.B., Shang, J.Q. and Yanful, E.K. (2009). Long-term evaluation of coal fly ash and mine
tailings co-placement: a site-specific study, Journal of Environmental Management, 91(1), 237-244.
Yilmaz, E., Benzaazoua, M., Belem, T., and Bussière, B. (2009). Effect of curing under pressure on
compressive strength development of cemented paste backfill, Minerals Engineering, 22(9), 772-785.
89
Yilmaz. E., Belem, T., Benzaazoua, M., and Bussière, B. (2010). Assessment of the modified CUAPS
apparatus to estimate in situ properties of cemented paste backfill, Geotechnical Testing Journal,
33(5), 1-12.
Yilmaz, E., Belem, T., Benzaazoua, M., Kesimal, A., Ercikdi, B., and Cihangir, F. (2011). Use of high-
density paste backfill for safe disposal of copper/zinc mine tailings, Mineral Resources Management,
27(3), 81-94.
Yilmaz, E., Belem, T., and Benzaazoua, M. (2014). Effects of curing and stress conditions on
hydromechanical, geotechnical and geochemical properties of cemented paste backfill, Engineering
Geology, 168, 23-37.
Yilmaz. E., Belem, T., Bussière, B., Mbonimpa, M., and Benzaazoua, M. (2015). Curing time effect on
consolidation behavior of cemented paste backfill containing different cement types and contents,
Construction and Building Materials, 75, 99-111.
Zhang, L., Ahmari, S. and Zhang, J. (2011). Synthesis and characterization of fly ash modified mine
tailings-based geopolymers, Construction and Building Materials, 25(9), 3773-3781.
Zhu, F., Clark, J. I., and Paulin, M. J. (1995). Factors affecting at-rest lateral stress in artificially cemented
sands, Canadian Geotechnical Journal, 32(2), 195-203.
Zou, D.H. and Li, L.P. (1999). Strengthening of solidified dilute tailings slurry, Journal of Geotechnical
and Geoenvironmental Engineering, 125(1), 11-15.