Embed Size (px)
DESCRIPTION
Facility Layout
Citation preview

Facility Layout Facility Layout
Chapter 6A
1
Facility Layout Defined Facility layout can be defined as the
process by which the placement of: departments,
workgroups within departments,
workstations
machines, and
stock-holding points
within a facility are determined. 2

This process requires the following inputs:
Specification of objectives of the system in terms of output and flexibility.
Estimation of product or service demand on the system.
Processing requirements in terms of number of operations and amount of flow between departments and work centers.
Space requirements for the elements in the layout.
Space availability within the facility itself.
Facility Layout Defined
3
4

Basic Production Layout FormatsProcess Layout
Product Layout
Group Technology (Cellular) Layout
Fixed-Position Layout
5
Product Layout Layout that uses standardized processing operations to
achieve smooth, rapid, high volume flow.
Process Layout Layout that can handle varied processing requirements.
Fixed-Position Layout Layout in which the product or project remains
stationary, and workers, materials, and equipment are moved as needed.
Basic Production Layouts
6

Basic Production Layouts
Cellular Manufacturing (Layout) Layout in which machines are grouped into a
cell that can process items that have similar processing requirements
Group Technology The grouping into part families of items with
similar design or manufacturing characteristics
http://www.makita.com/en-us/Modules/Tools/Default.aspx?CatID=26
7
Layout Structures Job shop [Process]
or Workcenter
Batch [Process] or Manufacturing Cell
Assembly line [Product]
Continuous flow [Product]
8

Process Layout (Job Shop)
FED
A B CProduct 1
Product 2
Product 3
Product 1
Product 2
Product 3
9
Process Layout –Position of equipment is dominant consideration
10

11
Process-Focused Strategy
Facilities are organized by process Similar processes (i.e. equipment)
are together Example: All drill presses are together
Low volume, high variety products ‘Jumbled’ flow Other names
Intermittent process Job shop
12

Process Layout: Interdepartmental Flow
GivenThe flow (number of moves) to and from all
departmentsThe cost of moving from one department to
anotherThe existing or planned physical layout of the
plantDetermineThe “best” locations for each department, where
best means interdepartmental transportation, or flow, costs
13
Process Focused Strategy -Pros & Cons Advantages
greater process flexibility more general purpose equipment lower initial capital investment
Disadvantages more “specialist” trained personnel
required more difficult production planning and
control
14

Layout Structures
Job shop [Process]
Batch [Process]
Assembly line [Product]
Continuous flow [Product]
15
Product Layout (Flow Shop)
FED
A B C
Product 2
Product 3
Product 1
FED
Product 2
Product 3
Product 1
16

Product Layout –Flow of product is dominantconsideration
17
18

Product-Focused Strategy Facilities are organized by product High volume, low variety products Where found
Discrete unit manufacturing Continuous process manufacturing
Other names Line flow production (flow shop) Continuous production
19
Product-Focused StrategyPros & ConsAdvantages
lower labor skills easier production planning and controlhigher equipment utilization
Disadvantages lower product flexibilitymore specialized (customized)
equipmentusually higher capital investment
20

Layout Structures
Job shop [Process]
Batch [Process]
Assembly line [Product]
Continuous flow [Product]
Group Technology a.k.a. Cell
21
Group Technology:Transition from Process Layout
1. Grouping parts into families that follow a common sequence of steps.
2. Identifying dominant flow patterns of parts families as a basis for location or relocation of processes.
3. Physically grouping machines and processes into cells.
22
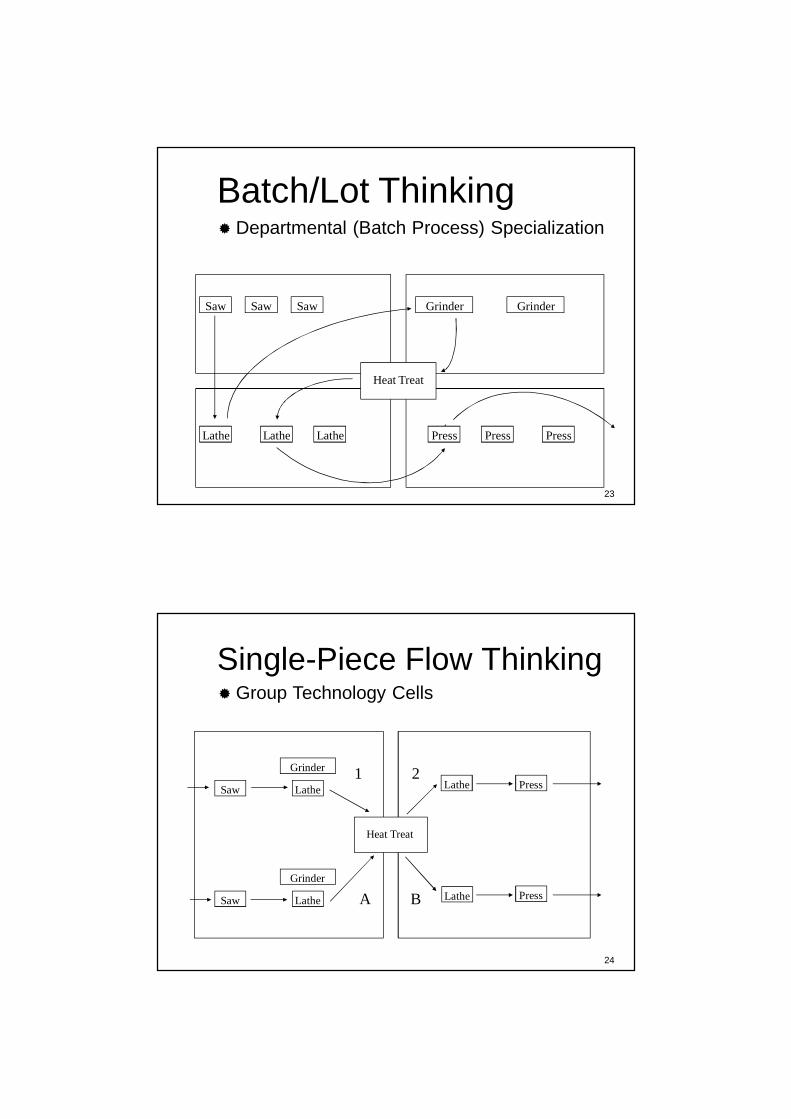
Departmental (Batch Process) Specialization
Saw Saw
Lathe PressPress
Grinder
LatheLathe
Saw
Press
Heat Treat
Grinder
Batch/Lot Thinking
23
Press
Lathe
Grinder
Grinder
A
2
BSaw
Heat Treat
LatheSaw Lathe
PressLathe
1
Group Technology Cells Single-Piece Flow Thinking
24

Assembly Line Cells
Group Technology
25
Benefits of Group Technology Changeover setup time reduced for
tooling and equipment Automation may be possible Operator may be specially (specifically)
trained with improved expertise Quality of output improved In-process inventory reduced Productivity improved Lead time reduced Improved human relations
26

27
Fixed Position (or Project) Layout
Question: What are our primary considerations for a fixed position layout?
Answer: Arranging materials and equipment concentrically around the production point in their order of use.
28

Volume and Variety of Products
Poor Strategy(Fixed costs and cost changing to other products
are high)
Volume andVariety ofProducts
Low Volume HighVariety Process
(Intermittent)
RepetitiveProcess
(Modular)
High VolumeLow Variety
Process(Continuous)
One or very fewunits per lot
Projects
Very small runs, highvariety
Job Shops
Modest runs, modestvariety
DisconnectedRepetitive
Long runs, modestvariations
ConnectedRepetitive
Very long runs,Changes inattributes
Continuous
Poor Strategy(High variable
costs)
Aluminum part
Cell Assembly
Motor Assembly
Part Molding
Tool Design
29
Summary - Comparison
Process Focus Product Focus1. Product: Smallquantity, largevariety
1. Product: Largequantities, smallvariety
2. Equipment:General purpose
2. Equipment:Special-purpose
3. Operators broadlyskilled
3. Operators lessbroadly skilled
4. Many jobinstructions
4. Few work orders and job instructions;standardization
Bank
30

Process/Product ContinuumProcess Focused
(intermittent process)Product Focused
(continuous process)
Continuum
High variety, low volumeLow utilization
General-purpose equipment
Low variety, high volumeHigh utilization
Specialized equipment
Group Technology /Cell
31
Station 1
Minutes per Unit 6
Station 2
7
Station 3
3
Assembly Lines Balancing Concepts
Question: Suppose you load work into the three work stations below such that each will take the corresponding number of minutes as shown. What is the cycle time of this line?
Answer: The cycle time of the line is always determined by the work station taking the longest time. In this problem, the cycle time of the line is 7 minutes. There is also going to be idle time at the other two work stations.
32
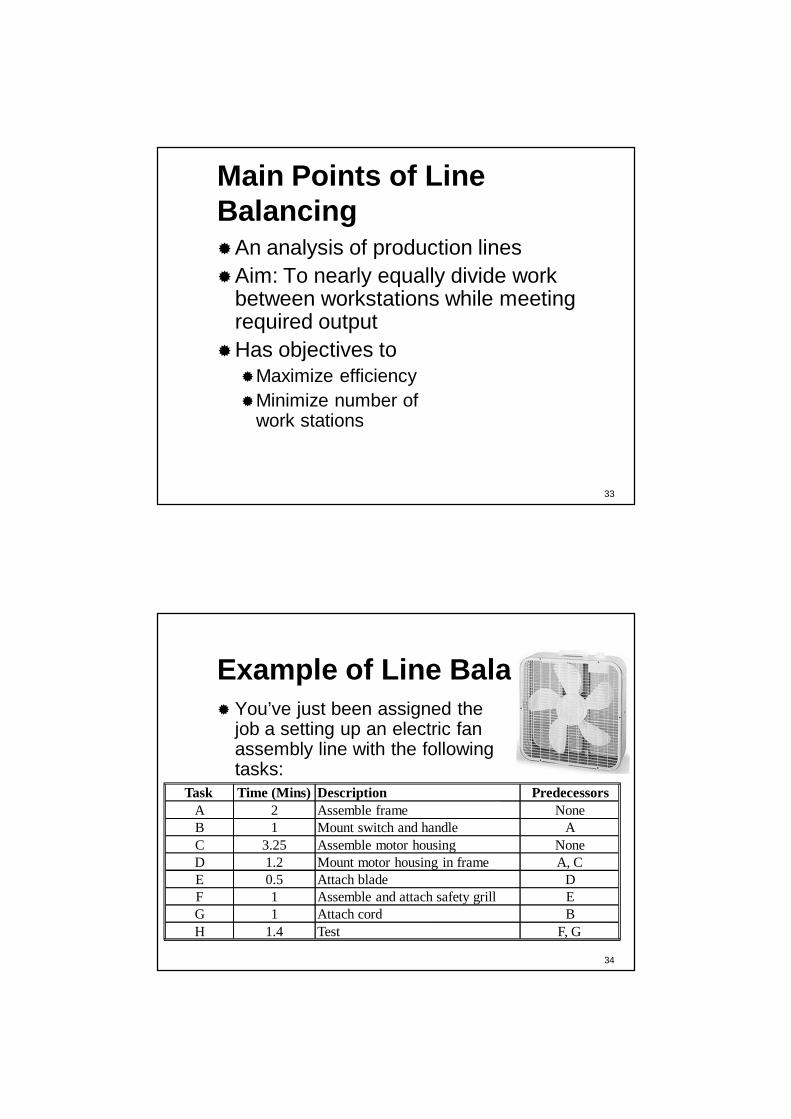
Main Points of Line BalancingAn analysis of production linesAim: To nearly equally divide work
between workstations while meeting required output
Has objectives toMaximize efficiencyMinimize number of
work stations
33
Example of Line Balancing You’ve just been assigned the
job a setting up an electric fan assembly line with the following tasks:
Task Time (Mins) Description PredecessorsA 2 Assemble frame NoneB 1 Mount switch and handle AC 3.25 Assemble motor housing NoneD 1.2 Mount motor housing in frame A, CE 0.5 Attach blade DF 1 Assemble and attach safety grill EG 1 Attach cord BH 1.4 Test F, G
34

Example of Line Balancing: Structuring the Precedence Diagram
Task PredecessorsA None
A
B A
B
C None
C
D A, C
D
Task PredecessorsE D
E
F E
F
G B
G
H F, G
H
35
Example of Line Balancing: Precedence Diagram
A
C
B
D E F
GH
2
3.25
1
1.2 .5
11.4
1
Question: Which process step defines the maximum rate of production?
Answer: Task C is the cycle time of the line and therefore, the maximum rate of production.
36

Example of Line Balancing: The Bottleneck
Task Time (Mins) Description PredecessorsA 2 Assemble frame NoneB 1 Mount switch AC 3.25 Assemble motor housing NoneD 1.2 Mount motor housing in frame A, CE 0.5 Attach blade DF 1 Assemble and attach safety grill EG 1 Attach cord BH 1.4 Test E, G
Max Production = Production time per day
Bottleneck time=
420 mins3.25 mins / unit
= 129 units
Total 11.35 Minutes = Sum of the task times ≈ Operation time 37
Process Performance Metrics
Operation time = Setup time + Run time
Throughput time = Average time for a unit tomove through the system
Velocity = Throughput timeValue-added time
[time to produce each unit x batch size]
[time to prepare a machine or system to make a particular item or unit]
[for a particular machine or contiguous discrete system]
[time unit spends being worked on plus time spent waiting in queue]
[time unit spends being worked or the cumulative activity operation times]
[a.k.a. Throughput Ratio]
[> or = 1]
38

Example of Line Balancing: Determine Cycle Time
Required Cycle Time, C = Production time per periodRequired output per period
C = 420 mins / day100 units / day
= 4.2 mins / unit
Question: Suppose we want to assemble100 fans per day. What would our cycletime have to be?
Answer:
Question: What else can the 4.2 min time be called other than cycle time? (i.e. ‘Pull’) 39
Task Time (Mins) Description PredecessorsA 2 Assemble frame NoneB 1 Mount switch AC 3.25 Assemble motor housing NoneD 1.2 Mount motor housing in frame A, CE 0.5 Attach blade DF 1 Assemble and attach safety grill EG 1 Attach cord BH 1.4 Test E, G
Example of Line Balancing: Determine Theoretical Minimum Number of Workstations
Question: What is the theoretical minimum number of workstations for this problem?
40
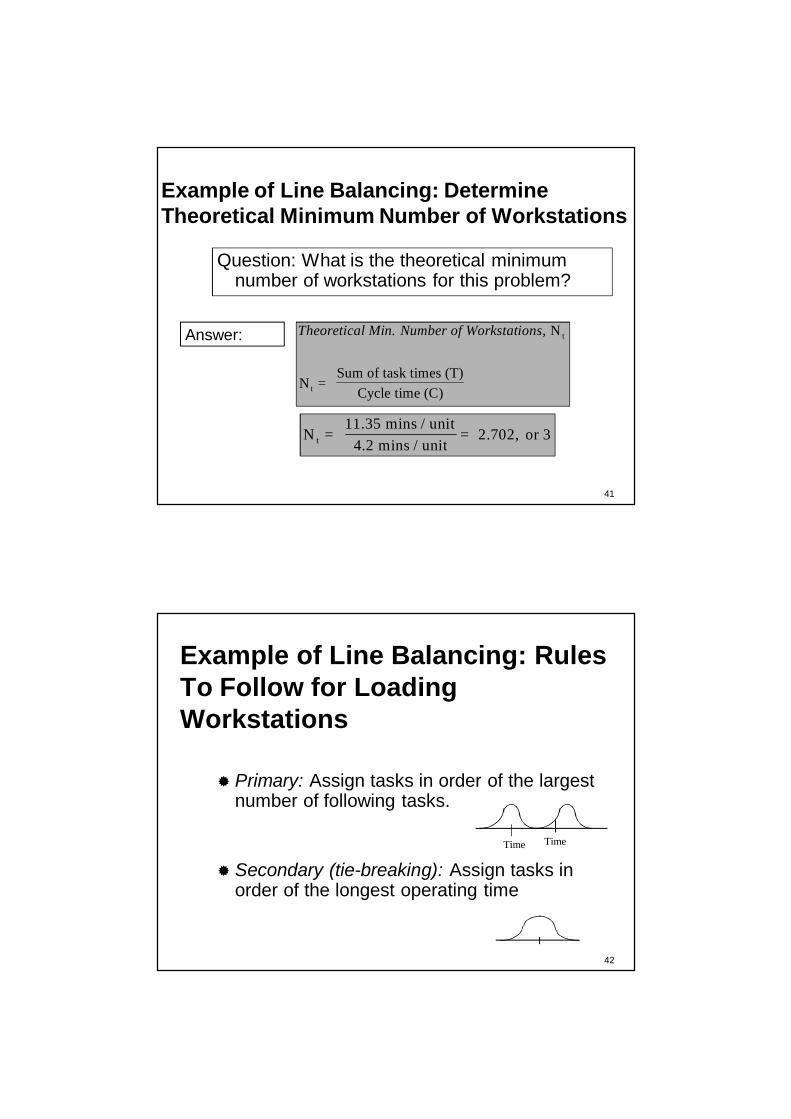
Example of Line Balancing: Determine Theoretical Minimum Number of Workstations
Question: What is the theoretical minimum number of workstations for this problem?
Answer: Theoretical Min. Number of Workstations, N
N = Sum of task times (T)
Cycle time (C)
t
t
N = 11.35 mins / unit
4.2 mins / unit= 2.702, or 3t
41
Example of Line Balancing: Rules To Follow for Loading Workstations
Primary: Assign tasks in order of the largest number of following tasks.
Secondary (tie-breaking): Assign tasks in order of the longest operating time
Time Time
42

A
C
B
D E F
GH
2
3.25
1
1.2 .5
11.4
1
Station 1 Station 2 Station 3
Task Followers Time (Mins)A 6 2C 4 3.25D 3 1.2B 2 1E 2 0.5F 1 1G 1 1H 0 1.4
4.2 min 4.2 min
43
A
C
B
D E F
GH
2
3.25
1
1.2 .5
11.4
1
Station 1 Station 2 Station 3
A (4.2-2=2.2)
Task Followers Time (Mins)A 6 2C 4 3.25D 3 1.2B 2 1E 2 0.5F 1 1G 1 1H 0 1.4
44

A
C
B
D E F
GH
2
3.25
1
1.2 .5
11.4
1
A (4.2-2=2.2)B (2.2-1=1.2)
Task Followers Time (Mins)A 6 2C 4 3.25D 3 1.2B 2 1E 2 0.5F 1 1G 1 1H 0 1.4
Station 1 Station 2 Station 3
45
A
C
B
D E F
GH
2
3.25
1
1.2 .5
11.4
1
A (4.2-2=2.2)B (2.2-1=1.2)G (1.2-1= .2)
Idle= .2
Task Followers Time (Mins)A 6 2C 4 3.25D 3 1.2B 2 1E 2 0.5F 1 1G 1 1H 0 1.4
Station 1 Station 2 Station 3
46

A
C
B
D E F
GH
2
3.25
1
1.2 .5
11.4
1
C (4.2-3.25)=.95
Task Followers Time (Mins)A 6 2C 4 3.25D 3 1.2B 2 1E 2 0.5F 1 1G 1 1H 0 1.4
A (4.2-2=2.2)B (2.2-1=1.2)G (1.2-1= .2)
Idle= .2
Station 1 Station 2 Station 3
47
C (4.2-3.25)=.95
Idle = .95
A
C
B
D E F
GH
2
3.25
1
1.2 .5
11.4
1
Task Followers Time (Mins)A 6 2C 4 3.25D 3 1.2B 2 1E 2 0.5F 1 1G 1 1H 0 1.4
A (4.2-2=2.2)B (2.2-1=1.2)G (1.2-1= .2)
Idle= .2
Station 1 Station 2 Station 3
48
C (4.2-3.25)=.95
Idle = .95
A
C
B
D E F
GH
2
3.25
1
1.2 .5
11.4
1
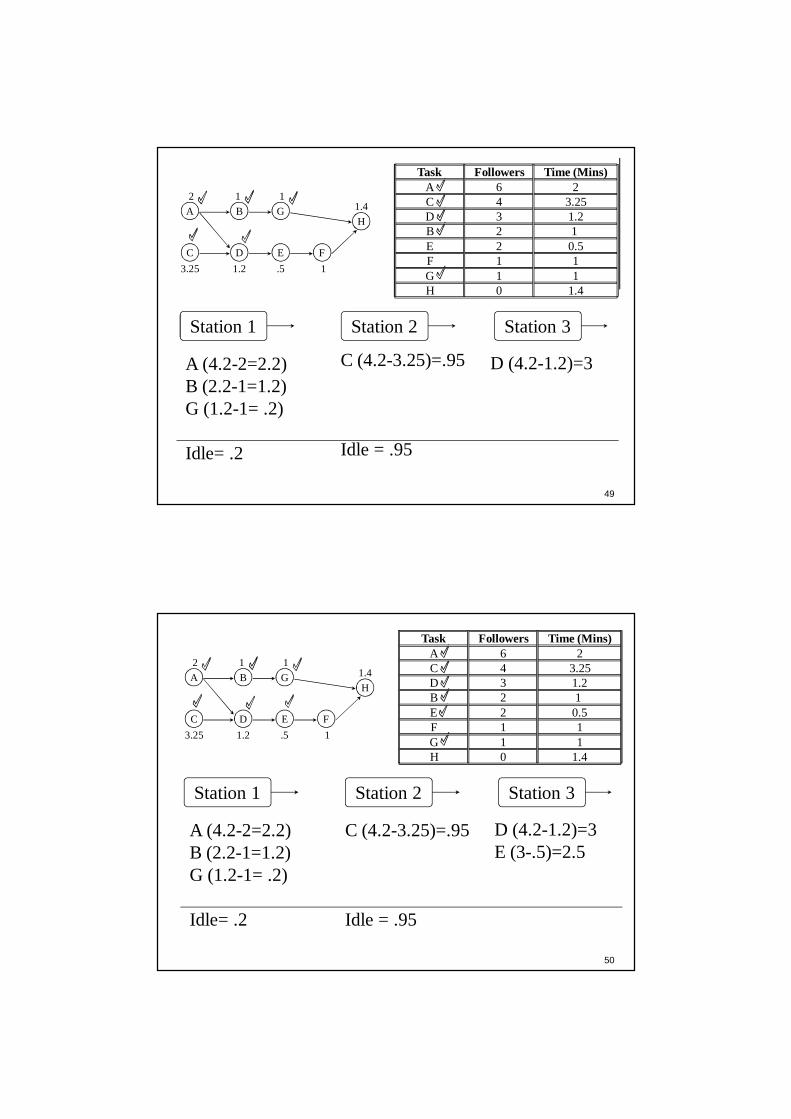
D (4.2-1.2)=3
Task Followers Time (Mins)A 6 2C 4 3.25D 3 1.2B 2 1E 2 0.5F 1 1G 1 1H 0 1.4
A (4.2-2=2.2)B (2.2-1=1.2)G (1.2-1= .2)
Idle= .2
Station 1 Station 2 Station 3
49
A
C
B
D E F
GH
2
3.25
1
1.2 .5
11.4
1
C (4.2-3.25)=.95
Idle = .95
D (4.2-1.2)=3E (3-.5)=2.5
Task Followers Time (Mins)A 6 2C 4 3.25D 3 1.2B 2 1E 2 0.5F 1 1G 1 1H 0 1.4
A (4.2-2=2.2)B (2.2-1=1.2)G (1.2-1= .2)
Idle= .2
Station 1 Station 2 Station 3
50

A
C
B
D E F
GH
2
3.25
1
1.2 .5
11.4
1
C (4.2-3.25)=.95
Idle = .95
D (4.2-1.2)=3E (3-.5)=2.5F (2.5-1)=1.5
Task Followers Time (Mins)A 6 2C 4 3.25D 3 1.2B 2 1E 2 0.5F 1 1G 1 1H 0 1.4
A (4.2-2=2.2)B (2.2-1=1.2)G (1.2-1= .2)
Idle= .2
Station 1 Station 2 Station 3
51
Which station is the bottleneck? What is the effective cycle time?
A
C
B
D E F
GH
2
3.25
1
1.2 .5
11.4
1
C (4.2-3.25)=.95
Idle = .95
D (4.2-1.2)=3E (3-.5)=2.5F (2.5-1)=1.5H (1.5-1.4)=.1Idle = .1
Task Followers Time (Mins)A 6 2C 4 3.25D 3 1.2B 2 1E 2 0.5F 1 1G 1 1H 0 1.4
A (4.2-2=2.2)B (2.2-1=1.2)G (1.2-1= .2)
Idle= .2
Station 1 Station 2 Station 3
52

Example of Line Balancing: Determine the Efficiency of the Assembly Line
Efficiency =Sum of task times (T)
Actual number of workstations (Na) x Cycle time (C)
Efficiency =11.35 mins / unit(3)(4.2mins / unit)
=.901
53
Assembly Line BalancingThe General Procedure Determine cycle time by taking the demand
(or production rate) per day and dividing it into the productive time available per day
Calculate the theoretical minimum number of work stations by dividing total task time by cycle time
Perform the line balance and assign specific assembly tasks to each work station
54

Assembly Line Balancing Steps1. Determine tasks (operations)2. Determine sequence3. Draw precedence diagram4. Estimate task times5. Calculate cycle time 6. Calculate number of work stations7. Assign tasks (load workstations) 8. Calculate efficiency
Basic Project
Mgt.
55
Mixed-Model ProcessingShort cycle-interval (time) Production of a variety of types,
sizes, or models of a product family on the same line or within the same cell.
56

Example – The Fresh Bakery: Cakes
Daily sales for: 24 Product L (Lemon Pound)
12 Product M (Chocolate Mud)
3 Product N (Nine Layer Carrot)
Questions:What is the best schedule for these
products?What are we assuming for this schedule to
work?57
ExampleDaily sales for: 24 Product L
12 Product M3 Product N
Step 1 - find minimum ratio8 L -- 4 M – 1 N
Step 2- determine number of cycles39/13 = 3
58

Example In order to meet daily demand, this
cycle will have to repeat 3 timesStep 3 - find the mix of the units that
is most repetitive.LLM LLM N LLM LLM
What are we assuming for this schedule to work?
Demand is uniform and our objective is to avoid inventory.
59
Mixed Model
Auto Industry
60