Embed Size (px)
Citation preview
Ministry of Agriculture and Food Security
MOZAMBIQUE NATIONAL
AGRICULTURAL INVESTMENT
PLAN
(PNISA):
ASSESSMENT
MAPUTO, NOVEMBER 2017
ACKNOWLEDGMENTS
The technical team which prepared this draft report, in close collaboration with technical officers
from MASA, is comprised of 3 consultants: Dr. Richard Anson (international consultant); Dr.
Joao Mutundo (consultant and Associate Professor of Agricultural Economics, Universidade
Eduardo Mondlane; and Dr. Helder Zavale, Senior Lecturer of Agricultural Economics,
Universidade Eduardo Mondlane).
This report is a result of team efforts of different institutions and experts. Gratitude is conveyed to
the management and technical officers from the Ministry of Agriculture and Food Security
(MASA), especially from the Directorate of Planning and International Cooperation (DPCI),
under the leadership of its National Director, Mr. Ilídio Massinga. Eng. Delfim Vilissa ably
coordinated a core team of technical officers composed of Anina Manganhela, Duque Willson
and Sofia Manusaa from DPCI, and provided valuable inputs and guidance.
Appreciation is also expressed to officials from other key stakeholder groups who collaborated in
providing useful information, feedback and insights on the implementation of National
Agricultural Investment Plan (PNISA) and other relevant initiatives. These stakeholder groups
included:
the other related Government Ministries (especially Ministry of Land, Environmental,
and Rural Development/MITADER; Ministry of Economy and Finance (MEF); Ministry
of Industry and Trade (MIC); Ministry of Sea, Interior Water and Fisheries (MMAIP);
and Ministry of Public Works, Housing, and Water Resources);
authorities and other stakeholders from four Provinces (Gaza, Niassa, Tete, Zambezia);
technical officers from the development partner working group (Agriculture and Rural
Economic Development – AGRED);
representatives from the private sector, civil society, and academia.
Finally, appreciation is also conveyed to AGRA, FAO and World Bank for funding this PNISA
assessment.
ii
Table of Contents
ACKNOWLEDGMENTS ................................................................................................................ i
LIST OF ANNEXES ...................................................................................................................... iii
LIST OF FIGURES ......................................................................................................................... v
ACRONYMS AND ABBREVIATIONS ...................................................................................... vii
EXECUTIVE SUMMARY ............................................................................................................ ix
1 INTRODUCTION AND BACKGROUND ............................................................................ 1
1.1 Overview ............................................................................................................................... 1
1.2 Lessons Learned from Other Sub Sahara African Countries ................................................. 2
2 OBJECTIVES, SCOPE AND METHODOLOGICAL APPROACH ..................................... 4
2.1 Objectives .............................................................................................................................. 4
2.2 Scope ..................................................................................................................................... 4
2.3 Methodological Approach ..................................................................................................... 5
2.3.1 Evaluation criteria. .......................................................................................................... 5
2.3.2 Methods, Theory of Change and Results Framework ..................................................... 5
2.3.3 Stakeholder Consultations ............................................................................................... 7
3 MAIN FINDINGS ................................................................................................................... 8
3.1 Program Development Objectives ......................................................................................... 8
3.2 PNISA Structure .................................................................................................................. 15
3.3 Results Area 1: Increased Production and Productivity ...................................................... 16
3.3.1 Food Crop Program ....................................................................................................... 16
3.3.2 Cash Crop Program ....................................................................................................... 19
3.3.3 Fisheries and Aquaculture Program .............................................................................. 23
3.3.4 Livestock Program......................................................................................................... 25
3.3.5 Research Program .......................................................................................................... 29
3.3.6 Agricultural Extension Program .................................................................................... 31
3.3.7 Agricultural Irrigation Program ..................................................................................... 32
3.3.8 Agricultural Mechanization Program ............................................................................ 34
3.4 Results Area 2: Expanded and Inclusive Access to Markets ............................................... 39
3.4.1 Post-Harvest Management and Marketing program ...................................................... 39
3.4.2 Financial Services Program ........................................................................................... 42
3.4.3 Agribusiness support program ....................................................................................... 45
3.4.4 Rural Roads Program .................................................................................................... 48
iii
3.4.5 Agricultural Statistics and Information Systems Program ............................................ 50
3.5 Results Area 3: Improved Food and Nutritional Security ................................................... 53
3.5.1 Multisectorial Monitoring and Coordination of Food and Nutritional Security Program
....................................................................................................................................... 53
3.5.2 Improving Access to and Utilization of High-nutritional Foods ................................... 55
3.6 Results Area 4: Improved Natural Resources ...................................................................... 58
3.6.1 Land for Agricultural Purposes Program....................................................................... 58
3.6.2 Forest and Wildlife Program ......................................................................................... 60
3.6.3 Institutional Development of DNTF Program ............................................................... 61
3.6.4 Mapping and Remote Sensing Program ........................................................................ 62
3.7 Results Area 5: Strengthened and Reformed Institutions .................................................... 66
3.7.1 Institutional Reform Program ........................................................................................ 66
3.7.2 Institutional Strengthening Program .............................................................................. 66
3.8 Cross Cutting Themes ......................................................................................................... 70
3.8.1 Decentralization ............................................................................................................. 70
3.8.2 Gender and Youth.......................................................................................................... 70
3.8.3 Monitoring and Evaluation System ............................................................................... 71
3.9 Budgetary and Financing Aspects ....................................................................................... 72
3.10 Emerging Strategic Lessons ................................................................................................ 76
4 STRATEGIC CONCLUSIONS AND CORE RECOMMENDATIONS ............................. 78
4.1 Main Conclusions ................................................................................................................ 78
4.2 Core Recommendations ....................................................................................................... 83
LIST OF ANNEXES (see separate Volume)
1: Results Framework for PNISA (reconstructed for PNISA)
2: Stakeholder Consultations: Guide Questionnaire
3: Provincial Stakeholders’ Consultations: Summary of Provincial Reports
4: Synthesis of Relevant Lessons Learned of NAIPs in Selected African Countries
5: Summary of Agriculture Public Expenditure Analyses in Mozambique
6: PNISA Assessment: Roadmap for Implementation of Proposed Core Recommendations
7: List of Main References
iv
LIST OF TABLES
Table 1 Assessment of PNISA PDO level indicators .................................................................... 14
Table 2 Structure of PNISA .......................................................................................................... 15
Table 3 Assessment of targets for food crop and cash crop programs .......................................... 17
Table 4 Assessment of targets for the fisheries and aquaculture program .................................... 24
Table 5 Summary of the assessment of core indicators under Result Area 1 ................................ 37
Table 6 Summary of the assessment of core indicators under Result Area 2 ................................ 52
Table 7 Summary of the assessment of the core indicator under Result Area 3 ........................... 57
Table 8 Strategic objectives by component: Improved natural resource management ................. 59
Table 9 Summary of results: Mapping and remote sensing program ............................................ 63
Table 10 Summary of the assessment of the core indicators under Result Area 4 ........................ 65
Table 11 Summary of the assessment of the core indicators under Result Area 5 ........................ 69
Table 13 Proposed Roadmap for Formulation of PEDSA 2 and PNISA 2 ................................... 89
v
LIST OF FIGURES
Figure 1: Results Framework for Assessment of PNISA: Theory of Change and Supporting
Results Chain ................................................................................................................... 6
Figure 2 Trend in agriculture GDP .................................................................................................. 9
Figure 3 Trends in poverty headcount incidence........................................................................... 11
Figure 4 Trends in stunting and wasting ....................................................................................... 12
Figure 5 Trends in cereals and beans yield ................................................................................... 18
Figure 6 Trends in Irish potato and tomato yields ......................................................................... 19
Figure 7 Gap between proposed and actual financing for the food crop program ........................ 19
Figure 8 Trends of marketed cashew nuts ..................................................................................... 21
Figure 9 Trends of soybean production ......................................................................................... 21
Figure 10 Trends in sunflower production .................................................................................... 22
Figure 11 Gap between proposed and actual financing for cash crop program ............................ 23
Figure 12 Trends in aquaculture and marine fish production ........................................................ 25
Figure 13 Number of cattle, pigs, goats and chicken .................................................................... 27
Figure 14 Trend in vaccinated cattle ............................................................................................. 27
Figure 15 Gap between proposed and actual financing for livestock program ............................. 28
Figure 16 Gap between proposed and actual financing for research program .............................. 30
Figure 17 Trend of the number of extension agents by service provider ...................................... 31
Figure 18 Gap between approved budget and actual financing for the extension program ......... 32
Figure 19 Gap between proposed and actual financing for the irrigation program ....................... 34
Figure 20 Gap between proposed budget and actual expenditure for the mechanization
program .......................................................................................................................... 36
Figure 21 Comparison between PNISA proposed budget and actual expenditure on expanded
access to markets ........................................................................................................... 39
Figure 22 Sales of selected agricultural commodities by smallholder farmers ............................. 40
Figure 23 Comparison between PNISA proposed budget and actual expenditure on post-
harvest management and marketing .............................................................................. 41
Figure 24 Most problematic factor for doing business in Mozambique: 2013 - 2017 .................. 42
Figure 25 Trends in loans to the economy .................................................................................... 43
Figure 26: Net export of goods during the period 2012 through 2016 ......................................... 46
Figure 27 Trends in classified roads in Mozambique .................................................................... 49
Figure 28 Trends in classified roads by road type ......................................................................... 49
Figure 29 Comparison between PNISA proposed budget and actual expenditure on
agricultural statistics and information systems .............................................................. 51
vi
Figure 30 PNISA proposed budget and actual expenditure on food and nutritional security
result area ....................................................................................................................... 53
Figure 31 Comparison between PNISA proposed budget and actual expenditure on
multisectorial coordination for food and nutritional security ........................................ 55
Figure 32 Comparison of PNISA proposed budget and actual expenditure in Improving
Access to and Utilization of High-nutritional Foods results area .................................. 56
Figure 33 Gap between proposed and actual financing for the land for agricultural process ....... 60
Figure 34 Comparison between PNISA proposed budget and actual expenditure for the
forest and wildlife program............................................................................................ 61
Figure 35 Gap between proposed and actual financing for the institutional development of
DNTF ............................................................................................................................. 62
Figure 36 Comparison between PNISA proposed budget and actual expenditure for the
mapping and remote sensing program ........................................................................... 64
Figure 37 Comparison between PNISA proposed budget and actual expenditure for the
institutional strengthening program ............................................................................... 68
Figure 38 Distribution of PNISA proposed budget for the period 2013-2017 .............................. 72
Figure 39 PNISA proposed budget and actual expenditure by result area for the period 2013-
2016 ............................................................................................................................... 73
Figure 38 Investment expenditure by source over the period 2013-2016 ..................................... 74
Figure 39 Approved investment and investment expenditure by source ....................................... 75
vii
ACRONYMS AND ABBREVIATIONS
AgRED Donor Working Group for Agriculture and Rural Development
CAADP Comprehensive Africa Agriculture Development Program
CCSA Comité de Coordenação do Sector Agrário (Agricultural Sector Coordinating
Committee)
CEPAGRI Centro de Promoção de Agricultura (Center for the Promotion of Commercial
Agriculture)
CTA Confederação das Associações Económicas
DUAT land use right
FAO Food and Agriculture Organization of the United Nations
GDP Gross Domestic Product
ha hectare
IIAM Instituto de Investigação Agrária de Moçambique
JSR Joint Sector Review
kg kilogram
M&E Monitoring and Evaluation
MAFAP Monitoring African Food and Agricultural Policies
MT Metric Tons
MZM Mozambican Metical
NAIP National Agricultural Investment Plan
NEPAD New Partnership for Africa's Development
NGO Nongovernmental Organization
NPCA NEPAD Planning and Coordinating Agency
ORAM Organização Rural de Ajuda Mútua (Rural Organization for Mutual Support)
PAEI Política Agrária e Estratégia de Implementação (Agricultural Policy and
Implementation Strategy)
viii
PARPA Plano de Acção para Redução da Pobreza Absoluta (Action Plan for the
Reduction of Absolute Poverty)
PEDSA Plano Estratégico de Desenvolvimento do Sector Agrário (Strategic Plan for
Agricultural Sector Development)
PNISA Programa Nacional de Investimentodo Sector Agrário (National Agricultural
Investment Plan)
PQG Plano Quinquenal do Governo (Five-Year Program of Government)
ReSAKKS–SA Regional Strategic Analysis Knowledge Support System for Southern Africa
TIA Trabalho de Inquérito Agrícola (Rural Household Income Surveys)
UEM Universidade Eduardo Mondlane (Eduardo Mondlane University)
UNAC UniãoNacional dos Camponeses(National Farmers’ Union)
ix
EXECUTIVE SUMMARY
INTRODUCTION
i. The National Agricultural Investment Plan (NAIP), referred to in Mozambique as Plano de Investimento
no Sector Agrário (PNISA, 2013 - 2017), is a national program which aims to operationalize Plano Estratégico
para o Desenvolvimento do Sector Agrário (PEDSA: 2010 – 2020); also, PNISA is inspired by and aligned with
three framework documents/programs: Mozambique’s Five-Year Government Plan, referred to as Plano
Quinquenal do Governo (PQG) – starting in 2010-2014, and now 2015-2019); PEDSA; and the Comprehensive
Africa Agriculture Development Program (CAADP).
ii. Emerging NAIP Cross-Country Lessons. In support of a strategic approach to the assessment of PNISA,
the team synthesized 7 African cross-country NAIP-derived lessons which are considered to be more pertinent
for enhancing Mozambique’s PNISA. These lessons also provide useful guidelines to enable Mozambique to
better achieve the MALABO commitments (7 core areas) applied to the Mozambican context. These 7
continental-wide lessons highlight the importance of:
Lesson 1: Strong operational alignment of the NAIP with relevant policy and strategy frameworks;
Lesson 2: Robust institutional and multi-stakeholder coordination arrangements and mechanisms, to be
functional within and outside the agricultural sector, and at various levels (central and local
governments)
Lesson 3: Effective formulation and utilization of the medium and annual planning and implementation of the
budgetary cycle, together with relevant supporting processes and tools;
Lesson 4: Ensuring financing mechanisms are appropriately sequenced and utilized, and to be driven by the
strategic result areas, supporting programs and strategically prioritized interventions;
Lesson 5: Active engagement of an inclusive and strengthened private sector throughout the planning and
implementation cycle;
Lesson 6: Integrated decentralization arrangements/mechanisms, utilizing the annual work plan and budgetary
cycle of participating local government entities;
Lesson 7: Improved and operational monitoring and evaluation (M&E) system, to be proactively utilized as a
key tool for enhancing evidenced-based decision-making, ensuring mutual accountability, making
timely enhancements and generating strategic results.
iii. Objectives, Scope and Methodological Aspects. The overall objective is to conduct an assessment of
PNISA’s performance in terms of identifying key achievements, gaps, lessons learned, and strategic
recommendations to achieve more fully and effectively its objectives and key targets. The evaluation exercise
focuses on addressing two main aspects:
Performance: main achievements/results and key gaps and challenges to meet its objectives and
strategic targets, including relevant strategic targets outlined under PEDSA, PNISA and the MALABO
Declaration; and
Recommendations and Road-Map: recommendations will be framed in terms of a road-map for
supporting the achievement and mutual accountability of PNISA’s strategic objectives and more
realistic and updated targets.
iv. The scope of the assessment. The PNISA assessment covered PNISA’s 5 results areas (equivalent to
components in the PNISA document), 3 cross-cutting themes and 21 supporting programs. The time period for
the assessment is from 2013 to 2016, and also covering 2017 subject to availability of data.
x
v. Methodological Approach. The assessment is guided by the following methodological features:
Utilization of best practice evaluation criteria, namely: lessons learned, relevance, effectiveness,
efficiency, results, and sustainability.;
Mixed methods approach, involving both qualitative and quantitative aspects;
Reconstructing PNISA’s theory of change (ToC) and a results framework (RF) to provide a robust
“lens” and tools to balance a backward and forwarding looking approach to assessing and deriving a
constructive roadmap for enhancing PNISA’s performance and strategic results;
Utilization of available data/information, and
Consultations with multiple stakeholders at the national and provincial levels. These consultations
brought diverse stakeholders from: Maputo City and four selected provinces (Niassa,Zambézia, Tete
and Gaza), from which included interviews with a total of about 80 diverse stakeholders involved in the
agricultural sector; and
Application of relevant lessons from other NAIPs in Africa and from the PNISA experience.
STRATEGIC CONCLUSIONS
vi. Based on the above approach, this assessment has highlighted 7 strategic conclusions. These
conclusions focus on key design features and the performance of “core drivers” toward achieving PNISA’s
overall objectives and strategic targets, especially at the impact and outcome levels.
1) PNISA’s Mixed Design Aspects: In general, PNISA was well designed, although strategic requirements and
implementation experience also highlight key challenges which were not addressed adequately in the design
stage, and also neglected during subsequent implementation. In summary:
PNISA’s positive design aspects include:
Addresses most of the relevant agricultural sector issues and thematic areas;
Is aligned generally with PQG and CAADP framework and processes;
Estimated required financial resources for each result area, program and subprogram;
Promoted the active engagement of key stakeholders during the design stage (e.g., Government entities
at both central and provincial levels, private sector, development partners, NGOs, academia) during the
design phase.
PNISA’s challenging aspects include neglect/inadequate:
Operational strategy and plan for expanding the vital role of the private sector; also, PNISA did not
include clear operational roles and targets involving private sector;
Operational content on some key sub-programs, such as international trade under the market access
result area;
Establishment of indicators and their respective targets for some of the key programs (eg: Market
access, institutional strengthening);
Operationalized M&E system, supported by clear and adequate accountability systems;
Strategy and mechanisms for mobilizing the required financial resources to close the large financing gap
(85%, which has persisted until this date);
Formulation of different funding and implementation scenarios (high, medium and low), taking into
account the possible and actual available funds.
2) Emerging Sound Policy and Institutional Environment and PNISA’s Limited Role: During the PNISA
implementation period, there were several key agricultural policies and strategies which were formulated,
approved and at various stages of implementation, although some of them need to be further deepened and
operationalized to generate the required and sustained benefits. Thus far, PNISA has played a relatively minor
role in helping to further operationalize these key policy and institutional initiatives, due to three main types of
constraints --- funding, technical capacities, and coordination.
3) Variable Achievement of PNISA’s Impact, Outcome and Output Results. After nearly five years of
implementation, tangible results at impact and outcome levels which can be attributed clearly to PNISA, are still
xi
in their early stages. The assessment report highlights the main achievements and key gaps according to PDO
level, the 5 result areas and the 3 cross-cutting themes in terms of “core” indicators, or those which comprise the
drivers in achieving PNISA’s objectives. The following section highlights some examples of these variable
results.
(a) There is a significant shortfall in achieving the ambitious agricultural growth rate target (actual rate of about
3.5% per year vs. the target of 7 % per year);
(b) Other key targets show mixed performance: nutritional, poverty reduction, private sector role and investment
levels, and crop yields of key food crops (cereals and beans) have lagged behind; yields for some crops (e.g.,
tomato, Irish potato, sugarcane) are very promising, but at early stages of increases; expanded rural roads,
although not adequately prioritized according to agricultural potential; establishment of service centers, although
with unclear results and with a need to ensure sustainability.
(c) A shortfall in the target allocation of agricultural public expenditures as a share of total public expenditures -
- 6 to 7% approved allocations vs. 10% target allocations;
(d) Some other tangible key results, albeit mixed, are in the incipient stages, including:
Improved agricultural varieties, although exhibiting relatively low farmer adoption rates (e.g, 10% vs.
an ambitious target of 100%);
Expanded access to land ownership and security by smallholders, while also needing expanded results;
Fisheries expansion and diversification, while also in initial stages; there is introduction and promotion
of aquaculture as a viable farm level enterprise, also at an incipient stage; expanded use of motorized
boats for off-shore fishing;
Expanded irrigation works, although there was a significant shortfall in meeting the targets (e.g., 20,000
ha vs. a target of 50,000 ha), and need for greater attention on operational and maintenance (O&M); and
Limited value chain development initiatives.
4) PNISA’s Major Financing Shortfalls: The most notable finding of the assessment is that the required
financing was not mobilized and released to implement the envisioned PNISA programs. During the period
2013-2016, there are 4 financing indicators which reveal different dimensions of the financing challenges: (a)
the actual expenditures were only 15% of the required funding; (b) the approved budget was only 26% of the
required funding; and (c) the actual expenditures were only 57% of the approved budget; (d) disbursed budget
(releases from the Ministry of Economy and Finance) also was only 57% of the approved budget (the %s are
coincidental). Moreover, during the implementation period, MASA did not adjust downwards the envisioned
and ambitious targets, at the Program Development Objectives (PDO) level, and for each of the 21 programs.
Therefore, it is not surprising that there are significant shortfalls in meeting many of the PNISA targets, while
also recognizing that some of the targets are on track (e.g., yields for some crops; generation of improved crop
varieties);
5) Limited and incipient role of the VITAL inclusive private sector and Promising Potential in Value
Chain Development (VCD) initiatives: There is increasing recognition of the VITAL role of promoting an
inclusive and broad-based private sector role to contribute to CAADP’s broader vision of agricultural
transformation. The role of the private sector in Mozambique is at an incipient stage, and needs to be promoted
through a combination of policy, institutional and investment interventions. There are some emerging
promising experiences involving private sector-driven value chain development (VCD) for commodities for
which Mozambique can become competitive (e.g, MITADER has launched a major program of VCD, and
prepared numerous business plans for financing). MASA is generating some emerging success stories of VCDs
(e.g., sugarcane; tobacco; cotton; soybean; poultry); however, these initiatives need to be scaled up, especially to
ensure inclusion of smallholders.
6) PNISA’s Limited Effective Coordination. While there is consensus on the urgency of significantly
strengthening coordination (within MASA and especially with other Ministries/stakeholders, such as
MITADER, and through the CCSA), thus far there is little evidence of tangible progress. Hence, there is an
urgent need for strengthening appropriate coordination mechanisms/processes; for example, there is a need to
build on existing coordination mechanisms, such as fully activating and supporting the CCSA).
xii
7) Core Drivers for Agricultural Transformation are at Early Stage of Activation: The theory of change
developed for the PNISA assessment provides a roadmap for helping to prioritize the main types and mix of
prioritized interventions, involving policies, institutional reforms and investments, especially by an expanded
and strengthened private sector. Available evidence from PNISA implementation seems to validate the
soundness of the proposed roadmap. However, this assessment shows that there are some strategic programs
which comprise key drivers and which need further strengthening and adequate funding to ensure they generate
the potential results which will contribute toward agricultural transformation.
CORE RECOMMENDATIONS AND SUPPORTING ROADMAP
vii. The identified gaps/shortcomings ---technical, capacity, financial, and coordination aspects ---in
achieving PNISA’s strategic objectives and targets highlights the need for Government, led by MASA, in close
collaboration with key stakeholders, to:
enhance the strategic content and/or targets of the 21 programs;
intensify implementation, with tangible results;
improve significantly the effectiveness of coordination, at various levels; and
strengthen and operationalize a sector-wide M&E system, which will support more efficient, effective
and timely decision-making.
viii. Accordingly, the report identifies 32 “core” recommendations which emerge from PNISA’s
implementation experience and assessment, and which are assessed in terms of the identified theory of change,
results framework, and key lessons from other NAIPs and from PNISA. The effective implementation of these
core recommendations (and their supporting actions) during the extended period of PNISA (through 2019),
supported by the proposed operational roadmap (see Annex 2), would generate two benefits: significantly
enhanced results of PNISA; and pave the way for a sound design and smooth launching and effective
implementation of a proposed PNISA Phase 2 (2020 - 2024). These core recommendations are s follows (with
further detains on the specific actions outlined in Chapter 4 and Annex 6):
A) By Overall and Program Development Level (6 core recommendations)
O.1: Extend PNISA through 2019;
O.2: Update Agricultural Growth Rate;
O.3: Update realistic nutritional targets (for stunting and wasting of children);
O.4: Prepare/implement Private Sector Strategy and Road-map;
O.5: Enhance PNISA Structure; and
O.6: Disseminate and Utilize Relevant Sector Analyses/Evidence.
B) By Result Areas (RAs) and Cross-Cutting Themes (RA) (26 core recommendations)
RA1: Increased production and productivity (7 core recommendations)
1.1: Enhance Crop Programs
1.2: Increase Fish Inputs:
1.3: Improve Livestock infrastructure, inputs and service markets
1.4: Enhance Agricultural Research Actions
1.5: Strengthen Agricultural Extension Program
1.6: Improve Irrigation Program coverage and impacts
1.7 Strengthen agricultural mechanization
RA 2: Expanded Access to Markets (3 core recommendations)
2.1: Strengthen Post-harvest management
2.2: Expand Rural Roads Program
2.3: Strengthen data systems to support enhanced evidenced-based policy formulation.
RA 3: Enhanced Food and Nutrition Security(1 core recommendation)
3.1: Enhance Multi-Sectoral nutritional coordination
xiii
RA 4: Improved Natural Resources Management (2 core recommendations)
4.1: Improve land security
4.2: Promote Sustainable use of natural resources
RA 5: Strengthened Institutional Development (4 core recommendations)
5.1: Institutional Reform Program
- Enhance Coordination Arrangements/Mechanisms:
- Enhanced & Sustainable Incentives
5.2: Institutional Strengthening Program
- Strengthen key staff for enhanced evidenced-based capacities and decisions:
- Strengthen CCSA role and effectiveness
6.0: Crosscutting Themes (9 core recommendations)
6.1 Decentralization: (2 core actions)
- Socialize PNISA at Provincial/District levels, and encourage increased level and quality of
expenditures for prioritized interventions
- Provide technical support to Provinces in their budgetary cycle
6.2: Monitoring and Evaluation System (1 core recommendation)
- Enhance operational Agricultural Sector M&E System
6.3 Financing and Budgetary Aspects (6 core recommendations)
- Enhance MASA’s Budget Structure
- Enhance quality of agriculture public expenditures (based on enhanced prioritization criteria and
improved efficiencies in execution)
- Improve DP expenditure funding support
- Close PNISA’s Funding Gap, by increasing the level of expenditures
- Update Costs, Financing Plan and Targets of PNISA
- Provide technical & financial support to provinces
ix. Finally, this assessment outlines the key elements of a roadmap (see Table 13) for the formulation of a
new PEDSA Phase 2 (say, 2020 – 2030) and a PNISA Phase 2(2020 – 2024). It is proposed that these two inter-
related tasks be carried out in parallel to carrying out the enhanced implementation/completion of the on-going
PNISA. This approach would help ensure a seamless transition to sound and timely launching of PNISA Phase
2, building on the positive results and momentum of PNISA Phase 1 and guided by PEDSA II.
1
1 INTRODUCTION AND BACKGROUND
1.1 Overview
The National Agricultural Investment Plan (NAIP), referred to in Mozambique as Plano de Investimento no
Sector Agrário (PNISA, 2013 - 2017), is a national program which aims to operationalize Plano Estratégico
para o Desenvolvimento do Sector Agrário (PEDSA: 2010 – 2020); also, PNISA is inspired by and aligned with
three framework documents/programs: Mozambique’s Five-Year Government Plan, referred to as Plano
Quinquenal do Governo (PQG) – starting in 2010-2014, and now 2015-2019); PEDSA; and the Comprehensive
Africa Agriculture Development Program (CAADP). CAADP was launched in Maputo, Mozambique in July
2003. Under CAADP, the African heads of state pledged to allocate at least 10% of the government budget to
agricultural sector accompanied with 6% annual agricultural production growth in order to boost food security
and rural development in Africa.
In order to achieve CAADP targets, the Government of Mozambique through the Ministry of Agriculture and
Food Security (MASA) started a consultation process which involved Mozambican agricultural stakeholders
including, the private sector, civil society, development partners, and research and training institutions for the
development of the Strategic Plan for Agricultural Sector Development (referred to as PEDSA). This
consultation process, supported by various background analytical studies, resulted in the development of the
PEDSA, which was officially approved in May 2011.
The PEDSA was developed to cover a period of 10 years (2011-2020), and it is comprised of 4 pillars,
namely:(i) agricultural production, productivity and competitiveness; (ii) infrastructure and services for an
increase in access to agricultural markets and investment in agricultural sector; (iii) sustainable and integral use
of natural resources such as land, water, forestry and wildlife; and (iv) agricultural institutions improvement.
These pillars are in line with the CAADP pillars.
Seven months after the approval of PEDSA, on December 9th 2011, the CAADP Compact for Mozambique was
signed by government and non-government agricultural sector stakeholders. The Compact explicitly states that
CAADP will be implemented in Mozambique through the PEDSA and defines the priority focus areas of
intervention for agricultural development in the country.
Following the signing of the CAADP country Compact, the National CAADP Team was tasked to lead the
development of PNISA. From the leadership of CAADP Team, PNISA was prepared following a participatory
methodology through five distinct stages: (i) constitution of Technical Team (TT) responsible for the production
of PNISA document in January 2012. (ii) Provision of technical assistance by FAO to guide Technical Team in
the production of PNISA document, (iii) national consultation for the development of the master document of
PNISA (iv) formulation of proposals for sub-sector investment plans by identified working groups including key
stakeholders, and (v) plenary sessions for presenting and discussing the proposal of PNISA document. After the
five distinct stages, the Technical Team (TT) held a public consultation session attended by government
institutions, private sector, international agencies and non-governmental and civil society organizations.
The contributions collected in public session were subsequently analyzed by TT before they were incorporated
into the final document. Additionally, PNISA was submitted to independent Technical Peer Reviewers
comprised of NEPAD experts and comments from the reviewers were analyzed and incorporated in the
document. The final PNISA document was approved by the Council of Ministers in December 2012.
Following the approval of PNISA, and in line with the CAADP compact, a high-level business meeting chaired
by the President of Republic of Mozambique, Armando Emilio Guebuza, was held in April 2013. The event also
served as PNISA’s official launch and the government and donors agreed to mobilize resources for the
achievement of PNISA’s objectives. Specially, PNISA specifies 21 programs grouped under five components
(or result areas 1), namely (i) agricultural production and productivity; (ii) access to markets; (iii) food and
1 The original PEDSA document referred to “pillars”, while the PNISA document referred to “components”. This
evaluation refers to “result areas” to emphasize that PNISA should be results oriented.
2
nutritional security; (iv) natural resources; and (v) institutional reform and strengthening. The required financial
resources under PNISA during the period of 2013 to 2017 were estimated for each program and totalizing 112
billion MZN.
1.2 Lessons Learned from Other Sub Sahara African Countries
This section highlights the most relevant lessons learned from the design and implementation of other country-
level NAIPs. These lessons and perspectives were taken into account in order to help focus the approach and
analyses for this PNISA assessment exercise.
The Coordination Unit of the New Planning and Coordination Agency (NPCA) of the New Partnership for
Africa’s Development (NEPAD) arranged to carry out a series of assessments of country-level National
Agricultural Investment Plans (NAIPs) in several African countries. 2 One of the main sections of these
assessments involved deriving lessons learned, which are being used to underpin updated action plans/roadmaps
for enhancing strategic results, for both on-going and follow-up phases of each country-level NAIP. The section
below provides a summary of the main lessons derived for each of the countries covered: Burundi; Malawi;
Tanzania; and Togo.
While the lessons learned are specific to each of the countries covered, many of these lessons are applicable,
with some contextualization, to most African countries which are implementing an on going and/or formulating
a follow-up phase of the NAIP. Given the design and implementation experience of Mozambique’s PNISA,
many of the lessons provide relevant insights/guidelines for enhancing the implementation and generation of
tangible and sustainable results of the on-going PNISA.
The following section synthesizes the following 7 cross-country NAIP-related lessons which are considered to
be more pertinent for Mozambique’s PNISA; these lessons need to be applied to PNISA to enable enabling
Mozambique to better achieve the Malabo commitments (7 core areas).
Lesson 1: Strong Operational Alignment with Relevant Policy and Strategy Frameworks: The sustainable
success of NAIPs hinges on the Government’s strengthened commitment to a sound and coherent political,
economic and financial “environment”, to be supported by a comprehensive, coherent and updated agricultural
sector strategic plan and (with an appropriate definition of the “sector” 3). It should be supported by prioritized
agricultural public investments, together with complementary sound and updated policies and investments in
other strategic and growth-inducing public sector investments (e.g., infrastructure, such as roads, electrification,
storage) and broad-based private sector investments. Accordingly, it is vital to ensure strong and continuous
alignment of the agricultural sector strategy and with the national strategic plan and the 7 core areas of the
Malabo Declaration, and to use periodic assessments as an opportunity to strengthen NAIPs’ strategic and
operational alignment;
Lesson 2: Robust Coordination Arrangements and Mechanisms: One of the key lessons from the assessments of
NAIPs is that achieving key strategic objectives for the agricultural sector hinges on active engagement of
stakeholders/entities which are outside the direct control of the Ministry of Agriculture (or equivalent).
Accordingly, it is vital to ensure Ministries of Agriculture establishes and strengthens appropriate and
operational coordination arrangements and mechanisms at various levels, especially involving “core” central
ministries (i.e., Finance/Planning, Industry and Trade), Provinces/Districts (e.g., Provincial and District
Development Officers, others), and private sector (e.g., relevant chamber(s) of commerce). There are good
practices in numerous African countries in utilizing and strengthening agricultural sector working group
(ASWG), supported by sub-working groups organized according to strategic themes which are drivers of
agricultural growth (e.g., key commodities/value chains; private sector; agricultural technology; inputs;
2 Assessment of NAIP and Development of Guidelines for Country Self-Assessment Processes in Burundi, Malawi,
Tanzania and Togo, prepared by NEPAD (November, 2015). Further details are provided in the country-specific
assessments (also, dated 2015). Based on available information, most (or all) of these lessons continue to be relevant.
3 For a useful and generally agreed guideline for the agricultural sector, see: AU Guidance Note: On Tracking and
Measuring the Levels and Quality of Government Expenditure for Agriculture (CAADP/NEPAD, 2015).
3
financing). To help ensure broad-based ownership, it will be important to distribute the leadership
responsibilities among diverse stakeholders (e.g., and to co-chair arrangements).
Lesson 3: Effective Utilization of the Medium and Annual Planning/Budgetary Cycle and Supporting Tools: To
complement the above two lessons, it is imperative that the Ministry of Agriculture and the Provinces/Districts
strengthen and utilize effectively the annual and medium term planning and budgetary cycle and processes to
ensure sound and coordinated level and prioritized composition of agricultural public expenditures (based on
explicit and sound prioritization criteria) and from other key supporting sectors (especially road infrastructure).
Key tools which need to be enhanced and effectively utilized for the planning and prioritization of key
interventions is a sound Results Framework (RF) for PNISA, whereby each “result area” and supporting
strategic outcome and output indicators would provide the same structure and indicators for: (a) a results-
oriented budget proposal; and (b) an improved monitoring and evaluation system (see below also).
Accordingly, these tools would to be utilized to sharpen the content and prioritization of the annual budgetary
planning processes and proposals, coupled with the active engagement of key stakeholders during the entire
cycle, which would be enabled by the strengthened coordination arrangements (reference to lesson 2). Given the
context of decentralization, it is important that the Ministry of Agriculture at the central level provide the
sectoral RF as a guide for each of the Provinces and Districts to derive their own version of the RF to guide their
budgetary planning cycle. In that manner, there will be stronger alignment and coherence, at various levels;
Lesson 4: Ensure Financing Mechanisms Are Appropriately Sequenced and Utilized. In several countries,
including Mozambique, there was excessive importance placed in establishing a financing mechanism (e.g.,
“basket funding”) which became the dominant focus of discussions, rather than ensuring the Ministry of
Agriculture focused first and on a continuous basis on a sound agricultural strategy and prioritized agricultural
sector expenditure program, to be supported by appropriate financing mechanisms (e.g., basket fund). In
practice, this misplaced focus by the Ministry of Agriculture and DPs have resulted in inadvertent perverse
effects. Accordingly, Ministry of Agriculture need to ensure utmost attention to ensuring and reaching
consensus with key stakeholders on an updated expenditure plan, and to utilizing financing mechanisms as a
support mechanism to achieve the expenditure objectives (in line with the enhanced RF and M&E system).
Lesson 5: Active Engagement of Inclusive Private Sector throughout the Cycle: Country experiences provide
strong evidence that the primary driver of inclusive agricultural sector growth, including the achievement of an
ambitious agricultural sector growth target of at least 6% growth per annum (or even above 3% per annum) will
depend primarily on expanding the active role of the private sector in all phases of the expenditure cycle. In
recent years, many countries (including Mozambique) have been increased engagement by the private sector in
the NAIPs, but mostly in the planning phase, and there has been negligible engagement in the implementation
and monitoring and evaluation phases. The strengthened coordination mechanisms (e.g., ASWG and sub-
working groups) also need to be operational during all phases of the cycle to ensure active and sustained
engagement of the private sector, also at various levels (central and provincial/district levels). In this manner,
there is a need to be close attention to identifying key bottlenecks faced by the private sector (say, taking a
value-chain approach, which means active listening of the private sector stakeholders to ensure public
expenditure are complementary and help catalyze increase and inclusive private sector investments);
Lesson 6: Integrated Decentralization Arrangements/Mechanisms: Similar to Mozambique, most African
countries are actively promoting political/administrative/expenditure decentralization, and most countries, are
facing diverse challenges.. It is important to ensure that Ministry of Agriculture give explicit attention to
ensuring adequate “socialization” of the NAIP at the Provincial/District levels (say, via the annual budgetary
cycle and M&E system), and work out and integrate an appropriate decentralization strategy/roadmap for the
further operationalization of the NAIP at these decentralized levels – again, using the budgetary cycle as the
core driver of the roadmap. There has been a tendency to embark on decentralization in one phase, rather than
follow a phased approach to ensure effective decentralization. NAIPs may wish to consider a phase approach to
a more effective operational and intensive approach to decentralization with respect to the agricultural sector,
while recognizing that current decentralization covers all 11 Provinces;
Lesson 7: Improved and Operational M&E System: A common weakness among all NAIPs, including the
PNISA, is a deficient M&E system. Accordingly, it will be vital for the Ministry of Agriculture to intensify its
efforts to strengthen significantly the M&E system for its NAIP (which also supports the requirements of its
4
strategic frameworks), and to ensure a strong alignment of the M&E system with the enhanced RF,, with a focus
on the most strategic indicators at the impact, outcome and output levels. Some of the specific elements of good
practice M&E system include the following features: (a) strong alignment with a sound RF, and the use of
“SMART” indicators, at the 3 levels; (b) a roadmap to improve the generation, reliability and timeliness of data
sources and systems of the most relevant indicators at the 3 levels (impact, outcome and outputs), including the
use of existing surveys, special survey data, taking into account their costs; the indicators should include
appropriate indicators involving the private sector investments and role; (c) clear roles and responsibilities in the
management and implementation of the M&E system, at both central and provincial levels (which in turn is
linked to the implementation of the decentralization strategies); (d) identifying strategic programs/subprograms
which comprise core drivers and ensuring periodic in-depth and independent evaluation studies (e.g., inputs,
especially where there are subsidies; agricultural technology, and the technology/extension linkages; periodic
assessment of the agricultural strategy); (e) ensuring the M&E system is effectively utilized, with periodic
feedback from key decision-makers, to also provide basis for improvements on a periodic basis; and (f) ensuring
appropriate learning-related activities with a strong capacity building orientation, at central and decentralized
levels.
2 OBJECTIVES, SCOPE AND METHODOLOGICAL APPROACH
2.1 Objectives
The overall objective is to conduct a mid-term evaluation (MTE) of PNISA’s performance in terms of
identifying key achievements, gaps, lessons learned, and strategic recommendations to achieve more fully and
effectively its objectives and key targets. The evaluation exercise focuses on addressing two main aspects:
Performance: main achievements/results and key gaps and challenges to meet its objectives and
strategic targets, including relevant key targets outlined under the MALABO Declaration; and
Recommendations and Road Map: Recommendations will be framed in terms of a road map for
supporting the achievement of PNISA’s strategic objectives and more realistic and updated targets.
2.2 Scope
The assessment covered the following aspects:
Overall objectives/targets as outlined in the PNISA program document;
Content: 5 result areas and 21 programs, with a focus on assessing “key drivers” of inclusive
agricultural growth and “transformation”;
Time-period: 2013 to 2016, with a forward-looking approach to the proposed remaining period of
PNISA up to 2020 in order to coincide with the timeframe of the on-going Plan Quinquenal de Governo
(PQG, 2015-2020) and PEDSA (2010-2020);
Based on utilizing available information and analyses, given limited timeframe and resources to carry
out the assessment, and utilizing mix-methods approach;
National and Provincial level analyses, including an assessment of the performance of PNISA in 4
“Provinces. The agreed criteria for the selection of the Provinces are those which exhibit the following
features:
o diversity of corridors/regions in terms of agro-ecological potential, with geographical spread
and diversity (e.g., north, central and south);
o diversity of performance in PNISA implementation;
o commitment of key counterparts to collaborate in exercise
Accordingly, the evaluation team agreed with MASA/DPCI authorities that the following Provinces
would be included for an in-depth assessment and to use the findings as inputs for the overall PNISA
review. This assessment was based on readily available information, together with a questionnaire
administered to about 80diverse stakeholders in the following provinces: including Maputo city for the
national perspective and four province (Niassa in Northern region, Zambezia and Tete in Central region
and Gaza in Southern region).
5
2.3 Methodological Approach
The assessment was guided by the following methodological features:
2.3.1 Evaluation criteria.
International good practices for carrying out evaluations of programs/projects recommends assessing 6 key
dimensions/criteria, as follows:
(i) Relevance: to Government’s main policies, strategies and policies, and to addressing key sector
constraints;
(ii) Efficiency: the extent to which available resources have been used efficiently to achieve the
objectives/targets; (iii) Effectiveness: the extent to which the main objectives/targets have been achieved;
(iv) Results: the extent to which key impacts, outcomes and outputs have been generated as a result
of PNISA’s interventions, while recognizing the challenges of “attribution”; (v) Sustainability: the extent to which the generated results will be sustained over time; (vi) Major lessons: the specific lessons which have been generated as a result of implementing
PNISA, and which can be useful for enhancing PNISA’s on-going performance and also other
sector-level projects.
2.3.2 Methods, Theory of Change and Results Framework
The mixed methods approach utilized involved applying a mix of quantitative and qualitative methods. One of
the key tools utilized involved reconstructing and using a theory of change (ToC)4 and a Results Framework
(RF) to assess PNISA’s performance and to guide priority recommendations. This ToC is underpinned by a
results chain to help focus the assessment exercise on the more strategic elements and indicators/targets which is
envisioned to “drive” agricultural transformation in Mozambique. This RF is comprised of 4 overall impact
level indicators, 5 strategic result areas (or components), and supported by “strategic” indicators, involving a
mix of outcomes and outputs (see Annex 1). There are 3 sources of the indicators shown in the RF: from the
PNISA document; from the MALABO Declaration (used for the biennial report), and from the team’s
experience/ judgment. 5
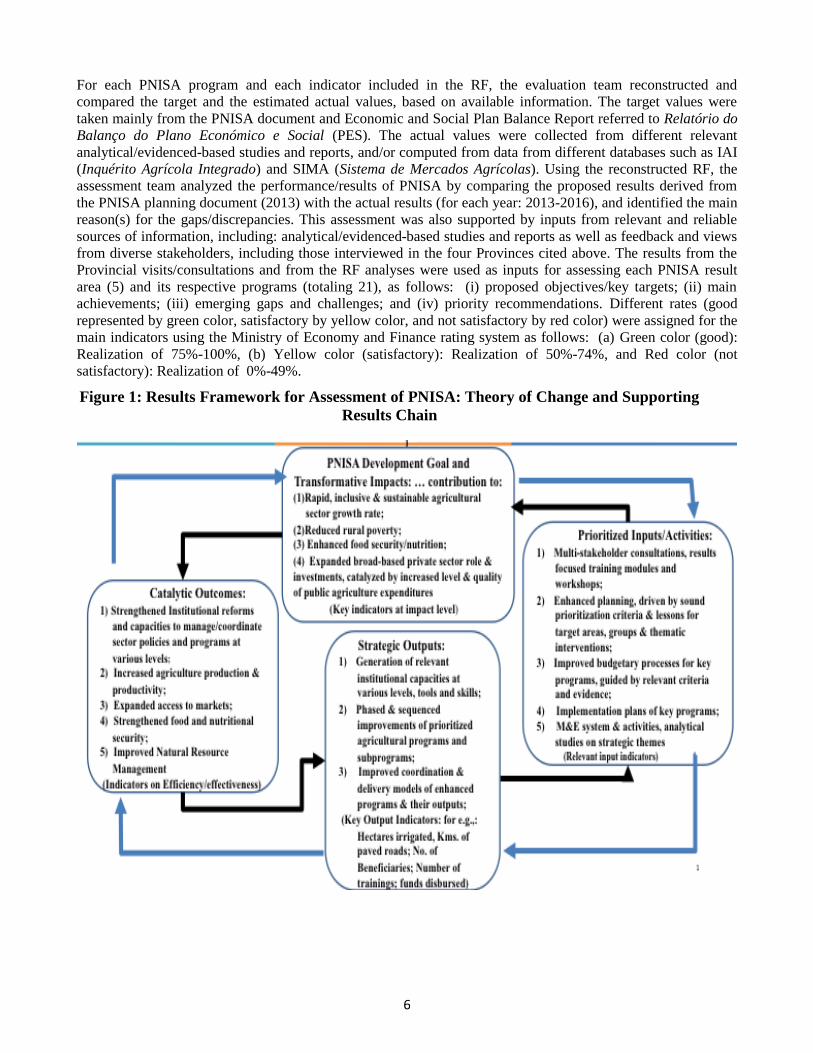
Figure 1 illustrates the ToC which was contextualized for PNISA. This ToC aims to help focus PNISA’s
retrospective assessment and its forward-looking recommendations. The ToC also serves as a “bridge” between
a comprehensive diagnosis of Mozambique’s agricultural sector and the RF.6 Accordingly, the RF analyses
focuses on strategically selected impact, outcome and output indicators, including “core indicators”/CI (about
30). It is suggested that MASA accord higher priority to ensuring its improved M&E system focuses on
promoting and tracking these CIs. Also, these CIs will help focus priority actions and results, given limited
financial and human capacity resources at central (MASA, others) and provincial/district levels.
4 Good international practice has highlighted the importance of programs/projects defining explicitly a “theory of change”,
which will provide a conceptual framework/roadmap for identifying the main strategic interventions which will generate
the desired results (or changes) at the impact, outcome and outputs levels, and their interlinkages (or results chain).
Accordingly, a sound ToC provides the basis for constructing a sound results framework. 5The MALABO Declaration biennial report for Mozambique (draft July, 2016) presents about 43 indicators for which each
participating CAADP country is supposed to track and report on. Some of the more strategic MALABO Declaration
indicators meet the selection criteria for this assessment, and therefore, were included in the RF for PNISA. 6 For example, there are 3 recent agricultural sector studies which provide a sound diagnosis of the main challenges facing
Mozambique’s agricultural sector, and also include identification of some of the key drivers identified in the ToC and the
supporting RF: (i) Promoting Inclusive Agriculture Growth in Mozambique: Sector Performance and Policy Priorities
(World Bank, April 2017); (ii) Institutions and Investments in Agriculture: Tracking Implementation of the NAIP for the
Agriculture Sector in Mozambique (World Bank, April, 2017); (iii) Joint Sector Review: Strengthening Mutual
Accountability and Preparing for the Malabo Biennial Review through Joint Sector Review (prepared for MASA, June,
2017).
6
For each PNISA program and each indicator included in the RF, the evaluation team reconstructed and
compared the target and the estimated actual values, based on available information. The target values were
taken mainly from the PNISA document and Economic and Social Plan Balance Report referred to Relatório do
Balanço do Plano Económico e Social (PES). The actual values were collected from different relevant
analytical/evidenced-based studies and reports, and/or computed from data from different databases such as IAI
(Inquérito Agrícola Integrado) and SIMA (Sistema de Mercados Agrícolas). Using the reconstructed RF, the
assessment team analyzed the performance/results of PNISA by comparing the proposed results derived from
the PNISA planning document (2013) with the actual results (for each year: 2013-2016), and identified the main
reason(s) for the gaps/discrepancies. This assessment was also supported by inputs from relevant and reliable
sources of information, including: analytical/evidenced-based studies and reports as well as feedback and views
from diverse stakeholders, including those interviewed in the four Provinces cited above. The results from the
Provincial visits/consultations and from the RF analyses were used as inputs for assessing each PNISA result
area (5) and its respective programs (totaling 21), as follows: (i) proposed objectives/key targets; (ii) main
achievements; (iii) emerging gaps and challenges; and (iv) priority recommendations. Different rates (good
represented by green color, satisfactory by yellow color, and not satisfactory by red color) were assigned for the
main indicators using the Ministry of Economy and Finance rating system as follows: (a) Green color (good):
Realization of 75%-100%, (b) Yellow color (satisfactory): Realization of 50%-74%, and Red color (not
satisfactory): Realization of 0%-49%.
Figure 1: Results Framework for Assessment of PNISA: Theory of Change and Supporting
Results Chain
7
2.3.3 Stakeholder Consultations
The feedback and views from different stakeholders were guided by 7 questions which aim to capture the six
key assessment dimensions -see above criteria (and see Annex 2). The questionnaires were administered in
person by members of the PNISA assessment team. Each interview took about one hour, and was applied to
approximately 79 strategically selected multi-stakeholders/actors located in Maputo and the 4 selected
Provinces. These stakeholders are familiar with and directly engaged in the agricultural sector, and many of
them were involved directly in PNISA’s design and/or implementation aspects. These strategic stakeholders
represented the following groups: Government (national level and provincial levels); development partners
(from AG-RED); academia; civil society; and private sector. Their responses reflect their comparative and
partial knowledge of selected strategic objectives and programs/subprograms/activities of PNISA, and hence,
this information has been integrated with other information compiled and analyzed during the assessment
exercise. Descriptive statistics of the ratings provided by each stakeholder were computed for each question, and
the associated rationale/evidence and interpretation of responses also were summarized. The summary responses
for the stakeholders interviewed in Maputo and the overall findings for each of the 4 provinces are presented in
Annex 3.
8
3 MAIN FINDINGS
The main results-focused findings are presented according to each of PNISA’s 5 results areas (RAs) and
their respective programs (totalizingng 21), together with key crosscutting themes (3). This assessment is
structured according to the following common aspects: (i) objectives/targets; (ii) status/achievements; (iii)
identified gaps and challenges; and (iv) priority recommendations.
3.1 Program Development Objectives
Program Development Objectives (PDOs) refer to the most relevant crosscutting outcome and impact
indicators. This section provides an overview of the Program Development Objectives (PDOs), their
targets, current achievements and closes with strategic recommendations.
(i) Program Development Objectives (PDO): The PNISA aims to contribute to the main PEDSA objective
of enhanced food security and nutrition, increased income and profitability of agricultural producers, and
the rapid, competitive and sustainable increases in market-oriented agricultural production. PNISA set out
to support the following specific objectives:
(a) accelerate the production of staple and nutritious food products;
(b) increase income for producers;
(c) ensure expanded access and secure tenure of the necessary natural resources;
(d) provide enhanced specialized services geared towards the development of the value chain; and
(e) boost the development of the areas of greatest agricultural and commercial potential (in line with
comparative advantage)
(ii) Key Targets, Status/Achievements and Gaps/Challenges:
The key impact indicators and their targets and status by the end of 2017 are summarized below.
(a) Agricultural Growth Rate
Target: Sustain an average growth rate of 7% per year for the next 10 years (PNISA). The MALABO
agricultural growth rate target is at least 6% from 2015 to 2025.
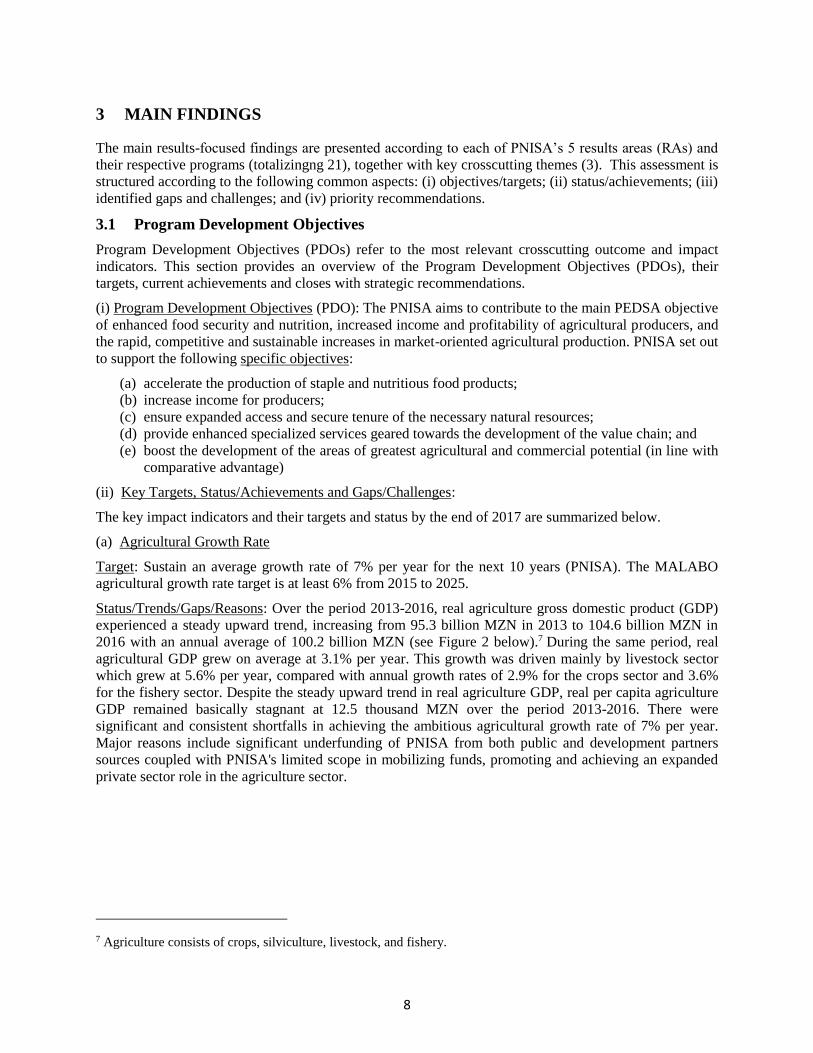
Status/Trends/Gaps/Reasons: Over the period 2013-2016, real agriculture gross domestic product (GDP)
experienced a steady upward trend, increasing from 95.3 billion MZN in 2013 to 104.6 billion MZN in
2016 with an annual average of 100.2 billion MZN (see Figure 2 below).7 During the same period, real
agricultural GDP grew on average at 3.1% per year. This growth was driven mainly by livestock sector
which grew at 5.6% per year, compared with annual growth rates of 2.9% for the crops sector and 3.6%
for the fishery sector. Despite the steady upward trend in real agriculture GDP, real per capita agriculture
GDP remained basically stagnant at 12.5 thousand MZN over the period 2013-2016. There were
significant and consistent shortfalls in achieving the ambitious agricultural growth rate of 7% per year.
Major reasons include significant underfunding of PNISA from both public and development partners
sources coupled with PNISA's limited scope in mobilizing funds, promoting and achieving an expanded
private sector role in the agriculture sector.
7 Agriculture consists of crops, silviculture, livestock, and fishery.
9
95.398.9
102.0104.6
0
20
40
60
80
100
Re
al a
gri
cu
ltu
re G
DP
(b
illio
n M
ZN
)
2013 2014 2015 2016Source: INE
Figure 2 Trend in agriculture GDP
(iii) Priority Recommendations (CR refers to “core” recommendation8)
a) (CR) MASA to update targeted agricultural growth rates for 2018, 2019, and 2020, based on
trends over past 5 years, realistic assumptions, and available studies. This implies a downward
revision of the ambitious target of 7% per year;
b) MASA to build on/utilize the available agricultural sector model for Mozambique as a tool for
more rigorous and realistic sector planning, and the support for the formulation of PNISA II. Re-
assess and derive sources of agricultural growth rate with possible scenarios (low, medium, and
high). The modeling work will provide the basis for further updating of the agricultural growth
rate targets. MASA would need to seek/secure appropriate technical assistance (TA), and include
a “twinning” arrangement with a local university, to help ensure sustainability of the modeling
work, and also provide a training vehicle for future MASA staff;
c) (CR) MASA to formulate and implement an action plan to mobilize adequate funding for PNISA,
for FY18 and FY19, while recognizing the challenges of increasing funds for FY18);
d) (CR) MASA to sharpen and apply consistently its operational prioritization criteria to enhance
budgetary planning and allocations. MASA’s current prioritization criteria have emphasized the
following 4 programs: (a) agricultural extension; (b) agricultural research; (c) irrigation; and (d)
control of crop plagues and livestock diseases. While these are generally sound programs, it
would be useful to sharpen and complement them with the following 3 criteria to help prioritize
limited funding:
8 “Core” recommendations (CR) are identified to help establish priorities among the recommendations, and which
contribute to the key drivers of transformation. It is also important to address the other recommendations, but in a
phased manner.
10
Programs/interventions which comprise “core drivers of agricultural transformation”,
and are strongly aligned with and contribute to strategic targets of the PQG and PEDSA
(e.g., agricultural growth, poverty reduction, catalyzing inclusive private sector role and
investments, especially smallholder and small enterprise-led value chain development);
Programs which benefit large numbers of beneficiaries, with special focus on
smallholders;
Programs which demonstrate attractive financial returns to smallholders and economic
viability, especially with respect to lumpy investments (e.g., irrigation, rural roads,
technology development and dissemination),
e) (CR) MASA to structure its budget according to PNISA’s 5 components (result areas) and 21
programs, preferably starting with the finalization of the budget submission for FY 2018. It is
recognized there is a limited window in the budgetary cycle for FY 2018 to make this adjustment;
if not possible before the FY18 budget is finalized, then MASA should endeavor to make the
structural adjustments during the mid-year budgetary review for FY18, and hopefully for the
FY19 budgetary cycle.
(b) Poverty Level
Target: Reduce poverty level by at the least 50% from 2015 to 2025 (MALABO and not specified by
PNISA);
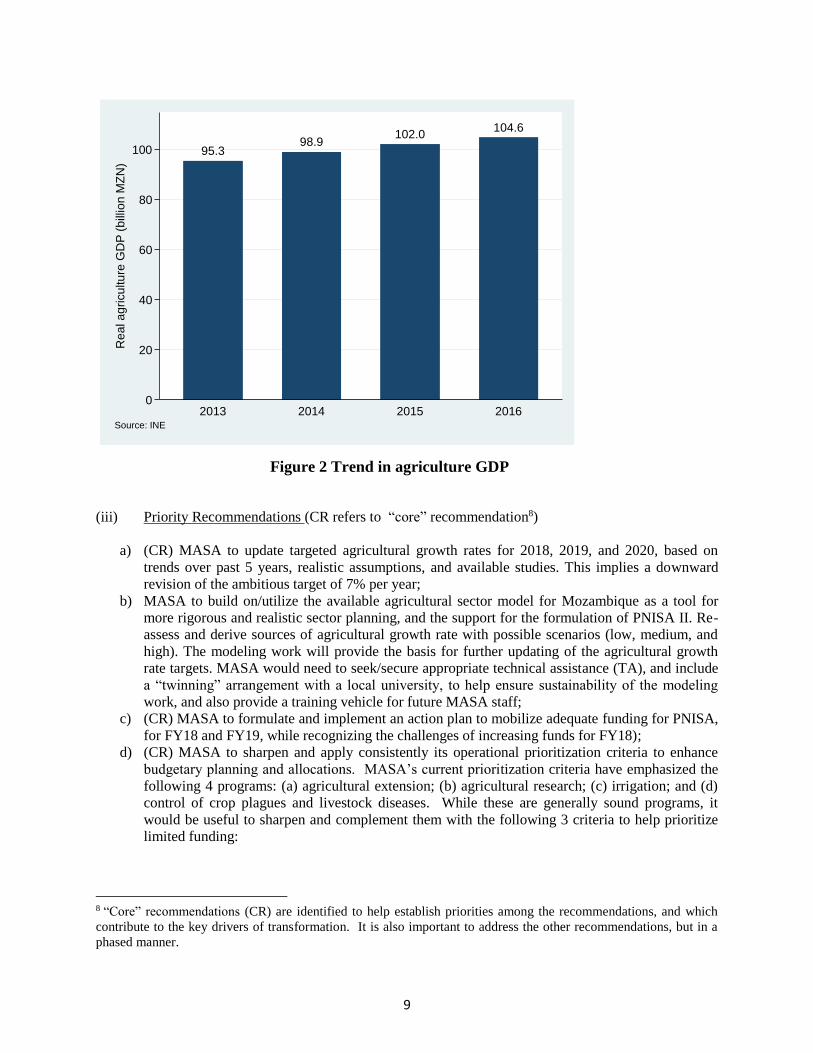
Status/Trends/Gaps/Reasons: Figure 3 plots trends in poverty headcount incidence. This figure shows that
poverty decreased from 54.7% in 2008/2009 to 49.2% in 2014/2015. This decline reflects a larger
reduction in urban poverty with modest decrease in rural poverty (9% versus 4%). This modest decrease
also reflects the relatively low agricultural sector growth rate trends as discussed earlier. Despite the
observed reduction in poverty at national level from 2009 to 2015, notable differences across regions
exist: Poverty increased by 13% in Northern Mozambique, while it decreased by 12% in Central
Mozambique and by 21% in Southern Mozambique. Northern and Central Mozambique are the regions
with higher agricultural potential compared to Southern Mozambique as discussed later. Observed trends
suggest that promising sources of agricultural growth and rural poverty reduction include scaling up
improved technologies and contract farming. However, PNISA limited funding (level and composition)
has limited its potential role and contributions to helping poverty reduction. Some of the main PNISA
poverty reduction interventions have included rural roads, and technology development and
dissemination.
Priority Recommendations:
a) MASA to ensure that the proposed agricultural sector growth modeling work also include
explicitly assessment of rural poverty reduction strategies and interventions. Ensure improvement
to data collection systems and frequency on household incomes;
b) Given that MASA is collecting household income information (TIA and IAI) during some
rounds, there is a need for MASA to improve data reliability, analyses, and utilization of these
potentially useful data to better track rural household incomes and rural poverty trends and to
help prioritize interventions;
c) (CR) Given various recent evidence-based studies for Mozambique’s agricultural sector have not
been widely disseminated and fully utilized (see references in footnote 5), MASA, in
collaboration with and support by the AGRED, to develop and carry out an action plan for their
wide dissemination, discussion and utilization to support policy and budgetary cycle. These
follow-up actions would contribute to enhanced implementation of PNISA and its results, at a
very low cost.
11
55.356.9
53.151.5
49.6
40.7
54.1 54.7
49.2
0
20
40
60
Po
ve
rty h
ea
dco
un
t (%
)
Rural Urban National
Source: MEF
IAF 2003 IOF 2009 IOF 2015
Figure 3 Trends in poverty headcount incidence
(c) Prevalence of stunting and wasting among under-five children
Targets:
Reduce stunting from 44% in 2008 to 30% in 2015 and 20% in 2020. Targets for intermediate
years were not defined;
Reduce wasting to 5% or less by the year 2025 (MALABO and not specified by PNISA). Targets
for intermediate years were not defined.
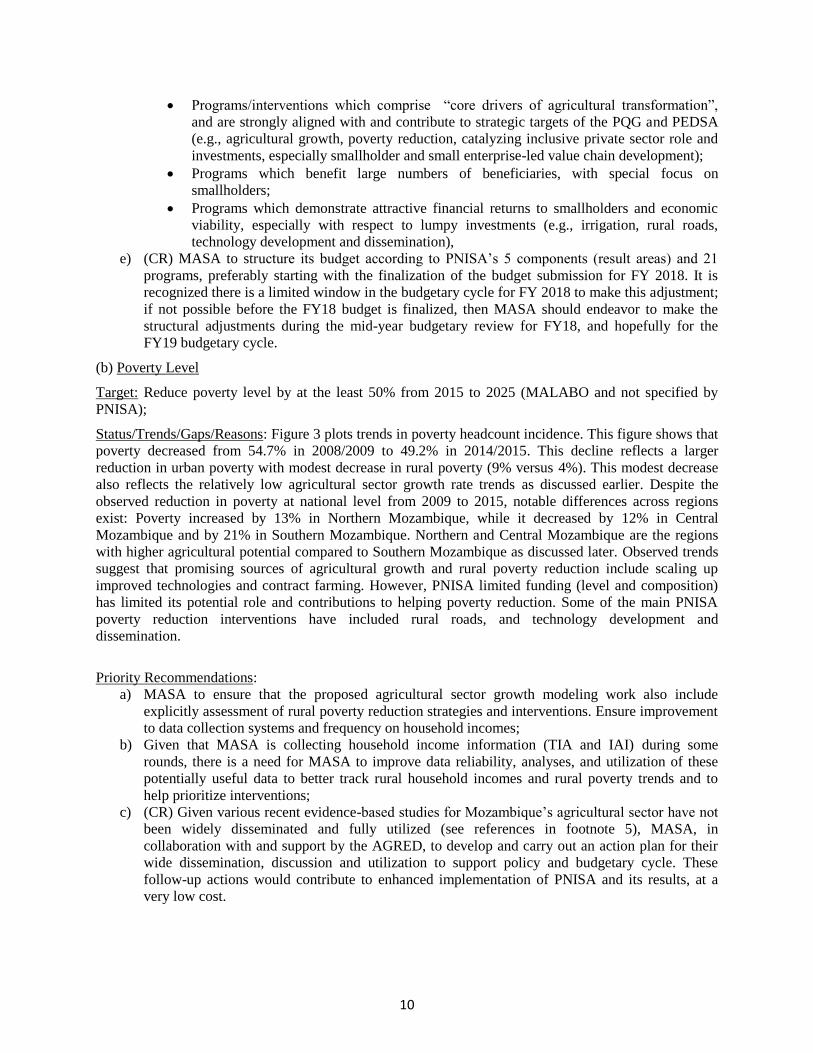
Status/Trends/Gaps/Reasons: (for both nutritional targets) Figure 4 displays trends in stunting and
wasting for under-five children. This figure shows that stunting slightly increased from 45.7% in 2009 to
47.9% in 2013 and then it modestly declined to 43.6% in 2015. Between 2013 and 2015, decline in
stunting was higher in urban than rural areas (from 43.7% to 35.4% for urban areas versus from 49.7% to
46.5% for rural areas). This could also be a reflection of low agricultural productivity over the period.
Figure 4 also illustrates that wasting increased from 8.0% in 2009 to 11.3% in 2013 and then dropping to
4.9% in 2015. Contrary to the case of stunting, wasting dropped by about 6.0% in both urban and rural
areas. However, the incidence of wasting is higher in rural than urban areas. Stunting and wasting
prevalence are considerably higher in Northern and Central Mozambique than in Southern Mozambique
for any given year. For instance, in 2015, stunting (wasting) was 50.9% (6.9%) in the Northern region and
44.7% (4.6%) in the Central region, compared with 27.0% (2.1%) in the Southern region. PNISA target
for stunting of 30% in 2015 was not achieved; while the MALABO target for wasting of 5.0% or lower
was met. Progress was made towards achieving the target for the short-term indicator (wasting), but
significant shortfall in achieving target for the long-term indicator (stunting). This reflects the complex
underlying causes and multisectorial interventions required to address issues related to food and
nutritional security. Stakeholder consultations (Central and provincial levels) revealed SETSAN's
constraints and limited provincial and district level engagement in addressing nutritional issues. PNISA,
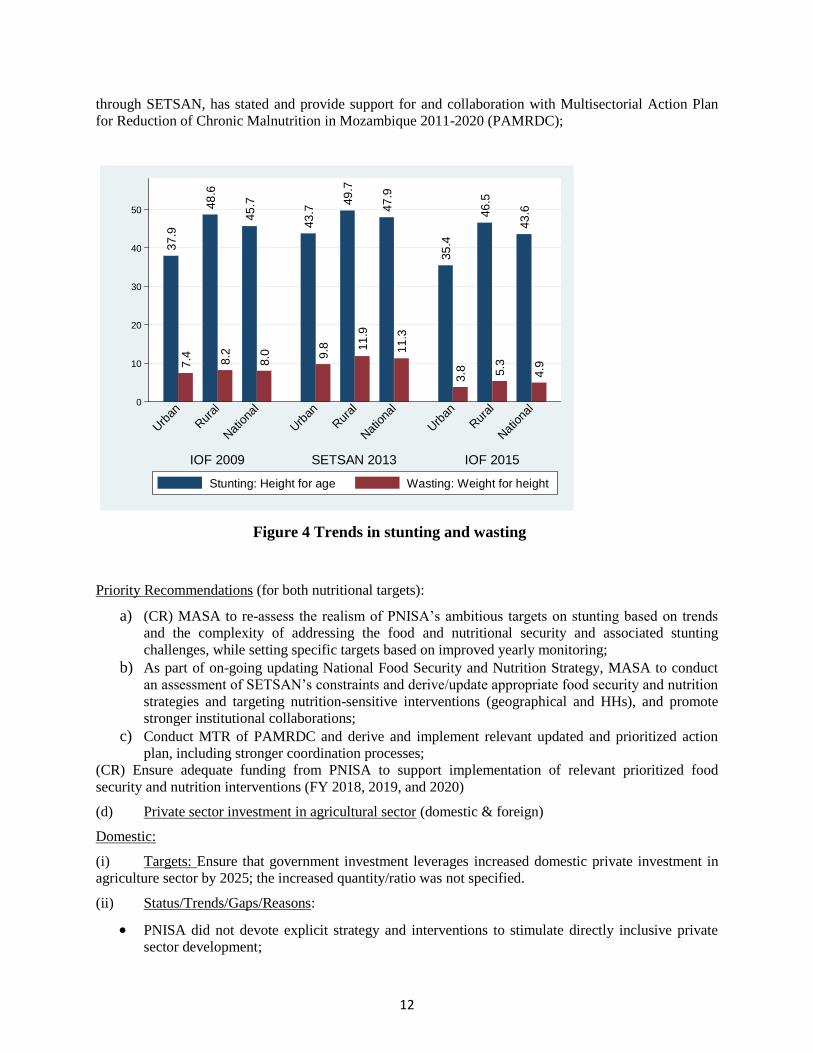
12
through SETSAN, has stated and provide support for and collaboration with Multisectorial Action Plan
for Reduction of Chronic Malnutrition in Mozambique 2011-2020 (PAMRDC);
37
.9
7.4
48
.6
8.2
45
.7
8.0
43
.7
9.8
49
.7
11
.9
47
.9
11
.3
35
.4
3.8
46
.5
5.3
43
.6
4.9
0
10
20
30
40
50
% o
f u
nd
er-
five
ch
ildre
n
IOF 2009 SETSAN 2013 IOF 2015
Urb
an
Rur
al
Nat
iona
l
Urb
an
Rur
al
Nat
iona
l
Urb
an
Rur
al
Nat
iona
l
Stunting: Height for age Wasting: Weight for height
Figure 4 Trends in stunting and wasting
Priority Recommendations (for both nutritional targets):
a) (CR) MASA to re-assess the realism of PNISA’s ambitious targets on stunting based on trends
and the complexity of addressing the food and nutritional security and associated stunting
challenges, while setting specific targets based on improved yearly monitoring; b) As part of on-going updating National Food Security and Nutrition Strategy, MASA to conduct
an assessment of SETSAN’s constraints and derive/update appropriate food security and nutrition
strategies and targeting nutrition-sensitive interventions (geographical and HHs), and promote
stronger institutional collaborations;
c) Conduct MTR of PAMRDC and derive and implement relevant updated and prioritized action
plan, including stronger coordination processes; (CR) Ensure adequate funding from PNISA to support implementation of relevant prioritized food
security and nutrition interventions (FY 2018, 2019, and 2020)
(d) Private sector investment in agricultural sector (domestic & foreign)
Domestic:
(i) Targets: Ensure that government investment leverages increased domestic private investment in
agriculture sector by 2025; the increased quantity/ratio was not specified.
(ii) Status/Trends/Gaps/Reasons:
PNISA did not devote explicit strategy and interventions to stimulate directly inclusive private
sector development;
13
The indicator was not defined under PNISA and targets were not defined under MALABO.
Absence of data systems to generate this important indicator limits its assessment.
Promising private sector investment includes numerous key commodities (e.g. sugarcane, banana,
poultry, rice, maize processing, etc.);
(iii) Priority Recommendations:
a) Establish realistic targets for this indicator taking into account the existing trends and resources; b) Collect data for analyses and utilization of information on the level private sector investment in
agricultural sector
Foreign Investment:
(i) Targets: Ensure that government investment leverages increased a foreign private direct
investment in agriculture sector by 2025; the quantity/ratio was not specified.
(ii) Status/Trends/Gaps/Reasons:
The indicator was not defined under PNISA and targets were not defined under MALABO.
Absence of data systems to generate this important indicator;
Promising foreign private direct investment was not specified;
While some initiatives to promote private sector investment are being promoted (e.g. reduction of
import tax, extension of 10% IRPC for another 10 years, bona fide water rates for irrigation, no
payment of VAT for locally produced commodities, subsidized rates for electricity and diesel),
they are at incipient stage;
Absence of comprehensive and operational strategy for expanding private sector development of
and engagement in Mozambique's agriculture sector.
(iii) Priority Recommendations (applies for both domestic and foreign investments, with some
adjustments):
a) (CR) Carry out comprehensive and operational strategy for expanding private sector
development of and engagement in Mozambique's agriculture sector (to cover both domestic and
foreign direct investment). This is to be based on agreed ToR, mobilization of funding and acting
engagement by private sector stakeholders; ToR should give special attention to addressing
enabling environment (e.g. reduced bureaucracy to benefit from bona fide diesel and electricity
rates, access to land ownership and enhanced security) for private sector investment. Based on
operational strategy, there is a need for PNISA to provide adequate and prioritized funding based
on explicit criteria.
b) (CR) With the abolishment of CEPAGRI, there is a need for MASA to work out appropriate
institutional roles and arrangements for spearheading expanded and inclusive domestic and
foreign private sector development to help drive agricultural transformation (including youth and
gender), with a focus on promoting competitive and private sector-driven VCD.
c) (CR) MASA, in collaboration with MIC and other entities, to creating an enabling environment
(e.g. reduced bureaucracy to benefit from bona fide diesel and electricity rates, expanded access
to land ownership and security, expanded access to finance, etc.) for expanded private sector
investment (domestic and foreign).
d) (CR) MASA, in close collaboration with MIC, to establish appropriate and reliable data
collection system of private sector investment, analyses, and utilization of these potentially useful
data to track and promote more effectively inclusive and expanded private sector investments
(domestic and foreign) in the agriculture sector. PNISA to provide adequate funding for improved
data system;
Table 1 below summarizes evaluation results for core indicators at the PDO level.
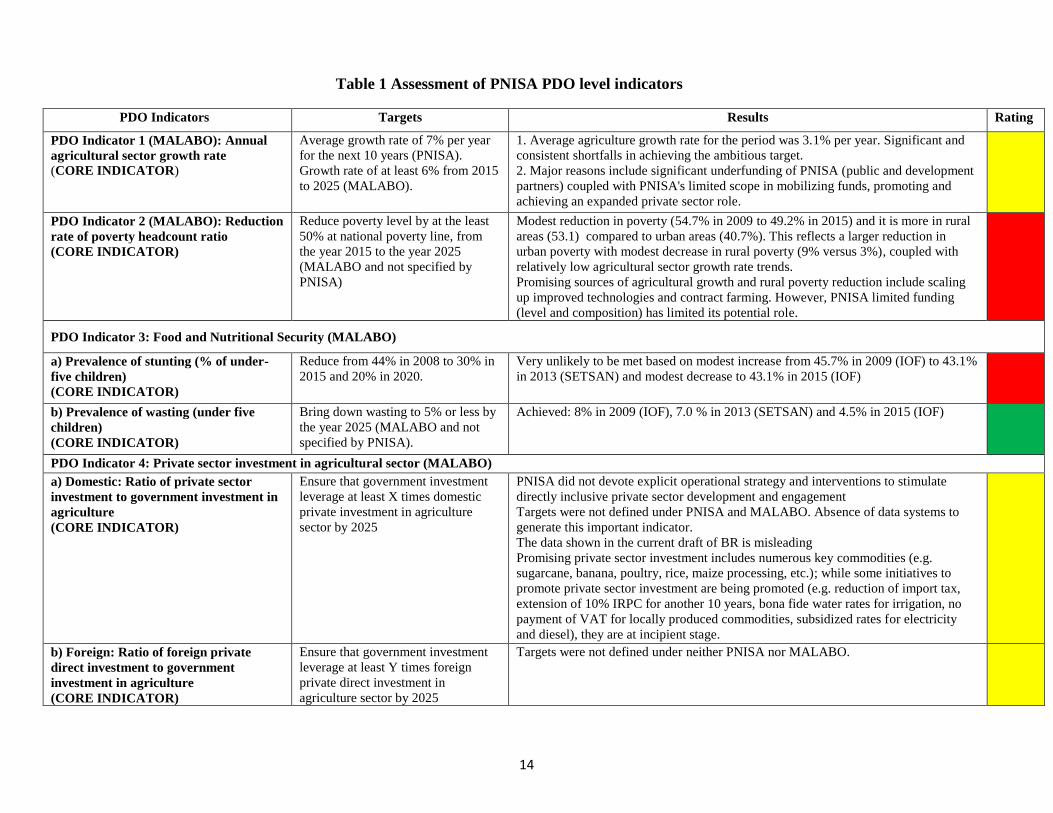
14
Table 1 Assessment of PNISA PDO level indicators
PDO Indicators Targets Results Rating
PDO Indicator 1 (MALABO): Annual
agricultural sector growth rate
(CORE INDICATOR)
Average growth rate of 7% per year
for the next 10 years (PNISA).
Growth rate of at least 6% from 2015
to 2025 (MALABO).
1. Average agriculture growth rate for the period was 3.1% per year. Significant and
consistent shortfalls in achieving the ambitious target.
2. Major reasons include significant underfunding of PNISA (public and development
partners) coupled with PNISA's limited scope in mobilizing funds, promoting and
achieving an expanded private sector role.
PDO Indicator 2 (MALABO): Reduction
rate of poverty headcount ratio
(CORE INDICATOR)
Reduce poverty level by at the least
50% at national poverty line, from
the year 2015 to the year 2025
(MALABO and not specified by
PNISA)
Modest reduction in poverty (54.7% in 2009 to 49.2% in 2015) and it is more in rural
areas (53.1) compared to urban areas (40.7%). This reflects a larger reduction in
urban poverty with modest decrease in rural poverty (9% versus 3%), coupled with
relatively low agricultural sector growth rate trends.
Promising sources of agricultural growth and rural poverty reduction include scaling
up improved technologies and contract farming. However, PNISA limited funding
(level and composition) has limited its potential role.
PDO Indicator 3: Food and Nutritional Security (MALABO)
a) Prevalence of stunting (% of under-
five children)
(CORE INDICATOR)
Reduce from 44% in 2008 to 30% in
2015 and 20% in 2020.
Very unlikely to be met based on modest increase from 45.7% in 2009 (IOF) to 43.1%
in 2013 (SETSAN) and modest decrease to 43.1% in 2015 (IOF)
b) Prevalence of wasting (under five
children)
(CORE INDICATOR)
Bring down wasting to 5% or less by
the year 2025 (MALABO and not
specified by PNISA).
Achieved: 8% in 2009 (IOF), 7.0 % in 2013 (SETSAN) and 4.5% in 2015 (IOF)
PDO Indicator 4: Private sector investment in agricultural sector (MALABO)
a) Domestic: Ratio of private sector
investment to government investment in
agriculture
(CORE INDICATOR)
Ensure that government investment
leverage at least X times domestic
private investment in agriculture
sector by 2025
PNISA did not devote explicit operational strategy and interventions to stimulate
directly inclusive private sector development and engagement
Targets were not defined under PNISA and MALABO. Absence of data systems to
generate this important indicator.
The data shown in the current draft of BR is misleading
Promising private sector investment includes numerous key commodities (e.g.
sugarcane, banana, poultry, rice, maize processing, etc.); while some initiatives to
promote private sector investment are being promoted (e.g. reduction of import tax,
extension of 10% IRPC for another 10 years, bona fide water rates for irrigation, no
payment of VAT for locally produced commodities, subsidized rates for electricity
and diesel), they are at incipient stage.
b) Foreign: Ratio of foreign private
direct investment to government
investment in agriculture
(CORE INDICATOR)
Ensure that government investment
leverage at least Y times foreign
private direct investment in
agriculture sector by 2025
Targets were not defined under neither PNISA nor MALABO.
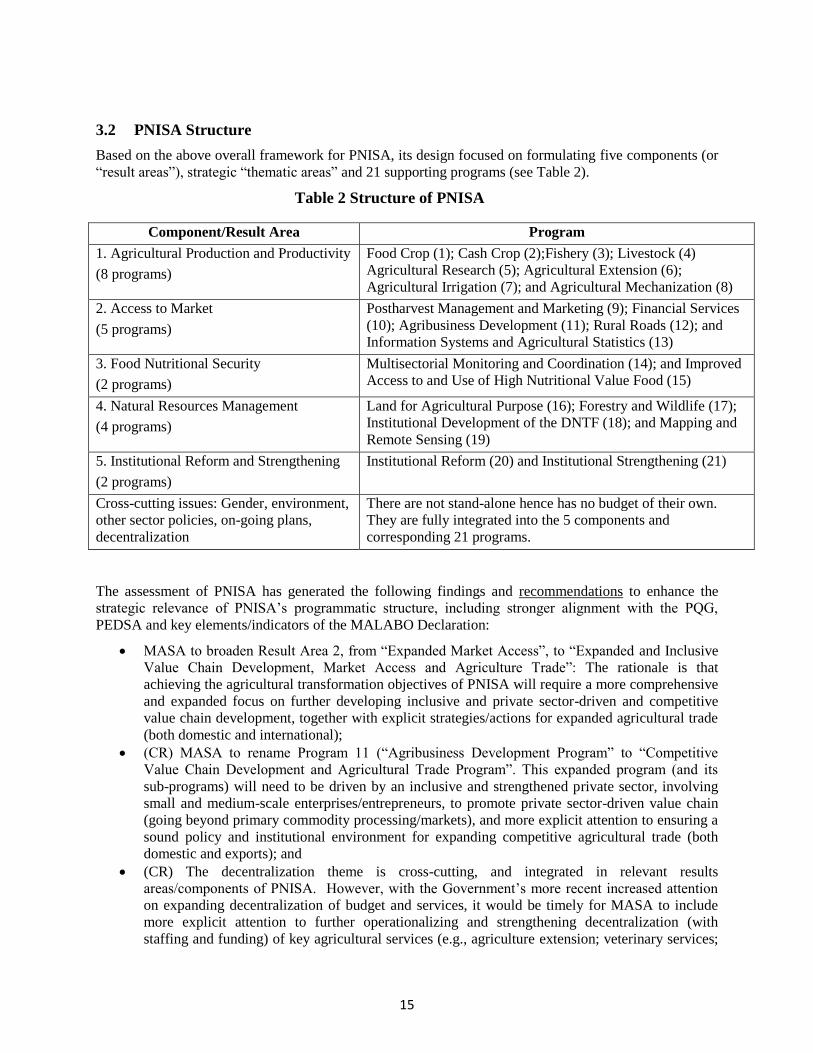
15
3.2 PNISA Structure
Based on the above overall framework for PNISA, its design focused on formulating five components (or
“result areas”), strategic “thematic areas” and 21 supporting programs (see Table 2).
Table 2 Structure of PNISA
Component/Result Area Program
1. Agricultural Production and Productivity
(8 programs)
Food Crop (1); Cash Crop (2);Fishery (3); Livestock (4)
Agricultural Research (5); Agricultural Extension (6);
Agricultural Irrigation (7); and Agricultural Mechanization (8)
2. Access to Market
(5 programs)
Postharvest Management and Marketing (9); Financial Services
(10); Agribusiness Development (11); Rural Roads (12); and
Information Systems and Agricultural Statistics (13)
3. Food Nutritional Security
(2 programs)
Multisectorial Monitoring and Coordination (14); and Improved
Access to and Use of High Nutritional Value Food (15)
4. Natural Resources Management
(4 programs)
Land for Agricultural Purpose (16); Forestry and Wildlife (17);
Institutional Development of the DNTF (18); and Mapping and
Remote Sensing (19)
5. Institutional Reform and Strengthening
(2 programs)
Institutional Reform (20) and Institutional Strengthening (21)
Cross-cutting issues: Gender, environment,
other sector policies, on-going plans,
decentralization
There are not stand-alone hence has no budget of their own.
They are fully integrated into the 5 components and
corresponding 21 programs.
The assessment of PNISA has generated the following findings and recommendations to enhance the
strategic relevance of PNISA’s programmatic structure, including stronger alignment with the PQG,
PEDSA and key elements/indicators of the MALABO Declaration:
MASA to broaden Result Area 2, from “Expanded Market Access”, to “Expanded and Inclusive
Value Chain Development, Market Access and Agriculture Trade”: The rationale is that
achieving the agricultural transformation objectives of PNISA will require a more comprehensive
and expanded focus on further developing inclusive and private sector-driven and competitive
value chain development, together with explicit strategies/actions for expanded agricultural trade
(both domestic and international);
(CR) MASA to rename Program 11 (“Agribusiness Development Program” to “Competitive
Value Chain Development and Agricultural Trade Program”. This expanded program (and its
sub-programs) will need to be driven by an inclusive and strengthened private sector, involving
small and medium-scale enterprises/entrepreneurs, to promote private sector-driven value chain
(going beyond primary commodity processing/markets), and more explicit attention to ensuring a
sound policy and institutional environment for expanding competitive agricultural trade (both
domestic and exports); and
(CR) The decentralization theme is cross-cutting, and integrated in relevant results
areas/components of PNISA. However, with the Government’s more recent increased attention
on expanding decentralization of budget and services, it would be timely for MASA to include
more explicit attention to further operationalizing and strengthening decentralization (with
staffing and funding) of key agricultural services (e.g., agriculture extension; veterinary services;
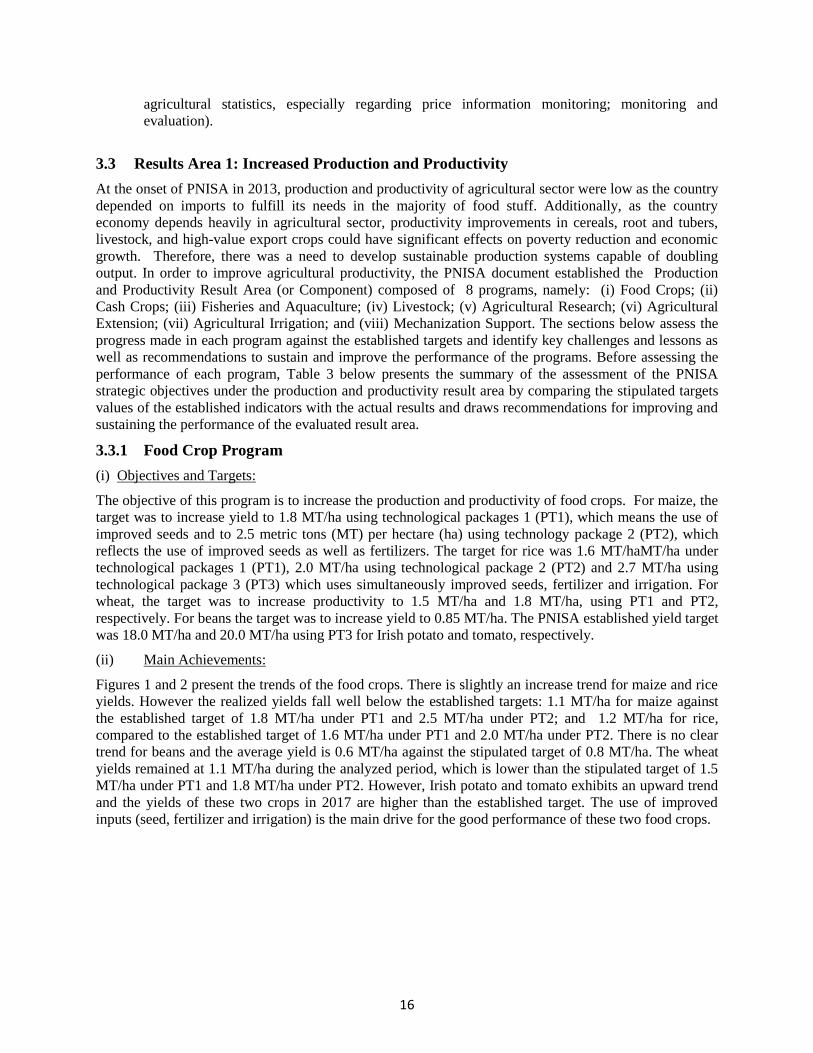
16
agricultural statistics, especially regarding price information monitoring; monitoring and
evaluation).
3.3 Results Area 1: Increased Production and Productivity
At the onset of PNISA in 2013, production and productivity of agricultural sector were low as the country
depended on imports to fulfill its needs in the majority of food stuff. Additionally, as the country
economy depends heavily in agricultural sector, productivity improvements in cereals, root and tubers,
livestock, and high-value export crops could have significant effects on poverty reduction and economic
growth. Therefore, there was a need to develop sustainable production systems capable of doubling
output. In order to improve agricultural productivity, the PNISA document established the Production
and Productivity Result Area (or Component) composed of 8 programs, namely: (i) Food Crops; (ii)
Cash Crops; (iii) Fisheries and Aquaculture; (iv) Livestock; (v) Agricultural Research; (vi) Agricultural
Extension; (vii) Agricultural Irrigation; and (viii) Mechanization Support. The sections below assess the
progress made in each program against the established targets and identify key challenges and lessons as
well as recommendations to sustain and improve the performance of the programs. Before assessing the
performance of each program, Table 3 below presents the summary of the assessment of the PNISA
strategic objectives under the production and productivity result area by comparing the stipulated targets
values of the established indicators with the actual results and draws recommendations for improving and
sustaining the performance of the evaluated result area.
3.3.1 Food Crop Program
(i) Objectives and Targets:
The objective of this program is to increase the production and productivity of food crops. For maize, the
target was to increase yield to 1.8 MT/ha using technological packages 1 (PT1), which means the use of
improved seeds and to 2.5 metric tons (MT) per hectare (ha) using technology package 2 (PT2), which
reflects the use of improved seeds as well as fertilizers. The target for rice was 1.6 MT/haMT/ha under
technological packages 1 (PT1), 2.0 MT/ha using technological package 2 (PT2) and 2.7 MT/ha using
technological package 3 (PT3) which uses simultaneously improved seeds, fertilizer and irrigation. For
wheat, the target was to increase productivity to 1.5 MT/ha and 1.8 MT/ha, using PT1 and PT2,
respectively. For beans the target was to increase yield to 0.85 MT/ha. The PNISA established yield target
was 18.0 MT/ha and 20.0 MT/ha using PT3 for Irish potato and tomato, respectively.
(ii) Main Achievements:
Figures 1 and 2 present the trends of the food crops. There is slightly an increase trend for maize and rice
yields. However the realized yields fall well below the established targets: 1.1 MT/ha for maize against
the established target of 1.8 MT/ha under PT1 and 2.5 MT/ha under PT2; and 1.2 MT/ha for rice,
compared to the established target of 1.6 MT/ha under PT1 and 2.0 MT/ha under PT2. There is no clear
trend for beans and the average yield is 0.6 MT/ha against the stipulated target of 0.8 MT/ha. The wheat
yields remained at 1.1 MT/ha during the analyzed period, which is lower than the stipulated target of 1.5
MT/ha under PT1 and 1.8 MT/ha under PT2. However, Irish potato and tomato exhibits an upward trend
and the yields of these two crops in 2017 are higher than the established target. The use of improved
inputs (seed, fertilizer and irrigation) is the main drive for the good performance of these two food crops.
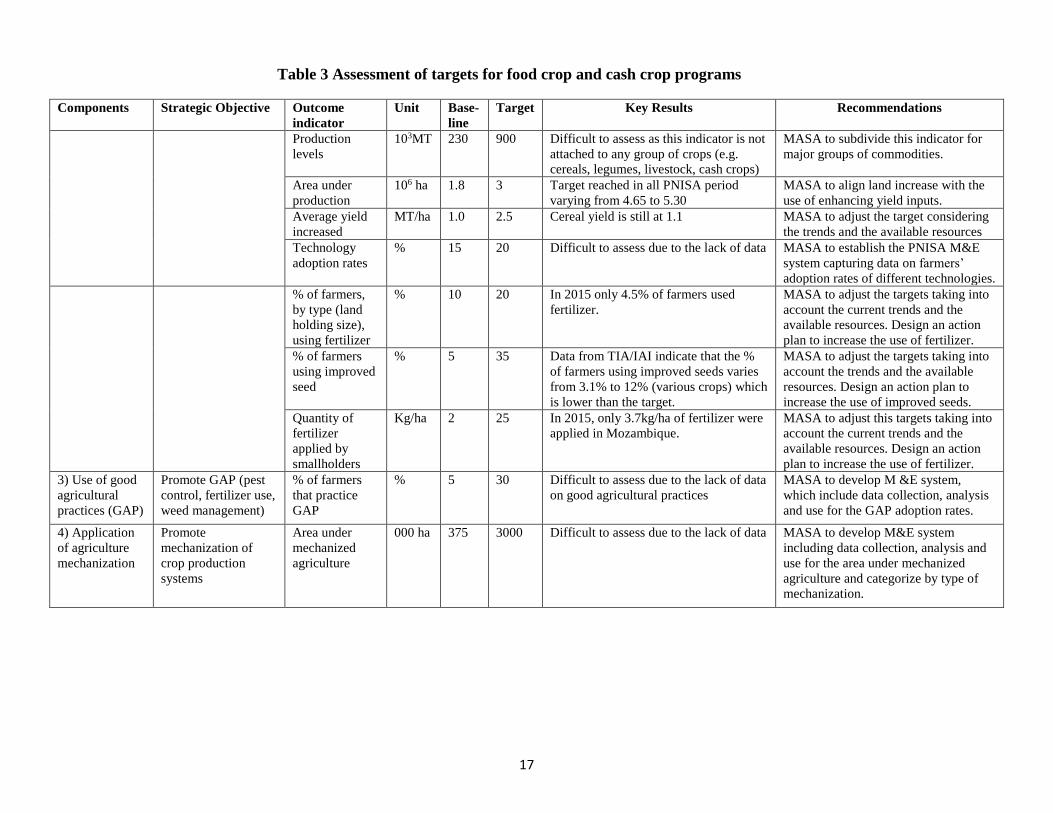
17
Table 3 Assessment of targets for food crop and cash crop programs
Components Strategic Objective Outcome
indicator
Unit Base-
line
Target Key Results Recommendations
Production
levels
103MT 230 900 Difficult to assess as this indicator is not
attached to any group of crops (e.g.
cereals, legumes, livestock, cash crops)
MASA to subdivide this indicator for
major groups of commodities.
Area under
production
106 ha 1.8 3 Target reached in all PNISA period
varying from 4.65 to 5.30
MASA to align land increase with the
use of enhancing yield inputs.
Average yield
increased
MT/ha 1.0 2.5 Cereal yield is still at 1.1 MASA to adjust the target considering
the trends and the available resources
Technology
adoption rates
% 15 20 Difficult to assess due to the lack of data MASA to establish the PNISA M&E
system capturing data on farmers’
adoption rates of different technologies.
% of farmers,
by type (land
holding size),
using fertilizer
% 10 20 In 2015 only 4.5% of farmers used
fertilizer.
MASA to adjust the targets taking into
account the current trends and the
available resources. Design an action
plan to increase the use of fertilizer.
% of farmers
using improved
seed
% 5 35 Data from TIA/IAI indicate that the %
of farmers using improved seeds varies
from 3.1% to 12% (various crops) which
is lower than the target.
MASA to adjust the targets taking into
account the trends and the available
resources. Design an action plan to
increase the use of improved seeds.
Quantity of
fertilizer
applied by
smallholders
Kg/ha 2 25 In 2015, only 3.7kg/ha of fertilizer were
applied in Mozambique.
MASA to adjust this targets taking into
account the current trends and the
available resources. Design an action
plan to increase the use of fertilizer.
3) Use of good
agricultural
practices (GAP)
Promote GAP (pest
control, fertilizer use,
weed management)
% of farmers
that practice
GAP
% 5 30 Difficult to assess due to the lack of data
on good agricultural practices
MASA to develop M &E system,
which include data collection, analysis
and use for the GAP adoption rates.
4) Application
of agriculture
mechanization
Promote
mechanization of
crop production
systems
Area under
mechanized
agriculture
000 ha 375 3000 Difficult to assess due to the lack of data MASA to develop M&E system
including data collection, analysis and
use for the area under mechanized
agriculture and categorize by type of
mechanization.
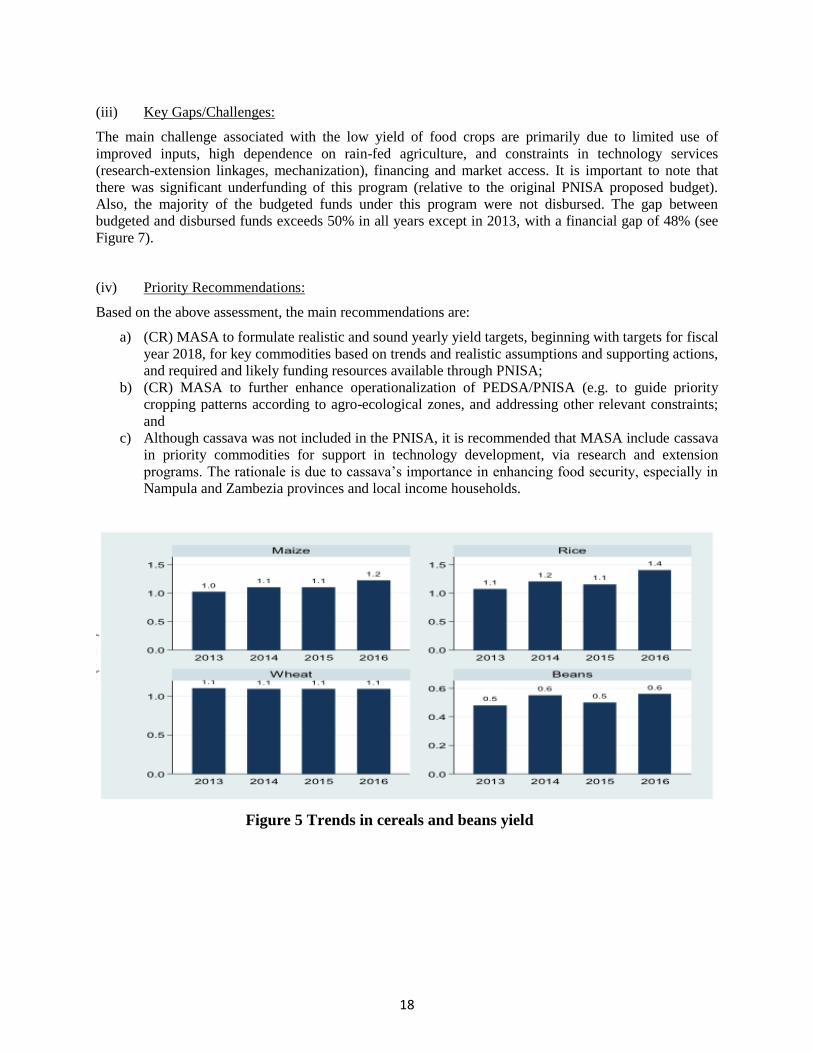
18
(iii) Key Gaps/Challenges:
The main challenge associated with the low yield of food crops are primarily due to limited use of
improved inputs, high dependence on rain-fed agriculture, and constraints in technology services
(research-extension linkages, mechanization), financing and market access. It is important to note that
there was significant underfunding of this program (relative to the original PNISA proposed budget).
Also, the majority of the budgeted funds under this program were not disbursed. The gap between
budgeted and disbursed funds exceeds 50% in all years except in 2013, with a financial gap of 48% (see
Figure 7).
(iv) Priority Recommendations:
Based on the above assessment, the main recommendations are:
a) (CR) MASA to formulate realistic and sound yearly yield targets, beginning with targets for fiscal
year 2018, for key commodities based on trends and realistic assumptions and supporting actions,
and required and likely funding resources available through PNISA;
b) (CR) MASA to further enhance operationalization of PEDSA/PNISA (e.g. to guide priority
cropping patterns according to agro-ecological zones, and addressing other relevant constraints;
and
c) Although cassava was not included in the PNISA, it is recommended that MASA include cassava
in priority commodities for support in technology development, via research and extension
programs. The rationale is due to cassava’s importance in enhancing food security, especially in
Nampula and Zambezia provinces and local income households.
Figure 5 Trends in cereals and beans yield
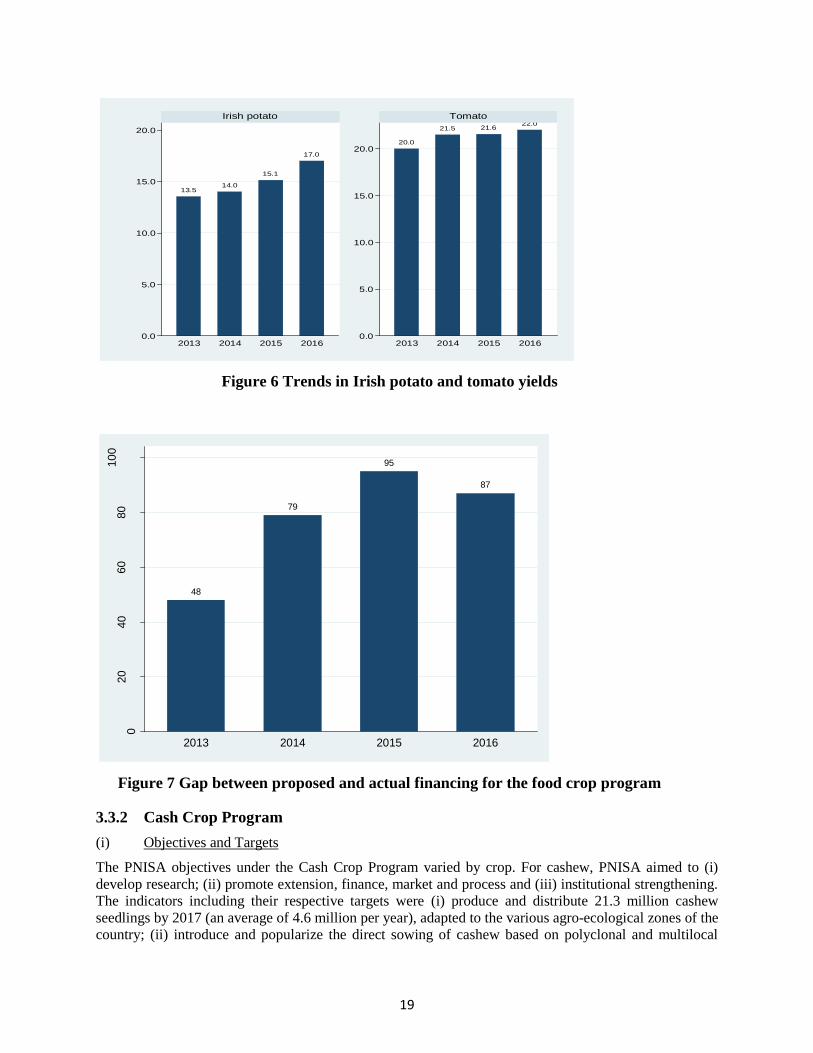
19
13.514.0
15.1
17.0
20.0
21.5 21.622.0
0.0
5.0
10.0
15.0
20.0
0.0
5.0
10.0
15.0
20.0
2013 2014 2015 2016 2013 2014 2015 2016
Irish potato Tomato
Yie
ld (t
ons/
ha)
Figure 6 Trends in Irish potato and tomato yields
48
79
95
87
020
40
60
80
10
0
Fin
ancia
l g
ap
(%
)
2013 2014 2015 2016
Figure 7 Gap between proposed and actual financing for the food crop program
3.3.2 Cash Crop Program
(i) Objectives and Targets
The PNISA objectives under the Cash Crop Program varied by crop. For cashew, PNISA aimed to (i)
develop research; (ii) promote extension, finance, market and process and (iii) institutional strengthening.
The indicators including their respective targets were (i) produce and distribute 21.3 million cashew
seedlings by 2017 (an average of 4.6 million per year), adapted to the various agro-ecological zones of the
country; (ii) introduce and popularize the direct sowing of cashew based on polyclonal and multilocal
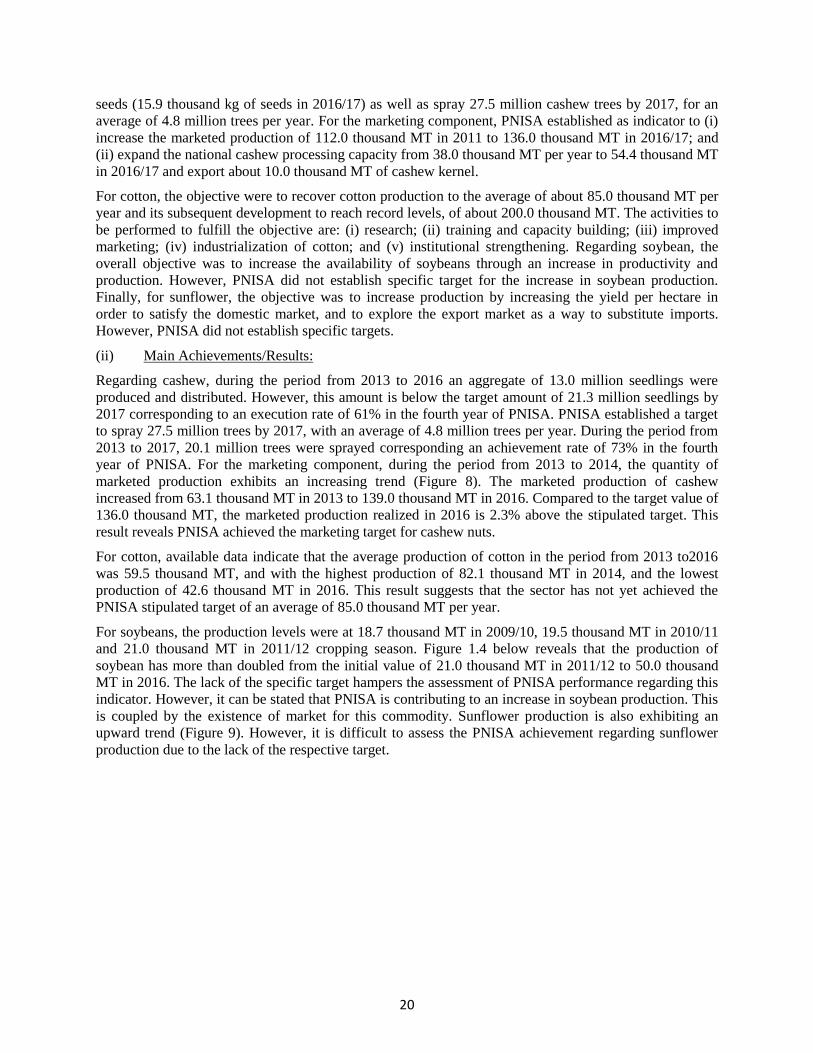
20
seeds (15.9 thousand kg of seeds in 2016/17) as well as spray 27.5 million cashew trees by 2017, for an
average of 4.8 million trees per year. For the marketing component, PNISA established as indicator to (i)
increase the marketed production of 112.0 thousand MT in 2011 to 136.0 thousand MT in 2016/17; and
(ii) expand the national cashew processing capacity from 38.0 thousand MT per year to 54.4 thousand MT
in 2016/17 and export about 10.0 thousand MT of cashew kernel.
For cotton, the objective were to recover cotton production to the average of about 85.0 thousand MT per
year and its subsequent development to reach record levels, of about 200.0 thousand MT. The activities to
be performed to fulfill the objective are: (i) research; (ii) training and capacity building; (iii) improved
marketing; (iv) industrialization of cotton; and (v) institutional strengthening. Regarding soybean, the
overall objective was to increase the availability of soybeans through an increase in productivity and
production. However, PNISA did not establish specific target for the increase in soybean production.
Finally, for sunflower, the objective was to increase production by increasing the yield per hectare in
order to satisfy the domestic market, and to explore the export market as a way to substitute imports.
However, PNISA did not establish specific targets.
(ii) Main Achievements/Results:
Regarding cashew, during the period from 2013 to 2016 an aggregate of 13.0 million seedlings were
produced and distributed. However, this amount is below the target amount of 21.3 million seedlings by
2017 corresponding to an execution rate of 61% in the fourth year of PNISA. PNISA established a target
to spray 27.5 million trees by 2017, with an average of 4.8 million trees per year. During the period from
2013 to 2017, 20.1 million trees were sprayed corresponding an achievement rate of 73% in the fourth
year of PNISA. For the marketing component, during the period from 2013 to 2014, the quantity of
marketed production exhibits an increasing trend (Figure 8). The marketed production of cashew
increased from 63.1 thousand MT in 2013 to 139.0 thousand MT in 2016. Compared to the target value of
136.0 thousand MT, the marketed production realized in 2016 is 2.3% above the stipulated target. This
result reveals PNISA achieved the marketing target for cashew nuts.
For cotton, available data indicate that the average production of cotton in the period from 2013 to2016
was 59.5 thousand MT, and with the highest production of 82.1 thousand MT in 2014, and the lowest
production of 42.6 thousand MT in 2016. This result suggests that the sector has not yet achieved the
PNISA stipulated target of an average of 85.0 thousand MT per year.
For soybeans, the production levels were at 18.7 thousand MT in 2009/10, 19.5 thousand MT in 2010/11
and 21.0 thousand MT in 2011/12 cropping season. Figure 1.4 below reveals that the production of
soybean has more than doubled from the initial value of 21.0 thousand MT in 2011/12 to 50.0 thousand
MT in 2016. The lack of the specific target hampers the assessment of PNISA performance regarding this
indicator. However, it can be stated that PNISA is contributing to an increase in soybean production. This
is coupled by the existence of market for this commodity. Sunflower production is also exhibiting an
upward trend (Figure 9). However, it is difficult to assess the PNISA achievement regarding sunflower
production due to the lack of the respective target.
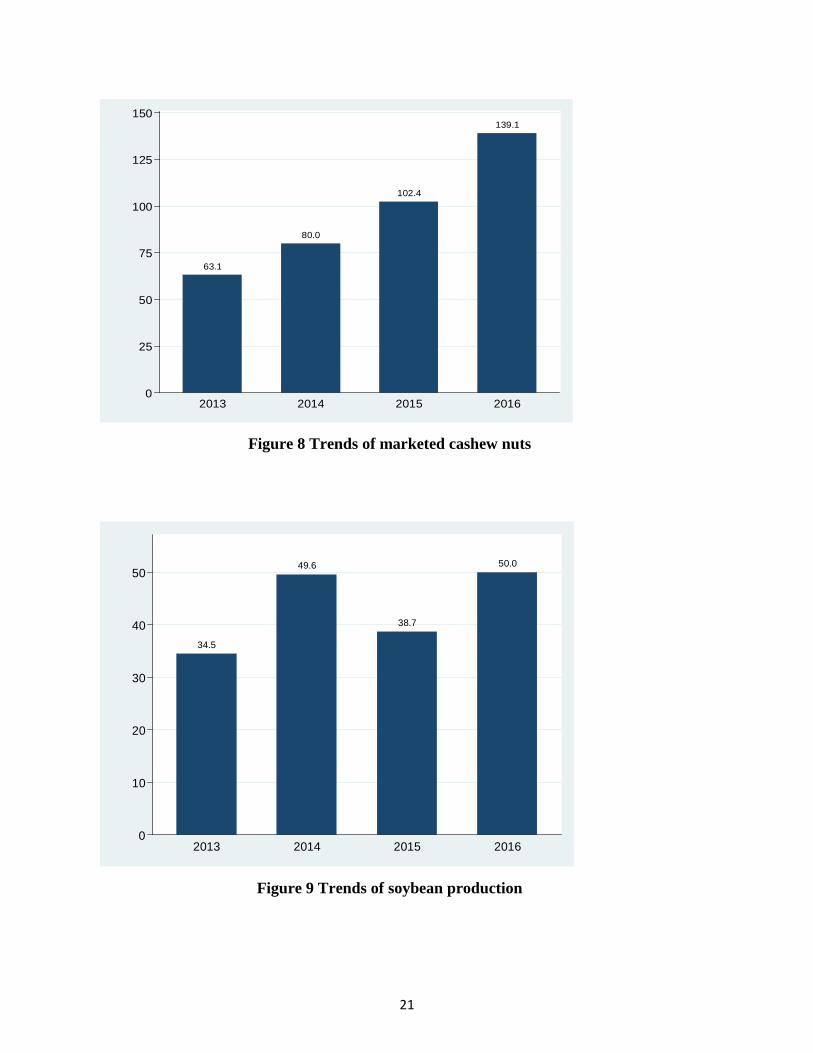
21
63.1
80.0
102.4
139.1
0
25
50
75
100
125
150
Ma
rkete
d c
ashe
w (
'00
0 M
T)
2013 2014 2015 2016
Figure 8 Trends of marketed cashew nuts
34.5
49.6
38.7
50.0
0
10
20
30
40
50
Pro
du
ction
('0
00
MT
)
2013 2014 2015 2016
Figure 9 Trends of soybean production
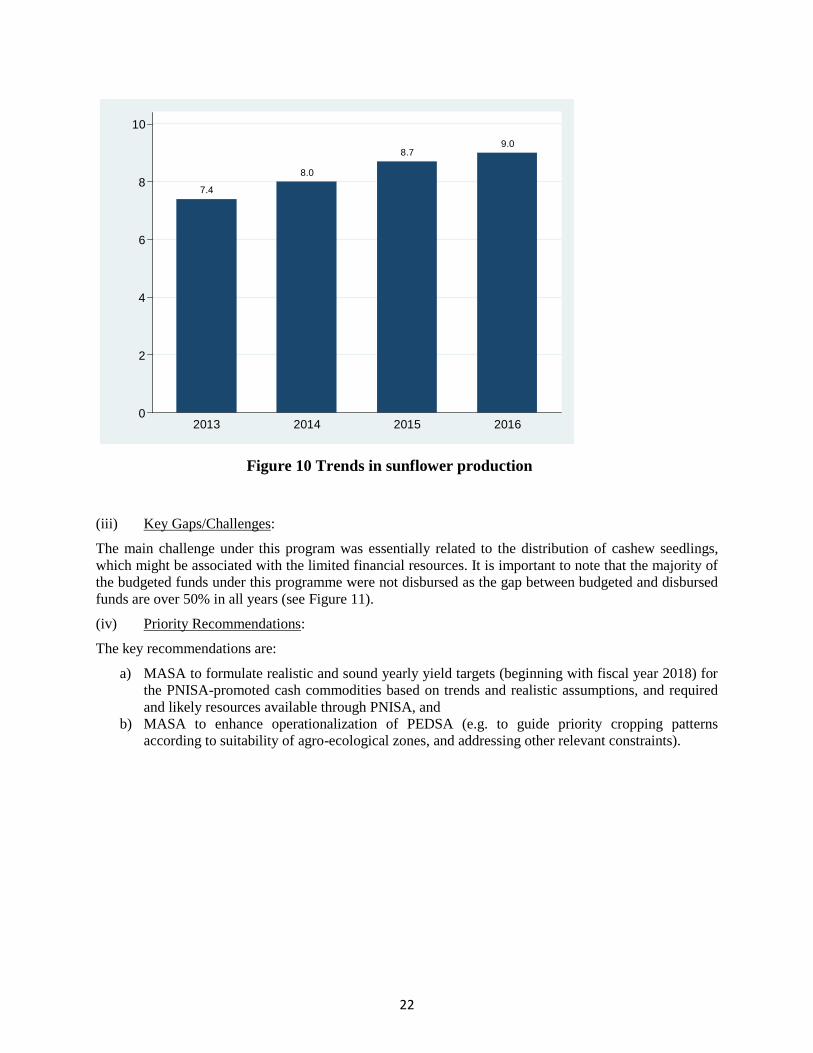
22
7.4
8.0
8.79.0
0
2
4
6
8
10
Pro
du
ction
('0
00
MT
)
2013 2014 2015 2016
Figure 10 Trends in sunflower production
(iii) Key Gaps/Challenges:
The main challenge under this program was essentially related to the distribution of cashew seedlings,
which might be associated with the limited financial resources. It is important to note that the majority of
the budgeted funds under this programme were not disbursed as the gap between budgeted and disbursed
funds are over 50% in all years (see Figure 11).
(iv) Priority Recommendations:
The key recommendations are:
a) MASA to formulate realistic and sound yearly yield targets (beginning with fiscal year 2018) for
the PNISA-promoted cash commodities based on trends and realistic assumptions, and required
and likely resources available through PNISA, and
b) MASA to enhance operationalization of PEDSA (e.g. to guide priority cropping patterns
according to suitability of agro-ecological zones, and addressing other relevant constraints).
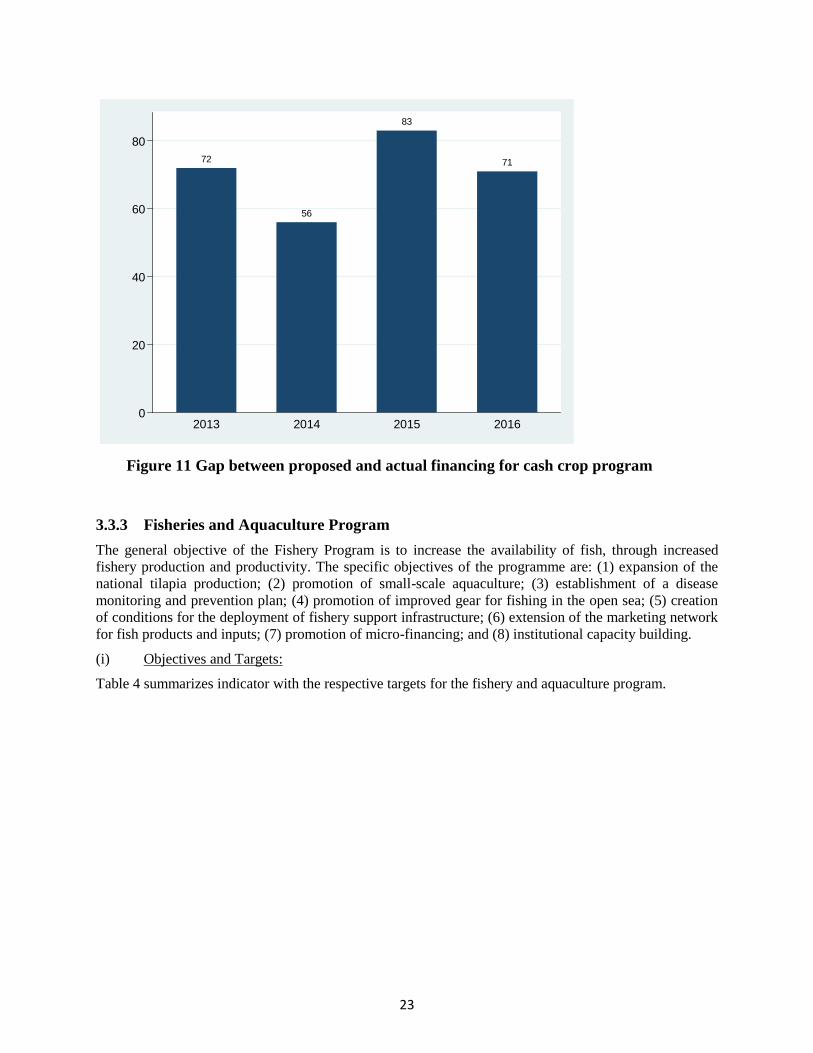
23
72
56
83
71
0
20
40
60
80
Fin
ancia
l g
ap
(%
)
2013 2014 2015 2016
Figure 11 Gap between proposed and actual financing for cash crop program
3.3.3 Fisheries and Aquaculture Program
The general objective of the Fishery Program is to increase the availability of fish, through increased
fishery production and productivity. The specific objectives of the programme are: (1) expansion of the
national tilapia production; (2) promotion of small-scale aquaculture; (3) establishment of a disease
monitoring and prevention plan; (4) promotion of improved gear for fishing in the open sea; (5) creation
of conditions for the deployment of fishery support infrastructure; (6) extension of the marketing network
for fish products and inputs; (7) promotion of micro-financing; and (8) institutional capacity building.
(i) Objectives and Targets:
Table 4 summarizes indicator with the respective targets for the fishery and aquaculture program.
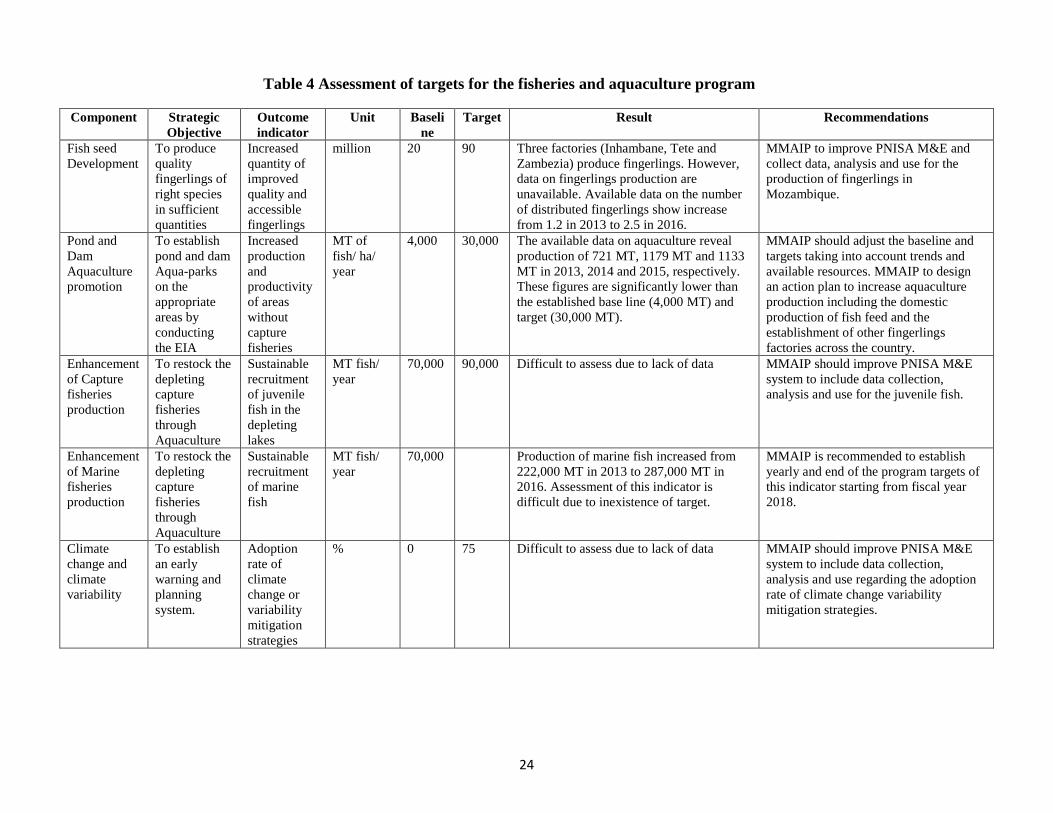
24
Table 4 Assessment of targets for the fisheries and aquaculture program
Component Strategic
Objective
Outcome
indicator
Unit Baseli
ne
Target Result Recommendations
Fish seed
Development
To produce
quality
fingerlings of
right species
in sufficient
quantities
Increased
quantity of
improved
quality and
accessible
fingerlings
million 20 90 Three factories (Inhambane, Tete and
Zambezia) produce fingerlings. However,
data on fingerlings production are
unavailable. Available data on the number
of distributed fingerlings show increase
from 1.2 in 2013 to 2.5 in 2016.
MMAIP to improve PNISA M&E and
collect data, analysis and use for the
production of fingerlings in
Mozambique.
Pond and
Dam
Aquaculture
promotion
To establish
pond and dam
Aqua-parks
on the
appropriate
areas by
conducting
the EIA
Increased
production
and
productivity
of areas
without
capture
fisheries
MT of
fish/ ha/
year
4,000 30,000 The available data on aquaculture reveal
production of 721 MT, 1179 MT and 1133
MT in 2013, 2014 and 2015, respectively.
These figures are significantly lower than
the established base line (4,000 MT) and
target (30,000 MT).
MMAIP should adjust the baseline and
targets taking into account trends and
available resources. MMAIP to design
an action plan to increase aquaculture
production including the domestic
production of fish feed and the
establishment of other fingerlings
factories across the country.
Enhancement
of Capture
fisheries
production
To restock the
depleting
capture
fisheries
through
Aquaculture
Sustainable
recruitment
of juvenile
fish in the
depleting
lakes
MT fish/
year
70,000 90,000 Difficult to assess due to lack of data MMAIP should improve PNISA M&E
system to include data collection,
analysis and use for the juvenile fish.
Enhancement
of Marine
fisheries
production
To restock the
depleting
capture
fisheries
through
Aquaculture
Sustainable
recruitment
of marine
fish
MT fish/
year
70,000 Production of marine fish increased from
222,000 MT in 2013 to 287,000 MT in
2016. Assessment of this indicator is
difficult due to inexistence of target.
MMAIP is recommended to establish
yearly and end of the program targets of
this indicator starting from fiscal year
2018.
Climate
change and
climate
variability
To establish
an early
warning and
planning
system.
Adoption
rate of
climate
change or
variability
mitigation
strategies
% 0 75 Difficult to assess due to lack of data MMAIP should improve PNISA M&E
system to include data collection,
analysis and use regarding the adoption
rate of climate change variability
mitigation strategies.
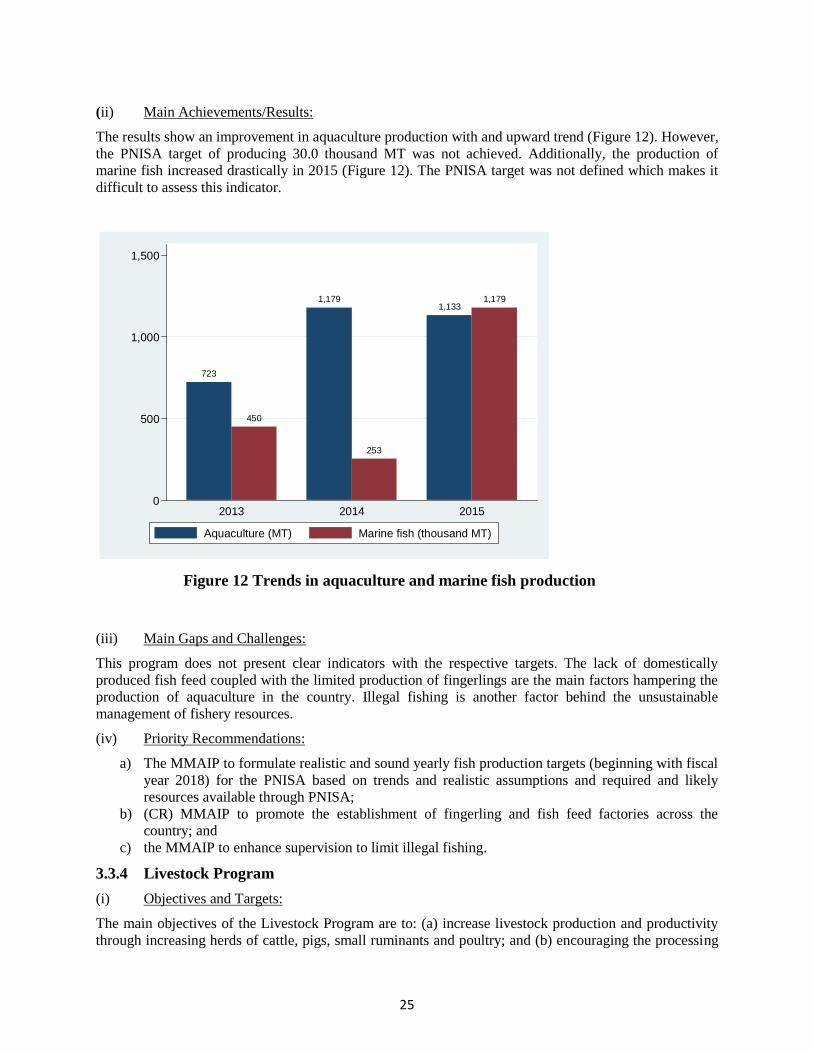
25
(ii) Main Achievements/Results:
The results show an improvement in aquaculture production with and upward trend (Figure 12). However,
the PNISA target of producing 30.0 thousand MT was not achieved. Additionally, the production of
marine fish increased drastically in 2015 (Figure 12). The PNISA target was not defined which makes it
difficult to assess this indicator.
723
450
1,179
253
1,1331,179
0
500
1,000
1,500
Pro
ductio
n
2013 2014 2015
Aquaculture (MT) Marine fish (thousand MT)
Figure 12 Trends in aquaculture and marine fish production
(iii) Main Gaps and Challenges:
This program does not present clear indicators with the respective targets. The lack of domestically
produced fish feed coupled with the limited production of fingerlings are the main factors hampering the
production of aquaculture in the country. Illegal fishing is another factor behind the unsustainable
management of fishery resources.
(iv) Priority Recommendations:
a) The MMAIP to formulate realistic and sound yearly fish production targets (beginning with fiscal
year 2018) for the PNISA based on trends and realistic assumptions and required and likely
resources available through PNISA;
b) (CR) MMAIP to promote the establishment of fingerling and fish feed factories across the
country; and
c) the MMAIP to enhance supervision to limit illegal fishing.
3.3.4 Livestock Program
(i) Objectives and Targets:
The main objectives of the Livestock Program are to: (a) increase livestock production and productivity
through increasing herds of cattle, pigs, small ruminants and poultry; and (b) encouraging the processing
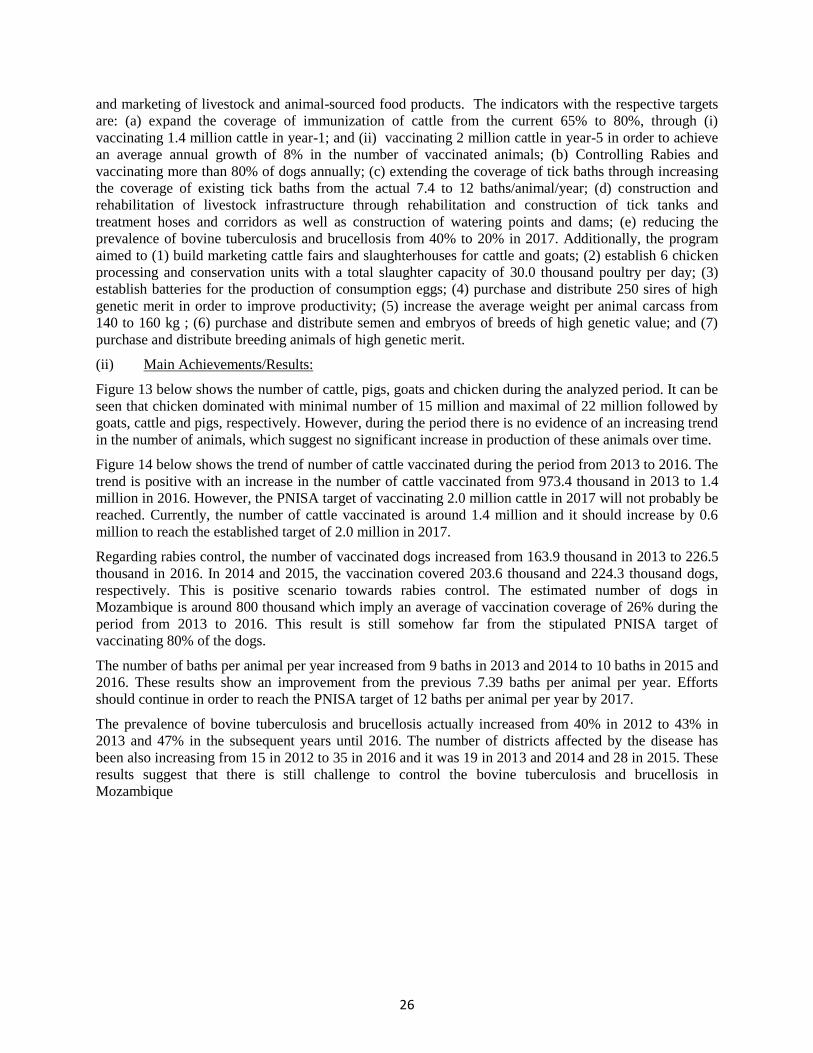
26
and marketing of livestock and animal-sourced food products. The indicators with the respective targets
are: (a) expand the coverage of immunization of cattle from the current 65% to 80%, through (i)
vaccinating 1.4 million cattle in year-1; and (ii) vaccinating 2 million cattle in year-5 in order to achieve
an average annual growth of 8% in the number of vaccinated animals; (b) Controlling Rabies and
vaccinating more than 80% of dogs annually; (c) extending the coverage of tick baths through increasing
the coverage of existing tick baths from the actual 7.4 to 12 baths/animal/year; (d) construction and
rehabilitation of livestock infrastructure through rehabilitation and construction of tick tanks and
treatment hoses and corridors as well as construction of watering points and dams; (e) reducing the
prevalence of bovine tuberculosis and brucellosis from 40% to 20% in 2017. Additionally, the program
aimed to (1) build marketing cattle fairs and slaughterhouses for cattle and goats; (2) establish 6 chicken
processing and conservation units with a total slaughter capacity of 30.0 thousand poultry per day; (3)
establish batteries for the production of consumption eggs; (4) purchase and distribute 250 sires of high
genetic merit in order to improve productivity; (5) increase the average weight per animal carcass from
140 to 160 kg ; (6) purchase and distribute semen and embryos of breeds of high genetic value; and (7)
purchase and distribute breeding animals of high genetic merit.
(ii) Main Achievements/Results:
Figure 13 below shows the number of cattle, pigs, goats and chicken during the analyzed period. It can be
seen that chicken dominated with minimal number of 15 million and maximal of 22 million followed by
goats, cattle and pigs, respectively. However, during the period there is no evidence of an increasing trend
in the number of animals, which suggest no significant increase in production of these animals over time.
Figure 14 below shows the trend of number of cattle vaccinated during the period from 2013 to 2016. The
trend is positive with an increase in the number of cattle vaccinated from 973.4 thousand in 2013 to 1.4
million in 2016. However, the PNISA target of vaccinating 2.0 million cattle in 2017 will not probably be
reached. Currently, the number of cattle vaccinated is around 1.4 million and it should increase by 0.6
million to reach the established target of 2.0 million in 2017.
Regarding rabies control, the number of vaccinated dogs increased from 163.9 thousand in 2013 to 226.5
thousand in 2016. In 2014 and 2015, the vaccination covered 203.6 thousand and 224.3 thousand dogs,
respectively. This is positive scenario towards rabies control. The estimated number of dogs in
Mozambique is around 800 thousand which imply an average of vaccination coverage of 26% during the
period from 2013 to 2016. This result is still somehow far from the stipulated PNISA target of
vaccinating 80% of the dogs.
The number of baths per animal per year increased from 9 baths in 2013 and 2014 to 10 baths in 2015 and
2016. These results show an improvement from the previous 7.39 baths per animal per year. Efforts
should continue in order to reach the PNISA target of 12 baths per animal per year by 2017.
The prevalence of bovine tuberculosis and brucellosis actually increased from 40% in 2012 to 43% in
2013 and 47% in the subsequent years until 2016. The number of districts affected by the disease has
been also increasing from 15 in 2012 to 35 in 2016 and it was 19 in 2013 and 2014 and 28 in 2015. These
results suggest that there is still challenge to control the bovine tuberculosis and brucellosis in
Mozambique
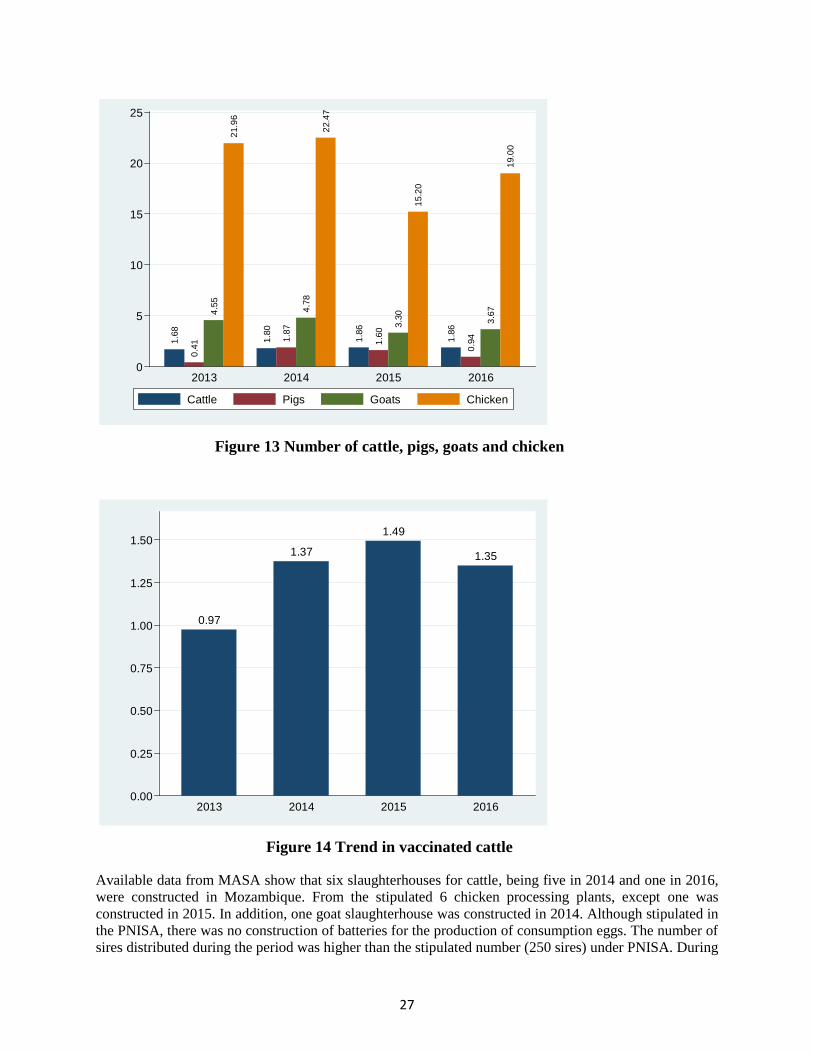
27
1.6
8
0.4
1
4.5
5
21.9
6
1.8
0
1.8
7
4.7
8
22.4
7
1.8
6
1.6
0
3.3
0
15.2
0
1.8
6
0.9
4
3.6
7
19.0
0
0
5
10
15
20
25
An
ima
l ('00
0'0
00
)
2013 2014 2015 2016
Cattle Pigs Goats Chicken
Figure 13 Number of cattle, pigs, goats and chicken
0.97
1.37
1.49
1.35
0.00
0.25
0.50
0.75
1.00
1.25
1.50
Va
ccin
ate
d c
attle
('0
00
'00
0)
2013 2014 2015 2016
Figure 14 Trend in vaccinated cattle
Available data from MASA show that six slaughterhouses for cattle, being five in 2014 and one in 2016,
were constructed in Mozambique. From the stipulated 6 chicken processing plants, except one was
constructed in 2015. In addition, one goat slaughterhouse was constructed in 2014. Although stipulated in
the PNISA, there was no construction of batteries for the production of consumption eggs. The number of
sires distributed during the period was higher than the stipulated number (250 sires) under PNISA. During
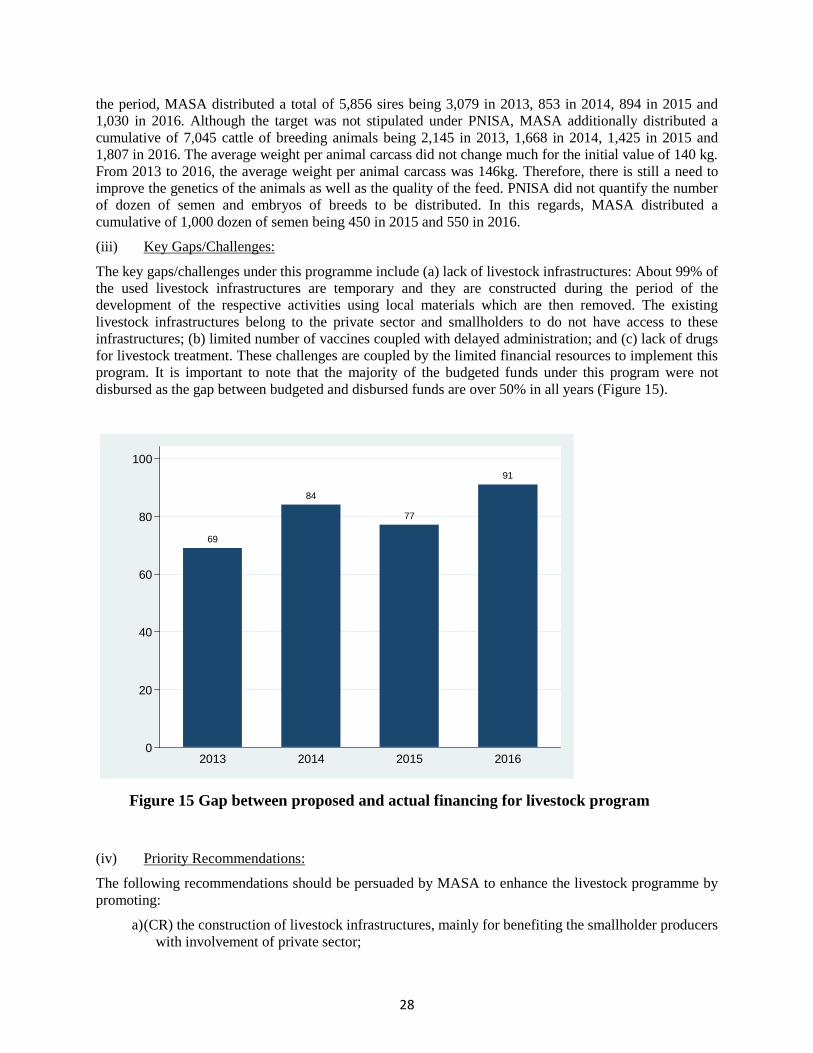
28
the period, MASA distributed a total of 5,856 sires being 3,079 in 2013, 853 in 2014, 894 in 2015 and
1,030 in 2016. Although the target was not stipulated under PNISA, MASA additionally distributed a
cumulative of 7,045 cattle of breeding animals being 2,145 in 2013, 1,668 in 2014, 1,425 in 2015 and
1,807 in 2016. The average weight per animal carcass did not change much for the initial value of 140 kg.
From 2013 to 2016, the average weight per animal carcass was 146kg. Therefore, there is still a need to
improve the genetics of the animals as well as the quality of the feed. PNISA did not quantify the number
of dozen of semen and embryos of breeds to be distributed. In this regards, MASA distributed a
cumulative of 1,000 dozen of semen being 450 in 2015 and 550 in 2016.
(iii) Key Gaps/Challenges:
The key gaps/challenges under this programme include (a) lack of livestock infrastructures: About 99% of
the used livestock infrastructures are temporary and they are constructed during the period of the
development of the respective activities using local materials which are then removed. The existing
livestock infrastructures belong to the private sector and smallholders to do not have access to these
infrastructures; (b) limited number of vaccines coupled with delayed administration; and (c) lack of drugs
for livestock treatment. These challenges are coupled by the limited financial resources to implement this
program. It is important to note that the majority of the budgeted funds under this program were not
disbursed as the gap between budgeted and disbursed funds are over 50% in all years (Figure 15).
69
84
77
91
0
20
40
60
80
100
Fin
ancia
l g
ap
(%
)
2013 2014 2015 2016
Figure 15 Gap between proposed and actual financing for livestock program
(iv) Priority Recommendations:
The following recommendations should be persuaded by MASA to enhance the livestock programme by
promoting:
a) (CR) the construction of livestock infrastructures, mainly for benefiting the smallholder producers
with involvement of private sector;
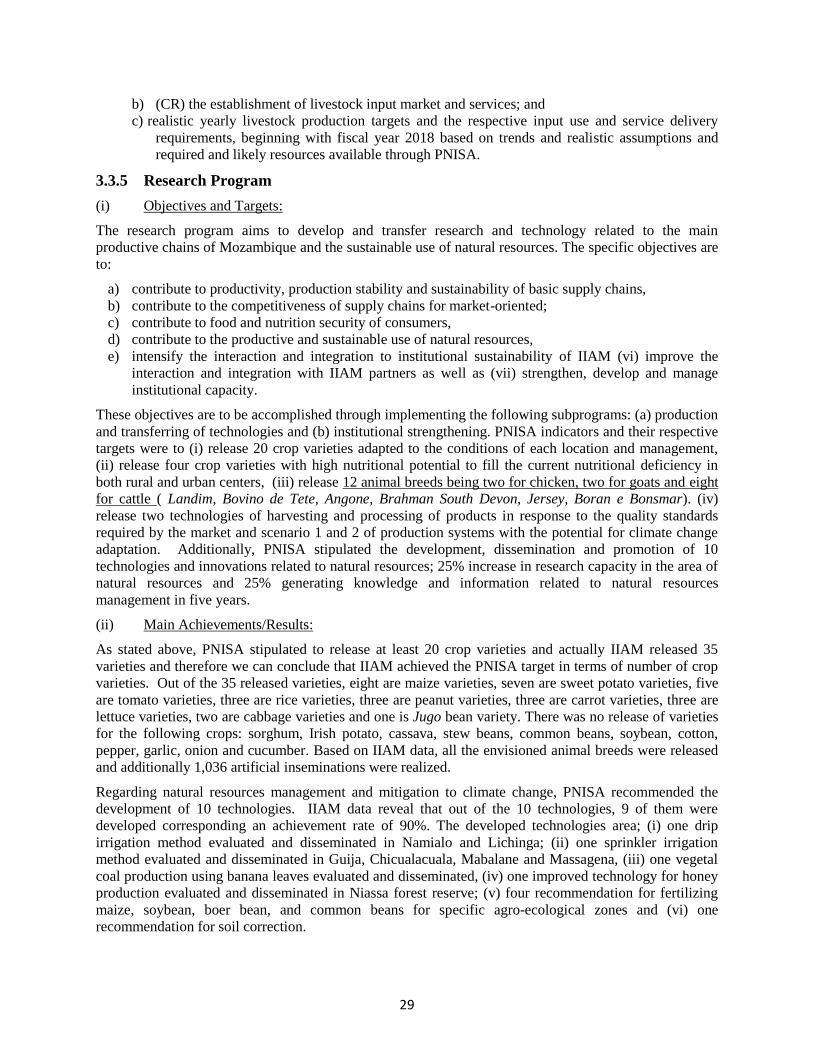
29
b) (CR) the establishment of livestock input market and services; and
c) realistic yearly livestock production targets and the respective input use and service delivery
requirements, beginning with fiscal year 2018 based on trends and realistic assumptions and
required and likely resources available through PNISA.
3.3.5 Research Program
(i) Objectives and Targets:
The research program aims to develop and transfer research and technology related to the main
productive chains of Mozambique and the sustainable use of natural resources. The specific objectives are
to:
a) contribute to productivity, production stability and sustainability of basic supply chains,
b) contribute to the competitiveness of supply chains for market-oriented;
c) contribute to food and nutrition security of consumers,
d) contribute to the productive and sustainable use of natural resources,
e) intensify the interaction and integration to institutional sustainability of IIAM (vi) improve the
interaction and integration with IIAM partners as well as (vii) strengthen, develop and manage
institutional capacity.
These objectives are to be accomplished through implementing the following subprograms: (a) production
and transferring of technologies and (b) institutional strengthening. PNISA indicators and their respective
targets were to (i) release 20 crop varieties adapted to the conditions of each location and management,
(ii) release four crop varieties with high nutritional potential to fill the current nutritional deficiency in
both rural and urban centers, (iii) release 12 animal breeds being two for chicken, two for goats and eight
for cattle ( Landim, Bovino de Tete, Angone, Brahman South Devon, Jersey, Boran e Bonsmar). (iv)
release two technologies of harvesting and processing of products in response to the quality standards
required by the market and scenario 1 and 2 of production systems with the potential for climate change
adaptation. Additionally, PNISA stipulated the development, dissemination and promotion of 10
technologies and innovations related to natural resources; 25% increase in research capacity in the area of
natural resources and 25% generating knowledge and information related to natural resources
management in five years.
(ii) Main Achievements/Results:
As stated above, PNISA stipulated to release at least 20 crop varieties and actually IIAM released 35
varieties and therefore we can conclude that IIAM achieved the PNISA target in terms of number of crop
varieties. Out of the 35 released varieties, eight are maize varieties, seven are sweet potato varieties, five
are tomato varieties, three are rice varieties, three are peanut varieties, three are carrot varieties, three are
lettuce varieties, two are cabbage varieties and one is Jugo bean variety. There was no release of varieties
for the following crops: sorghum, Irish potato, cassava, stew beans, common beans, soybean, cotton,
pepper, garlic, onion and cucumber. Based on IIAM data, all the envisioned animal breeds were released
and additionally 1,036 artificial inseminations were realized.
Regarding natural resources management and mitigation to climate change, PNISA recommended the
development of 10 technologies. IIAM data reveal that out of the 10 technologies, 9 of them were
developed corresponding an achievement rate of 90%. The developed technologies area; (i) one drip
irrigation method evaluated and disseminated in Namialo and Lichinga; (ii) one sprinkler irrigation
method evaluated and disseminated in Guija, Chicualacuala, Mabalane and Massagena, (iii) one vegetal
coal production using banana leaves evaluated and disseminated, (iv) one improved technology for honey
production evaluated and disseminated in Niassa forest reserve; (v) four recommendation for fertilizing
maize, soybean, boer bean, and common beans for specific agro-ecological zones and (vi) one
recommendation for soil correction.
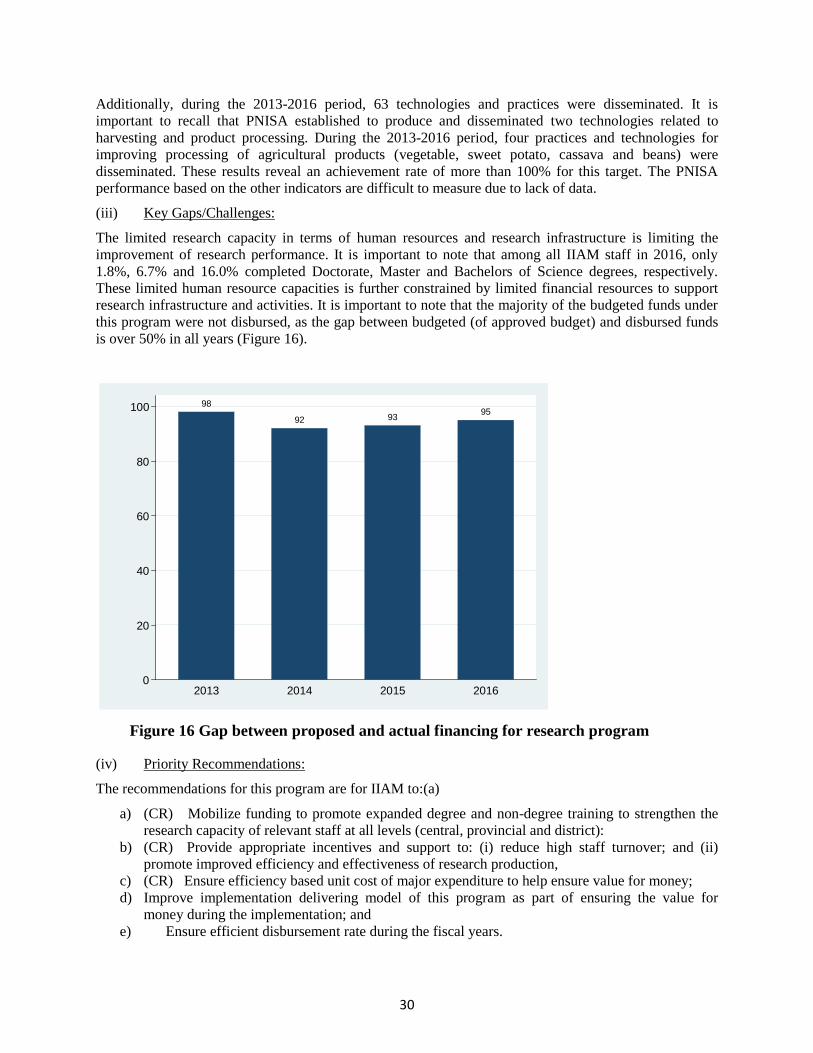
30
Additionally, during the 2013-2016 period, 63 technologies and practices were disseminated. It is
important to recall that PNISA established to produce and disseminated two technologies related to
harvesting and product processing. During the 2013-2016 period, four practices and technologies for
improving processing of agricultural products (vegetable, sweet potato, cassava and beans) were
disseminated. These results reveal an achievement rate of more than 100% for this target. The PNISA
performance based on the other indicators are difficult to measure due to lack of data.
(iii) Key Gaps/Challenges:
The limited research capacity in terms of human resources and research infrastructure is limiting the
improvement of research performance. It is important to note that among all IIAM staff in 2016, only
1.8%, 6.7% and 16.0% completed Doctorate, Master and Bachelors of Science degrees, respectively.
These limited human resource capacities is further constrained by limited financial resources to support
research infrastructure and activities. It is important to note that the majority of the budgeted funds under
this program were not disbursed, as the gap between budgeted (of approved budget) and disbursed funds
is over 50% in all years (Figure 16).
98
92 9395
0
20
40
60
80
100
Fin
ancia
l g
ap
(%
)
2013 2014 2015 2016
Figure 16 Gap between proposed and actual financing for research program
(iv) Priority Recommendations:
The recommendations for this program are for IIAM to:(a)
a) (CR) Mobilize funding to promote expanded degree and non-degree training to strengthen the
research capacity of relevant staff at all levels (central, provincial and district):
b) (CR) Provide appropriate incentives and support to: (i) reduce high staff turnover; and (ii)
promote improved efficiency and effectiveness of research production,
c) (CR) Ensure efficiency based unit cost of major expenditure to help ensure value for money;
d) Improve implementation delivering model of this program as part of ensuring the value for
money during the implementation; and
e) Ensure efficient disbursement rate during the fiscal years.
31
3.3.6 Agricultural Extension Program
(i) Objectives and Targets:
The Agricultural Extension Program presented the following specific objectives: (1) increase the
implementation capacity of extension programs within a pluralistic and participatory framework; (2)
improve the technical and managerial capacity of producers with respect to the planning, monitoring and
evaluation process and the provision of services; (3) provide extension services at provincial and district
level to promote agricultural and fishery productivity for food and nutritional security and food and the
sustainable use of natural resources. The PNISA document did not establish the indicators and the
respective targets for this program. The possible indicator for this program can be (i) percentage of
farmers having access to extension services and (ii) the number of extension agents. The first indicator
was stipulated under MALABO declaration and the target is to all farmers having access to advisory
services by 2018.
(ii) Main Achievements/Results:
Regarding the coverage of the extension services, the available data reveal a significant shortfall between
the MALABO target of coverage 100% by 2018 vis-a -vis the coverage rate of 28.8% in 2016. Figure 17
below shows the number of extension agents by service provider. It can be seen that the majority of the
extension agents belongs to the government and the number of government extension agents exhibits a
slightly upward trend. However, due to the lack of PNISA target for this indicator, the PNISA effects in
terms of increasing the number of extension agents is impossible to assess.
1,137
281
607
1,261
781
1,304
732 748
1,371
510
421
0
500
1,000
1,500
Exte
nsio
n a
ge
nts
2013 2014 2015 2016
Government Private sector NGO
Figure 17 Trend of the number of extension agents by service provider
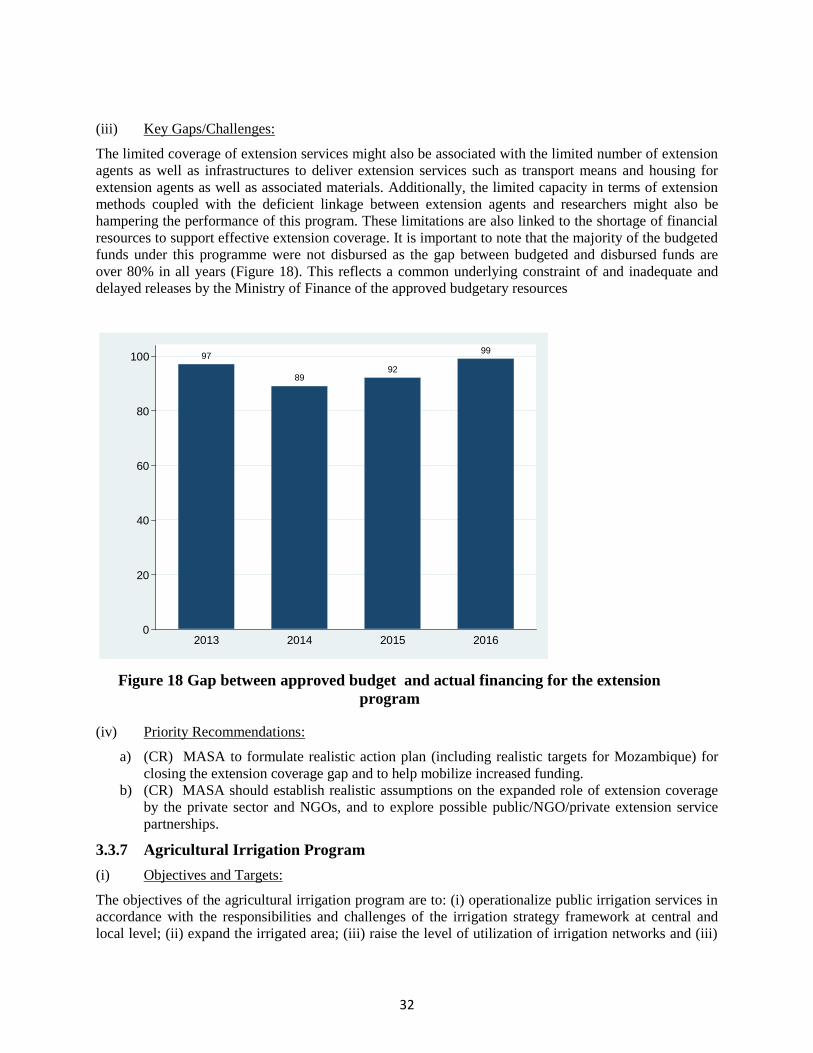
32
(iii) Key Gaps/Challenges:
The limited coverage of extension services might also be associated with the limited number of extension
agents as well as infrastructures to deliver extension services such as transport means and housing for
extension agents as well as associated materials. Additionally, the limited capacity in terms of extension
methods coupled with the deficient linkage between extension agents and researchers might also be
hampering the performance of this program. These limitations are also linked to the shortage of financial
resources to support effective extension coverage. It is important to note that the majority of the budgeted
funds under this programme were not disbursed as the gap between budgeted and disbursed funds are
over 80% in all years (Figure 18). This reflects a common underlying constraint of and inadequate and
delayed releases by the Ministry of Finance of the approved budgetary resources
97
8992
99
0
20
40
60
80
100
Fin
ancia
l g
ap
(%
)
2013 2014 2015 2016
Figure 18 Gap between approved budget and actual financing for the extension
program
(iv) Priority Recommendations:
a) (CR) MASA to formulate realistic action plan (including realistic targets for Mozambique) for
closing the extension coverage gap and to help mobilize increased funding.
b) (CR) MASA should establish realistic assumptions on the expanded role of extension coverage
by the private sector and NGOs, and to explore possible public/NGO/private extension service
partnerships.
3.3.7 Agricultural Irrigation Program
(i) Objectives and Targets:
The objectives of the agricultural irrigation program are to: (i) operationalize public irrigation services in
accordance with the responsibilities and challenges of the irrigation strategy framework at central and
local level; (ii) expand the irrigated area; (iii) raise the level of utilization of irrigation networks and (iii)
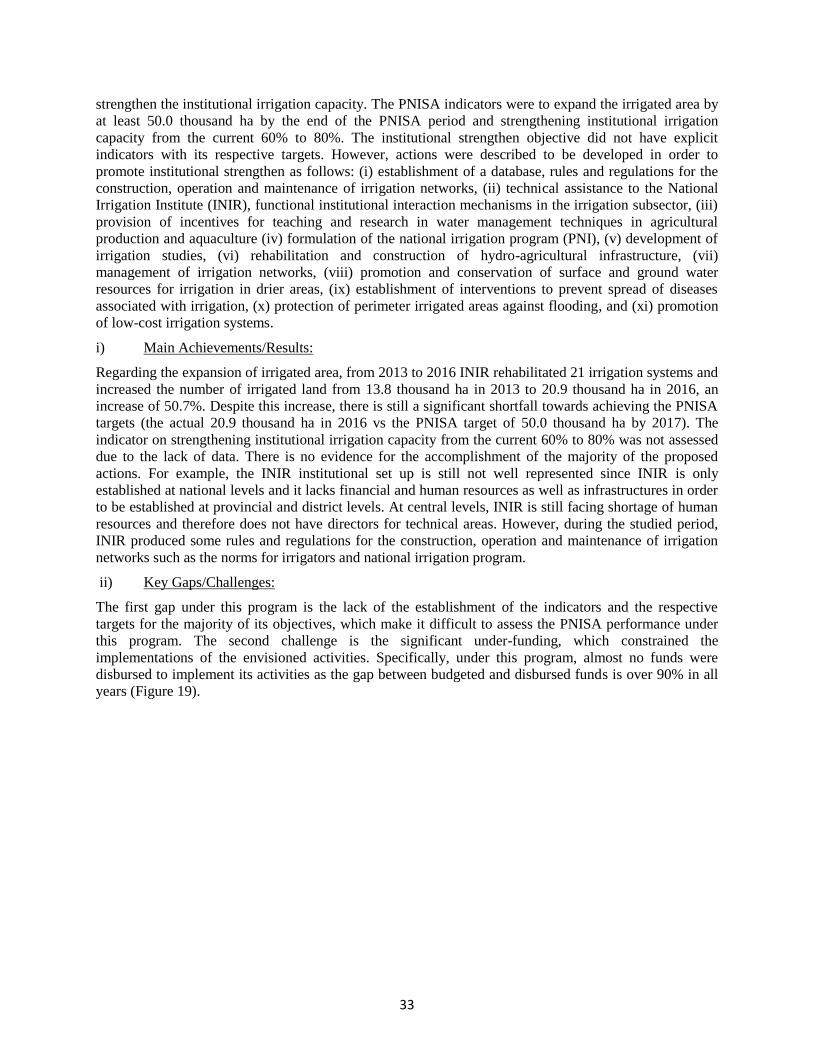
33
strengthen the institutional irrigation capacity. The PNISA indicators were to expand the irrigated area by
at least 50.0 thousand ha by the end of the PNISA period and strengthening institutional irrigation
capacity from the current 60% to 80%. The institutional strengthen objective did not have explicit
indicators with its respective targets. However, actions were described to be developed in order to
promote institutional strengthen as follows: (i) establishment of a database, rules and regulations for the
construction, operation and maintenance of irrigation networks, (ii) technical assistance to the National
Irrigation Institute (INIR), functional institutional interaction mechanisms in the irrigation subsector, (iii)
provision of incentives for teaching and research in water management techniques in agricultural
production and aquaculture (iv) formulation of the national irrigation program (PNI), (v) development of
irrigation studies, (vi) rehabilitation and construction of hydro-agricultural infrastructure, (vii)
management of irrigation networks, (viii) promotion and conservation of surface and ground water
resources for irrigation in drier areas, (ix) establishment of interventions to prevent spread of diseases
associated with irrigation, (x) protection of perimeter irrigated areas against flooding, and (xi) promotion
of low-cost irrigation systems.
i) Main Achievements/Results:
Regarding the expansion of irrigated area, from 2013 to 2016 INIR rehabilitated 21 irrigation systems and
increased the number of irrigated land from 13.8 thousand ha in 2013 to 20.9 thousand ha in 2016, an
increase of 50.7%. Despite this increase, there is still a significant shortfall towards achieving the PNISA
targets (the actual 20.9 thousand ha in 2016 vs the PNISA target of 50.0 thousand ha by 2017). The
indicator on strengthening institutional irrigation capacity from the current 60% to 80% was not assessed
due to the lack of data. There is no evidence for the accomplishment of the majority of the proposed
actions. For example, the INIR institutional set up is still not well represented since INIR is only
established at national levels and it lacks financial and human resources as well as infrastructures in order
to be established at provincial and district levels. At central levels, INIR is still facing shortage of human
resources and therefore does not have directors for technical areas. However, during the studied period,
INIR produced some rules and regulations for the construction, operation and maintenance of irrigation
networks such as the norms for irrigators and national irrigation program.
ii) Key Gaps/Challenges:
The first gap under this program is the lack of the establishment of the indicators and the respective
targets for the majority of its objectives, which make it difficult to assess the PNISA performance under
this program. The second challenge is the significant under-funding, which constrained the
implementations of the envisioned activities. Specifically, under this program, almost no funds were
disbursed to implement its activities as the gap between budgeted and disbursed funds is over 90% in all
years (Figure 19).
34
9693
95
99
0
20
40
60
80
100
Fin
ancia
l g
ap
(%
)
2013 2014 2015 2016
Figure 19 Gap between proposed and actual financing for the irrigation program
(iii) Priority Recommendations:
a) (CR) MASA to formulate realistic action plan (including realistic target) for closing the gap
between the target value of area under irrigation and the actual value ensuring the required
funding. This will require MASA to make realistic assumption on the role of private sector in the
development of irrigation systems;
b) (CR) MASA to re-assess the unit costs of irrigation works, with the aim of developing
efficiency-based unit costs, low-cost irrigation investment options, which together can increase
the number of direct beneficiaries.
3.3.8 Agricultural Mechanization Program
(i) Objectives and Targets
The objectives of the agricultural mechanization program are to: (a) promote and consolidate institutional
coordination between the stakeholders in the agricultural mechanization chain; (b) ensure that the
productive sector has properly trained and qualified operators and technicians; (c) promote the grouping
of agricultural production units around support infrastructure based on the ongoing agro-ecological
zoning process; (d) allow agricultural producers to have access to more profitable markets, information
and the skills to negotiate in order to ensure the return on invested capital. PNISA did not estipulate the
indicators and the respective targets for achieving the objectives of this program. One key suggested
indicator for this program is the increase in the area of the prepared land using machinery from the service
centers.
(ii) Main Achievements/Results
The agricultural mechanization program is implemented through the established network of service
centers. As of July 2017, there were established 134 agricultural service centers being 90 established by
MASA and 44 established by the Zambezi Vale Development Agency. Among these service centers, 107
are managed by the private sector and 27 by the government. These service centers were equipped with
584 tractors with the respective agricultural implements among which 513 were provided by MASA and
35
71 by the Zambezi Vale Development Agency. The targets in terms of the creation of service centers as
well as provision of tractors with their respective implements were not defined under PNISA, which
makes it difficult to assess the PNISA performance under this component.
Regarding the second objective (ensure that the productive sector has properly trained and qualified
operators and technicians), 542 machinery operators, 58 managers, 64 extension agents and 4 mechanics
were trained in Mozambique. However, it is not possible to assess the level of accomplishment related to
human resource training since PNISA did not establish the respective targets.
For the increase in the area of land prepared using the established service centers, the amount of land
prepared using equipment of these service centers is not consistently recorded. As of July 2017, the
Agricultural Development Fund (FDA) under MASA reports that the service centers prepared about 50.4
thousand hectares of land. The lack of targets using mechanization limits the assessment of this indicator.
(iii) Key Gaps/Challenges:
The first challenge in this program is the weak adherence of the beneficiaries to the services provided by
the service centers. This is because the beneficiaries do not have purchasing power for paying the charged
tariff for land preparation stipulated by the service centers. The tariff for land preparation was estimated
by FDA to be 4,034.67 MT/ha, which seems to be high for smallholder producer. According to FDA, out
of this amount, 44% correspond to the cost of fuel. The associated cost related to the services provided
by the service centers coupled with the fact that the producers are disperse make the service centers to be
not used at their fully capacity. Interviewed stakeholders reported that these centers are used at 10-15% of
its potential capacity.
Furthermore, the existing human resources do not know how to operate the provided equipment and
mainly seeders and auto-combiners and this fact yield the under utilization of some of the provided
equipment. Finally, some service centers were established in the areas without complementary services
such as gas station and sources of mechanical services and equipment and other centers are managed by
individuals who are not in the agricultural business. These constraints limit the effective use of the centers
for agricultural purposes. The lack of funds also limits the implementation of this program. Specifically,
under this program, almost no funds were disbursed to implement its activities as the gap between
budgeted and disbursed funds is over 90% in all years (Figure 20).
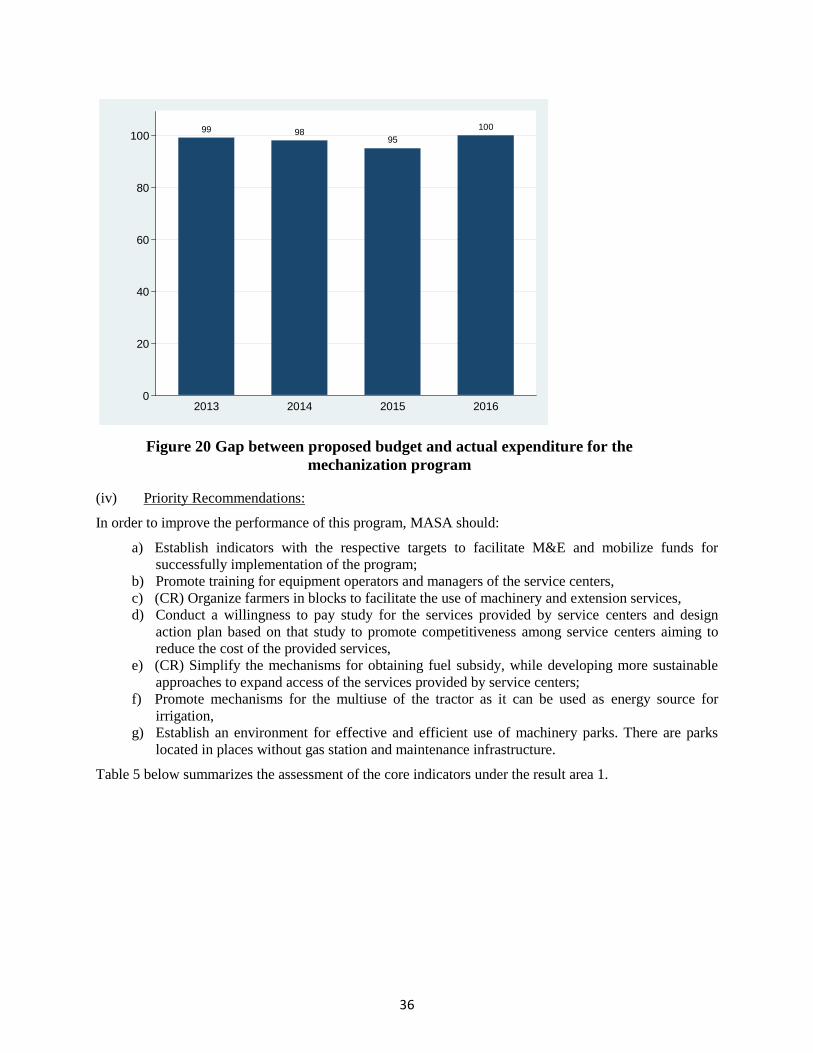
36
99 9895
100
0
20
40
60
80
100
Fin
ancia
l g
ap
(%
)
2013 2014 2015 2016
Figure 20 Gap between proposed budget and actual expenditure for the
mechanization program
(iv) Priority Recommendations:
In order to improve the performance of this program, MASA should:
a) Establish indicators with the respective targets to facilitate M&E and mobilize funds for
successfully implementation of the program;
b) Promote training for equipment operators and managers of the service centers,
c) (CR) Organize farmers in blocks to facilitate the use of machinery and extension services,
d) Conduct a willingness to pay study for the services provided by service centers and design
action plan based on that study to promote competitiveness among service centers aiming to
reduce the cost of the provided services,
e) (CR) Simplify the mechanisms for obtaining fuel subsidy, while developing more sustainable
approaches to expand access of the services provided by service centers;
f) Promote mechanisms for the multiuse of the tractor as it can be used as energy source for
irrigation,
g) Establish an environment for effective and efficient use of machinery parks. There are parks
located in places without gas station and maintenance infrastructure.
Table 5 below summarizes the assessment of the core indicators under the result area 1.
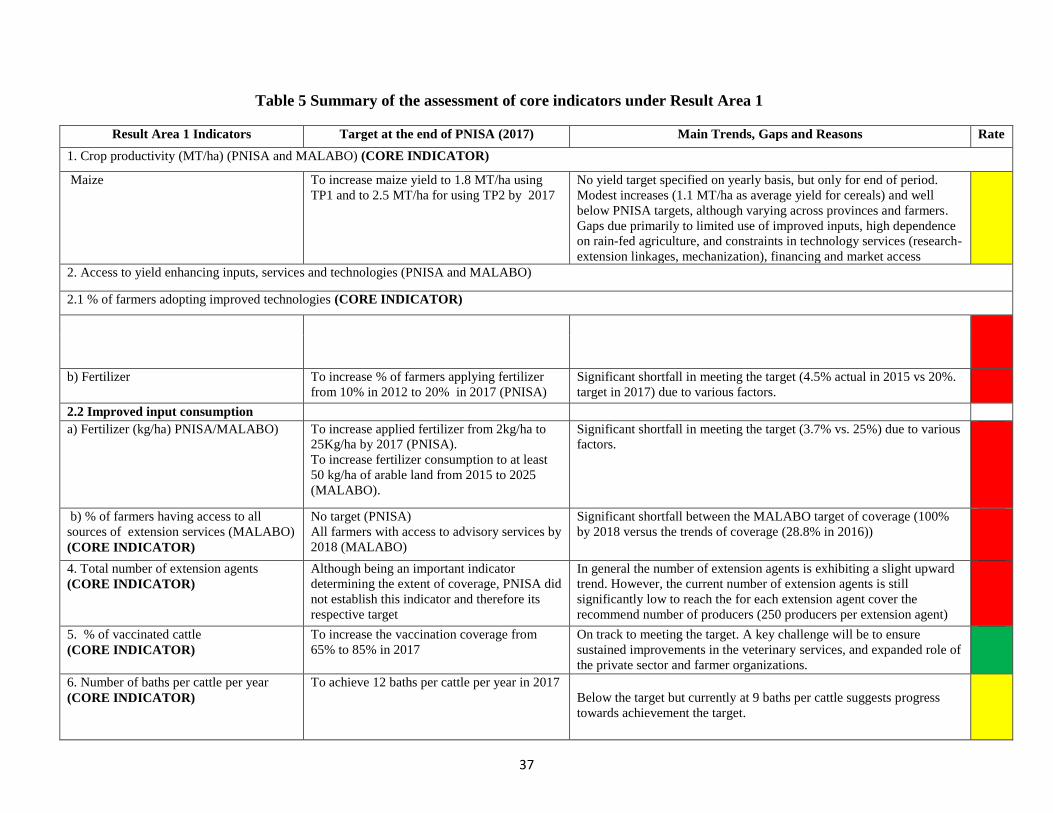
37
Table 5 Summary of the assessment of core indicators under Result Area 1
Result Area 1 Indicators Target at the end of PNISA (2017) Main Trends, Gaps and Reasons Rate
1. Crop productivity (MT/ha) (PNISA and MALABO) (CORE INDICATOR)
Maize To increase maize yield to 1.8 MT/ha using
TP1 and to 2.5 MT/ha for using TP2 by 2017
No yield target specified on yearly basis, but only for end of period.
Modest increases (1.1 MT/ha as average yield for cereals) and well
below PNISA targets, although varying across provinces and farmers.
Gaps due primarily to limited use of improved inputs, high dependence
on rain-fed agriculture, and constraints in technology services (research-
extension linkages, mechanization), financing and market access
2. Access to yield enhancing inputs, services and technologies (PNISA and MALABO)
2.1 % of farmers adopting improved technologies (CORE INDICATOR)
b) Fertilizer To increase % of farmers applying fertilizer
from 10% in 2012 to 20% in 2017 (PNISA)
Significant shortfall in meeting the target (4.5% actual in 2015 vs 20%.
target in 2017) due to various factors.
2.2 Improved input consumption
a) Fertilizer (kg/ha) PNISA/MALABO) To increase applied fertilizer from 2kg/ha to
25Kg/ha by 2017 (PNISA).
To increase fertilizer consumption to at least
50 kg/ha of arable land from 2015 to 2025
(MALABO).
Significant shortfall in meeting the target (3.7% vs. 25%) due to various
factors.
b) % of farmers having access to all
sources of extension services (MALABO)
(CORE INDICATOR)
No target (PNISA)
All farmers with access to advisory services by
2018 (MALABO)
Significant shortfall between the MALABO target of coverage (100%
by 2018 versus the trends of coverage (28.8% in 2016))
4. Total number of extension agents
(CORE INDICATOR)
Although being an important indicator
determining the extent of coverage, PNISA did
not establish this indicator and therefore its
respective target
In general the number of extension agents is exhibiting a slight upward
trend. However, the current number of extension agents is still
significantly low to reach the for each extension agent cover the
recommend number of producers (250 producers per extension agent)
5. % of vaccinated cattle
(CORE INDICATOR)
To increase the vaccination coverage from
65% to 85% in 2017
On track to meeting the target. A key challenge will be to ensure
sustained improvements in the veterinary services, and expanded role of
the private sector and farmer organizations.
6. Number of baths per cattle per year
(CORE INDICATOR)
To achieve 12 baths per cattle per year in 2017
Below the target but currently at 9 baths per cattle suggests progress
towards achievement the target.

38
7. Livestock indicators
a) Animal weight (Cattle) To increase the weight of the carcass from
140kg to 160kg in 2017 (PNISA)
From 2013-2016, Average weight per animal was 146Kg (2013-2016),
which is lower than the target. Limited use of improved breeds coupled
with use of traditional feeding methods (grass fed cattle) contributes
negatively to the increase of the weight per animal.
b) Chicken (million) Establish 6 plants for processing and storing
chicken with capacity of 30,000 chicks
(PNISA)
Except one chicken processing plant was constructed in 2015 and
therefore the PNISA target (construct 6 plants for reaching capacity of
slaughtering 30,000 chicks) was not achieved.
8. Volume of fish catch
(CORE INDICATOR)
Production target of 30,000MT of aquaculture
fish and no target for off-shore fish production
(PNISA).
The available data show an upward trend for the aquaculture and off-
shore fish production. However, the stipulated target for aquaculture
fish production was over stated and it was not attained through PNISA.
9. Irrigated area (PNISA and MALABO) (CORE INDICATOR)
Cumulative (thousand ha) To have 50,000 ha under irrigation by 2017
(PNISA).
An increase by 100% by 2025 considering
2000 as the base year (MALABO).
There is a significant shortfall in meeting this target (20,000 ha. in 2016
vs. 50,000 has. by 2017), due primarily to shortfall in provision of
financing, and also related due to delays arising from procurement
processes and implementation capacities.
10. Agricultural research
No. of New/Improved Varieties
Disseminated
(CORE INDICATOR)
To release 20 crop varieties (4 with high
nutritional potential), 2 chicken breeds with
high productivity and tolerance to adverse
weather condition, and 12 animal breeds ( 8
for cattle, 2 chicken and 2 goat breeds adapted
to different agro-ecological conditions)
(PNISA)
Target met: IIAM released 35 varieties. Target reached: IIAM released
35 crop varieties, 12 animal breeds (8 for cattle, 2 chicken and 2 goat
breeds).
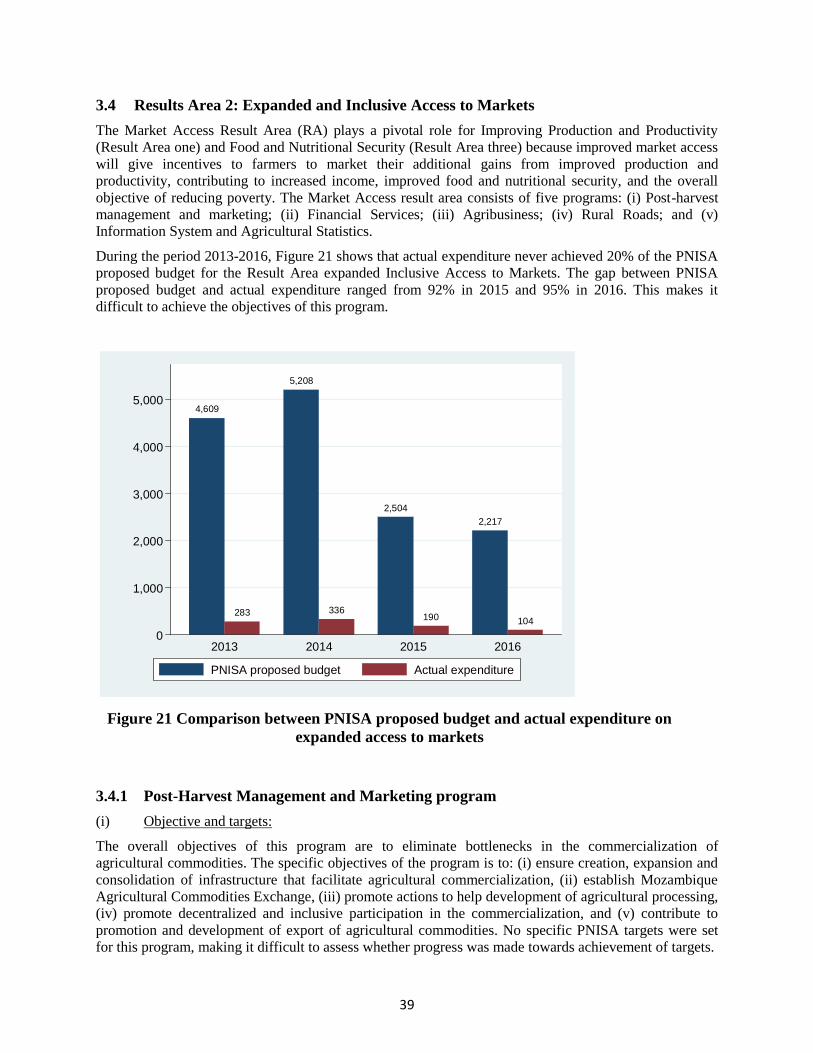
39
3.4 Results Area 2: Expanded and Inclusive Access to Markets
The Market Access Result Area (RA) plays a pivotal role for Improving Production and Productivity
(Result Area one) and Food and Nutritional Security (Result Area three) because improved market access
will give incentives to farmers to market their additional gains from improved production and
productivity, contributing to increased income, improved food and nutritional security, and the overall
objective of reducing poverty. The Market Access result area consists of five programs: (i) Post-harvest
management and marketing; (ii) Financial Services; (iii) Agribusiness; (iv) Rural Roads; and (v)
Information System and Agricultural Statistics.
During the period 2013-2016, Figure 21 shows that actual expenditure never achieved 20% of the PNISA
proposed budget for the Result Area expanded Inclusive Access to Markets. The gap between PNISA
proposed budget and actual expenditure ranged from 92% in 2015 and 95% in 2016. This makes it
difficult to achieve the objectives of this program.
4,609
283
5,208
336
2,504
190
2,217
104
0
1,000
2,000
3,000
4,000
5,000
Am
ou
nt ('0
00
'00
0 M
ZN
)
2013 2014 2015 2016
PNISA proposed budget Actual expenditure
Figure 21 Comparison between PNISA proposed budget and actual expenditure on
expanded access to markets
3.4.1 Post-Harvest Management and Marketing program
(i) Objective and targets:
The overall objectives of this program are to eliminate bottlenecks in the commercialization of
agricultural commodities. The specific objectives of the program is to: (i) ensure creation, expansion and
consolidation of infrastructure that facilitate agricultural commercialization, (ii) establish Mozambique
Agricultural Commodities Exchange, (iii) promote actions to help development of agricultural processing,
(iv) promote decentralized and inclusive participation in the commercialization, and (v) contribute to
promotion and development of export of agricultural commodities. No specific PNISA targets were set
for this program, making it difficult to assess whether progress was made towards achievement of targets.
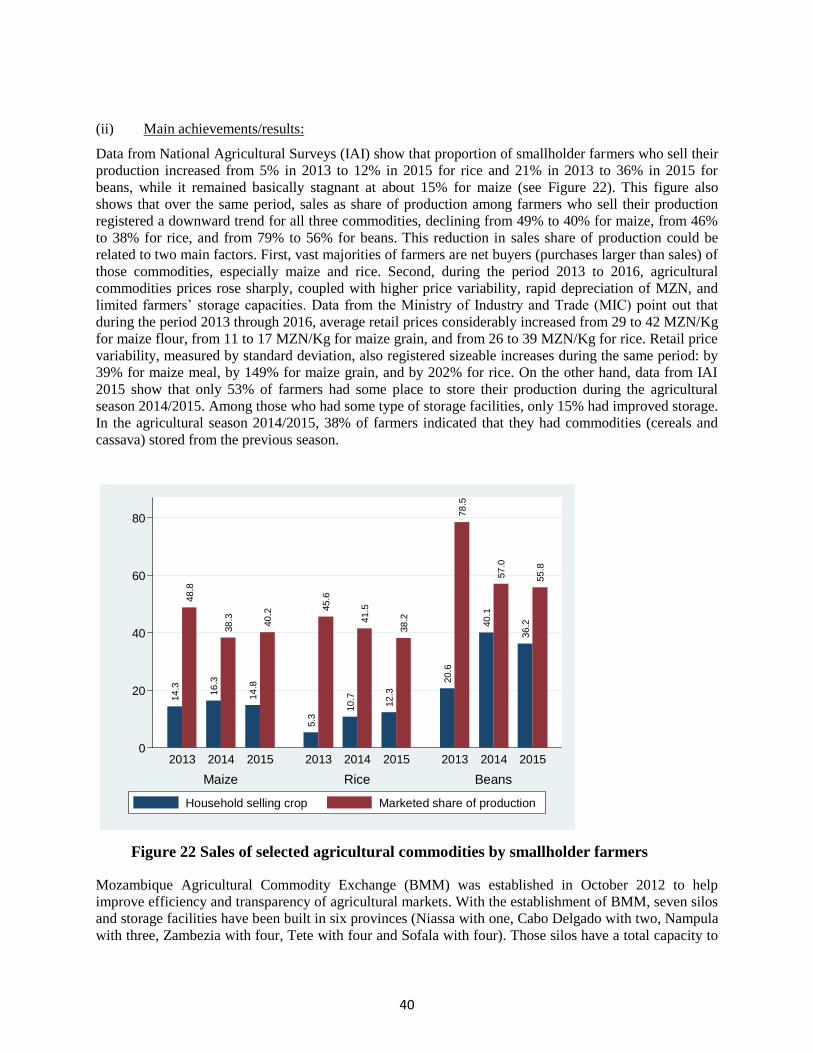
40
(ii) Main achievements/results:
Data from National Agricultural Surveys (IAI) show that proportion of smallholder farmers who sell their
production increased from 5% in 2013 to 12% in 2015 for rice and 21% in 2013 to 36% in 2015 for
beans, while it remained basically stagnant at about 15% for maize (see Figure 22). This figure also
shows that over the same period, sales as share of production among farmers who sell their production
registered a downward trend for all three commodities, declining from 49% to 40% for maize, from 46%
to 38% for rice, and from 79% to 56% for beans. This reduction in sales share of production could be
related to two main factors. First, vast majorities of farmers are net buyers (purchases larger than sales) of
those commodities, especially maize and rice. Second, during the period 2013 to 2016, agricultural
commodities prices rose sharply, coupled with higher price variability, rapid depreciation of MZN, and
limited farmers’ storage capacities. Data from the Ministry of Industry and Trade (MIC) point out that
during the period 2013 through 2016, average retail prices considerably increased from 29 to 42 MZN/Kg
for maize flour, from 11 to 17 MZN/Kg for maize grain, and from 26 to 39 MZN/Kg for rice. Retail price
variability, measured by standard deviation, also registered sizeable increases during the same period: by
39% for maize meal, by 149% for maize grain, and by 202% for rice. On the other hand, data from IAI
2015 show that only 53% of farmers had some place to store their production during the agricultural
season 2014/2015. Among those who had some type of storage facilities, only 15% had improved storage.
In the agricultural season 2014/2015, 38% of farmers indicated that they had commodities (cereals and
cassava) stored from the previous season.
14
.3
48
.8
16
.3
38
.3
14
.8
40
.2
5.3
45
.6
10
.7
41
.5
12
.3
38
.2
20
.6
78
.5
40
.1
57
.0
36
.2
55
.8
0
20
40
60
80
Perc
enta
ge
Maize Rice Beans
2013 2014 2015 2013 2014 2015 2013 2014 2015
Household selling crop Marketed share of production
Figure 22 Sales of selected agricultural commodities by smallholder farmers
Mozambique Agricultural Commodity Exchange (BMM) was established in October 2012 to help
improve efficiency and transparency of agricultural markets. With the establishment of BMM, seven silos
and storage facilities have been built in six provinces (Niassa with one, Cabo Delgado with two, Nampula
with three, Zambezia with four, Tete with four and Sofala with four). Those silos have a total capacity to
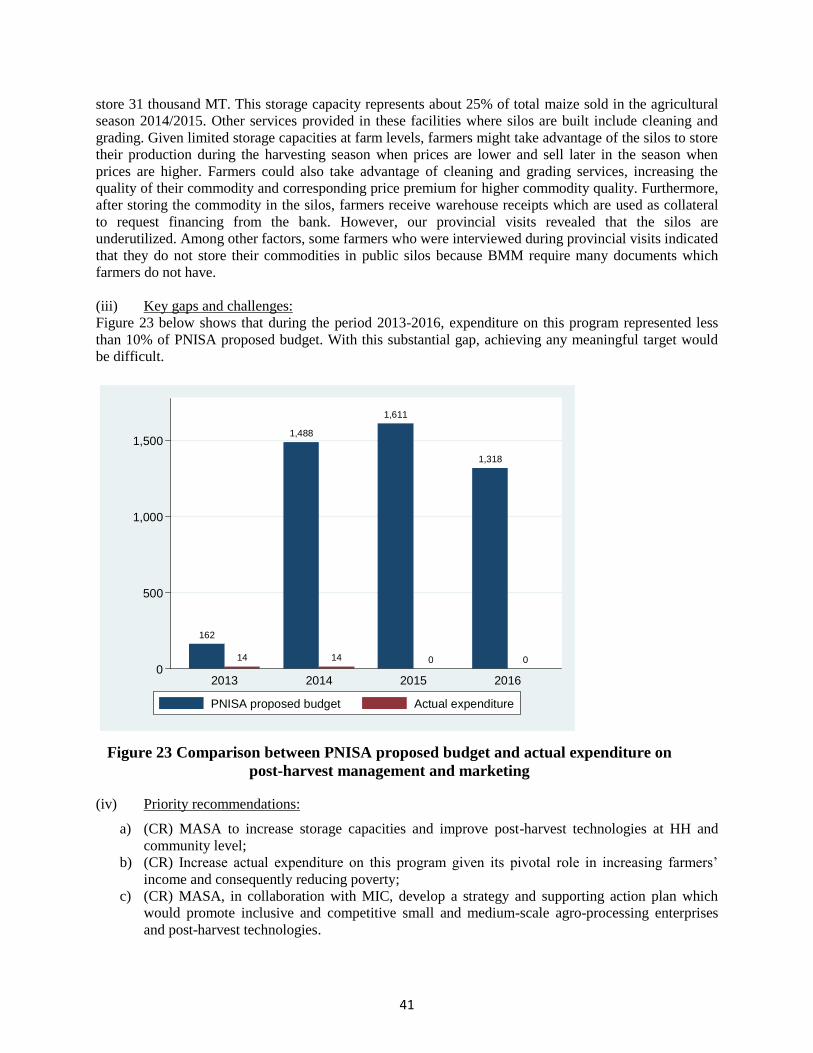
41
store 31 thousand MT. This storage capacity represents about 25% of total maize sold in the agricultural
season 2014/2015. Other services provided in these facilities where silos are built include cleaning and
grading. Given limited storage capacities at farm levels, farmers might take advantage of the silos to store
their production during the harvesting season when prices are lower and sell later in the season when
prices are higher. Farmers could also take advantage of cleaning and grading services, increasing the
quality of their commodity and corresponding price premium for higher commodity quality. Furthermore,
after storing the commodity in the silos, farmers receive warehouse receipts which are used as collateral
to request financing from the bank. However, our provincial visits revealed that the silos are
underutilized. Among other factors, some farmers who were interviewed during provincial visits indicated
that they do not store their commodities in public silos because BMM require many documents which
farmers do not have.
(iii) Key gaps and challenges:
Figure 23 below shows that during the period 2013-2016, expenditure on this program represented less
than 10% of PNISA proposed budget. With this substantial gap, achieving any meaningful target would
be difficult.
162
14
1,488
14
1,611
0
1,318
00
500
1,000
1,500
Am
ou
nt ('0
00
'00
0 M
ZN
)
2013 2014 2015 2016
PNISA proposed budget Actual expenditure
Figure 23 Comparison between PNISA proposed budget and actual expenditure on
post-harvest management and marketing
(iv) Priority recommendations:
a) (CR) MASA to increase storage capacities and improve post-harvest technologies at HH and
community level;
b) (CR) Increase actual expenditure on this program given its pivotal role in increasing farmers’
income and consequently reducing poverty;
c) (CR) MASA, in collaboration with MIC, develop a strategy and supporting action plan which
would promote inclusive and competitive small and medium-scale agro-processing enterprises
and post-harvest technologies.
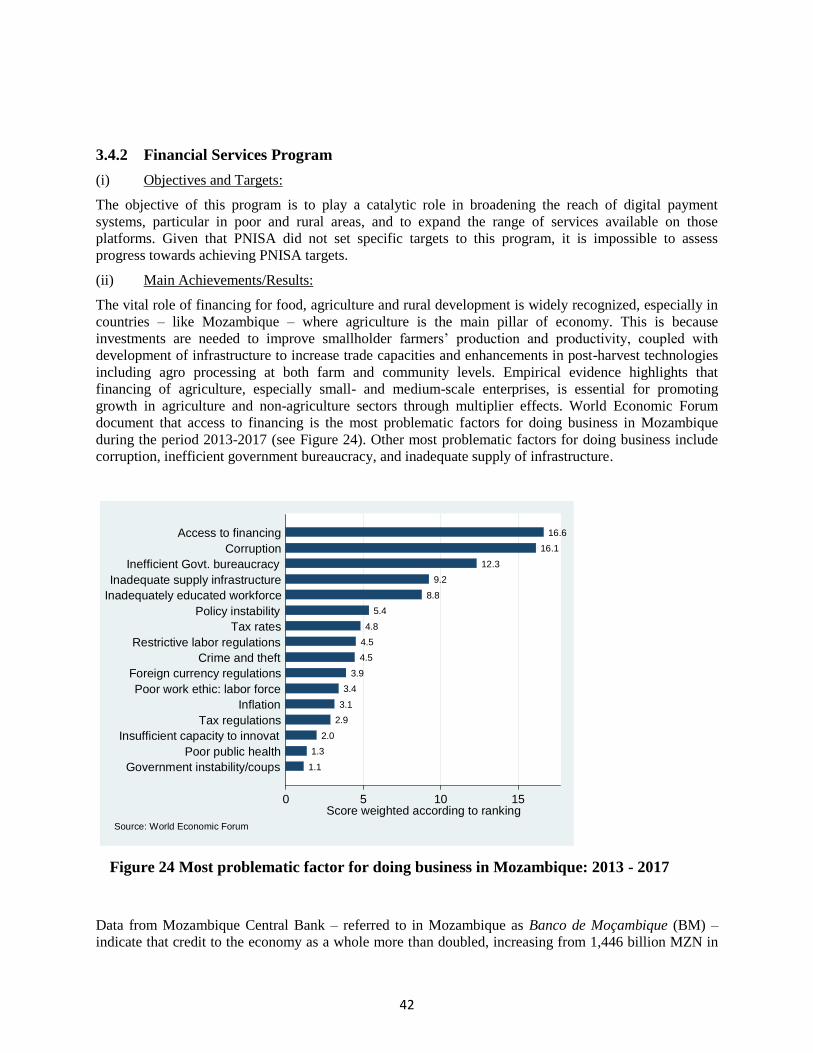
42
3.4.2 Financial Services Program
(i) Objectives and Targets:
The objective of this program is to play a catalytic role in broadening the reach of digital payment
systems, particular in poor and rural areas, and to expand the range of services available on those
platforms. Given that PNISA did not set specific targets to this program, it is impossible to assess
progress towards achieving PNISA targets.
(ii) Main Achievements/Results:
The vital role of financing for food, agriculture and rural development is widely recognized, especially in
countries – like Mozambique – where agriculture is the main pillar of economy. This is because
investments are needed to improve smallholder farmers’ production and productivity, coupled with
development of infrastructure to increase trade capacities and enhancements in post-harvest technologies
including agro processing at both farm and community levels. Empirical evidence highlights that
financing of agriculture, especially small- and medium-scale enterprises, is essential for promoting
growth in agriculture and non-agriculture sectors through multiplier effects. World Economic Forum
document that access to financing is the most problematic factors for doing business in Mozambique
during the period 2013-2017 (see Figure 24). Other most problematic factors for doing business include
corruption, inefficient government bureaucracy, and inadequate supply of infrastructure.
1.1
1.3
2.0
2.9
3.1
3.4
3.9
4.5
4.5
4.8
5.4
8.8
9.2
12.3
16.1
16.6
0 5 10 15Score weighted according to ranking
Government instability/coups
Poor public health
Insufficient capacity to innovat
Tax regulations
Inflation
Poor work ethic: labor force
Foreign currency regulations
Crime and theft
Restrictive labor regulations
Tax rates
Policy instability
Inadequately educated workforce
Inadequate supply infrastructure
Inefficient Govt. bureaucracy
Corruption
Access to financing
Source: World Economic Forum
Figure 24 Most problematic factor for doing business in Mozambique: 2013 - 2017
Data from Mozambique Central Bank – referred to in Mozambique as Banco de Moçambique (BM) –
indicate that credit to the economy as a whole more than doubled, increasing from 1,446 billion MZN in
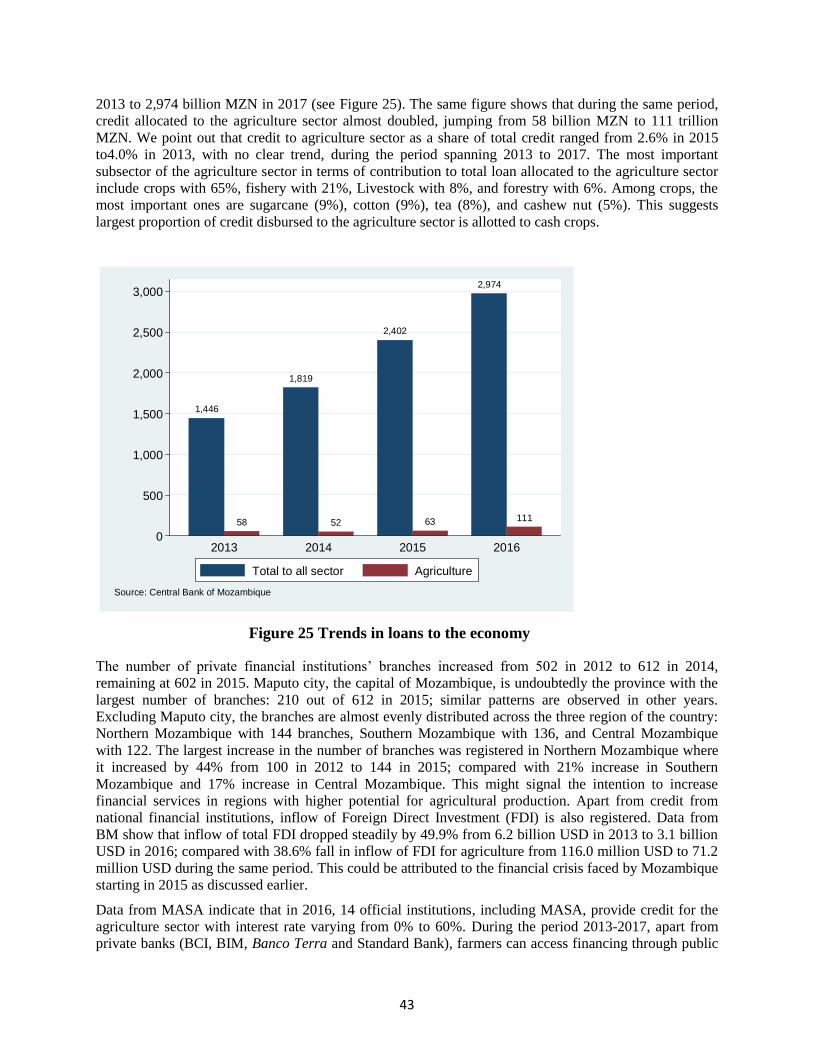
43
2013 to 2,974 billion MZN in 2017 (see Figure 25). The same figure shows that during the same period,
credit allocated to the agriculture sector almost doubled, jumping from 58 billion MZN to 111 trillion
MZN. We point out that credit to agriculture sector as a share of total credit ranged from 2.6% in 2015
to4.0% in 2013, with no clear trend, during the period spanning 2013 to 2017. The most important
subsector of the agriculture sector in terms of contribution to total loan allocated to the agriculture sector
include crops with 65%, fishery with 21%, Livestock with 8%, and forestry with 6%. Among crops, the
most important ones are sugarcane (9%), cotton (9%), tea (8%), and cashew nut (5%). This suggests
largest proportion of credit disbursed to the agriculture sector is allotted to cash crops.
1,446
58
1,819
52
2,402
63
2,974
111
0
500
1,000
1,500
2,000
2,500
3,000
Cre
dit (
bill
ion M
ZN
)
2013 2014 2015 2016
Source: Central Bank of Mozambique
Total to all sector Agriculture
Figure 25 Trends in loans to the economy
The number of private financial institutions’ branches increased from 502 in 2012 to 612 in 2014,
remaining at 602 in 2015. Maputo city, the capital of Mozambique, is undoubtedly the province with the
largest number of branches: 210 out of 612 in 2015; similar patterns are observed in other years.
Excluding Maputo city, the branches are almost evenly distributed across the three region of the country:
Northern Mozambique with 144 branches, Southern Mozambique with 136, and Central Mozambique
with 122. The largest increase in the number of branches was registered in Northern Mozambique where
it increased by 44% from 100 in 2012 to 144 in 2015; compared with 21% increase in Southern
Mozambique and 17% increase in Central Mozambique. This might signal the intention to increase
financial services in regions with higher potential for agricultural production. Apart from credit from
national financial institutions, inflow of Foreign Direct Investment (FDI) is also registered. Data from
BM show that inflow of total FDI dropped steadily by 49.9% from 6.2 billion USD in 2013 to 3.1 billion
USD in 2016; compared with 38.6% fall in inflow of FDI for agriculture from 116.0 million USD to 71.2
million USD during the same period. This could be attributed to the financial crisis faced by Mozambique
starting in 2015 as discussed earlier.
Data from MASA indicate that in 2016, 14 official institutions, including MASA, provide credit for the
agriculture sector with interest rate varying from 0% to 60%. During the period 2013-2017, apart from
private banks (BCI, BIM, Banco Terra and Standard Bank), farmers can access financing through public
44
and private institutions and nongovernment organizations (NGOs) such as, but not limited to, Agricultural
Development Fund (FDA), District Development Funds (FDD), Agriculture Promotion Centre
(CEPAGRI), Cabinet for Promotion of Investment (GAPI), Investment Promotion Centre (CPI), Institute
for Promotion of Small and Medium-scale Enterprises (IPEME), Africa Management Services Company
(AMSCO), Caixa Comunitária de Microfinanças (CCOM), Support to Private Sector Initiatives in the
Agriculture Sector (ADIPSA), and Enterprise Fund for Portuguese Cooperation (FECOP). 9 Some
promising examples include:
Pro-Poor Value Chain Development Project in the Maputo and Gaza corridors (PROSUL),
coordinated by CEPAGRI and targeting 20 thousand households, promotes access to timely and
adequately financial services in 19 districts in Southern Mozambique (Maputo province with six
districts; Gaza province with eight and Inhambane province with five).10 About 33% of the total
PROSUL’s budget estimated at 44.95 million USD for the period 2013-2019 was allocated to
provision of financial services. Another initiative promoted by PROSUL includes development of
four value chains which structured in five programs with 14.5 million USD for financial services
component;
Rural Market Promotion Program (PROMER), coordinated by the Ministry of Economy and
Finance (MEF), aims at improving livelihoods of smallholder farmers located in Northern
Mozambique focusing on the Nacala corridor. It targeted to benefit 20 thousand households and
to cover 15 districts (Niassa province with six districts, Cabo Delgado with five, Nampula with
two, and Zambezia with two).11 Under the component of market environment, PROMER aims at
providing technical assistance to improve bankability of value chain participants, providing
training to farmers associations and trades about rural financing, supplying short-term
institutional support to financial institutions development, and promoting expansion of financial
services in PROMER target districts. PROMER is also promoting value chain development
through matching grants;
FDA in partnership with two private banks (BCI and BIM) established two revolving credit lines
with bona fide interest rate of 10% per year: One for the fresh vegetables sector with funds of
28.0 million MZN covering three provinces (Maputo, Inhambane and Gaza) and the other for the
poultry sectors with funds of 49.5 million MZN covering Maputo province and Maputo City;
Despite the above described some progress in terms of coverage of financial institutions (amount loaned
and number of branches), access to financing in Mozambique is limited. Proportion of farmers who have
9Government of Mozambique closed CEPAGRI in 2016 and transferred its mandate to FDA.
10PROSUL promotes development of three value chains and consists of five components, namely horticulture,
cassava, red meat, financial services, and institutional support. PROSUL covers 19 districts: Moamba, Marracuene,
Namaacha, Boane, Manhica and Magude in Maputo province; Xai-Xai, Manjacaze, Chokwe, Guija, Chibuto,
Chicualacuala, Massingir and Mabalane in Gaza province; and Zavala, Inhambane, Jangamo, Morrumbene and
Massinga in Inhambane province. PROSUL is funded by four main institutions: Government of Mozambique,
International Fund for Agriculture Development (IFAD), Spanish Food Security Co-financing Facility Trust Fund,
and Adaptation for Smallholder Agriculture Program.
11PROMER with total estimated budget of 40.6 million USD for the period 2009 through 2020 comprises five
components, namely Support to input and output traders, enterprise-led value chain initiatives, improving the market
environment, nutrition promotion, and institutional support. Districts covered by PROMER include Cuamba,
Mandimba, Marrupa, Maua, Mecanhelas and Metarica in Niassa province; Ancuabe, Balama, Chiure, Montepuez,
and Namuno in Cabo Delgado province; Malema and Ribaue in Nampula province; and Alto Molocue and Gurue in
Zambezia province. PROMER with life span from 2009 through 2020 is co-financed by four main institutions:
Government of Mozambique, International Fund for Agriculture Development (IFAD), the Alliance for Green
Revolution in Africa (AGRA), and European Union.
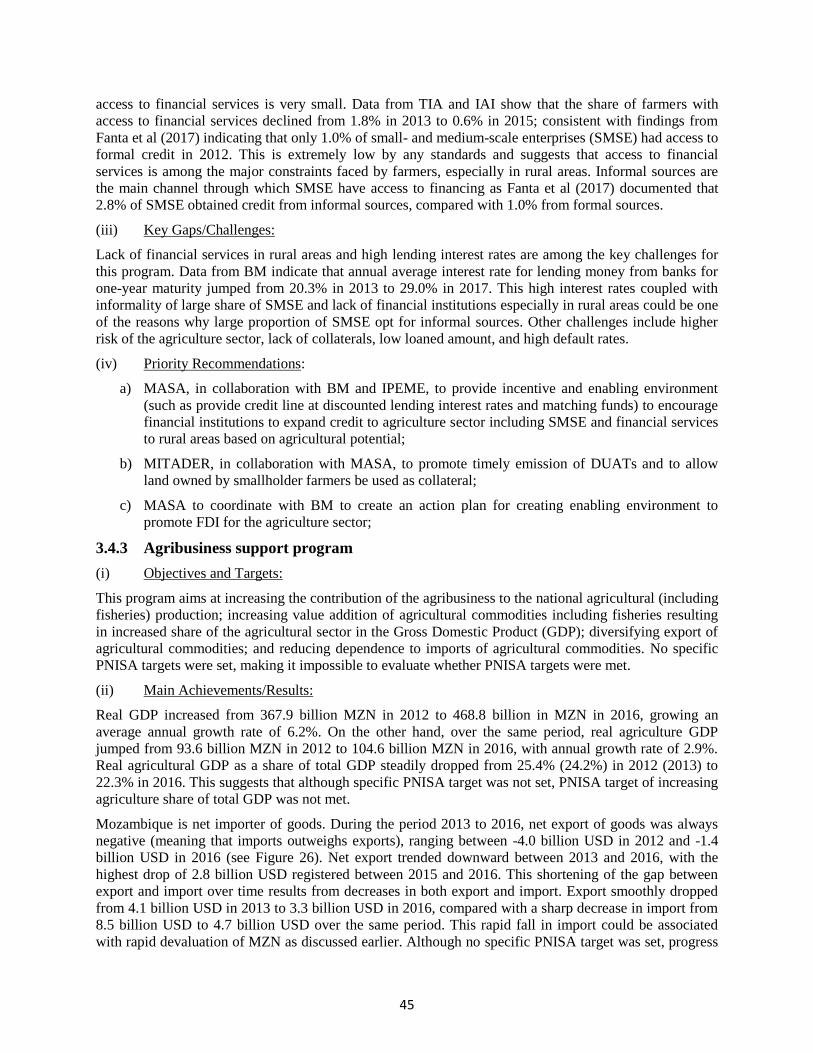
45
access to financial services is very small. Data from TIA and IAI show that the share of farmers with
access to financial services declined from 1.8% in 2013 to 0.6% in 2015; consistent with findings from
Fanta et al (2017) indicating that only 1.0% of small- and medium-scale enterprises (SMSE) had access to
formal credit in 2012. This is extremely low by any standards and suggests that access to financial
services is among the major constraints faced by farmers, especially in rural areas. Informal sources are
the main channel through which SMSE have access to financing as Fanta et al (2017) documented that
2.8% of SMSE obtained credit from informal sources, compared with 1.0% from formal sources.
(iii) Key Gaps/Challenges:
Lack of financial services in rural areas and high lending interest rates are among the key challenges for
this program. Data from BM indicate that annual average interest rate for lending money from banks for
one-year maturity jumped from 20.3% in 2013 to 29.0% in 2017. This high interest rates coupled with
informality of large share of SMSE and lack of financial institutions especially in rural areas could be one
of the reasons why large proportion of SMSE opt for informal sources. Other challenges include higher
risk of the agriculture sector, lack of collaterals, low loaned amount, and high default rates.
(iv) Priority Recommendations:
a) MASA, in collaboration with BM and IPEME, to provide incentive and enabling environment
(such as provide credit line at discounted lending interest rates and matching funds) to encourage
financial institutions to expand credit to agriculture sector including SMSE and financial services
to rural areas based on agricultural potential;
b) MITADER, in collaboration with MASA, to promote timely emission of DUATs and to allow
land owned by smallholder farmers be used as collateral;
c) MASA to coordinate with BM to create an action plan for creating enabling environment to
promote FDI for the agriculture sector;
3.4.3 Agribusiness support program
(i) Objectives and Targets:
This program aims at increasing the contribution of the agribusiness to the national agricultural (including
fisheries) production; increasing value addition of agricultural commodities including fisheries resulting
in increased share of the agricultural sector in the Gross Domestic Product (GDP); diversifying export of
agricultural commodities; and reducing dependence to imports of agricultural commodities. No specific
PNISA targets were set, making it impossible to evaluate whether PNISA targets were met.
(ii) Main Achievements/Results:
Real GDP increased from 367.9 billion MZN in 2012 to 468.8 billion in MZN in 2016, growing an
average annual growth rate of 6.2%. On the other hand, over the same period, real agriculture GDP
jumped from 93.6 billion MZN in 2012 to 104.6 billion MZN in 2016, with annual growth rate of 2.9%.
Real agricultural GDP as a share of total GDP steadily dropped from 25.4% (24.2%) in 2012 (2013) to
22.3% in 2016. This suggests that although specific PNISA target was not set, PNISA target of increasing
agriculture share of total GDP was not met.
Mozambique is net importer of goods. During the period 2013 to 2016, net export of goods was always
negative (meaning that imports outweighs exports), ranging between -4.0 billion USD in 2012 and -1.4
billion USD in 2016 (see Figure 26). Net export trended downward between 2013 and 2016, with the
highest drop of 2.8 billion USD registered between 2015 and 2016. This shortening of the gap between
export and import over time results from decreases in both export and import. Export smoothly dropped
from 4.1 billion USD in 2013 to 3.3 billion USD in 2016, compared with a sharp decrease in import from
8.5 billion USD to 4.7 billion USD over the same period. This rapid fall in import could be associated
with rapid devaluation of MZN as discussed earlier. Although no specific PNISA target was set, progress
46
was made towards reducing the gap between export and import. Agriculture with 13.2% ranks third in
terms of average contribution to total export; after extractive industry with 33.1% and processing industry
with 28.4%. One of the PNISA objectives for this program was to diversify export of agricultural
commodities. We computed Herfindahl-Hirschman Index (HHI) to get an indication of concentration of
export of agricultural commodities. Monthly average HHI steadily increased from 34.2% in 2013 to
46.4% in 2015; and it then dropped to 43.4% in 2016; with an average of 41.1% over the period 2013 to
2016. This indicates high concentration of export of agricultural commodities. Looking at individual
commodities, we point out that four commodities account for 80.3% of total export of agricultural
commodities during the period 2013 through 2016: tobacco with 43.5%, sugar with 18.8%, cotton with
11.0%, and banana with 7.0%. With similar patterns across years. This suggests that no progress was
made towards achieving PNISA target although no specific PNISA target was set.
-10.0
-8.0
-6.0
-4.0
-2.0
0.0
2.0
4.0
6.0
Valu
e (
bill
ion
US
D
2012 2013 2014 2015 2016
Year
Export Import Net export
Source: Mozambique Central Bank
Figure 26: Net export of goods during the period 2012 through 2016
Some initiatives to development and strengthen some value chains have been put forth by MASA and
other institutions. Promising examples, but in its incipient stages, include:
Starting in 2016, MASA is drafting its National Youth in Agriculture Incubation Program
(NYAIP). This program aims to increase incomes through youth’s skills development and access
to resources (land, agricultural inputs, finance, equipment, etc.) coupled with promotion of small
and medium enterprises (SME) for youth;
PROSUL covering 19 districts in the Maputo and Gaza corridors promotes three value chains:
horticulture, cassava and red meat in 19 districts;
PROMER covering 15 districts in the Nacala corridor promotes four value chains: cassava,
sesame, beans and groundnuts;
47
MASA provided funding to build 29 greenhouses for fresh vegetables growers in seven
provinces: 14 greenhouses in Maputo, four in Gaza, two in Tete, two in Manica, three in
Zambezia, two in Nampula, and two in Cabo Delgado;
MASA financed construction of cold storage with capacity of 40 MT for Center for Value
Addition of Agricultural Commodities (CAVA) in Maputo province;
MASA provided favorable recommendation for nine agricultural enterprises which submitted
applications to MEF to benefit from bona fide diesel prices in 2016: All nine enterprises were
granted the bona fide diesel prices. It appears that few agricultural enterprises are aware of the
existence of the bona fide prices for diesel and electricity. In 2016, MASA in collaboration with
MEF organized one workshop, in which 32 agricultural enterprises participated, to increase
awareness of the existing (including procedures to access) bona fide prices of diesel and
electricity;
Under the Private Sector Investment Program, Mozambican and Danish governments designed a
program to support development of agricultural business in Mozambique. The program known as
AGRO-INVESTE spans five years (2013 through 2017) with a budget of 33.1 million USD and
has three components:
o Strengthening of agricultural private sector, managed by GAPI, provides loans, technical
assistance and training. This component has three subcomponent:
Provision of credit to promote and develop agricultural value chains except those
strongly related to forestry;
Promotion of youth agribusiness entrepreneurship: training and technical
assistance provided by higher education institutions to strengthen youth
agribusiness entrepreneurship, coupled with credit to kick start agribusiness
enterprises;
Agribusiness risk sharing: partnership with private bank to share risk in
agribusiness related investments;
o Loan guarantee fund managed by GAPI and implemented in partnership with private
banks;
o Strengthening MASA’s institutional capacity to promote and create enabling
environment for flourishing agricultural private sector;
MASA provides technical assistance in the preparation of business plans by the private sector,
especially for the following commodities: sugarcane, maize, rice, soybean, sesame, and fruits and
vegetables;
National Fund for Sustainable Development SUSTENTA, coordinated by MITADER, aims at
integrating smallholder farmers into sustainable agriculture- and forest-based value chain
development.
(iii) Key Gaps/Challenges:
Coordination between MASA and MITADER, the two major actors in the value chain development is the
key challenge in order to take advantage of synergies to create a well-functioning agribusiness value
chains with strong and inclusive participation of the private sector. Bureaucratic procedures and processes
for agricultural enterprises to benefit from bona fide prices for diesel and electricity is another challenge.
48
(iv) Priority Recommendations:
a) MASA to collaborate with MITADER to build a clear action plan to strengthening sustainable
agriculture- and forest-based value chain development with inclusive private sector participation;
b) MASA in collaboration with MEF to have simplified procedures to facilitate access to bona fide
prices of diesel and electricity by agricultural enterprises;
3.4.4 Rural Roads Program
(i) Objectives and Targets:
The objective of this program is to maintain, improve, and build road network (tertiary, vicinal and
unclassified roads) linking areas with agricultural, tourism, industrial and natural resource potential to
consumption markets throughout the country. This program will be implemented in close collaboration
between MASA and the National Road Administration (commonly known by its Portuguese acronym
ANE) of the Ministry of Public Works, Housing and Water Resource. Under this program, MASA and
ANE will identify some rural roads (or portions of rural roads) to be maintained and built by province-
and district-level governments, leading to decentralization. PNISA specific targets for this program were
not specified, making it difficult to assess whether progress towards achieving those targets was made.
(ii) Main Achievements and Results:
Data from National Road Administration (ANE) show that road extension increased from 30.56 thousand
in 2012 to 30.98 thousand kilometers in 2015. Over the same period, in any given year, unpaved roads
comprise about 77% of the total classified roads. However, the share of classified roads accounted for by
unpaved roads declined from 79.3% in 2012 to 76.6% in 2015. Paved roads increased from 6.35 thousand
in 2012 to 7.27 thousand kilometers in 2015, representing an increase of 14.5% (see Figure 27). This
improvement could contribute to improved access to market through reduced transaction costs to move
commodities from production to consumption hubs. However, we cannot assess whether PNISA target
were achieved because specified PNISA targets were not set. When looking at region patterns during the
period 2012 through 2015, the data from ANE show that paved roads increased by 36.7% from 1.76 to
2.41 thousand kilometers in Southern Mozambique, increased by 10.7% from 2.53 to 2.80 thousand
kilometers in Northern Mozambique, and registered no change in Central Mozambique remaining at 2.06
thousand kilometers. This indicates that largest improvements in paved roads were observed in Southern
Mozambique, suggesting that this region could have experienced largest strengthening of market access
despite lower agricultural potential and production compared to Northern and Central Mozambique.
Figure 28 shows trends in classified roads by type of road. This figures illustrates that vicinal roads
decreased from 6.88 thousand kilometers in 2012 to 6.79 thosuand kilometers in 2015 and tertiary roads
reduced from 12.76 thousand in 2012 to 12.63 thousand kilometers in 2015. By contrast, during the same
period, both secondary and primary roads increased from 4.96 thousand kilometers to 5.17 thousand
kilometers and from 6.04 thousand kilometers to 6.4 thousand kilometers, respectively. These figures
suggest that road construction and maintenance have focused on primary and secondary roads network,
contributing to strengthening road linkages between production and consumption zones and indirectly
improved access to markets. During the period spanning 2012 through 2015, data from ANE also show
that primary roads increased by 32% from 1.16 thousand kilometers to 1.53 thousand kilometers in
Southern Mozambique, reduced by 0.5% from 3.24 thosuand kilometers to 3.28 thousand kilometers in
Northern Mozambique, and did not change – remaining at 1.64 thousand kilometers – in Central
Mozambique. Similar regional patterns are seen for secondary roads. This suggests that Southern
Mozambique is the region that contributed to the increase in primary and secondary roads.
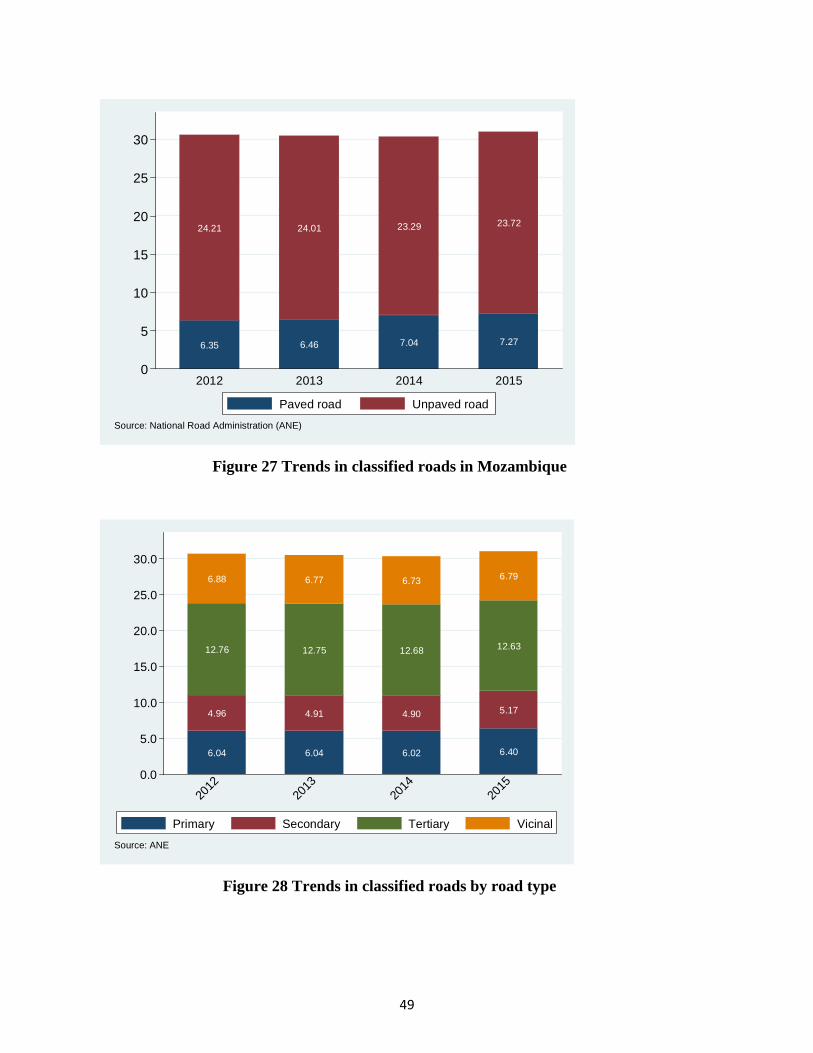
49
6.35
24.21
6.46
24.01
7.04
23.29
7.27
23.72
0
5
10
15
20
25
30
Ro
ad
exte
nsio
n (
Km
)
2012 2013 2014 2015
Source: National Road Administration (ANE)
Paved road Unpaved road
Figure 27 Trends in classified roads in Mozambique
6.04
4.96
12.76
6.88
6.04
4.91
12.75
6.77
6.02
4.90
12.68
6.73
6.40
5.17
12.63
6.79
0.0
5.0
10.0
15.0
20.0
25.0
30.0
Ro
ad
exte
nsio
n (
'00
0 K
m)
2012
2013
2014
2015
Source: ANE
Primary Secondary Tertiary Vicinal
Figure 28 Trends in classified roads by road type
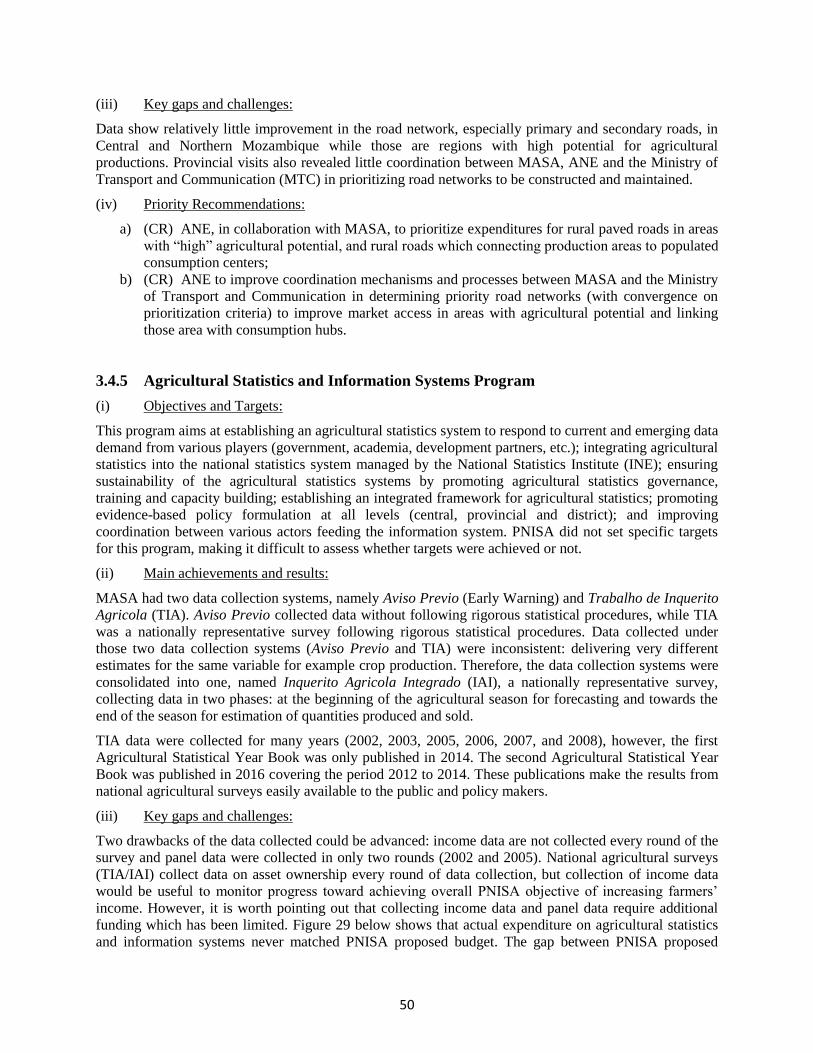
50
(iii) Key gaps and challenges:
Data show relatively little improvement in the road network, especially primary and secondary roads, in
Central and Northern Mozambique while those are regions with high potential for agricultural
productions. Provincial visits also revealed little coordination between MASA, ANE and the Ministry of
Transport and Communication (MTC) in prioritizing road networks to be constructed and maintained.
(iv) Priority Recommendations:
a) (CR) ANE, in collaboration with MASA, to prioritize expenditures for rural paved roads in areas
with “high” agricultural potential, and rural roads which connecting production areas to populated
consumption centers;
b) (CR) ANE to improve coordination mechanisms and processes between MASA and the Ministry
of Transport and Communication in determining priority road networks (with convergence on
prioritization criteria) to improve market access in areas with agricultural potential and linking
those area with consumption hubs.
3.4.5 Agricultural Statistics and Information Systems Program
(i) Objectives and Targets:
This program aims at establishing an agricultural statistics system to respond to current and emerging data
demand from various players (government, academia, development partners, etc.); integrating agricultural
statistics into the national statistics system managed by the National Statistics Institute (INE); ensuring
sustainability of the agricultural statistics systems by promoting agricultural statistics governance,
training and capacity building; establishing an integrated framework for agricultural statistics; promoting
evidence-based policy formulation at all levels (central, provincial and district); and improving
coordination between various actors feeding the information system. PNISA did not set specific targets
for this program, making it difficult to assess whether targets were achieved or not.
(ii) Main achievements and results:
MASA had two data collection systems, namely Aviso Previo (Early Warning) and Trabalho de Inquerito
Agricola (TIA). Aviso Previo collected data without following rigorous statistical procedures, while TIA
was a nationally representative survey following rigorous statistical procedures. Data collected under
those two data collection systems (Aviso Previo and TIA) were inconsistent: delivering very different
estimates for the same variable for example crop production. Therefore, the data collection systems were
consolidated into one, named Inquerito Agricola Integrado (IAI), a nationally representative survey,
collecting data in two phases: at the beginning of the agricultural season for forecasting and towards the
end of the season for estimation of quantities produced and sold.
TIA data were collected for many years (2002, 2003, 2005, 2006, 2007, and 2008), however, the first
Agricultural Statistical Year Book was only published in 2014. The second Agricultural Statistical Year
Book was published in 2016 covering the period 2012 to 2014. These publications make the results from
national agricultural surveys easily available to the public and policy makers.
(iii) Key gaps and challenges:
Two drawbacks of the data collected could be advanced: income data are not collected every round of the
survey and panel data were collected in only two rounds (2002 and 2005). National agricultural surveys
(TIA/IAI) collect data on asset ownership every round of data collection, but collection of income data
would be useful to monitor progress toward achieving overall PNISA objective of increasing farmers’
income. However, it is worth pointing out that collecting income data and panel data require additional
funding which has been limited. Figure 29 below shows that actual expenditure on agricultural statistics
and information systems never matched PNISA proposed budget. The gap between PNISA proposed
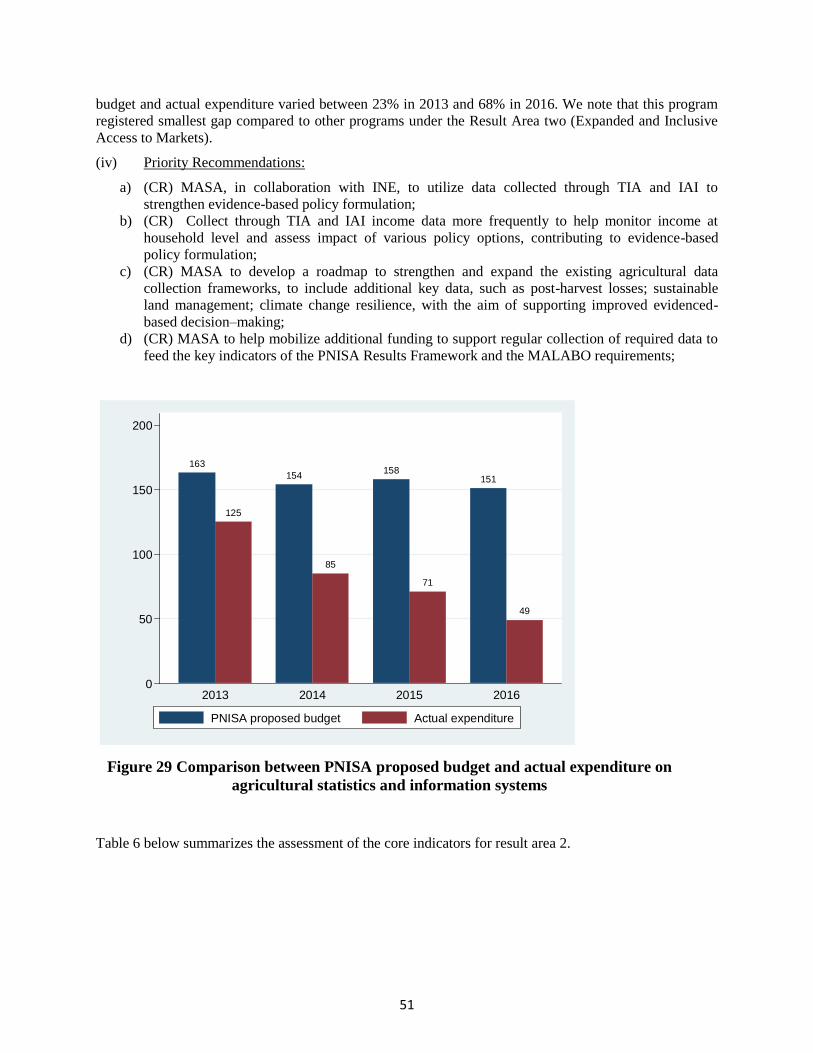
51
budget and actual expenditure varied between 23% in 2013 and 68% in 2016. We note that this program
registered smallest gap compared to other programs under the Result Area two (Expanded and Inclusive
Access to Markets).
(iv) Priority Recommendations:
a) (CR) MASA, in collaboration with INE, to utilize data collected through TIA and IAI to
strengthen evidence-based policy formulation;
b) (CR) Collect through TIA and IAI income data more frequently to help monitor income at
household level and assess impact of various policy options, contributing to evidence-based
policy formulation;
c) (CR) MASA to develop a roadmap to strengthen and expand the existing agricultural data
collection frameworks, to include additional key data, such as post-harvest losses; sustainable
land management; climate change resilience, with the aim of supporting improved evidenced-
based decision–making;
d) (CR) MASA to help mobilize additional funding to support regular collection of required data to
feed the key indicators of the PNISA Results Framework and the MALABO requirements;
163
125
154
85
158
71
151
49
0
50
100
150
200
Am
ou
nt ('0
00
'00
0 M
ZN
)
2013 2014 2015 2016
PNISA proposed budget Actual expenditure
Figure 29 Comparison between PNISA proposed budget and actual expenditure on
agricultural statistics and information systems
Table 6 below summarizes the assessment of the core indicators for result area 2.
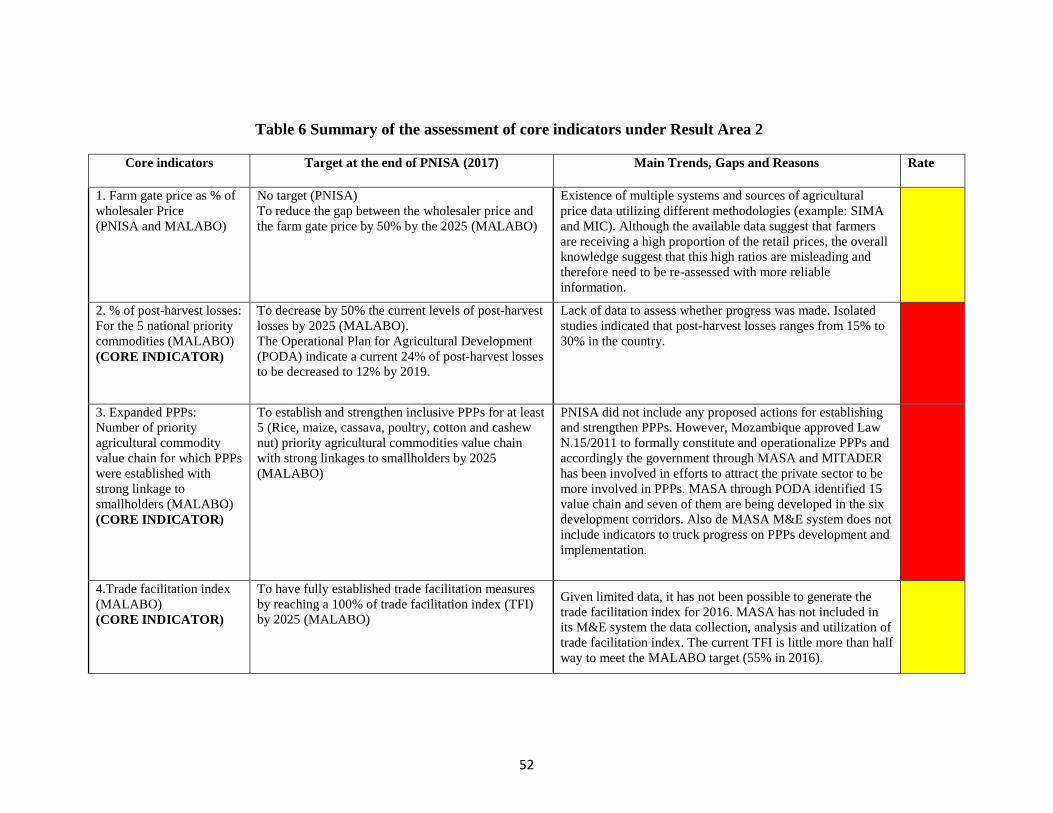
52
Table 6 Summary of the assessment of core indicators under Result Area 2
Core indicators Target at the end of PNISA (2017) Main Trends, Gaps and Reasons Rate
1. Farm gate price as % of
wholesaler Price
(PNISA and MALABO)
No target (PNISA)
To reduce the gap between the wholesaler price and
the farm gate price by 50% by the 2025 (MALABO)
Existence of multiple systems and sources of agricultural
price data utilizing different methodologies (example: SIMA
and MIC). Although the available data suggest that farmers
are receiving a high proportion of the retail prices, the overall
knowledge suggest that this high ratios are misleading and
therefore need to be re-assessed with more reliable
information.
2. % of post-harvest losses:
For the 5 national priority
commodities (MALABO)
(CORE INDICATOR)
To decrease by 50% the current levels of post-harvest
losses by 2025 (MALABO).
The Operational Plan for Agricultural Development
(PODA) indicate a current 24% of post-harvest losses
to be decreased to 12% by 2019.
Lack of data to assess whether progress was made. Isolated
studies indicated that post-harvest losses ranges from 15% to
30% in the country.
3. Expanded PPPs:
Number of priority
agricultural commodity
value chain for which PPPs
were established with
strong linkage to
smallholders (MALABO)
(CORE INDICATOR)
To establish and strengthen inclusive PPPs for at least
5 (Rice, maize, cassava, poultry, cotton and cashew
nut) priority agricultural commodities value chain
with strong linkages to smallholders by 2025
(MALABO)
PNISA did not include any proposed actions for establishing
and strengthen PPPs. However, Mozambique approved Law
N.15/2011 to formally constitute and operationalize PPPs and
accordingly the government through MASA and MITADER
has been involved in efforts to attract the private sector to be
more involved in PPPs. MASA through PODA identified 15
value chain and seven of them are being developed in the six
development corridors. Also de MASA M&E system does not
include indicators to truck progress on PPPs development and
implementation.
4.Trade facilitation index
(MALABO)
(CORE INDICATOR)
To have fully established trade facilitation measures
by reaching a 100% of trade facilitation index (TFI)
by 2025 (MALABO)
Given limited data, it has not been possible to generate the
trade facilitation index for 2016. MASA has not included in
its M&E system the data collection, analysis and utilization of
trade facilitation index. The current TFI is little more than half
way to meet the MALABO target (55% in 2016).
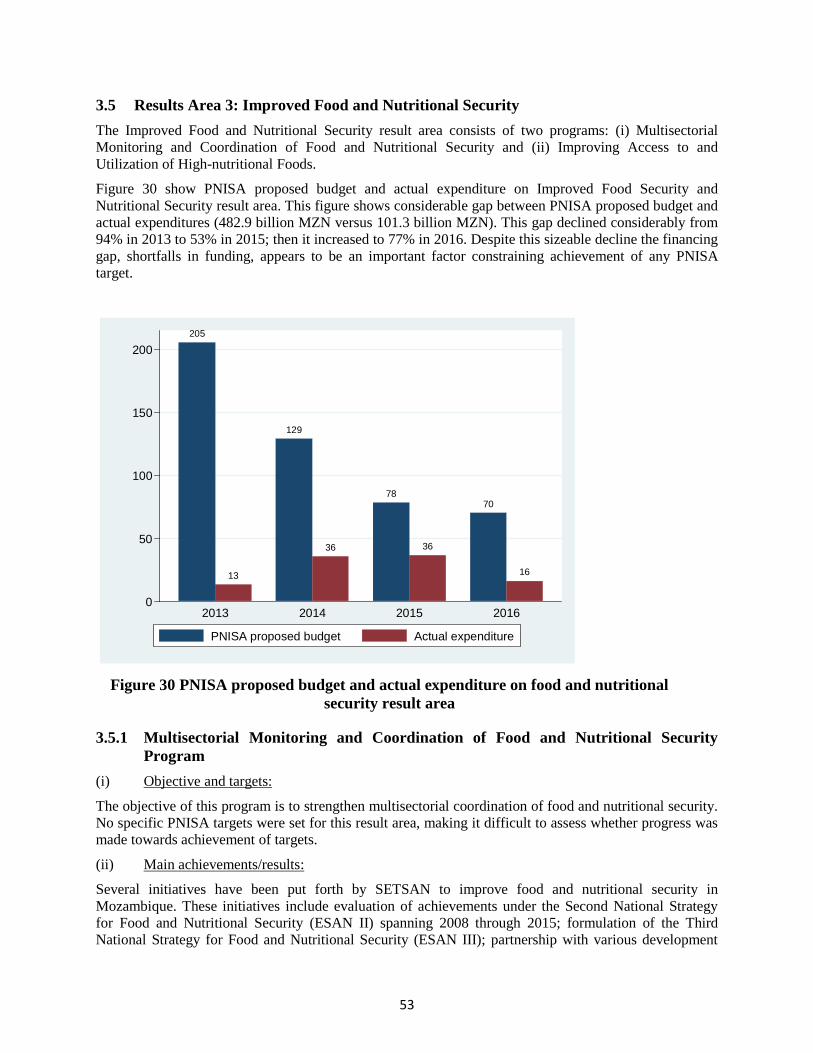
53
3.5 Results Area 3: Improved Food and Nutritional Security
The Improved Food and Nutritional Security result area consists of two programs: (i) Multisectorial
Monitoring and Coordination of Food and Nutritional Security and (ii) Improving Access to and
Utilization of High-nutritional Foods.
Figure 30 show PNISA proposed budget and actual expenditure on Improved Food Security and
Nutritional Security result area. This figure shows considerable gap between PNISA proposed budget and
actual expenditures (482.9 billion MZN versus 101.3 billion MZN). This gap declined considerably from
94% in 2013 to 53% in 2015; then it increased to 77% in 2016. Despite this sizeable decline the financing
gap, shortfalls in funding, appears to be an important factor constraining achievement of any PNISA
target.
205
13
129
36
78
36
70
16
0
50
100
150
200
Am
ou
nt ('0
00
'00
0 M
ZN
)
2013 2014 2015 2016
PNISA proposed budget Actual expenditure
Figure 30 PNISA proposed budget and actual expenditure on food and nutritional
security result area
3.5.1 Multisectorial Monitoring and Coordination of Food and Nutritional Security
Program
(i) Objective and targets:
The objective of this program is to strengthen multisectorial coordination of food and nutritional security.
No specific PNISA targets were set for this result area, making it difficult to assess whether progress was
made towards achievement of targets.
(ii) Main achievements/results:
Several initiatives have been put forth by SETSAN to improve food and nutritional security in
Mozambique. These initiatives include evaluation of achievements under the Second National Strategy
for Food and Nutritional Security (ESAN II) spanning 2008 through 2015; formulation of the Third
National Strategy for Food and Nutritional Security (ESAN III); partnership with various development
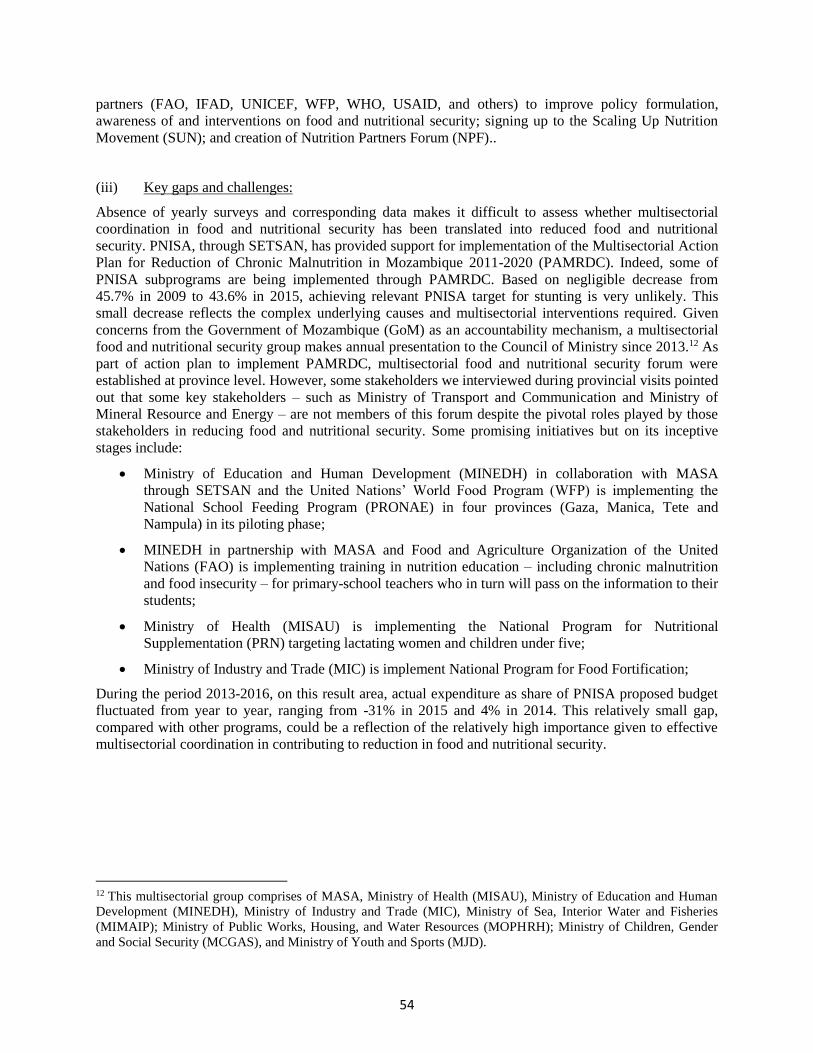
54
partners (FAO, IFAD, UNICEF, WFP, WHO, USAID, and others) to improve policy formulation,
awareness of and interventions on food and nutritional security; signing up to the Scaling Up Nutrition
Movement (SUN); and creation of Nutrition Partners Forum (NPF)..
(iii) Key gaps and challenges:
Absence of yearly surveys and corresponding data makes it difficult to assess whether multisectorial
coordination in food and nutritional security has been translated into reduced food and nutritional
security. PNISA, through SETSAN, has provided support for implementation of the Multisectorial Action
Plan for Reduction of Chronic Malnutrition in Mozambique 2011-2020 (PAMRDC). Indeed, some of
PNISA subprograms are being implemented through PAMRDC. Based on negligible decrease from
45.7% in 2009 to 43.6% in 2015, achieving relevant PNISA target for stunting is very unlikely. This
small decrease reflects the complex underlying causes and multisectorial interventions required. Given
concerns from the Government of Mozambique (GoM) as an accountability mechanism, a multisectorial
food and nutritional security group makes annual presentation to the Council of Ministry since 2013.12 As
part of action plan to implement PAMRDC, multisectorial food and nutritional security forum were
established at province level. However, some stakeholders we interviewed during provincial visits pointed
out that some key stakeholders – such as Ministry of Transport and Communication and Ministry of
Mineral Resource and Energy – are not members of this forum despite the pivotal roles played by those
stakeholders in reducing food and nutritional security. Some promising initiatives but on its inceptive
stages include:
Ministry of Education and Human Development (MINEDH) in collaboration with MASA
through SETSAN and the United Nations’ World Food Program (WFP) is implementing the
National School Feeding Program (PRONAE) in four provinces (Gaza, Manica, Tete and
Nampula) in its piloting phase;
MINEDH in partnership with MASA and Food and Agriculture Organization of the United
Nations (FAO) is implementing training in nutrition education – including chronic malnutrition
and food insecurity – for primary-school teachers who in turn will pass on the information to their
students;
Ministry of Health (MISAU) is implementing the National Program for Nutritional
Supplementation (PRN) targeting lactating women and children under five;
Ministry of Industry and Trade (MIC) is implement National Program for Food Fortification;
During the period 2013-2016, on this result area, actual expenditure as share of PNISA proposed budget
fluctuated from year to year, ranging from -31% in 2015 and 4% in 2014. This relatively small gap,
compared with other programs, could be a reflection of the relatively high importance given to effective
multisectorial coordination in contributing to reduction in food and nutritional security.
12 This multisectorial group comprises of MASA, Ministry of Health (MISAU), Ministry of Education and Human
Development (MINEDH), Ministry of Industry and Trade (MIC), Ministry of Sea, Interior Water and Fisheries
(MIMAIP); Ministry of Public Works, Housing, and Water Resources (MOPHRH); Ministry of Children, Gender
and Social Security (MCGAS), and Ministry of Youth and Sports (MJD).
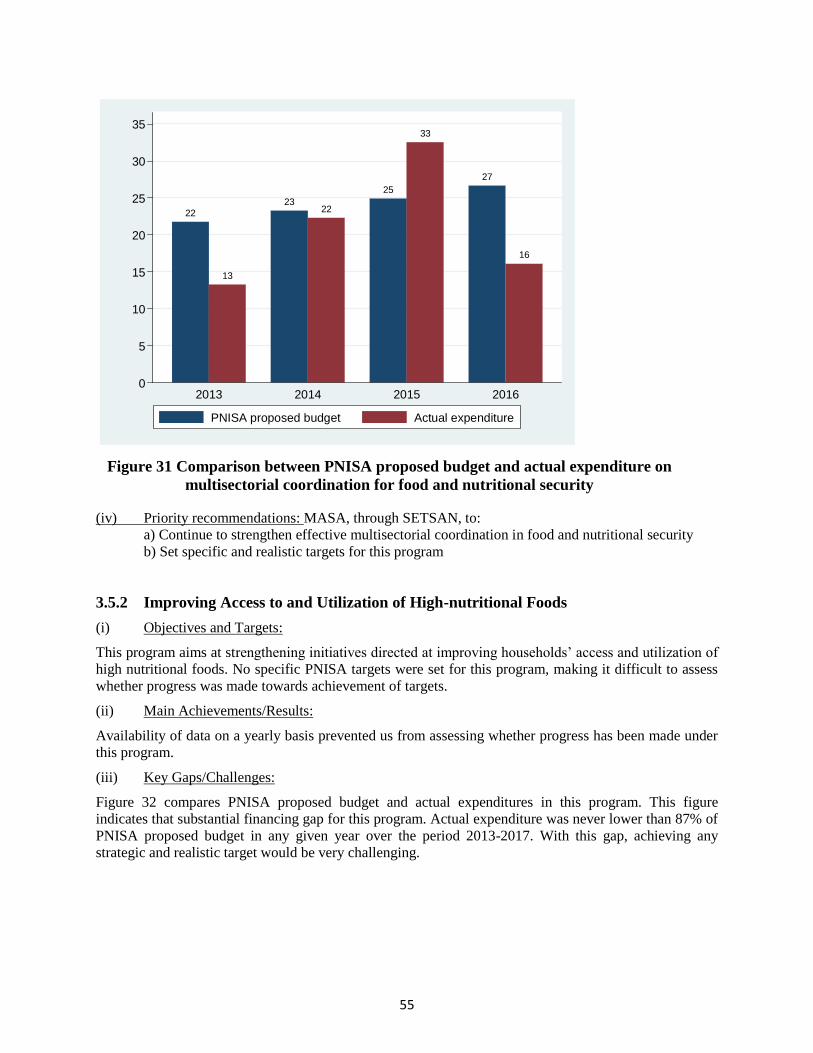
55
22
13
2322
25
33
27
16
0
5
10
15
20
25
30
35
Am
ou
nt ('0
00
'00
0 M
ZN
)
2013 2014 2015 2016
PNISA proposed budget Actual expenditure
Figure 31 Comparison between PNISA proposed budget and actual expenditure on
multisectorial coordination for food and nutritional security
(iv) Priority recommendations: MASA, through SETSAN, to:
a) Continue to strengthen effective multisectorial coordination in food and nutritional security
b) Set specific and realistic targets for this program
3.5.2 Improving Access to and Utilization of High-nutritional Foods
(i) Objectives and Targets:
This program aims at strengthening initiatives directed at improving households’ access and utilization of
high nutritional foods. No specific PNISA targets were set for this program, making it difficult to assess
whether progress was made towards achievement of targets.
(ii) Main Achievements/Results:
Availability of data on a yearly basis prevented us from assessing whether progress has been made under
this program.
(iii) Key Gaps/Challenges:
Figure 32 compares PNISA proposed budget and actual expenditures in this program. This figure
indicates that substantial financing gap for this program. Actual expenditure was never lower than 87% of
PNISA proposed budget in any given year over the period 2013-2017. With this gap, achieving any
strategic and realistic target would be very challenging.
56
184
0
106
13
53
4
43
00
50
100
150
200
Am
ou
nt ('0
00
'00
0 M
ZN
)
2013 2014 2015 2016
PNISA proposed budget Actual expenditure
Figure 32 Comparison of PNISA proposed budget and actual expenditure in
Improving Access to and Utilization of High-nutritional Foods results area
(iv) Priority Recommendations:
a) MASA through SETSAN to mobilize funding to more effectively improve access to and
utilization of high-nutritional foods.
Table 7 below summarizes the assessment of the core indicator of the result area 3.
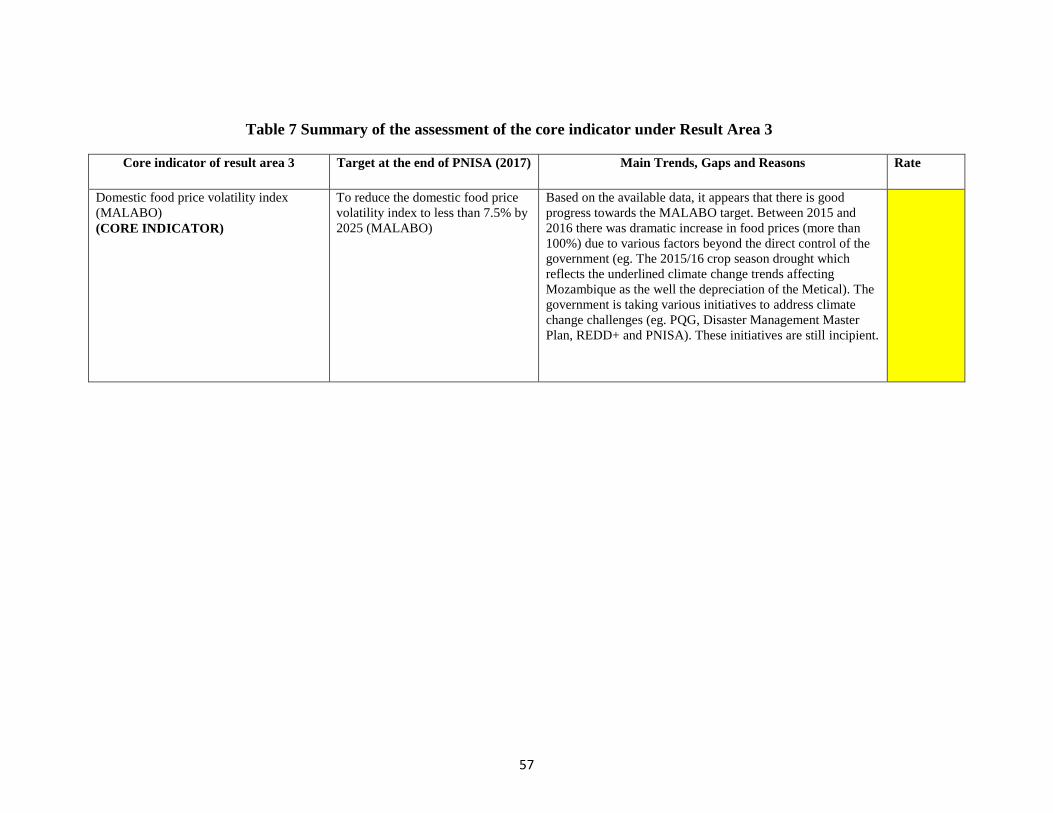
57
Table 7 Summary of the assessment of the core indicator under Result Area 3
Core indicator of result area 3 Target at the end of PNISA (2017) Main Trends, Gaps and Reasons Rate
Domestic food price volatility index
(MALABO)
(CORE INDICATOR)
To reduce the domestic food price
volatility index to less than 7.5% by
2025 (MALABO)
Based on the available data, it appears that there is good
progress towards the MALABO target. Between 2015 and
2016 there was dramatic increase in food prices (more than
100%) due to various factors beyond the direct control of the
government (eg. The 2015/16 crop season drought which
reflects the underlined climate change trends affecting
Mozambique as the well the depreciation of the Metical). The
government is taking various initiatives to address climate
change challenges (eg. PQG, Disaster Management Master
Plan, REDD+ and PNISA). These initiatives are still incipient.
58
3.6 Results Area 4: Improved Natural Resources
This result area is composed of 4 Programs as follows: (1) Land for Agricultural Purposes Program,
(2) Forest and Wildlife Program, (3) Institutional Development Program, and (4) Mapping and
Remote Sensing Program. Table 8 below presents the strategic objectives by component of this result
area and its actual results and key recommendations.
3.6.1 Land for Agricultural Purposes Program
(i) Objectives and Targets:
The Land for Agricultural Purposes Program has two main objectives: (i) promoting the sustainable
use of land; and (ii) ensure and facilitate access to and protection of rights for the use and enjoyment
of land, particularly at local community level. Related to this program, PNISA established the
indicator of percentage of small-scale farmers that have adopted conservation agriculture with a target
of increased from the baseline value of 10% to 25% by the end of the PNISA as well as improved land
quality (% of soil organic matter) with a target of increasing from the baseline value of 1% to 2% by
the end of the PNISA. The other proposed indicators to be measured to monitor the achievement of
the above objectives are: (i) percentage of agricultural land under sustainable land management and
(ii) percentage of farmers with ownership or secured land rights. The MALABO target for the first
indicator is to ensure that at least 30% of agricultural land is placed under sustainable land
management practices and the MALABO target for the second indicator is to ensure that 100% of
farmers have rights to access required land by 2018.
(ii) Main Achievements/Results:
The assessment of the PNISA target is not possible due to lack of data. The assessment of the
indicator on percentage of agricultural land under sustainable land management is not possible due to
the lack of data to derive clear trends. However, Mozambique is cyclically affected by climate and
weather conditions which call for sustainable agricultural practices to mitigate the effects of these
variations. These practices being implemented in the country include (i) conservation agriculture and
nutrition soils programs and (ii) regeneration of mangroves and rehabilitation of degraded ecosystems.
There are isolated efforts which together do not give enough evidence towards the achievement of the
established target. Regarding the indicator on percentage of farmers with ownership or secured land
rights, the MASA (2017) reports that 10% of the farmers have secured their land. Relative to
MALABO target there is significant shortfall (10% in 2016 vs 100% by 2018).
(iii) Key Gaps/Challenges:
The above targets are over-established taking into account the remaining time frame to meet the
targets (10% of farmers with secure land in 2016 against the target of 100% of farmers with secure
land by 2018). The other main challenges under this program include the (i) lack of data to track the
trends on percentage of agricultural land under sustainable land management, percentage of small-
scale farmers that have adopted conservation agriculture, and improved land quality (% of soil organic
matter); (ii) lack of action plans, strategies and tactics to meet the established targets as well as (ii) the
limited financial resources. It is important to note that the majority of the budgeted funds under this
program were not disbursed as the gap between budgeted and disbursed funds are over 70% in all
years and in 2015 and 2016 no funds were disbursed to implement this program (Figure 33)
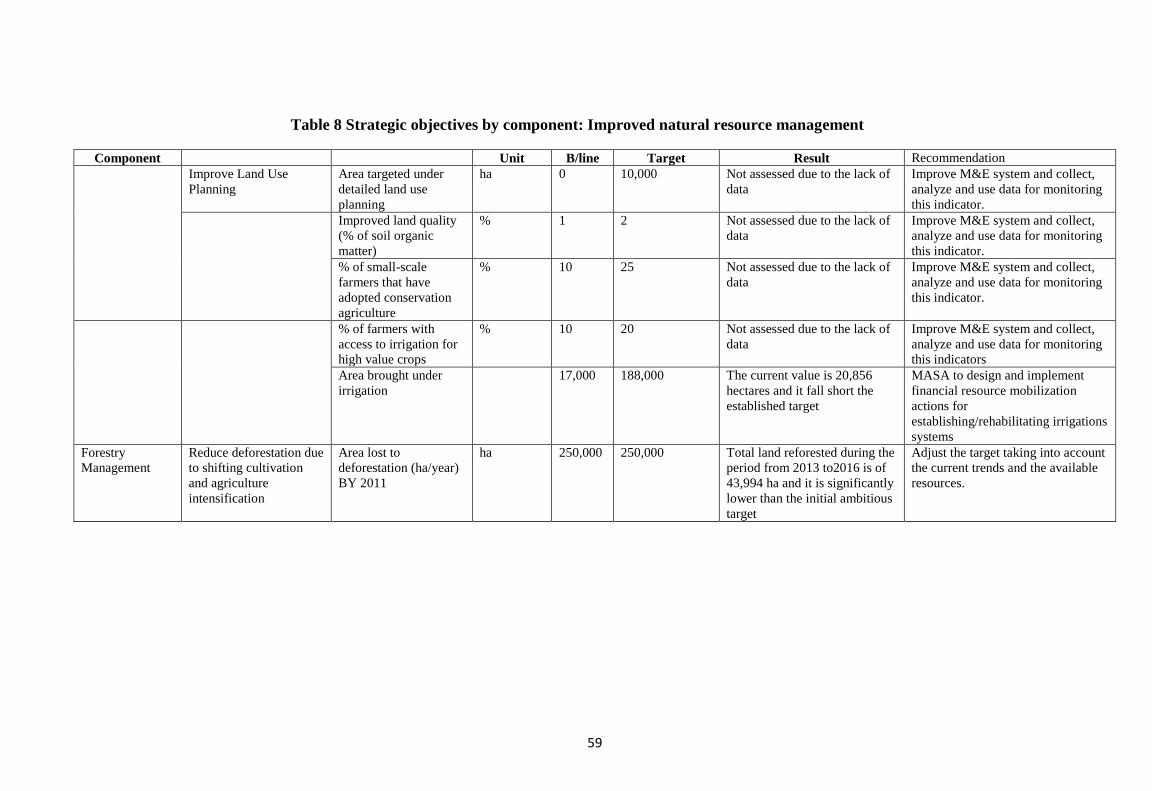
59
Table 8 Strategic objectives by component: Improved natural resource management
Component Unit B/line Target Result Recommendation
Improve Land Use
Planning
Area targeted under
detailed land use
planning
ha 0 10,000 Not assessed due to the lack of
data
Improve M&E system and collect,
analyze and use data for monitoring
this indicator.
Improved land quality
(% of soil organic
matter)
% 1 2 Not assessed due to the lack of
data
Improve M&E system and collect,
analyze and use data for monitoring
this indicator.
% of small-scale
farmers that have
adopted conservation
agriculture
% 10 25 Not assessed due to the lack of
data
Improve M&E system and collect,
analyze and use data for monitoring
this indicator.
% of farmers with
access to irrigation for
high value crops
% 10 20 Not assessed due to the lack of
data
Improve M&E system and collect,
analyze and use data for monitoring
this indicators
Area brought under
irrigation
17,000 188,000 The current value is 20,856
hectares and it fall short the
established target
MASA to design and implement
financial resource mobilization
actions for
establishing/rehabilitating irrigations
systems
Forestry
Management
Reduce deforestation due
to shifting cultivation
and agriculture
intensification
Area lost to
deforestation (ha/year)
BY 2011
ha 250,000 250,000 Total land reforested during the
period from 2013 to2016 is of
43,994 ha and it is significantly
lower than the initial ambitious
target
Adjust the target taking into account
the current trends and the available
resources.
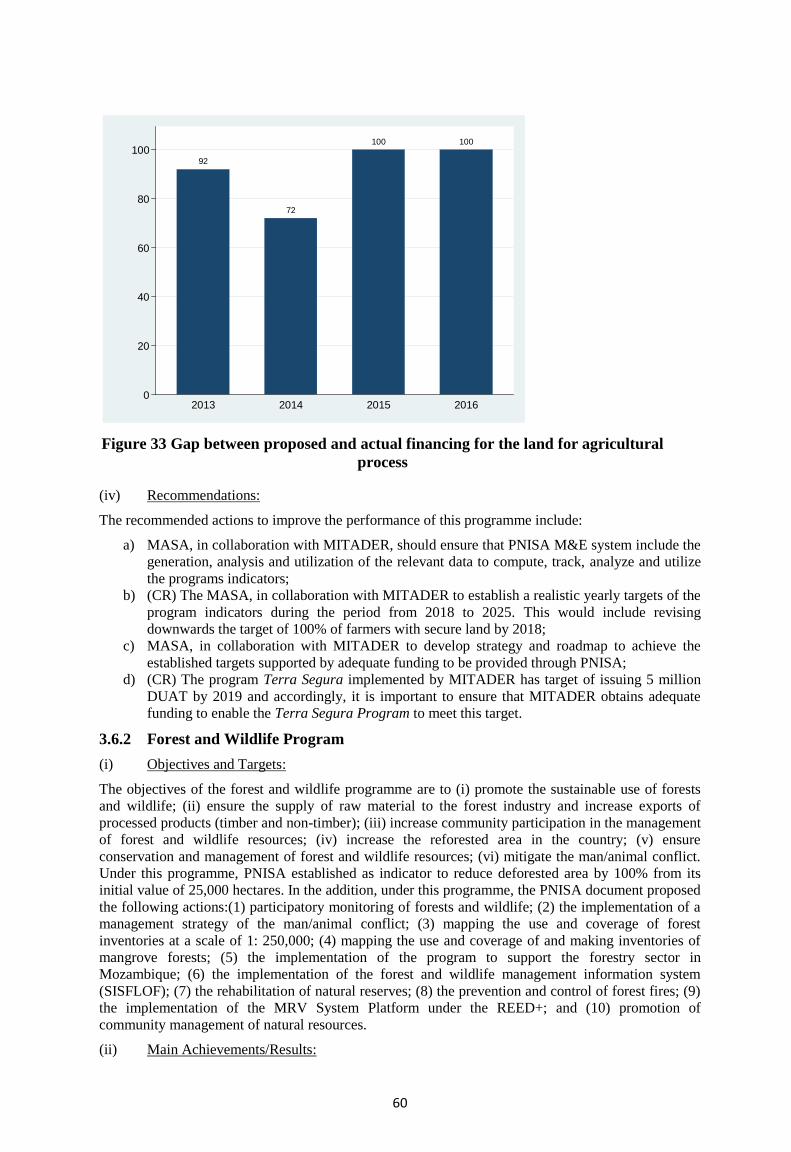
60
92
72
100 100
0
20
40
60
80
100
Fin
ancia
l g
ap
(%
)
2013 2014 2015 2016
Figure 33 Gap between proposed and actual financing for the land for agricultural
process
(iv) Recommendations:
The recommended actions to improve the performance of this programme include:
a) MASA, in collaboration with MITADER, should ensure that PNISA M&E system include the
generation, analysis and utilization of the relevant data to compute, track, analyze and utilize
the programs indicators;
b) (CR) The MASA, in collaboration with MITADER to establish a realistic yearly targets of the
program indicators during the period from 2018 to 2025. This would include revising
downwards the target of 100% of farmers with secure land by 2018;
c) MASA, in collaboration with MITADER to develop strategy and roadmap to achieve the
established targets supported by adequate funding to be provided through PNISA;
d) (CR) The program Terra Segura implemented by MITADER has target of issuing 5 million
DUAT by 2019 and accordingly, it is important to ensure that MITADER obtains adequate
funding to enable the Terra Segura Program to meet this target.
3.6.2 Forest and Wildlife Program
(i) Objectives and Targets:
The objectives of the forest and wildlife programme are to (i) promote the sustainable use of forests
and wildlife; (ii) ensure the supply of raw material to the forest industry and increase exports of
processed products (timber and non-timber); (iii) increase community participation in the management
of forest and wildlife resources; (iv) increase the reforested area in the country; (v) ensure
conservation and management of forest and wildlife resources; (vi) mitigate the man/animal conflict.
Under this programme, PNISA established as indicator to reduce deforested area by 100% from its
initial value of 25,000 hectares. In the addition, under this programme, the PNISA document proposed
the following actions:(1) participatory monitoring of forests and wildlife; (2) the implementation of a
management strategy of the man/animal conflict; (3) mapping the use and coverage of forest
inventories at a scale of 1: 250,000; (4) mapping the use and coverage of and making inventories of
mangrove forests; (5) the implementation of the program to support the forestry sector in
Mozambique; (6) the implementation of the forest and wildlife management information system
(SISFLOF); (7) the rehabilitation of natural reserves; (8) the prevention and control of forest fires; (9)
the implementation of the MRV System Platform under the REED+; and (10) promotion of
community management of natural resources.
(ii) Main Achievements/Results:
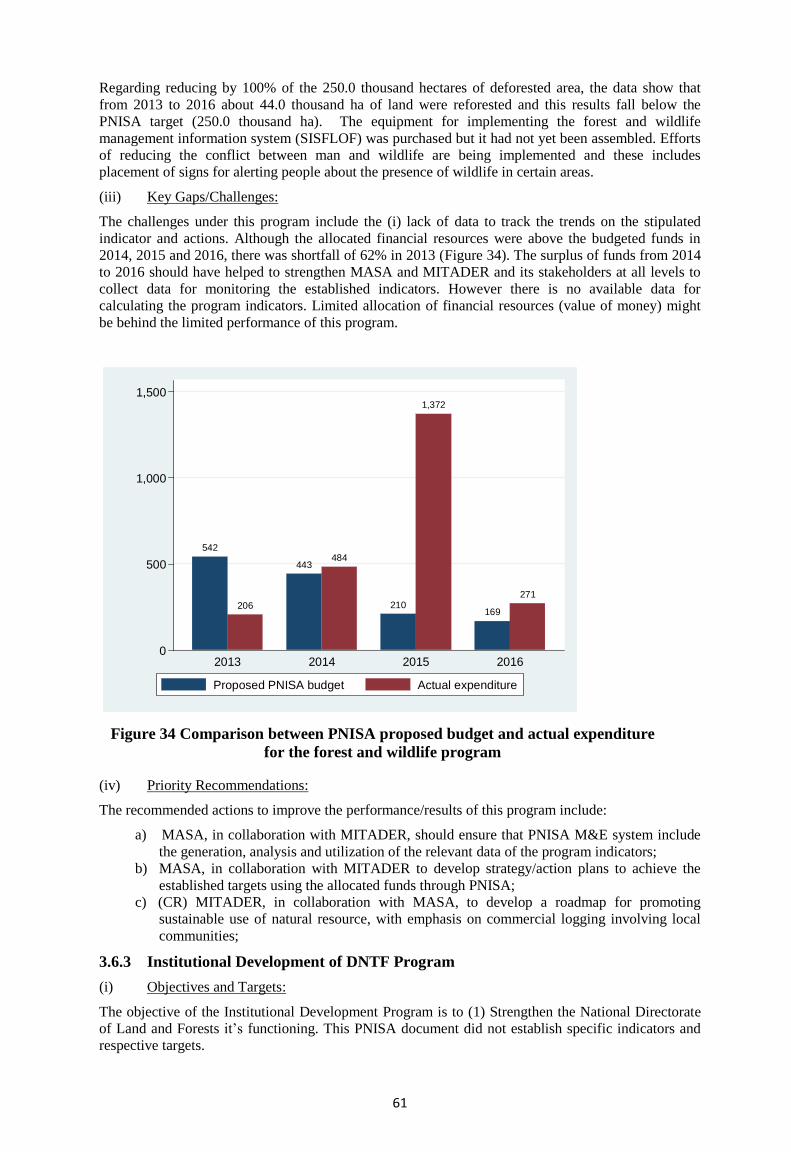
61
Regarding reducing by 100% of the 250.0 thousand hectares of deforested area, the data show that
from 2013 to 2016 about 44.0 thousand ha of land were reforested and this results fall below the
PNISA target (250.0 thousand ha). The equipment for implementing the forest and wildlife
management information system (SISFLOF) was purchased but it had not yet been assembled. Efforts
of reducing the conflict between man and wildlife are being implemented and these includes
placement of signs for alerting people about the presence of wildlife in certain areas.
(iii) Key Gaps/Challenges:
The challenges under this program include the (i) lack of data to track the trends on the stipulated
indicator and actions. Although the allocated financial resources were above the budgeted funds in
2014, 2015 and 2016, there was shortfall of 62% in 2013 (Figure 34). The surplus of funds from 2014
to 2016 should have helped to strengthen MASA and MITADER and its stakeholders at all levels to
collect data for monitoring the established indicators. However there is no available data for
calculating the program indicators. Limited allocation of financial resources (value of money) might
be behind the limited performance of this program.
542
206
443484
210
1,372
169
271
0
500
1,000
1,500
MZ
N (
mill
ion)
2013 2014 2015 2016
Proposed PNISA budget Actual expenditure
Figure 34 Comparison between PNISA proposed budget and actual expenditure
for the forest and wildlife program
(iv) Priority Recommendations:
The recommended actions to improve the performance/results of this program include:
a) MASA, in collaboration with MITADER, should ensure that PNISA M&E system include
the generation, analysis and utilization of the relevant data of the program indicators;
b) MASA, in collaboration with MITADER to develop strategy/action plans to achieve the
established targets using the allocated funds through PNISA;
c) (CR) MITADER, in collaboration with MASA, to develop a roadmap for promoting
sustainable use of natural resource, with emphasis on commercial logging involving local
communities;
3.6.3 Institutional Development of DNTF Program
(i) Objectives and Targets:
The objective of the Institutional Development Program is to (1) Strengthen the National Directorate
of Land and Forests it’s functioning. This PNISA document did not establish specific indicators and
respective targets.
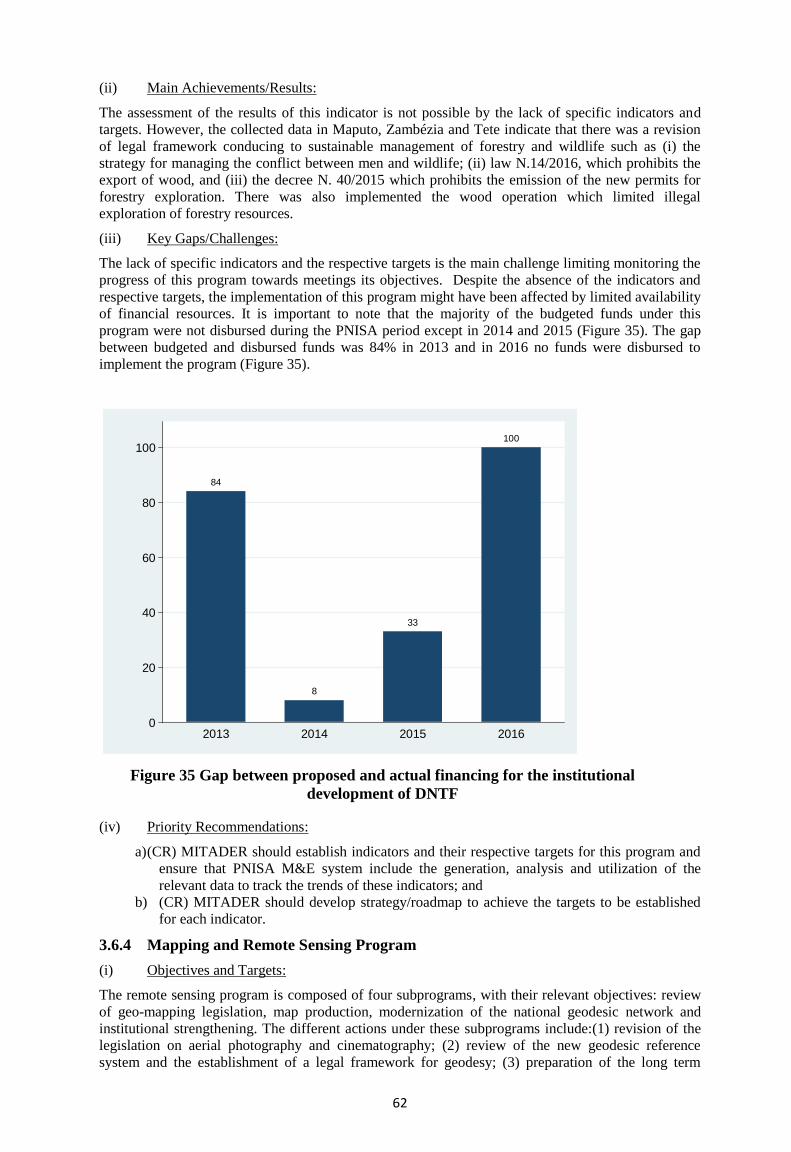
62
(ii) Main Achievements/Results:
The assessment of the results of this indicator is not possible by the lack of specific indicators and
targets. However, the collected data in Maputo, Zambézia and Tete indicate that there was a revision
of legal framework conducing to sustainable management of forestry and wildlife such as (i) the
strategy for managing the conflict between men and wildlife; (ii) law N.14/2016, which prohibits the
export of wood, and (iii) the decree N. 40/2015 which prohibits the emission of the new permits for
forestry exploration. There was also implemented the wood operation which limited illegal
exploration of forestry resources.
(iii) Key Gaps/Challenges:
The lack of specific indicators and the respective targets is the main challenge limiting monitoring the
progress of this program towards meetings its objectives. Despite the absence of the indicators and
respective targets, the implementation of this program might have been affected by limited availability
of financial resources. It is important to note that the majority of the budgeted funds under this
program were not disbursed during the PNISA period except in 2014 and 2015 (Figure 35). The gap
between budgeted and disbursed funds was 84% in 2013 and in 2016 no funds were disbursed to
implement the program (Figure 35).
84
8
33
100
0
20
40
60
80
100
Fin
ancia
l g
ap
(%
)
2013 2014 2015 2016
Figure 35 Gap between proposed and actual financing for the institutional
development of DNTF
(iv) Priority Recommendations:
a) (CR) MITADER should establish indicators and their respective targets for this program and
ensure that PNISA M&E system include the generation, analysis and utilization of the
relevant data to track the trends of these indicators; and
b) (CR) MITADER should develop strategy/roadmap to achieve the targets to be established
for each indicator.
3.6.4 Mapping and Remote Sensing Program
(i) Objectives and Targets:
The remote sensing program is composed of four subprograms, with their relevant objectives: review
of geo-mapping legislation, map production, modernization of the national geodesic network and
institutional strengthening. The different actions under these subprograms include:(1) revision of the
legislation on aerial photography and cinematography; (2) review of the new geodesic reference
system and the establishment of a legal framework for geodesy; (3) preparation of the long term
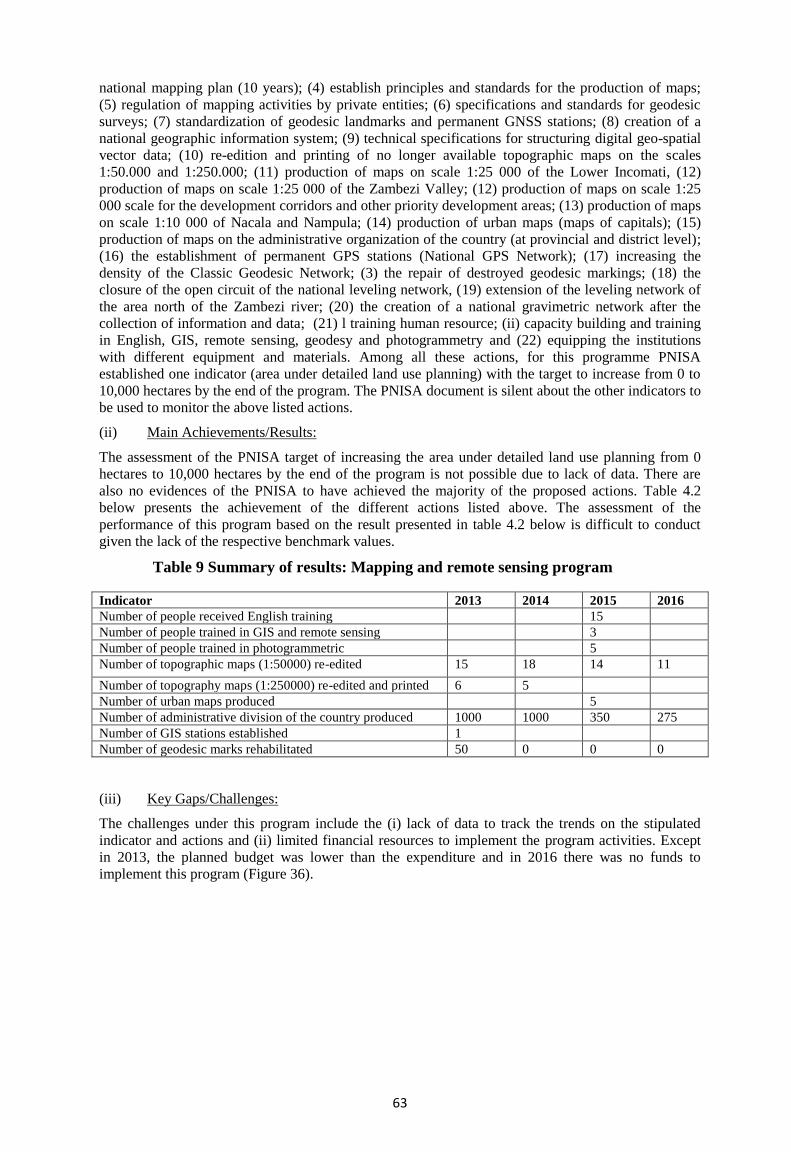
63
national mapping plan (10 years); (4) establish principles and standards for the production of maps;
(5) regulation of mapping activities by private entities; (6) specifications and standards for geodesic
surveys; (7) standardization of geodesic landmarks and permanent GNSS stations; (8) creation of a
national geographic information system; (9) technical specifications for structuring digital geo-spatial
vector data; (10) re-edition and printing of no longer available topographic maps on the scales
1:50.000 and 1:250.000; (11) production of maps on scale 1:25 000 of the Lower Incomati, (12)
production of maps on scale 1:25 000 of the Zambezi Valley; (12) production of maps on scale 1:25
000 scale for the development corridors and other priority development areas; (13) production of maps
on scale 1:10 000 of Nacala and Nampula; (14) production of urban maps (maps of capitals); (15)
production of maps on the administrative organization of the country (at provincial and district level);
(16) the establishment of permanent GPS stations (National GPS Network); (17) increasing the
density of the Classic Geodesic Network; (3) the repair of destroyed geodesic markings; (18) the
closure of the open circuit of the national leveling network, (19) extension of the leveling network of
the area north of the Zambezi river; (20) the creation of a national gravimetric network after the
collection of information and data; (21) l training human resource; (ii) capacity building and training
in English, GIS, remote sensing, geodesy and photogrammetry and (22) equipping the institutions
with different equipment and materials. Among all these actions, for this programme PNISA
established one indicator (area under detailed land use planning) with the target to increase from 0 to
10,000 hectares by the end of the program. The PNISA document is silent about the other indicators to
be used to monitor the above listed actions.
(ii) Main Achievements/Results:
The assessment of the PNISA target of increasing the area under detailed land use planning from 0
hectares to 10,000 hectares by the end of the program is not possible due to lack of data. There are
also no evidences of the PNISA to have achieved the majority of the proposed actions. Table 4.2
below presents the achievement of the different actions listed above. The assessment of the
performance of this program based on the result presented in table 4.2 below is difficult to conduct
given the lack of the respective benchmark values.
Table 9 Summary of results: Mapping and remote sensing program
Indicator 2013 2014 2015 2016
Number of people received English training 15
Number of people trained in GIS and remote sensing 3
Number of people trained in photogrammetric 5
Number of topographic maps (1:50000) re-edited 15 18 14 11
Number of topography maps (1:250000) re-edited and printed 6 5
Number of urban maps produced 5
Number of administrative division of the country produced 1000 1000 350 275
Number of GIS stations established 1
Number of geodesic marks rehabilitated 50 0 0 0
(iii) Key Gaps/Challenges:
The challenges under this program include the (i) lack of data to track the trends on the stipulated
indicator and actions and (ii) limited financial resources to implement the program activities. Except
in 2013, the planned budget was lower than the expenditure and in 2016 there was no funds to
implement this program (Figure 36).
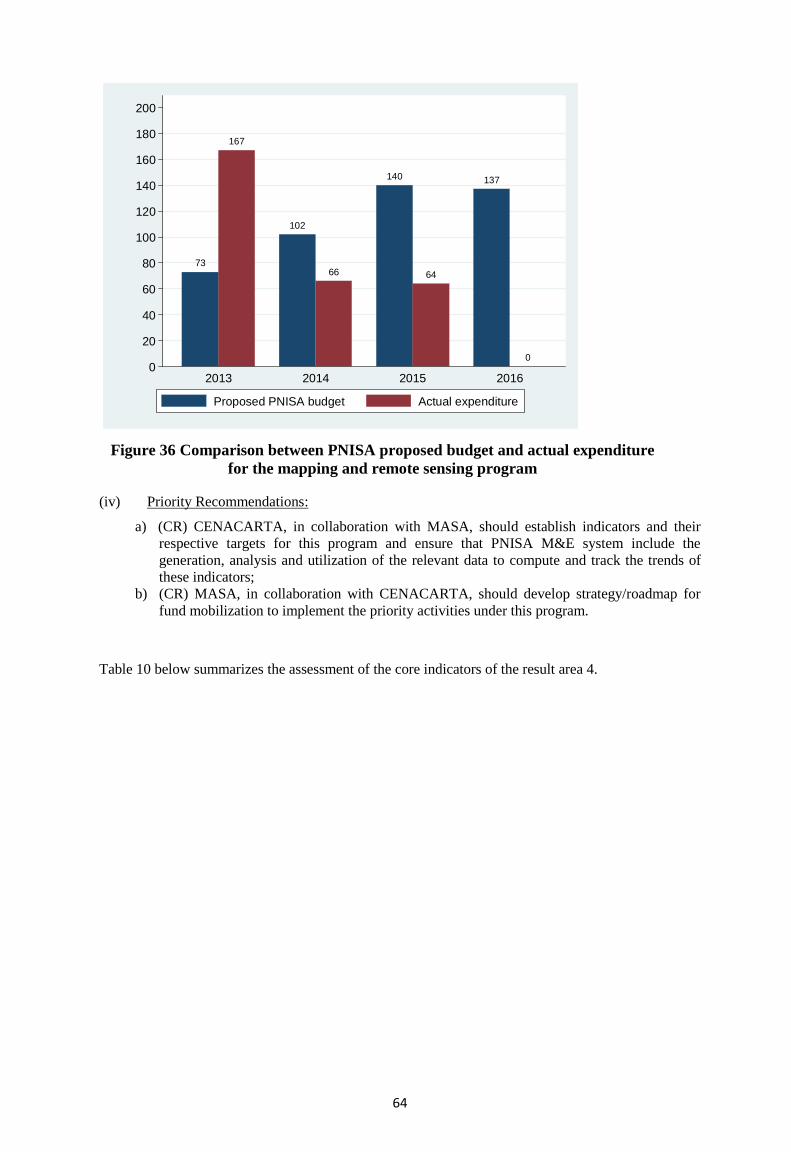
64
73
167
102
66
140
64
137
00
20
40
60
80
100
120
140
160
180
200
MZ
N (
mill
ion)
2013 2014 2015 2016
Proposed PNISA budget Actual expenditure
Figure 36 Comparison between PNISA proposed budget and actual expenditure
for the mapping and remote sensing program
(iv) Priority Recommendations:
a) (CR) CENACARTA, in collaboration with MASA, should establish indicators and their
respective targets for this program and ensure that PNISA M&E system include the
generation, analysis and utilization of the relevant data to compute and track the trends of
these indicators;
b) (CR) MASA, in collaboration with CENACARTA, should develop strategy/roadmap for
fund mobilization to implement the priority activities under this program.
Table 10 below summarizes the assessment of the core indicators of the result area 4.
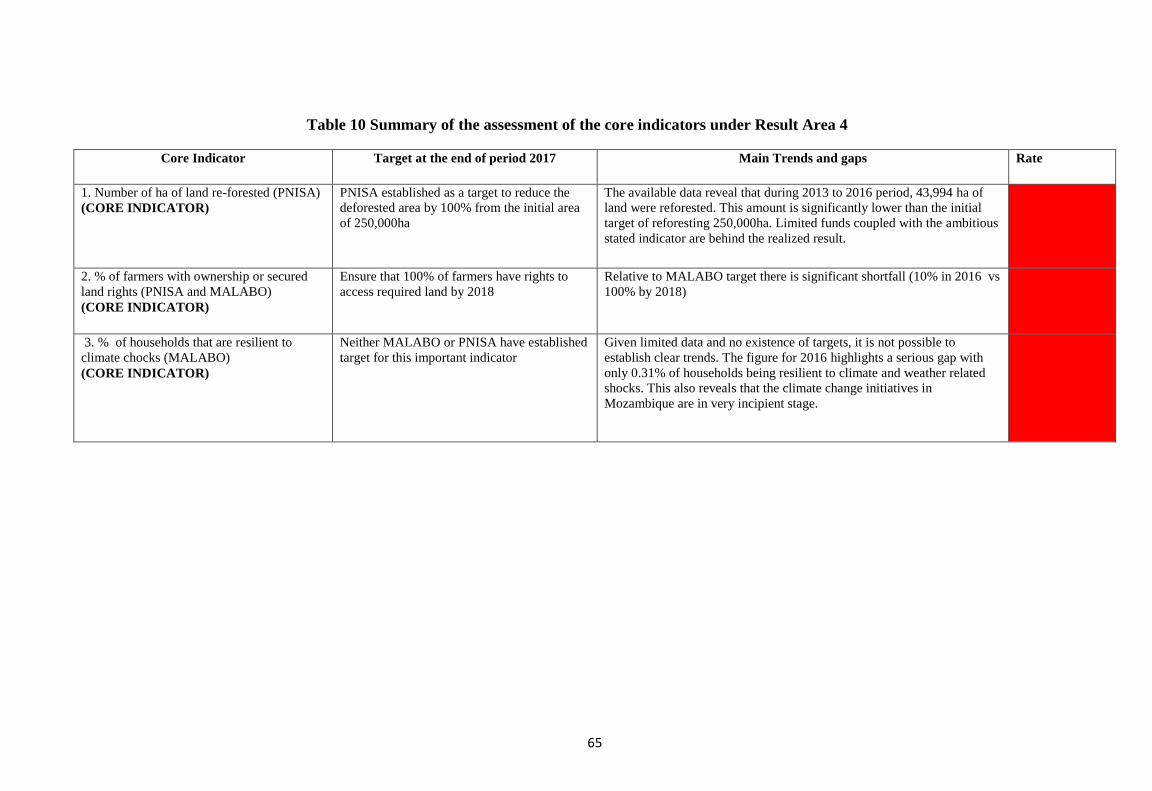
65
Table 10 Summary of the assessment of the core indicators under Result Area 4
Core Indicator Target at the end of period 2017 Main Trends and gaps Rate
1. Number of ha of land re-forested (PNISA)
(CORE INDICATOR)
PNISA established as a target to reduce the
deforested area by 100% from the initial area
of 250,000ha
The available data reveal that during 2013 to 2016 period, 43,994 ha of
land were reforested. This amount is significantly lower than the initial
target of reforesting 250,000ha. Limited funds coupled with the ambitious
stated indicator are behind the realized result.
2. % of farmers with ownership or secured
land rights (PNISA and MALABO)
(CORE INDICATOR)
Ensure that 100% of farmers have rights to
access required land by 2018
Relative to MALABO target there is significant shortfall (10% in 2016 vs
100% by 2018)
3. % of households that are resilient to
climate chocks (MALABO)
(CORE INDICATOR)
Neither MALABO or PNISA have established
target for this important indicator
Given limited data and no existence of targets, it is not possible to
establish clear trends. The figure for 2016 highlights a serious gap with
only 0.31% of households being resilient to climate and weather related
shocks. This also reveals that the climate change initiatives in
Mozambique are in very incipient stage.
66
3.7 Results Area 5: Strengthened and Reformed Institutions
The institutional reform and strengthening program is comprised of two programs: (i) institutional
Reform and (ii) Institutional Strengthening.
3.7.1 Institutional Reform Program
(i) Objectives and targets:
The objectives of the institutional reform program are to: (1) develop the organic statutes and internal
regulations of the MASA; (2) develop the career qualifications of the MASA in order to adapt them to
MASA functions and (3) develop staffing framework. The PNISA document did not establish the
indicators and the respective targets in order to achieve these objectives.
(ii) Main achievement and Results:
The organic statute of MASA was developed in 2016 being necessary to enhance it with the
development of the respective internal regulation. There are no specific career qualifications for
MASA and currently MASA is using the government carrier qualifications developed in 2010.
However, in 2017 MASA developed and approved the extension agent carrier qualifications.
Regarding staffing, no visible actions were done during the period from 2013 to 2016. It is important
to note that the government cut the recruitment of human resources in all government institutions
except for health and education at the end of 2015 due to financial crisis.
(iii) Key Gaps and Challenges:
The main gap limiting enhancement of institutional reforms is mainly the limited financial resources.
It should be noted that PNISA did not budget funds for the institutional reform program. The available
data also show that the institutional reform program was neglected in terms of fund allocation. The
approved budget to this program decreased drastically (98% decrease) from 379 million Meticais in
2013 to 9 million Meticais in 2014 and no funds were allocated for this program in 2015 and 2016.
This might be due to financial crisis faced by Mozambique which forced the government to cut budget
in different economic areas.
(iv) Priority and Recommendations:
(CR) The key recommendation is for MASA to develop strategy/roadmap aimed to mobilize funds for
implementing the activities aiming to enhance institutional reforms (e.g, such as the development of
internal regulations and staffing).
3.7.2 Institutional Strengthening Program
(i) Objectives and targets:
The objectives of institutional strengthening are to: (1) establish database for human resources
management in the MASA; (2) adopt mechanisms to link human resources with the right places and
functions; (3) define the profile of human resources and of the functions and powers of each of the
areas;(4) create a platform for information about training/capacity building needs, consistent with and
appropriate for the objectives of individual and the MASA development (5) deepen the foundations
for the creation and consolidation of the SIGEDAP; (6) improve the working conditions of MASA
employees and agents, which includes equipping the HR sector at all levels with office supplies and
equipment; (7) improve management processes to stimulate retention of qualified staff through (a)
design, implement and promote career path plans, (b) design and implement mechanisms to award the
best employees and work teams, (b) the implementation of the salary policy, and (e) the design of an
incentives policy for the sector and funding mechanisms; (8) strengthen the institutions for agricultural
education and associations of producers and farmers; (9) strengthening the institutional,
organizational and management capacity; and (10) operationalize the strategies for civil service cross
cutting issues such as HIV/AIDS, disability and gender.
The PNISA document did not establish indicators and the respective targets to assess the achievement
of these objectives.
The proposed indicator to monitor institutional strengthening include: (i) the percentage of public
agricultural expenditure as percent of total public expenditure, (ii) the ODA disbursed to agriculture as
percent of the commitments for the agricultural sector, (iii) the index and capacity to generate and use
agricultural statistical data and information (ASCI) and (iv) the index of inclusive institutionalized
67
mechanisms for mutual accountability and peer review. The CAADP through the Maputo Declaration
stipulate 10% government budget devoted to agriculture. The MALABO target is 100% of ODA
disbursed annually from 2015 to 2025. The MALOBO target is also to reach at least 63% of the index
and capacity to generate and use agricultural statistical data and information by 2025. Finally, the
MALABO target is to reach 100% of institutionalized mechanisms and platforms for mutual
accountability and peer review.
(ii) Main achievements and Results:
Although the absence of specific indicators and targets, there is no evidence related to the
achievement of the first set of objectives (objectives 1 to 10 above). The SIGADAP is being
implemented and so far is mainly covering management staff. The MASA is using the government
HIV strategic plan and the MASA gender strategy (2005-2015) is out of date and currently the MASA
is drafting the new gender strategy (2015-2019).
For the proposed set of indicators, agricultural expenditure data show that the PNISA has made
relatively good progress towards the 10% expenditure target, although there has been variation during
this period (6.5% in 2013, 9.8%in 2014, 6.5% in 2015 and 7.2% in 2016). The reported ODA
disbursement rate for 2015 is drastically low (38.4%) compared to its 100% target. Despite the index
and capacity to generate and use agricultural statistical data and information was reported by MASA
(2017) at 70% in 2015 and thereby exceeding the MALABO target, there is a need of re-assessing this
index given that there is general weakness of agricultural database and the components of this index
(eg. infrastructures for data analysis processing) and capacity for analysis. Additionally, the MASA
has generated many strategies and action plans to support the development of agricultural sector,
which are not been fully and effectively utilized due to several factors, including weak accountability
for achieving results; the absence of functional M&E system for PNISA; limited capacity of the staff
at various levels. Furthermore, the MASA continues to experience high level of staff turnover for
various reasons, which limits its capacity for analyzing and utilizing evidence based information.
The MASA (2017) reports the rate of 69.4% for the index of inclusive institutionalized mechanisms
for mutual accountability and peer review, which seems to be high taking into account the notified
limited coordination to implement PNISA during this Midterm evaluation. It is important to state that
the majority (90%) of stakeholders at provincial level are not aware of PNISA and this limitation is
hampering the effective and efficient implementation of PNISA.
(iii) Key Gaps and Challenges:
The implementation of PNISA requires effective and efficient coordination among the agricultural
sector stakeholders. However, there is no evidence of effective and efficient coordination. PNISA
calls for the establishment of the Comité de Coordenação do Sector Agrário (CCSA) to improve
coordination among involved stakeholders. It was theoretically established with the development of its
terms of reference. This coordinating body was supposed to meet twice a year but since its
establishment, it met once in May, 2017. The CCSA was supposed to be managed by its secretariat
but it has not yet been officially established. The coordination limitation is coupled by the absence of
accountability mechanisms to be applied to the different stakeholders and within the MASA structures
at all levels.
Furthermore, the turnover of the key MASA professional staff is limiting the continuations of
effective and efficient implementation of PNISA. This might be due to the lack of incentive policy for
retaining qualified human resources. Although the allocated financial resources were above the
budgeted funds in 2013, 2014 and 2015, there was shortfall of 89% in 2016 (Figure 37). The surplus
of funds from 2013 to 2015 should have helped to strengthen MASA and its stakeholders at all levels.
However, the presented results above reveal limiting achievements in the majority of the indicators
under this program. Limited allocation of resources (value of money) might be behind the limited
performance of this program.
Finally, given that PNISA requires the active and accountable engagement of several central
government ministries and Provincial governments, relying on MASA to mobilize and enforce this
active inter-ministerial/governmental engagement is very challenging.
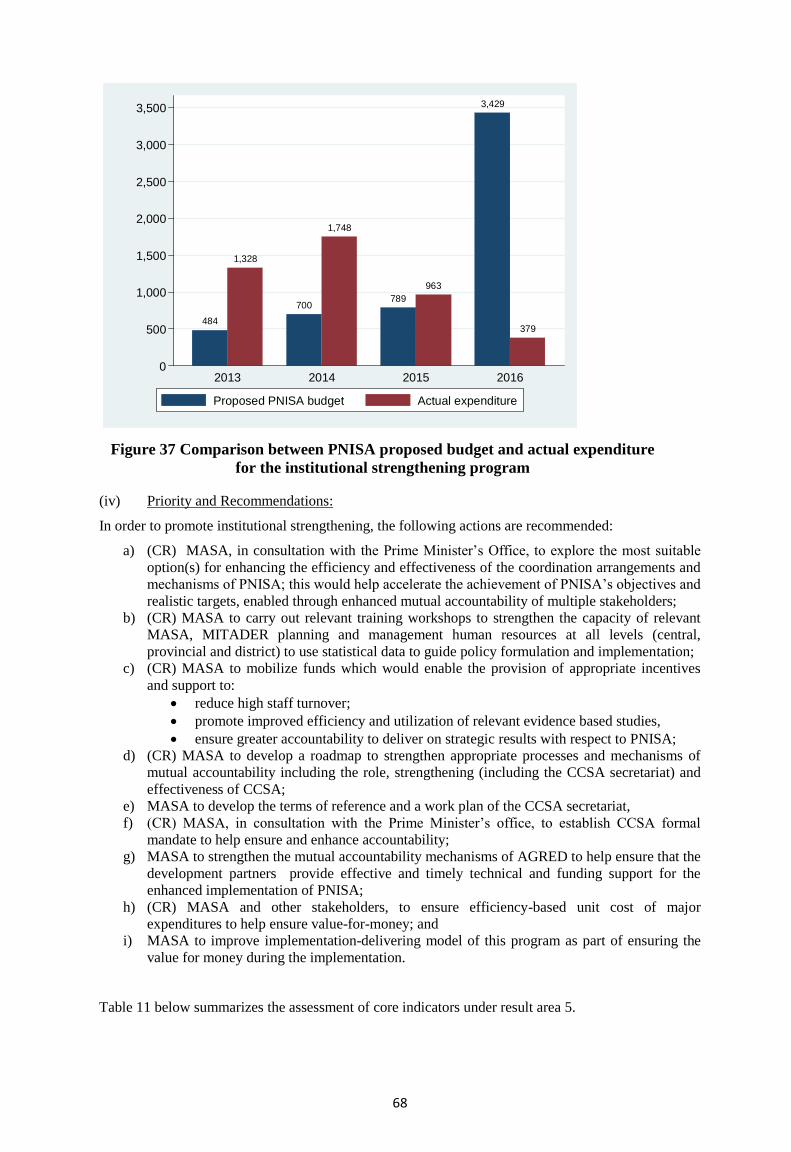
68
484
1,328
700
1,748
789
963
3,429
379
0
500
1,000
1,500
2,000
2,500
3,000
3,500
MZ
N (
mill
ion)
2013 2014 2015 2016
Proposed PNISA budget Actual expenditure
Figure 37 Comparison between PNISA proposed budget and actual expenditure
for the institutional strengthening program
(iv) Priority and Recommendations:
In order to promote institutional strengthening, the following actions are recommended:
a) (CR) MASA, in consultation with the Prime Minister’s Office, to explore the most suitable
option(s) for enhancing the efficiency and effectiveness of the coordination arrangements and
mechanisms of PNISA; this would help accelerate the achievement of PNISA’s objectives and
realistic targets, enabled through enhanced mutual accountability of multiple stakeholders;
b) (CR) MASA to carry out relevant training workshops to strengthen the capacity of relevant
MASA, MITADER planning and management human resources at all levels (central,
provincial and district) to use statistical data to guide policy formulation and implementation;
c) (CR) MASA to mobilize funds which would enable the provision of appropriate incentives
and support to:
reduce high staff turnover;
promote improved efficiency and utilization of relevant evidence based studies,
ensure greater accountability to deliver on strategic results with respect to PNISA;
d) (CR) MASA to develop a roadmap to strengthen appropriate processes and mechanisms of
mutual accountability including the role, strengthening (including the CCSA secretariat) and
effectiveness of CCSA;
e) MASA to develop the terms of reference and a work plan of the CCSA secretariat,
f) (CR) MASA, in consultation with the Prime Minister’s office, to establish CCSA formal
mandate to help ensure and enhance accountability;
g) MASA to strengthen the mutual accountability mechanisms of AGRED to help ensure that the
development partners provide effective and timely technical and funding support for the
enhanced implementation of PNISA;
h) (CR) MASA and other stakeholders, to ensure efficiency-based unit cost of major
expenditures to help ensure value-for-money; and
i) MASA to improve implementation-delivering model of this program as part of ensuring the
value for money during the implementation.
Table 11 below summarizes the assessment of core indicators under result area 5.
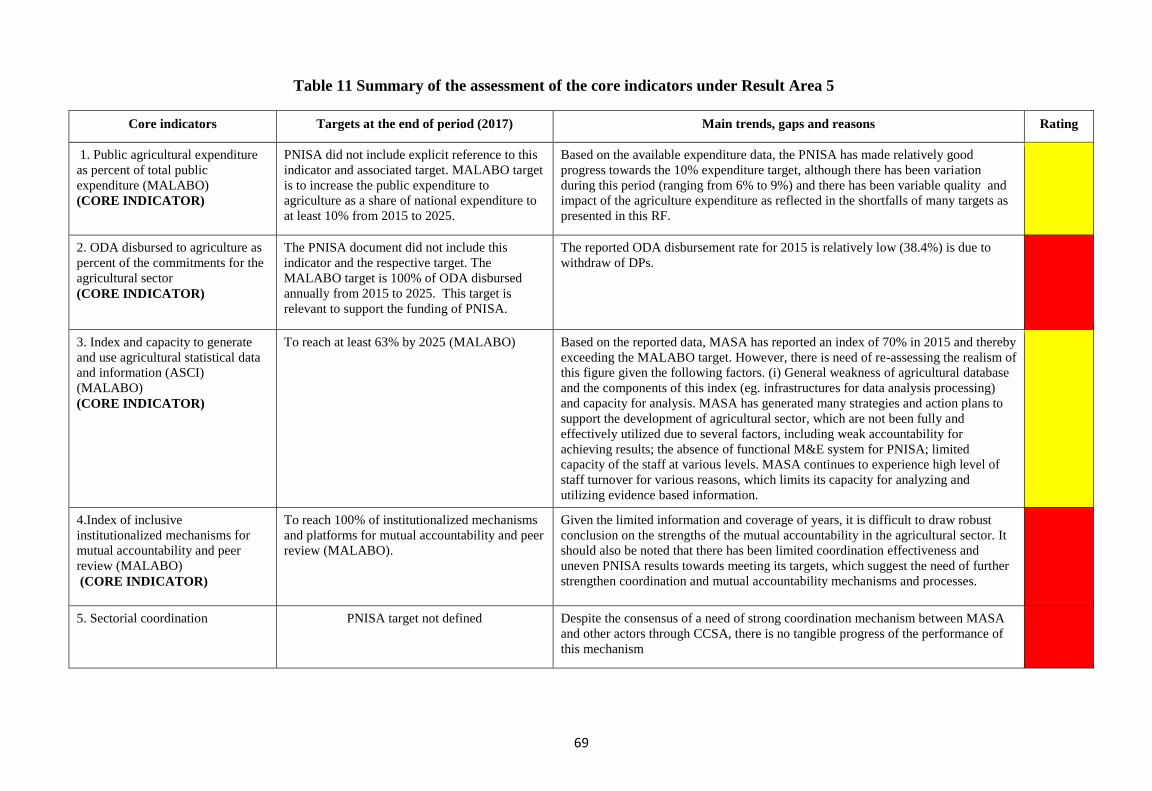
69
Table 11 Summary of the assessment of the core indicators under Result Area 5
Core indicators Targets at the end of period (2017) Main trends, gaps and reasons Rating
1. Public agricultural expenditure
as percent of total public
expenditure (MALABO)
(CORE INDICATOR)
PNISA did not include explicit reference to this
indicator and associated target. MALABO target
is to increase the public expenditure to
agriculture as a share of national expenditure to
at least 10% from 2015 to 2025.
Based on the available expenditure data, the PNISA has made relatively good
progress towards the 10% expenditure target, although there has been variation
during this period (ranging from 6% to 9%) and there has been variable quality and
impact of the agriculture expenditure as reflected in the shortfalls of many targets as
presented in this RF.
2. ODA disbursed to agriculture as
percent of the commitments for the
agricultural sector
(CORE INDICATOR)
The PNISA document did not include this
indicator and the respective target. The
MALABO target is 100% of ODA disbursed
annually from 2015 to 2025. This target is
relevant to support the funding of PNISA.
The reported ODA disbursement rate for 2015 is relatively low (38.4%) is due to
withdraw of DPs.
3. Index and capacity to generate
and use agricultural statistical data
and information (ASCI)
(MALABO)
(CORE INDICATOR)
To reach at least 63% by 2025 (MALABO) Based on the reported data, MASA has reported an index of 70% in 2015 and thereby
exceeding the MALABO target. However, there is need of re-assessing the realism of
this figure given the following factors. (i) General weakness of agricultural database
and the components of this index (eg. infrastructures for data analysis processing)
and capacity for analysis. MASA has generated many strategies and action plans to
support the development of agricultural sector, which are not been fully and
effectively utilized due to several factors, including weak accountability for
achieving results; the absence of functional M&E system for PNISA; limited
capacity of the staff at various levels. MASA continues to experience high level of
staff turnover for various reasons, which limits its capacity for analyzing and
utilizing evidence based information.
4.Index of inclusive
institutionalized mechanisms for
mutual accountability and peer
review (MALABO)
(CORE INDICATOR)
To reach 100% of institutionalized mechanisms
and platforms for mutual accountability and peer
review (MALABO).
Given the limited information and coverage of years, it is difficult to draw robust
conclusion on the strengths of the mutual accountability in the agricultural sector. It
should also be noted that there has been limited coordination effectiveness and
uneven PNISA results towards meeting its targets, which suggest the need of further
strengthen coordination and mutual accountability mechanisms and processes.
5. Sectorial coordination PNISA target not defined Despite the consensus of a need of strong coordination mechanism between MASA
and other actors through CCSA, there is no tangible progress of the performance of
this mechanism
70
3.8 Cross Cutting Themes
3.8.1 Decentralization
(i) Objectives and Targets:
As part of Government’s broader policy on decentralization, PNISA aims to expand and strengthen
the role and effectiveness of Provincial and District stakeholders in the implementation of PNISA and
its M&E.13
(ii) Main Achievements/Results and Challenges:
In general, there is a consistent pattern of increasing role and commitment by Provincial and district
stakeholders, including government authorities, to promote agricultural development in their
respective geographical areas. However, Provinces and District Governments are facing financial
constraints give competing demands for limited funds, and therefore require additional financial and
technical support to implement new initiatives, such as PNISA. At the same time, the assessment
revealed that at the provincial and district levels there is limited knowledge of PNISA and its targets,
and there is negligible additional funding provided to the Provinces to directly support the
implementation of the PNISA programs. Moreover, the severe funding constraints of PNISA (as cited
below) did not allow the allocation of funds directly to the Provinces. Therefore, given the severe
funding constraints at both national and provincial levels, the agricultural annual work plans and
budgetary proposals at the provincial and district levels have not been linked to or associated with
implementing PNISA programs to achieve its specific targets. Accordingly, the agricultural programs
being implemented at the Provincial and district level reflect their normal on-going agricultural
activities, without making explicit linkages toward achieving the PNISA targets.
In addition, the Provinces are facing staffing constraints, especially at the professional level, to
improve their budgetary planning processes, efficient and effective implementation of all of their
programs/activities, and weak M&E systems. Without explicit strengthening and funding of Provinces
and districts, coupled with limited socialization of PNISA and negligible technical engagement
regarding PNISA programs/targets (from MASA) at the Provincial and district levels, it is unrealistic
to expect them to contribute to the delivery of PNISA targets.
(iii) Priority Recommendations:
a) (CR) MASA to carry out as soon as possible a socialization initiative of PNISA, as part of
the annual budgetary planning processes and cycle, to ensure the Provinces are familiar with
PNISA programs and their targets, and their important role in supporting implementation.
b) (CR) MASA should provide technical and financial support to the Provinces during the
annual budgetary planning and implementation cycle, including M&E, to ensure improved
capacities to support implementation of PNISA programs and meeting of its targets;
c) (CR) MASA to help ensure the Provincial agricultural officers include relevant PNISA
indicators and targets in the Provincial and District work plans/budgets and M&E system,
thereby helping to focus implementation efforts in contributing to relevant PNISA targets.
This support should form part of the external technical support proposed to strengthen
MASA’s M&E system;
d) (CR) MASA to provide additional funding to Provinces for supporting the implementation
of relevant PNISA programs, through an appropriate funding mechanism (e.g., earmarking,
“matching funds mechanism”). This assumes that MASA will carry out a resource
mobilization initiative to increase funding for PNISA, of which a portion of the additional
funds mobilized could support Provincial funding for PNISA.
3.8.2 Gender and Youth
In summary, the PNISA document did not provide an operational strategy and actions for addressing
gender and youth challenges. Also, during implementation, there were not explicit interventions
supported, aside from those activities supported in the regular on-going programs. Accordingly, it is
13 It is understood that PNISA implementation will require the participation of both Provincial and district
authorities. However, MASA focuses its dialogue and support through Provincial governments, which in turn,
provide support to their member districts. Therefore, it is understood that references to Provinces also include
the engagement of districts.
71
recommended that the MASA promote and mainstream a more explicit strategy and actions on gender
and youth development in rural areas to be supported by relevant central government ministries and
provincial and district entities, in collaboration with other stakeholders.
3.8.3 Monitoring and Evaluation System
i) Objective:
The Monitoring and Evaluation (M&E) of the PNISA aims to provide information to address
problems and solve constraints, and also to help ensure accountability and transparency in the use of
funds channeled towards investment. The M&E system was expected to be executed at different levels
to maintain its focus and direction.
ii) Main Achievements and Gaps/Challenges:
MASA has been doing a good job in monitoring the implementation of the PQG through the PES
M&E system. MASA also took initiative to develop the first list of indicators, but these s efforts did
not materialize into an operational M&E system. As a result, MASA has relied on using its existing
monitoring system to meet its internal and external requirements, especially with respect to meeting
the PES requirements. Accordingly, MASA has not been able to track and assess systematically the
progress, performance and results, especially at outcome and impact levels, of PNISA’s specific
programs and targets. In addition, these constraints also have affected MASA’s capacity to track
systematically the MALABO targets for Mozambique. Accordingly, these constraints also have
weakened mutual accountability of PNISA at various levels, involving diverse stakeholders.
These shortcomings are due to a combination of factors, including: (a) absence of a detailed
operational design of PNISA’s M&E system, from the outset;(b) inadequate human resources and
capacities (numbers of professional staff and skills/experience); (c) negligible funding to generate
required data to track key indicators, especially at outcome and impact levels; (d) weak linkages with
Provincial M&E systems and other CCSA stakeholders.
iii) Priority Recommendations:
a) (CR) MASA to develop a sound, integrated and operational M&E system for PNISA,14
building on the reconstructed results framework developed to support the PNISA MTR, in
order to meet the various reporting requirements for the agricultural sector (e.g., PES,
PNISA, MALABO, others, as relevant). Accordingly, there is a need to focus on a limited
list of strategic indicators to meet the essential reporting requirements. Also, this improved
M&E system will support an enhanced annual budgetary planning and implementation
cycle, with a result orientation;
b) (CR) MASA to develop an action plan and to mobilize the required funding for generating,
disseminating, accessing, and utilizing reliable and timely data/findings to support the
enhanced PNISA M&E system, and the priority indicators;
c) (CR) MASA to enhance a dedicated M&E team (in terms of numbers and skills) for
carrying out effectively the enhanced PNISA/sector M&E system, supported by appropriate
technical assistance which would provide capacity development and technical
accompaniment, at both MASA and Provincial levels;
d) (CR) MASA, with the support of the AGRED, to ensure regular assessments and follow-
up, including: (i) the carrying out of a Joint Sector Review on an annual basis to focus on
assessing PNISA performance and results, based on clear TOR; (ii) adequate funding and
technical support to generate a quality JSR report, which can help support the efficient and
effective implementation of PNISA; (iii) systematic follow up of agreed actions, as part of
the mutual accountability principle involving the relevant stakeholders;
e) (CR) the CCSA needs to take an active role in demanding the M&E information, including
the JSR findings and recommendations, as input for their guidance and decision-making
role in supporting more effective coordination, implementation and mutual accountability of
PNISA;
14 There is a need to ensure an integrated, unified and sustainable M&E system, and therefore to avoid creating
parallel M&E systems driven by different programs.
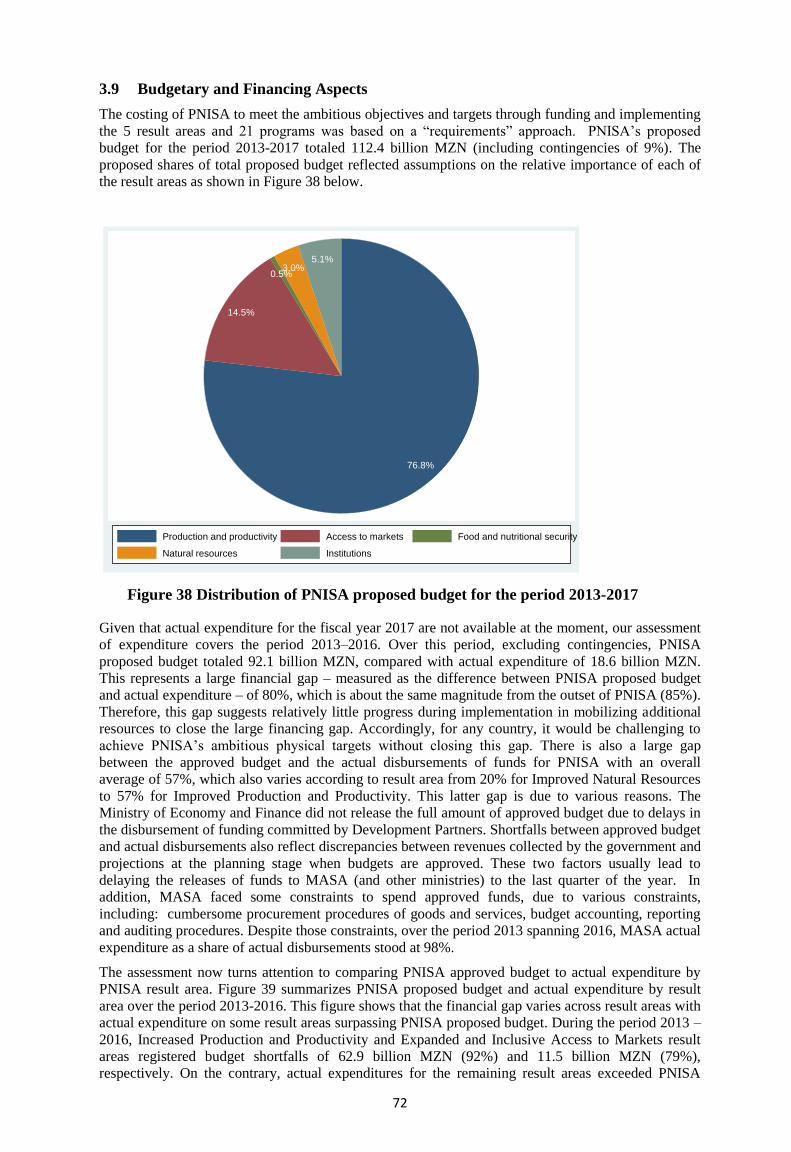
72
3.9 Budgetary and Financing Aspects
The costing of PNISA to meet the ambitious objectives and targets through funding and implementing
the 5 result areas and 21 programs was based on a “requirements” approach. PNISA’s proposed
budget for the period 2013-2017 totaled 112.4 billion MZN (including contingencies of 9%). The
proposed shares of total proposed budget reflected assumptions on the relative importance of each of
the result areas as shown in Figure 38 below.
76.8%
14.5%
0.5%3.0%
5.1%
Production and productivity Access to markets Food and nutritional security
Natural resources Institutions
Figure 38 Distribution of PNISA proposed budget for the period 2013-2017
Given that actual expenditure for the fiscal year 2017 are not available at the moment, our assessment
of expenditure covers the period 2013–2016. Over this period, excluding contingencies, PNISA
proposed budget totaled 92.1 billion MZN, compared with actual expenditure of 18.6 billion MZN.
This represents a large financial gap – measured as the difference between PNISA proposed budget
and actual expenditure – of 80%, which is about the same magnitude from the outset of PNISA (85%).
Therefore, this gap suggests relatively little progress during implementation in mobilizing additional
resources to close the large financing gap. Accordingly, for any country, it would be challenging to
achieve PNISA’s ambitious physical targets without closing this gap. There is also a large gap
between the approved budget and the actual disbursements of funds for PNISA with an overall
average of 57%, which also varies according to result area from 20% for Improved Natural Resources
to 57% for Improved Production and Productivity. This latter gap is due to various reasons. The
Ministry of Economy and Finance did not release the full amount of approved budget due to delays in
the disbursement of funding committed by Development Partners. Shortfalls between approved budget
and actual disbursements also reflect discrepancies between revenues collected by the government and
projections at the planning stage when budgets are approved. These two factors usually lead to
delaying the releases of funds to MASA (and other ministries) to the last quarter of the year. In
addition, MASA faced some constraints to spend approved funds, due to various constraints,
including: cumbersome procurement procedures of goods and services, budget accounting, reporting
and auditing procedures. Despite those constraints, over the period 2013 spanning 2016, MASA actual
expenditure as a share of actual disbursements stood at 98%.
The assessment now turns attention to comparing PNISA approved budget to actual expenditure by
PNISA result area. Figure 39 summarizes PNISA proposed budget and actual expenditure by result
area over the period 2013-2016. This figure shows that the financial gap varies across result areas with
actual expenditure on some result areas surpassing PNISA proposed budget. During the period 2013 –
2016, Increased Production and Productivity and Expanded and Inclusive Access to Markets result
areas registered budget shortfalls of 62.9 billion MZN (92%) and 11.5 billion MZN (79%),
respectively. On the contrary, actual expenditures for the remaining result areas exceeded PNISA
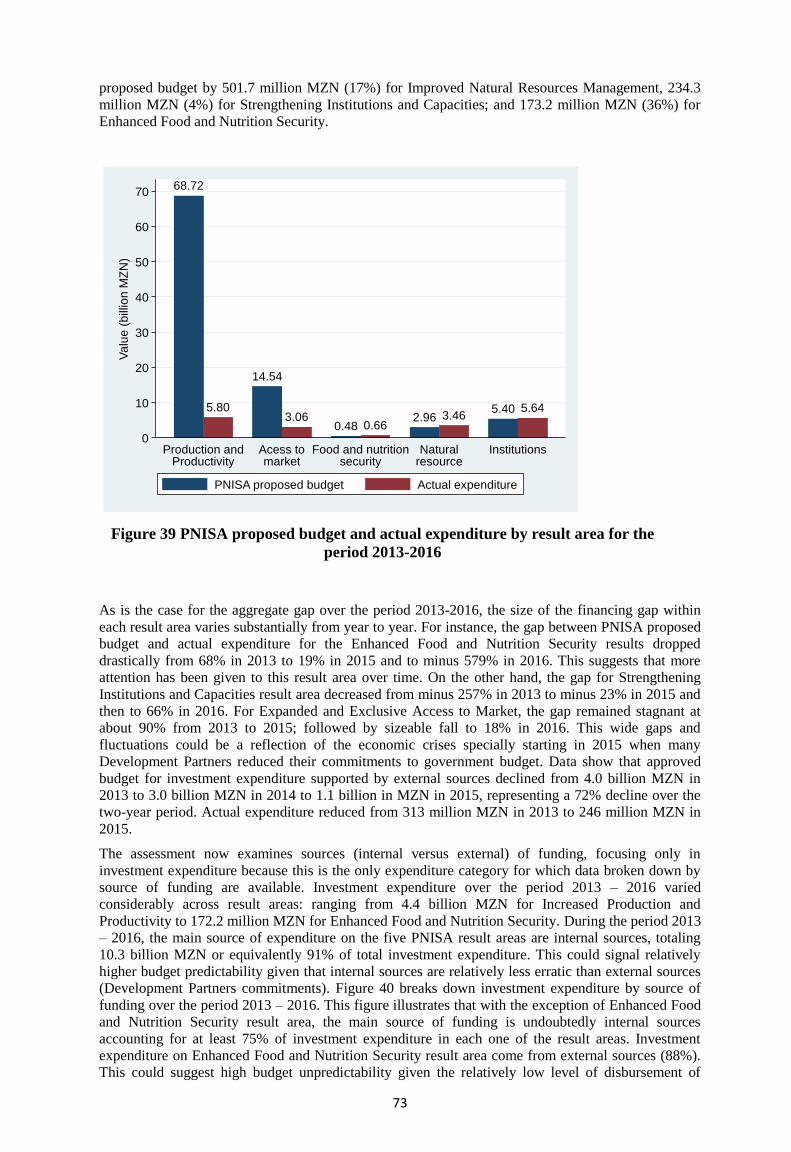
73
proposed budget by 501.7 million MZN (17%) for Improved Natural Resources Management, 234.3
million MZN (4%) for Strengthening Institutions and Capacities; and 173.2 million MZN (36%) for
Enhanced Food and Nutrition Security.
68.72
5.80
14.54
3.060.48 0.66
2.96 3.465.40 5.64
0
10
20
30
40
50
60
70
Va
lue
(b
illio
n M
ZN
)
Production andProductivity
Acess tomarket
Food and nutritionsecurity
Naturalresource
Institutions
PNISA proposed budget Actual expenditure
Figure 39 PNISA proposed budget and actual expenditure by result area for the
period 2013-2016
As is the case for the aggregate gap over the period 2013-2016, the size of the financing gap within
each result area varies substantially from year to year. For instance, the gap between PNISA proposed
budget and actual expenditure for the Enhanced Food and Nutrition Security results dropped
drastically from 68% in 2013 to 19% in 2015 and to minus 579% in 2016. This suggests that more
attention has been given to this result area over time. On the other hand, the gap for Strengthening
Institutions and Capacities result area decreased from minus 257% in 2013 to minus 23% in 2015 and
then to 66% in 2016. For Expanded and Exclusive Access to Market, the gap remained stagnant at
about 90% from 2013 to 2015; followed by sizeable fall to 18% in 2016. This wide gaps and
fluctuations could be a reflection of the economic crises specially starting in 2015 when many
Development Partners reduced their commitments to government budget. Data show that approved
budget for investment expenditure supported by external sources declined from 4.0 billion MZN in
2013 to 3.0 billion MZN in 2014 to 1.1 billion in MZN in 2015, representing a 72% decline over the
two-year period. Actual expenditure reduced from 313 million MZN in 2013 to 246 million MZN in
2015.
The assessment now examines sources (internal versus external) of funding, focusing only in
investment expenditure because this is the only expenditure category for which data broken down by
source of funding are available. Investment expenditure over the period 2013 – 2016 varied
considerably across result areas: ranging from 4.4 billion MZN for Increased Production and
Productivity to 172.2 million MZN for Enhanced Food and Nutrition Security. During the period 2013
– 2016, the main source of expenditure on the five PNISA result areas are internal sources, totaling
10.3 billion MZN or equivalently 91% of total investment expenditure. This could signal relatively
higher budget predictability given that internal sources are relatively less erratic than external sources
(Development Partners commitments). Figure 40 breaks down investment expenditure by source of
funding over the period 2013 – 2016. This figure illustrates that with the exception of Enhanced Food
and Nutrition Security result area, the main source of funding is undoubtedly internal sources
accounting for at least 75% of investment expenditure in each one of the result areas. Investment
expenditure on Enhanced Food and Nutrition Security result area come from external sources (88%).
This could suggest high budget unpredictability given the relatively low level of disbursement of
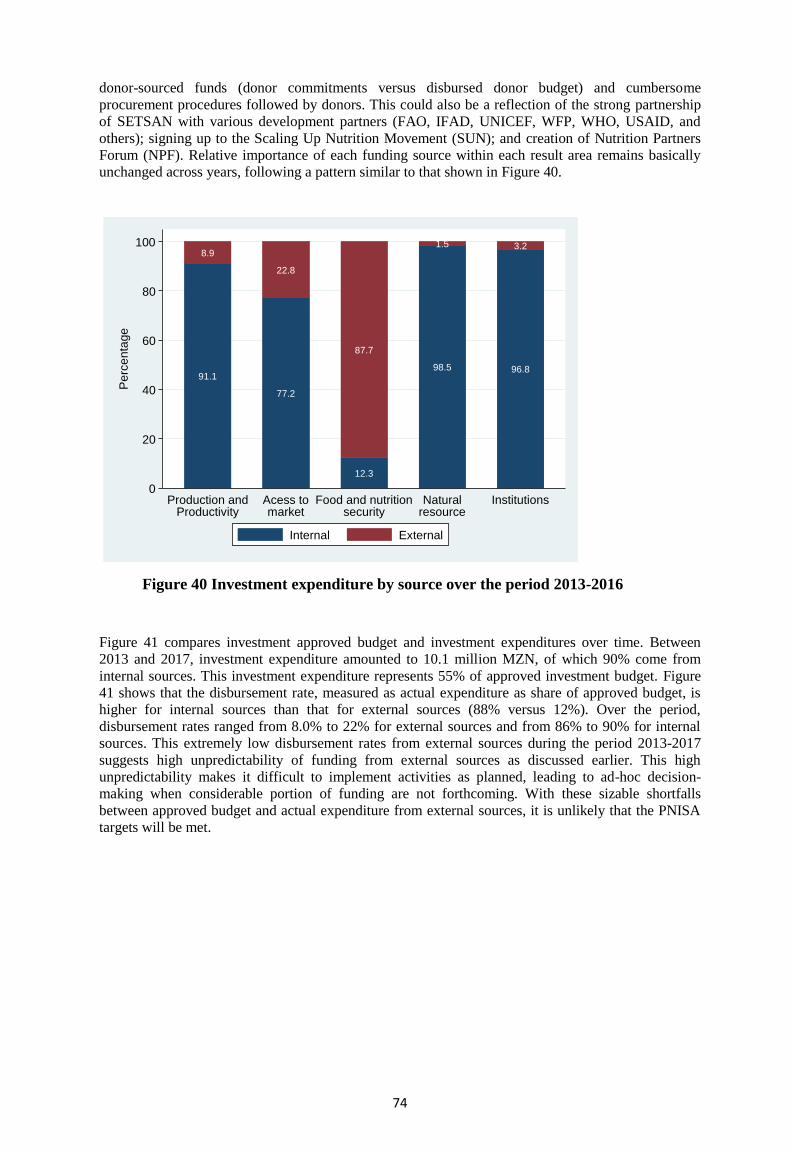
74
donor-sourced funds (donor commitments versus disbursed donor budget) and cumbersome
procurement procedures followed by donors. This could also be a reflection of the strong partnership
of SETSAN with various development partners (FAO, IFAD, UNICEF, WFP, WHO, USAID, and
others); signing up to the Scaling Up Nutrition Movement (SUN); and creation of Nutrition Partners
Forum (NPF). Relative importance of each funding source within each result area remains basically
unchanged across years, following a pattern similar to that shown in Figure 40.
91.1
8.9
77.2
22.8
12.3
87.7
98.5
1.5
96.8
3.2
0
20
40
60
80
100
Pe
rce
nta
ge
Production andProductivity
Acess tomarket
Food and nutritionsecurity
Naturalresource
Institutions
Internal External
Figure 40 Investment expenditure by source over the period 2013-2016
Figure 41 compares investment approved budget and investment expenditures over time. Between
2013 and 2017, investment expenditure amounted to 10.1 million MZN, of which 90% come from
internal sources. This investment expenditure represents 55% of approved investment budget. Figure
41 shows that the disbursement rate, measured as actual expenditure as share of approved budget, is
higher for internal sources than that for external sources (88% versus 12%). Over the period,
disbursement rates ranged from 8.0% to 22% for external sources and from 86% to 90% for internal
sources. This extremely low disbursement rates from external sources during the period 2013-2017
suggests high unpredictability of funding from external sources as discussed earlier. This high
unpredictability makes it difficult to implement activities as planned, leading to ad-hoc decision-
making when considerable portion of funding are not forthcoming. With these sizable shortfalls
between approved budget and actual expenditure from external sources, it is unlikely that the PNISA
targets will be met.
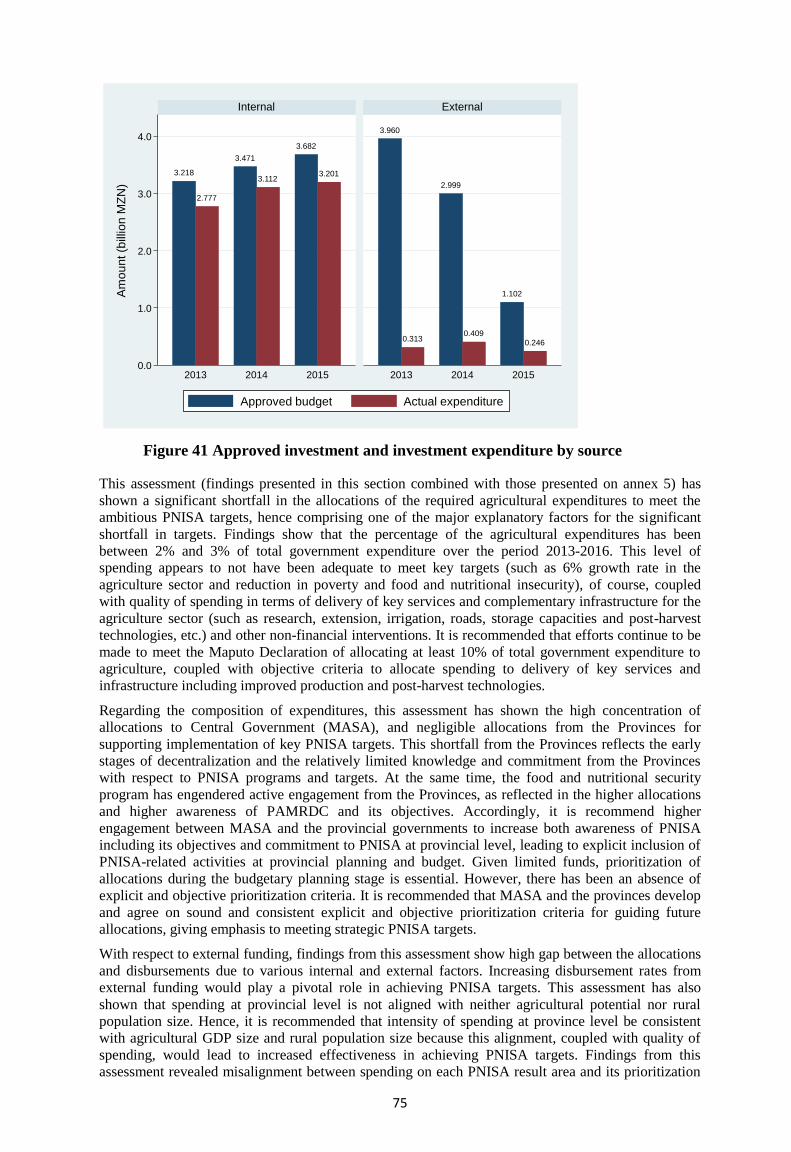
75
3.218
2.777
3.471
3.112
3.682
3.201
3.960
0.313
2.999
0.409
1.102
0.246
0.0
1.0
2.0
3.0
4.0
2013 2014 2015 2013 2014 2015
Internal External
Approved budget Actual expenditure
Am
ou
nt (b
illio
n M
ZN
)
Figure 41 Approved investment and investment expenditure by source
This assessment (findings presented in this section combined with those presented on annex 5) has
shown a significant shortfall in the allocations of the required agricultural expenditures to meet the
ambitious PNISA targets, hence comprising one of the major explanatory factors for the significant
shortfall in targets. Findings show that the percentage of the agricultural expenditures has been
between 2% and 3% of total government expenditure over the period 2013-2016. This level of
spending appears to not have been adequate to meet key targets (such as 6% growth rate in the
agriculture sector and reduction in poverty and food and nutritional insecurity), of course, coupled
with quality of spending in terms of delivery of key services and complementary infrastructure for the
agriculture sector (such as research, extension, irrigation, roads, storage capacities and post-harvest
technologies, etc.) and other non-financial interventions. It is recommended that efforts continue to be
made to meet the Maputo Declaration of allocating at least 10% of total government expenditure to
agriculture, coupled with objective criteria to allocate spending to delivery of key services and
infrastructure including improved production and post-harvest technologies.
Regarding the composition of expenditures, this assessment has shown the high concentration of
allocations to Central Government (MASA), and negligible allocations from the Provinces for
supporting implementation of key PNISA targets. This shortfall from the Provinces reflects the early
stages of decentralization and the relatively limited knowledge and commitment from the Provinces
with respect to PNISA programs and targets. At the same time, the food and nutritional security
program has engendered active engagement from the Provinces, as reflected in the higher allocations
and higher awareness of PAMRDC and its objectives. Accordingly, it is recommend higher
engagement between MASA and the provincial governments to increase both awareness of PNISA
including its objectives and commitment to PNISA at provincial level, leading to explicit inclusion of
PNISA-related activities at provincial planning and budget. Given limited funds, prioritization of
allocations during the budgetary planning stage is essential. However, there has been an absence of
explicit and objective prioritization criteria. It is recommended that MASA and the provinces develop
and agree on sound and consistent explicit and objective prioritization criteria for guiding future
allocations, giving emphasis to meeting strategic PNISA targets.
With respect to external funding, findings from this assessment show high gap between the allocations
and disbursements due to various internal and external factors. Increasing disbursement rates from
external funding would play a pivotal role in achieving PNISA targets. This assessment has also
shown that spending at provincial level is not aligned with neither agricultural potential nor rural
population size. Hence, it is recommended that intensity of spending at province level be consistent
with agricultural GDP size and rural population size because this alignment, coupled with quality of
spending, would lead to increased effectiveness in achieving PNISA targets. Findings from this
assessment revealed misalignment between spending on each PNISA result area and its prioritization
76
based on PNISA proposed budget. Hence, it is recommended that MASA budget be structured
according to PNISA result areas and programs.
Priority Recommendations:
(1) Enhanced Expenditure Quality/Efficiency and Results: MASA and Provinces, in collaboration
with the Ministry of Planning and Finance, to enhance key qualitative aspects of the
budgetary/financing efficiencies, processes and of budgetary allocations for PNISA, including
(building on the recommendations of the recent sector studies and the JSR for 2017):
(i) Prioritization Criteria: adoption and application of enhanced prioritization criteria for the
allocation of public funds as part of the medium and annual budgetary planning for PNISA, especially
in the light of severe budgetary/financing constraints, including:
a) Core Drivers: Programs/interventions which comprise “core drivers of agricultural
transformation”, and are strongly aligned with and contribute to strategic targets of the PQG and
PEDSA;
b) Numbers of Direct Beneficiaries: Programs which benefit large numbers of beneficiaries, with
special focus on smallholders, and the scope of benefits (and unit cost);
c) Viability: Programs which demonstrate attractive financial returns and enhanced incomes to
smallholders and sound economic viability, especially with respect to lumpy investments and key
services (e.g., irrigation, rural roads, technology development and dissemination);
d) Balance: Enhanced “balance” of allocations between the PNISA result areas and
programs, and between capital and recurrent expenditures, especially some which are severely
underfunded and contribute to strategic targets (e.g., food security and nutrition, technology);
e) Subsidies: Rationalization and phasing out of subsidies for “private” goods and services,
based on an assessment and action plan (involving seeds, fertilizers, tractor services)
(ii) Budgetary Execution/Gaps: formulate an action plan which will help reduce the identified
gaps between the budgetary approvals, releases and expenditures, including the delayed releases of
funds in the fourth quarter;
(2) Development Partner’s Improved Efficiencies and Updated Allocations: Development
partners, in close consultation with MASA and MEF;
(i) To identify and take the appropriate actions to expedite disbursements of approved funds to
support the timely implementation of agreed programs/activities;
(ii) Where relevant, the DPs may wish to re-allocate approved funds for on-going
programs/projects, in line with the enhanced expenditure priorities;
(3) Closing Financing Gaps: MASA, in collaboration with the MEF and development partners, to
formulate and implement a strategy and action plan to close PNISA’s financing/budgetary gap for
FY18 – FY 20 (including upward adjustment of budgetary ceilings, for both central and provincial
entities); these required increases also would be in line with the MALABO 10% agricultural
expenditure target;
(4) Updated Costs and Key Targets: MASA, in close collaboration with the MEF, to update the:
(i) costs of PNISA, based on actual expenditures/budgetary approvals (2013 – 2017), and likely
financing for FY18 – 20, and generate 3 financing scenarios (high, medium and low, with the “low”
scenario reflecting the current situation and funding trends); (ii) key targets for priority programs. This
updating should reflect the results of the above relevant items (including subsidies of private goods
and services);
It is understood that the results of the resource mobilization strategy/action plan will help adjust the
most likely financing scenario and updated targets.
3.10 Emerging Strategic Lessons
This MTR for PNISA has generated eight important operational lessons which reflect the
Mozambican version of many of the common lessons arising from the design and implementation of
77
many NAIPs in other Sub-Saharan Africa countries (see Chapter 1, and Annex 4). These
Mozambican-specific constructive lessons arise from the assessment of the 21 programs; these lessons
highlight the importance of addressing effectively key design and implementation features, with the
aim of achieving the envisioned results (or lack thereof). Further details, including implied “negative
lessons” which have generated these constructive lessons are reflected in the above detailed
assessment.
1) Sound Design and Scenario Planning: Ensuring the generation and use of adequate and updated
analytical work to underpin design and implementation strategy, preferably using relevant sector
planning tools (e.g., an agricultural sector-wide model, disaggregated by major type of farmer
households, using several scenarios (high, medium, and low), to take into account uncertain funding
availabilities, and to ensure consistency between proposed targets and actual funding; guided by a
sound theory of change, and supporting results chain and results framework, underpinned by an
updated sector diagnostic assessment;
2) Consistent/coherent Targets, Actual Funding and Budgetary Cycle: Use evidenced-based and
achievable targets, consistent with likely funding availabilities specified in medium and annual
budgetary allocations and work plans (at central government and provincial/district government
levels). To the extent funding does not materialize at various levels, ensure the relevant program
targets and annual work plans of relevant entities (central and provincial levels) are adjusted
downwards to ensure realism, while ensuring the application of sound prioritization criteria for
determining the most appropriate composition of investments to be funded, as part of the annual
budgetary cycle;
3) Sound Policy and Institutional Environment and Roles: From the outset of the program, ensure
sound, updated and socialized sector policies/regulations (e.g., seeds, fertilizer, finance, farm-level
services) and institutional roles of the public and private sectors and their respective institutions. This
clarity upfront will help minimize overlaps, and misallocation of public funds for functions to be
carried out by an expanded and inclusive private sector;
4) Expanded Inclusive Private Sector Role: Show explicit role and support for an expanded and
inclusive private sector role (including women and youth), in input and output markets, especially to
promote competitive value chain development; and engage private sector dialogue in early phase and
on continuous basis, at various levels (national and provincial). This should include strengthening
farmer organizations and effective models for enabling efficient and effective access to inputs,
outputs, and to engage directly in value chain development opportunities;
5) Foster Effective Institutional and Multi-stakeholder Coordination: From the outset of the
program, promote adequate/strong sectoral coordination arrangements and mechanisms, which can
also serve as multi-stakeholder consultation mechanism on a continuous basis; this
mechanism/arrangement needs to have a clear mandate(s) and supported by a technical secretariat (or
equivalent). This will help ensure the required systematic and technical follow-up, with a strong
results orientation, and reinforced by appropriate mutual accountability mechanisms and “culture”,
and supported by an enhanced M&E system;
6) Operational and Effective M&E System: Ensure an improved and operational Monitoring and
Evaluation system, from the outset of the program, and which should: (a) be based on a sound results
framework; (b) focus on the most strategic “core” indicators, covering a mix of relevant impact,
outcome and output indicators; (c) supported by high quality annual reviews (e.g., Joint Sector
Reviews); and (d) be utilized effectively by decision-makers, relevant coordination mechanisms; and
multi-stakeholder fora/platforms to help reinforce follow-up and mutual accountability (e.g., JSR;
development partner groups, such as Ag-RED);
7) Strengthened Institutional Capacities: Strengthen institutional capacities and sustainable and
non-distortionary incentives (financial and non-financial) to attract and retain qualified technical
officers, at central and Provincial levels; and
78
8) Adequate and Timely Resource Mobilization: Actively promote financial resource mobilization
and cost sharing from the outset of the program, and from various sources of key stakeholders:
Government (central, provincial, district), private sector, development partners, and beneficiaries.
4 STRATEGIC CONCLUSIONS AND CORE RECOMMENDATIONS
4.1 Main Conclusions
Based on the above assessment, this MTE has highlighted 7 strategic conclusions. These conclusions
focus on the key design aspects and performance and “core drivers” toward achieving PNISA’s
overall objectives and strategic targets, especially at the impact and outcome level. Further details are
provided in Chapter 3, which provides supporting evidenced-based analyses used to derive these
conclusions.
1) Mixed Design Aspects: In general, PNISA was well designed, although strategic requirements
and implementation experience also suggest key challenges which were not addressed adequately in
the design stage, and also during subsequent implementation. In summary:
PNISA’s positive design aspects include:
Addresses most of the relevant agricultural sector issues and thematic areas;
Is aligned generally with PQG and CAADP framework and processes;
Estimated required financial resources for each result area, program and subprogram;
Promoted the active engagement of key stakeholders during the design stage (e.g.,
Government entities at both central and provincial levels, private sector, development
partners, NGOs, academia) during the design phase.
PNISA’s challenging aspects included neglect/inadequate:
Operational strategy and plan for expanding the vital role of the private sector; also, PNISA
did not include clear operational roles and targets involving private sector;
Operational content on some key sub-programs, such as international trade under the market
access result area;
Establishment of indicators and their respective targets for some of the key programs (eg:
Market access, institutional strengthening);
Operationalized M&E system, supported by clear and adequate accountability systems;
Strategy and mechanisms for mobilizing the required financial resources to close the large
financing gap (85%, which has persisted until this date);
Formulation of different funding and implementation scenarios (high, medium and low),
taking into account the possible and actual available funds.
2) Emerging Sound Policy and Institutional Environment and PNISA’s Limited Role: During the
PNISA implementation period, there were several key agricultural policies and strategies which were
formulated, approved and at various stages of implementation, although some of them need to be
further deepened and operationalized to generate the required and sustained benefits. For example:
POCA (2013 - 2013): Operational Plan for Agricultural Commercialization; PICA (2013-2020):
Integrated Plan for Agricultural Commercialization; PODA (2015 - 2020): Operational Plan for
Agricultural Development; initiatives on improved access to land (Terra Segura), and enhanced and
enabling institutional coordination initiatives (e.g., establishment of the CCSA, although in incipient
stages of being functional; enhanced food security coordination: Nutrition Partners Forum). Thus far,
PNISA has played a relatively minor role in helping to further operationalize these key policy and
institutional initiatives, due to various constraints highlighted in Chapter 3 (e.g., funding, technical
capacities, coordination).
3) Variable Achievement of PNISA’s Impact, Outcome and Output Results. After nearly five
years of implementation, tangible results (at impact and outcome levels) which can be attributed
clearly to PNISA, are still in their early stages. The following section summarizes the main
achievements and key gaps according to PDO level, the 5 result areas and the crosscutting themes in
terms of “core” indicators (which comprises the drivers in achieving PNISA objective).
(a) According to PDO Level:
79
(i) Agricultural. Growth Rate: PNISA stipulated an agricultural growth of 7% per year; the
CAADP/MALABO target is 6% per year. The actual agricultural growth rate has been about 3.0%
per annum (2013-2017), and therefore, significantly and consistently below the ambitious target of 7%
per year. The major reasons for shortfalls include significant underfunding of PNISA (public and
Development Partners); PNISA's limited scope in mobilizing funds, promoting and achieving an
expanded private sector role in the agriculture sector.
(ii) Poverty Reduction: Despite PNISA did not establish a target for poverty reduction, MALABO
established a target reducing poverty level by at least 50% at national poverty line, from the year 2015
to the year 2025. There was a modest decrease in poverty from 54.7% (2008/2009) to 49.2%
(2014/2015), reflecting the relatively low agricultural sector growth rate trends. Promising sources of
agricultural growth and rural poverty reduction include scaling up improved technologies and contract
farming. However, PNISA limited funding level and composition has limited its potential role in
helping to reduce poverty.
(iii) Nutrition: Stunting and Wasting Rate: PNISA established as target to reduce prevalence of
stunting from 44% (2008) to 30% (2015) and 20% (2020) and MALABO established as target to bring
down wasting to 5% or less by the year 2025. The absence of yearly surveys limits evidence-based
assessment of progress and effective targeting of stunting and wasting. Based on negligible decrease
from 44% in 2008 to 43% in 2013, achieving current targets are unlikely, due to complex underlying
causes and multi-sectorial interventions required coupled with the revealed SETSAN's constraints and
limited provincial and district level engagement in addressing nutrition issues.
(iv) Private sector investment rate and role: PNISA and MALABO did not establish the target on the
ratio of private sector investment to government investment in agriculture. PNISA did not formulate
and implement an explicit operational strategy and interventions to stimulate directly inclusive private
sector development. This neglect is also associated with an absence of required data systems.
Accordingly, the actual role of the private sector in Mozambique is at an incipient stage, especially
involving the agricultural sector. Promising private sector investment includes numerous key
commodities and value chains, supported by business plans which are being promoted by MITADER.
While some initiatives to promote private sector investment are being promoted, they are at an
incipient stage. The absence of comprehensive and operational strategy for expanding private sector
development of and engagement in Mozambique's agriculture sector is limiting the active involvement
of the private sector in agriculture.
(b) According to Result Areas (5)
Following the main conclusions for the program development objectives, the main conclusions related
to the principal targets under each result area are presented below.
(i) Result Area 1: Increased Production and Productivity
(a) Crop Yield: PNISA established as a target an increase in maize yield to 1.8 MT/ha using TP1
(use of improved seeds) and to 2.5 MT/ha for using TP2 (use of improved seeds and fertilizer) by
2017. There is modest increases and well below PNISA targets for maize as well as other food crops
although varying across provinces and farmers. Gaps are due primarily to limited use of improved
inputs, high dependence on rain-fed agriculture, and constraints in technology services (research-
extension linkages, mechanization), and constraints to accessing financing and markets. However,
targets were met for soybeans, tomato, Irish potato, sugar cane and cashew nuts.
(b) Access to yield enhancing inputs: PNISA established as target an increase from 5% (2012) to
35% (2017) of percentage of farmers adopting improved seeds; and increase from 10% (2012) to 20%
(2017) of percentage of farmers adopting fertilizer and an increase in the quantity of applied fertilizer
from 2kg/ha to 25Kg/ha by 2017. MALABO established as target an increase in the quantity of
fertilizer applied to at least 50 kg/ha by 2025. There is significant shortfall in meeting the target due
to various factors (e.g., ambitious, weak research-extension linkages. Limited extension coverage).
For example, the proportion of farmers using fertilizer was 4.5% in 2015 against the 20% target in
2017. The quantity of fertilizer used in 2016 is 3.7kg/ha against the 50kg/ha in 2025.
(c) Extension services (crops and livestock): PNISA did not establish a target for the extension
coverage and MALBO established a target of covering all farmers (100%) by 2018. The target on
number of extension agents was not established both under PNISA and MALABO. There is
80
significant shortfall for the MALABO target related to extension services coverage as the actual
coverage is 28.8% in 2016 against the target of 100% by 2018. There is a slight an upward trend in the
number of extension agents. However, the number of extension agents is still significantly low to
reach the recommended coverage of 250 producers per extension agent.
(d) Livestock: PNISA established as a target an increase in the weight of carcass from 140kg to
160 kg in 2017, an increase the percentage of vaccinated cattle from 65% to 80% in 2017 and reach 12
baths per animal by 2017. The average weight per animal was 146Kg (2013-2016), which is lower
than the target (160kg) and constraints includes limited use of improved breeds coupled with use of
traditional feeding methods (grass fed cattle). Regarding the cattle vaccination, PNISA is on track to
meeting the target, however, a key challenge is to ensure sustained improvements in veterinary
services, and expanded role of the private sector and farmer organizations. For the number of baths,
PNISA is generally on track to meeting the target with the current average of 9 baths per animal per
annum.
(e) Fisheries: PNISA established as target to produce 30.0 thousand MT of aquaculture fish and
no target for offshore fish production. There is an upward trend for both aquaculture and offshore fish
production. However, the target for aquaculture was over stated and it was not attained (30.0 thousand
MT against the actual 700 MT/year).
(f) Agricultural research: PNISA established as target to release 20 crop varieties (4 with high
nutritional potential, chicken breeds with tolerance to adverse weather condition, and 2 goat breeds
adapted to different agro-ecological conditions. The target on crop varieties was met. IIAM released
35 varieties. However, there was a shortfall in meeting the target of releasing 2 chicken and goat
breeds.
(g) Agricultural irrigation: PNISA established as a target to increase the irrigated area to: 50.0
thousand ha in 2017 and MALABO target is to increase by 100% by the year 2025 taking as a base
the year 2000. Significant shortfall is observed under this target (20.0 thousand ha in 2016 vs. 50.0
thousand ha in 2017). This is due primarily to shortfall in provision of financing, and also delays
arising from procurement processes and implementation capacities.
(ii) Result Area 2: Market Access
(a) Quantity Sold as % of production for major crops:PNISA and MALABO did not establish
explicit this indicator and the respective target. There is limited reliable data available, although
general impression is that pace of increased market surpluses is below implied targets.
(b) Farm gate prices vs wholesaler prices: PNISA did not establish explicit targets in this result
area and for the indicator farm price as percentage of wholesaler price. There are multiple systems and
sources of price data utilizing different methodologies (e.g. SIMA and MIC). Available data suggest
farmers are receiving a high proportion of the retail prices, the overall knowledge suggest this is
misleading.
(c) Percentage of post-harvest losses for the 5 national priority commodities: PNISA did not
establish the target for this indicator. MALABO established as a target the decrease by 50% by 2025
as a base the year 2015 and PODA established as target the decrease from 24%of post harvest losses
in 2015 to 12% in 2019. There is no data to assess this indicator. General impression is that there is a
relatively high % of post-harvest losses for major commodities.
(d) Expanded Public and Private Partnerships (PPPs): Number of priority agricultural commodity
value chain for which PPPs were established with strong linkage to smallholders: PNISA did not
establish this indicator with the respective indicator. MALABO stated: establish and strengthen
inclusive PPPs for at least 5 (Rice, maize, cassava, poultry, cotton and cashew nut) priority
agricultural commodities value chain with strong linkages to smallholders by 2025. PNISA did not
include any proposed actions to establish and strengthen PPPs. However, government (MASA and
MITADER) has been involved in efforts to attract private sector to participate in PPPs. Assessment on
this indicator is difficult due to the lack of data.
(e) Value and growth of intra Africa trade of major agricultural commodities and services:
PNISA did not establish this indicator with the respective target. MALABO established as a target to
triple intra Africa trade in agricultural commodities and services by 2025 as a base the year 2015.
Agricultural good imports outweigh exports by four to five times (negative trade balance), and no
evidence of reversing trends. Progress towards meeting MALABO target is lagging behind. There is
81
absence of data disaggregated by commodity and by agricultural services, reflecting underlying data
challenge.
(f) Trade facilitation index (TFI): PNISA did not establish this indicator with the respective
target. MALABO established as a target a fully established trade facilitation measures by reaching a
100% of trade facilitation index by 2025 as a base the year 2015. Absence of data is a key challenge,
which is a constraint to assessing reliably trends over time. Current TFI is at 55% (2016), little more
than half way to meet the target, no data for other years.
(iii) Result Area 3: Food Security and Nutrition
(a) Domestic food price volatility index: PNISA did not establish this indicator including its
target. MALABO established as target to reduce domestic food price volatility index to less than 7.5%
by 2025.It appears some progress towards the target has been made. However, Mozambique is prone
to flood and drought (climate change), leading to high price volatility. Government is taking various
initiatives to address climate change challenges and adverse effects on stable food prices (eg. PQG,
Disaster Management Master Plan, REDD+ and PNISA). These initiatives are still incipient.
(iv) Result Area 4: Natural Resources
(a) Number of hectares of land re-forested: PNISA established as target to reduce deforested area
by 100% to 250,000 ha in 2017. Total land reforested of 43,994 ha (2013 to 2016) is significantly
lower than the initial ambitious target.
(b) Percentage of farmers with ownership or secured land rights: PNISA did not establish a clear
target for this indicator. MALABO established as target to have 100% of farmers with land rights by
2018. There is significant shortfall (10% in2016 vs 100% target in 2018)
(c) Percentage of households resilient to climate chocks: PNISA and MALABO did not establish
a clear target for this indicator. Absence of data is key challenge and data is available for only one
year. Only 0.31% of households in 2016 were resilient to climate and weather related shocks,
revealing serious gaps and that the climate change initiatives in Mozambique are in very incipient
stage.
(v) Result Area 5: Institutional Strengthening
(a) Public agricultural expenditure as percent of total public expenditure: The implied target for
this indicator is 10% under PNISA. The MALABO target is to increase to at least 10% from 2015 to
2025. Relatively good progress towards achieving the 10% target has been made, although with erratic
fluctuation (ranging from 6% to 9%), coupled with variable quality and impact of the agriculture
expenditure.
(b) ODA disbursed to agriculture as percent of the commitments for the agricultural sector:
PNISA did not establish this indicator and the respective target. MALABO target is 100% of ODA
disbursed annually from 2015 to 2025. Relatively low ODA disbursement rate (38% in 2015), due to
withdraw of Development Partners.
(c) Index and capacity to generate and use agricultural statistical data and information: PNISA
did not establish this indicator and the respective target. MALABO established a target of giving at
least 63% of the index and capacity to generate and use agricultural statistical data and information by
2025.Target exceeded: This index was 70% in 2015. However, there is need of re-assessing the
realism of this figure given the following factors: (i) General weakness of agricultural database and
the components of this index (eg. infrastructures for data analysis processing) and capacity for
analysis; and (ii) MASA has generated many strategies and action plans to support the development of
agricultural sector, which are not being fully and effectively utilized due to several factors, including
weak accountability for ensuring follow-up and the required results.
(d) Index of inclusive institutionalized mechanisms for mutual accountability and peer review:
PNISA recognized the need of mutual accountability and peer review and propose to be done through
CCSA; however not specific targets were indicated. The MALABO target is to reach 100% of
institutionalized mechanisms and platforms for mutual accountability and peer review. Absence of
data is key challenge to draw robust conclusion on the strengths and weaknesses of the mutual
accountability in the agricultural sector. Existence of limited coordination effectiveness and uneven
PNISA results towards meeting its targets, which suggest the need to further strengthen coordination
and mutual accountability mechanisms and processes.
82
(e) Number of full-time researchers: PNISA and MALABO did not establish this indicator and
the respective target. There is absence of data on yearly basis. Data from IIAM reveal that 1.8%,
6.2%, and 16% of employees have a PhD, MSc and BSc degrees, which show limited human resource
for knowledge production.
(f) While there is consensus on the urgency of significantly strengthening coordination (within
MASA and especially with other Ministries/stakeholders), and support for the establishment of the
CCSA, there is little evidence of tangible progress.
c) Conclusions According to Strategic Crosscutting themes
(i) Decentralization
1) Growing commitment by Provincial and district stakeholders to promote inclusive agricultural
development;
2) Financial, staffing, M&E, work plans, budgetary cycle, and capacity constraints at Provincial
and District levels, limiting their capacity to contribute to PNISA targets.
3) Limited knowledge of PNISA and its targets at Provincial and District levels
4) Severe underfunding of PNISA (85%) has impeded MASA’s capacity to allocate funds
directly to the Provinces;
5) Agricultural programs/activities at Province and District level reflect their on-going program
without explicit linkages toward achieving the PNISA targets; in summary: “business as
usual”
ii) Monitoring & Evaluation
1) MASA has relied on using its existing monitoring system to meet its internal and external
requirements, especially with respect to meeting the PES requirements;
2) MASA has not been able to track and assess systematically the progress, performance and
results, especially at outcome and impact levels, of PNISA’s specific programs and targets.
3) These M&E constraints are due to a combination of factors, including:
absence of a detailed operational design of PNISA’s M&E system, from the outset;
inadequate human resources and capacities (numbers of professional staff and
skills/experience), and inadequate external technical support;
negligible funding to generate required data to track key indicators, especially at
outcome and impact levels; and
weak linkages with Provincial M&E systems and other CCSA stakeholders.
4) Weak M&E has resulted in deficient mutual accountability at various levels and among key
stakeholders
4) PNISA’s Major Financing Shortfalls: The most notable finding of the MTR is that the required
financing was not mobilized and released to implement the envisioned PNISA programs. During the
period 2013-2016, there are 5 financing indicators which reveal different dimensions of the financing
challenges: (a) the level of agricultural expenditures as a % of total government expenditures was only
2-3% during the period 2013-2016, well below the 10% expenditure target agreed by African
Governments, including Mozambique; (b) the actual expenditures were only 15% of the required
funding; (c) the approved budget was only 26% of the required funding; and (d) the actual
expenditures were only 57% of the approved budget; (e) disbursed budget (releases from the Ministry
of Economy and Finance) was only 57% of the approved budget. Moreover, during the
implementation period, MASA did not adjust downwards the envisioned and ambitious targets, at the
Program Development Objectives (PDO) level, and for each of the 21 programs. Therefore, it is not
surprising that there are significant shortfalls in meeting many of the targets, while also recognizing
that some of the targets are on track (e.g., yields for some crops; generation of improved crop
varieties);
5) Limited and incipient role of the VITAL inclusive private sector and Promising Potential in
Value Chain Development (VCD) initiatives: There is increasing recognition of the VITAL role of
promoting an inclusive and broad-based private sector role to contribute to CAADP’s broader vision
of agricultural transformation. The role of the private sector in Mozambique is at an incipient stage,
and needs to be promoted through a combination of policy, institutional and investment interventions.
83
There are some emerging promising experiences involving private sector-driven value chain
development (VCD) for commodities for which Mozambique can become competitive. For example,
several government entities (e.g., MASA through CEPAGRI, Zambezi Valley Development Agency,
MITADER) have carried out promising VCD initiatives through supporting the formulation of
business plans and expanding access to finance and land by smallholders. These initiatives offer
MASA the opportunity to forge a close collaboration with the relevant entities, and therefore generate
positive synergies for tapping this vital source of agricultural growth and poverty reduction. There is
some emerging success stories of VCDs, but these need to be scaled up, especially to ensure inclusion
of smallholders (e.g., sugarcane; tobacco; cotton; soybean; poultry).
6) PNISA’s Limited Effective Coordination. While there is consensus on the urgency of
significantly strengthening coordination (within MASA and especially with other
Ministries/stakeholders), thus far there is little evidence of tangible progress. Hence, there is an urgent
need for strengthening appropriate coordination mechanisms/processes (e.g., building on existing
coordination mechanisms, such as fully activating the CCSA, and providing it with the needed M&E
information and technical support for systematic follow-up and enhanced mutual accountability);
7) Core Drivers for Agricultural Transformation are at early stage of Activation: The theory of
change developed for the PNISA MTE provides a roadmap for helping to prioritize the main types and
mix of prioritized interventions, involving policies, institutional reforms and investments, especially
by an expanded and strengthened private sector. Available evidence from PNISA implementation
seems to validate the soundness of the proposed roadmap. However, this assessment shows that there
are some strategic programs which comprise key drivers and which need further strengthening and
adequate funding to ensure they generate the potential results which will contribute toward
agricultural transformation. For example, the following are core driver interventions, but which need
to be boosted significantly to achieve the desired results: some crops are meeting yield targets;
agricultural research, agricultural extension, agricultural research-extension linkages are moving in the
right direction; access to finance, including guarantee fund is at very incipient stages; expanded and
prioritized irrigation and rural roads, with improved operational and maintenance need greater
attention and funding support; farmer organizations and apex bodies are at incipient stages of
development, in order to better access enhanced quality of services and expanded market access;
expanded, inclusive and competitive VCD, supported by rural electrification, post-harvest storage
enhancements and expanded agricultural trade are all at very incipient stages. Given limited resources,
there will need to be a phased and prioritized approach to activating these drivers of transformation.
4.2 Core Recommendations
As highlighted above, the emerging gaps (technical, capacity, financial, coordination) in achieving
PNISA’s strategic objectives and targets highlights the need for Government, led by MASA, in close
collaboration with key stakeholders, to:
enhance the strategic content and/or targets of the 21 programs;
intensify implementation, with tangible results;
improve significantly the effectiveness of coordination, at various levels;
strengthen and operationalize a sector-wide M&E system, which will support more efficient,
effective and timely decision-making.
Accordingly, the section below summarizes the 32 “core”15 recommendations (and supporting actions)
to help achieve enhanced results from PNISA during the extended period of PNISA (through 2019).
Annex 2 provides a roadmap which indicates key milestones (by end 2018 and 2019), primary
implementation responsibilities, and the types of required resources to implement the
recommendations.
15 “Core” actions reflect the key “drivers” for agricultural transformation, based on the theory of change and
results framework summarized in Chapter 3. These “core” actions are further supported/operationalized by
component sub-actions which are outlined below, to enable effective and focused implementation, tracking and
generation of tanbible results.
84
4.2.1 Core Recommendations For On-going PNISA: Consolidating and Securing Strategic
Results
A) Overall and Program Development (6 Core Actions)
O.1: Extend PNISA: MASA, in consultation and endorsement of Consultative Council, to seek
formal approval of the extension of PNISA to the end of 2019.
The rationale for the extension is to enable more time to generate key results and meet key
targets, and to enable a PNISA phase 2 to coincide with the launching of the next PQG (2020).
O.2: Update Agricultural Growth Rate: MASA to update (decrease) 7% agricultural growth rate
(based on more realistic assumptions, and possible funding scenarios)
O.3: Update realistic Nutritional Targets: MASA, together with other members of the Malnutrition
Steering Group, to re-assess PNISA’s ambitious targets on stunting and wasting-20% (by 2020),
and to derive updated and realistic targets
O.4: Prepare/implement Private Sector Strategy and Road-map:
MASA:
(i) to carry out comprehensive and operational strategy and road-map for expanding
inclusive private sector development;
(ii) Work out an appropriate institutional roles and arrangements for spearheading
expanded and inclusive domestic and foreign private sector development, supported by a
sound road-map;
(iii) together with MIC, establish appropriate and reliable data collection system and
roadmap of private sector investment, analyses, and utilization.
O.5: Enhance PNISA Structure and Increase level of agricultural expenditures
MASA to:
(i) rename Program 11 (“Agribusiness Development Program” --- to “Competitive Value
Chain Development and Agricultural Trade Program”;
(ii) enhance the strategy and road map to promote enhanced agricultural trade;
(iii) MASA to establish indicators and targets for the PNISA programs (e.g. Market
access, food security, natural resources, institutional strengthening) taking into account the
current trends and available resources; and
(iv) MASA, with the support from the MOF, to increase the level of agricultural
expenditures, in accordance with the 10% target and according to explicit priorities.
O.6: Disseminate and Utilize Relevant Sector Analyses/Evidence:
MASA, in collaboration with and support by the AGRED, to develop and carry out a road map for
wide dissemination, discussion and effective utilization of relevant sector studies, including follow-up
actions (key sector studies to be identified and compiled).
B) BY RESULT AREA (RA)
RA1: INCREASED PRODUCTION AND PRODUCTIVITY (7 core actions)
1.1: Enhance Crop Programs:
MASA:
(i) to prioritize recommended cropping patterns according to agro-ecological zones, and
addressing other relevant constraints;
(ii) MASA to promote the use of enhanced yield inputs, in partnership with the private
sector (eg. seed, fertilizer, irrigation, and tractor services);
useful for MASA to develop road map & formulate possible Memo of Understanding/MOU.
1.2: Increase Fish Inputs:
MMAIP to promote the establishment of fingerling and fish feed factories across the country with
participation of private sector; MASA to develop supporting road map and explore possible MOU;
1.3: Improve Livestock infrastructure, inputs and service markets:
MASA to:
85
(i) promote the construction of livestock infrastructures, mainly for benefiting the
smallholder producers, and with involvement of private sector;
(ii) ensure the establishment of livestock input and service markets, with active
involvement of private sector
1.4: Enhance Agricultural Research Actions:
MASA to:
(i) develop and implement a roadmap that will aim to expanded degree and non-degree
training to strengthen the research capacity of relevant staff at all levels (central, provincial
and district);
(ii) provide appropriate incentives and support to:
reduce high staff turnover;
promote improved efficiency and effectiveness of research production;
develop/implement sound road-map;
ensure efficiency-based unit cost of major expenditures to help ensure value- for-money;
1.5: Strengthen Agricultural Extension Program:
MASA to formulate realistic road-map (including realistic targets for Mozambique) involving private
sector and NGOs by exploring possible public/NGO/private extension service partnerships for closing
the extension coverage gap.
1.6: Improve Irrigation Program coverage and impacts:
MASA to:
(i) formulate realistic action plan involving private sector to cover the gap of the
irrigation target;
(ii) re-assess the unit costs of irrigation works, with the aim of developing efficiency-
based unit costs, low-cost irrigation investment options, which together can increase
the number of direct beneficiaries.
1.7 Strengthen agricultural mechanization:
MASA to organize farmers in blocks to facilitate the use of machinery and extension services, with
increasing role of private sector; Simplify the mechanisms for obtaining fuel subsidy, while
developing more sustainable approaches to expand access to the mechanization services.
RESULT AREA 2: EXPANDED ACCESS TO MARKETS (3 core actions)
2.1: Strengthen Post-harvest management:
MASA:
(i) together with MIC, to develop a strategy and supporting road map which would
promote inclusive and competitive small and medium-scale enterprises post-harvest
management including agro-processing;
(ii) to increase actual expenditure on this program given its pivotal role in increasing
farmers’ income and consequently reducing poverty;
(iii) to expand storage capacities and improve post-harvest technologies at household and
community level.
2.2: Expand Rural Roads Program:
(i) ANE, in collaboration with MASA, to prioritize expenditures for rural paved roads in
areas with “high” agricultural potential, and rural roads which connecting production areas to
populated consumption canters;
(ii) ANE would improve coordination mechanisms and processes between MASA and the
Ministry of Transport and Communication in determining priority road networks (with
convergence on prioritization criteria).
2.3: Strengthen data systems to support enhanced evidenced-based policy formulation:
MASA:
(i) in collaboration with INE, to utilize collected data through TIA and IAI to strengthen
evidence-based policy formulation; collect through TIA and IAI income data more frequently
to help monitor income at household (HH) level and assess impact of various policy options,
contributing to evidence-based policy formulation;
86
(ii) MASA to develop a roadmap to strengthen and expand the existing agricultural data
collection frameworks, to include additional key data, such as post-harvest losses; sustainable
land management; climate change resilience, with the aim of supporting improved evidenced-
based decision–making.
RESULTS AREA 3: ENHANCED FOOD AND NUTRITION SECURITY (1 core action)
3.1: Enhance Multi-Sectoral nutritional coordination
MASA, through SETSAN, to prepare sound action plan to strengthen effective multisectorial
coordination in food and nutritional security;
RESULTS AREA 4: IMPROVED NATURAL RESOURCES (2 core actions)
4.1: Improve land security:
(i) MITADER to revise downwards the target of 100% of farmers with secure land by 2018,
while updating and implementing a road-map for achieving a more realistic target;
(ii) MITADER, with support from MEF, to ensure that MITADER obtains adequate funding (via
budgetary cycle) to enable the Terra Segura Program to meet the target of issuing 5 million
DUATs by 2019.
4.2: Promote Sustainable use of natural resources: MITADER, in collaboration with MASA, to
develop a roadmap for promoting sustainable use of natural resource, with emphasis on commercial
logging;
RESULTS AREA 5: INSTITUTIONAL REFORM AND STRENGTHENING (4 core actions)
5.1: Institutional Reform Program
5.1.1: Enhance Coordination Arrangements/Mechanisms:
MASA, in consultation with the Prime Minister’s Office, to:
(i) explore the most suitable option(s) for enhancing the efficiency and effectiveness of
the coordination arrangements and mechanisms of PNISA;
(ii) proceed to implement the preferred and agreed option;
5.1.2: Enhanced & Sustainable Incentives:
MASA to prepare and carry out an action plan for formulating appropriate financial and non-financial
measures/incentives to: (a) reduce high staff turnover; (b) promote improved efficiency and utilization
of relevant evidence based studies, (c) ensure greater accountability to deliver on strategic results with
respect to PNISA.
5.2: Institutional Strengthening Program
5.2.1: Strengthen key staff for enhanced evidenced-based capacities and decisions:
MASA to carry out relevant training workshops to strengthen the capacity of relevant MASA,
MITADER planning and management human resources at all levels (central, provincial and district) to
use statistical data to guide policy formulation and implementation;
5.2.2: Strengthen CCSA role and effectiveness:
(i) MASA to develop an action plan proposal to strengthen the role and effectiveness of
CCSA, including support from a CCSA secretariat (including the option of MASA’s DPCI;
(ii) CCSA to review, approve and implement the roadmap (with the support of the CCSA
secretariat);
6.0: CROSS-CUTTING THEMES (9 core actions)
6.1 Decentralization: (2 core actions)
6.1.1: Socialize PNISA at Provincial/District levels:
MASA to carry out as soon as possible a socialization initiative of PNISA, based on a road-map, to
enhance their engagement via work plans and budgetary cycle;
6.1.2: Provide technical support to Provinces in their budgetary cycle
87
(i) This socialization activity should be complemented by ensuring MASA’s more active
engagement in providing direct support to Provinces (especially the Departments of
Agriculture) in the formulation of their annual work plans/budgets to help ensure strong
alignment and support to key PNISA targets;
(ii) MASA to help ensure the Provincial agricultural officers include relevant PNISA
indicators and targets in the Provincial and District work plans/budgets and M&E system
(including as part of mid-year review for FY18);
6.2: Monitoring and Evaluation System (1 core action)
6.2.1: Enhance operational Ag. Sector M&E System
(i) MASA to formulate road-map for enhancing a dedicated M&E team (in terms of
numbers and skills) for carrying out effectively the enhanced PNISA/sector M&E system,
supported by appropriate technical assistance which would provide capacity development and
technical accompaniment, at both MASA and Provincial levels;
(ii) MASA, with the support of the AGRED, to formulate road-map for ensuring regular
assessments and follow-up, including: (a) the carrying out of a Joint Sector Review on an
annual basis (b) adequate funding and technical support to generate a quality JSR report; (c)
systematic follow up of agreed actions;
(iii) CCSA needs to take an active role in demanding the M&E information and results
from strategic studies such as JSR, and other strategic thematic assessment studies to be
carried out.
6.3 Financing and Budgetary Aspects (6 core actions)
6.3.1: Enhance MASA’s Budget Structure:
MASA to structure its budget according to PNISA’s 5 components (result areas) and 21 programs; the
rationale is that the enhanced budget structure will facilitate management by results/targets, enhanced
“value-for-money”, and strengthened accountability.
6.3.2: Enhance level and quality of agriculture public expenditures:
MASA and Provinces, in collaboration with the Ministry of Economy and Finance (MEF), to increase
the level of agricultural expenditures (toward the 10% target), and to enhance key qualitative aspects
of the budgetary/financing processes and of budgetary allocations for PNISA would include the
following key elements:
(i) Sharpen Agricultural Expenditure Prioritization Criteria:
MASA to adopt and apply enhanced prioritization criteria for the improved allocation of
public funds as part of the medium and annual budgetary planning for PNISA, especially in
the light of severe budgetary/financing constraints; enhanced criteria would include:
a) Core Drivers: Programs/interventions which comprise “core drivers of agricultural
transformation”, and are strongly aligned with and contribute to strategic targets of
the PQG and PEDSA;
b) Numbers of Direct Beneficiaries: Programs which benefit large numbers of
beneficiaries, with special focus on smallholders, and the scope of benefits (and their
unit cost);
c) Viability: Programs which demonstrate attractive financial returns and enhanced
incomes to smallholders and sound economic viability, especially with respect to
lumpy investments and key services (e.g., irrigation, rural roads, technology
development and dissemination);
d) Balance: Enhanced “balance” of allocations between the PNISA result areas and
programs, and between capital and recurrent expenditures, especially some which are
severely underfunded and contribute to strategic targets (e.g., food security and
nutrition, technology);
e) Subsidies: Rationalization and phasing out of subsidies for “private” goods and
services, based on an assessment and action plan (involving seeds, fertilizers,
mechanization)
(ii) Close budgetary Execution/Gaps: formulate an action plan which will help reduce the
identified gaps between the budgetary approvals, releases and expenditures, including the
88
delayed releases of funds in the fourth quarter; this would include increasing the level of
agricultural expenditures, taking into the account the agreed 10% target;
6.3.3: Improve DP expenditure funding support
Development partners, in close consultation with MASA and MEF, to support improved expenditure
efficiencies and allocations:
(i) to identify and take the appropriate actions to expedite disbursements of approved
funds to support the timely implementation of agreed programs/activities;
(ii) where relevant, the DPs may wish to re-allocate approved funds for on-going
programs/projects, in line with the enhanced expenditure priorities; this review/adjustments
can be made during each DP’s next review of its program/project.
6.3.4: Close PNISA’s Funding Gap:
MASA, in collaboration with the MEF and development partners, to formulate and implement a
strategy and action plan to close PNISA’s financing/budgetary gap for FY18 – FY 20 (including
upward adjustment of budgetary ceilings, for both central and provincial entities); these increases also
are in line with the MALABO 10% expenditure target;
6.3.5: Update Costs, Financing Plan and Targets of PNISA:
MASA, in close collaboration with the MEF, to update the:
(i) costs of PNISA, based on actual expenditures/budgetary approvals (2013 – 2017), and
likely financing for FY18 – 20, and to generate 3 financing scenarios (high, medium and low,
with the “low” scenario reflecting the current situation and funding trends);
(ii) key targets for priority programs. This updating should reflect the results of the above
relevant items/findings;
It is understood that the results of the resource mobilization strategy/action plan will help adjust the
most likely financing scenario and updated targets;
6.3.6: Provide technical & financial support to provinces:
MASA to provide technical and financial support to the Provinces, with an emphasis on:
(i) enhancing their planning/budgetary cycle;MASA to help ensure the Provincial
agricultural officers include relevant PNISA indicators and targets in the Provincial and
District work plans/budgets and M&E system (including as part of mid-year review for
FY18);
(ii) helping the provinces to develop a sound, integrated and operational M&E system for
the agricultural sector (and key targets of PNISA); this M&E system needs to build on and
complement the reconstructed results framework developed to support the PNISA MTE; these
enhanced tools will help provinces meet in a coherent manner the various reporting
requirements for the agricultural sector (e.g., PES, PNISA, MALABO, other relevant
initiatives).
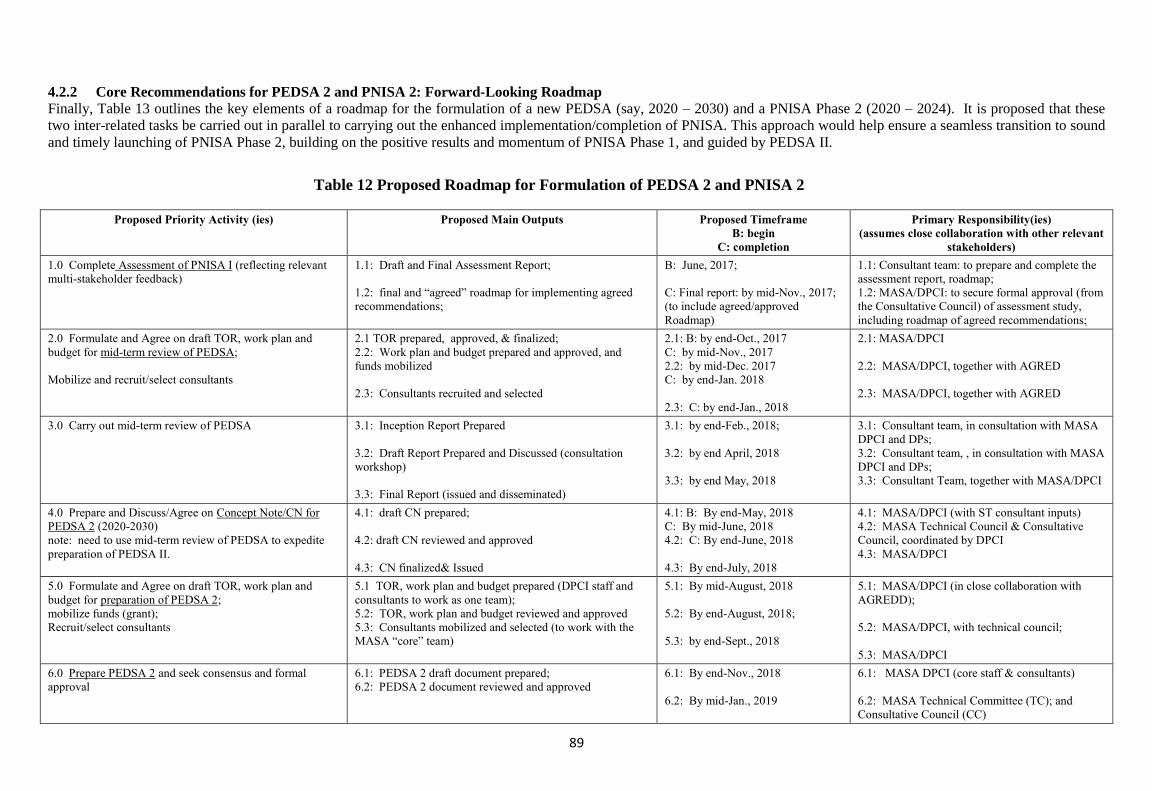
89
4.2.2 Core Recommendations for PEDSA 2 and PNISA 2: Forward-Looking Roadmap
Finally, Table 13 outlines the key elements of a roadmap for the formulation of a new PEDSA (say, 2020 – 2030) and a PNISA Phase 2 (2020 – 2024). It is proposed that these
two inter-related tasks be carried out in parallel to carrying out the enhanced implementation/completion of PNISA. This approach would help ensure a seamless transition to sound
and timely launching of PNISA Phase 2, building on the positive results and momentum of PNISA Phase 1, and guided by PEDSA II.
Table 12 Proposed Roadmap for Formulation of PEDSA 2 and PNISA 2
Proposed Priority Activity (ies) Proposed Main Outputs Proposed Timeframe
B: begin
C: completion
Primary Responsibility(ies)
(assumes close collaboration with other relevant
stakeholders)
1.0 Complete Assessment of PNISA I (reflecting relevant
multi-stakeholder feedback)
1.1: Draft and Final Assessment Report;
1.2: final and “agreed” roadmap for implementing agreed
recommendations;
B: June, 2017;
C: Final report: by mid-Nov., 2017;
(to include agreed/approved
Roadmap)
1.1: Consultant team: to prepare and complete the
assessment report, roadmap;
1.2: MASA/DPCI: to secure formal approval (from
the Consultative Council) of assessment study,
including roadmap of agreed recommendations;
2.0 Formulate and Agree on draft TOR, work plan and
budget for mid-term review of PEDSA;
Mobilize and recruit/select consultants
2.1 TOR prepared, approved, & finalized;
2.2: Work plan and budget prepared and approved, and
funds mobilized
2.3: Consultants recruited and selected
2.1: B: by end-Oct., 2017
C: by mid-Nov., 2017
2.2: by mid-Dec. 2017
C: by end-Jan. 2018
2.3: C: by end-Jan., 2018
2.1: MASA/DPCI
2.2: MASA/DPCI, together with AGRED
2.3: MASA/DPCI, together with AGRED
3.0 Carry out mid-term review of PEDSA 3.1: Inception Report Prepared
3.2: Draft Report Prepared and Discussed (consultation
workshop)
3.3: Final Report (issued and disseminated)
3.1: by end-Feb., 2018;
3.2: by end April, 2018
3.3: by end May, 2018
3.1: Consultant team, in consultation with MASA
DPCI and DPs;
3.2: Consultant team, , in consultation with MASA
DPCI and DPs;
3.3: Consultant Team, together with MASA/DPCI
4.0 Prepare and Discuss/Agree on Concept Note/CN for
PEDSA 2 (2020-2030)
note: need to use mid-term review of PEDSA to expedite
preparation of PEDSA II.
4.1: draft CN prepared;
4.2: draft CN reviewed and approved
4.3: CN finalized& Issued
4.1: B: By end-May, 2018
C: By mid-June, 2018
4.2: C: By end-June, 2018
4.3: By end-July, 2018
4.1: MASA/DPCI (with ST consultant inputs)
4.2: MASA Technical Council & Consultative
Council, coordinated by DPCI
4.3: MASA/DPCI
5.0 Formulate and Agree on draft TOR, work plan and
budget for preparation of PEDSA 2;
mobilize funds (grant);
Recruit/select consultants
5.1 TOR, work plan and budget prepared (DPCI staff and
consultants to work as one team);
5.2: TOR, work plan and budget reviewed and approved
5.3: Consultants mobilized and selected (to work with the
MASA “core” team)
5.1: By mid-August, 2018
5.2: By end-August, 2018;
5.3: by end-Sept., 2018
5.1: MASA/DPCI (in close collaboration with
AGREDD);
5.2: MASA/DPCI, with technical council;
5.3: MASA/DPCI
6.0 Prepare PEDSA 2 and seek consensus and formal
approval
6.1: PEDSA 2 draft document prepared;
6.2: PEDSA 2 document reviewed and approved
6.1: By end-Nov., 2018
6.2: By mid-Jan., 2019
6.1: MASA DPCI (core staff & consultants)
6.2: MASA Technical Committee (TC); and
Consultative Council (CC)
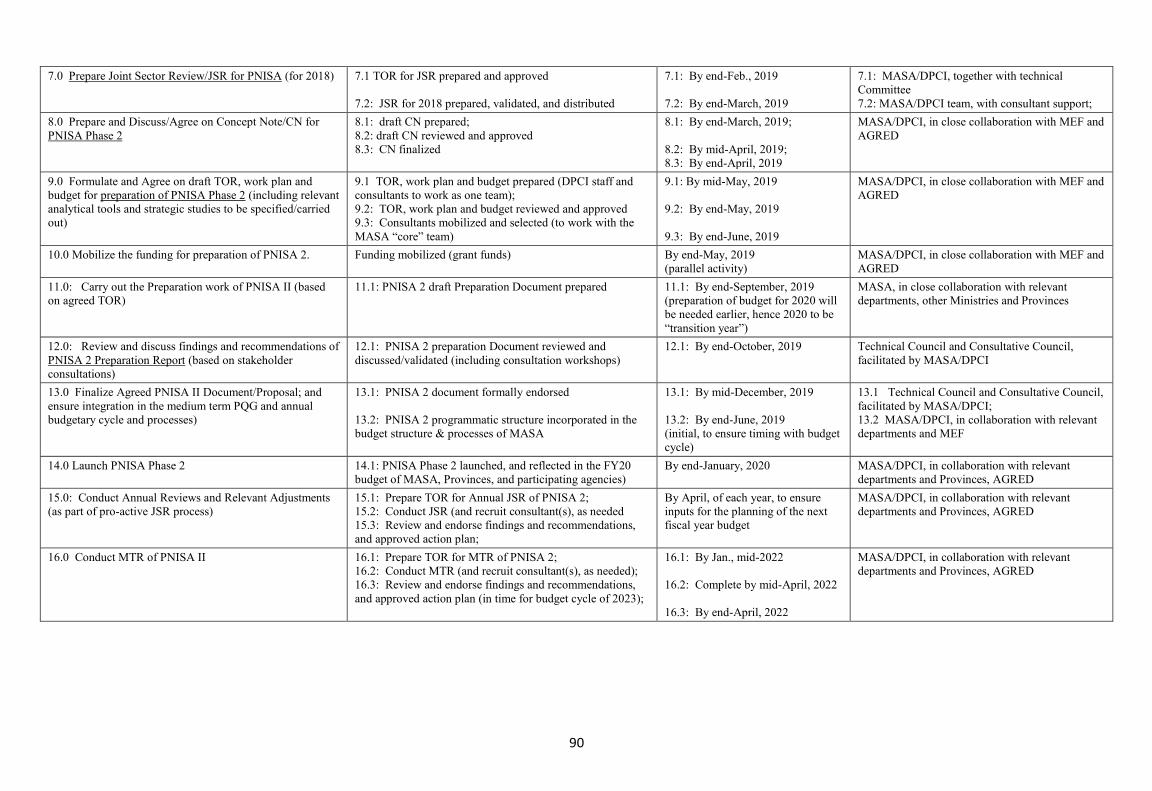
90
7.0 Prepare Joint Sector Review/JSR for PNISA (for 2018) 7.1 TOR for JSR prepared and approved
7.2: JSR for 2018 prepared, validated, and distributed
7.1: By end-Feb., 2019
7.2: By end-March, 2019
7.1: MASA/DPCI, together with technical
Committee
7.2: MASA/DPCI team, with consultant support;
8.0 Prepare and Discuss/Agree on Concept Note/CN for
PNISA Phase 2
8.1: draft CN prepared;
8.2: draft CN reviewed and approved
8.3: CN finalized
8.1: By end-March, 2019;
8.2: By mid-April, 2019;
8.3: By end-April, 2019
MASA/DPCI, in close collaboration with MEF and
AGRED
9.0 Formulate and Agree on draft TOR, work plan and
budget for preparation of PNISA Phase 2 (including relevant
analytical tools and strategic studies to be specified/carried
out)
9.1 TOR, work plan and budget prepared (DPCI staff and
consultants to work as one team);
9.2: TOR, work plan and budget reviewed and approved
9.3: Consultants mobilized and selected (to work with the
MASA “core” team)
9.1: By mid-May, 2019
9.2: By end-May, 2019
9.3: By end-June, 2019
MASA/DPCI, in close collaboration with MEF and
AGRED
10.0 Mobilize the funding for preparation of PNISA 2. Funding mobilized (grant funds) By end-May, 2019
(parallel activity)
MASA/DPCI, in close collaboration with MEF and
AGRED
11.0: Carry out the Preparation work of PNISA II (based
on agreed TOR)
11.1: PNISA 2 draft Preparation Document prepared 11.1: By end-September, 2019
(preparation of budget for 2020 will
be needed earlier, hence 2020 to be
“transition year”)
MASA, in close collaboration with relevant
departments, other Ministries and Provinces
12.0: Review and discuss findings and recommendations of
PNISA 2 Preparation Report (based on stakeholder
consultations)
12.1: PNISA 2 preparation Document reviewed and
discussed/validated (including consultation workshops)
12.1: By end-October, 2019 Technical Council and Consultative Council,
facilitated by MASA/DPCI
13.0 Finalize Agreed PNISA II Document/Proposal; and
ensure integration in the medium term PQG and annual
budgetary cycle and processes)
13.1: PNISA 2 document formally endorsed
13.2: PNISA 2 programmatic structure incorporated in the
budget structure & processes of MASA
13.1: By mid-December, 2019
13.2: By end-June, 2019
(initial, to ensure timing with budget
cycle)
13.1 Technical Council and Consultative Council,
facilitated by MASA/DPCI;
13.2 MASA/DPCI, in collaboration with relevant
departments and MEF
14.0 Launch PNISA Phase 2 14.1: PNISA Phase 2 launched, and reflected in the FY20
budget of MASA, Provinces, and participating agencies)
By end-January, 2020 MASA/DPCI, in collaboration with relevant
departments and Provinces, AGRED
15.0: Conduct Annual Reviews and Relevant Adjustments
(as part of pro-active JSR process)
15.1: Prepare TOR for Annual JSR of PNISA 2;
15.2: Conduct JSR (and recruit consultant(s), as needed
15.3: Review and endorse findings and recommendations,
and approved action plan;
By April, of each year, to ensure
inputs for the planning of the next
fiscal year budget
MASA/DPCI, in collaboration with relevant
departments and Provinces, AGRED
16.0 Conduct MTR of PNISA II 16.1: Prepare TOR for MTR of PNISA 2;
16.2: Conduct MTR (and recruit consultant(s), as needed);
16.3: Review and endorse findings and recommendations,
and approved action plan (in time for budget cycle of 2023);
16.1: By Jan., mid-2022
16.2: Complete by mid-April, 2022
16.3: By end-April, 2022
MASA/DPCI, in collaboration with relevant
departments and Provinces, AGRED

91