Embed Size (px)
Citation preview

MOVING VEHICLE QUIZ
SB Workshop
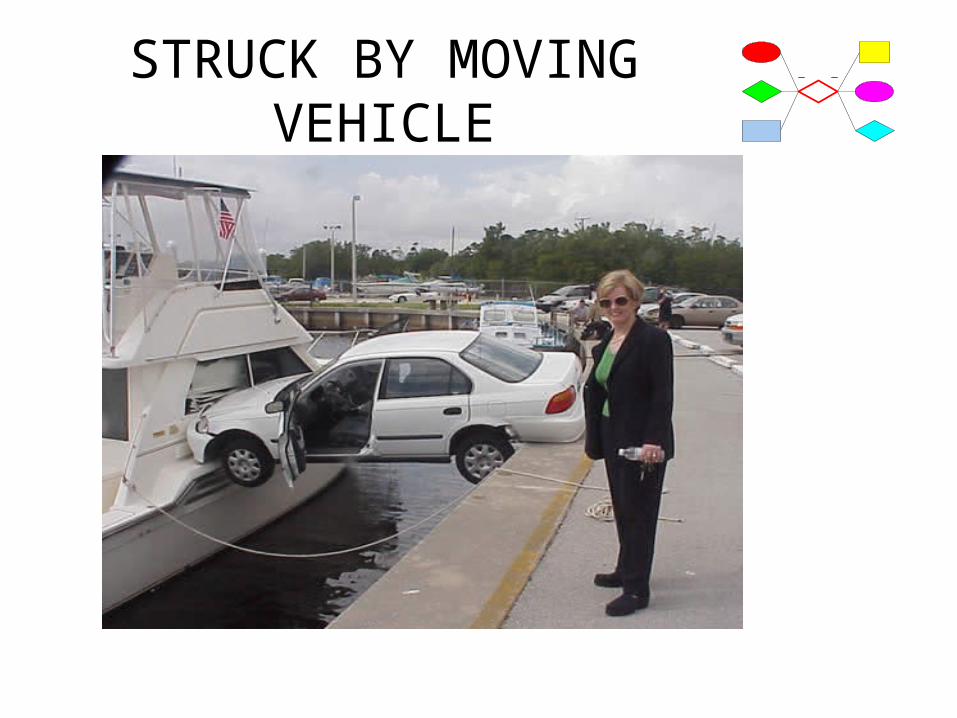
STRUCK BY MOVING VEHICLE
Reasons the driver hits the victim
The commonest loss of control event resulting in the vehicle heading towards the victim is :
A. Unintentional sudden movement (lock-out failure)
B. The driver loses control or cannot brake in time
C. The driver is unaware of the victim in his path

Reasons the driver hits the victim
C: Mostly the driver doesn’t see the victim
A. Unintentional sudden movement (lock-out failure) (19%)
B. The driver loses control or cannot brake in time (20%)
C. The driver is unaware of the victim in his path (50%)

The blind driver
Investigations suggest that the driver doesn’t see the victim in the path of the vehicle mostly because:
A. The load gets in the wayB. The vehicle has dead angles and no
mirrors/other aids C. Bad weather D. The victim wasn’t wearing high visibility
clothing

The blind driver
B. Dead angles without visibility aids is the main problem
A. The load gets in the way (13%)
B. The vehicle has dead angles and no mirrors/other aids (65%)
C. Bad weather (2%)
D. The victim wasn’t wearing high visibility clothing (13%)
Reasons the victim gets in the way
The victim is also a factor, mostly because:
A. They are getting in a dangerous location like the rear of a vehicle
B. They are not behaving in an able way (distracted, horseplay, slipping, hurrying)
C. They don’t see or hear the vehicle coming
Reasons the victim gets in the way
A. Mostly the victim was not keeping in the safe zone, including cases where they were not needed for the job
A. They are getting in a dangerous location like the rear of a vehicle (46%)
B. They are not behaving in an able way (distracted, horseplay, slipping, hurrying) (10%)
C. They don’t see or hear the vehicle coming (36%)

Speed of vehicle
Where known (in 20% of cases), the speed of the vehicle at the time of the accident was mostly:
A. More than 50km/hr
B. 15-30 km/hr
C. Less than 5km/hr

Speed of vehicle
C: Most accidents occurred at slow speeds
A. More than 50km/hr (5%)
B. 15-30 km/hr (4%)
C. Less than 5km/hr (74%)
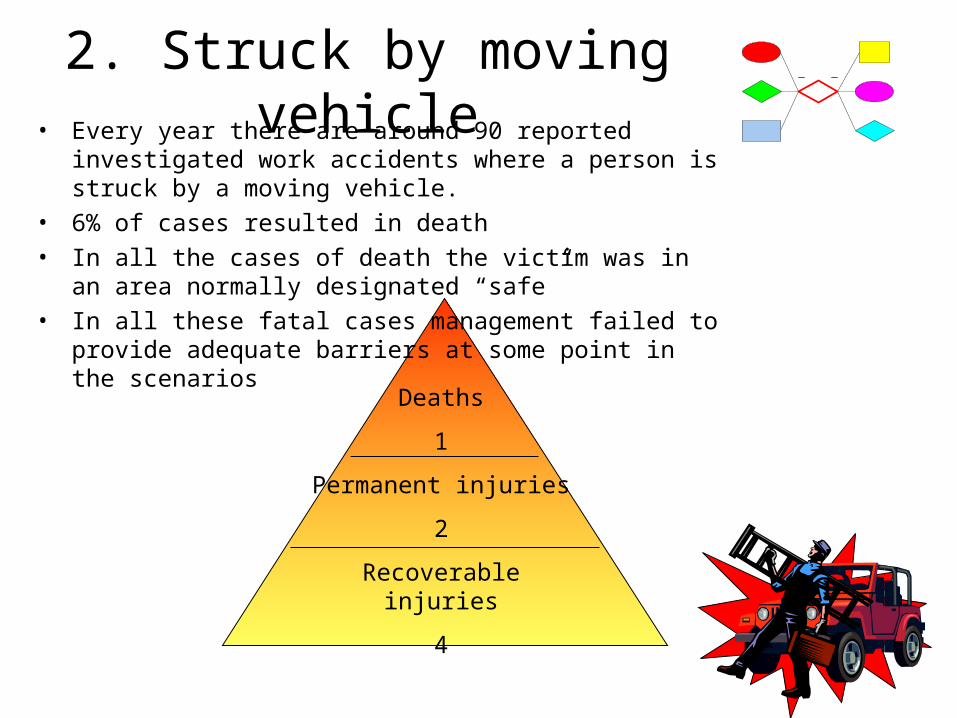
Deaths
1
Permanent injuries
2
Recoverable injuries
4
2. Struck by moving vehicle• Every year there are around 90 reported investigated work
accidents where a person is struck by a moving vehicle.
• 6% of cases resulted in death
• In all the cases of death the victim was in an area normally designated “safe”
• In all these fatal cases management failed to provide adequate barriers at some point in the scenarios
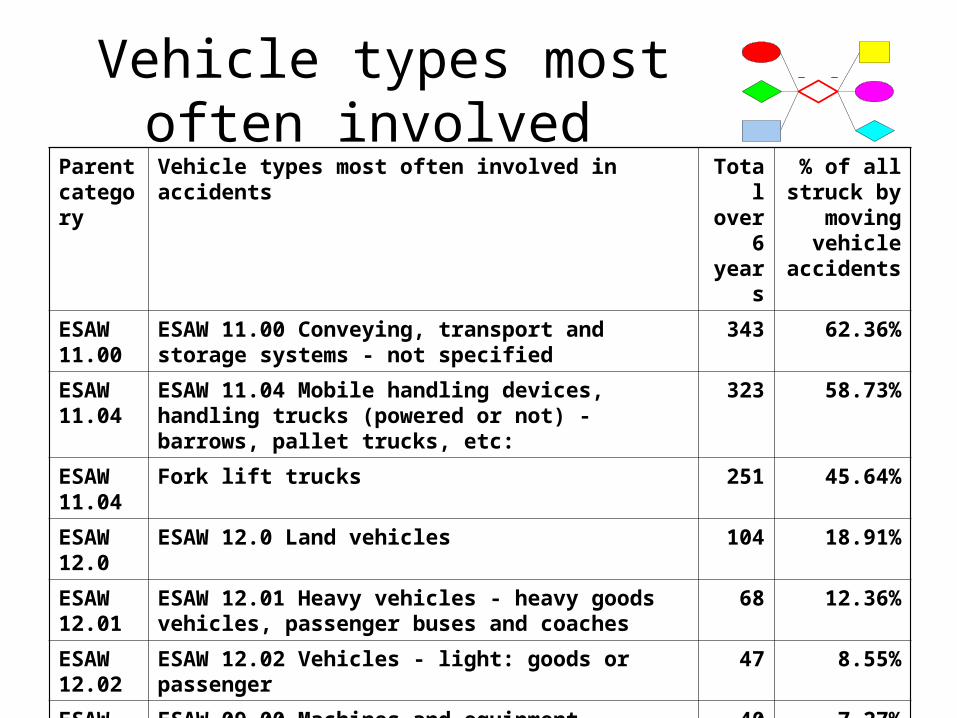
Vehicle types most often involved
Parent category
Vehicle types most often involved in accidents Total over
6 years
% of all struck by
moving vehicle
accidents
ESAW 11.00
ESAW 11.00 Conveying, transport and storage systems - not specified
343 62.36%
ESAW 11.04
ESAW 11.04 Mobile handling devices, handling trucks (powered or not) - barrows, pallet trucks, etc:
323 58.73%
ESAW 11.04
Fork lift trucks 251 45.64%
ESAW 12.0
ESAW 12.0 Land vehicles 104 18.91%
ESAW 12.01
ESAW 12.01 Heavy vehicles - heavy goods vehicles, passenger buses and coaches
68 12.36%
ESAW 12.02
ESAW 12.02 Vehicles - light: goods or passenger 47 8.55%
ESAW 09.00
ESAW 09.00 Machines and equipment - portable or mobile
40 7.27%
ESAW 09.01
ESAW 09.01 Port./Mob.machines - working-/ extracting the ground
37 6.73%
ESAW 11.04
Powered stacking trucks, pallet truck, elevators, stackers with driver
33 6.00%

Activity of the vehicle
21
59
212
258
10.7
38.5
46.9
3.8
0 50 100 150 200 250 300 350
Manoevering/turning
Standing still ->unintentional
movement
Driving in reverse
Driving ahead
Aantal ongevallen %
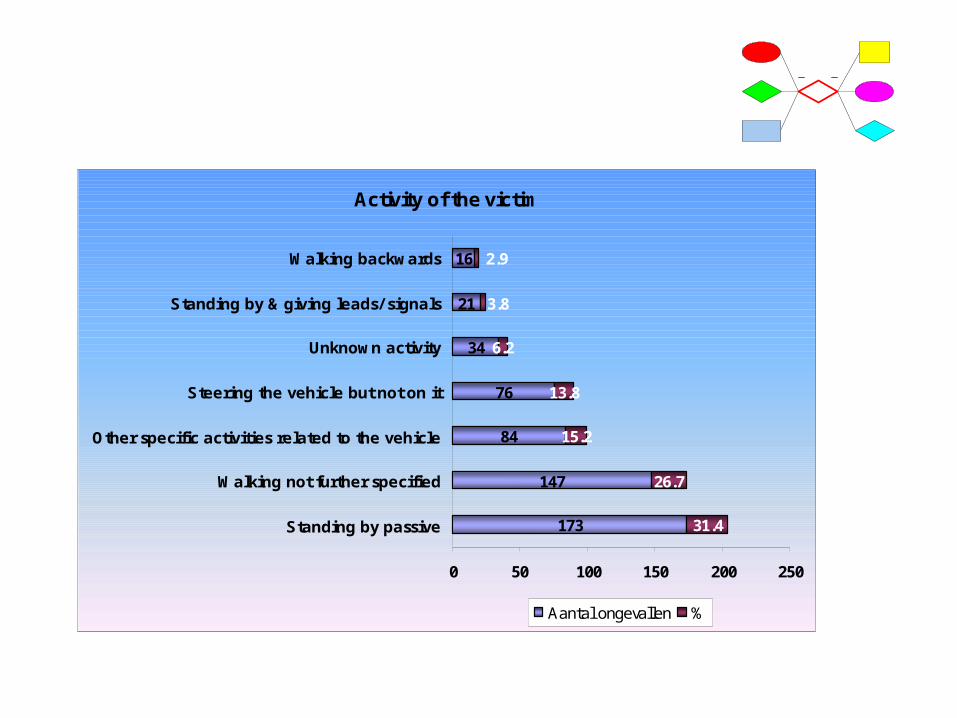
Activity of the victim
173
147
84
76
34
21
16
31.4
26.7
15.2
13.8
6.2
2.9
3.8
0 50 100 150 200 250
Standing by passive
Walking not further specified
Other specific activities related to the vehicle
Steering the vehicle but not on it
Unknown activity
Standing by & giving leads/ signals
Walking backwards
Aantal ongevallen %
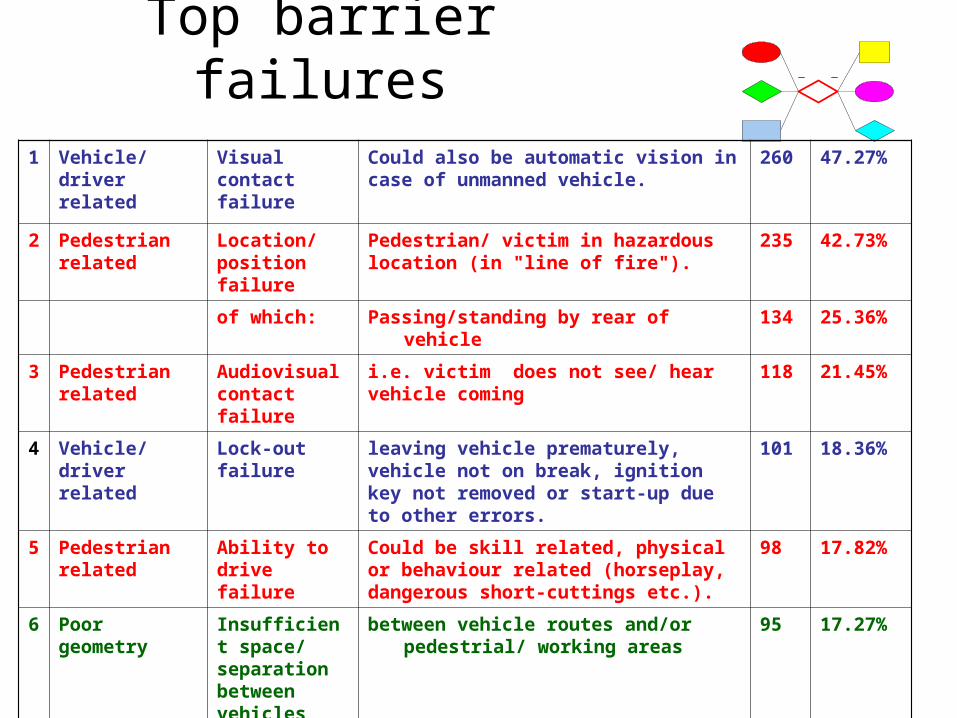
Top barrier failures
1 Vehicle/driver related
Visual contact failure
Could also be automatic vision in case of unmanned vehicle.
260 47.27%
2 Pedestrian related
Location/ position failure
Pedestrian/ victim in hazardous location (in "line of fire").
235 42.73%
of which: Passing/standing by rear of vehicle 134 25.36%
3 Pedestrian related
Audiovisual contact failure
i.e. victim does not see/ hear vehicle coming
118 21.45%
4 Vehicle/driver related
Lock-out failure
leaving vehicle prematurely, vehicle not on break, ignition key not removed or start-up due to other errors.
101 18.36%
5 Pedestrian related
Ability to drive failure
Could be skill related, physical or behaviour related (horseplay, dangerous short-cuttings etc.).
98 17.82%
6 Poor geometry Insufficient space/ separation between vehicles
between vehicle routes and/or pedestrial/ working areas
95 17.27%
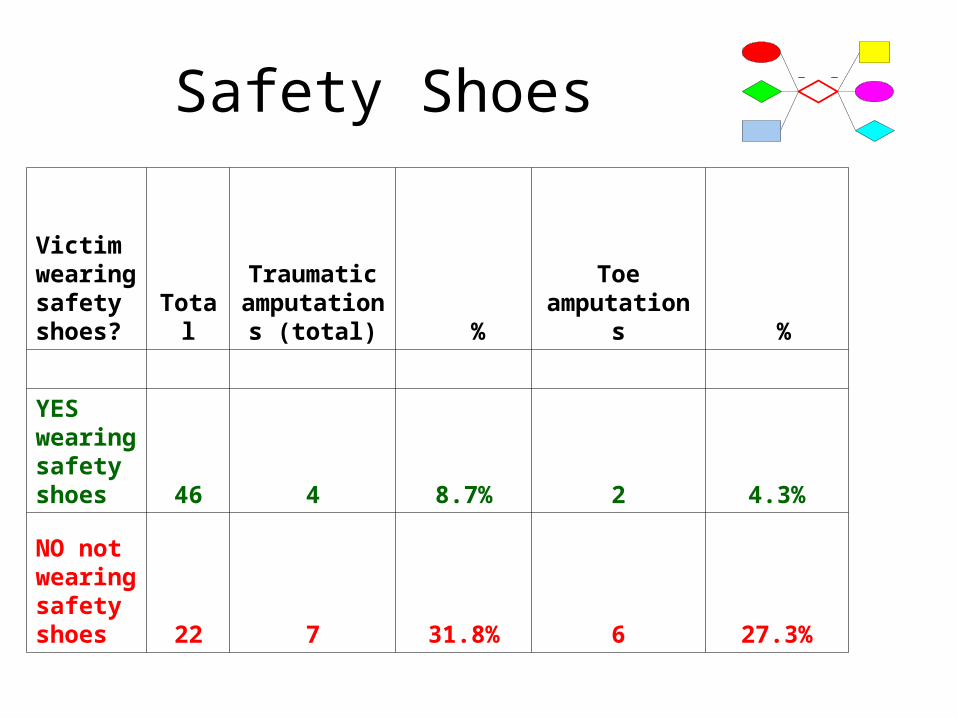
Safety Shoes
Victim wearing safety shoes? Total
Traumatic amputations
(total) %Toe
amputations %
YES wearing safety shoes 46 4 8.7% 2 4.3%
NO not wearing safety shoes 22 7 31.8% 6 27.3%
Conclusion
1. Always be on visual and auditory watch for slow or stationary vehicles especially conveying, transport and storage system vehicles……

Conclusion
2. …..Do not stand around anywhere near them
Conclusion
3. Wear safety shoes, be visible and listen out

Conclusion
4. Do not drive if you do not have the ability to do so or your eyesight is bad or the visibility is inadequate
Conclusion
5. if you do drive then use signals, a banksman if necessary, check blind spots round the vehicle, use a rear view mirror, look behind obstacles and don't play games and ….
Conclusion
6. When stopped, put the brake on and take out the keys when leaving the vehicle.

the end