Embed Size (px)
Citation preview
Moving Up the Value Chain in ICT: ASEAN Trade With ChinaSiew Yean Thama,b, Andrew Jia Yi Kamb and Nor Izzatina Abdul Azizb
aISEAS-Yusof Ishak Institute, Singapore; bInstitute of Malaysian and International Studies (IKMAS),UniversitiKebangsaan Malaysia, Malaysia
ABSTRACTThe rise of China increased competition for foreign direct invest-ment and exports for the ASEAN economies. It also increasedASEAN trade with China. But, are ASEAN countries able to moveup the value chain in their trade with China? The objectives of thisarticle are to examine upgrading in the information and commu-nications technology (ICT) value chain through changes in theproduct quality of parts and components (PNC) exports fromASEAN to China and the influence of these changes on their ICTtrade with China. The main findings indicate that there is little orno product upgrading in the most important SITC 776 sub-com-ponent of the PNC exports from the four major ASEAN economies(ASEAN-4) to China after 2005. It is also found that improvementsin product quality are more apparent for SITC 772 but this productgroup constitutes a small share in total manufactured exportsfrom the ASEAN-4 to China. Lastly, with little or no productupgrading, exporters from the ASEAN-4 have shifted to exportsof non-PNC goods to China. This shift has enabled the overall ICTexports from the ASEAN-4 to China to continue to grow for theperiod of this study.
ARTICLE HISTORYPublished online5 August 2016
KEYWORDSGlobal value chain;information and communi-cations technology exports;ASEAN; China; parts andcomponents
The emergence of global value chains (GVCs) implies that developing economies canindustrialise by joining GVCs, without having to build a whole industry from scratch.This is facilitated by “headquarter” economies shifting some of their production tasks to“factory” economies.1 ASEAN and China have both participated in this process byusing foreign direct investment (FDI) as a part their development strategies. China hasincreasingly integrated with the regional production networks that span ASEAN due tolarge inflows of FDI after the opening of its economy in the late 1970s and its accessionto the World Trade Organisation (WTO) in 2001. Thus, while the rise of China hasincreased competition for FDI and exports for ASEAN, it has also increased ASEANtrade with China, especially with progressive tariff liberalisation under the ASEAN-China Free Trade Agreement (ACFTA) from 2005. In particular, the movement ofinformation and communications technology (ICT) goods, specifically in parts andcomponents (PNC), between ASEAN and China is expedited by the intra-industry
CONTACT Siew Yean Tham [email protected]; [email protected] ISEAS-Yusof Ishak Institute,30 Heng Mui Keng Terrace, Singapore 119614 and Institute of Malaysian and International Studies (IKMAS), UniversitiKebangsaan Malaysia, Bangi, 43600 Selangor, Malaysia.
JOURNAL OF CONTEMPORARY ASIA, 2016VOL. 46, NO. 4, 680–699http://dx.doi.org/10.1080/00472336.2016.1212995
© 2016 Journal of Contemporary Asia
trade in the region by multinational corporations. Since 1995, trade between China andthe members of ASEAN has grown at an average of approximately 20% a year. In 2013,two-way trade rose by 10.9% to US$444 billion. China has become ASEAN’s largesttrading partner since 2009 while ASEAN has been China’s third largest since 2010(China Daily, August 9, 2014).
However, as in the case of other developing countries, ASEAN countries and Chinaaspire to move up the GVC by shifting to higher value added production. A crucialquestion in the trade relations between the ASEAN countries and China is whether theASEAN countries have been able to move up the value chain in their trade with China.The objectives of this article are to examine upgrading in the ICT value chain throughchanges in the product quality of ASEAN ICT exports to China and the influence ofthese changes on their ICT trade with China. Improvements in quality will imply thatASEAN exports goods are moving up the ICT value chain relative to China, therebyenabling the ASEAN economies to improve their relative competitiveness with Chinawhile the converse will hold if product quality deteriorates.
The article is organised as follows. A review of GVCs and upgrading is presented inthe next section, followed by a profile of the salient features in ASEAN trade withChina. The findings are then presented. The concluding section summarises the keyfindings of this article and provides some policy suggestions.
Global Value Chains and Upgrading
Technological changes have facilitated fragmentation in the production process, therebyenabling many countries to participate in the production of any manufactured good.According to Baldwin (2012), in the first “unbundling,” production is separated fromconsumption, while the second “unbundling,” which occurred after the mid-1980s,spliced the production process itself across countries (offshoring) and across organisa-tions (outsourcing) into different tasks along GVCs. The emergence of GVCs attractsconsiderable research attention that seeks to explain its characteristics and measure-ments as well as the main factors that have contributed to its development. The impactof GVCs on the pattern of world investment and trade as well as its role in drivingstructural change in different countries are other areas that are currently explored (see,for example, Sturgeon and Memedovic 2010; Cattaneo et al., 2013; UNCTAD 2013;Amador and Cabral 2014).
The electronics industry, which is a key component of the ICT industry, is one of themore researched sectors in GVC analysis due to the extent of offshoring and out-sourcing activities in this sector. This is in turn attributed to the extensive standardisa-tion and automation of the manufacturing processes in this sector. The electronicsindustry comprises a broad range of components, intermediates, final goods andservices. In particular, the second unbundling has contributed to the growing trade inintermediate goods, especially in PNC. Sturgeon and Kawakami (2010) examine theimpact of the global financial crisis (GFC) on the GVC in electronics and find that thereare both new challenges and opportunities for latecomers from the developing world inthis sector. Challenges come in the form of new barriers created after the crisis, whileopportunities are also created for latecomers to leverage on the deep capabilities thathave evolved within this sector in the last 20 years.
JOURNAL OF CONTEMPORARY ASIA 681
Some country studies have been conducted to assess the potential for these countriesto move up the electronics value chain, namely Costa Rica and the Philippines(Federick and Gereffi 2013; Aldaba 2015). Yamashita and Archanun (2011) use tradedata to examine the development of trade patterns of ASEAN with China to illustratethe complementarity between ASEAN exports to China as a result of the latter’sintegration into the GVC. Although the study covers PNC trade, it does not addressupgrading issues in the electronics trade between ASEAN and China.
In the GVC literature, upgrading refers to adding value to production or shifting tohigher value added activities in global production operations via six distinct changes: (i)entry into the value chain or when a new firm begins to participate in the value chain;(ii) process upgrading where firms upgrade processes via transforming inputs intooutputs more efficiently by reorganising the production system or introducing superiortechnology; (iii) product upgrading where the firms produce more sophisticated pro-ducts/higher value products; or products of better quality, and (iv) functional upgradingwhereby firms acquire new functions in the chain such as design or marketing; (v)chain upgrading or the entry into a new value chain by leveraging on the knowledgeand skills acquired in the current chain; and (vi) end market upgrading which is theshift into new higher value end market segments (Fernandez-Stark, Bamber, andGereffi, 2012; Humphrey and Schmitz, 2000). Upgrading pursued at the firm leveltranslates into country-level upgrading when a critical mass of firms located withinthe country achieves upgrading.
Fernandez-Stark, Bamber, and Gereffi (2012) observe that product and processupgrading is more easily attained for developing countries as they require relativelyminor adjustments in production and skills development with lower overall investment.For ASEAN, the literature supports evidence of at least some firm-level upgrading inthe four older member countries (ASEAN-4, namely the Philippines, Malaysia,Singapore and Thailand) in their respective participation in the electronics GVC. Forexample, Sturgeon and Kawakami (2010) document supplier upgrading in a case studyof Singapore by tracing the evolution of the supplier firm’s growth from supplying toAmerican disk drive producers in Singapore and Malaysia to becoming a regional firmwith its own vertically integrated electronics manufacturing bases in the region. In thecase of Malaysia, earlier studies conducted in the early 2000s indicate limited upgradingin Malysia’s electronics due to structural weaknesses in the industry (Ernst 2003;Henderson and Phillips 2007). These structural weaknesses include, among others, adependence on technology spillovers from the affiliates of multinational corporationsoperating in the country, lack of a broad and multi-tier base of support industries, skillsmismatch, use of affirmative policies as well as the use of unskilled migrant workers.
However, subsequent studies found some evidence of process, product as well asfunctional upgrading in the electronics cluster in Penang (Edgington and Hayter 2013;Kharas, Zeufack and Majeed, 2010). Firm-level interviews conducted in Penang’selectronics cluster in these studies indicate that there is progressive industrial upgradingfrom 2000 to 2006 following the Asian Financial Crisis in 1998, with multinationalcorporations increasingly embedding their operations in-situ, through using localskilled labour and supply firms. Archanun and Nipon (2011) also find some evidenceof functional and product upgrading in Thailand’s hard disk drive industry. Althoughthe electronics industry in the Philippines is concentrated mainly in assembly and
682 S. Y. THAM ET AL.
testing at the lowest segment of the GVC, Reyes-Macasaquit’s (2010) study of tenelectronics firms indicate that there is process upgrading as well as substantial organisa-tional innovation. In addition, some exceptional firms have even managed to move upthe value chain into design and more advanced production processes.
While evidence at the firm level is encouraging, work at the country level seems toimply that these countries may not have amassed the necessary critical mass of firmsthat can shift the country’s upgrading trajectory into a higher value added path. Forexample, Felipe (2012) finds that that although Malaysia and the Philippines made goodprogress by getting into the electronics cluster in the 1990s, they have not been able tomove into the most advanced and well-connected products in his study on the exportproducts from these countries compared to Korea from 1965 to 2005. The inability toshift into more diversified, sophisticated and non-standard baskets of goods forMalaysia is identified by Felipe as the reason for the country to be stuck in themiddle-income trap.
In the case of China’s trade with ASEAN, Azhar and colleagues (2012) used a newdynamic measure of differentiated intra-industry trade to show the impact of theemergence of China on the quality of exports and imports to and from Malaysia,Singapore and Indonesia to China from 1994 to 2004. Their results suggest that forthe most part, China’s neighbours have benefitted from China’s increasing demand forimported goods as all the three countries in their study have managed to maintain theirposition as the producer of high quality varieties. Devadason (2009), finds in her studieson Malaysia’s network trade with China from 1990 to 2004 that there are improvementsin the quality of products destined to China, thereby reflecting a movement up thevalue chain. However, she cautions that the narrowing between the unit values ofexports and imports may imply less product development. Moreover, she also findsthat there is evidence of no skill upgrading in Malaysia’s trade with China and this mayhave contributed to the low levels of export values of high-quality varieties in matchedtrade between Malaysia with China and India (Devadason 2008). For ASEAN,Devadason (2011) finds that although high-quality vertical intra-industry trade dom-inates the intra-industry trade between ASEAN and China and also intra-ASEAN trade,there is no clear quality advantage for the products traded by Singapore, Malaysia andThailand with China for the period 1995–2006.
Despite the importance of and aspirations for upgrading, it has not been extensivelystudied in ASEAN trade relations with China, especially for ICT and PNC trade afterthe GFC. Rasiah, Yap, and Govindaraju (2014), for example, compared the impact ofthe two crises, namely the Asian Financial Crisis and the GFC on electronics exportsfrom the founder ASEAN member states. They conclude that the GFC reduced electro-nics exports from these countries due to the contraction in demand in the US duringthe crisis. Their detailed analysis, however, does not focus specifically on the trade linksbetween ASEAN and China as this is not within the scope of their article.
Salient Features of Trade Between ASEAN and China
Trade between ASEAN economies and China in the manufacturing sector has increasedsteadily since the Asian Financial Crisis. Table 1 shows the increasing importance ofChina as a trading partner with ASEAN countries in manufactured goods. For
JOURNAL OF CONTEMPORARY ASIA 683
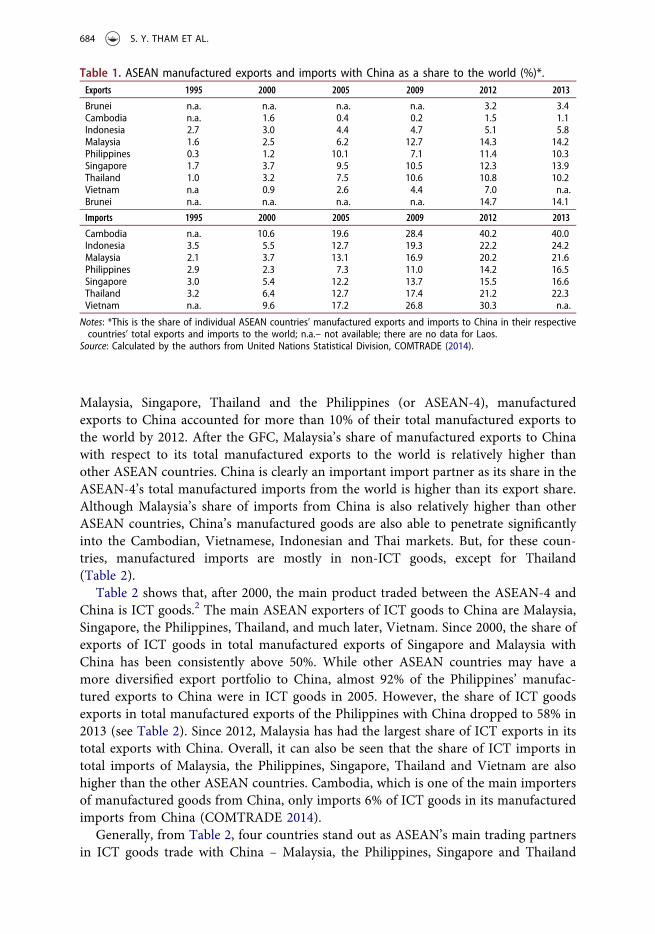
Malaysia, Singapore, Thailand and the Philippines (or ASEAN-4), manufacturedexports to China accounted for more than 10% of their total manufactured exports tothe world by 2012. After the GFC, Malaysia’s share of manufactured exports to Chinawith respect to its total manufactured exports to the world is relatively higher thanother ASEAN countries. China is clearly an important import partner as its share in theASEAN-4’s total manufactured imports from the world is higher than its export share.Although Malaysia’s share of imports from China is also relatively higher than otherASEAN countries, China’s manufactured goods are also able to penetrate significantlyinto the Cambodian, Vietnamese, Indonesian and Thai markets. But, for these coun-tries, manufactured imports are mostly in non-ICT goods, except for Thailand(Table 2).
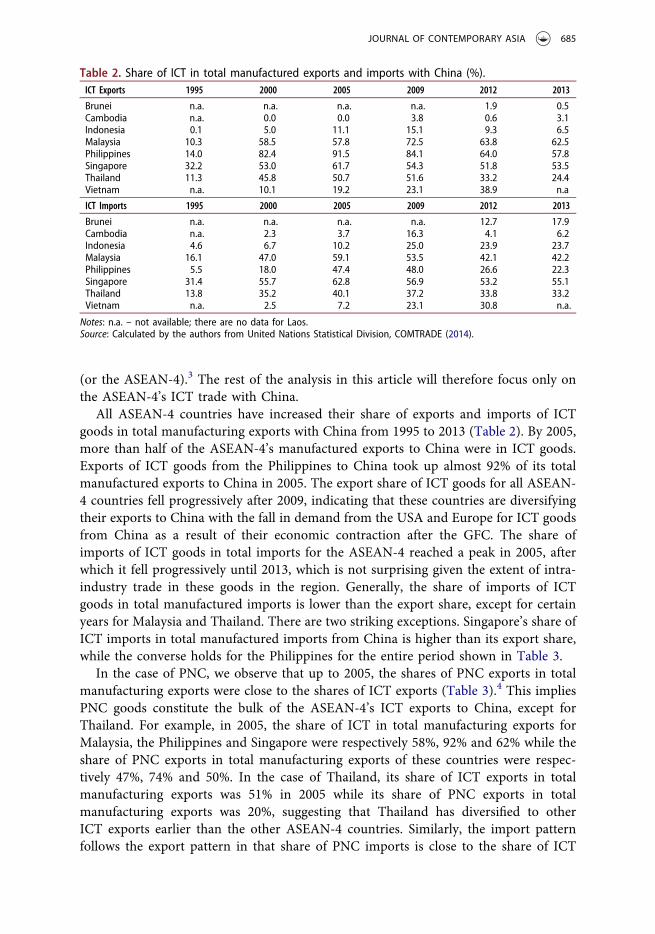
Table 2 shows that, after 2000, the main product traded between the ASEAN-4 andChina is ICT goods.2 The main ASEAN exporters of ICT goods to China are Malaysia,Singapore, the Philippines, Thailand, and much later, Vietnam. Since 2000, the share ofexports of ICT goods in total manufactured exports of Singapore and Malaysia withChina has been consistently above 50%. While other ASEAN countries may have amore diversified export portfolio to China, almost 92% of the Philippines’ manufac-tured exports to China were in ICT goods in 2005. However, the share of ICT goodsexports in total manufactured exports of the Philippines with China dropped to 58% in2013 (see Table 2). Since 2012, Malaysia has had the largest share of ICT exports in itstotal exports with China. Overall, it can also be seen that the share of ICT imports intotal imports of Malaysia, the Philippines, Singapore, Thailand and Vietnam are alsohigher than the other ASEAN countries. Cambodia, which is one of the main importersof manufactured goods from China, only imports 6% of ICT goods in its manufacturedimports from China (COMTRADE 2014).
Generally, from Table 2, four countries stand out as ASEAN’s main trading partnersin ICT goods trade with China – Malaysia, the Philippines, Singapore and Thailand
Table 1. ASEAN manufactured exports and imports with China as a share to the world (%)*.Exports 1995 2000 2005 2009 2012 2013
Brunei n.a. n.a. n.a. n.a. 3.2 3.4Cambodia n.a. 1.6 0.4 0.2 1.5 1.1Indonesia 2.7 3.0 4.4 4.7 5.1 5.8Malaysia 1.6 2.5 6.2 12.7 14.3 14.2Philippines 0.3 1.2 10.1 7.1 11.4 10.3Singapore 1.7 3.7 9.5 10.5 12.3 13.9Thailand 1.0 3.2 7.5 10.6 10.8 10.2Vietnam n.a 0.9 2.6 4.4 7.0 n.a.Brunei n.a. n.a. n.a. n.a. 14.7 14.1
Imports 1995 2000 2005 2009 2012 2013
Cambodia n.a. 10.6 19.6 28.4 40.2 40.0Indonesia 3.5 5.5 12.7 19.3 22.2 24.2Malaysia 2.1 3.7 13.1 16.9 20.2 21.6Philippines 2.9 2.3 7.3 11.0 14.2 16.5Singapore 3.0 5.4 12.2 13.7 15.5 16.6Thailand 3.2 6.4 12.7 17.4 21.2 22.3Vietnam n.a. 9.6 17.2 26.8 30.3 n.a.
Notes: *This is the share of individual ASEAN countries’ manufactured exports and imports to China in their respectivecountries’ total exports and imports to the world; n.a.– not available; there are no data for Laos.
Source: Calculated by the authors from United Nations Statistical Division, COMTRADE (2014).
684 S. Y. THAM ET AL.
(or the ASEAN-4).3 The rest of the analysis in this article will therefore focus only onthe ASEAN-4’s ICT trade with China.
All ASEAN-4 countries have increased their share of exports and imports of ICTgoods in total manufacturing exports with China from 1995 to 2013 (Table 2). By 2005,more than half of the ASEAN-4’s manufactured exports to China were in ICT goods.Exports of ICT goods from the Philippines to China took up almost 92% of its totalmanufactured exports to China in 2005. The export share of ICT goods for all ASEAN-4 countries fell progressively after 2009, indicating that these countries are diversifyingtheir exports to China with the fall in demand from the USA and Europe for ICT goodsfrom China as a result of their economic contraction after the GFC. The share ofimports of ICT goods in total imports for the ASEAN-4 reached a peak in 2005, afterwhich it fell progressively until 2013, which is not surprising given the extent of intra-industry trade in these goods in the region. Generally, the share of imports of ICTgoods in total manufactured imports is lower than the export share, except for certainyears for Malaysia and Thailand. There are two striking exceptions. Singapore’s share ofICT imports in total manufactured imports from China is higher than its export share,while the converse holds for the Philippines for the entire period shown in Table 3.
In the case of PNC, we observe that up to 2005, the shares of PNC exports in totalmanufacturing exports were close to the shares of ICT exports (Table 3).4 This impliesPNC goods constitute the bulk of the ASEAN-4’s ICT exports to China, except forThailand. For example, in 2005, the share of ICT in total manufacturing exports forMalaysia, the Philippines and Singapore were respectively 58%, 92% and 62% while theshare of PNC exports in total manufacturing exports of these countries were respec-tively 47%, 74% and 50%. In the case of Thailand, its share of ICT exports in totalmanufacturing exports was 51% in 2005 while its share of PNC exports in totalmanufacturing exports was 20%, suggesting that Thailand has diversified to otherICT exports earlier than the other ASEAN-4 countries. Similarly, the import patternfollows the export pattern in that share of PNC imports is close to the share of ICT
Table 2. Share of ICT in total manufactured exports and imports with China (%).ICT Exports 1995 2000 2005 2009 2012 2013
Brunei n.a. n.a. n.a. n.a. 1.9 0.5Cambodia n.a. 0.0 0.0 3.8 0.6 3.1Indonesia 0.1 5.0 11.1 15.1 9.3 6.5Malaysia 10.3 58.5 57.8 72.5 63.8 62.5Philippines 14.0 82.4 91.5 84.1 64.0 57.8Singapore 32.2 53.0 61.7 54.3 51.8 53.5Thailand 11.3 45.8 50.7 51.6 33.2 24.4Vietnam n.a. 10.1 19.2 23.1 38.9 n.a
ICT Imports 1995 2000 2005 2009 2012 2013
Brunei n.a. n.a. n.a. n.a. 12.7 17.9Cambodia n.a. 2.3 3.7 16.3 4.1 6.2Indonesia 4.6 6.7 10.2 25.0 23.9 23.7Malaysia 16.1 47.0 59.1 53.5 42.1 42.2Philippines 5.5 18.0 47.4 48.0 26.6 22.3Singapore 31.4 55.7 62.8 56.9 53.2 55.1Thailand 13.8 35.2 40.1 37.2 33.8 33.2Vietnam n.a. 2.5 7.2 23.1 30.8 n.a.
Notes: n.a. – not available; there are no data for Laos.Source: Calculated by the authors from United Nations Statistical Division, COMTRADE (2014).
JOURNAL OF CONTEMPORARY ASIA 685
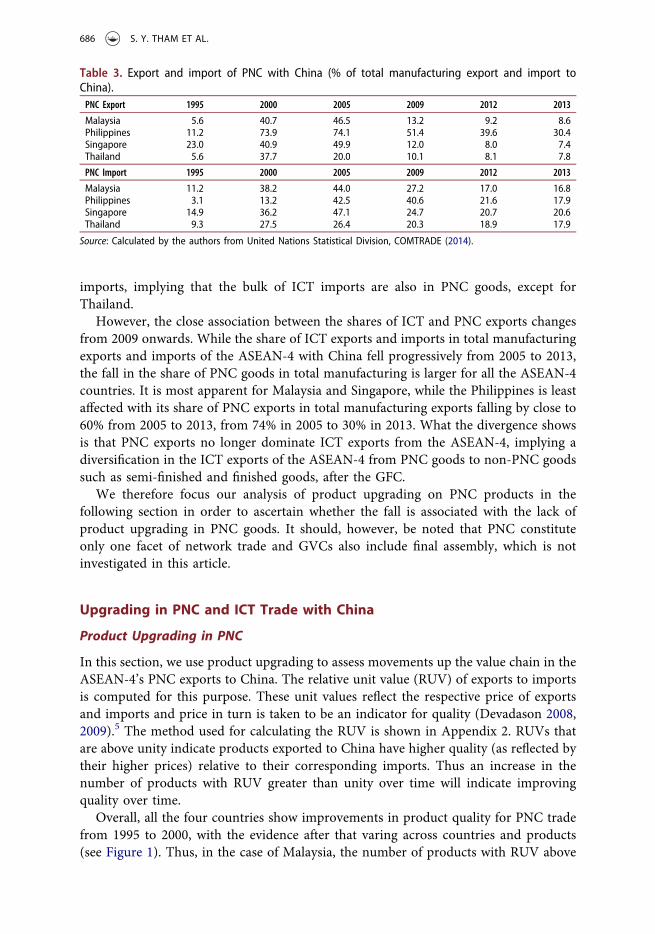
imports, implying that the bulk of ICT imports are also in PNC goods, except forThailand.
However, the close association between the shares of ICT and PNC exports changesfrom 2009 onwards. While the share of ICT exports and imports in total manufacturingexports and imports of the ASEAN-4 with China fell progressively from 2005 to 2013,the fall in the share of PNC goods in total manufacturing is larger for all the ASEAN-4countries. It is most apparent for Malaysia and Singapore, while the Philippines is leastaffected with its share of PNC exports in total manufacturing exports falling by close to60% from 2005 to 2013, from 74% in 2005 to 30% in 2013. What the divergence showsis that PNC exports no longer dominate ICT exports from the ASEAN-4, implying adiversification in the ICT exports of the ASEAN-4 from PNC goods to non-PNC goodssuch as semi-finished and finished goods, after the GFC.
We therefore focus our analysis of product upgrading on PNC products in thefollowing section in order to ascertain whether the fall is associated with the lack ofproduct upgrading in PNC goods. It should, however, be noted that PNC constituteonly one facet of network trade and GVCs also include final assembly, which is notinvestigated in this article.
Upgrading in PNC and ICT Trade with China
Product Upgrading in PNC
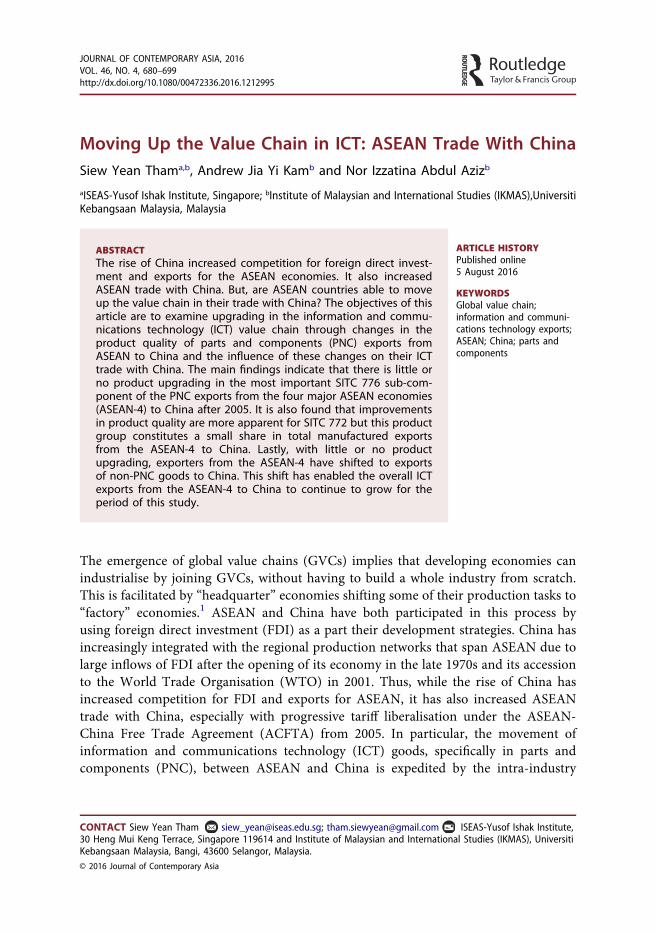
In this section, we use product upgrading to assess movements up the value chain in theASEAN-4’s PNC exports to China. The relative unit value (RUV) of exports to importsis computed for this purpose. These unit values reflect the respective price of exportsand imports and price in turn is taken to be an indicator for quality (Devadason 2008,2009).5 The method used for calculating the RUV is shown in Appendix 2. RUVs thatare above unity indicate products exported to China have higher quality (as reflected bytheir higher prices) relative to their corresponding imports. Thus an increase in thenumber of products with RUV greater than unity over time will indicate improvingquality over time.
Overall, all the four countries show improvements in product quality for PNC tradefrom 1995 to 2000, with the evidence after that varing across countries and products(see Figure 1). Thus, in the case of Malaysia, the number of products with RUV above
Table 3. Export and import of PNC with China (% of total manufacturing export and import toChina).PNC Export 1995 2000 2005 2009 2012 2013
Malaysia 5.6 40.7 46.5 13.2 9.2 8.6Philippines 11.2 73.9 74.1 51.4 39.6 30.4Singapore 23.0 40.9 49.9 12.0 8.0 7.4Thailand 5.6 37.7 20.0 10.1 8.1 7.8
PNC Import 1995 2000 2005 2009 2012 2013
Malaysia 11.2 38.2 44.0 27.2 17.0 16.8Philippines 3.1 13.2 42.5 40.6 21.6 17.9Singapore 14.9 36.2 47.1 24.7 20.7 20.6Thailand 9.3 27.5 26.4 20.3 18.9 17.9
Source: Calculated by the authors from United Nations Statistical Division, COMTRADE (2014).
686 S. Y. THAM ET AL.
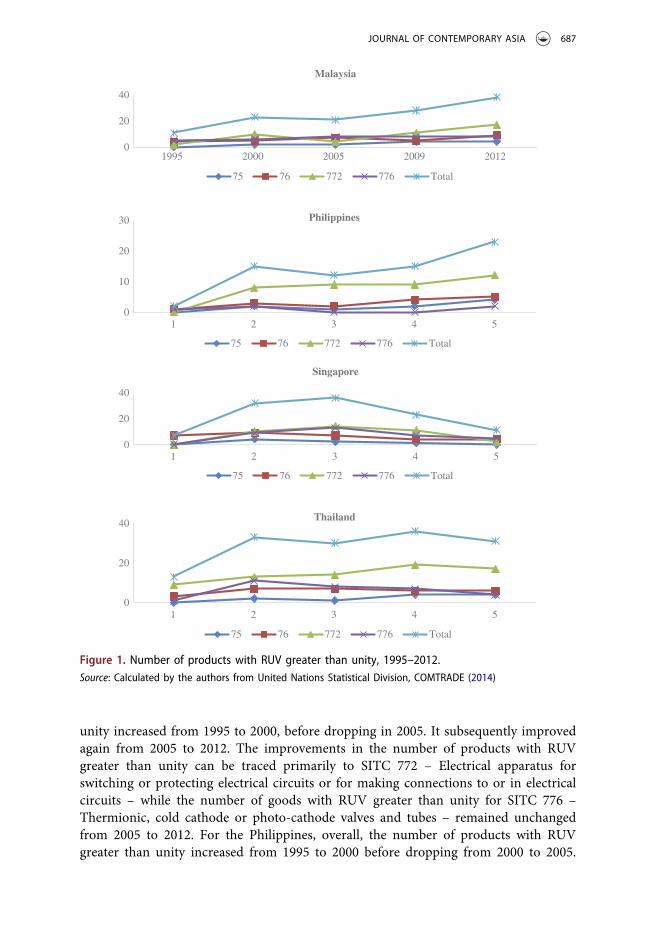
unity increased from 1995 to 2000, before dropping in 2005. It subsequently improvedagain from 2005 to 2012. The improvements in the number of products with RUVgreater than unity can be traced primarily to SITC 772 – Electrical apparatus forswitching or protecting electrical circuits or for making connections to or in electricalcircuits – while the number of goods with RUV greater than unity for SITC 776 –Thermionic, cold cathode or photo-cathode valves and tubes – remained unchangedfrom 2005 to 2012. For the Philippines, overall, the number of products with RUVgreater than unity increased from 1995 to 2000 before dropping from 2000 to 2005.
0
20
40
1995 2000 2005 2009 2012
Malaysia
75 76 772 776 Total
0
10
20
30
1 2 3 4 5
Philippines
75 76 772 776 Total
0
20
40
1 2 3 4 5
Singapore
75 76 772 776 Total
0
20
40
1 2 3 4 5
Thailand
75 76 772 776 Total
Figure 1. Number of products with RUV greater than unity, 1995–2012.Source: Calculated by the authors from United Nations Statistical Division, COMTRADE (2014)
JOURNAL OF CONTEMPORARY ASIA 687
From 2009 to 2012, the number of products with RUV greater than unity showed smallimprovements in all product lines. In Singapore’s case, the number of products withRUV greater than unity increased from 1995 to 2005, after which it fell progressively to2012, due to the drop observed in SITC 772 and SITC 776 (Figure 1). Thailand showsmixed patterns; with improvements in the number of products with RUV greater thanunity from 1995 to 2000 before falling slightly in 2005. There was an increase in thenumber of products with RUV greater than unity in 2009 before dropping in 2012.Improvements in quality are mostly seen for SITC 772 from 1995 to 2009. Figure 1 alsoshows that SITC 772 shows the highest number of products with RUV greater thanunity for all the ASEAN-4 for most of the years from 2000 to 2012.
The observed pattern of change can be explained by several factors, includingcountry-specific reasons. The number of product lines in each of the SITC commoditygroups are different. SITC 75 and 76 have the least number of product lines (4 and 11respectively), while SITC 772 and 776 have the most (23 and 19, respectively).Moreover, the technology intensity of the products differs. Based on the Organisationfor Economic Co-operation and Development’s (OECD) technology classification ofmanufacturing industries, SITC 75 and 76 are high-technology manufacturing indus-tries while SITC 772 and 776 are medium- to high-technology industries (Nayak,Aggarwal, and Mann 2013). The skill intensity of SITC 772 and 776 are also differentas the former is classified as medium skill while the latter is high skill (Wei andBalasubramanyam 2015). Given that the Philippines and Thailand are at the learningphase of technology development while Malaysia is at the catch-up phase and that thereis a shortage of skilled labor in all these countries, improving product quality in SITC75, 76 and 776 will be harder for these three countries compared to SITC 772 (Wong2013; Iredale et al., 2014; Rasiah 2014).
Technology development in the Pihlippines, Malaysia and Thailand has been depen-dent on spillovers from the multinationals operating in these countries and publicinstitutions rather than the private sector (Chu and Hill 2006). Moreover, the policyframework needed to co-ordinate the relationship that is necessary between macro-institutions, meso-organisations and micro-agents for stimulating innovation in thesecountries is either weak or lacking (Rasiah 2014). In addition, although Malaysia showsgreater progress in terms of the number of products with quality improvement over thetime period of this study, the country’s flexible labor policy through the use of cheapmigrant workers may have deterred more local firms from moving up the value chainfrom assembly to product development (Samel 2012).
The case of Singapore is different as the country is already at the frontier stage oftechnology development based on Rasiah’s (2014) typology. Singapore’s policies havefocused more on functional upgrading to shift from mere assembly operations toassembly and test, wafer fabrication, R&D support, chip design and R&D. The declinein product quality improvement for Singapore’s PNC trade as shown in Figure 1 reflectsthe declining importance of this segment of ICT trade for Singapore as the country hasmoved up the GVC towards the higher value-added end.
Table 4 shows the bilateral revealed comparative advantage (RCA) for all the PNCproducts for the ASEAN-4 with China (see Appendix 2 for method for computing theRCAs). The number of products with RCA greater than 1 for the ASEAN-4 as a grouphas decreased steadily from 45 in 1995 to 41 in 2013, while conversely the number of
688 S. Y. THAM ET AL.
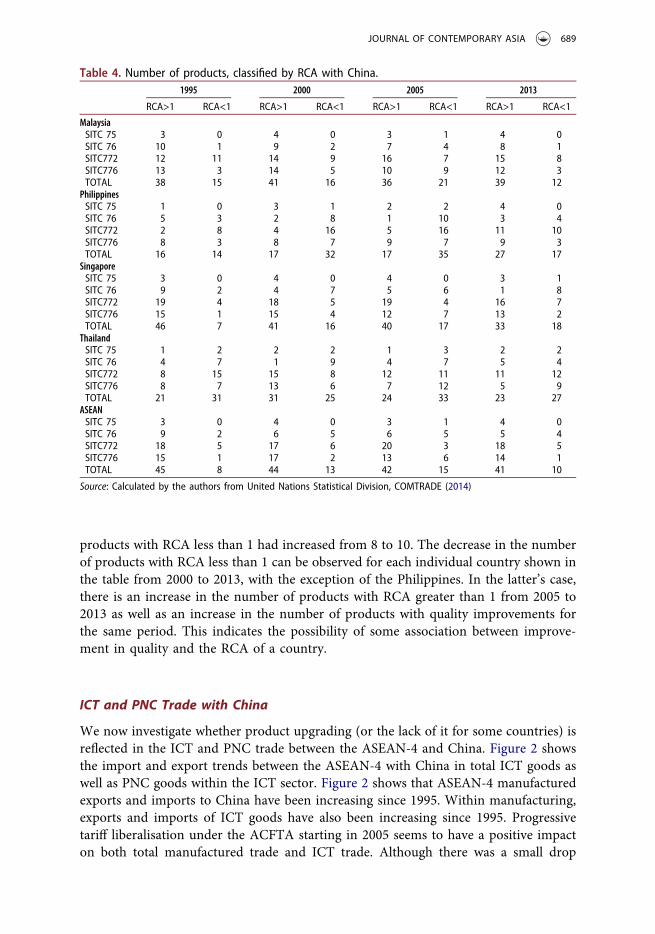
products with RCA less than 1 had increased from 8 to 10. The decrease in the numberof products with RCA less than 1 can be observed for each individual country shown inthe table from 2000 to 2013, with the exception of the Philippines. In the latter’s case,there is an increase in the number of products with RCA greater than 1 from 2005 to2013 as well as an increase in the number of products with quality improvements forthe same period. This indicates the possibility of some association between improve-ment in quality and the RCA of a country.
ICT and PNC Trade with China
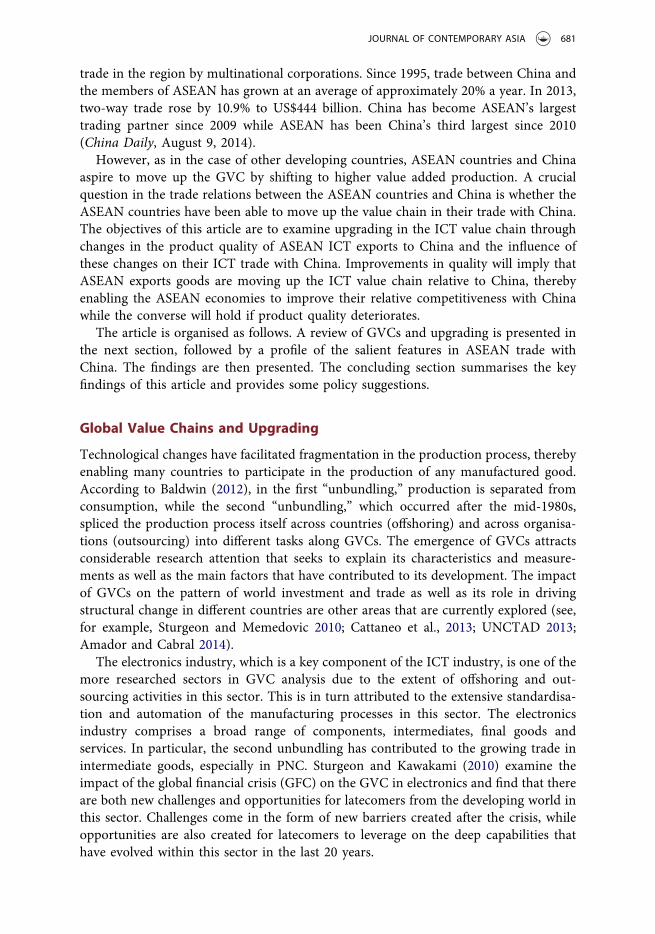
We now investigate whether product upgrading (or the lack of it for some countries) isreflected in the ICT and PNC trade between the ASEAN-4 and China. Figure 2 showsthe import and export trends between the ASEAN-4 with China in total ICT goods aswell as PNC goods within the ICT sector. Figure 2 shows that ASEAN-4 manufacturedexports and imports to China have been increasing since 1995. Within manufacturing,exports and imports of ICT goods have also been increasing since 1995. Progressivetariff liberalisation under the ACFTA starting in 2005 seems to have a positive impacton both total manufactured trade and ICT trade. Although there was a small drop
Table 4. Number of products, classified by RCA with China.1995 2000 2005 2013
RCA>1 RCA<1 RCA>1 RCA<1 RCA>1 RCA<1 RCA>1 RCA<1
MalaysiaSITC 75 3 0 4 0 3 1 4 0SITC 76 10 1 9 2 7 4 8 1SITC772 12 11 14 9 16 7 15 8SITC776 13 3 14 5 10 9 12 3TOTAL 38 15 41 16 36 21 39 12
PhilippinesSITC 75 1 0 3 1 2 2 4 0SITC 76 5 3 2 8 1 10 3 4SITC772 2 8 4 16 5 16 11 10SITC776 8 3 8 7 9 7 9 3TOTAL 16 14 17 32 17 35 27 17
SingaporeSITC 75 3 0 4 0 4 0 3 1SITC 76 9 2 4 7 5 6 1 8SITC772 19 4 18 5 19 4 16 7SITC776 15 1 15 4 12 7 13 2TOTAL 46 7 41 16 40 17 33 18
ThailandSITC 75 1 2 2 2 1 3 2 2SITC 76 4 7 1 9 4 7 5 4SITC772 8 15 15 8 12 11 11 12SITC776 8 7 13 6 7 12 5 9TOTAL 21 31 31 25 24 33 23 27
ASEANSITC 75 3 0 4 0 3 1 4 0SITC 76 9 2 6 5 6 5 5 4SITC772 18 5 17 6 20 3 18 5SITC776 15 1 17 2 13 6 14 1TOTAL 45 8 44 13 42 15 41 10
Source: Calculated by the authors from United Nations Statistical Division, COMTRADE (2014)
JOURNAL OF CONTEMPORARY ASIA 689
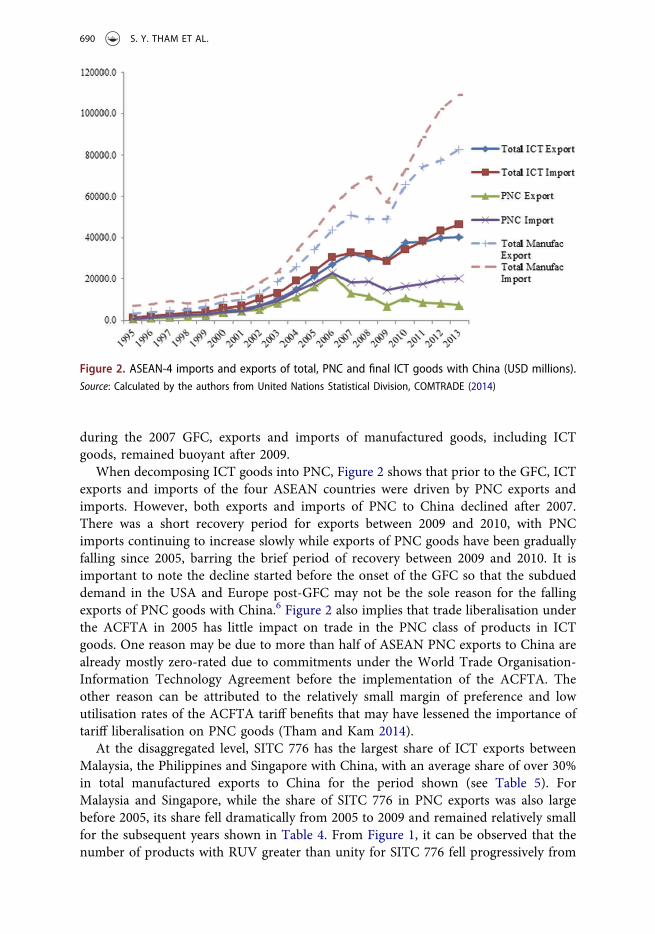
during the 2007 GFC, exports and imports of manufactured goods, including ICTgoods, remained buoyant after 2009.
When decomposing ICT goods into PNC, Figure 2 shows that prior to the GFC, ICTexports and imports of the four ASEAN countries were driven by PNC exports andimports. However, both exports and imports of PNC to China declined after 2007.There was a short recovery period for exports between 2009 and 2010, with PNCimports continuing to increase slowly while exports of PNC goods have been graduallyfalling since 2005, barring the brief period of recovery between 2009 and 2010. It isimportant to note the decline started before the onset of the GFC so that the subdueddemand in the USA and Europe post-GFC may not be the sole reason for the fallingexports of PNC goods with China.6 Figure 2 also implies that trade liberalisation underthe ACFTA in 2005 has little impact on trade in the PNC class of products in ICTgoods. One reason may be due to more than half of ASEAN PNC exports to China arealready mostly zero-rated due to commitments under the World Trade Organisation-Information Technology Agreement before the implementation of the ACFTA. Theother reason can be attributed to the relatively small margin of preference and lowutilisation rates of the ACFTA tariff benefits that may have lessened the importance oftariff liberalisation on PNC goods (Tham and Kam 2014).
At the disaggregated level, SITC 776 has the largest share of ICT exports betweenMalaysia, the Philippines and Singapore with China, with an average share of over 30%in total manufactured exports to China for the period shown (see Table 5). ForMalaysia and Singapore, while the share of SITC 776 in PNC exports was also largebefore 2005, its share fell dramatically from 2005 to 2009 and remained relatively smallfor the subsequent years shown in Table 4. From Figure 1, it can be observed that thenumber of products with RUV greater than unity for SITC 776 fell progressively from
Figure 2. ASEAN-4 imports and exports of total, PNC and final ICT goods with China (USD millions).Source: Calculated by the authors from United Nations Statistical Division, COMTRADE (2014)
690 S. Y. THAM ET AL.
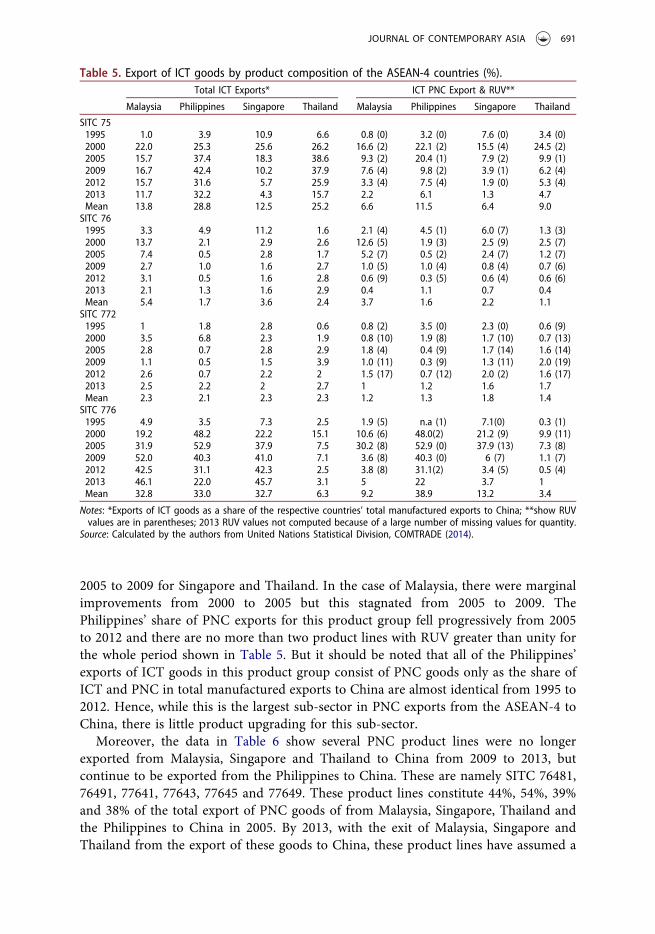
2005 to 2009 for Singapore and Thailand. In the case of Malaysia, there were marginalimprovements from 2000 to 2005 but this stagnated from 2005 to 2009. ThePhilippines’ share of PNC exports for this product group fell progressively from 2005to 2012 and there are no more than two product lines with RUV greater than unity forthe whole period shown in Table 5. But it should be noted that all of the Philippines’exports of ICT goods in this product group consist of PNC goods only as the share ofICT and PNC in total manufactured exports to China are almost identical from 1995 to2012. Hence, while this is the largest sub-sector in PNC exports from the ASEAN-4 toChina, there is little product upgrading for this sub-sector.
Moreover, the data in Table 6 show several PNC product lines were no longerexported from Malaysia, Singapore and Thailand to China from 2009 to 2013, butcontinue to be exported from the Philippines to China. These are namely SITC 76481,76491, 77641, 77643, 77645 and 77649. These product lines constitute 44%, 54%, 39%and 38% of the total export of PNC goods of from Malaysia, Singapore, Thailand andthe Philippines to China in 2005. By 2013, with the exit of Malaysia, Singapore andThailand from the export of these goods to China, these product lines have assumed a
Table 5. Export of ICT goods by product composition of the ASEAN-4 countries (%).Total ICT Exports* ICT PNC Export & RUV**
Malaysia Philippines Singapore Thailand Malaysia Philippines Singapore Thailand
SITC 751995 1.0 3.9 10.9 6.6 0.8 (0) 3.2 (0) 7.6 (0) 3.4 (0)2000 22.0 25.3 25.6 26.2 16.6 (2) 22.1 (2) 15.5 (4) 24.5 (2)2005 15.7 37.4 18.3 38.6 9.3 (2) 20.4 (1) 7.9 (2) 9.9 (1)2009 16.7 42.4 10.2 37.9 7.6 (4) 9.8 (2) 3.9 (1) 6.2 (4)2012 15.7 31.6 5.7 25.9 3.3 (4) 7.5 (4) 1.9 (0) 5.3 (4)2013 11.7 32.2 4.3 15.7 2.2 6.1 1.3 4.7Mean 13.8 28.8 12.5 25.2 6.6 11.5 6.4 9.0
SITC 761995 3.3 4.9 11.2 1.6 2.1 (4) 4.5 (1) 6.0 (7) 1.3 (3)2000 13.7 2.1 2.9 2.6 12.6 (5) 1.9 (3) 2.5 (9) 2.5 (7)2005 7.4 0.5 2.8 1.7 5.2 (7) 0.5 (2) 2.4 (7) 1.2 (7)2009 2.7 1.0 1.6 2.7 1.0 (5) 1.0 (4) 0.8 (4) 0.7 (6)2012 3.1 0.5 1.6 2.8 0.6 (9) 0.3 (5) 0.6 (4) 0.6 (6)2013 2.1 1.3 1.6 2.9 0.4 1.1 0.7 0.4Mean 5.4 1.7 3.6 2.4 3.7 1.6 2.2 1.1
SITC 7721995 1 1.8 2.8 0.6 0.8 (2) 3.5 (0) 2.3 (0) 0.6 (9)2000 3.5 6.8 2.3 1.9 0.8 (10) 1.9 (8) 1.7 (10) 0.7 (13)2005 2.8 0.7 2.8 2.9 1.8 (4) 0.4 (9) 1.7 (14) 1.6 (14)2009 1.1 0.5 1.5 3.9 1.0 (11) 0.3 (9) 1.3 (11) 2.0 (19)2012 2.6 0.7 2.2 2 1.5 (17) 0.7 (12) 2.0 (2) 1.6 (17)2013 2.5 2.2 2 2.7 1 1.2 1.6 1.7Mean 2.3 2.1 2.3 2.3 1.2 1.3 1.8 1.4
SITC 7761995 4.9 3.5 7.3 2.5 1.9 (5) n.a (1) 7.1(0) 0.3 (1)2000 19.2 48.2 22.2 15.1 10.6 (6) 48.0(2) 21.2 (9) 9.9 (11)2005 31.9 52.9 37.9 7.5 30.2 (8) 52.9 (0) 37.9 (13) 7.3 (8)2009 52.0 40.3 41.0 7.1 3.6 (8) 40.3 (0) 6 (7) 1.1 (7)2012 42.5 31.1 42.3 2.5 3.8 (8) 31.1(2) 3.4 (5) 0.5 (4)2013 46.1 22.0 45.7 3.1 5 22 3.7 1Mean 32.8 33.0 32.7 6.3 9.2 38.9 13.2 3.4
Notes: *Exports of ICT goods as a share of the respective countries’ total manufactured exports to China; **show RUVvalues are in parentheses; 2013 RUV values not computed because of a large number of missing values for quantity.
Source: Calculated by the authors from United Nations Statistical Division, COMTRADE (2014).
JOURNAL OF CONTEMPORARY ASIA 691
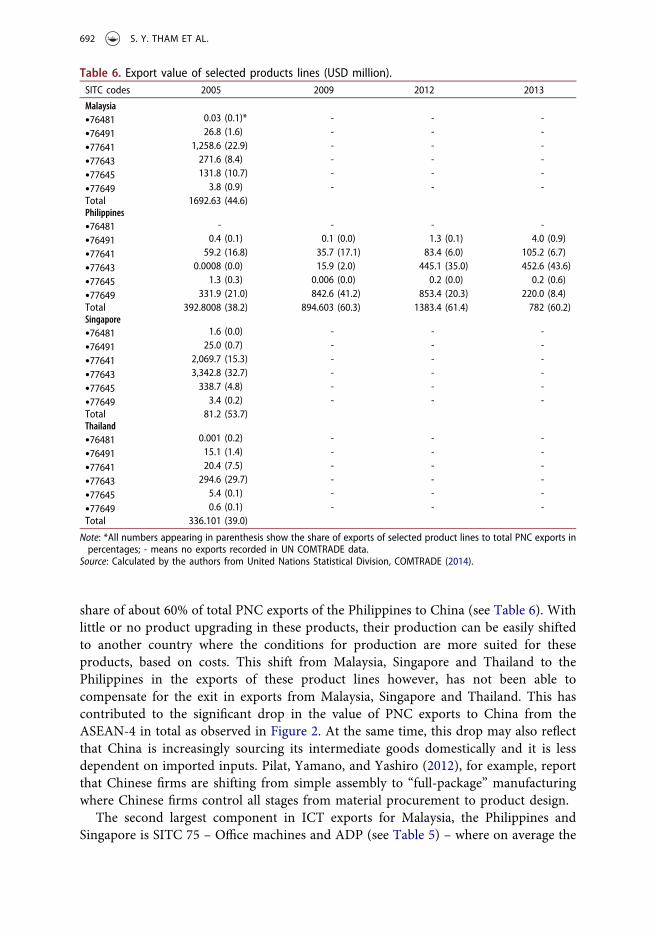
share of about 60% of total PNC exports of the Philippines to China (see Table 6). Withlittle or no product upgrading in these products, their production can be easily shiftedto another country where the conditions for production are more suited for theseproducts, based on costs. This shift from Malaysia, Singapore and Thailand to thePhilippines in the exports of these product lines however, has not been able tocompensate for the exit in exports from Malaysia, Singapore and Thailand. This hascontributed to the significant drop in the value of PNC exports to China from theASEAN-4 in total as observed in Figure 2. At the same time, this drop may also reflectthat China is increasingly sourcing its intermediate goods domestically and it is lessdependent on imported inputs. Pilat, Yamano, and Yashiro (2012), for example, reportthat Chinese firms are shifting from simple assembly to “full-package” manufacturingwhere Chinese firms control all stages from material procurement to product design.
The second largest component in ICT exports for Malaysia, the Philippines andSingapore is SITC 75 – Office machines and ADP (see Table 5) – where on average the
Table 6. Export value of selected products lines (USD million).SITC codes 2005 2009 2012 2013
Malaysia
•76481 0.03 (0.1)* - - -
•76491 26.8 (1.6) - - -
•77641 1,258.6 (22.9) - - -
•77643 271.6 (8.4) - - -
•77645 131.8 (10.7) - - -
•77649 3.8 (0.9) - - -Total 1692.63 (44.6)Philippines
•76481 - - - -
•76491 0.4 (0.1) 0.1 (0.0) 1.3 (0.1) 4.0 (0.9)
•77641 59.2 (16.8) 35.7 (17.1) 83.4 (6.0) 105.2 (6.7)
•77643 0.0008 (0.0) 15.9 (2.0) 445.1 (35.0) 452.6 (43.6)
•77645 1.3 (0.3) 0.006 (0.0) 0.2 (0.0) 0.2 (0.6)
•77649 331.9 (21.0) 842.6 (41.2) 853.4 (20.3) 220.0 (8.4)Total 392.8008 (38.2) 894.603 (60.3) 1383.4 (61.4) 782 (60.2)Singapore
•76481 1.6 (0.0) - - -
•76491 25.0 (0.7) - - -
•77641 2,069.7 (15.3) - - -
•77643 3,342.8 (32.7) - - -
•77645 338.7 (4.8) - - -
•77649 3.4 (0.2) - - -Total 81.2 (53.7)Thailand
•76481 0.001 (0.2) - - -
•76491 15.1 (1.4) - - -
•77641 20.4 (7.5) - - -
•77643 294.6 (29.7) - - -
•77645 5.4 (0.1) - - -
•77649 0.6 (0.1) - - -Total 336.101 (39.0)
Note: *All numbers appearing in parenthesis show the share of exports of selected product lines to total PNC exports inpercentages; - means no exports recorded in UN COMTRADE data.
Source: Calculated by the authors from United Nations Statistical Division, COMTRADE (2014).
692 S. Y. THAM ET AL.
share of this product group in total manufactured exports is 14%, 29%, and 13%respectively. It is the largest component of ICT product exported from Thailand toChina, averaging 25% for the period shown in Table 5. The share of PNC exports toChina in this product group also fell sharply for Malaysia, Singapore and Thailand from2005 onwards and from 2009 onwards for the Philippines. Figure 1 shows littleupgrading in this product group. Similarly, in the case of SITC 76 –Telecommunications and sound recording equipment – there is little product upgrad-ing and the shares of PNC exports of this product group to China also fell sharply forMalaysia as well as for the other countries over time.
The largest number of products with RUV greater than unity and hence higherquality as well as an increase in the number of products with RUV greater than unity isobserved for product group SITC 772, for all the ASEAN-4. However, the share of PNCexports in this product group is rather small, averaging less than 1.8 % (Table 5).Singapore shows progressive deterioration in the quality of its exports as the number ofproducts greater than unity fell progressively from 2005 to 2012. Improvements can beobserved for the Philippines. However, since this product group is only a smallcomponent for PNC exports, it cannot offset the sharp drops in the shares of PNCexports observed in Table 4 for the other sub-components, and hence, there is asignificant drop in PNC exports of the ASEAN-4 with China as highlighted in Figure 2.
It is important to note that the changes observed above only refer to productupgrading in PNC goods, as captured by price changes. Other studies, such as Rasiahand Yap (2014), indicate that technological upgrading in terms of horizontal andfunctional upgrading can be observed in the integrated circuits industry in Malaysia(Penang and Kulim Tech Park). This observed technological upgrading can help toexplain the increasing ICT exports from Malaysia to China but not the decline in PNCexports observed after 2005.
Conclusion
ASEAN trade in manufactured goods with China is primarily dominated by theASEAN-4 countries, namely Malaysia, the Philippines, Singapore and Thailand. Thistrade is focused mainly in the ICT sector, primarily in PNC trade. However, the shareof exports of PNC goods to total manufactured goods fell sharply after 2005. Adverseexternal circumstances such as the economic impact of the GFC on the final demandcountries such as the European Union and the USA have affected the ICT trade of thecountries engaged in the GVC in this sector and this has contributed to the economiccontraction observed in the ASEAN-4 countries in 2008/09. Post-GFC, the ASEAN-4’sgrowth has recovered and although there are restructuring problems in all thesecountries, the trade in ICT goods between the ASEAN-4 and China has also recovered,though imports are growing faster than exports after 2011.
There is a noticeable drop in the PNC exports of the ASEAN-4 to China after 2005that indicates a shift that predates the adverse circumstances of the GFC. The mainfindings of this study indicate that there is little or no product upgrading in the mostimportant sub-component of the PNC exports from the ASEAN-4 to China, namelySITC 776. Instead, four product lines in SITC 776 are no longer exported fromMalaysia, Singapore and Thailand to China, after 2005. It would appear that
JOURNAL OF CONTEMPORARY ASIA 693
Malaysia, Singapore and Thailand are no longer able to compete in exports to China asthere have been few improvements in the quality of this group of products that isexported to China for the period of this study. Rising costs of production in thesecountries have led to the relocation of the production and export of SITC 776 to thePhilippines. This is bolstered by the relatively lower wages in the Philippines(Deveonshire-Ellis 2014) and improvements in its economic performance withincreased spending on infrastructure post 2010. Therefore, these product lines continueto be exported from the Philippines to China, but their export value in 2013 isconsiderably less than the aggregate export value of the other three ASEAN countriesin 2005. The increase in exports from the Philippines to China is therefore insufficientto compensate for the loss in exports from the Malaysia, Singapore and Thailand toChina, leading to a drop in overall PNC exports to China.
Second, improvements in product quality are more apparent for SITC 772 but thisproduct group constitutes a small share in total manufactured exports from theASEAN-4 to China and hence its impact on overall PNC exports is small and insuffi-cient to compensate for the large drop in exports from SITC 776. Lastly, with little orno product upgrading, especially in SITC 776, exporters from the ASEAN-4 haveshifted to exports of non-PNC goods to China. Whether this shift to non-PNC goodswhich comprises semi-finished and final goods implies downgrading in the GVC for theASEAN-4 warrants a separate study to investigate the upgrading and changes withinthis segment of the GVC. Nevertheless, the shift has enabled the overall ICT exportsfrom the ASEAN-4 to China to continue to grow during the time period of this study.
Recent trends indicate renewed investors’ interest in ASEAN. Increasing wages, anappreciating Renminbi and a shrinking working population are pushing multinationalsto relocate from China (Nguyen 2013). In addition, mounting geopolitical tensionsbetween China and Japan as well as the slowing down of China’s economy have alsoprompted Japan to shift its new investment interests in the next few years to ASEAN inorder to hedge the risks of its investment in China (Reuters, April 18, 2014). There isalso renewed interest in ASEAN as a regional grouping as 2015 draws closer. Althoughthe lofty aims of the ASEAN Economic Community Blueprints are unlikely to beachieved by this deadline, uncertainty in the external environment as well as limitedprogress in multilateral liberalisation will press ASEAN to deepen integration fromwithin.
Moreover, the current negotiations under the Regional Comprehensive EconomicPartnership Agreement (RCEP) aim to enlarge the regional grouping considerably bydrawing in its Plus One Partners. This enlarged and integrated market will add to theattractiveness of the countries of the region as host economies. ASEAN is thus poised toreassume its status as preferred host economies, especially for Japanese direct invest-ment. These future trends indicate another opportunity for Malaysia, Thailand and thePhilippines to use FDI to move up the GVC from their current position, especially innon-PNC goods, based on the shift identified in this article. Appropriate policies needto be formulated to take advantage of this new opportunity to increase the value-addedcontent of electronics production in especially Malaysia, the Phillipines and Thailand.
694 S. Y. THAM ET AL.
Disclosure statement
No potenatial conflict of interest was reported by the authors.
Notes
1. These are economies whose exports contain very little imports as opposed to “factory”economies whose exports contain a large share of imports of intermediate goods.
2. Based on Athukorala (2010), ICT goods are defined as: Office Machines and ADP (SITC-75); Telecommunications and Sound Recording Equipment (SITC-76); Semiconductorand Semiconductor Devices (SITC 772 – Electrical apparatus for switching or protectingelectrical circuits or for making connections to or in electrical circuits (e.g. switches, relays,fuses, lightning arresters, voltage limiters, surge suppressors, plugs and sockets, lamp-holders and junction boxes); electrical resistors (including rheostats and potentiometers),other than heating resistors; printed circuits; boards, panels (including numerical controlpanels), consoles, desks, cabinets and other bases, equipped with two or more apparatusfor switching, protecting or for making connections to or in electrical circuits, for electriccontrol or the distribution of electricity (excluding switching apparatus of subgroup764.1)); and SITC 776 – Thermionic, cold cathode or photo-cathode valves and tubes(e.g. vacuum or vapour or gas-filled valves and tubes, mercury arc rectifying valves andtubes, cathode-ray tubes, television camera tubes); diodes, transistors and similar semi-conductor devices; photosensitive semiconductor devices; light-emitting diodes; mountedpiezoelectric crystals; electronic integrated circuits and microassemblies; parts thereof).
3. Although Vietnam has increasing trade with China in ICT products, because there aremissing data, it is excluded from this study.
4. Refer to Appendix 1 for the list of PNC goods in ICT sectors. Classification is made basedon Athukorala (2010).
5. Devadason (2008) notes that, generally, higher-quality products have higher prices,although unit value measures may also be influenced by other factors such as productioncosts, efficiency and compositional changes.
6. PNC goods exported to China are affected by final demand in the USA and Europe as theyare processed into semi-finished or finished goods before export to those markets.
References
Aldaba, R. 2015. “The Philippines in the Electronics Global Value Chain.” Paper presented at theSecond Workshop on Trade in Value-Added, Tokyo, April 24–26.
Amador, J., and S. Cabral. 2014. “Global Value Chains: Surveying Drivers, Measures andImpacts.” Lisbon: Banco de Portugal Working Papers No. 3/2014. Accessed September 20,2014. http://www.bportugal.pt/en-US/BdP%20Publications%20Research/wp201403.pdf.
Archanun Kohpaiboon, and Nipon Poapongsakorn. 2011. “Industrial Upgrading and GlobalRecession: Evidence of Hard Disk Drive and Automotive Industries in Thailand.” Tokyo:Asian Development Bank Institute, ADBI Working Paper 283. Accessed September 22, 2014.http://www.adb.org/sites/default/files/publication/156138/adbi-wp283.pdf.
Athukorala, P. 2010. “Production Networks and Trade Patterns in East Asia: Regionalization orGlobalization?” Manila: Asian Development Bank Working Papers on Regional EconomicIntegration 56. Accessed September 19, 2014. http://aric.adb.org/pdf/workingpaper/WP56_Trade_Patterns_in_East_Asia.pdf.
Azhar, A., R. Elliott, and J. Liu. 2012. “Product Quality, Trade, and Adjustment: The China-ASEAN Experience.” Global Economy Journal 12 (2). DOI: 10.1515/1524-5861.1675.
JOURNAL OF CONTEMPORARY ASIA 695
Baldwin, R. 2012. ”Global Supply Chains: Why They Emerged, Why They Matter, and WhereAre They Going?” London: Centre for Economic Policy Research CEPR Discussion Paper No.9103. Accessed August 28, 2014. http://www.cepr.org/pubs/dps/DP9103.asp.
Cattaneo, O., G. Gereffi, S. Miroudot, and D. Taglioni. 2013. “Joining, Upgrading and BeingCompetitive in Global Value Chains: A Strategic Framework.” Washington, DC: The WorldBank Policy Research Working Paper 6406. Accessed September 18, 2014. http://go.worldbank.org/ZK9AHXAMV0.
Chu, Y., and H. Hill. 2006. The East Asian High-Tech Drive. Cheltenham: Edward Elgar.COMTRADE, 2014. UN Comtrade Database. Geneva: United Nations. Accessed September 15,
2014. http://comtrade.un.org/db.Devadason, E. 2008. “China and India in World Trade: Are the Asia Giants a Threat to
Malaysia?” Global Economic Review 37 (4): 447–467.Devadason, E. 2009. “Malaysia-China Network Trade: A Note on Product Upgrading.” Journal of
Contemporary Asia 39 (1): 37–51.Devadason, E. S. 2011. “Re-organization of Intra-ASEAN 5 Trade Flows: The ‘China’ Factor.”
Asian Economic Journal 25 (2): 129–149.Deveonshire-Ellis, C. 2014. “China-ASEAN Wage Comparisons and the 70 Percent Production
Capacity Benchmark – China Briefing News.” China Briefing News. Accessed October 24,2014. http://www.china-briefing.com/news/2014/06/03/china-asean-wage-comparisons-70-production-capacity-benchmark.html.
Edgington, D., and R. Hayter. 2013. “The In Situ Upgrading of Japanese Electronics Firms inMalaysian Industrial Cluster.” Economic Geography 89 (3): 227–259.
Ernst, D. 2003. “How Sustainable are Benefits from Global Production Networks? Malaysia’sUpgrading Prospects in the Electronics Industry.” Honolulu: East-West Center Working PapersEconomic Series No. 57. Accessed May 15, 2015. http://www.eastwestcenter.org/publications/how-sustainable-are-benefits-global-production-networks-malaysias-upgrading-prospects-e.
Federick, S., and G. Gereffi. 2013. “Costa Rica in the Electronics Global Value Chain:Opportunities for Upgrading.” Durham: Duke Center on Globalization, Governance &Competitiveness. Accessed September 17, 2014. http://www.cggc.duke.edu/pdfs/2013-08-20_Ch3_Electronics.pdf.
Felipe, J. 2012. “Tracking the Middle-Income Trap: What is It, Who is in It, and Why (Part 2)?”Manila: Asian Development Bank Economics Working Paper Series No. 307. AccessedSeptember 20, 2014. adb.org/sites/default/files/pub/2012/economics-wp-307.pdf.
Fernandez-Stark, K., P. Bamber, and G. Gereffi. 2012. “Upgrading in Global Value Chains:Addressing the Skills Challenge in Developing Countries.” OECD Background Paper.Accessed September 20, 2014. http://www.cggc.duke.edu/pdfs/2012-09-26_Duke_CGGC_OECD_background_paper_Skills_Upgrading_inGVCs.pdf.
Henderson, J., and R. Phillips. 2007. “Unintended Consequences: Social Policy, State Institutions andthe ‘Stalling’ of the Malaysian Industrialization Project.” Economy and Society 36 (1): 78–102.
Humphrey, J., and H. Schmitz. 2000. “Governance and Upgrading: Linking Industrial Clusterand Global Value Chain Research.” Brighton: Institute of Development Studies, University ofSussex, IDS Working Paper 120. Accessed September 20, 2014. http://www.ids.ac.uk/idspublication/governance-and-upgrading-linking-industrial-cluster-and-global-value-chain-research.
Iredale, R., P. Toner, T. Turin, and M. Fernandez-Esquinas. 2014. “A Report on the APECRegion Labour Market: Evidence of Skill Shortages and General Trends in Employment andthe Value of Better Labour Market Information Systems.” Singapore: APEC Secretariat, APECHuman Resoruces Development Working Group. Accessed May 19, 2015. publications.apec.org/publication-detail.php?pub_id=1533.
Kharas, H., A. Zeufack, and H. Majeed. 2010. Cities, People & the Economy: A Study onPositioning Penang. Washington, DC: World Bank. Accessed September 22, 2014. http://documents.worldbank.org/curated/en/2010/09/13062998/cities-people-economy-study-positioning-penang.
Nayak, S., V. Aggarwal, and P. Mann. 2013. “India’s Manufacturing Exports Dynamics: AnAnalysis of Technology Intensity Transition.” New Delhi: Centre for WTO Studies Working
696 S. Y. THAM ET AL.
Paper 6. Accessed May 20, 2015. http://wtocentre.iift.ac.in/workingpaper/Technology%20Intesity%20of%20Indian%20Manufacturing%20Exports-WP.pdf.
Nguyen, Trinh D. 2013. “The Great Migration: How FDI is Moving to ASEAN and India.” HSBCGlobal Research. Accessed September 22, 2014. https://www.hsbc.com.vn/1/PA_ES_Content_Mgmt/content/vietnam/abouthsbc/newsroom/attached_files/FDI_migration_to_ASEAN_2013_en.pdf.
Pilat, D., N. Yamano, and N. Yashiro. 2012. “Moving up the Value Chain: China’s Experienceand Future Prospects.” In OECD, China in Focus: Lessons and Challenges. Paris: OECD.Accessed May 18, 2015. http://www.oecd.org/china/50011051.pdf.
Rasiah, R. 2014. “Stimulating Innovation in ASEAN: Institutional Support, R&D Activity andIntellectual Property Rights.” Jakarta: Economic Research for ASEAN and East Asia (ERIA)Policy Brief No. 2014-06. Accessed May 20, 2015. http://www.eria.org/ERIA-PB-2014-06.pdf.
Rasiah, R., and X. Yap. 2014. “Provincializing Economic Development: Technological Upgradingin the Integrated Circuits Industry in Penang and Kulim High Tech Park.” Paper, UNU-WIDER International Development Conference, Hanoi. Accessed September 23, 2014. http://www1.wider.unu.edu/tisconf/sites/default/files/IGA/Rasiah.pdf.
Rasiah, R., X. Yap., and V. Govindaraju. 2014. “Crisis Effects on the Electronics Industry inSoutheast Asia.” Journal of Contemporary Asia 44 (4): 645–663.
Reyes-Macasaquit, M. 2010. “Case Study of the Electronics Industry in the Philippines: Linkagesand Innovation.” In Fostering Production and Science and Technology Linkages to StimulateInnovation in ASEAN, 145–229. Jakarta: Economic Research Institute for ASEAN and EastAsia. Accessed September 23, 2014. http://www.eria.org/RPR-2009-7-4.pdf.
Samel, H. 2012. “Upgrading Under Volatility in a Global Economy.” Accessed May 20, 2015.http://papers.ssrn.com/sol3/papers.cfm?abstract_id=2102643.
Sturgeon, T., and M. Kawakami. 2010. “Global Value Chains in the Electronics Industry: Was theCrisis a Window of Opportunity for Developing Countries.” Washington, DC: The WorldBank Policy Research Working Paper WPS5417. Accessed May 20, 2015. http://dx.doi.org/10.1596%2F1813-9450-5417.
Sturgeon, T., and O. Memedovic. 2010. “Mapping Global Value Chains: Intermediate GoodsTrade and Structural Change in the World Economy.” Vienna: UNIDO Working Paper 05/2010. Accessed September 27, 2014. http://www.unido.org//fileadmin/user_media/Publications/Research_and_statistics/Branch_publications/Research_and_Policy/Files/Working_Papers/2010/WP%2005%20Mapping%20Glocal%20Value%20Chains.pdf.
Tham, S., and A. Kam. 2014. “Re-examining the Impact of ACFTA on ASEAN’s Exports ofManufactured Goods to China.” Asian Economic Papers 13 (3): 63–82.
UNCTAD. 2013. World Investment Report 2013: Global Value Chains: Investment and Trade forDevelopment. Geneva: UNCTAD.
Wei, Y., and V. Balasubramanyam. 2015. “A Comparative Analysis of China and India’sManufacturing Sectors.” Lancaster: Lancaster University Management School EconomicsWorking Paper Series 2015/3. Accessed May 20, 2015. http://www.lancaster.ac.uk/media/lancaster-university/content-assets/documents/lums/economics/working-papers/LancasterWP2015_003.pdf.
Wong, S. 2013. “The Malaysian Electical and Electronics (E&E) Industry – At an InflexionPoint.” Jurutera, July: 6–9. http://dspace.unimap.edu.my/xmlui/bitstream/handle/123456789/28674/The%20Malaysian%20Electrical%20%26%20Electronics%20(E%26E).pdf?sequence=1.
Yamashita, N., and Archanun Kohpaiboon. 2011. “Trade in Supply Chains between ASEAN andChina: Development and Implications.” In ASEAN+1 FTAs and Global Value Chains, editedby C. Findlay, 25–51. Jakarta: ERIA. Accessed May 20, 2015. http://www.eria.org/publications/research_project_reports/images/pdf/y2010/no29/Ch2_Trade_in_Supply_Chains_between_ASEAN_and_China.pdf.
JOURNAL OF CONTEMPORARY ASIA 697
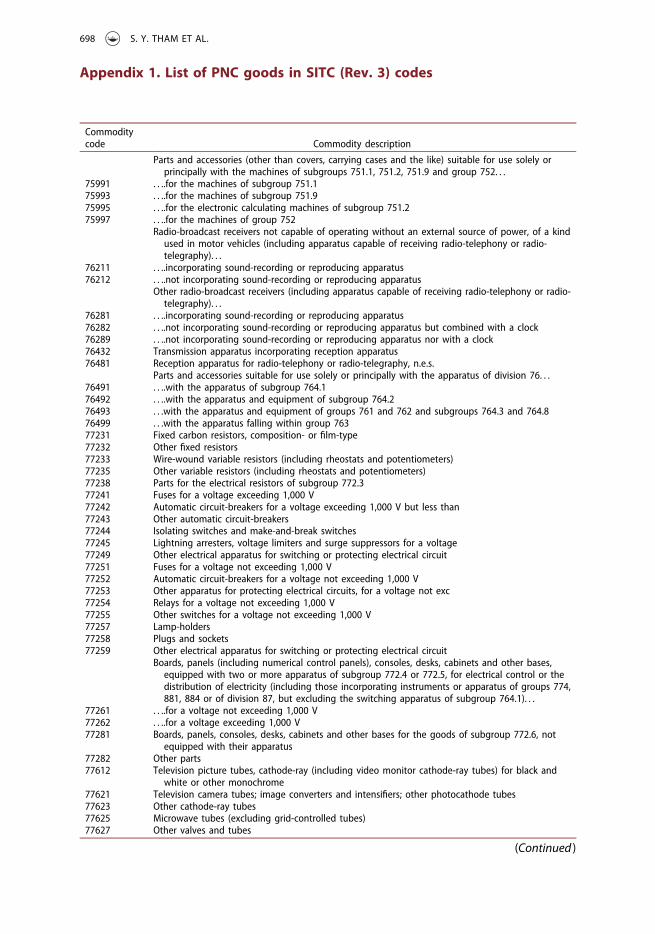
Appendix 1. List of PNC goods in SITC (Rev. 3) codes
Commoditycode Commodity description
Parts and accessories (other than covers, carrying cases and the like) suitable for use solely orprincipally with the machines of subgroups 751.1, 751.2, 751.9 and group 752. . .
75991 . . ..for the machines of subgroup 751.175993 . . ..for the machines of subgroup 751.975995 . . ..for the electronic calculating machines of subgroup 751.275997 . . ..for the machines of group 752
Radio-broadcast receivers not capable of operating without an external source of power, of a kindused in motor vehicles (including apparatus capable of receiving radio-telephony or radio-telegraphy). . .
76211 . . ..incorporating sound-recording or reproducing apparatus76212 . . ..not incorporating sound-recording or reproducing apparatus
Other radio-broadcast receivers (including apparatus capable of receiving radio-telephony or radio-telegraphy). . .
76281 . . ..incorporating sound-recording or reproducing apparatus76282 . . ..not incorporating sound-recording or reproducing apparatus but combined with a clock76289 . . ..not incorporating sound-recording or reproducing apparatus nor with a clock76432 Transmission apparatus incorporating reception apparatus76481 Reception apparatus for radio-telephony or radio-telegraphy, n.e.s.
Parts and accessories suitable for use solely or principally with the apparatus of division 76. . .76491 . . ..with the apparatus of subgroup 764.176492 . . ..with the apparatus and equipment of subgroup 764.276493 . . .with the apparatus and equipment of groups 761 and 762 and subgroups 764.3 and 764.876499 . . .with the apparatus falling within group 76377231 Fixed carbon resistors, composition- or film-type77232 Other fixed resistors77233 Wire-wound variable resistors (including rheostats and potentiometers)77235 Other variable resistors (including rheostats and potentiometers)77238 Parts for the electrical resistors of subgroup 772.377241 Fuses for a voltage exceeding 1,000 V77242 Automatic circuit-breakers for a voltage exceeding 1,000 V but less than77243 Other automatic circuit-breakers77244 Isolating switches and make-and-break switches77245 Lightning arresters, voltage limiters and surge suppressors for a voltage77249 Other electrical apparatus for switching or protecting electrical circuit77251 Fuses for a voltage not exceeding 1,000 V77252 Automatic circuit-breakers for a voltage not exceeding 1,000 V77253 Other apparatus for protecting electrical circuits, for a voltage not exc77254 Relays for a voltage not exceeding 1,000 V77255 Other switches for a voltage not exceeding 1,000 V77257 Lamp-holders77258 Plugs and sockets77259 Other electrical apparatus for switching or protecting electrical circuit
Boards, panels (including numerical control panels), consoles, desks, cabinets and other bases,equipped with two or more apparatus of subgroup 772.4 or 772.5, for electrical control or thedistribution of electricity (including those incorporating instruments or apparatus of groups 774,881, 884 or of division 87, but excluding the switching apparatus of subgroup 764.1). . .
77261 . . ..for a voltage not exceeding 1,000 V77262 . . ..for a voltage exceeding 1,000 V77281 Boards, panels, consoles, desks, cabinets and other bases for the goods of subgroup 772.6, not
equipped with their apparatus77282 Other parts77612 Television picture tubes, cathode-ray (including video monitor cathode-ray tubes) for black and
white or other monochrome77621 Television camera tubes; image converters and intensifiers; other photocathode tubes77623 Other cathode-ray tubes77625 Microwave tubes (excluding grid-controlled tubes)77627 Other valves and tubes
(Continued )
698 S. Y. THAM ET AL.
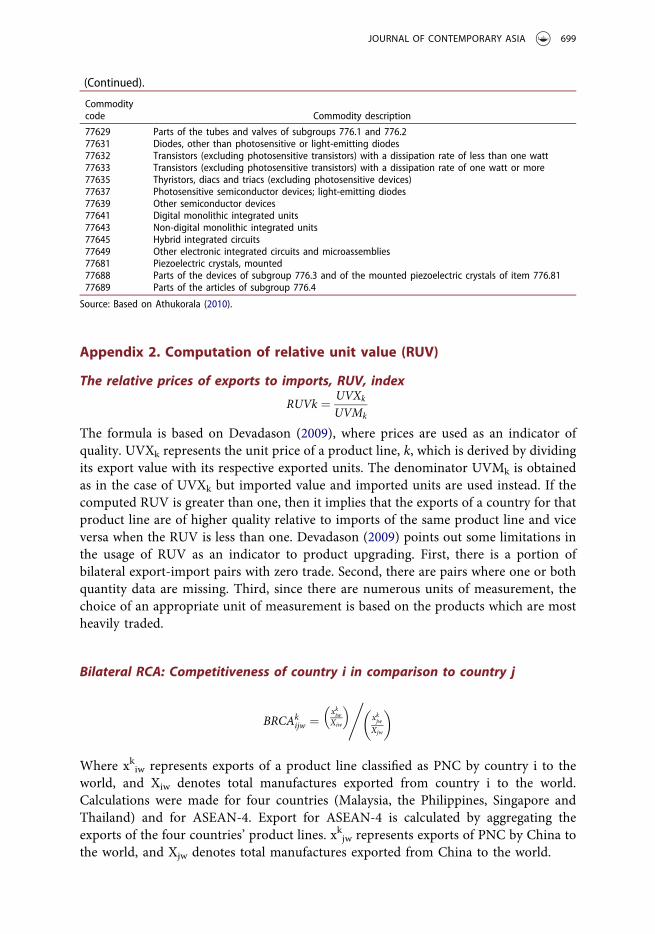
Appendix 2. Computation of relative unit value (RUV)
The relative prices of exports to imports, RUV, index
RUVk ¼ UVXk
UVMk
The formula is based on Devadason (2009), where prices are used as an indicator ofquality. UVXk represents the unit price of a product line, k, which is derived by dividingits export value with its respective exported units. The denominator UVMk is obtainedas in the case of UVXk but imported value and imported units are used instead. If thecomputed RUV is greater than one, then it implies that the exports of a country for thatproduct line are of higher quality relative to imports of the same product line and viceversa when the RUV is less than one. Devadason (2009) points out some limitations inthe usage of RUV as an indicator to product upgrading. First, there is a portion ofbilateral export-import pairs with zero trade. Second, there are pairs where one or bothquantity data are missing. Third, since there are numerous units of measurement, thechoice of an appropriate unit of measurement is based on the products which are mostheavily traded.
Bilateral RCA: Competitiveness of country i in comparison to country j
BRCAkijw ¼ xkiw
Xiw
� �,xkjwXjw
� �
Where xkiw represents exports of a product line classified as PNC by country i to theworld, and Xiw denotes total manufactures exported from country i to the world.Calculations were made for four countries (Malaysia, the Philippines, Singapore andThailand) and for ASEAN-4. Export for ASEAN-4 is calculated by aggregating theexports of the four countries’ product lines. xkjw represents exports of PNC by China tothe world, and Xjw denotes total manufactures exported from China to the world.
(Continued).
Commoditycode Commodity description
77629 Parts of the tubes and valves of subgroups 776.1 and 776.277631 Diodes, other than photosensitive or light-emitting diodes77632 Transistors (excluding photosensitive transistors) with a dissipation rate of less than one watt77633 Transistors (excluding photosensitive transistors) with a dissipation rate of one watt or more77635 Thyristors, diacs and triacs (excluding photosensitive devices)77637 Photosensitive semiconductor devices; light-emitting diodes77639 Other semiconductor devices77641 Digital monolithic integrated units77643 Non-digital monolithic integrated units77645 Hybrid integrated circuits77649 Other electronic integrated circuits and microassemblies77681 Piezoelectric crystals, mounted77688 Parts of the devices of subgroup 776.3 and of the mounted piezoelectric crystals of item 776.8177689 Parts of the articles of subgroup 776.4
Source: Based on Athukorala (2010).
JOURNAL OF CONTEMPORARY ASIA 699

Copyright of Journal of Contemporary Asia is the property of Routledge and its content maynot be copied or emailed to multiple sites or posted to a listserv without the copyright holder'sexpress written permission. However, users may print, download, or email articles forindividual use.