Embed Size (px)
Citation preview
Moving people strategy: solutions to the nation’s long term (urban)
transport problems
Professor John StanleyInstitute of Transport and Logistics Studies
Faculty of Economics and BusinessThe University of Sydney
and Bus Industry Confederation
October 2008.
Scope
1. Summarise urban person transport problems
2. Suggest a range of solutions
3. Consider delivery responsibilities
4. Some conclusions
1. Urban person transport problems
1. Congestion/competitiveness
2. Climate change contribution
3. Social exclusion
4. Coping with patronage growth!
1-3 = The externalities problem!
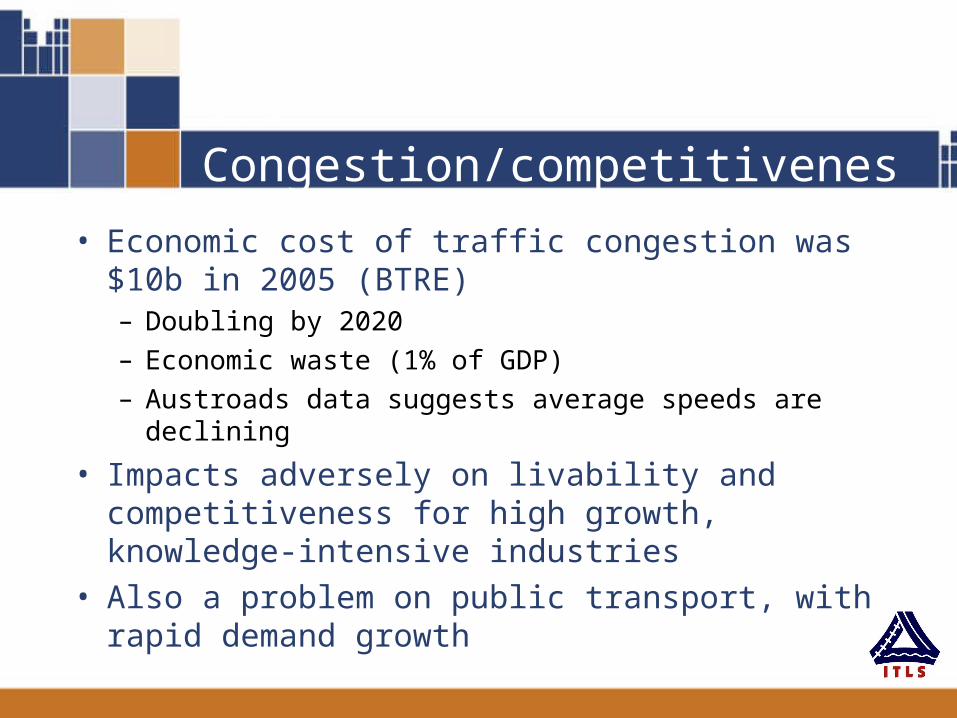
1.1 Congestion/competitiveness
• Economic cost of traffic congestion was $10b in 2005 (BTRE)– Doubling by 2020
– Economic waste (1% of GDP)
– Austroads data suggests average speeds are declining
• Impacts adversely on livability and competitiveness for high growth, knowledge-intensive industries
• Also a problem on public transport, with rapid demand growth
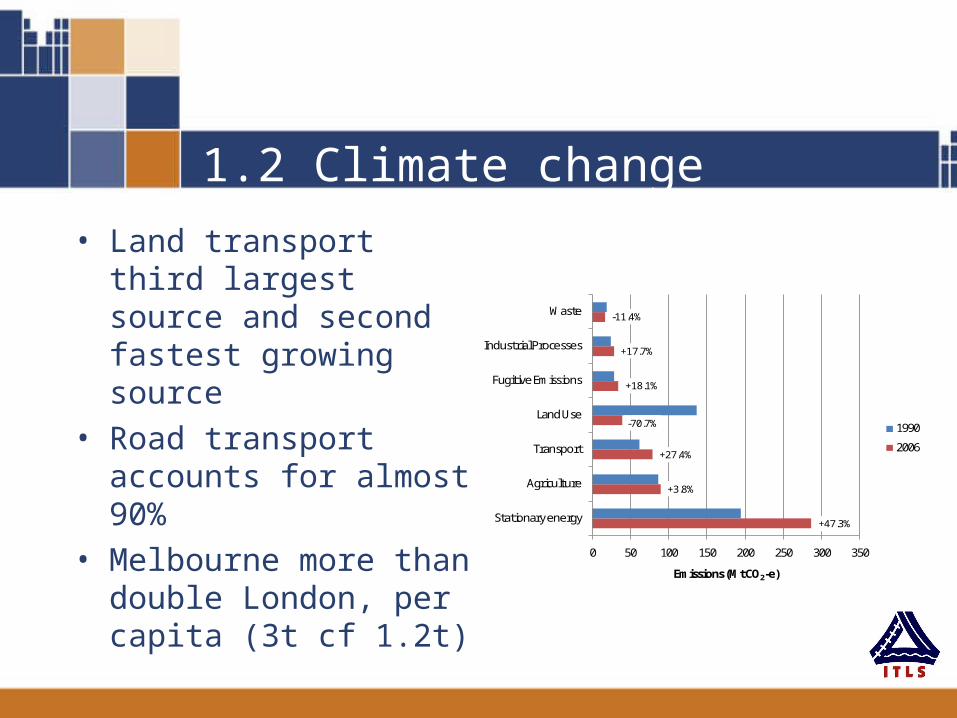
1.2 Climate change
• Land transport third largest source and second fastest growing source
• Road transport accounts for almost 90%
• Melbourne more than double London, per capita (3t cf 1.2t)
+47.3%
+3.8%
+27.4%
-70.7%
+18.1%
+17.7%
-11.4%
0 50 100 150 200 250 300 350
Stationary energy
Agriculture
Transport
Land Use
Fugitive Emissions
Industrial Processes
Waste
Emissions (Mt CO2-e)
1990
2006
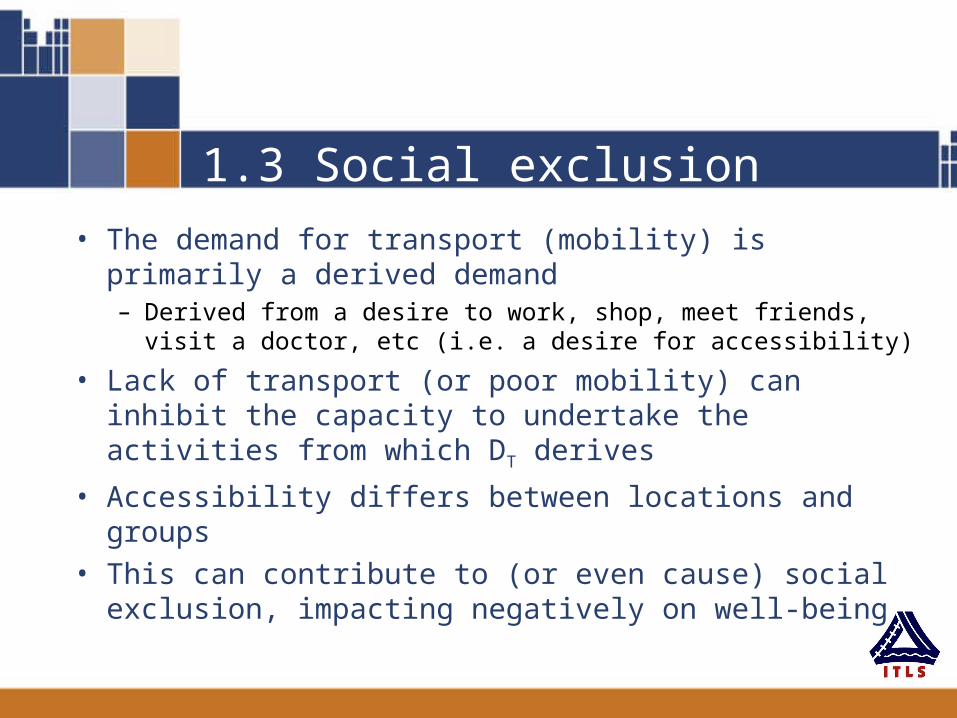
1.3 Social exclusion
• The demand for transport (mobility) is primarily a derived demand– Derived from a desire to work, shop, meet friends, visit a doctor,
etc (i.e. a desire for accessibility)
• Lack of transport (or poor mobility) can inhibit the capacity to undertake the activities from which DT derives
• Accessibility differs between locations and groups• This can contribute to (or even cause) social exclusion,
impacting negatively on well-being
Value judgment
• Social exclusion refers to a person’s inability to fully participate in society
• Proposition = dealing with specific origins of SE can increase inclusion and wellbeing
• Value judgment: all people have the right to a decent basic level of mobility, irrespective of personal circumstance- as a fundamental prerequisite for being able to enjoy
the opportunities afforded by our society

Varying trip rates
Trip Rates from BAV Warrnambool Case Study (2004)
0 0.5 1 1.5 2
Secondary students
Students outside W'bool
Deakin Residential students
Seniors
Aged in hostel
People with disability
Return trips/day

VAMPIRE (Dodgson and Sipe)
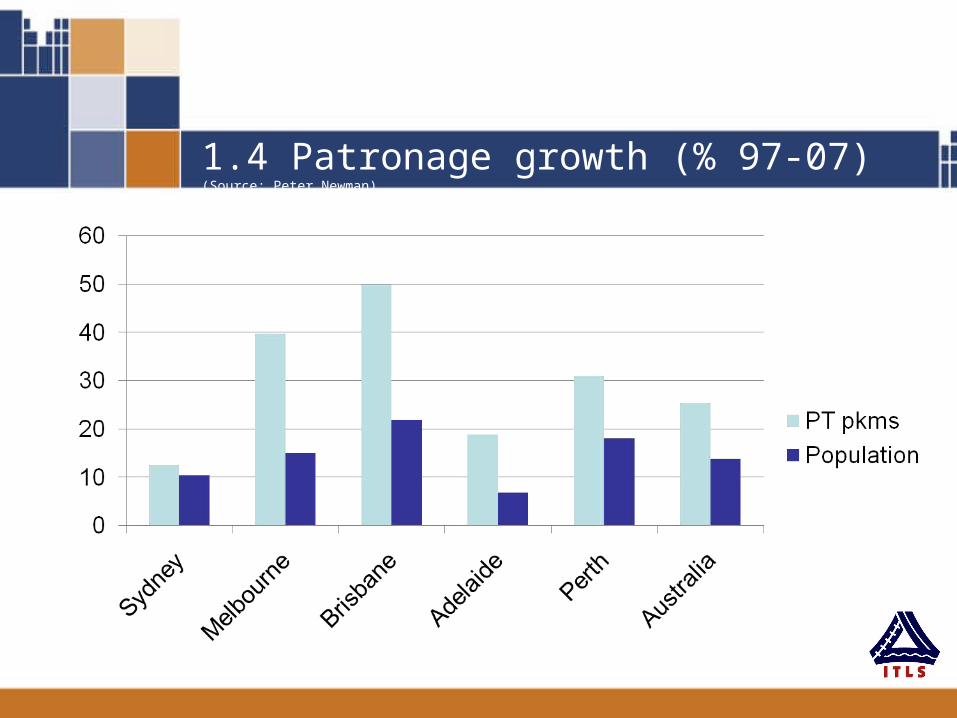
1.4 Patronage growth (% 97-07) (Source: Peter Newman)
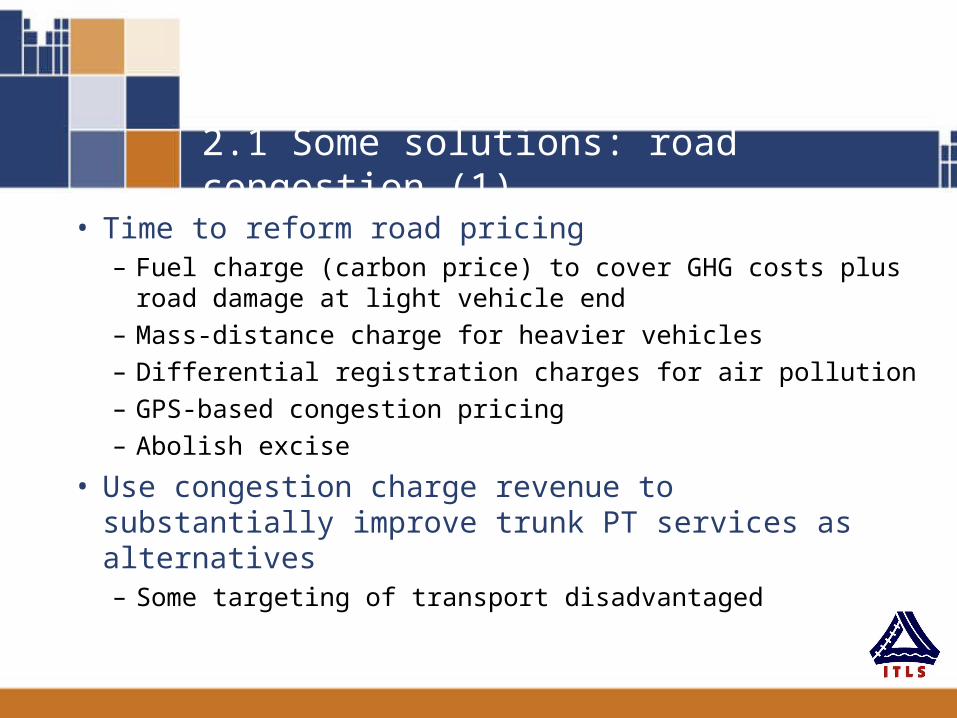
2.1 Some solutions: road congestion (1)
• Time to reform road pricing– Fuel charge (carbon price) to cover GHG costs plus
road damage at light vehicle end– Mass-distance charge for heavier vehicles– Differential registration charges for air pollution – GPS-based congestion pricing– Abolish excise
• Use congestion charge revenue to substantially improve trunk PT services as alternatives – Some targeting of transport disadvantaged
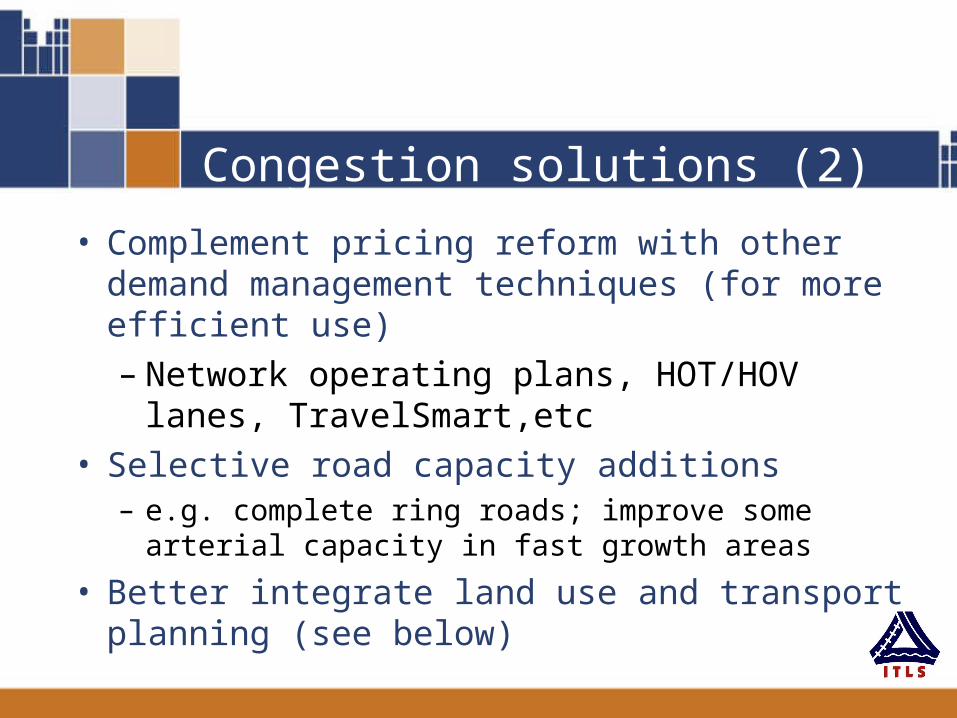
Congestion solutions (2)
• Complement pricing reform with other demand management techniques (for more efficient use)– Network operating plans, HOT/HOV lanes,
TravelSmart,etc• Selective road capacity additions
– e.g. complete ring roads; improve some arterial capacity in fast growth areas
• Better integrate land use and transport planning (see below)

2.2 Climate change (GHG) solutions
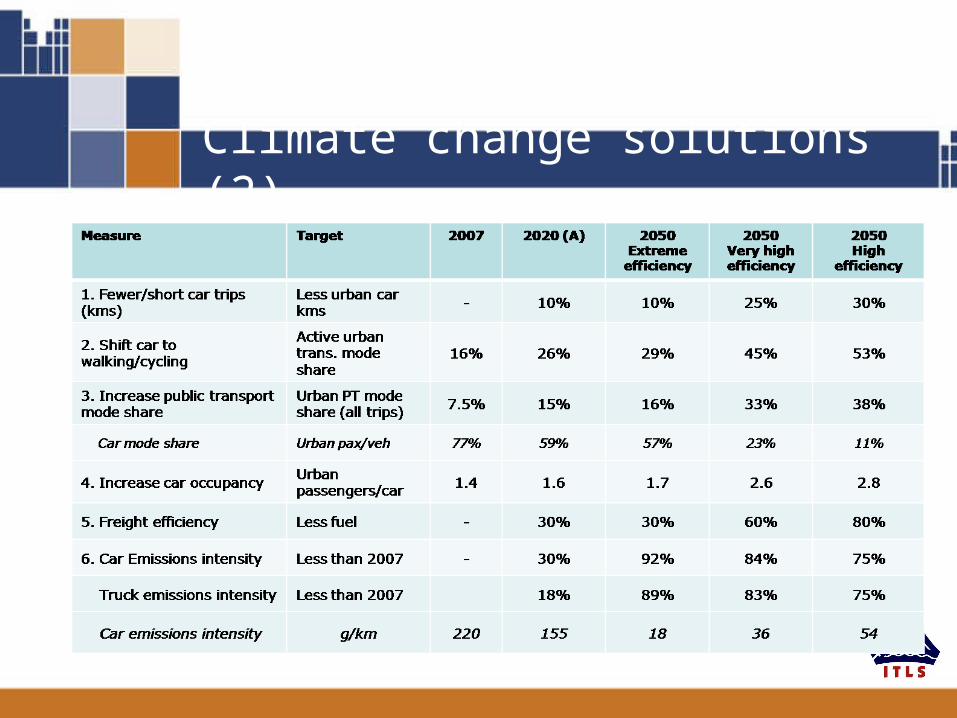
Climate change solutions (2)
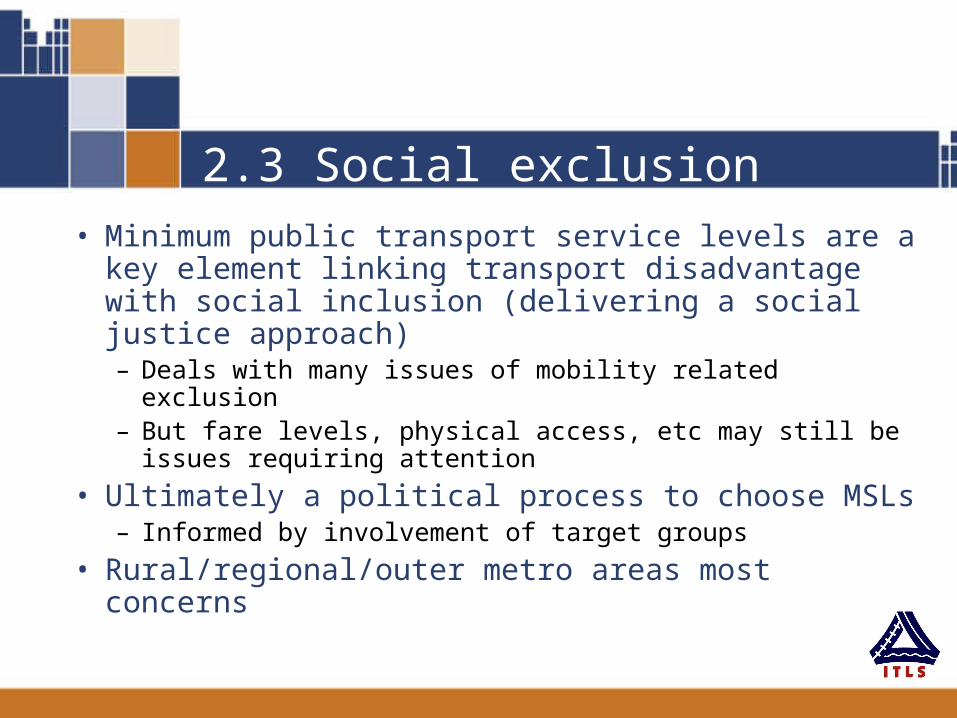
2.3 Social exclusion
• Minimum public transport service levels are a key element linking transport disadvantage with social inclusion (delivering a social justice approach)– Deals with many issues of mobility related exclusion– But fare levels, physical access, etc may still be issues
requiring attention
• Ultimately a political process to choose MSLs– Informed by involvement of target groups
• Rural/regional/outer metro areas most concerns
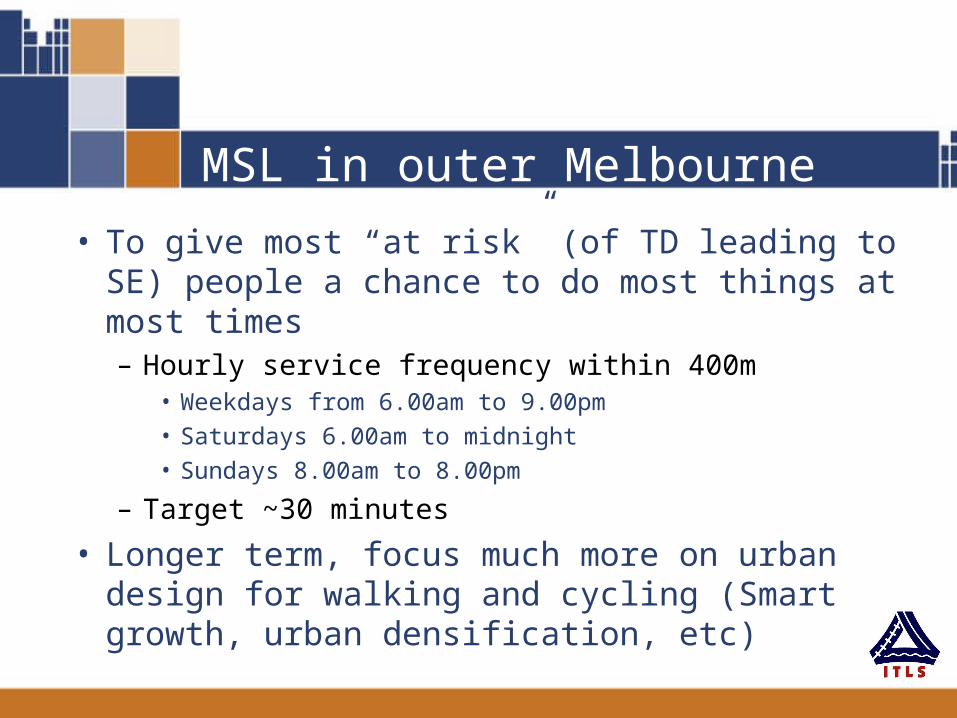
MSL in outer Melbourne
• To give most “at risk” (of TD leading to SE) people a chance to do most things at most times – Hourly service frequency within 400m
• Weekdays from 6.00am to 9.00pm• Saturdays 6.00am to midnight• Sundays 8.00am to 8.00pm
– Target ~30 minutes
• Longer term, focus much more on urban design for walking and cycling (Smart growth, urban densification, etc)
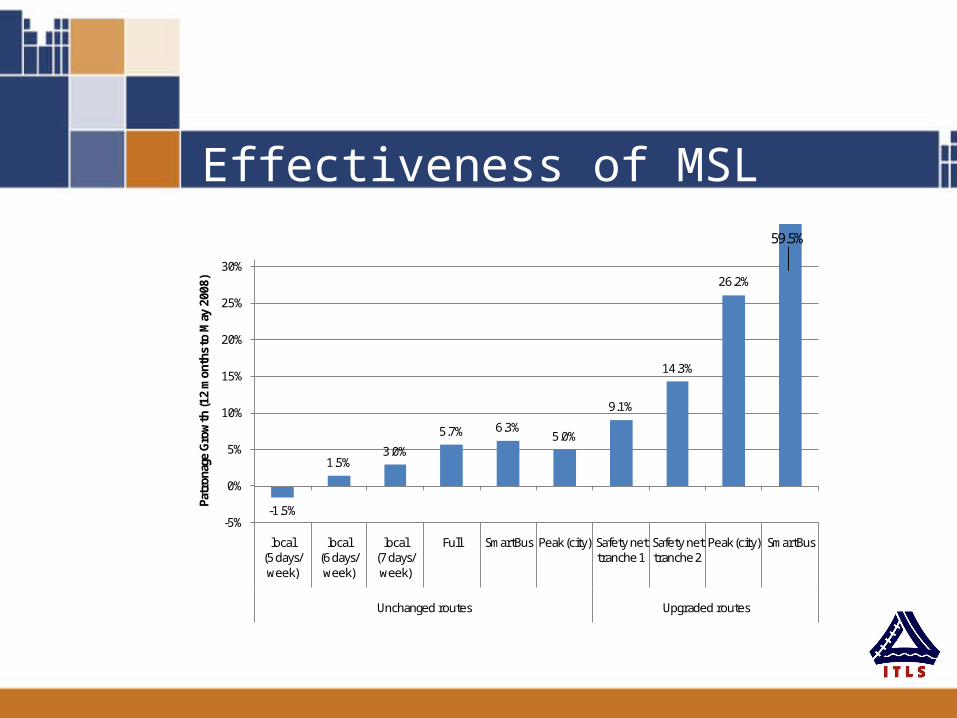
Effectiveness of MSL
-1.5%
1.5%3.0%
5.7% 6.3%5.0%
9.1%
14.3%
26.2%
-5%
0%
5%
10%
15%
20%
25%
30%
local (5 days/ week)
local (6 days/ week)
local (7 days/ week)
Full SmartBus Peak (city) Safety net tranche 1
Safety net tranche 2
Peak (city) SmartBus
Unchanged routes Upgraded routes
Patr
onag
e G
row
th (1
2 m
onth
s to
May
200
8)
59.5%
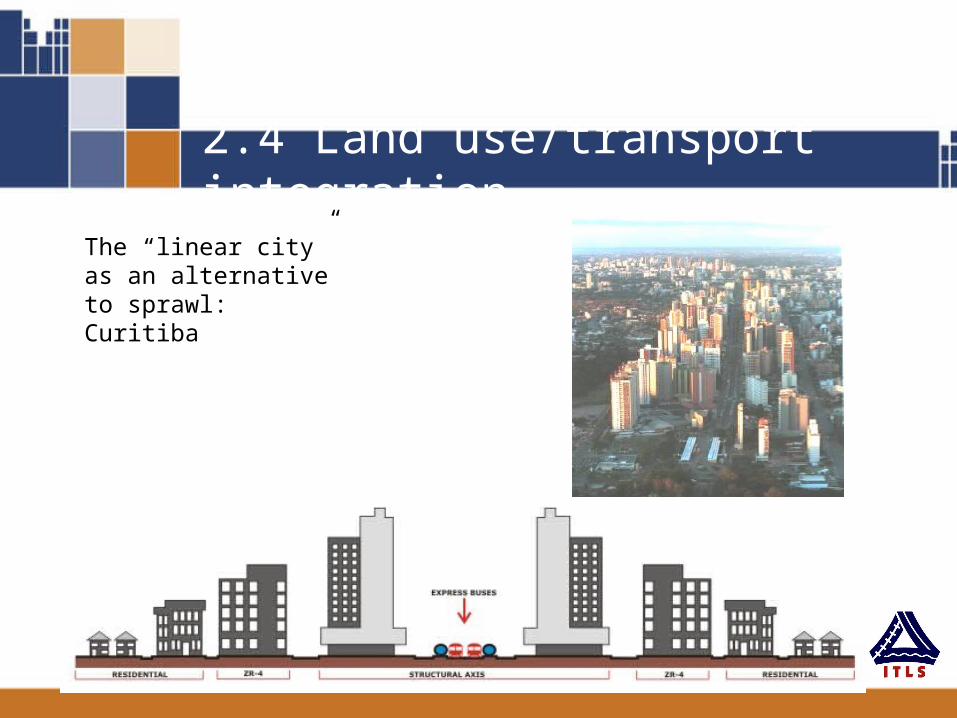
2.4 Land use/transport integration
The “linear city” as an alternative to sprawl: Curitiba

Melbourne example (Rob Adams) (1)
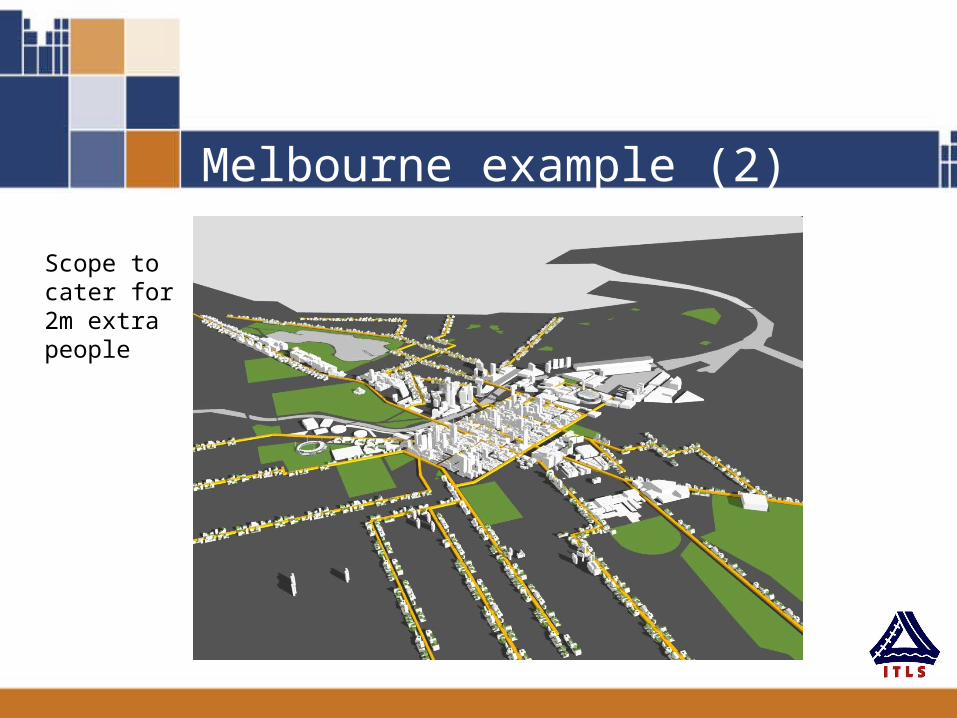
Melbourne example (2)
Scope to cater for 2m extra people
2.5 Institutional arrangements
• STO model
• The tactical level failure– Need for well-based strategic land
use/transport plans
• Placement of the T– Departments when well functioning– Separate agency, with the $, if major change
needed
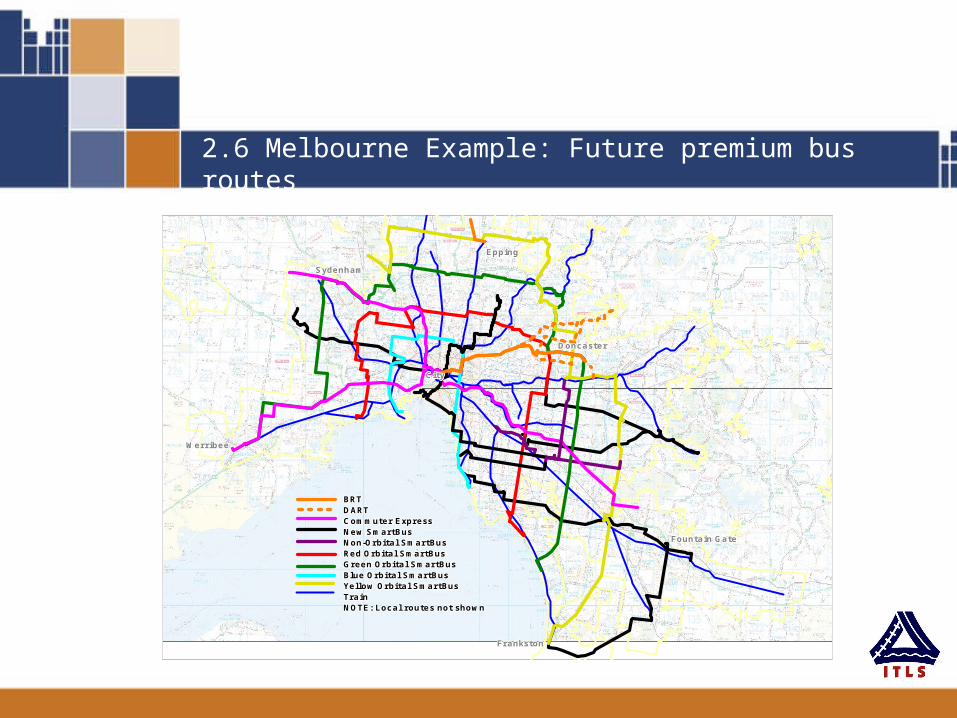
2.6 Melbourne Example: Future premium bus routes
BRTBRTBRTBRTBRTBRTBRTBRTBRTDARTDARTDARTDARTDARTDARTDARTDARTDARTCommuter ExpressCommuter ExpressCommuter ExpressCommuter ExpressCommuter ExpressCommuter ExpressCommuter ExpressCommuter ExpressCommuter ExpressNew SmartBusNew SmartBusNew SmartBusNew SmartBusNew SmartBusNew SmartBusNew SmartBusNew SmartBusNew SmartBusNon-Orbital SmartBusNon-Orbital SmartBusNon-Orbital SmartBusNon-Orbital SmartBusNon-Orbital SmartBusNon-Orbital SmartBusNon-Orbital SmartBusNon-Orbital SmartBusNon-Orbital SmartBusRed Orbital SmartBusRed Orbital SmartBusRed Orbital SmartBusRed Orbital SmartBusRed Orbital SmartBusRed Orbital SmartBusRed Orbital SmartBusRed Orbital SmartBusRed Orbital SmartBusGreen Orbital SmartBusGreen Orbital SmartBusGreen Orbital SmartBusGreen Orbital SmartBusGreen Orbital SmartBusGreen Orbital SmartBusGreen Orbital SmartBusGreen Orbital SmartBusGreen Orbital SmartBusBlue Orbital SmartBusBlue Orbital SmartBusBlue Orbital SmartBusBlue Orbital SmartBusBlue Orbital SmartBusBlue Orbital SmartBusBlue Orbital SmartBusBlue Orbital SmartBusBlue Orbital SmartBusYellow Orbital SmartBusYellow Orbital SmartBusYellow Orbital SmartBusYellow Orbital SmartBusYellow Orbital SmartBusYellow Orbital SmartBusYellow Orbital SmartBusYellow Orbital SmartBusYellow Orbital SmartBusTrainTrainTrainTrainTrainTrainTrainTrainTrainNOTE: Local routes not shownNOTE: Local routes not shownNOTE: Local routes not shownNOTE: Local routes not shownNOTE: Local routes not shownNOTE: Local routes not shownNOTE: Local routes not shownNOTE: Local routes not shownNOTE: Local routes not shown
WerribeeWerribeeWerribeeWerribeeWerribeeWerribeeWerribeeWerribeeWerribee
SydenhamSydenhamSydenhamSydenhamSydenhamSydenhamSydenhamSydenhamSydenham
CityCityCityCityCityCityCityCityCity
DoncasterDoncasterDoncasterDoncasterDoncasterDoncasterDoncasterDoncasterDoncaster
EppingEppingEppingEppingEppingEppingEppingEppingEpping
Fountain GateFountain GateFountain GateFountain GateFountain GateFountain GateFountain GateFountain GateFountain Gate
FrankstonFrankstonFrankstonFrankstonFrankstonFrankstonFrankstonFrankstonFrankston

Melbourne possible future local bus services
Train
Over 60 mins
48 to 60 mins
34 to 44 mins
24 to 34 mins
16 to 22 mins
Up to 15 mins
Now Possible future
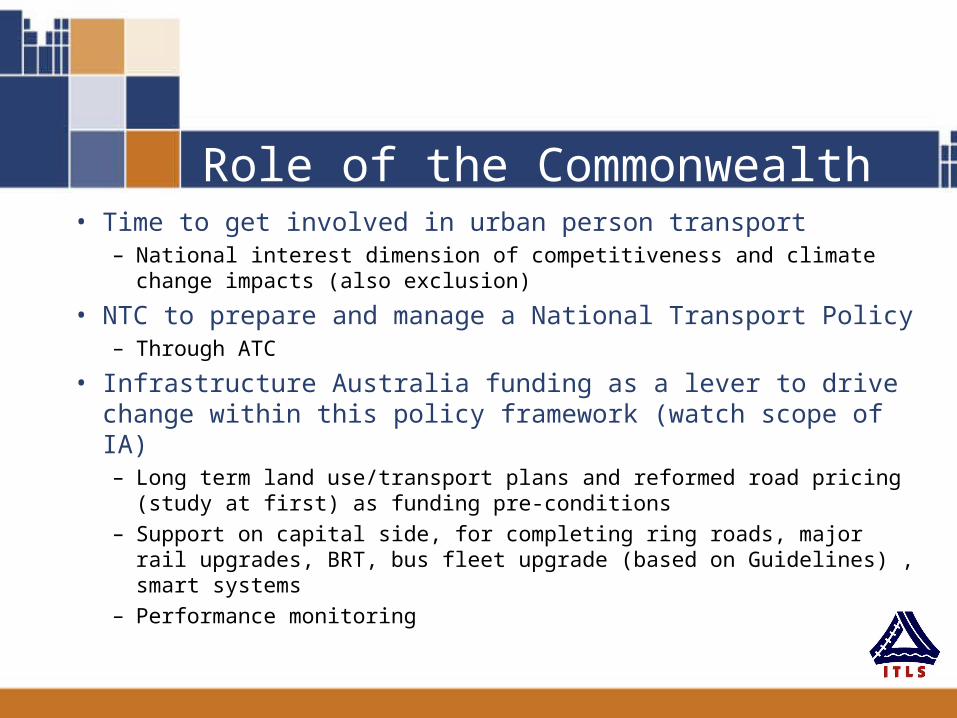
Role of the Commonwealth• Time to get involved in urban person transport
– National interest dimension of competitiveness and climate change impacts (also exclusion)
• NTC to prepare and manage a National Transport Policy– Through ATC
• Infrastructure Australia funding as a lever to drive change within this policy framework (watch scope of IA)– Long term land use/transport plans and reformed road pricing (study at
first) as funding pre-conditions – Support on capital side, for completing ring roads, major rail upgrades,
BRT, bus fleet upgrade (based on Guidelines) , smart systems– Performance monitoring
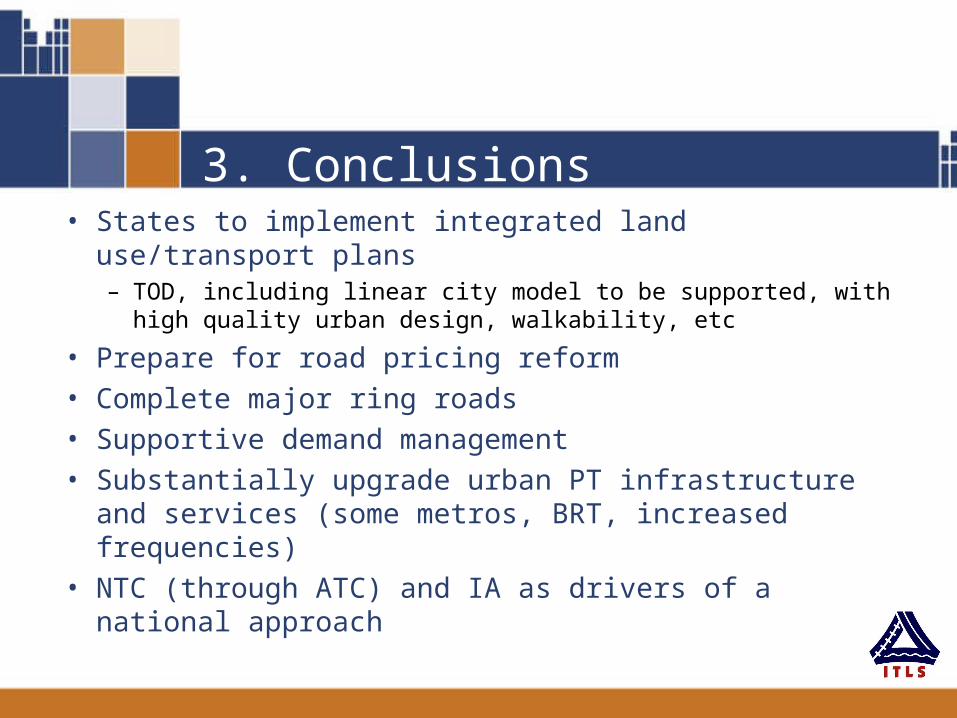
3. Conclusions• States to implement integrated land use/transport plans
– TOD, including linear city model to be supported, with high quality urban design, walkability, etc
• Prepare for road pricing reform• Complete major ring roads• Supportive demand management• Substantially upgrade urban PT infrastructure and
services (some metros, BRT, increased frequencies)• NTC (through ATC) and IA as drivers of a national
approach