Embed Size (px)
Citation preview
www.advisor.ca 0 2 2 0 0 8 AE 25
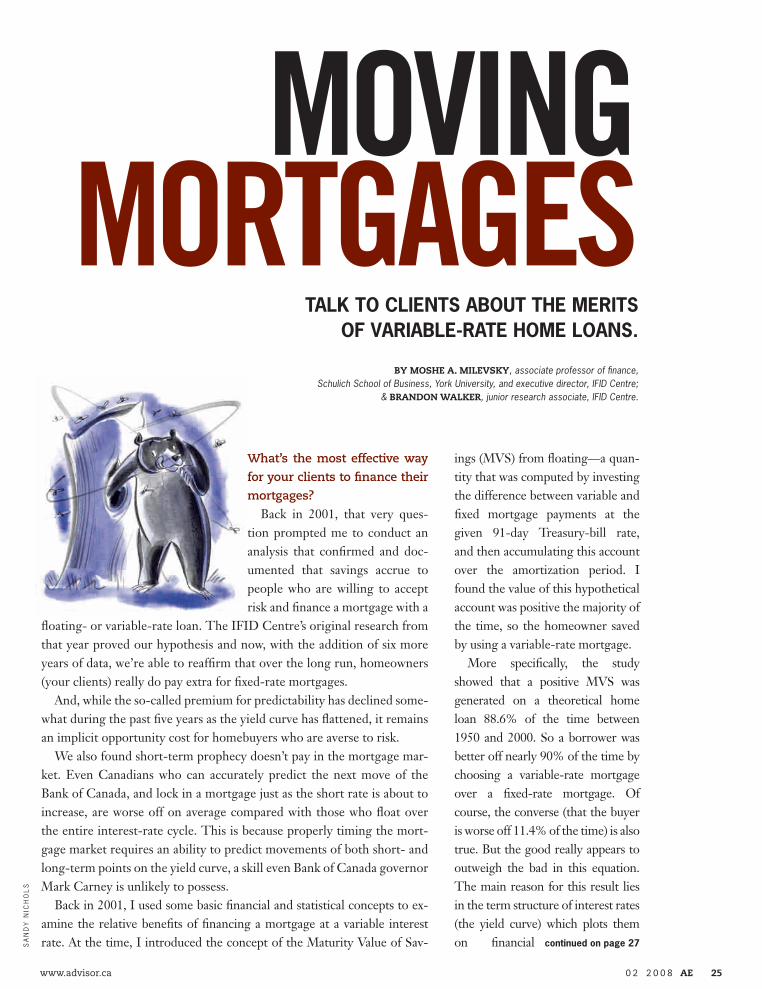
What’s the most effective way
for your clients to finance their
mortgages?
Back in 2001, that very ques-tion prompted me to conduct an analysis that confirmed and doc-umented that savings accrue to people who are willing to accept risk and finance a mortgage with a
floating- or variable-rate loan. The IFID Centre’s original research from that year proved our hypothesis and now, with the addition of six more years of data, we’re able to reaffirm that over the long run, homeowners (your clients) really do pay extra for fixed-rate mortgages.
And, while the so-called premium for predictability has declined some-what during the past five years as the yield curve has flattened, it remains an implicit opportunity cost for homebuyers who are averse to risk.
We also found short-term prophecy doesn’t pay in the mortgage mar-ket. Even Canadians who can accurately predict the next move of the Bank of Canada, and lock in a mortgage just as the short rate is about to increase, are worse off on average compared with those who float over the entire interest-rate cycle. This is because properly timing the mort-gage market requires an ability to predict movements of both short- and long-term points on the yield curve, a skill even Bank of Canada governor Mark Carney is unlikely to possess.
Back in 2001, I used some basic financial and statistical concepts to ex-amine the relative benefits of financing a mortgage at a variable interest rate. At the time, I introduced the concept of the Maturity Value of Sav- continued on page 27
moving mortgages
ings (MVS) from floating—a quan-tity that was computed by investing the difference between variable and fixed mortgage payments at the given 91-day Treasury-bill rate, and then accumulating this account over the amortization period. I found the value of this hypothetical account was positive the majority of the time, so the homeowner saved by using a variable-rate mortgage.
More specifically, the study showed that a positive MVS was generated on a theoretical home loan 88.6% of the time between 1950 and 2000. So a borrower was better off nearly 90% of the time by choosing a variable-rate mortgage over a fixed-rate mortgage. Of course, the converse (that the buyer is worse off 11.4% of the time) is also true. But the good really appears to outweigh the bad in this equation. The main reason for this result lies in the term structure of interest rates (the yield curve) which plots them on financial
talk to clients about the merits of variable-rate home loans.
BY MoshE A. MilEvskY, associate professor of finance, Schulich School of Business, York University, and executive director, IFID Centre;
& BrAndon WAlkEr, junior research associate, IFID Centre.
sa
nd
y n
ich
ol
s
AE02_025-039.indd 25 01/24/2008 12:18:21 PM
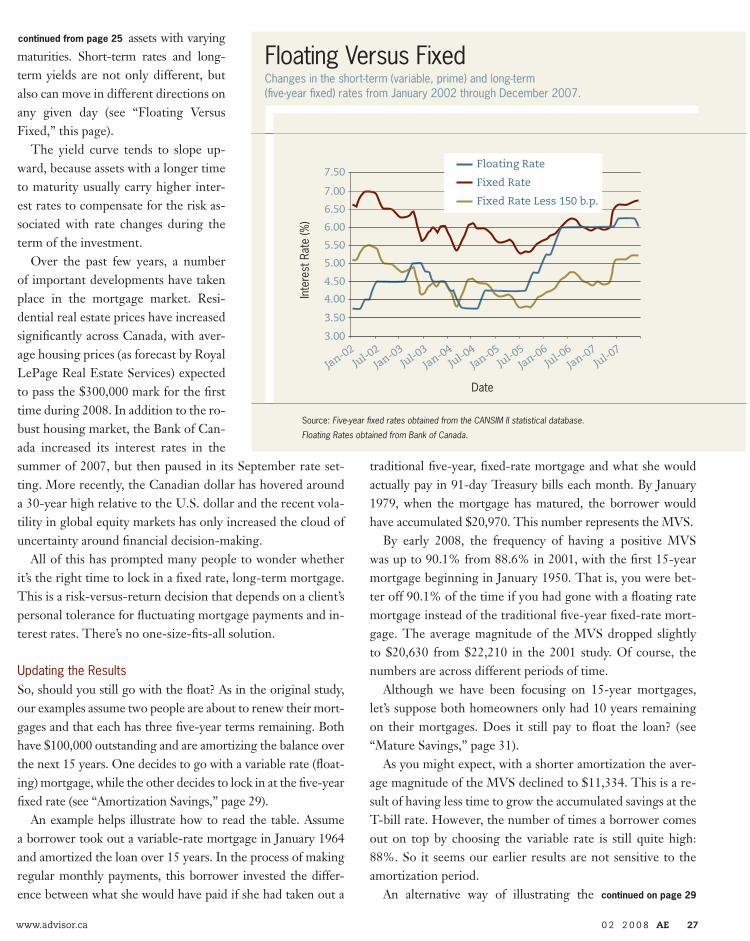
assets with varying maturities. Short-term rates and long-term yields are not only different, but also can move in different directions on any given day (see “Floating Versus Fixed,” this page).
The yield curve tends to slope up-ward, because assets with a longer time to maturity usually carry higher inter-est rates to compensate for the risk as-sociated with rate changes during the term of the investment.
Over the past few years, a number of important developments have taken place in the mortgage market. Resi-dential real estate prices have increased significantly across Canada, with aver-age housing prices (as forecast by Royal LePage Real Estate Services) expected to pass the $300,000 mark for the first time during 2008. In addition to the ro-bust housing market, the Bank of Can-ada increased its interest rates in the summer of 2007, but then paused in its September rate set-ting. More recently, the Canadian dollar has hovered around a 30-year high relative to the U.S. dollar and the recent vola-tility in global equity markets has only increased the cloud of uncertainty around financial decision-making.
All of this has prompted many people to wonder whether it’s the right time to lock in a fixed rate, long-term mortgage. This is a risk-versus-return decision that depends on a client’s personal tolerance for fluctuating mortgage payments and in-terest rates. There’s no one-size-fits-all solution.
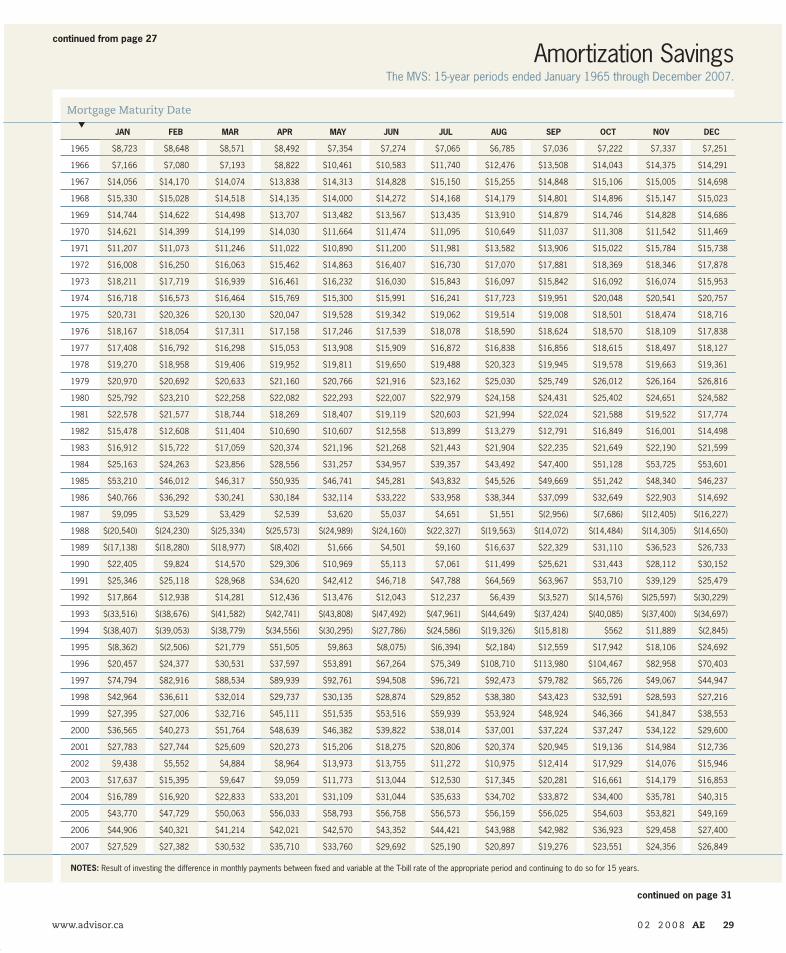
Updating the ResultsSo, should you still go with the float? As in the original study, our examples assume two people are about to renew their mort-gages and that each has three five-year terms remaining. Both have $100,000 outstanding and are amortizing the balance over the next 15 years. One decides to go with a variable rate (float-ing) mortgage, while the other decides to lock in at the five-year fixed rate (see “Amortization Savings,” page 29).
An example helps illustrate how to read the table. Assume a borrower took out a variable-rate mortgage in January 1964 and amortized the loan over 15 years. In the process of making regular monthly payments, this borrower invested the differ-ence between what she would have paid if she had taken out a
traditional five-year, fixed-rate mortgage and what she would actually pay in 91-day Treasury bills each month. By January 1979, when the mortgage has matured, the borrower would have accumulated $20,970. This number represents the MVS.
By early 2008, the frequency of having a positive MVS was up to 90.1% from 88.6% in 2001, with the first 15-year mortgage beginning in January 1950. That is, you were bet-ter off 90.1% of the time if you had gone with a floating rate mortgage instead of the traditional five-year fixed-rate mort-gage. The average magnitude of the MVS dropped slightly to $20,630 from $22,210 in the 2001 study. Of course, the numbers are across different periods of time.
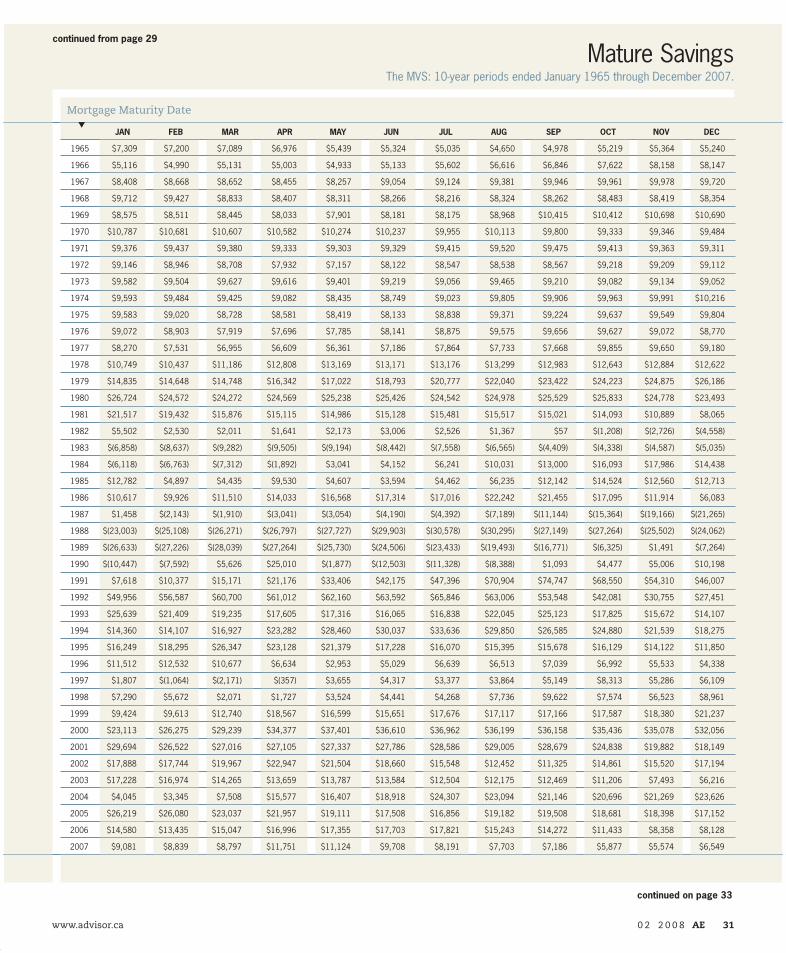
Although we have been focusing on 15-year mortgages, let’s suppose both homeowners only had 10 years remaining on their mortgages. Does it still pay to float the loan? (see “Mature Savings,” page 31).
As you might expect, with a shorter amortization the aver-age magnitude of the MVS declined to $11,334. This is a re-sult of having less time to grow the accumulated savings at the T-bill rate. However, the number of times a borrower comes out on top by choosing the variable rate is still quite high: 88%. So it seems our earlier results are not sensitive to the amortization period.
An alternative way of illustrating the
continued from page 25
continued on page 29
Floating Versus FixedChanges in the short-term (variable, prime) and long-term (five-year fixed) rates from January 2002 through December 2007.
Date
Floating Rate
Fixed Rate
Fixed Rate Less 150 b.p.
3.00
3.50
4.00
4.50
5.00
5.50
6.00
6.50
7.00
7.50
Jan-02Jul-0
2Jan-03
Jul-03Jan-04
Jul-04Jan-05
Jul-05Jan-06
Jul-06Jan-07
Jul-07
Inte
rest
Rat
e (%
)
Source: Five-year fixed rates obtained from the CANSIM II statistical database.
Floating Rates obtained from Bank of Canada.
www.advisor.ca 0 2 2 0 0 8 AE 27
AE02_025-039.indd 27 1/28/08 7:30:52 PM
continued from page 27
continued on page 31
Amortization SavingsThe MVS: 15-year periods ended January 1965 through December 2007.
s
Mortgage Maturity Date
Jan Feb Mar apr May Jun Jul aug Sep Oct nOv Dec
1965 $8,723 $8,648 $8,571 $8,492 $7,354 $7,274 $7,065 $6,785 $7,036 $7,222 $7,337 $7,251
1966 $7,166 $7,080 $7,193 $8,822 $10,461 $10,583 $11,740 $12,476 $13,508 $14,043 $14,375 $14,291
1967 $14,056 $14,170 $14,074 $13,838 $14,313 $14,828 $15,150 $15,255 $14,848 $15,106 $15,005 $14,698
1968 $15,330 $15,028 $14,518 $14,135 $14,000 $14,272 $14,168 $14,179 $14,801 $14,896 $15,147 $15,023
1969 $14,744 $14,622 $14,498 $13,707 $13,482 $13,567 $13,435 $13,910 $14,879 $14,746 $14,828 $14,686
1970 $14,621 $14,399 $14,199 $14,030 $11,664 $11,474 $11,095 $10,649 $11,037 $11,308 $11,542 $11,469
1971 $11,207 $11,073 $11,246 $11,022 $10,890 $11,200 $11,981 $13,582 $13,906 $15,022 $15,784 $15,738
1972 $16,008 $16,250 $16,063 $15,462 $14,863 $16,407 $16,730 $17,070 $17,881 $18,369 $18,346 $17,878
1973 $18,211 $17,719 $16,939 $16,461 $16,232 $16,030 $15,843 $16,097 $15,842 $16,092 $16,074 $15,953
1974 $16,718 $16,573 $16,464 $15,769 $15,300 $15,991 $16,241 $17,723 $19,951 $20,048 $20,541 $20,757
1975 $20,731 $20,326 $20,130 $20,047 $19,528 $19,342 $19,062 $19,514 $19,008 $18,501 $18,474 $18,716
1976 $18,167 $18,054 $17,311 $17,158 $17,246 $17,539 $18,078 $18,590 $18,624 $18,570 $18,109 $17,838
1977 $17,408 $16,792 $16,298 $15,053 $13,908 $15,909 $16,872 $16,838 $16,856 $18,615 $18,497 $18,127
1978 $19,270 $18,958 $19,406 $19,952 $19,811 $19,650 $19,488 $20,323 $19,945 $19,578 $19,663 $19,361
1979 $20,970 $20,692 $20,633 $21,160 $20,766 $21,916 $23,162 $25,030 $25,749 $26,012 $26,164 $26,816
1980 $25,792 $23,210 $22,258 $22,082 $22,293 $22,007 $22,979 $24,158 $24,431 $25,402 $24,651 $24,582
1981 $22,578 $21,577 $18,744 $18,269 $18,407 $19,119 $20,603 $21,994 $22,024 $21,588 $19,522 $17,774
1982 $15,478 $12,608 $11,404 $10,690 $10,607 $12,558 $13,899 $13,279 $12,791 $16,849 $16,001 $14,498
1983 $16,912 $15,722 $17,059 $20,374 $21,196 $21,268 $21,443 $21,904 $22,235 $21,649 $22,190 $21,599
1984 $25,163 $24,263 $23,856 $28,556 $31,257 $34,957 $39,357 $43,492 $47,400 $51,128 $53,725 $53,601
1985 $53,210 $46,012 $46,317 $50,935 $46,741 $45,281 $43,832 $45,526 $49,669 $51,242 $48,340 $46,237
1986 $40,766 $36,292 $30,241 $30,184 $32,114 $33,222 $33,958 $38,344 $37,099 $32,649 $22,903 $14,692
1987 $9,095 $3,529 $3,429 $2,539 $3,620 $5,037 $4,651 $1,551 $(2,956) $(7,686) $(12,405) $(16,227)
1988 $(20,540) $(24,230) $(25,334) $(25,573) $(24,989) $(24,160) $(22,327) $(19,563) $(14,072) $(14,484) $(14,305) $(14,650)
1989 $(17,138) $(18,280) $(18,977) $(8,402) $1,666 $4,501 $9,160 $16,637 $22,329 $31,110 $36,523 $26,733
1990 $22,405 $9,824 $14,570 $29,306 $10,969 $5,113 $7,061 $11,499 $25,621 $31,443 $28,112 $30,152
1991 $25,346 $25,118 $28,968 $34,620 $42,412 $46,718 $47,788 $64,569 $63,967 $53,710 $39,129 $25,479
1992 $17,864 $12,938 $14,281 $12,436 $13,476 $12,043 $12,237 $6,439 $(3,527) $(14,576) $(25,597) $(30,229)
1993 $(33,516) $(38,676) $(41,582) $(42,741) $(43,808) $(47,492) $(47,961) $(44,649) $(37,424) $(40,085) $(37,400) $(34,697)
1994 $(38,407) $(39,053) $(38,779) $(34,556) $(30,295) $(27,786) $(24,586) $(19,326) $(15,818) $562 $11,889 $(2,845)
1995 $(8,362) $(2,506) $21,779 $51,505 $9,863 $(8,075) $(6,394) $(2,184) $12,559 $17,942 $18,106 $24,692
1996 $20,457 $24,377 $30,531 $37,597 $53,891 $67,264 $75,349 $108,710 $113,980 $104,467 $82,958 $70,403
1997 $74,794 $82,916 $88,534 $89,939 $92,761 $94,508 $96,721 $92,473 $79,782 $65,726 $49,067 $44,947
1998 $42,964 $36,611 $32,014 $29,737 $30,135 $28,874 $29,852 $38,380 $43,423 $32,591 $28,593 $27,216
1999 $27,395 $27,006 $32,716 $45,111 $51,535 $53,516 $59,939 $53,924 $48,924 $46,366 $41,847 $38,553
2000 $36,565 $40,273 $51,764 $48,639 $46,382 $39,822 $38,014 $37,001 $37,224 $37,247 $34,122 $29,600
2001 $27,783 $27,744 $25,609 $20,273 $15,206 $18,275 $20,806 $20,374 $20,945 $19,136 $14,984 $12,736
2002 $9,438 $5,552 $4,884 $8,964 $13,973 $13,755 $11,272 $10,975 $12,414 $17,929 $14,076 $15,946
2003 $17,637 $15,395 $9,647 $9,059 $11,773 $13,044 $12,530 $17,345 $20,281 $16,661 $14,179 $16,853
2004 $16,789 $16,920 $22,833 $33,201 $31,109 $31,044 $35,633 $34,702 $33,872 $34,400 $35,781 $40,315
2005 $43,770 $47,729 $50,063 $56,033 $58,793 $56,758 $56,573 $56,159 $56,025 $54,603 $53,821 $49,169
2006 $44,906 $40,321 $41,214 $42,021 $42,570 $43,352 $44,421 $43,988 $42,982 $36,923 $29,458 $27,400
2007 $27,529 $27,382 $30,532 $35,710 $33,760 $29,692 $25,190 $20,897 $19,276 $23,551 $24,356 $26,849
nOteS: Result of investing the difference in monthly payments between fixed and variable at the T-bill rate of the appropriate period and continuing to do so for 15 years.
www.advisor.ca 0 2 2 0 0 8 AE 29
AE02_025-039.indd 29 1/28/08 7:31:09 PM
continued from page 29
continued on page 33
Mature SavingsThe MVS: 10-year periods ended January 1965 through December 2007.
s
Mortgage Maturity Date
Jan Feb Mar apr May Jun Jul aug Sep Oct nOv Dec
1965 $7,309 $7,200 $7,089 $6,976 $5,439 $5,324 $5,035 $4,650 $4,978 $5,219 $5,364 $5,240
1966 $5,116 $4,990 $5,131 $5,003 $4,933 $5,133 $5,602 $6,616 $6,846 $7,622 $8,158 $8,147
1967 $8,408 $8,668 $8,652 $8,455 $8,257 $9,054 $9,124 $9,381 $9,946 $9,961 $9,978 $9,720
1968 $9,712 $9,427 $8,833 $8,407 $8,311 $8,266 $8,216 $8,324 $8,262 $8,483 $8,419 $8,354
1969 $8,575 $8,511 $8,445 $8,033 $7,901 $8,181 $8,175 $8,968 $10,415 $10,412 $10,698 $10,690
1970 $10,787 $10,681 $10,607 $10,582 $10,274 $10,237 $9,955 $10,113 $9,800 $9,333 $9,346 $9,484
1971 $9,376 $9,437 $9,380 $9,333 $9,303 $9,329 $9,415 $9,520 $9,475 $9,413 $9,363 $9,311
1972 $9,146 $8,946 $8,708 $7,932 $7,157 $8,122 $8,547 $8,538 $8,567 $9,218 $9,209 $9,112
1973 $9,582 $9,504 $9,627 $9,616 $9,401 $9,219 $9,056 $9,465 $9,210 $9,082 $9,134 $9,052
1974 $9,593 $9,484 $9,425 $9,082 $8,435 $8,749 $9,023 $9,805 $9,906 $9,963 $9,991 $10,216
1975 $9,583 $9,020 $8,728 $8,581 $8,419 $8,133 $8,838 $9,371 $9,224 $9,637 $9,549 $9,804
1976 $9,072 $8,903 $7,919 $7,696 $7,785 $8,141 $8,875 $9,575 $9,656 $9,627 $9,072 $8,770
1977 $8,270 $7,531 $6,955 $6,609 $6,361 $7,186 $7,864 $7,733 $7,668 $9,855 $9,650 $9,180
1978 $10,749 $10,437 $11,186 $12,808 $13,169 $13,171 $13,176 $13,299 $12,983 $12,643 $12,884 $12,622
1979 $14,835 $14,648 $14,748 $16,342 $17,022 $18,793 $20,777 $22,040 $23,422 $24,223 $24,875 $26,186
1980 $26,724 $24,572 $24,272 $24,569 $25,238 $25,426 $24,542 $24,978 $25,529 $25,833 $24,778 $23,493
1981 $21,517 $19,432 $15,876 $15,115 $14,986 $15,128 $15,481 $15,517 $15,021 $14,093 $10,889 $8,065
1982 $5,502 $2,530 $2,011 $1,641 $2,173 $3,006 $2,526 $1,367 $57 $(1,208) $(2,726) $(4,558)
1983 $(6,858) $(8,637) $(9,282) $(9,505) $(9,194) $(8,442) $(7,558) $(6,565) $(4,409) $(4,338) $(4,587) $(5,035)
1984 $(6,118) $(6,763) $(7,312) $(1,892) $3,041 $4,152 $6,241 $10,031 $13,000 $16,093 $17,986 $14,438
1985 $12,782 $4,897 $4,435 $9,530 $4,607 $3,594 $4,462 $6,235 $12,142 $14,524 $12,560 $12,713
1986 $10,617 $9,926 $11,510 $14,033 $16,568 $17,314 $17,016 $22,242 $21,455 $17,095 $11,914 $6,083
1987 $1,458 $(2,143) $(1,910) $(3,041) $(3,054) $(4,190) $(4,392) $(7,189) $(11,144) $(15,364) $(19,166) $(21,265)
1988 $(23,003) $(25,108) $(26,271) $(26,797) $(27,727) $(29,903) $(30,578) $(30,295) $(27,149) $(27,264) $(25,502) $(24,062)
1989 $(26,633) $(27,226) $(28,039) $(27,264) $(25,730) $(24,506) $(23,433) $(19,493) $(16,771) $(6,325) $1,491 $(7,264)
1990 $(10,447) $(7,592) $5,626 $25,010 $(1,877) $(12,503) $(11,328) $(8,388) $1,093 $4,477 $5,006 $10,198
1991 $7,618 $10,377 $15,171 $21,176 $33,406 $42,175 $47,396 $70,904 $74,747 $68,550 $54,310 $46,007
1992 $49,956 $56,587 $60,700 $61,012 $62,160 $63,592 $65,846 $63,006 $53,548 $42,081 $30,755 $27,451
1993 $25,639 $21,409 $19,235 $17,605 $17,316 $16,065 $16,838 $22,045 $25,123 $17,825 $15,672 $14,107
1994 $14,360 $14,107 $16,927 $23,282 $28,460 $30,037 $33,636 $29,850 $26,585 $24,880 $21,539 $18,275
1995 $16,249 $18,295 $26,347 $23,128 $21,379 $17,228 $16,070 $15,395 $15,678 $16,129 $14,122 $11,850
1996 $11,512 $12,532 $10,677 $6,634 $2,953 $5,029 $6,639 $6,513 $7,039 $6,992 $5,533 $4,338
1997 $1,807 $(1,064) $(2,171) $(357) $3,655 $4,317 $3,377 $3,864 $5,149 $8,313 $5,286 $6,109
1998 $7,290 $5,672 $2,071 $1,727 $3,524 $4,441 $4,268 $7,736 $9,622 $7,574 $6,523 $8,961
1999 $9,424 $9,613 $12,740 $18,567 $16,599 $15,651 $17,676 $17,117 $17,166 $17,587 $18,380 $21,237
2000 $23,113 $26,275 $29,239 $34,377 $37,401 $36,610 $36,962 $36,199 $36,158 $35,436 $35,078 $32,056
2001 $29,694 $26,522 $27,016 $27,105 $27,337 $27,786 $28,586 $29,005 $28,679 $24,838 $19,882 $18,149
2002 $17,888 $17,744 $19,967 $22,947 $21,504 $18,660 $15,548 $12,452 $11,325 $14,861 $15,520 $17,194
2003 $17,228 $16,974 $14,265 $13,659 $13,787 $13,584 $12,504 $12,175 $12,469 $11,206 $7,493 $6,216
2004 $4,045 $3,345 $7,508 $15,577 $16,407 $18,918 $24,307 $23,094 $21,146 $20,696 $21,269 $23,626
2005 $26,219 $26,080 $23,037 $21,957 $19,111 $17,508 $16,856 $19,182 $19,508 $18,681 $18,398 $17,152
2006 $14,580 $13,435 $15,047 $16,996 $17,355 $17,703 $17,821 $15,243 $14,272 $11,433 $8,358 $8,128
2007 $9,081 $8,839 $8,797 $11,751 $11,124 $9,708 $8,191 $7,703 $7,186 $5,877 $5,574 $6,549
www.advisor.ca 0 2 2 0 0 8 AE 31
AE02_025-039.indd 31 1/28/08 7:31:21 PM
No NegotiatioN Negotiator aggressive
Reduction (fixed/float) - 100bp/50bp 150bp/75bp
Positive 90.50% 81.01% 72.48%
Negative 9.50% 18.99% 27.52%
Note: All four tables assume a negotiator is able to obtain a 100-basis point reduction on the five-year fixed rate and a 50-
basis point reduction on the floating rate of interest. It also assumes an aggressive negotiator is able to obtain a 150-basis
point reduction on the five-year fixed rate and a 75-basis point reduction on the floating rate of interest.
Frequency in which the borrower paid off the mortgage sooner given his or her ability to negotiate over the 10-year periods ending from January 1965 through December 31, 2007.
TotalMonthsSaved(TMS)
January1965-December2007
No NegotiatioN Negotiator aggressive
Reduction (fixed/float) - 100bp/50bp 150bp/75bp
Positive 88.37% 84.88% 77.91%
Negative 11.63% 15.12% 22.09%
Frequency in which the borrower paid off the mortgage sooner given his or her ability to negotiate over the 15-year periods ending from January 1965 through December 31, 2007.
TotalMonthsSaved(TMS)
January1965-December2007
No NegotiatioN Negotiator aggressive
Reduction (fixed/float) - 100bp/50bp 150bp/75bp
Positive 87.98% 81.59% 75.97%
Negative 12.02% 18.41% 24.03%
Frequency of a positive MVS over the 10-year periods ending from January 1965 through December 31, 2007 given the borrower’s ability to negotiate.
MaturityValueofSavings(MVS)
January1965-December2007
No NegotiatioN Negotiator aggressive
Reduction (fixed/float) - 100bp/50bp 150bp/75bp
Positive 90.12% 85.08% 77.13%
Negative 9.88% 14.92% 22.87%
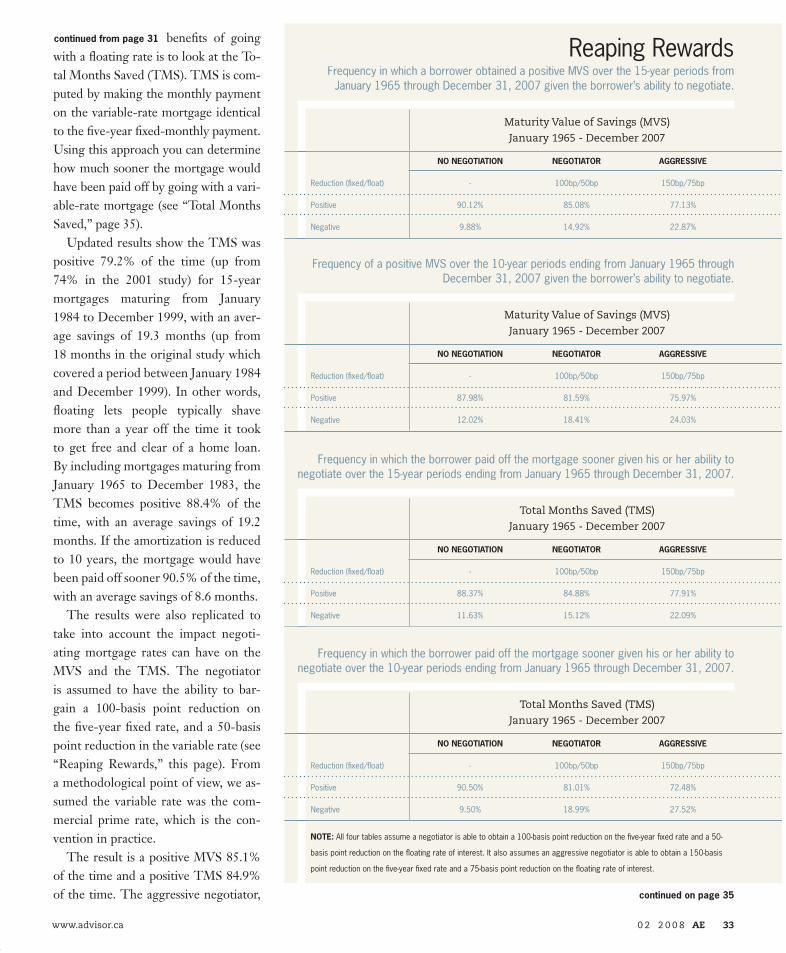
Reaping RewardsFrequency in which a borrower obtained a positive MVS over the 15-year periods from
January 1965 through December 31, 2007 given the borrower’s ability to negotiate.
MaturityValueofSavings(MVS)
January1965-December2007
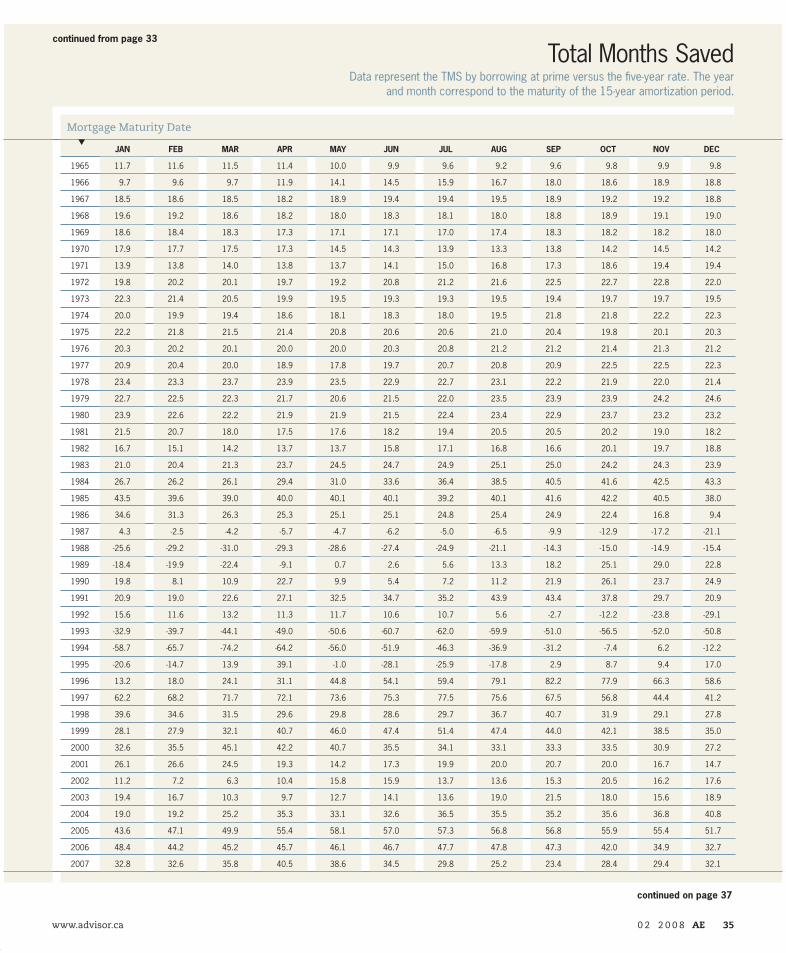
benefits of going with a floating rate is to look at the To-tal Months Saved (TMS). TMS is com-puted by making the monthly payment on the variable-rate mortgage identical to the five-year fixed-monthly payment. Using this approach you can determine how much sooner the mortgage would have been paid off by going with a vari-able-rate mortgage (see “Total Months Saved,” page 35).
Updated results show the TMS was positive 79.2% of the time (up from 74% in the 2001 study) for 15-year mortgages maturing from January 1984 to December 1999, with an aver-age savings of 19.3 months (up from 18 months in the original study which covered a period between January 1984 and December 1999). In other words, floating lets people typically shave more than a year off the time it took to get free and clear of a home loan. By including mortgages maturing from January 1965 to December 1983, the TMS becomes positive 88.4% of the time, with an average savings of 19.2 months. If the amortization is reduced to 10 years, the mortgage would have been paid off sooner 90.5% of the time, with an average savings of 8.6 months.
The results were also replicated to take into account the impact negoti-ating mortgage rates can have on the MVS and the TMS. The negotiator is assumed to have the ability to bar-gain a 100-basis point reduction on the five-year fixed rate, and a 50-basis point reduction in the variable rate (see “Reaping Rewards,” this page). From a methodological point of view, we as-sumed the variable rate was the com-mercial prime rate, which is the con-vention in practice.
The result is a positive MVS 85.1% of the time and a positive TMS 84.9% of the time. The aggressive negotiator, continued on page 35
www.advisor.ca 0 2 2 0 0 8 AE 33
continued from page 31
AE02_025-039.indd 33 1/28/08 7:31:28 PM
continued from page 33
continued on page 37
Total Months SavedData represent the TMS by borrowing at prime versus the five-year rate. The year
and month correspond to the maturity of the 15-year amortization period.
s
Mortgage Maturity Date
Jan Feb Mar apr May Jun Jul aug Sep Oct nOv Dec
1965 11.7 11.6 11.5 11.4 10.0 9.9 9.6 9.2 9.6 9.8 9.9 9.8
1966 9.7 9.6 9.7 11.9 14.1 14.5 15.9 16.7 18.0 18.6 18.9 18.8
1967 18.5 18.6 18.5 18.2 18.9 19.4 19.4 19.5 18.9 19.2 19.2 18.8
1968 19.6 19.2 18.6 18.2 18.0 18.3 18.1 18.0 18.8 18.9 19.1 19.0
1969 18.6 18.4 18.3 17.3 17.1 17.1 17.0 17.4 18.3 18.2 18.2 18.0
1970 17.9 17.7 17.5 17.3 14.5 14.3 13.9 13.3 13.8 14.2 14.5 14.2
1971 13.9 13.8 14.0 13.8 13.7 14.1 15.0 16.8 17.3 18.6 19.4 19.4
1972 19.8 20.2 20.1 19.7 19.2 20.8 21.2 21.6 22.5 22.7 22.8 22.0
1973 22.3 21.4 20.5 19.9 19.5 19.3 19.3 19.5 19.4 19.7 19.7 19.5
1974 20.0 19.9 19.4 18.6 18.1 18.3 18.0 19.5 21.8 21.8 22.2 22.3
1975 22.2 21.8 21.5 21.4 20.8 20.6 20.6 21.0 20.4 19.8 20.1 20.3
1976 20.3 20.2 20.1 20.0 20.0 20.3 20.8 21.2 21.2 21.4 21.3 21.2
1977 20.9 20.4 20.0 18.9 17.8 19.7 20.7 20.8 20.9 22.5 22.5 22.3
1978 23.4 23.3 23.7 23.9 23.5 22.9 22.7 23.1 22.2 21.9 22.0 21.4
1979 22.7 22.5 22.3 21.7 20.6 21.5 22.0 23.5 23.9 23.9 24.2 24.6
1980 23.9 22.6 22.2 21.9 21.9 21.5 22.4 23.4 22.9 23.7 23.2 23.2
1981 21.5 20.7 18.0 17.5 17.6 18.2 19.4 20.5 20.5 20.2 19.0 18.2
1982 16.7 15.1 14.2 13.7 13.7 15.8 17.1 16.8 16.6 20.1 19.7 18.8
1983 21.0 20.4 21.3 23.7 24.5 24.7 24.9 25.1 25.0 24.2 24.3 23.9
1984 26.7 26.2 26.1 29.4 31.0 33.6 36.4 38.5 40.5 41.6 42.5 43.3
1985 43.5 39.6 39.0 40.0 40.1 40.1 39.2 40.1 41.6 42.2 40.5 38.0
1986 34.6 31.3 26.3 25.3 25.1 25.1 24.8 25.4 24.9 22.4 16.8 9.4
1987 4.3 -2.5 -4.2 -5.7 -4.7 -6.2 -5.0 -6.5 -9.9 -12.9 -17.2 -21.1
1988 -25.6 -29.2 -31.0 -29.3 -28.6 -27.4 -24.9 -21.1 -14.3 -15.0 -14.9 -15.4
1989 -18.4 -19.9 -22.4 -9.1 0.7 2.6 5.6 13.3 18.2 25.1 29.0 22.8
1990 19.8 8.1 10.9 22.7 9.9 5.4 7.2 11.2 21.9 26.1 23.7 24.9
1991 20.9 19.0 22.6 27.1 32.5 34.7 35.2 43.9 43.4 37.8 29.7 20.9
1992 15.6 11.6 13.2 11.3 11.7 10.6 10.7 5.6 -2.7 -12.2 -23.8 -29.1
1993 -32.9 -39.7 -44.1 -49.0 -50.6 -60.7 -62.0 -59.9 -51.0 -56.5 -52.0 -50.8
1994 -58.7 -65.7 -74.2 -64.2 -56.0 -51.9 -46.3 -36.9 -31.2 -7.4 6.2 -12.2
1995 -20.6 -14.7 13.9 39.1 -1.0 -28.1 -25.9 -17.8 2.9 8.7 9.4 17.0
1996 13.2 18.0 24.1 31.1 44.8 54.1 59.4 79.1 82.2 77.9 66.3 58.6
1997 62.2 68.2 71.7 72.1 73.6 75.3 77.5 75.6 67.5 56.8 44.4 41.2
1998 39.6 34.6 31.5 29.6 29.8 28.6 29.7 36.7 40.7 31.9 29.1 27.8
1999 28.1 27.9 32.1 40.7 46.0 47.4 51.4 47.4 44.0 42.1 38.5 35.0
2000 32.6 35.5 45.1 42.2 40.7 35.5 34.1 33.1 33.3 33.5 30.9 27.2
2001 26.1 26.6 24.5 19.3 14.2 17.3 19.9 20.0 20.7 20.0 16.7 14.7
2002 11.2 7.2 6.3 10.4 15.8 15.9 13.7 13.6 15.3 20.5 16.2 17.6
2003 19.4 16.7 10.3 9.7 12.7 14.1 13.6 19.0 21.5 18.0 15.6 18.9
2004 19.0 19.2 25.2 35.3 33.1 32.6 36.5 35.5 35.2 35.6 36.8 40.8
2005 43.6 47.1 49.9 55.4 58.1 57.0 57.3 56.8 56.8 55.9 55.4 51.7
2006 48.4 44.2 45.2 45.7 46.1 46.7 47.7 47.8 47.3 42.0 34.9 32.7
2007 32.8 32.6 35.8 40.5 38.6 34.5 29.8 25.2 23.4 28.4 29.4 32.1
www.advisor.ca 0 2 2 0 0 8 AE 35
AE02_025-039.indd 35 1/28/08 7:31:35 PM
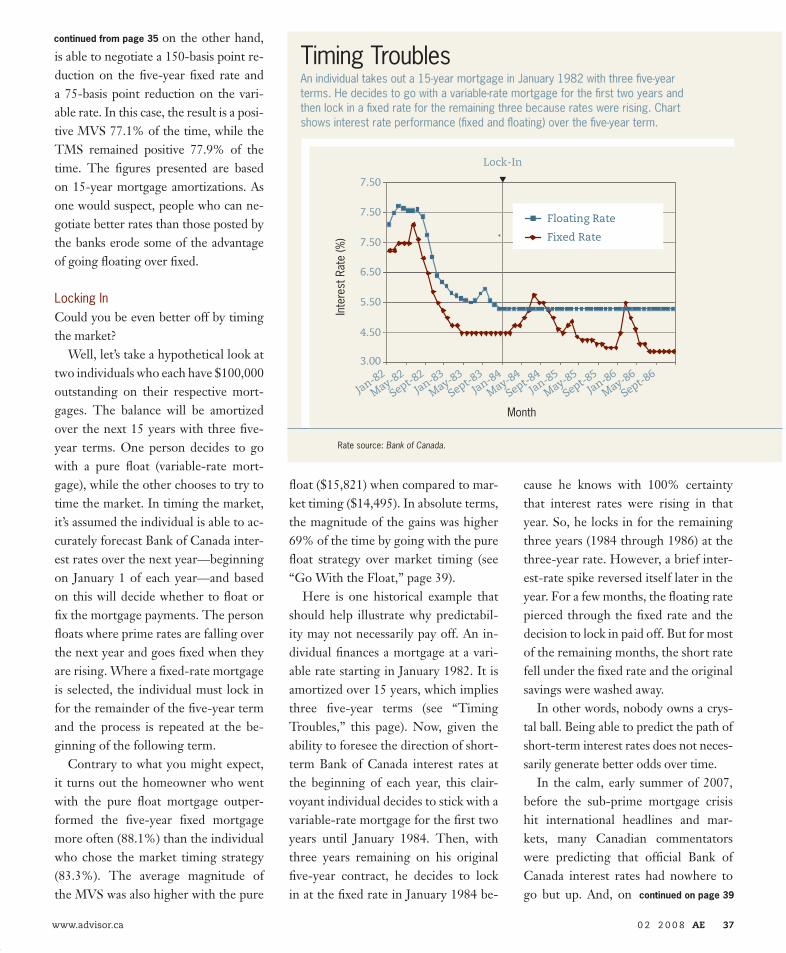
Timing TroublesAn individual takes out a 15-year mortgage in January 1982 with three five-year terms. He decides to go with a variable-rate mortgage for the first two years and then lock in a fixed rate for the remaining three because rates were rising. Chart shows interest rate performance (fixed and floating) over the five-year term.
Month
Floating Rate
Fixed Rate
3.00
4.50
5.50
6.50
7.50
Jan-82
Inte
rest
Rat
e (%
)
Rate source: Bank of Canada.
7.50
7.50
May-82
Sept-82Jan-83
May-83
Sept-83
Jan-84
May-84
Sept-84
Jan-85
May-85
Sept-85Jan-86
May-86
Sept-86
s
Lock-In
on the other hand, is able to negotiate a 150-basis point re-duction on the five-year fixed rate and a 75-basis point reduction on the vari-able rate. In this case, the result is a posi-tive MVS 77.1% of the time, while the TMS remained positive 77.9% of the time. The figures presented are based on 15-year mortgage amortizations. As one would suspect, people who can ne-gotiate better rates than those posted by the banks erode some of the advantage of going floating over fixed.
Locking InCould you be even better off by timing the market?
Well, let’s take a hypothetical look at two individuals who each have $100,000 outstanding on their respective mort-gages. The balance will be amortized over the next 15 years with three five-year terms. One person decides to go with a pure float (variable-rate mort-gage), while the other chooses to try to time the market. In timing the market, it’s assumed the individual is able to ac-curately forecast Bank of Canada inter-est rates over the next year—beginning on January 1 of each year—and based on this will decide whether to float or fix the mortgage payments. The person floats where prime rates are falling over the next year and goes fixed when they are rising. Where a fixed-rate mortgage is selected, the individual must lock in for the remainder of the five-year term and the process is repeated at the be-ginning of the following term.
Contrary to what you might expect, it turns out the homeowner who went with the pure float mortgage outper-formed the five-year fixed mortgage more often (88.1%) than the individual who chose the market timing strategy (83.3%). The average magnitude of the MVS was also higher with the pure
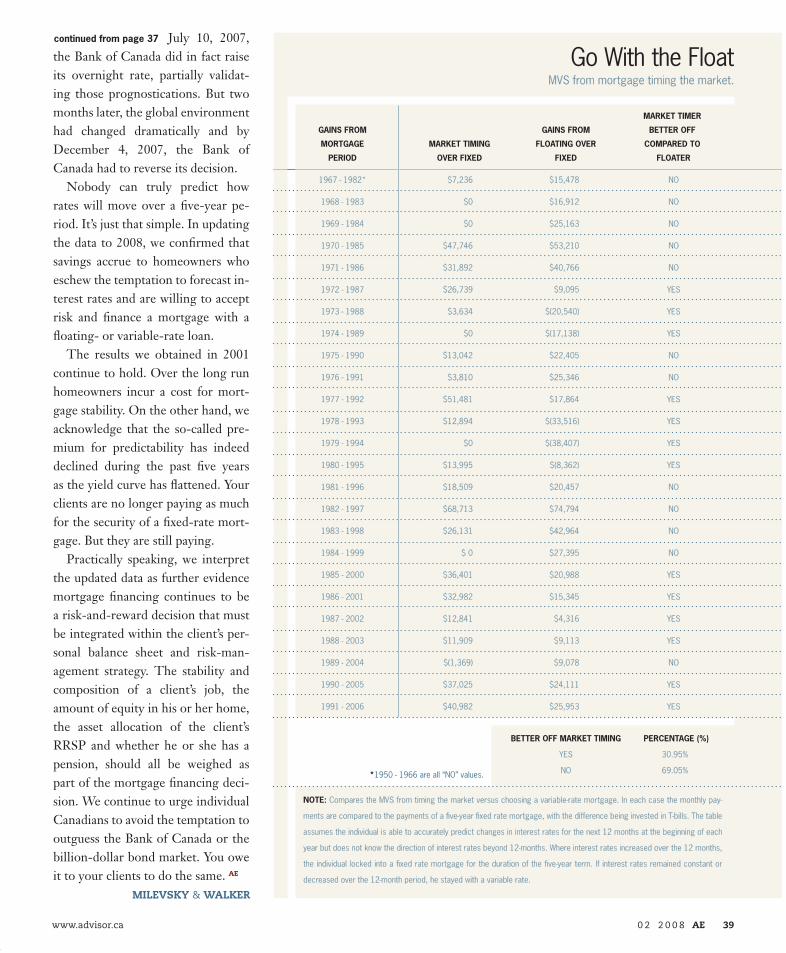
float ($15,821) when compared to mar-ket timing ($14,495). In absolute terms, the magnitude of the gains was higher 69% of the time by going with the pure float strategy over market timing (see “Go With the Float,” page 39).
Here is one historical example that should help illustrate why predictabil-ity may not necessarily pay off. An in-dividual finances a mortgage at a vari-able rate starting in January 1982. It is amortized over 15 years, which implies three five-year terms (see “Timing Troubles,” this page). Now, given the ability to foresee the direction of short-term Bank of Canada interest rates at the beginning of each year, this clair-voyant individual decides to stick with a variable-rate mortgage for the first two years until January 1984. Then, with three years remaining on his original five-year contract, he decides to lock in at the fixed rate in January 1984 be-
cause he knows with 100% certainty that interest rates were rising in that year. So, he locks in for the remaining three years (1984 through 1986) at the three-year rate. However, a brief inter-est-rate spike reversed itself later in the year. For a few months, the floating rate pierced through the fixed rate and the decision to lock in paid off. But for most of the remaining months, the short rate fell under the fixed rate and the original savings were washed away.
In other words, nobody owns a crys-tal ball. Being able to predict the path of short-term interest rates does not neces-sarily generate better odds over time.
In the calm, early summer of 2007, before the sub-prime mortgage crisis hit international headlines and mar-kets, many Canadian commentators were predicting that official Bank of Canada interest rates had nowhere to go but up. And, on
continued from page 35
www.advisor.ca 0 2 2 0 0 8 AE 37
continued on page 39
AE02_025-039.indd 37 1/28/08 7:33:54 PM
MarkettiMer
GainsfroM GainsfroM betteroff
MortGaGe MarkettiMinG floatinGover coMparedto
period overfixed fixed floater
1967-1982* $7,236 $15,478 NO
1968-1983 $0 $16,912 NO
1969-1984 $0 $25,163 NO
1970-1985 $47,746 $53,210 NO
1971-1986 $31,892 $40,766 NO
1972-1987 $26,739 $9,095 YES
1973-1988 $3,634 $(20,540) YES
1974-1989 $0 $(17,138) YES
1975-1990 $13,042 $22,405 NO
1976-1991 $3,810 $25,346 NO
1977-1992 $51,481 $17,864 YES
1978-1993 $12,894 $(33,516) YES
1979-1994 $0 $(38,407) YES
1980-1995 $13,995 $(8,362) YES
1981-1996 $18,509 $20,457 NO
1982-1997 $68,713 $74,794 NO
1983-1998 $26,131 $42,964 NO
1984-1999 $0 $27,395 NO
1985-2000 $36,401 $20,988 YES
1986-2001 $32,982 $15,345 YES
1987-2002 $12,841 $4,316 YES
1988-2003 $11,909 $9,113 YES
1989-2004 $(1,369) $9,078 NO
1990-2005 $37,025 $24,111 YES
1991-2006 $40,982 $25,953 YES
GoWiththeFloatMVSfrommortgagetimingthemarket.
July 10, 2007, the Bank of Canada did in fact raise its overnight rate, partially validat-ing those prognostications. But two months later, the global environment had changed dramatically and by December 4, 2007, the Bank of Canada had to reverse its decision.
Nobody can truly predict how rates will move over a five-year pe-riod. It’s just that simple. In updating the data to 2008, we confirmed that savings accrue to homeowners who eschew the temptation to forecast in-terest rates and are willing to accept risk and finance a mortgage with a floating- or variable-rate loan.
The results we obtained in 2001 continue to hold. Over the long run homeowners incur a cost for mort-gage stability. On the other hand, we acknowledge that the so-called pre-mium for predictability has indeed declined during the past five years as the yield curve has flattened. Your clients are no longer paying as much for the security of a fixed-rate mort-gage. But they are still paying.
Practically speaking, we interpret the updated data as further evidence mortgage financing continues to be a risk-and-reward decision that must be integrated within the client’s per-sonal balance sheet and risk-man-agement strategy. The stability and composition of a client’s job, the amount of equity in his or her home, the asset allocation of the client’s RRSP and whether he or she has a pension, should all be weighed as part of the mortgage financing deci-sion. We continue to urge individual Canadians to avoid the temptation to outguess the Bank of Canada or the billion-dollar bond market. You owe it to your clients to do the same. AE
www.advisor.ca 0 2 2 0 0 8 AE 39
continuedfrompage37
note:ComparestheMVSfromtimingthemarketversuschoosingavariable-ratemortgage.Ineachcasethemonthlypay-
mentsarecomparedtothepaymentsofafive-yearfixedratemortgage,withthedifferencebeinginvestedinT-bills.Thetable
assumestheindividualisabletoaccuratelypredictchangesininterestratesforthenext12monthsatthebeginningofeach
yearbutdoesnotknowthedirectionofinterestratesbeyond12-months.Whereinterestratesincreasedoverthe12months,
theindividuallockedintoafixedratemortgageforthedurationofthefive-yearterm.Ifinterestratesremainedconstantor
decreasedoverthe12-monthperiod,hestayedwithavariablerate.
betteroffMarkettiMinG percentaGe(%)
YES 30.95%
NO 69.05%
milEvsky &wAlkEr
*1950-1966areall“NO”values.
AE02_025-039.indd 39 1/28/08 7:34:01 PM