Embed Size (px)
Citation preview
Moving from 'My Experience' to 'My Measured Experience'
Brent C. James, MD, MStat Chief Quality Officer, Executive Director, Intermountain Institute for
Health Care Delivery Research, Intermountain Healthcare; Salt Lake City, Utah
Objectives: • Discuss the gap between current care delivery and the
transition results• Describe the difference between improvements and research• Discuss the need to move from managed care to managing
processes of care• Explain process control theory to clinical process and a
multidisciplinary team approach
The Learning Healthcare System:Building Effective, Affordable Care
Brent C. James, M.D., M.Stat.Executive Director, Institute for Health Care Delivery ResearchIntermountain HealthcareSalt Lake City, Utah, USA
Intermountain Healthcare Continuing Medical Education6th Annual Excellence in Urology Seminar
The Canyons Resort, Park City, UtahThursday, 6 February 2014, 7:05a - 8:20a
Disclosures
Neither I, Brent C. James, nor any family members, have any relevant financial relationships to be discussed, directly or indirectly, referred to or illustrated with or without recognition within the presentation.
I have no financial relationships beyond my employment at Intermountain Healthcare.
Outline
1. Change accelerates:Health reform = "bending the cost curve"
2. Quality (process managment with cost control) becomesthe core business
3. Building a Learning Health Care System
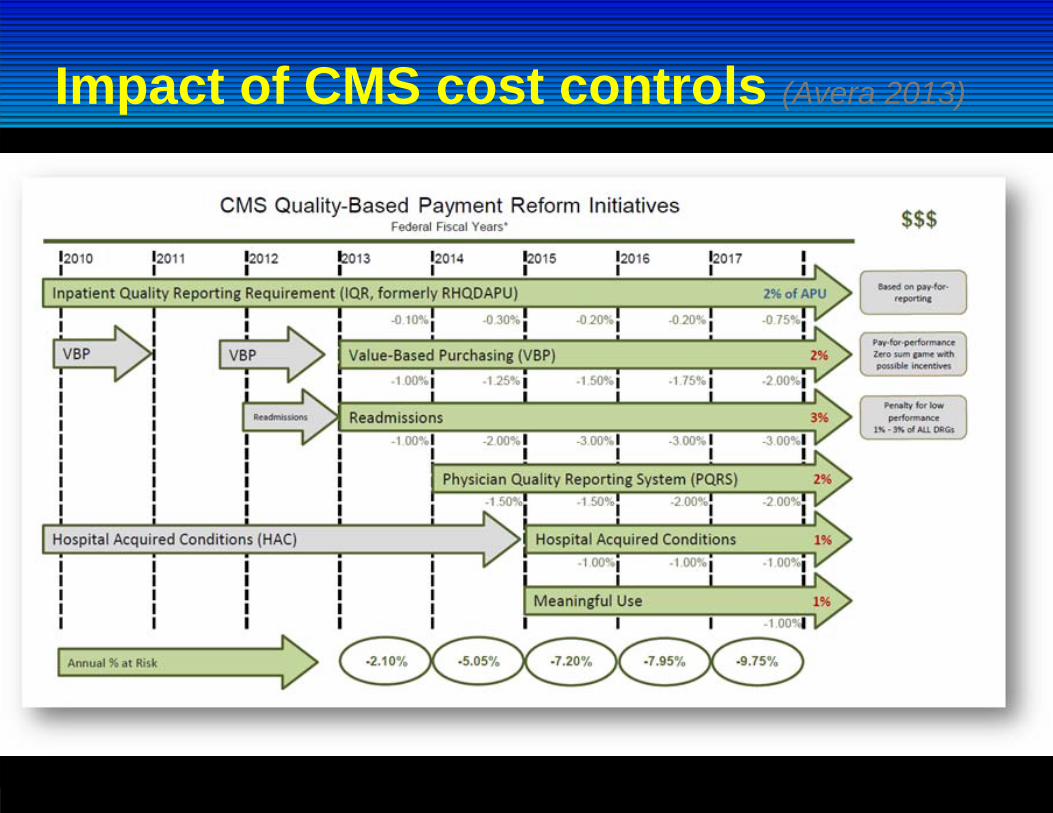
Impact of CMS cost controls (Avera 2013)
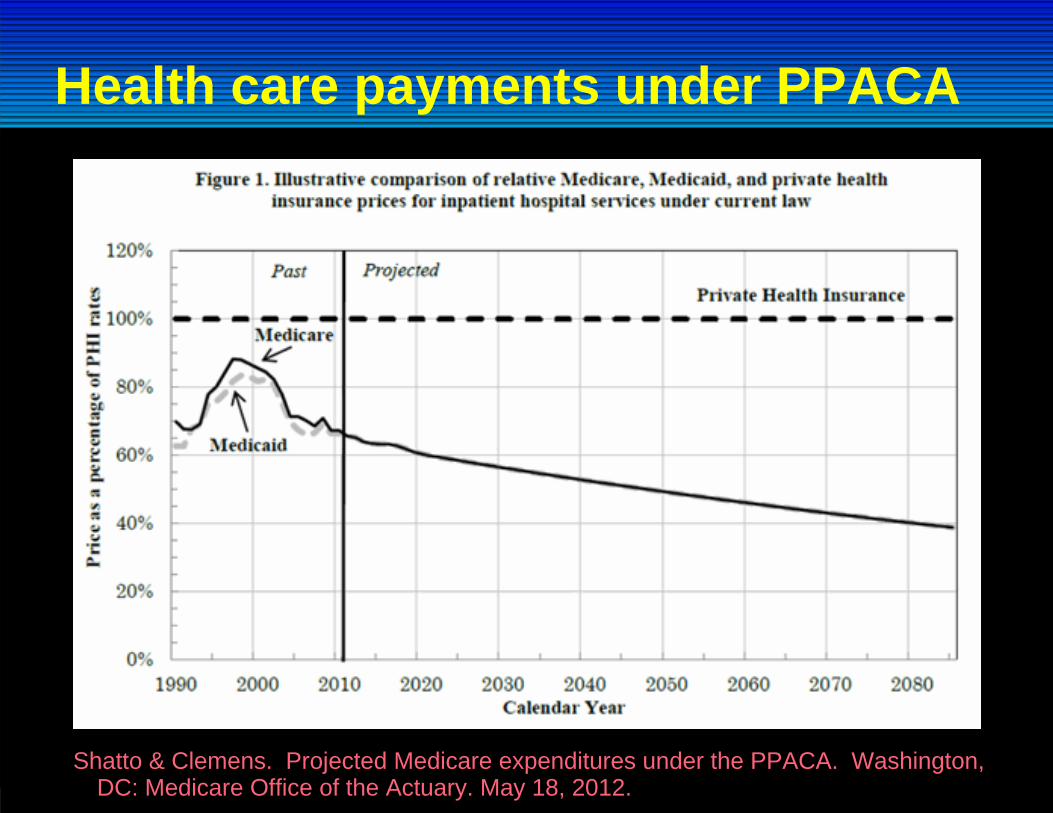
Health care payments under PPACA
Shatto & Clemens. Projected Medicare expenditures under the PPACA. Washington, DC: Medicare Office of the Actuary. May 18, 2012.
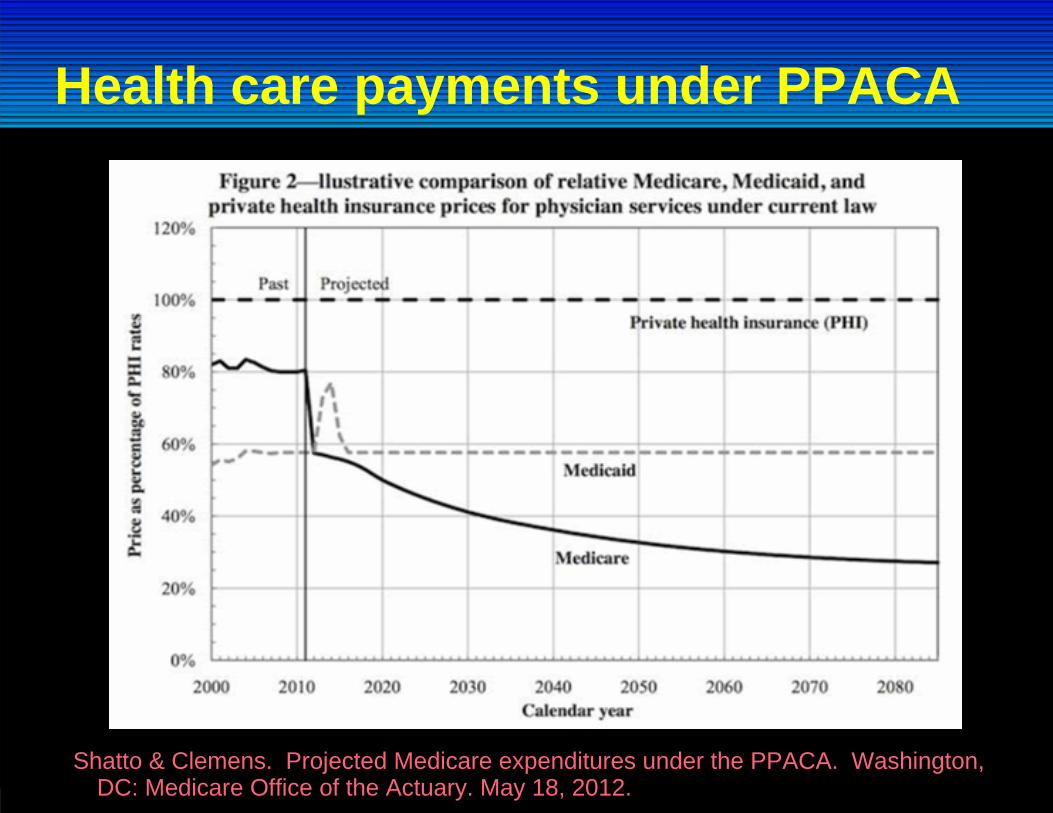
Health care payments under PPACA
Shatto & Clemens. Projected Medicare expenditures under the PPACA. Washington, DC: Medicare Office of the Actuary. May 18, 2012.
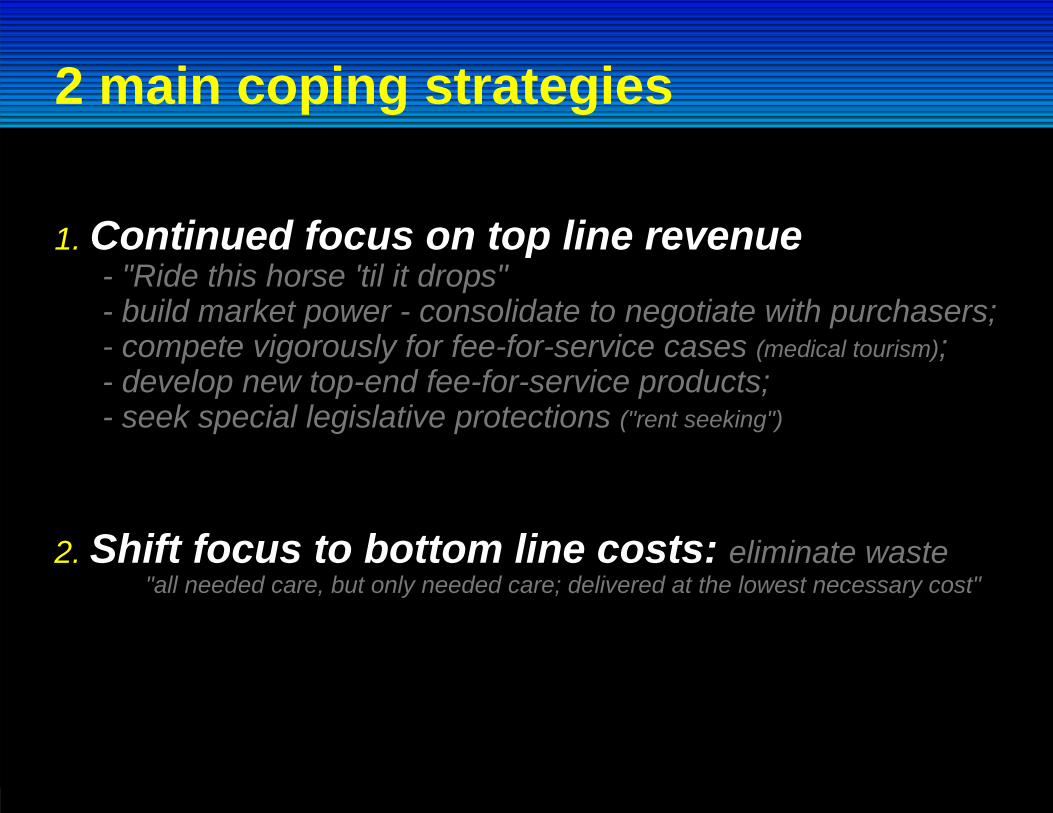
1. Continued focus on top line revenue- "Ride this horse 'til it drops"- build market power - consolidate to negotiate with purchasers;- compete vigorously for fee-for-service cases (medical tourism);- develop new top-end fee-for-service products;- seek special legislative protections ("rent seeking")
2. Shift focus to bottom line costs: eliminate waste"all needed care, but only needed care; delivered at the lowest necessary cost"
2 main coping strategies
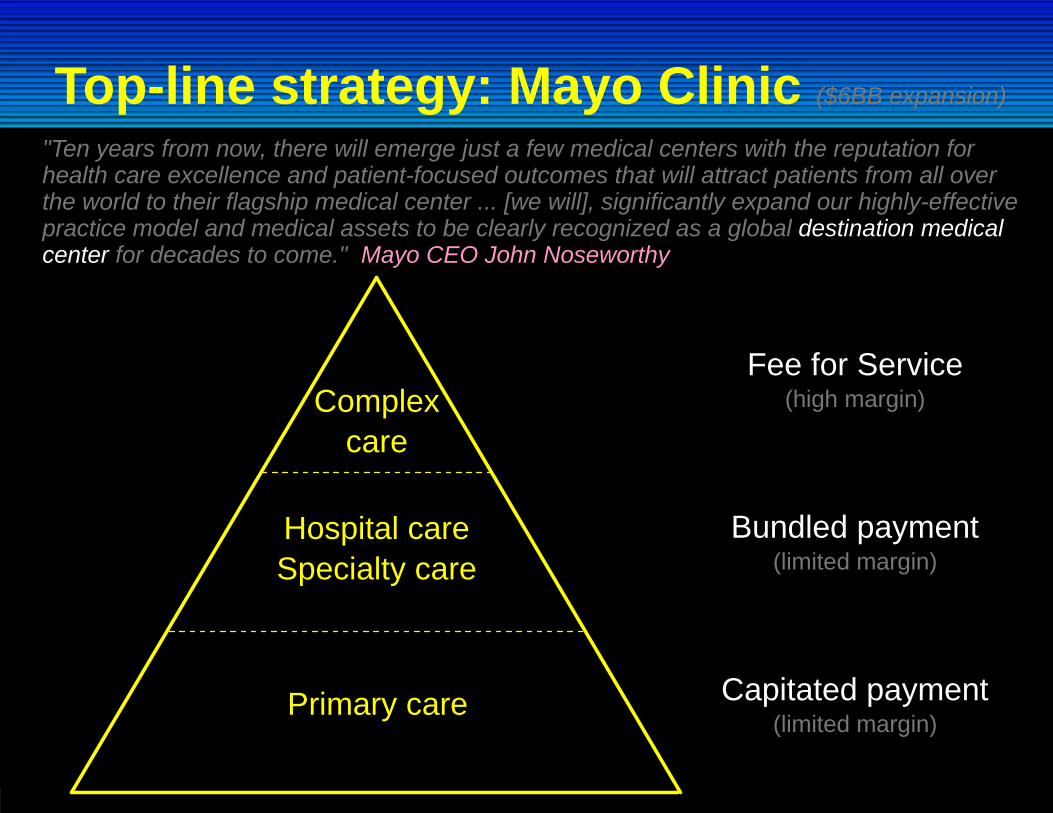
Top-line strategy: Mayo Clinic ($6BB expansion)
Primary care
Hospital careSpecialty care
Complexcare
Capitated payment(limited margin)
Bundled payment(limited margin)
Fee for Service(high margin)
"Ten years from now, there will emerge just a few medical centers with the reputation for health care excellence and patient-focused outcomes that will attract patients from all over the world to their flagship medical center ... [we will], significantly expand our highly-effective practice model and medical assets to be clearly recognized as a global destination medical center for decades to come." Mayo CEO John Noseworthy
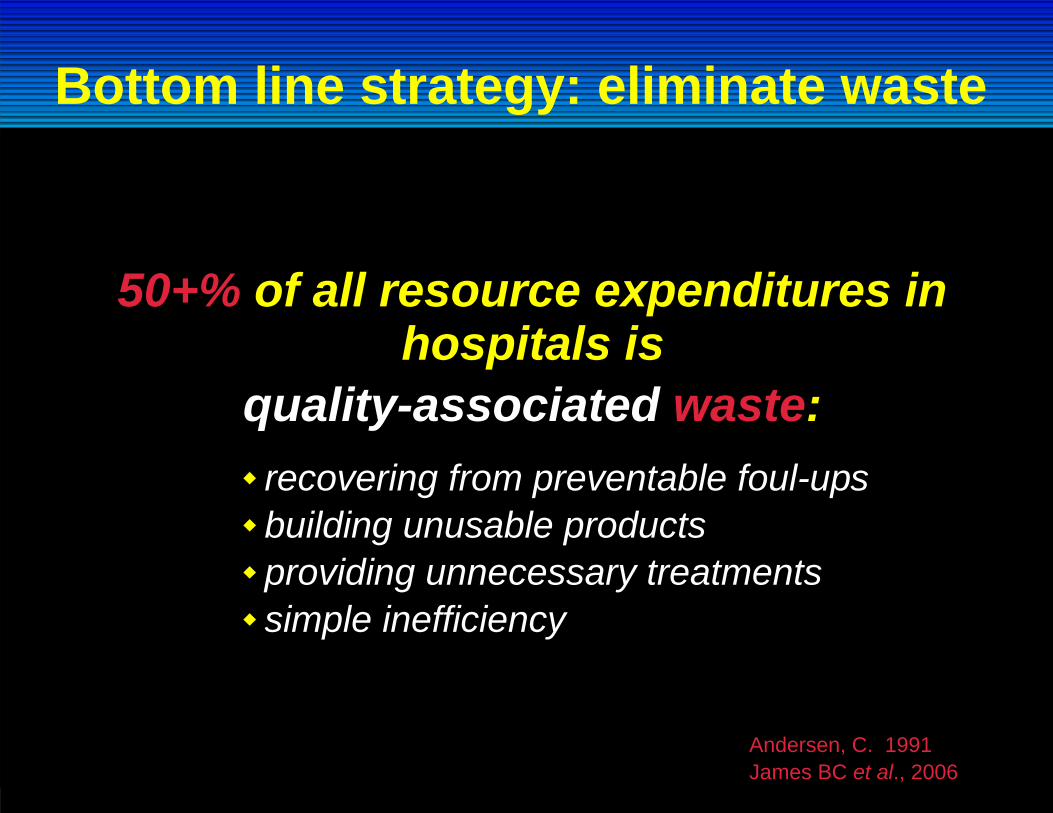
50+% of all resource expenditures in hospitals is
quality-associated waste:recovering from preventable foul-upsbuilding unusable productsproviding unnecessary treatmentssimple inefficiency
Andersen, C. 1991James BC et al., 2006
Bottom line strategy: eliminate waste
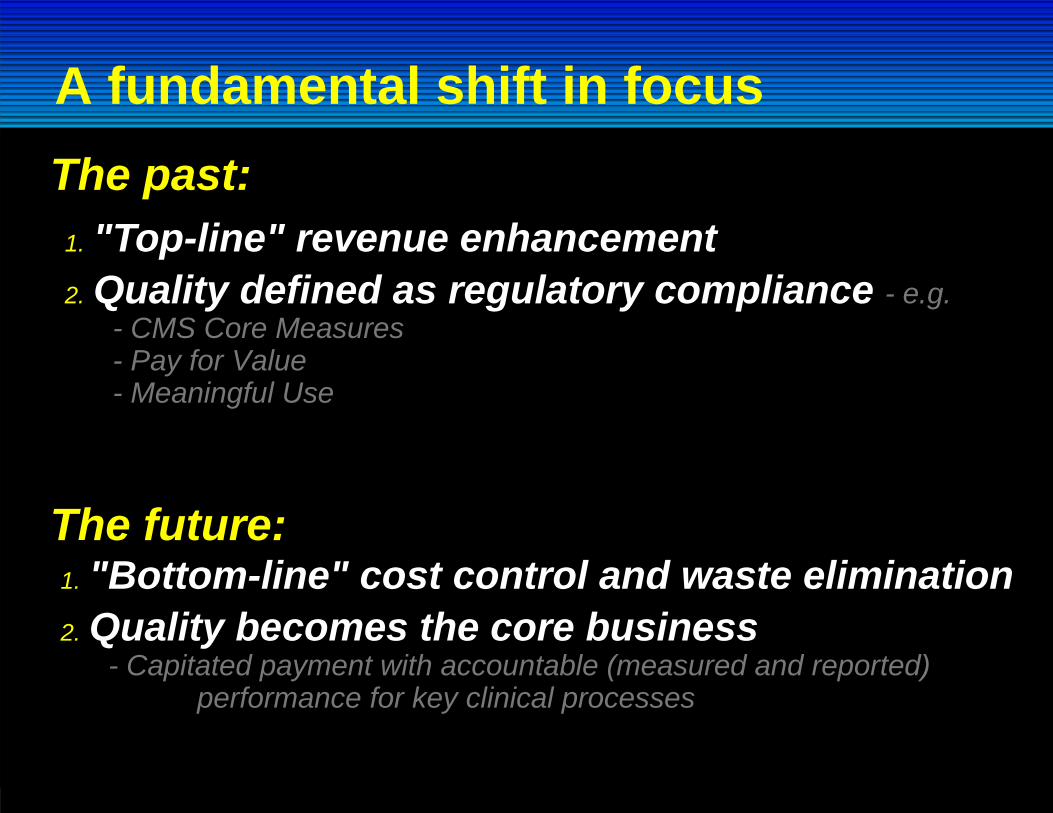
A fundamental shift in focusThe past:
1. "Top-line" revenue enhancement2. Quality defined as regulatory compliance - e.g.
- CMS Core Measures- Pay for Value- Meaningful Use
The future:1. "Bottom-line" cost control and waste elimination2. Quality becomes the core business
- Capitated payment with accountable (measured and reported)performance for key clinical processes
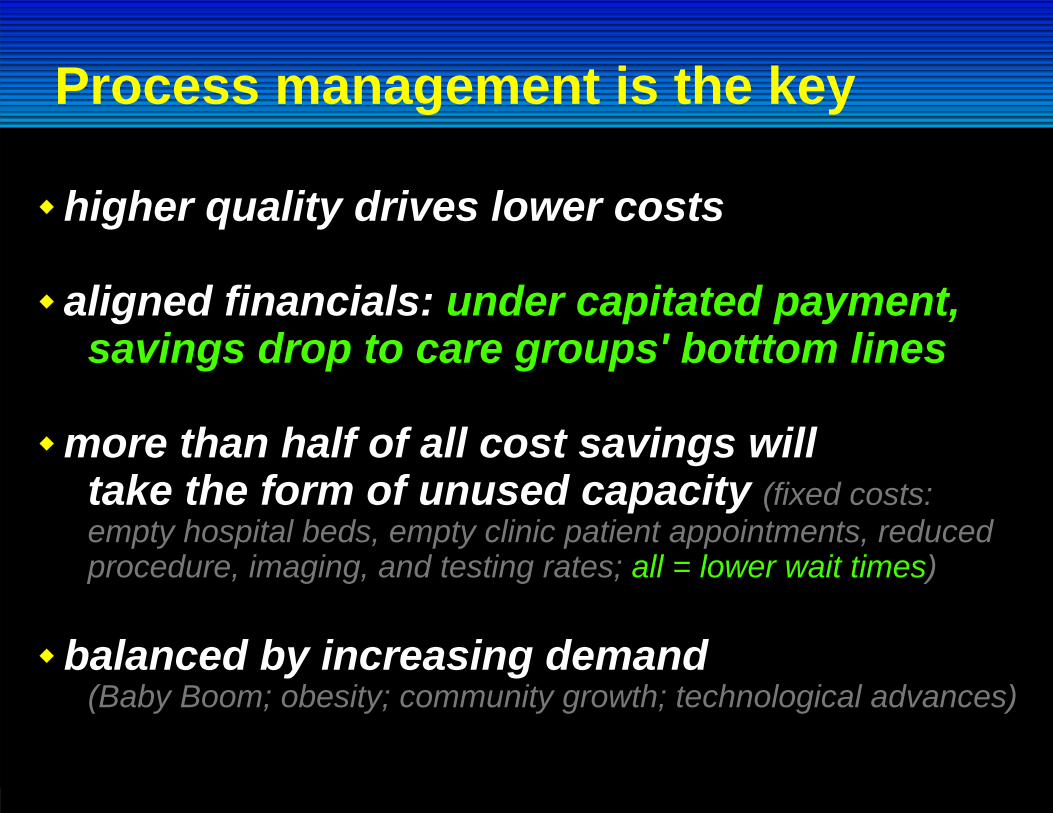
Process management is the key
higher quality drives lower costs
aligned financials: under capitated payment, savings drop to care groups' botttom lines
more than half of all cost savings willtake the form of unused capacity (fixed costs:empty hospital beds, empty clinic patient appointments, reduced procedure, imaging, and testing rates; all = lower wait times)
balanced by increasing demand(Baby Boom; obesity; community growth; technological advances)
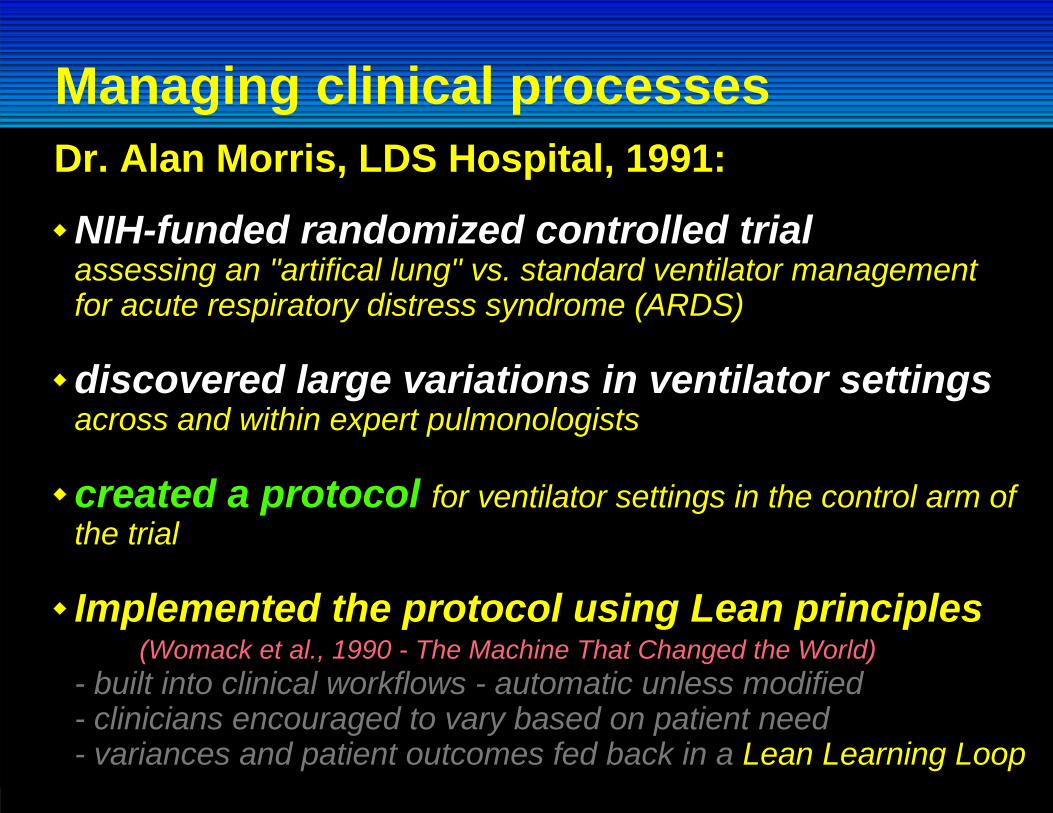
NIH-funded randomized controlled trialassessing an "artifical lung" vs. standard ventilator managementfor acute respiratory distress syndrome (ARDS)
discovered large variations in ventilator settings across and within expert pulmonologists
created a protocol for ventilator settings in the control arm of the trial
Implemented the protocol using Lean principles (Womack et al., 1990 - The Machine That Changed the World)- built into clinical workflows - automatic unless modified- clinicians encouraged to vary based on patient need- variances and patient outcomes fed back in a Lean Learning Loop
Managing clinical processesDr. Alan Morris, LDS Hospital, 1991:
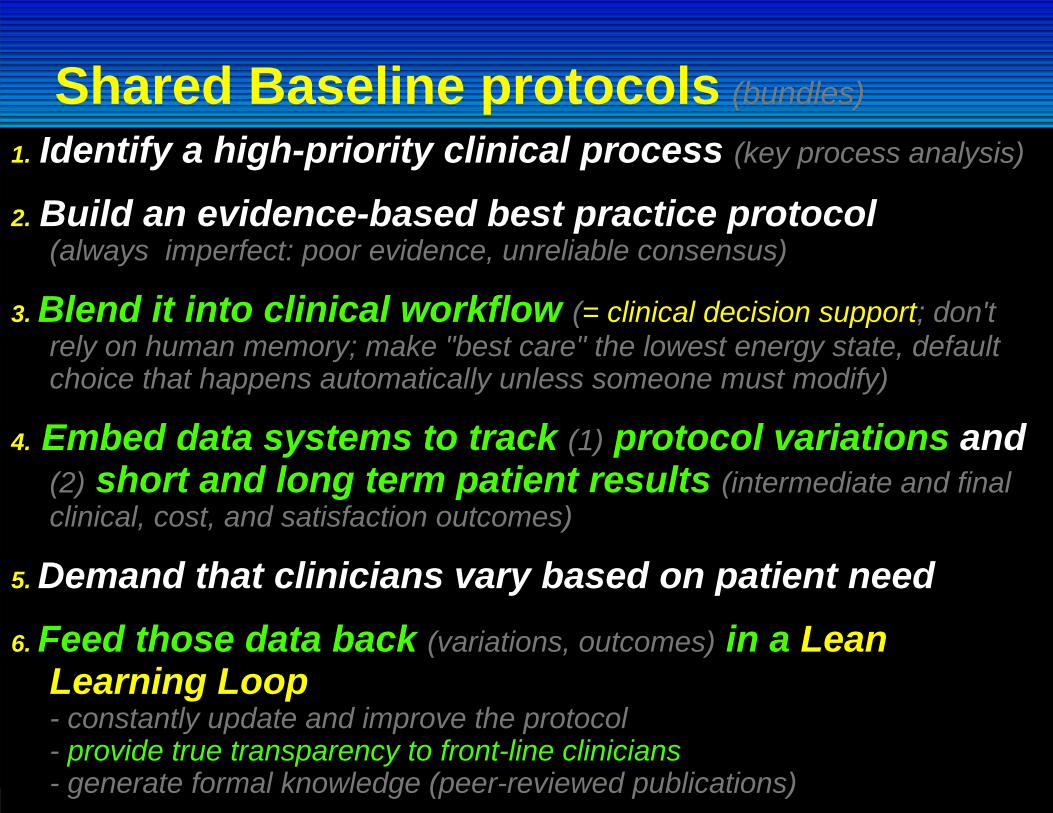
1. Identify a high-priority clinical process (key process analysis)
2. Build an evidence-based best practice protocol(always imperfect: poor evidence, unreliable consensus)
3. Blend it into clinical workflow (= clinical decision support; don't rely on human memory; make "best care" the lowest energy state, default choice that happens automatically unless someone must modify)
4. Embed data systems to track (1) protocol variations and (2) short and long term patient results (intermediate and final clinical, cost, and satisfaction outcomes)
5. Demand that clinicians vary based on patient need6. Feed those data back (variations, outcomes) in a Lean
Learning Loop- constantly update and improve the protocol- provide true transparency to front-line clinicians- generate formal knowledge (peer-reviewed publications)
Shared Baseline protocols (bundles)
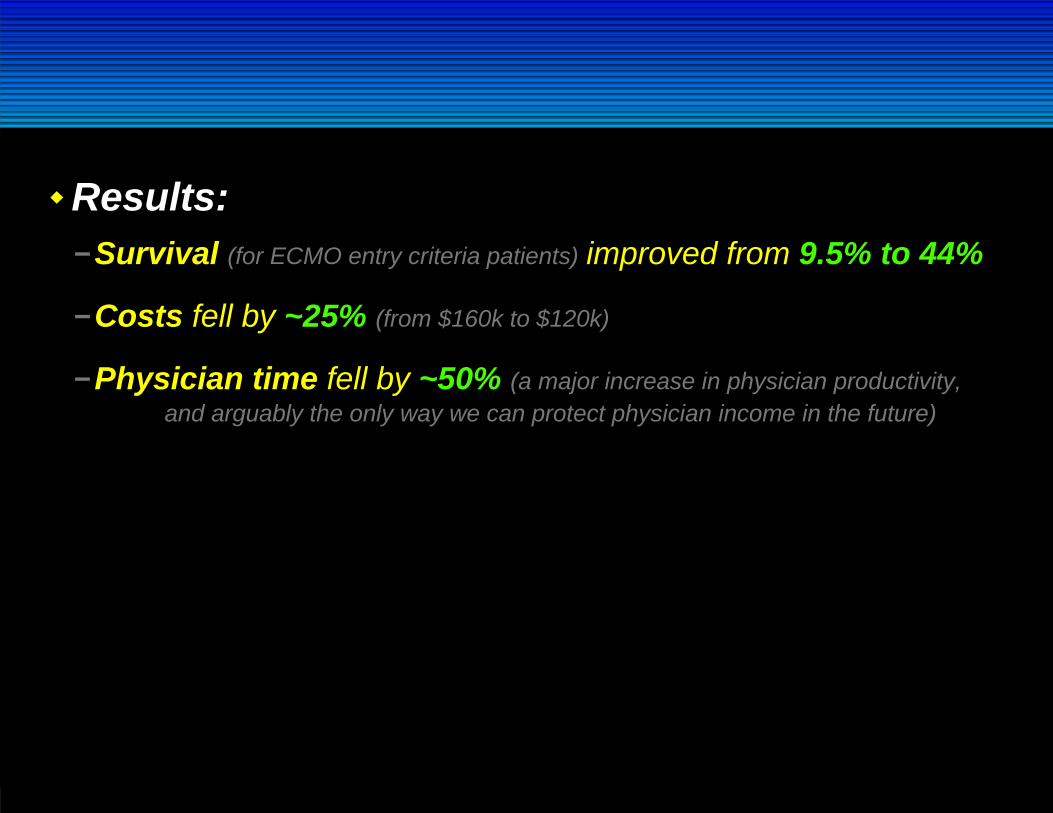
Results:Survival (for ECMO entry criteria patients) improved from 9.5% to 44%
Costs fell by ~25% (from $160k to $120k)
Physician time fell by ~50% (a major increase in physician productivity,and arguably the only way we can protect physician income in the future)
07 Ja
nMar May Ju
lSep Nov
08 Ja
nMar May Ju
lSep Nov
09 Ja
nMar May Ju
lSep Nov
10 Ja
nMar
Month
0
20
40
60
80
100
% c
ompl
ianc
e
0
20
40
60
80
100
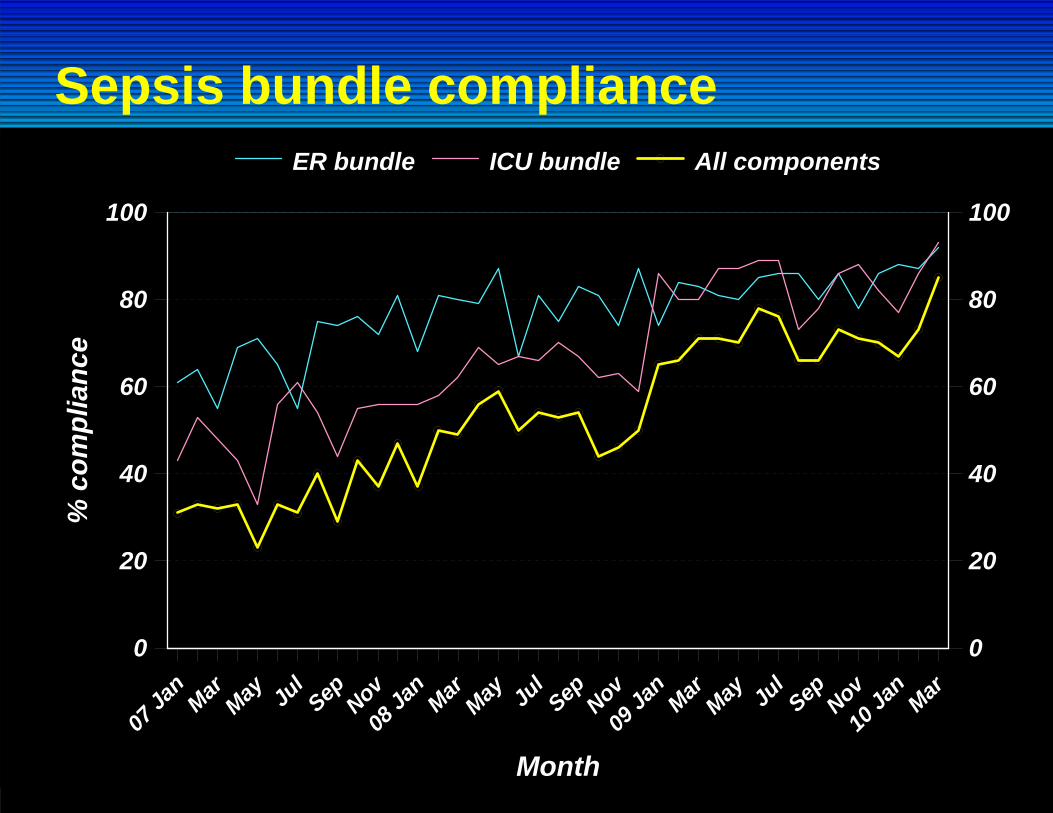
ER bundle ICU bundle All components
Sepsis bundle compliance
04 Ja
nMay Sep
05 Ja
nMay Sep
06 Ja
nMay Sep
07 Ja
nMay Sep
08 Ja
nMay Sep
09 Ja
nMay Sep
10 Ja
n
Month
0
0.1
0.2
0.3
0.4
0.5
Mor
talit
y ra
te
0
0.1
0.2
0.3
0.4
0.5
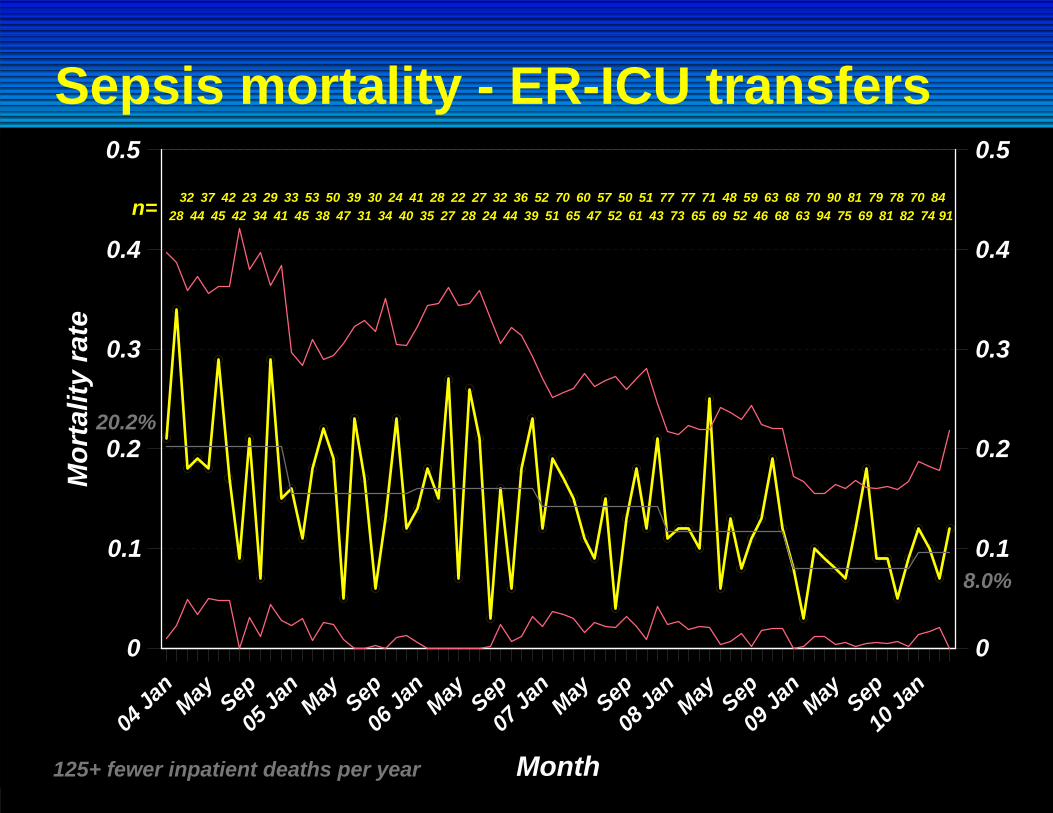
Sepsis mortality - ER-ICU transfers
20.2%
8.0%
125+ fewer inpatient deaths per year
2832
4437
4542
4223
3429
4133
4553
3850
4739
3130
3424
4041
3528
2722
2827
2432
4436
3952
5170
6560
4757
5250
6151
4377
7377
6571
6948
5259
4663
6868
6370
9490
7581
6979
8178
8270
7484
91n=
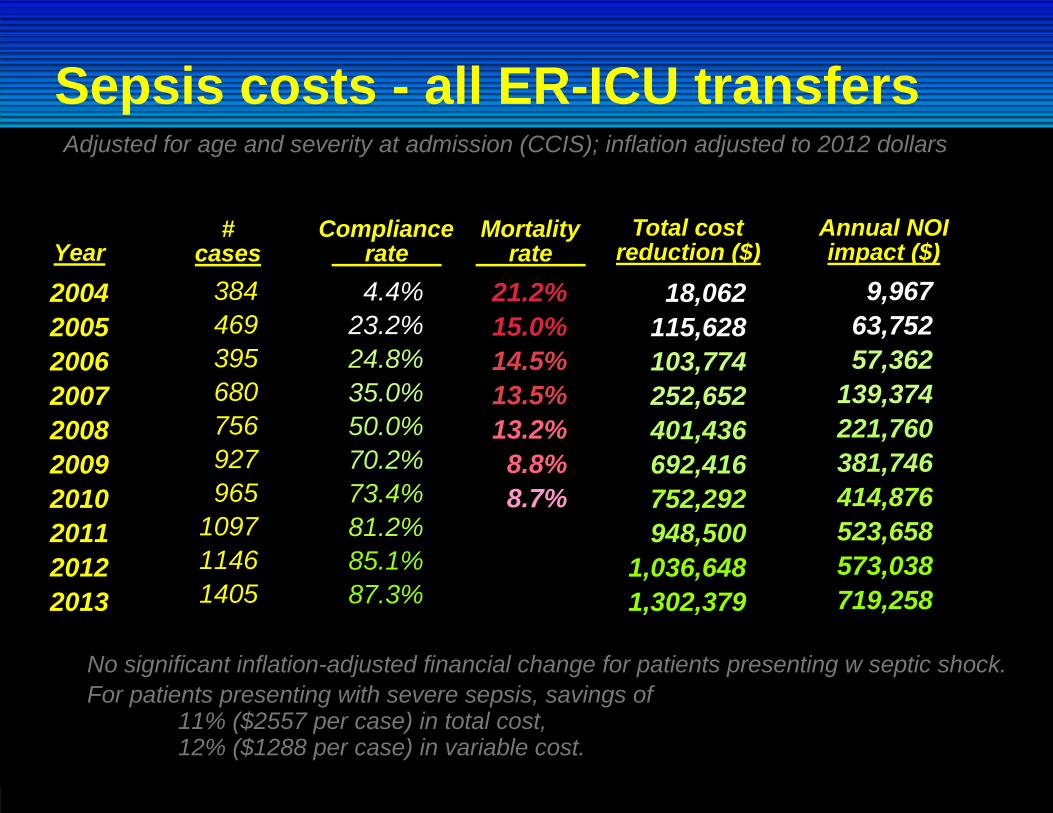
Sepsis costs - all ER-ICU transfers
2004200520062007200820092010201120122013
384469395680756927965
109711461405
4.4%23.2%24.8%35.0%50.0%70.2%73.4%81.2%85.1%87.3%
18,062115,628103,774252,652401,436692,416752,292948,500
1,036,6481,302,379
9,96763,75257,362
139,374221,760381,746414,876523,658573,038719,258
Year#
casesCompliance rate
Total cost reduction ($)
Annual NOI impact ($)
No significant inflation-adjusted financial change for patients presenting w septic shock.For patients presenting with severe sepsis, savings of
11% ($2557 per case) in total cost,12% ($1288 per case) in variable cost.
Adjusted for age and severity at admission (CCIS); inflation adjusted to 2012 dollars
21.2%15.0%14.5%13.5%13.2%8.8%8.7%
Mortality rate

We count our successes in lives ...
Lesson 1
Most often(but not always)
better care is cheaper care ...
Lesson 2
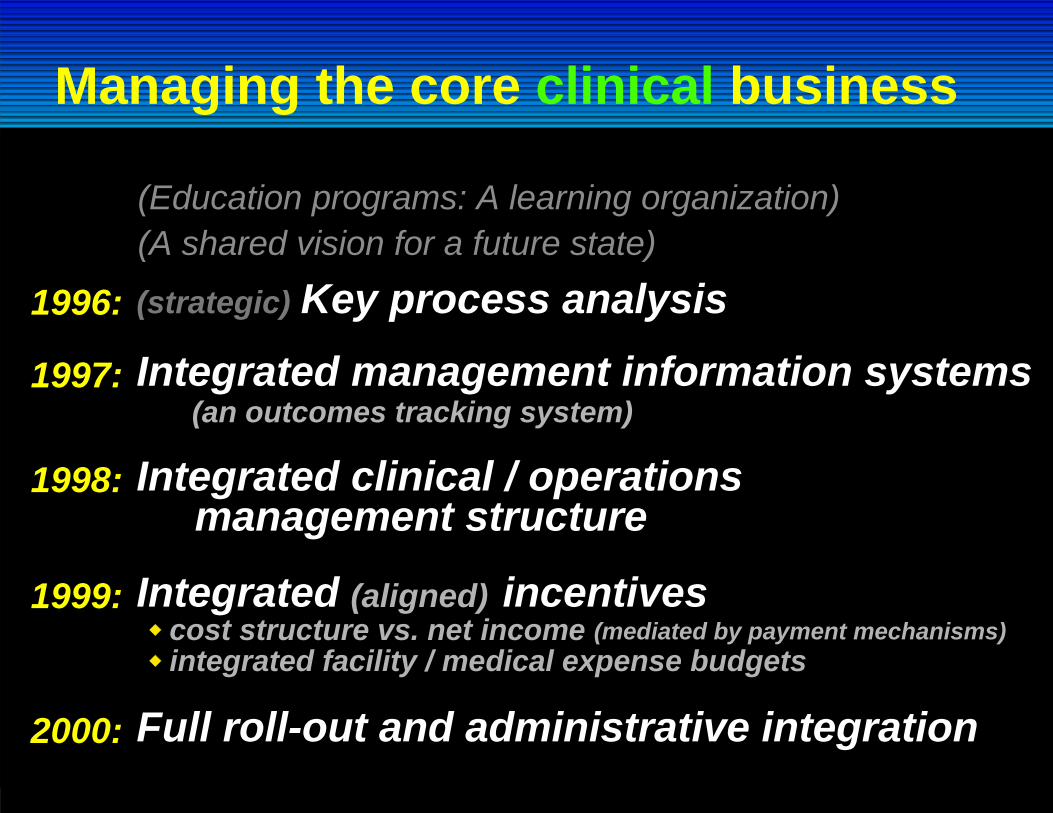
Managing the core clinical business
Integrated clinical / operations management structure
1998:
(an outcomes tracking system)Integrated management information systems1997:
(mediated by payment mechanisms)cost structure vs. net incomeintegrated facility / medical expense budgets
Integrated incentives1999: (aligned)
Full roll-out and administrative integration2000:
(strategic) Key process analysis1996:
(Education programs: A learning organization)(A shared vision for a future state)
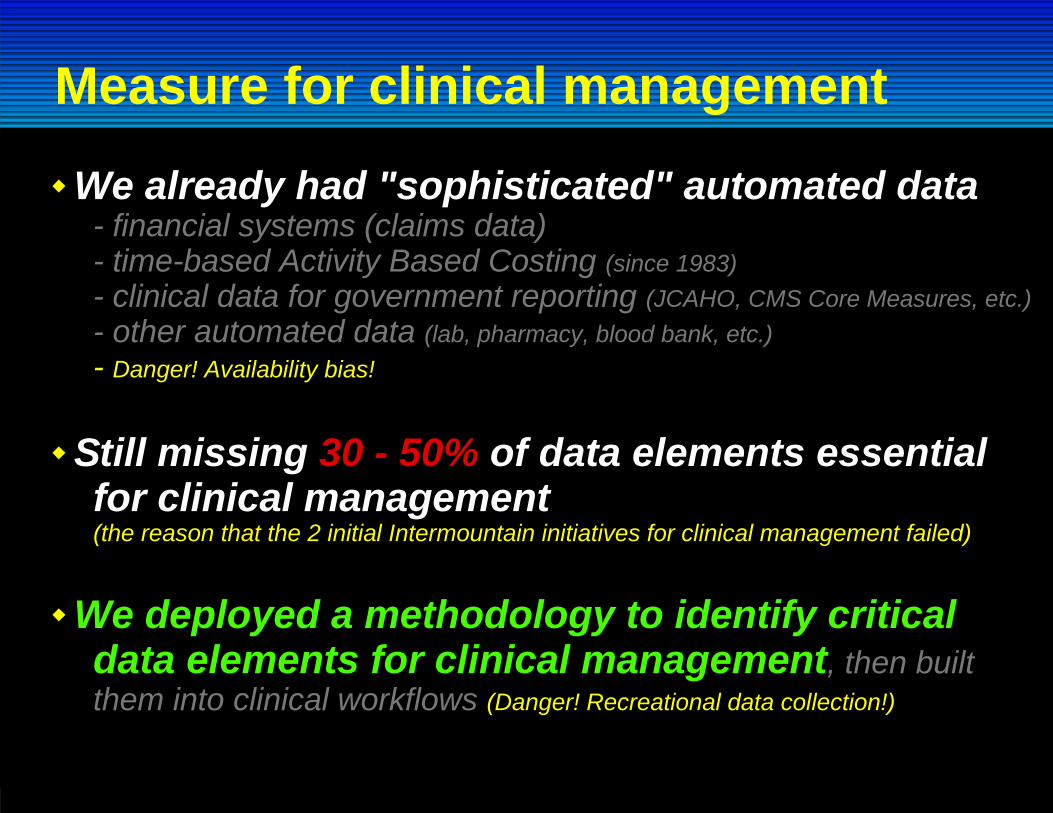
Measure for clinical management
We already had "sophisticated" automated data- financial systems (claims data)- time-based Activity Based Costing (since 1983)- clinical data for government reporting (JCAHO, CMS Core Measures, etc.)- other automated data (lab, pharmacy, blood bank, etc.)- Danger! Availability bias!
Still missing 30 - 50% of data elements essentialfor clinical management(the reason that the 2 initial Intermountain initiatives for clinical management failed)
We deployed a methodology to identify criticaldata elements for clinical management, then builtthem into clinical workflows (Danger! Recreational data collection!)
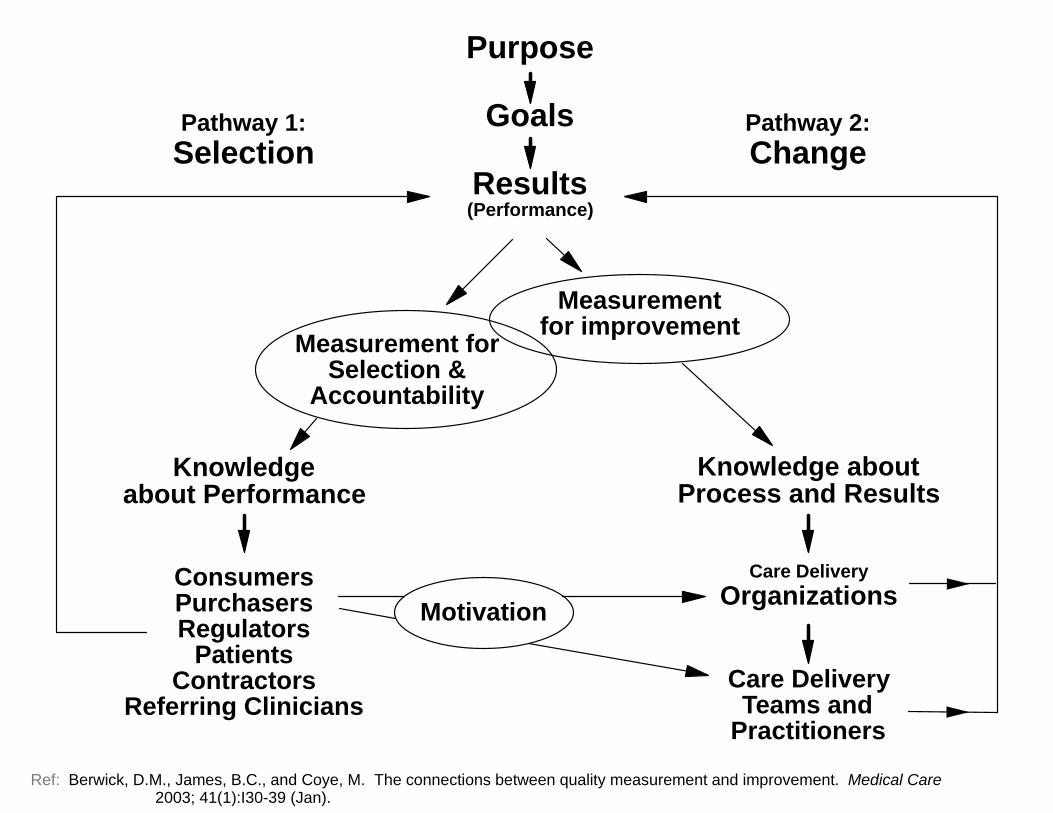
Purpose
Goals
Results(Performance)
Measurementfor improvementMeasurement for
Selection &Accountability
Pathway 1:Selection
Pathway 2:Change
Knowledgeabout Performance
Knowledge aboutProcess and Results
ConsumersPurchasersRegulators
PatientsContractors
Referring Clinicians
Care DeliveryOrganizations
Care DeliveryTeams and
Practitioners
Motivation
Ref: Berwick, D.M., James, B.C., and Coye, M. The connections between quality measurement and improvement. Medical Care 2003; 41(1):I30-39 (Jan).
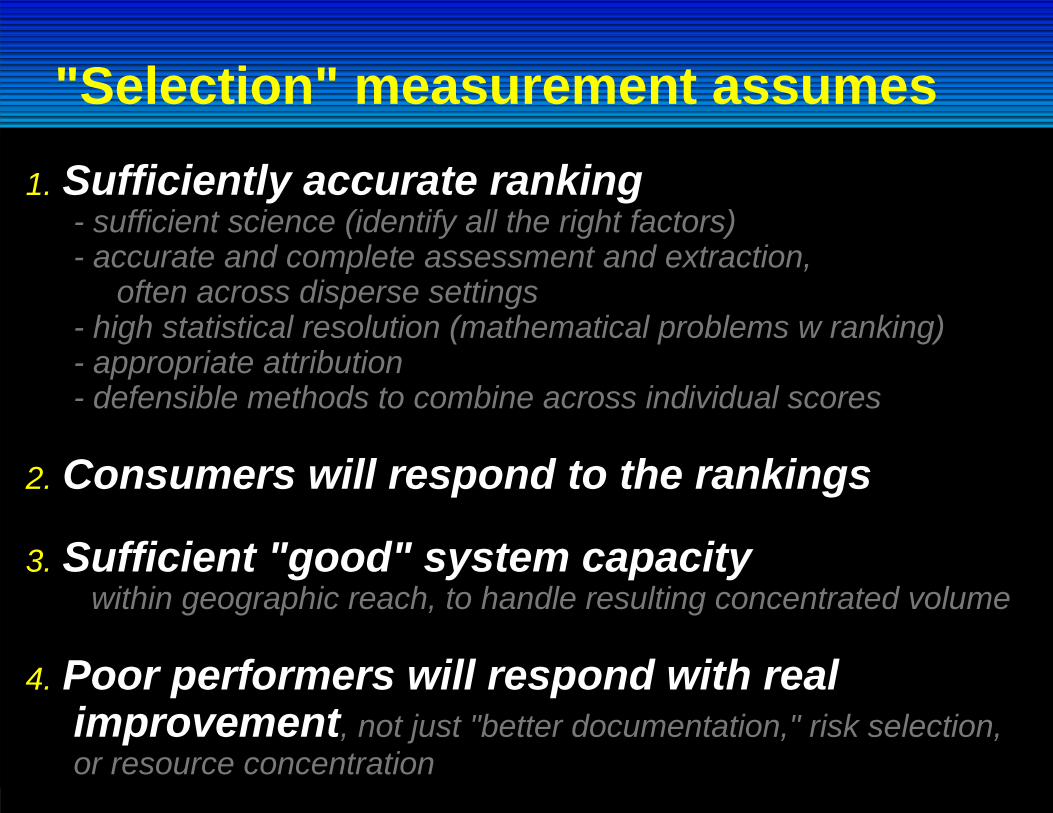
"Selection" measurement assumes1. Sufficiently accurate ranking
- sufficient science (identify all the right factors)- accurate and complete assessment and extraction,
often across disperse settings- high statistical resolution (mathematical problems w ranking)- appropriate attribution- defensible methods to combine across individual scores
2. Consumers will respond to the rankings
3. Sufficient "good" system capacity within geographic reach, to handle resulting concentrated volume
4. Poor performers will respond with real improvement, not just "better documentation," risk selection, or resource concentration
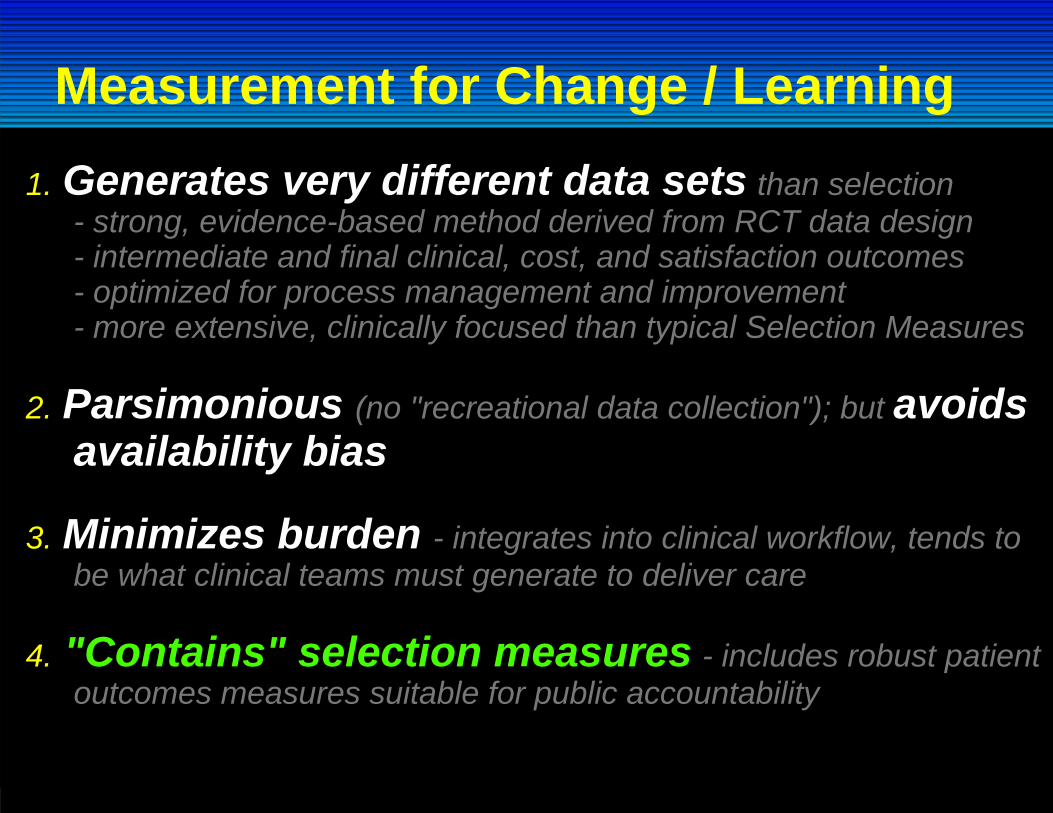
1. Generates very different data sets than selection - strong, evidence-based method derived from RCT data design- intermediate and final clinical, cost, and satisfaction outcomes- optimized for process management and improvement- more extensive, clinically focused than typical Selection Measures
2. Parsimonious (no "recreational data collection"); but avoids availability bias
3. Minimizes burden - integrates into clinical workflow, tends to be what clinical teams must generate to deliver care
4. "Contains" selection measures - includes robust patient outcomes measures suitable for public accountability
Measurement for Change / Learning
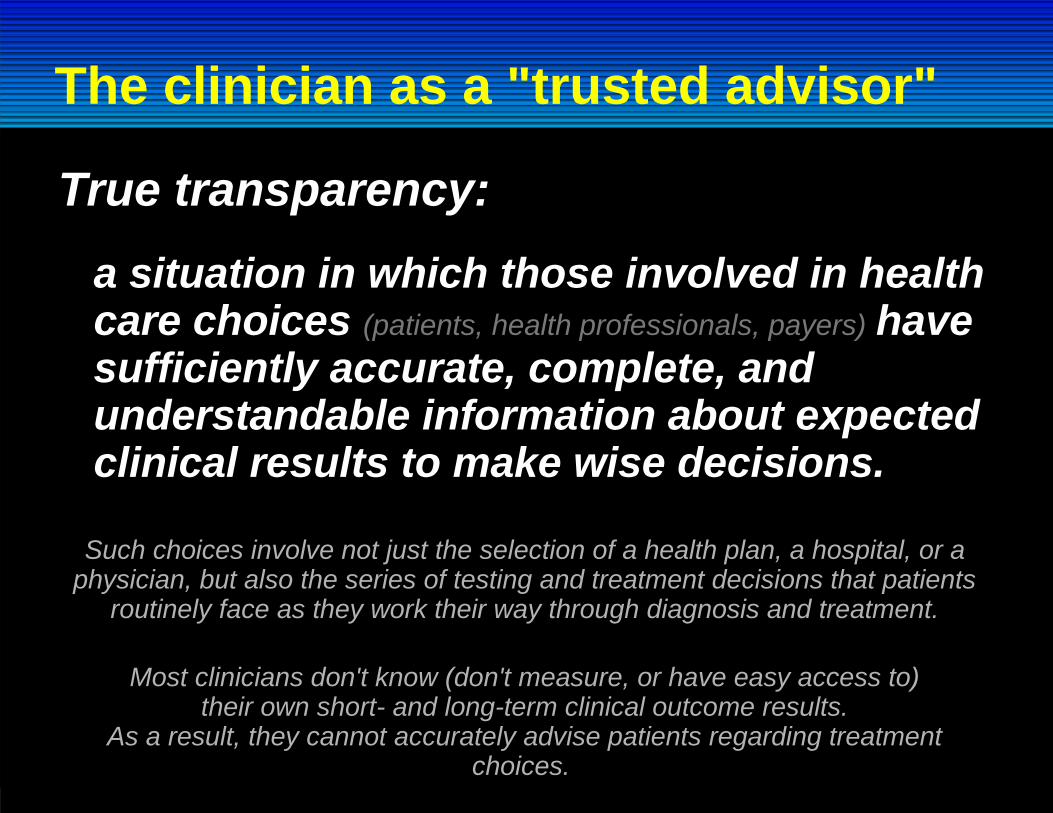
The clinician as a "trusted advisor"
a situation in which those involved in health care choices (patients, health professionals, payers) have sufficiently accurate, complete, and understandable information about expected clinical results to make wise decisions.
Such choices involve not just the selection of a health plan, a hospital, or a physician, but also the series of testing and treatment decisions that patients
routinely face as they work their way through diagnosis and treatment.
Most clinicians don't know (don't measure, or have easy access to)their own short- and long-term clinical outcome results.
As a result, they cannot accurately advise patients regarding treatment choices.
True transparency:
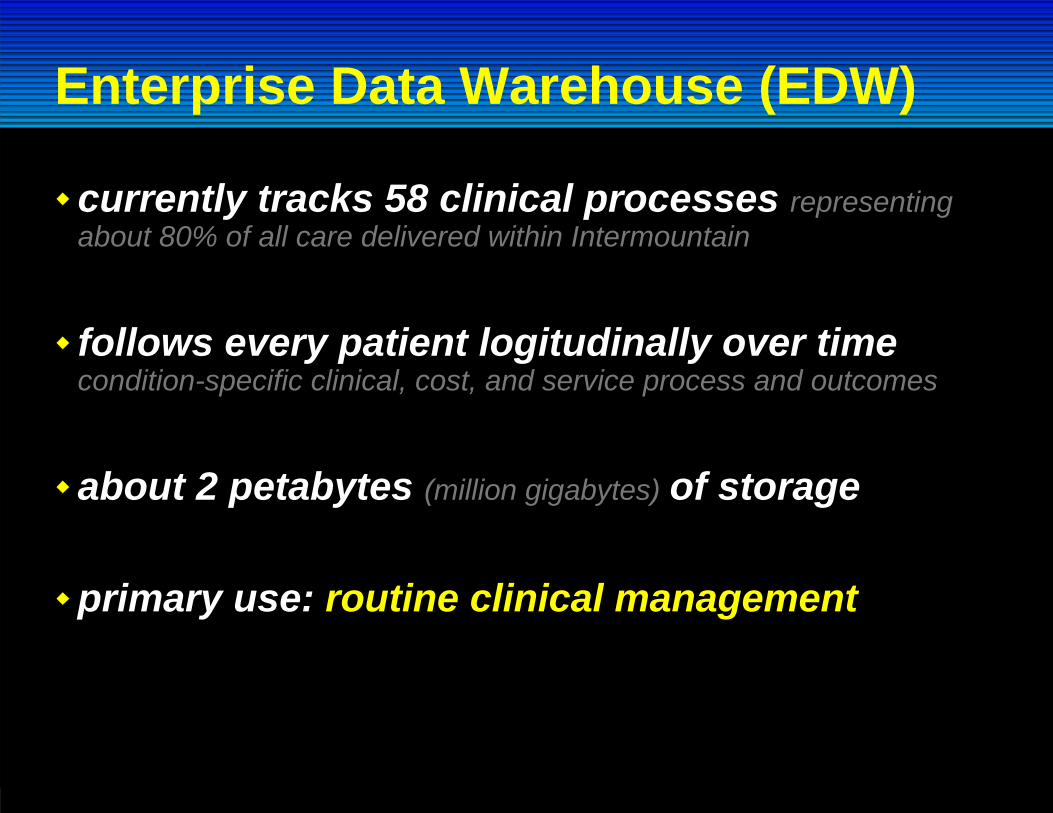
Enterprise Data Warehouse (EDW)
currently tracks 58 clinical processes representing about 80% of all care delivered within Intermountain
follows every patient logitudinally over timecondition-specific clinical, cost, and service process and outcomes
about 2 petabytes (million gigabytes) of storage
primary use: routine clinical management
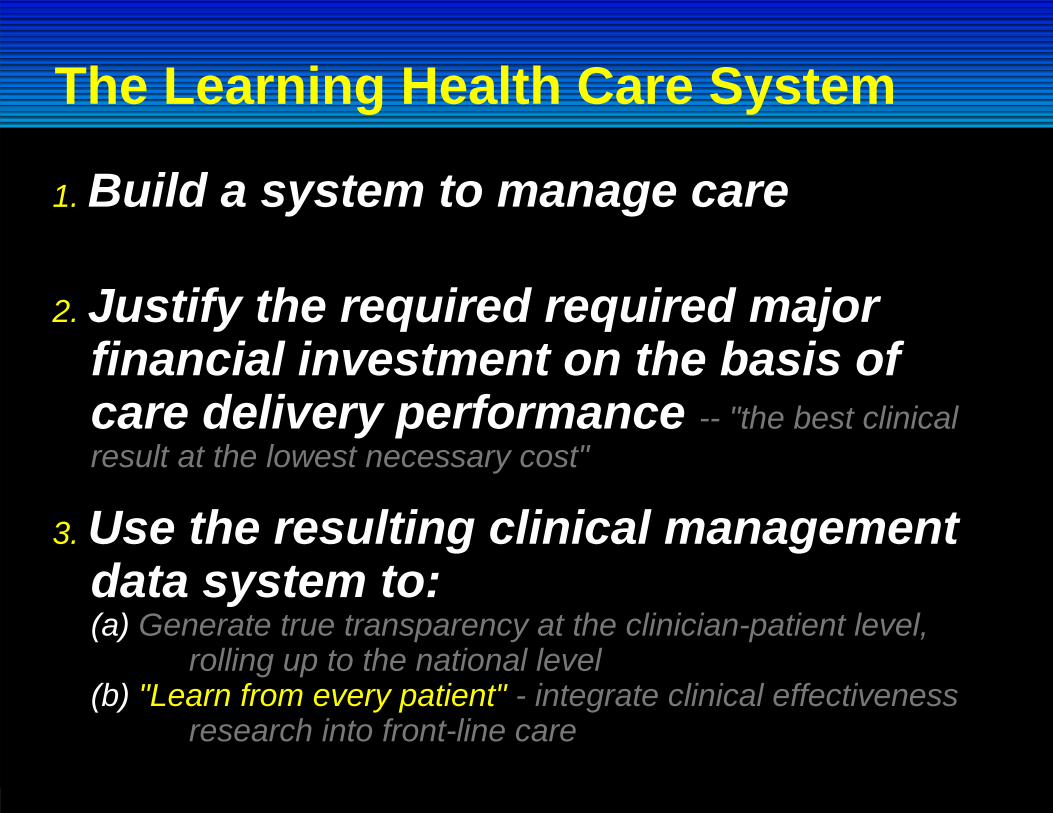
The Learning Health Care System
1. Build a system to manage care
2. Justify the required required major financial investment on the basis of care delivery performance -- "the best clinical result at the lowest necessary cost"
3. Use the resulting clinical management data system to:(a) Generate true transparency at the clinician-patient level,
rolling up to the national level(b) "Learn from every patient" - integrate clinical effectiveness
research into front-line care
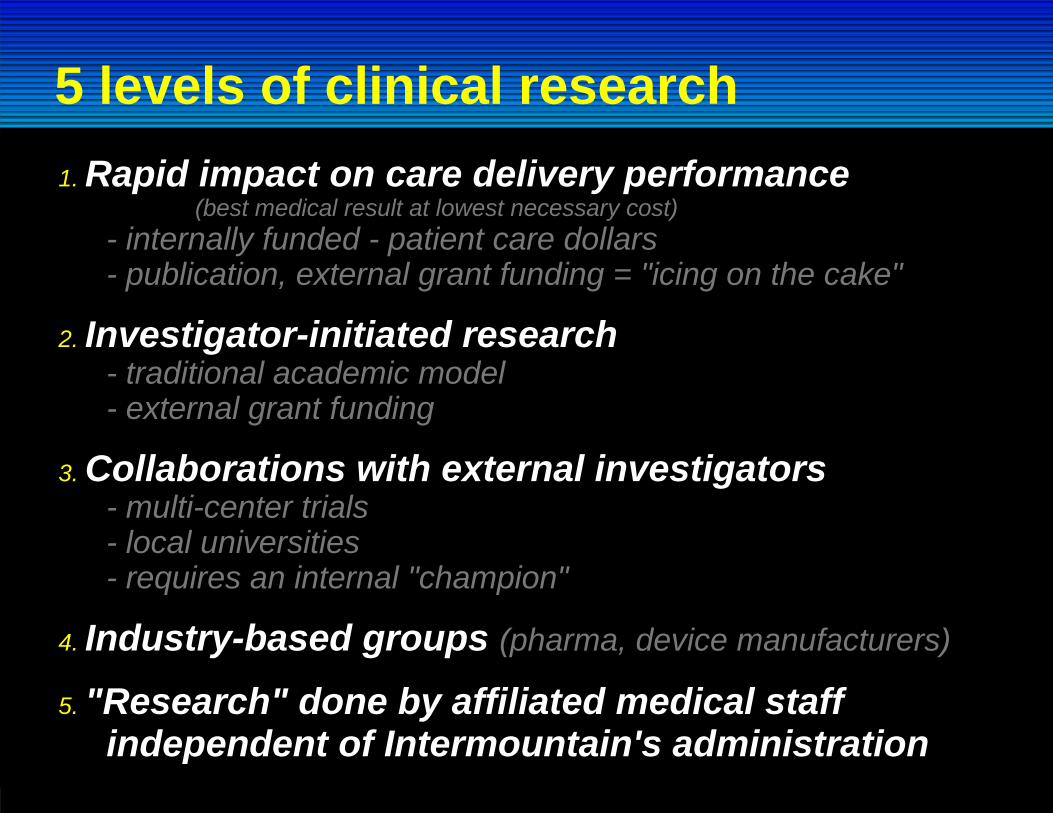
1. Rapid impact on care delivery performance(best medical result at lowest necessary cost)
- internally funded - patient care dollars- publication, external grant funding = "icing on the cake"
2. Investigator-initiated research- traditional academic model- external grant funding
3. Collaborations with external investigators- multi-center trials- local universities- requires an internal "champion"
4. Industry-based groups (pharma, device manufacturers)
5. "Research" done by affiliated medical staff independent of Intermountain's administration
5 levels of clinical research
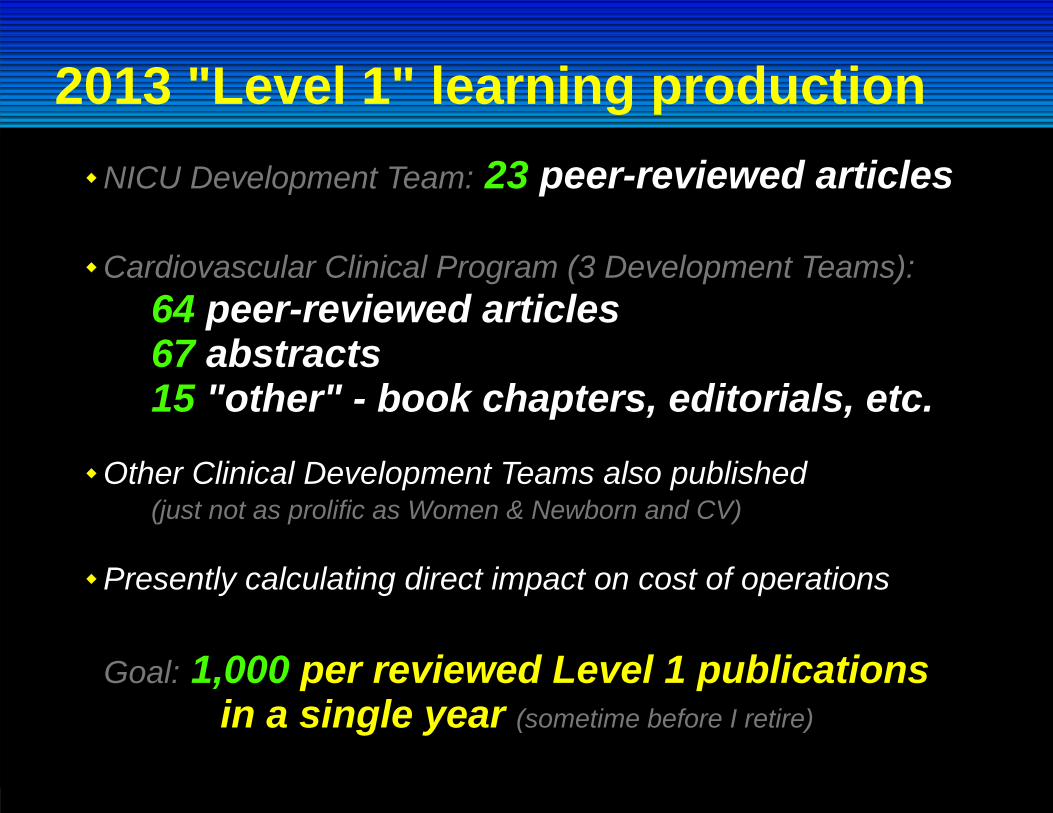
2013 "Level 1" learning productionNICU Development Team: 23 peer-reviewed articles
Cardiovascular Clinical Program (3 Development Teams):64 peer-reviewed articles67 abstracts15 "other" - book chapters, editorials, etc.
Other Clinical Development Teams also published(just not as prolific as Women & Newborn and CV)
Presently calculating direct impact on cost of operations
Goal: 1,000 per reviewed Level 1 publicationsin a single year (sometime before I retire)

Better has no limit ...
an old Yiddish proverb
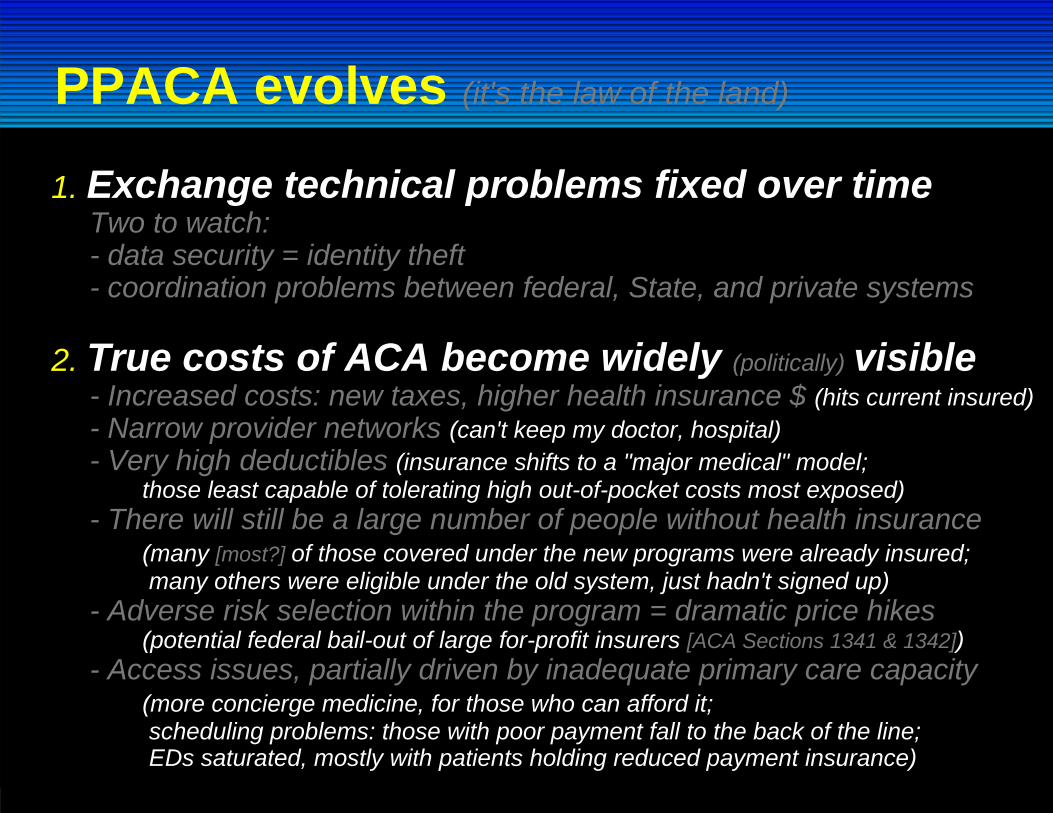
PPACA evolves (it's the law of the land)
1. Exchange technical problems fixed over timeTwo to watch:- data security = identity theft- coordination problems between federal, State, and private systems
2. True costs of ACA become widely (politically) visible- Increased costs: new taxes, higher health insurance $ (hits current insured)- Narrow provider networks (can't keep my doctor, hospital)- Very high deductibles (insurance shifts to a "major medical" model;
those least capable of tolerating high out-of-pocket costs most exposed)- There will still be a large number of people without health insurance
(many [most?] of those covered under the new programs were already insured; many others were eligible under the old system, just hadn't signed up)
- Adverse risk selection within the program = dramatic price hikes(potential federal bail-out of large for-profit insurers [ACA Sections 1341 & 1342])
- Access issues, partially driven by inadequate primary care capacity(more concierge medicine, for those who can afford it; scheduling problems: those with poor payment fall to the back of the line; EDs saturated, mostly with patients holding reduced payment insurance)
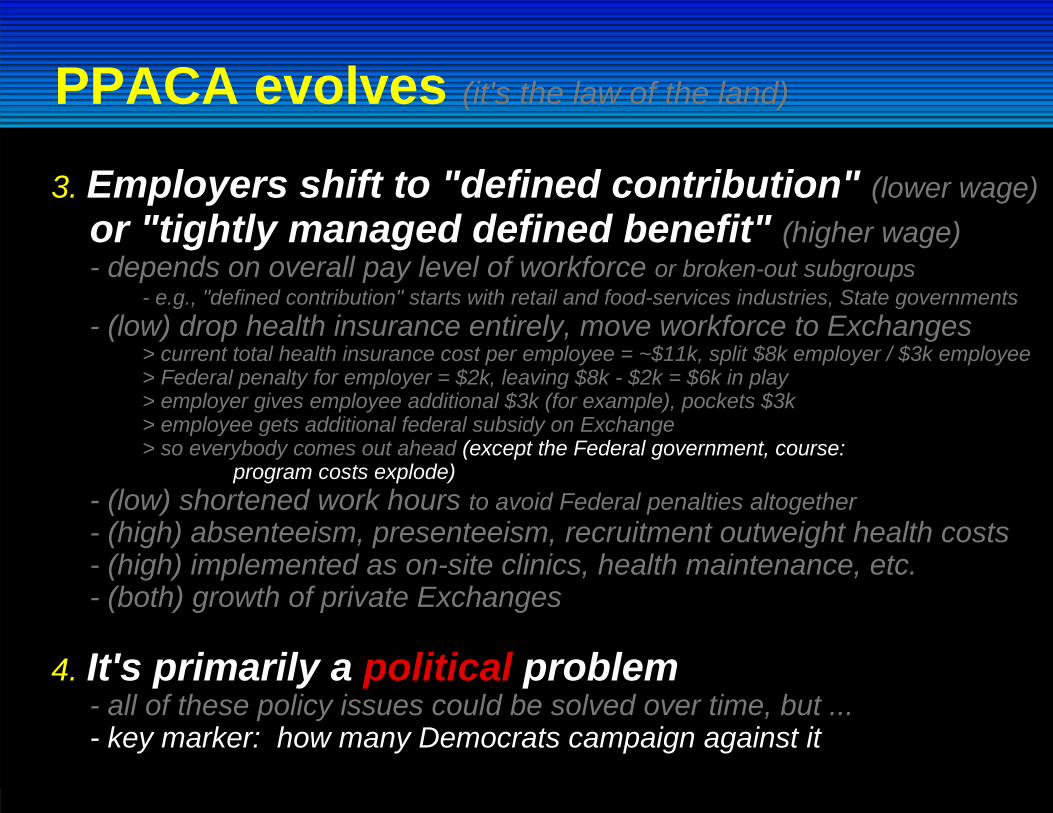
PPACA evolves (it's the law of the land)
3. Employers shift to "defined contribution" (lower wage) or "tightly managed defined benefit" (higher wage)- depends on overall pay level of workforce or broken-out subgroups
- e.g., "defined contribution" starts with retail and food-services industries, State governments- (low) drop health insurance entirely, move workforce to Exchanges
> current total health insurance cost per employee = ~$11k, split $8k employer / $3k employee> Federal penalty for employer = $2k, leaving $8k - $2k = $6k in play> employer gives employee additional $3k (for example), pockets $3k> employee gets additional federal subsidy on Exchange> so everybody comes out ahead (except the Federal government, course:
program costs explode)- (low) shortened work hours to avoid Federal penalties altogether- (high) absenteeism, presenteeism, recruitment outweight health costs- (high) implemented as on-site clinics, health maintenance, etc.- (both) growth of private Exchanges
4. It's primarily a political problem- all of these policy issues could be solved over time, but ...- key marker: how many Democrats campaign against it