Embed Size (px)
Citation preview

Passionate about Progress
AgilityHow we continue to deliver energy
and solutions
ResilienceDeliberate steps taken to
strengthen the foundation for sustainable progress
SustainabilityEnriching lives through
the transformative power of energy
MovingForwardwith You
PETRONAS Financial Report 2020

1
The Directors hereby submit their report and the audited financial statements of the Group and of the Company for the year
ended 31 December 2020.
PRINCIPAL ACTIVITIES
The principal activities of the Company in the course of the financial year remained unchanged and consist of exploitation of oil
and gas, the marketing of petroleum and petroleum products and investment holding. The principal activities of key subsidiaries,
key associates and joint ventures are stated in Note 42, Note 43 and Note 44 to the financial statements respectively. The
principal activities of other subsidiaries are available in the respective subsidiaries’ Directors’ Report or the Company’s registered
office that the Board of Directors (“Board”) deems such information is included in the Company’s Directors’ Report by such
reference and shall form part of the Company’s Directors’ Report.
The Company has been granted a relief order pursuant to Section 255(1) of the Companies Act, 2016 relieving the Company’s
Directors from full compliance to the requirements under Section 253(2) of the Companies Act, 2016.
The Company is wholly-owned by the Government of Malaysia.
SUBSIDIARIES
The details of the Company’s key subsidiaries are disclosed in Note 42 to the financial statements.
RESULTS
In RM Mil Group Company
(Loss)/Profit for the year (21,029) 8,710
(Loss)/Profit attributable to:
Shareholders of the Company (23,851) 8,710
Non-controlling interests 2,822 -
DIVIDENDS
During the financial year, the amount of dividends paid by the Company were as follows:
• a final dividend of RM240,000 per ordinary share amounting to RM24 billion in respect of financial year ended 31
December 2019 in instalments between April and August 2020.
• a dividend of RM100,000 per ordinary share amounting to RM10 billion in respect of financial year ended 31 December
2020 to shareholders in instalments between September and November 2020.
The Directors had on 25 February 2021 declared a dividend of RM180,000 per ordinary share amounting to RM18 billion.
The financial statements for the current financial year do not reflect this declared dividend. The dividend will be accounted for
in equity as an appropriation of retained profits in the financial year ending 31 December 2021.
Further details on dividends are disclosed in Note 29.
Directors’ ReportFor the year ended 31 December 2020
Financial StatementsDirectors‘ Report 1
Statement by Directors 6
Statutory Declaration 7
Consolidated Statement of 8
Financial Position
Consolidated Statement of Profit or Loss 9
and Other Comprehensive Income
Consolidated Statement of Changes 10
in Equity
Consolidated Statement of Cash Flows 14
Statement of Financial Position 16
Statement of Profit or Loss and Other 17
Comprehensive Income
Statement of Changes in Equity 18
Statement of Cash Flows 19
Notes to the Financial Statements 20
Independent Auditors’ Report 157
Appendix I 162
Petroliam Nasional Berhad (PETRONAS)
Financial Report 2020
2 3
RESERVES AND PROVISIONS
There were no material movements to and from reserves and provisions during the year other than as disclosed in the financial
statements.
DIRECTORS
Directors who served during the financial year until the date of this report are:
Tan Sri Ahmad Nizam bin Salleh (Chairman)
Tengku Muhammad Taufik
Ainul Azhar bin Ainul Jamal
Tan Sri Dato’ Seri Mohd Bakke bin Salleh
Zakiah binti Jaafar
Tan Sri Zaharah binti Ibrahim (appointed on 17 August 2020)
Dato Hj Ibrahim bin Hj Baki (appointed on 17 August 2020)
Dato’ Razali bin Mohd Yusof (appointed on 17 August 2020)
Tan Sri Wan Zulkiflee bin Wan Ariffin (resigned on 15 June 2020)
Ahmad Faris bin Rabidin (resigned on 23 August 2020)
The names of Directors of subsidiaries are available at the respective subsidiaries’ Directors’ Report or the Company’s registered
office that the Board deems such information is included in the Company Directors’ Report by such reference and shall form
part of the Company’s Directors’ Report.
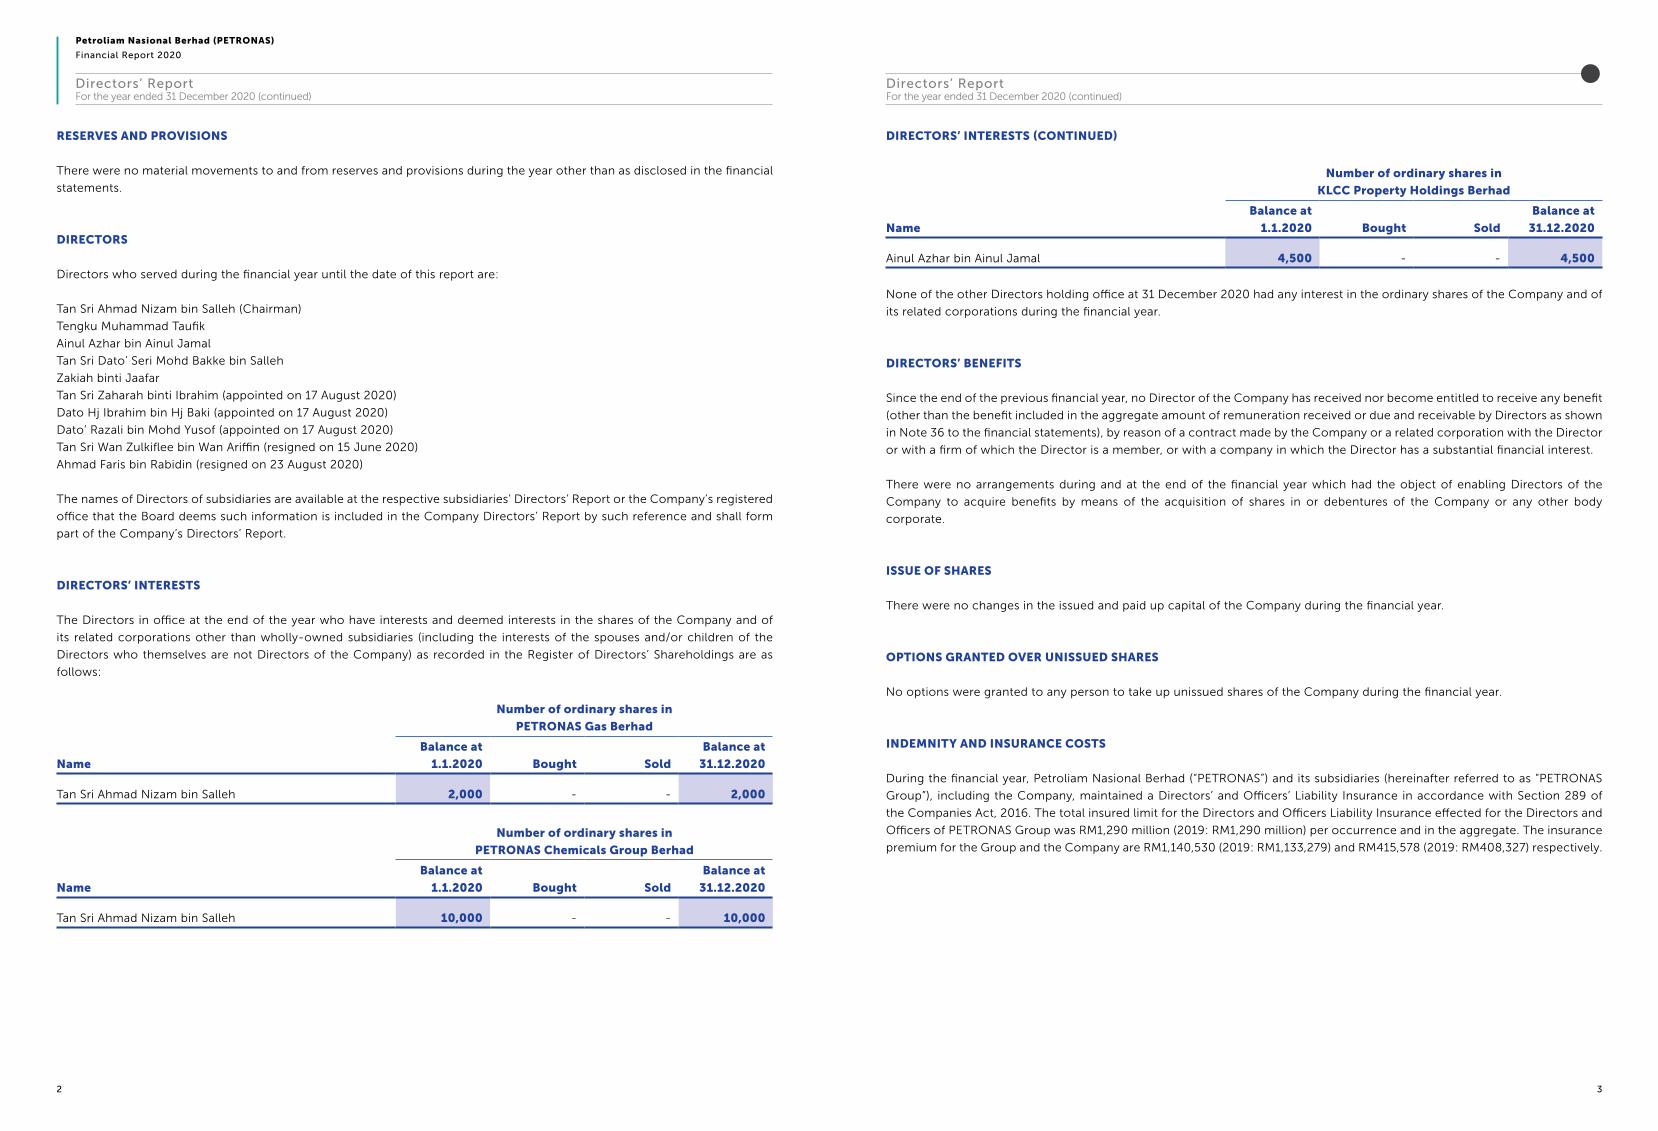
DIRECTORS’ INTERESTS
The Directors in office at the end of the year who have interests and deemed interests in the shares of the Company and of
its related corporations other than wholly-owned subsidiaries (including the interests of the spouses and/or children of the
Directors who themselves are not Directors of the Company) as recorded in the Register of Directors’ Shareholdings are as
follows:
Name
Number of ordinary shares in
PETRONAS Gas Berhad
Balance at
1.1.2020 Bought Sold
Balance at
31.12.2020
Tan Sri Ahmad Nizam bin Salleh 2,000 - - 2,000
Name
Number of ordinary shares in
PETRONAS Chemicals Group Berhad
Balance at
1.1.2020 Bought Sold
Balance at
31.12.2020
Tan Sri Ahmad Nizam bin Salleh 10,000 - - 10,000
DIRECTORS’ INTERESTS (CONTINUED)
Name
Number of ordinary shares in
KLCC Property Holdings Berhad
Balance at
1.1.2020 Bought Sold
Balance at
31.12.2020
Ainul Azhar bin Ainul Jamal 4,500 - - 4,500
None of the other Directors holding office at 31 December 2020 had any interest in the ordinary shares of the Company and of
its related corporations during the financial year.
DIRECTORS’ BENEFITS
Since the end of the previous financial year, no Director of the Company has received nor become entitled to receive any benefit
(other than the benefit included in the aggregate amount of remuneration received or due and receivable by Directors as shown
in Note 36 to the financial statements), by reason of a contract made by the Company or a related corporation with the Director
or with a firm of which the Director is a member, or with a company in which the Director has a substantial financial interest.
There were no arrangements during and at the end of the financial year which had the object of enabling Directors of the
Company to acquire benefits by means of the acquisition of shares in or debentures of the Company or any other body
corporate.
ISSUE OF SHARES
There were no changes in the issued and paid up capital of the Company during the financial year.
OPTIONS GRANTED OVER UNISSUED SHARES
No options were granted to any person to take up unissued shares of the Company during the financial year.
INDEMNITY AND INSURANCE COSTS
During the financial year, Petroliam Nasional Berhad (“PETRONAS”) and its subsidiaries (hereinafter referred to as “PETRONAS
Group”), including the Company, maintained a Directors’ and Officers’ Liability Insurance in accordance with Section 289 of
the Companies Act, 2016. The total insured limit for the Directors and Officers Liability Insurance effected for the Directors and
Officers of PETRONAS Group was RM1,290 million (2019: RM1,290 million) per occurrence and in the aggregate. The insurance
premium for the Group and the Company are RM1,140,530 (2019: RM1,133,279) and RM415,578 (2019: RM408,327) respectively.
Directors’ ReportFor the year ended 31 December 2020 (continued)
Directors’ ReportFor the year ended 31 December 2020 (continued)

Petroliam Nasional Berhad (PETRONAS)
Financial Report 2020
4 5
OTHER STATUTORY INFORMATION
Before the financial statements of the Group and of the Company were made out, the Directors took reasonable steps to
ascertain that:
(i) the necessary actions had been taken in relation to the writing off of bad debts and the provisioning of doubtful debts
and satisfied themselves that all known bad debts have been written off and adequate provision made for doubtful debts;
and
(ii) any current assets which were unlikely to be realised in the ordinary course of business, their values as shown in the
accounting records of the Group and of the Company, had been written down to an amount which they might be
expected so to realise.
At the date of this report, the Directors are not aware of any circumstances:
(i) that would render the amount written off for bad debts, or the amount of the provision for doubtful debts, in the Group
and in the Company inadequate to any substantial extent, or
(ii) that would render the value attributed to the current assets in the financial statements of the Group and of the Company
misleading, or
(iii) which have arisen which render adherence to the existing method of valuation of assets or liabilities of the Group and of
the Company misleading or inappropriate, or
(iv) not otherwise dealt with in this report or the financial statements, that would render any amount stated in the financial
statements of the Group and of the Company misleading.
At the date of this report, there does not exist:
(i) any charge on the assets of the Group or of the Company that has arisen since the end of the financial year and which
secures the liabilities of any other person, or
(ii) any material contingent liability in respect of the Group or of the Company that has arisen since the end of the financial
year.
No material contingent liability or other liability, other than as disclosed in financial statements, of any company in the Group
has become enforceable, or is likely to become enforceable within the period of twelve months after the end of the financial
year which, in the opinion of the Directors, will or may substantially affect the ability of the Group and of the Company to meet
their obligations as and when they fall due.
In the opinion of the Directors, the financial performance of the Group and of the Company for the financial year ended 31
December 2020 have not been substantially affected by any item, transaction or event of a material and unusual nature other
than those that have been disclosed in the financial statements, nor has any such item, transaction or event occurred in the
interval between the end of that financial year and the date of this report.
In respect of the Directors or past Directors of the Company:
(i) the amount of fees and other benefits paid to or receivable by them from the Company or its subsidiary companies as
remuneration for their services to the Company or its subsidiary companies; and
(ii) the estimated money value of any other benefits received or receivable by them otherwise than in cash from the Company
or from any of its subsidiaries
are disclosed in Note 36.
OTHER STATUTORY INFORMATION (CONTINUED)
There are no amounts paid to or receivable by any third party in respect of the services provided to the Company or any of its
subsidiary companies by any Director or past Director of the Company.
AUDITORS
The auditors, KPMG PLT, have indicated their willingness to accept re-appointment.
The auditors’ remuneration is disclosed in Note 26 to the financial statements.
Signed on behalf of the Board of Directors
in accordance with a resolution of the Directors:
Tan Sri Ahmad Nizam bin Salleh
Chairman
Tengku Muhammad Taufik
Director
Kuala Lumpur,
Date: 25 February 2021
Directors’ ReportFor the year ended 31 December 2020 (continued)
Directors’ ReportFor the year ended 31 December 2020 (continued)

Petroliam Nasional Berhad (PETRONAS)
Financial Report 2020
6 7
In the opinion of the Directors, the financial statements set out on pages 8 to 156, are drawn up in accordance with Malaysian
Financial Reporting Standards, International Financial Reporting Standards and the requirements of the Companies Act, 2016 in
Malaysia so as to give a true and fair view of the financial position of the Group and of the Company as of 31 December 2020
and of their financial performance and cash flows for the financial year then ended on that date.
Signed on behalf of the Board of Directors
in accordance with a resolution of the Directors:
Tan Sri Ahmad Nizam bin Salleh
Chairman
Tengku Muhammad Taufik
Director
Kuala Lumpur
Date: 25 February 2021
I, Liza binti Mustapha, the officer primarily responsible for the financial management of PETROLIAM NASIONAL BERHAD
(PETRONAS), do solemnly and sincerely declare that the financial statements set out on pages 8 to 156 are, to the best of my
knowledge and belief, correct and I make this solemn declaration conscientiously believing the same to be true, and by virtue
of provisions of the Statutory Declarations Act, 1960.
Subscribed and solemnly declared by the abovenamed
Liza binti Mustapha
MIA Membership Number: 47410
at Kuala Lumpur in Wilayah Persekutuan
on 25 February 2021
BEFORE ME,
Statement by Directors Statutory Declaration

Petroliam Nasional Berhad (PETRONAS)
Financial Report 2020
8 9
In RM Mil Note 2020 2019
ASSETS
Property, plant and equipment 3 291,717 319,204
Investment properties 4 10,468 8,714
Land held for development 5 2,986 2,994
Investments in associates 7 5,755 6,746
Investments in joint ventures 8 6,844 9,156
Intangible assets 9 20,044 26,260
Long-term receivables 10 21,232 20,383
Fund and other investments 11 1,009 1,929
Deferred tax assets 13 20,622 20,573
TOTAL NON-CURRENT ASSETS 380,677 415,959
Trade and other inventories 14 12,491 14,447
Trade and other receivables 15 40,583 41,285
Assets classified as held for sale 16 18 398
Fund and other investments 11 9,779 8,710
Cash and cash equivalents 17 130,523 141,622
TOTAL CURRENT ASSETS 193,394 206,462
TOTAL ASSETS 574,071 622,421
EQUITY
Share capital 18 100 100
Reserves 19 330,521 388,996
Total equity attributable to shareholders of the Company 330,621 389,096
Non-controlling interests 20 50,413 49,819
TOTAL EQUITY 381,034 438,915
LIABILITIES
Borrowings 21 76,808 53,422
Deferred tax liabilities 13 8,455 12,598
Other long-term liabilities and provisions 23 51,056 44,486
TOTAL NON-CURRENT LIABILITIES 136,319 110,506
Trade and other payables 24 43,728 53,968
Borrowings 21 11,421 15,316
Taxation 1,569 3,716
TOTAL CURRENT LIABILITIES 56,718 73,000
TOTAL LIABILITIES 193,037 183,506
TOTAL EQUITY AND LIABILITIES 574,071 622,421
The notes set out on pages 20 to 156 are an integral part of these financial statements.
In RM Mil Note 2020 2019
Revenue 25 178,741 240,263
Cost of revenue (134,958) (155,926)
Gross profit 43,783 84,337
Selling and distribution expenses (8,174) (7,536)
Administration expenses (9,675) (12,862)
Net impairment losses/write-off1 (32,681) (7,151)
Other expenses (5,871) (2,261)
Other income 4,102 5,158
Operating (loss)/profit 26 (8,516) 59,685
Financing costs 27 (4,133) (3,734)
Share of profit after tax and non-controlling interests of equity accounted associates and joint ventures 328 1,019
(Loss)/Profit before taxation (12,321) 56,970
Tax expense 28 (8,708) (16,498)
(Loss)/Profit for the year (21,029) 40,472
Other comprehensive (loss)/income
Items that will not be reclassified subsequently to profit or loss
Net changes in fair value of equity investments at fair value through other comprehensive income (“OCI”) 13 (3)
Items that may be reclassified subsequently to profit or loss
Net movements from exchange differences (452) (1,286)
Others (1,419) (62)
Total other comprehensive loss for the year, net of tax (1,858) (1,351)
TOTAL COMPREHENSIVE (LOSS)/INCOME FOR THE YEAR (22,887) 39,121
(Loss)/Profit attributable to:
Shareholders of the Company (23,851) 33,021
Non-controlling interests 2,822 7,451
(LOSS)/PROFIT FOR THE YEAR (21,029) 40,472
Total comprehensive (loss)/income attributable to:
Shareholders of the Company (25,019) 32,005
Non-controlling interests 2,132 7,116
TOTAL COMPREHENSIVE (LOSS)/INCOME FOR THE YEAR (22,887) 39,121
1 Includes certain amount relating to loss on remeasurement of finance lease receivables.
The notes set out on pages 20 to 156 are an integral part of these financial statements.
Consolidated Statement of Profit or Loss and Other Comprehensive IncomeFor the year ended 31 December 2020
Consolidated Statement of Financial PositionAs at 31 December 2020

Petroliam Nasional Berhad (PETRONAS)
Financial Report 2020
10 11
In RM Mil Note
Attributable to shareholders of the Company
Non-distributable
Share
Capital
Capital
and Other
Reserves
Foreign
Currency
Translation
Reserve
Fair Value
through OCI
Reserve
Balance at 1 January 2020 100 14,509 30,014 (78)
Net movements from exchange differences - - 184 -
Net changes of equity investments at fair value through OCI:
- Changes in fair value - - - 13
Other comprehensive loss - (1,365) - -
Total other comprehensive (loss)/ income for the year, net of tax - (1,365) 184 13
(Loss)/Profit for the year - - - -
Total comprehensive (loss)/income for the year - (1,365) 184 13
Changes in ownership interest in subsidiaries - - 359 -
Acquisition of a subsidiary - - - -
Redemption of redeemable preference shares in subsidiaries - 1,320 - -
Dividends 29 - - - -
Total transactions with owners of the Group - 1,320 359 -
Balance at 31 December 2020 100 14,464 30,557 (65)
continue to next page
In RM Mil Note
Attributable to shareholders of the Company
Distributable
General
Reserve
Retained
Profits Total
Non-
controlling
Interests
Total
Equity
Balance at 1 January 2020 12,000 332,551 389,096 49,819 438,915
Net movements from exchange differences - - 184 (636) (452)
Net changes of equity investments at fair value through OCI:
- Changes in fair value - - 13 - 13
Other comprehensive loss - - (1,365) (54) (1,419)
Total other comprehensive (loss)/income for the year, net of tax - - (1,168) (690) (1,858)
(Loss)/Profit for the year - (23,851) (23,851) 2,822 (21,029)
Total comprehensive (loss)/
income for the year - (23,851) (25,019) 2,132 (22,887)
Changes in ownership interest in subsidiaries - 185 544 2,533 3,077
Acquisition of a subsidiary - - - 632 632
Redemption of redeemable preference shares in subsidiaries - (1,320) - - -
Dividends 29 - (34,000) (34,000) (4,703) (38,703)
Total transactions with owners of
the Group - (35,135) (33,456) (1,538) (34,994)
Balance at 31 December 2020 12,000 273,565 330,621 50,413 381,034
continued from previous page
The notes set out on pages 20 to 156 are an integral part of these financial statements. The notes set out on pages 20 to 156 are an integral part of these financial statements.
Consolidated Statement of Changes in EquityFor the year ended 31 December 2020
Consolidated Statement of Changes in EquityFor the year ended 31 December 2020 (continued)

Petroliam Nasional Berhad (PETRONAS)
Financial Report 2020
12 13
In RM Mil Note
Attributable to shareholders of the Company
Non-distributable
Share
Capital
Capital
and Other
Reserves
Foreign
Currency
Translation
Reserve
Fair Value
through OCI
Reserve
Balance at 1 January 2019 100 14,191 31,245 (75)
Net movements from exchange differences - (5) (854) -
Net changes of equity investments at fair value through OCI:
- Changes in fair value - - - (3)
Other comprehensive (loss)/income - (154) - -
Total other comprehensive loss for the year, net of tax - (159) (854) (3)
Profit for the year - - - -
Total comprehensive (loss)/income for the year - (159) (854) (3)
Changes in ownership interest in subsidiaries - - (117) -
Disposal of Subsidiaries - - (260) -
Redemption of redeemable preference shares in subsidiaries - 477 - -
Dividend 29 - - - -
Total transactions with owners of the Group - 477 (377) -
Balance at 31 December 2019 100 14,509 30,014 (78)
continue to next page
In RM Mil Note
Attributable to shareholders of the Company
Distributable
General
Reserve
Retained
Profits Total
Non-
controlling
Interests
Total
Equity
Balance at 1 January 2019 12,000 321,468 378,929 44,609 423,538
Net movements from exchange differences - - (859) (427) (1,286)
Net changes of equity investments at fair value through OCI:
- Changes in fair value - - (3) - (3)
Other comprehensive (loss)/income - - (154) 92 (62)
Total other comprehensive loss for the year, net of tax - - (1,016) (335) (1,351)
Profit for the year - 33,021 33,021 7,451 40,472
Total comprehensive (loss)/
income for the year - 33,021 32,005 7,116 39,121
Changes in ownership interest in subsidiaries - 2,539 2,422 3,805 6,227
Disposal of Subsidiaries - - (260) - (260)
Redemption of redeemable preference shares in subsidiaries - (477) - (73) (73)
Dividend 29 - (24,000) (24,000) (5,638) (29,638)
Total transactions with owners of
the Group - (21,938) (21,838) (1,906) (23,744)
Balance at 31 December 2019 12,000 332,551 389,096 49,819 438,915
continued from previous page
The notes set out on pages 20 to 156 are an integral part of these financial statements. The notes set out on pages 20 to 156 are an integral part of these financial statements.
Consolidated Statement of Changes in EquityFor the year ended 31 December 2020 (continued)
Consolidated Statement of Changes in EquityFor the year ended 31 December 2020 (continued)

Petroliam Nasional Berhad (PETRONAS)
Financial Report 2020
14 15
In RM Mil Note 2020 2019
CASH FLOWS FROM OPERATING ACTIVITIES
(Loss)/Profit before taxation (12,321) 56,970
Adjustments for:
Depreciation of property, plant and equipment and investment properties 34,580 35,900
Amortisation of intangible assets and contract costs 1,446 2,778
Net change in contract liabilities (481) (422)
Net impairment losses/(write-back) on:
- Property, plant and equipment and investment properties 25,714 6,539
- Intangible assets 5,648 204
- Loan and advances to joint ventures 71 62
- Receivables (37) 69
- Investment in an associate 151 230
- Other investments - 251
Gain on bargain purchase (247) -
Net impairment/write-off on well costs 2,246 1,248
Net inventories written down to net realisable value/written off 37 35
Write-off of trade receivables and loss on remeasurement of finance lease receivables 846 -
Share of profit after tax and non-controlling interests of equity accounted associates and joint ventures (328) (1,019)
Property, plant and equipment written off 234 136
Net gain on disposal of investments in subsidiaries, a joint venture, other investments and property, plant and equipment (388) (393)
Bad debts written off 65 18
Intangible assets written off 20 -
Net loss on derivatives 275 64
Unrealised (gain)/loss on foreign exchange (6) 392
Interest income (4,838) (6,889)
Financing costs 4,133 3,734
Net change in provisions 769 (1,395)
Other non-cash items (70) -
Operating profit before changes in working capital 57,519 98,512
continue to next page
In RM Mil Note 2020 2019
CASH FLOWS FROM OPERATING ACTIVITIES (CONTINUED)
Operating profit before changes in working capital (continued) 57,519 98,512
Change in trade and other receivables 2,732 9,230
Change in trade inventories 1,956 57
Change in trade and other payables (8,885) (902)
Cash generated from operations 53,322 106,897
Interest income from fund and other investments 4,838 6,889
Interest expenses paid (2,689) (2,990)
Taxation paid, net of refund (14,726) (20,025)
Net cash generated from operating activities 40,745 90,771
CASH FLOWS FROM INVESTING ACTIVITIES
Net cash used in investing activities 30 (32,914) (52,177)
CASH FLOWS FROM FINANCING ACTIVITIES
Net cash used in financing activities 31 (17,467) (69,880)
NET DECREASE IN CASH AND CASH EQUIVALENTS (9,636) (31,286)
INCREASE IN CASH AND CASH EQUIVALENTS RESTRICTED (298) (699)
NET FOREIGN EXCHANGE DIFFERENCES (1,752) (622)
CASH AND CASH EQUIVALENTS AT BEGINNING OF THE YEAR 139,851 172,458
CASH AND CASH EQUIVALENTS AT END OF THE YEAR 128,165 139,851
CASH AND CASH EQUIVALENTS
Cash and bank balances and deposits 17 130,523 141,622
Bank overdrafts 21 (698) (409)
129,825 141,213
Less: Cash and cash equivalents restricted 17 (1,660) (1,362)
128,165 139,851
continue to next page
The notes set out on pages 20 to 156 are an integral part of these financial statements. The notes set out on pages 20 to 156 are an integral part of these financial statements.
Consolidated Statement of Cash FlowsFor the year ended 31 December 2020
Consolidated Statement of Cash FlowsFor the year ended 31 December 2020 (continued)

Petroliam Nasional Berhad (PETRONAS)
Financial Report 2020
16 17
In RM Mil Note 2020 2019
ASSETS
Property, plant and equipment 3 19,400 17,756
Investments in subsidiaries 6 155,496 153,229
Investments in associates 7 302 302
Investments in joint ventures 8 843 992
Intangible assets 9 36 -
Long-term receivables 10 120,429 121,831
Fund and other investments 11 393 1,050
Deferred tax assets 13 6,443 9,927
TOTAL NON-CURRENT ASSETS 303,342 305,087
Trade and other inventories 14 22 173
Trade and other receivables 15 14,310 19,231
Fund and other investments 11 5,072 3,992
Cash and cash equivalents 17 54,111 55,961
TOTAL CURRENT ASSETS 73,515 79,357
TOTAL ASSETS 376,857 384,444
EQUITY
Share capital 18 100 100
Reserves 19 274,394 299,684
TOTAL EQUITY 274,494 299,784
LIABILITIES
Borrowings 21 52,282 25,788
Other long-term liabilities and provisions 23 36,806 34,309
TOTAL NON-CURRENT LIABILITIES 89,088 60,097
Trade and other payables 24 11,954 17,416
Borrowings 21 572 5,465
Taxation 749 1,682
TOTAL CURRENT LIABILITIES 13,275 24,563
TOTAL LIABILITIES 102,363 84,660
TOTAL EQUITY AND LIABILITIES 376,857 384,444
In RM Mil Note 2020 2019
Revenue 25 73,460 121,202
Cost of revenue (51,264) (72,032)
Gross profit 22,196 49,170
Selling and distribution expenses (437) (501)
Administration expenses (4,650) (6,409)
Net impairment losses (2,483) (2,786)
Other expenses (2,830) (989)
Other income 9,394 15,416
Operating profit 26 21,190 53,901
Financing costs 27 (3,535) (4,449)
Profit before taxation 17,655 49,452
Tax expense 28 (8,945) (7,858)
PROFIT FOR THE YEAR REPRESENTING TOTAL COMPREHENSIVE INCOME FOR
THE YEAR 8,710 41,594
The notes set out on pages 20 to 156 are an integral part of these financial statements. The notes set out on pages 20 to 156 are an integral part of these financial statements.
Statement of Financial PositionAs at 31 December 2020
Statement of Profit or Loss and Other Comprehensive IncomeFor the year ended 31 December 2020

Petroliam Nasional Berhad (PETRONAS)
Financial Report 2020
18 19
Non-
distributable Distributable
In RM Mil Note
Share
Capital
General
Reserve
Retained
Profits
Total
Equity
Balance at 1 January 2020 100 12,000 287,684 299,784
Profit for the year - - 8,710 8,710
Total comprehensive income for the year - - 8,710 8,710
Dividends representing transaction with owners of the Company 29 - - (34,000) (34,000)
Balance at 31 December 2020 100 12,000 262,394 274,494
Balance at 1 January 2019 100 12,000 270,090 282,190
Profit for the year - - 41,594 41,594
Total comprehensive income for the year - - 41,594 41,594
Dividend representing transaction with owners of the Company 29 - - (24,000) (24,000)
Balance at 31 December 2019 100 12,000 287,684 299,784
In RM Mil Note 2020 2019
CASH FLOWS FROM OPERATING ACTIVITIES
Profit before taxation 17,655 49,452
Adjustments for:
Depreciation of property, plant and equipment 2,114 3,656
Amortisation of intangible assets and contract costs 10 -
Loss on derivative valuation 193 97
Net changes in fair value of cess receivables (694) (666)
Net change in contract liabilities (858) (1,691)
Net impairment (write-back)/losses on:
- Trade and other receivables (13) (93)
- Loan and advances to subsidiaries 353 (10)
- Property, plant and equipment 2,092 -
- Investment in subsidiaries 51 2,889
Net write-off on:
- Other receivables 12 7
- Intangible assets 20 -
Net change in provisions (1,095) (2,049)
Interest income (5,328) (6,739)
Financing costs 3,535 4,449
Gain on partial disposal of subsidiaries and other investments (1,546) (5,403)
Gain on disposal of property, plant and equipment (2) (430)
Net foreign exchange 1,162 632
Dividend income (11,148) (28,850)
Operating profit before changes in working capital 6,513 15,251
Change in trade and other receivables 1,561 1,745
Change in trade inventories 151 (73)
Change in trade and other payables (5,321) (2,129)
Cash generated from operations 2,904 14,794
Interest income received 5,359 6,662
Interest expenses paid (1,856) (1,655)
Taxation paid (6,394) (9,011)
Net cash generated from operating activities 13 10,790
CASH FLOWS FROM INVESTING ACTIVITIES
Net cash generated from investing activities 30 12,314 21,567
CASH FLOWS FROM FINANCING ACTIVITIES
Net cash used in financing activities 31 (14,076) (68,420)
NET DECREASE IN CASH AND CASH EQUIVALENTS (1,749) (36,063)
NET FOREIGN EXCHANGE DIFFERENCES (101) 202
CASH AND CASH EQUIVALENTS AT BEGINNING OF THE YEAR 55,961 91,822
CASH AND CASH EQUIVALENTS AT END OF THE YEAR 54,111 55,961
CASH AND CASH EQUIVALENTS
Cash and bank balances and deposits 17 54,111 55,961
The notes set out on pages 20 to 156 are an integral part of these financial statements. The notes set out on pages 20 to 156 are an integral part of these financial statements.
Statement of Changes in EquityFor the year ended 31 December 2020
Statement of Cash FlowsFor the year ended 31 December 2020

Petroliam Nasional Berhad (PETRONAS)
Financial Report 2020
20 21
Notes to the Financial Statements31 December 2020
1. BASIS OF PREPARATION
1.1 Statement of compliance
The financial statements of the Group and of the Company have been prepared in accordance with Malaysian
Financial Reporting Standards (“MFRS”), International Financial Reporting Standards and the requirements of the
Companies Act, 2016 in Malaysia.
As of 1 January 2020, the Group and the Company had adopted amendments to MFRSs (“pronouncements”) that
have been issued by the Malaysian Accounting Standards Board (“MASB”) as described fully in Note 41.
MASB has also issued new and revised pronouncements which are not yet effective for the Group and the Company
and therefore, have not been adopted in these financial statements. These pronouncements including their impact
on the financial statements in the period of initial application are set out in Note 41. Revised pronouncements that
are not relevant to the operations of the Group and the Company are set out in Note 41.
These financial statements were approved and authorised for issue by the Board of Directors on 25 February 2021.
1.2 Basis of measurement
The financial statements of the Group and of the Company have been prepared on historical cost basis except for
certain items are measured at fair value, as disclosed in the accounting policies below.
1.3 Functional and presentation currency
The individual financial statements of each entity in the Group are prepared using the currency of the primary
economic environment in which the entity operates (“the functional currency”). The functional currency of the
Company has been determined as Ringgit Malaysia (“RM”). The Group’s and the Company’s financial statements
are presented in Ringgit Malaysia, which is the Company’s reporting currency.
All financial information is presented in Ringgit Malaysia and has been rounded to the nearest million, unless
otherwise stated.
1.4 Use of estimates and judgments
The preparation of financial statements in conformity with MFRS requires management to make judgments,
estimates and assumptions that affect the application of accounting policies and the reported amounts of assets,
liabilities, income and expenses. Actual results may differ from these estimates.
Estimates and underlying assumptions are reviewed on an ongoing basis. Revisions to accounting estimates are
recognised in the period in which the estimate is revised and in any future periods affected.
1. BASIS OF PREPARATION (CONTINUED)
1.4 Use of estimates and judgments (continued)
In particular, information about significant areas of estimation uncertainty and critical judgments in applying
accounting policies that have the most significant effect on the amounts recognised in the financial statements
are described in the following Notes:
(i) Note 3 : Property, plant and equipment
(ii) Note 9 : Intangible assets
(iii) Note 13 : Deferred tax
(iv) Note 21 : Borrowings
(v) Note 23 : Other long-term liabilities and provisions
(vi) Note 25 : Revenue
(vii) Note 28 : Tax expense
(viii) Note 39 : Financial instruments
2. SIGNIFICANT ACCOUNTING POLICIES
The accounting policies set out below have been applied consistently to all periods presented in these financial statements
and have been applied consistently by the Group and the Company, unless otherwise stated.
2.1 Basis of consolidation
Subsidiaries
Subsidiaries are entities, including structured entities, controlled by the Company. The Group controls an entity
when it is exposed to, or has rights to, variable returns from its involvement with the entity and has the ability
to affect those returns through its power over the entity. Potential voting rights are considered when assessing
control only when such rights are substantive. The Group considers it has de facto power over an investee when,
despite not having the majority of voting rights, it has the current ability to direct the activities of the investee that
significantly affect the investee’s return.
Investments in subsidiaries are measured in the Company’s statement of financial position at cost less any
impairment losses, unless the investment is classified as held for sale or distribution. The cost of investment
includes transaction costs.
The financial statements of subsidiaries are included in the consolidated financial statements of the Group from
the date that control commences until the date that control ceases.
All inter-company transactions are eliminated on consolidation and revenue and profits relate to external
transactions only. Unrealised losses resulting from inter-company transactions are also eliminated unless cost
cannot be recovered.
Notes to the Financial Statements31 December 2020

Petroliam Nasional Berhad (PETRONAS)
Financial Report 2020
22 23
Notes to the Financial Statements31 December 2020
Notes to the Financial Statements31 December 2020
2. SIGNIFICANT ACCOUNTING POLICIES (CONTINUED)
2.1 Basis of consolidation (continued)
Business combinations
A business combination is a transaction or other event in which an acquirer obtains control of one or more
businesses. Business combinations are accounted for using the acquisition method from the acquisition date,
which is the date on which control is transferred to the Group. The identifiable assets acquired and liabilities
assumed are measured at their fair values at the acquisition date. The cost of an acquisition is measured as the
aggregate of the fair value of the consideration transferred and the amount of any non-controlling interests in the
acquiree. Non-controlling interests are stated either at fair value or at the proportionate share of the acquiree’s
identifiable net assets at the acquisition date.
When a business combination is achieved in stages, the Group remeasures its previously held non-controlling
equity interest in the acquiree at fair value at the acquisition date, with any resulting gain or loss recognised in
the profit or loss. Increase in the Group’s ownership interest in an existing subsidiary is accounted for as equity
transactions with differences between the fair value of consideration paid and the Group’s proportionate share of
net assets acquired, recognised directly in equity.
The Group measures goodwill as the excess of the cost of an acquisition and the fair values of any previously
held interest in the acquiree over the fair value of the identifiable assets acquired and liabilities assumed at the
acquisition date. When the excess is negative, a bargain purchase gain is recognised immediately in profit or loss.
Goodwill arising from business combinations prior to 1 October 2009 is stated at the previous carrying amount
less subsequent impairments, pursuant to the adoption of MFRS framework by the Group in the financial year
ended 31 December 2012.
Transaction costs, other than those associated with the issuance of debt or equity securities, that the Group incurs
in connection with a business combination are expensed as incurred.
Business combinations arising from transfers of interests in entities that are under the control of the shareholder
that controls the Group are accounted for as if the acquisition had occurred at the beginning of the earliest
comparative period presented, or, if later, at the date that common control was established; for this purpose,
comparatives are restated. The assets and liabilities acquired are recognised at the carrying amounts recognised
previously in the Group controlling shareholder’s consolidated financial statements. The components of equity
of the acquired entities are added to the same components within Group equity and any resulting gain or loss is
recognised directly in equity.
Non-controlling interests
Non-controlling interests at the end of the reporting period, being the portion of the net assets of subsidiaries
attributable to equity interests that are not owned by the Company, whether directly or indirectly through
subsidiaries, are presented in the consolidated statement of financial position and statement of changes in equity
within equity, separately from equity attributable to the shareholders of the Company. Non-controlling interests
in the results of the Group are presented in the consolidated statement of profit or loss and other comprehensive
income as an allocation of the profit or loss and total comprehensive income for the year between the non-
controlling interests and shareholders of the Company.
Losses applicable to the non-controlling interests in a subsidiary are allocated to the non-controlling interests
even if doing so causes the non-controlling interests to have a deficit balance.
2. SIGNIFICANT ACCOUNTING POLICIES (CONTINUED)
2.1 Basis of consolidation (continued)
Non-controlling interests (continued)
The Group treats all changes in its ownership interest in a subsidiary that do not result in a loss of control as equity
transactions between the Group and its non-controlling interest holders. Any difference between the Group’s
share of net assets before and after the change, and any consideration received or paid, is adjusted to or against
Group reserves.
Loss of control
Upon loss of control of a subsidiary, the Group derecognises the assets and liabilities of the former subsidiary,
any non-controlling interests and the other components of equity related to the former subsidiary from the
consolidated statements of financial position except when the retained interest is a joint operation where the
Group’s retained interest in the assets and liabilities of the former subsidiary are not derecognised. Any surplus
or deficit arising on the loss of control is recognised in profit or loss. If the Group retains any interest in the
previous subsidiary, then such interest is measured at fair value at the date that control is lost except when the
retained interest is a joint operation where such interest is measured at its carrying amount. Subsequently, it is
accounted for as an equity-accounted investee or as a fair value through other comprehensive income financial
asset depending on the level of influence retained.
2.2 Associates
Associates are entities in which the Group has significant influence including representation on the Board of
Directors, but not control or joint control, over the financial and operating policies of the investee company.
Associates are accounted for in the consolidated financial statements using the equity method less any impairment
losses, unless it is classified as held for sale or distribution. The consolidated financial statements include the
Group’s share of post-acquisition profits or losses and other comprehensive income of the equity-accounted
associates, after adjustments to align the accounting policies with those of the Group, from the date that significant
influence commences until the date that significant influence ceases.
The Group’s share of post-acquisition reserves and retained profits less losses is added to the carrying value of the
investment in the consolidated statement of financial position. These amounts are taken from the latest audited
financial statements or management financial statements of the associates.
When the Group’s share of post-acquisition losses exceeds its interest in an equity accounted associate, the
carrying amount of that interest (including any long-term investments such as loans and advances) is reduced to
nil and the recognition of further losses is discontinued except to the extent that the Group has an obligation or
has made payments on behalf of the associate.
When the Group ceases to have significant influence over an associate, it is accounted for as a disposal of the
entire interest in that associate, with the resulting gain or loss being recognised in the profit or loss. Any retained
interest in the former associate at the date when significant influence is lost is measured at fair value and this
amount is regarded as the initial carrying amount of a financial asset.

Petroliam Nasional Berhad (PETRONAS)
Financial Report 2020
24 25
Notes to the Financial Statements31 December 2020
Notes to the Financial Statements31 December 2020
2. SIGNIFICANT ACCOUNTING POLICIES (CONTINUED)
2.2 Associates (continued)
When the Group’s interest in an associate decreases but does not result in loss of significant influence, any retained
interest is not re-measured. Any gain or loss arising from the decrease in interest is recognised in profit or loss. Any
gains or losses previously recognised in other comprehensive income are also reclassified proportionately to the
profit or loss if that gain or loss would be required to be reclassified to profit or loss on the disposal of the related
assets and liabilities.
Unrealised profits arising from transactions between the Group and its associates are eliminated to the extent of
the Group’s interests in the associates. Unrealised losses on such transactions are also eliminated partially, unless
cost cannot be recovered.
2.3 Joint arrangements
Joint arrangements are arrangements of which the Group has joint control, established by contracts requiring
unanimous consent for decisions about the activities that significantly affect the arrangements’ returns.
Joint arrangements are classified as either joint operation or joint venture. A joint arrangement is classified as joint
operation when the Group or the Company has rights to the assets and obligations for the liabilities relating to an
arrangement. The Group and the Company account for each of its share of the assets, liabilities and transactions,
including its share of those held or incurred jointly with the other investors, in relation to the joint operation. A joint
arrangement is classified as joint venture when the Group has rights only to the net assets of the arrangements.
The Group accounts for its interest in the joint venture using the equity method as described in Note 2.2.
2.4 Property, plant and equipment and depreciation
Recognition and measurement
Freehold land and projects-in-progress are stated at cost less accumulated impairment losses and are not
depreciated. Other property, plant and equipment are stated at cost less accumulated depreciation and
accumulated impairment losses, if any.
Cost includes expenditures that are directly attributable to the acquisition of the assets and any other costs directly
attributable to bringing the assets to working condition for their intended use, and the costs of dismantling and
removing the items and restoring the site on which they are located. The cost of self-constructed assets also
includes the cost of material and direct labour. For qualifying assets, borrowing costs are capitalised in accordance
with the accounting policy on borrowing costs. Purchased software that is integral to the functionality of the
related equipment is capitalised as part of that equipment.
When the use of a property changes from owner-occupied to investment property, the property is reclassified as
investment property at cost.
When significant components of an item of property, plant and equipment have different useful lives, they are
accounted for as separate items (major components) of property, plant and equipment.
2. SIGNIFICANT ACCOUNTING POLICIES (CONTINUED)
2.4 Property, plant and equipment and depreciation (continued)
Subsequent costs
The cost of replacing a component of an item of property, plant and equipment is recognised in the carrying
amount of the item if it is probable that the future economic benefits embodied within the component will flow
to the Group or the Company and its cost can be measured reliably. The carrying amount of the replaced item of
property, plant and equipment is derecognised with any corresponding gain or loss recognised in the profit or loss
accordingly. The costs of the day-to-day servicing of property, plant and equipment are recognised in the profit
or loss as incurred.
Depreciation
Depreciation for property, plant and equipment other than freehold land, oil and gas properties and projects-
in-progress, is recognised in the profit or loss on a straight-line basis over the estimated useful lives of each
component of an item of property, plant and equipment. Property, plant and equipment are not depreciated until
the assets are ready for their intended use.
Amortisation of producing oil and gas properties is computed based on the unit of production method using total
proved reserves for capitalised acquisition cost, certain facilities and wells. For other capitalised exploration and
development costs, facilities and wells, total proved developed reserves are used.
The estimated useful lives of the other property, plant and equipment are as follows:
• Buildings 5 - 100 years
• Plant and equipment 2 - 67 years
• Office equipment, furniture and fittings 2 - 10 years
• Computer software and hardware 2 - 7 years
• Motor vehicles 3 - 15 years
• Vessels 20 - 30 years
The right-of-use asset is depreciated using the straight-line method from the commencement date to the earlier
of the end of the useful life of the right-of-use asset or the end of the lease term (other than certain right-of-
use assets related to oil and gas properties which are depreciated using the unit of production method based on
reserve cut-off at expiry of lease contract).
Estimates in respect of certain items of property, plant and equipment were revised during the year (refer Note 3).
The depreciable amount is determined after deducting residual value. The residual value, useful life and depreciation
method are reviewed at each financial year end to ensure that the amount, period and method of depreciation
are consistent with previous estimates and the expected pattern of consumption of the future economic benefits
embodied in the items of property, plant and equipment.
Derecognition
An item of property, plant and equipment is derecognised upon disposal or when no future economic benefits are
expected from its use or disposal. The difference between the net disposal proceeds, if any, and the net carrying
amount is recognised in the profit or loss.

Petroliam Nasional Berhad (PETRONAS)
Financial Report 2020
26 27
Notes to the Financial Statements31 December 2020
Notes to the Financial Statements31 December 2020
2. SIGNIFICANT ACCOUNTING POLICIES (CONTINUED)
2.5 Investment properties
Investment properties are properties which are owned to earn rental income or for capital appreciation or for
both, but not for sale in the ordinary course of business, use in the production or supply of goods or services or for
administrative purpose. Properties that are occupied by the companies in the Group are accounted for as owner-
occupied rather than as investment properties.
Freehold land and projects-in-progress are stated at cost and are not depreciated. Other investment properties
are stated at cost less accumulated depreciation and accumulated impairment losses, if any, consistent with the
accounting policy for property, plant and equipment as stated in Note 2.4.
Cost includes expenditure that is directly attributable to the acquisition of the investment property. The cost of
self-constructed investment property includes the cost of materials and direct labour, any other costs directly
attributable to bringing the investment property to a working condition for its intended use and capitalised
borrowing costs.
Depreciation is recognised in the profit or loss on a straight-line basis over their estimated useful lives ranging
between 10 and 50 years for buildings.
An investment property is derecognised on its disposal, or when it is permanently withdrawn from use and no
future economic benefits are expected from its disposal. The difference between net disposal proceeds and the
carrying amount is recognised in the profit or loss in the period in which the item is derecognised.
2.6 Land held for development
Land held for development consists of land or such portions thereof on which no development activities have
been carried out or where development activities are not expected to be completed within the normal operating
cycle. Such land is classified as non-current asset and is stated at the lower of cost and net realisable value
consistent with the accounting policy for inventories as stated in Note 2.16.
Cost includes acquisition cost of land and attributable development expenditure. Cost associated with the
acquisition of land includes the purchase price of the land, professional fees, stamp duties, commissions,
conversion fees and other relevant levies. Development expenditure includes the cost for development of main
infrastructure works.
Land held for development is reclassified as properties under development at the point when development
activities have commenced and where it can be demonstrated that the development activities can be completed
within the normal operating cycle. Properties under development are, in turn, reclassified as developed properties
held for sale upon completion of the development activities.
Properties under development and developed properties held for sale are recognised as trade and other inventories
in current assets. The accounting policy is described separately in Note 2.16.
2. SIGNIFICANT ACCOUNTING POLICIES (CONTINUED)
2.7 Leases
(i) Definition of a lease
A contract is, or contains, a lease if the contract conveys a right to control the use of an identified asset for
a period of time in exchange for a consideration. To assess whether a contract conveys the right to control
the use of an identified asset, the Group and the Company assess whether:
• the contract involves the use of an identified asset – this may be specified explicitly or implicitly and
should be physically distinct or represent substantially all of the capacity of a physically distinct asset.
If the supplier has a substantive substitution right, then the asset is not identified;
• the customer has the right to obtain substantially all of the economic benefits from use of the asset
throughout the period of use; and
• the customer has the right to direct the use of the asset when it has the decision-making rights that
are most relevant to changing how and for what purpose the asset is used. The customer has the
right to direct the use of the asset if either the customer has the right to operate the asset; or the
customer designed the asset in a way that predetermines how and for what purpose it will be used
throughout the period of use.
At inception or on reassessment of a contract that contains a lease component, the Group and the Company
allocate the consideration in the contract to each lease and non-lease component on the basis of their
relative stand-alone prices.
(ii) Recognition and initial measurement
(a) As a lessee
The Group and the Company recognise a right-of-use asset and a lease liability at the lease
commencement date. The right-of-use asset is initially measured at cost, which comprises the initial
amount of the lease liability adjusted for any lease payments made at or before the commencement
date, plus any initial direct costs incurred and an estimate of costs to dismantle and remove the
underlying asset or to restore the underlying asset or the site on which it is located, less any lease
incentives received.
The lease liability is initially measured at the present value of the lease payments that are not paid
at the commencement date, discounted using the interest rate implicit in the lease or, if that rate
cannot be readily determined, the respective Group entities’ incremental borrowing rate is used.
Generally, the Group entities use their incremental borrowing rate as the discount rate.
Lease payments included in the measurement of the lease liability comprise the following:
• fixed payments, including in-substance fixed payments;
• variable lease payments that depend on an index or a rate, initially measured using the index
or rate as at the commencement date;
• amounts expected to be payable under a residual value guarantee;
• the exercise price under a purchase option that the Group and the Company are reasonably
certain to exercise; and
• penalties for early termination of a lease unless the Group and the Company are reasonably
certain not to early terminate the contract.

Petroliam Nasional Berhad (PETRONAS)
Financial Report 2020
28 29
Notes to the Financial Statements31 December 2020
Notes to the Financial Statements31 December 2020
2. SIGNIFICANT ACCOUNTING POLICIES (CONTINUED)
2.7 Leases (continued)
(ii) Recognition and initial measurement (continued)
(a) As a lessee (continued)
The Group and the Company exclude variable lease payments that linked to future performance or
usage of the underlying asset from the lease liability. Instead, these payments are recognised in profit
or loss in the period in which the performance or use occurs.
The Group and the Company assess at lease commencement whether it is reasonably certain to
exercise the extension options in determining the lease term.
The Group and the Company have elected not to recognise right-of-use assets and lease liabilities
for short-term leases that have a lease term of 12 months or less and leases of low-value assets. The
Group and the Company recognise the lease payments associated with these leases as an expense
on a straight-line basis over the lease term.
The Group and the Company present right-of-use assets that do not meet the definition of investment
property in ‘property, plant and equipment’ and lease liabilities in ‘borrowings’ in the statement of
financial position.
The accounting for MFRS 16 in joint operation depends on whether the Group is the operator or
non-operator of a joint arrangement.
Where the Group is an operator and is the sole signatory to a lease contract of an asset to be
used in the activities of a specific joint operation, the operator does so implicitly or explicitly on
behalf of the joint arrangement. As is the customary norm in upstream activities operated through
joint arrangements, the operator will manage the lease, pay the lessor and subsequently re-bill the
partners for their share of the lease costs. In such instances, it is necessary to determine whether:
• the operator is the sole lessee in the external lease arrangement, and if so, whether the billings
to partners may represent sub-leases; or
• it is in fact the joint arrangement, which the lessee and other participants account for its
proportionate share of the lease.
Where the Group is a non-operator, it is necessary to determine whether the finance sub-lease exists
in the lease arrangement.
Depending on the facts and circumstances in each case, the Group recognises the lease liabilities
based on the principles described below.
2. SIGNIFICANT ACCOUNTING POLICIES (CONTINUED)
2.7 Leases (continued)
(ii) Recognition and initial measurement (continued)
(a) As a lessee (continued)
The Group as the operator of a joint operation
Where all partners in a joint operation are sharing the primary responsibility for lease payments under
a contract, the related lease liability and right-of-use asset will be recognised net by the Group, on
the basis of the Group’s participation interest in the joint operation.
The Group will recognise a lease liability fully when it has or considered having the primary
responsibility for the full external lease payments. When a finance sub-lease exists between the
Group and the non-operators, the Group will derecognise a portion of the right-of-use asset equal
to the non-operator’s interests in the lease, and instead recognise a corresponding finance lease
receivable. A finance sub-lease will typically exist when the Group enters into a contract in its own
name, where it has the primary responsibility for the external lease payments, and the leased asset is
to be used on one specific joint operation, and the costs and risks related to the use of this asset are
carried by that specific joint operation.
Where the use of the leased asset on a joint operation is not considered a finance sub-lease, the
Group will recognise the related right-of-use asset and lease liability on a gross basis. Expenses
which are not included in a recognised lease obligation, such as payments for short-term leases,
non-lease components and variable lease payments will continue to be reported net in the Group’s
statement of profit or loss, on the basis of the Group’s net participation interest.
The Group as a non-operator of a joint operation
As a non-operator of a joint operation, the Group will recognise its proportionate share of a lease
when the Group shares the primary responsibility for lease payments under a contract. These include
contracts where the Group has co-signed a lease contract and contracts for which the operator has
been given a legally binding mandate to sign the external lease contract on behalf of the licenced
partners.
The Group will also recognise its proportionate share when a lease contract is entered by the operator
of a joint operation, and where the operator’s use of the leased asset represents a sub-lease from
the operator to the non-operators. A sub-lease is considered to take place in situations where the
operator agrees with the non-operators for a specified period of time, and where the use of the asset
is deemed to be controlled jointly by the joint operation.
(b) As a lessor
When the Group and the Company act as a lessor, it determines at lease inception whether each
lease is a finance lease or an operating lease.
To classify each lease, the Group and the Company make an overall assessment on whether the lease
transfers substantially all of the risks and rewards incidental to ownership of the underlying asset.
If this is the case, then the lease is a finance lease; if not, then it is an operating lease.

Petroliam Nasional Berhad (PETRONAS)
Financial Report 2020
30 31
Notes to the Financial Statements31 December 2020
Notes to the Financial Statements31 December 2020
2. SIGNIFICANT ACCOUNTING POLICIES (CONTINUED)
2.7 Leases (continued)
(ii) Recognition and initial measurement (continued)
(b) As a lessor (continued)
If an arrangement contains lease and non-lease components, the Group and the Company apply
MFRS 15 Revenue from Contracts with Customers to allocate the consideration in the contract based
on the stand-alone selling price.
The Group and the Company recognise assets held under a finance lease in its statement of financial
position and presents them as a receivable at an amount equal to the net investment in the lease. The
Group and the Company use the interest rate implicit in the lease to measure the net investment in
the lease.
When the Group is an intermediate lessor, it accounts for its interests in the head lease and the sub-
lease separately. It assesses the lease classification of a sub-lease with reference to the right-of-use
asset arising from the head lease, not with reference to the underlying asset. If a head lease is a
short-term lease to which the Group applies the exemption described above, then it classifies the
sub-lease as an operating lease.
(iii) Subsequent measurement
(a) As a lessee
The right-of-use asset is subsequently depreciated using the straight-line method from the
commencement date to the earlier of the end of the useful life of the right-of-use asset or the end
of the lease term (other than certain right-of-use assets related to oil and gas properties which
are depreciated using the unit of production method based on reserve cut-off at expiry of lease
contract). The estimated useful lives of right-of-use assets are determined on the same basis as
those of property, plant and equipment. Depreciation of certain right-of-use assets are subsequently
capitalised into carrying amount of other assets whenever they meet the criteria for capitalisation. In
addition, the right-of-use asset is periodically reduced by impairment losses, if any, and adjusted for
certain remeasurements of the lease liability.
The lease liability is measured at amortised cost using the effective interest method. It is remeasured
when there is a change in future lease payments arising from a change in an index or rate, if there
is a revision of in-substance fixed lease payments, or if there is a change in the Group’s and the
Company’s estimate of the amount expected to be payable under a residual value guarantee, or if the
Group and the Company change its assessment of whether it will exercise a purchase, extension or
termination option. The Group will reassess whether it is reasonably certain to exercise the extension
option if there is a significant change in circumstances within its control.
When the lease liability is remeasured as described in the above paragraph, a corresponding
adjustment is made to the carrying amount of the right-of-use asset or is recorded in profit or loss if
the carrying amount of the right-of-use asset has been reduced to zero.
2. SIGNIFICANT ACCOUNTING POLICIES (CONTINUED)
2.7 Leases (continued)
(iii) Subsequent measurement (continued)
(a) As a lessee (continued)
When there is lease modification due to increase in the scope of lease by adding the right-to-use one
or more underlying assets, the Group and the Company assess whether the lease modification shall
be accounted for as a separate lease or similar to reassessment of lease liability. The Group and the
Company account for lease modification as a separate lease when the consideration for the lease
increases by an amount commensurate with the stand-alone price for the increase in scope and any
appropriate adjustments.
When there is lease modification due to decrease in scope, the Group and the Company decrease
the carrying amount of the right-of-use asset and remeasure the lease liability to reflect the partial
or full termination of the lease. The corresponding gain or loss shall be recognised in profit or loss.
Lease liabilities are remeasured for all other lease modifications with corresponding adjustments to
the right-of-use asset.
(b) As a lessor
The Group and the Company recognise lease payments received under operating leases as income
on a straight-line basis over the lease term as part of “revenue”.
The Group and the Company recognise finance income over the lease term, based on a pattern
reflecting a constant periodic rate of return on the Group’s and the Company’s net investment in
the lease. The Group and the Company aim to allocate finance income over the lease term on a
systematic and rational basis. The Group and the Company apply the lease payments relating to
the period against the gross investment in the lease to reduce both the principal and the unearned
finance income. The net investment in the lease is subject to impairment requirements in MFRS 9
Financial Instruments (see Note 2.12).
2.8 Investments
Long-term investments in subsidiaries, associates and joint ventures are stated at cost less impairment loss, if any,
in the Company’s financial statements unless the investment is classified as held for sale or distribution. The cost
of investments includes transaction costs.
The carrying amount of these investments includes fair value adjustments on shareholder’s loans and advances, if
any (Note 2.12(i)).
2.9 Intangible assets
Goodwill
Goodwill arising from business combinations is initially measured at cost as described in Note 2.1. Following the
initial recognition, goodwill is measured at cost less any accumulated impairment losses. Goodwill is not amortised
but instead, it is reviewed for impairment, annually or more frequently if events or changes in circumstances
indicate that the carrying value may be impaired.

Petroliam Nasional Berhad (PETRONAS)
Financial Report 2020
32 33
Notes to the Financial Statements31 December 2020
Notes to the Financial Statements31 December 2020
2. SIGNIFICANT ACCOUNTING POLICIES (CONTINUED)
2.9 Intangible assets (continued)
Goodwill (continued)
In respect of equity-accounted investees, the carrying amount of goodwill is included in the carrying amount of
the investment. The entire carrying amount of the investment is reviewed for impairment when there is objective
evidence of impairment.
Exploration expenditure
Intangible assets also include expenditure on the exploration for and evaluation of oil and natural gas resources
(hereinafter collectively referred to as “exploration expenditure”). The accounting policy for exploration expenditure
is described separately in Note 2.10.
Other intangible assets
Intangible assets other than goodwill and exploration expenditure are measured on initial recognition at cost. The
costs of intangible assets acquired in a business combination are their fair values as at the date of acquisition.
Following initial recognition, intangible assets with finite useful lives are carried at cost less accumulated
amortisation and any accumulated impairment losses.
Amortisation for intangible assets with finite useful lives is recognised in the profit or loss on a straight-line basis
over the estimated economic useful lives, other than certain recoverable expenditure incurred under a service
contract which is amortised based on unit of production method, which is calculated based on entitlement of
production for the period, and estimated entitlement for the remaining life of the asset.
For the Development and Production Service Contracts (“DPSC”) assets, the Group amortises through the unit of
production method, which is calculated based on entitlement of production for the period over the entitlement of
production for the period and estimated entitlement for the remaining life of the DPSC.
Estimates are made in relation to expected entitlement of production which are based on the actual cost incurred
but yet to be recovered and application of the prevailing crude oil price. The amortisation method and the useful
life for intangible assets are reviewed at least at each reporting date. Intangible assets are assessed for impairment
whenever there is indication that the intangible assets may be impaired.
Intangible assets with indefinite useful lives are carried at cost less accumulated impairment losses. These intangible
assets are reviewed for impairment annually or more frequently if events or changes in circumstances indicate that
the carrying value may be impaired.
2.10 Exploration and development expenditure
The Group follows the successful efforts method of accounting for the exploration and development expenditure.
Exploration expenditure
Costs directly associated with an exploration well, including license acquisition and drilling costs, are initially
capitalised as intangible assets until the results have been evaluated.
2. SIGNIFICANT ACCOUNTING POLICIES (CONTINUED)
2.10 Exploration and development expenditure (continued)
Exploration expenditure (continued)
If a well does not result in successful discovery of economically recoverable volume of hydrocarbons or the cost
of undeveloped land that expires, such costs are impaired or written off. If hydrocarbons are found and, subject
to further appraisal activity which may include the drilling of further wells, are likely to be capable of commercial
development under prevailing economic conditions, the costs continue to be carried as intangible assets. Such
costs are reviewed at least once a year to determine whether the reserves found or appraised remain economically
viable. When this is no longer the case, the costs are impaired or written off.
Where development plan is commercially viable and approved by the relevant authorities, the related exploration
and evaluation costs are transferred to projects-in-progress in property, plant and equipment.
Development expenditure
Development expenditure comprises all costs incurred in bringing a field to commercial production and is
capitalised as incurred. The amount capitalised includes attributable interests and other financing costs incurred
on exploration and development before commencement of production.
Upon commencement of production, the exploration and development expenditure initially capitalised as
projects-in-progress are transferred to oil and gas properties and are depreciated as described in the accounting
policy for property, plant and equipment and depreciation (Note 2.4).
2.11 Non-current assets held for sale
Non-current assets and disposal groups comprising assets and liabilities that are expected to be recovered
primarily through sale rather than through continuing use, are classified as held for sale. This condition is regarded
as met only when the sale is highly probable and the asset is available for immediate sale in its present condition.
Immediately before classification as held for sale, the assets (or all the assets and liabilities in a disposal group) are
remeasured in accordance with the Group’s applicable accounting policies. Thereafter, on initial classification as
held for sale, the assets or disposal groups are measured at the lower of carrying amount and fair value less cost
to sell. Any differences are charged to the profit or loss.
Any impairment loss on a disposal group is first allocated to goodwill, and then to remaining assets and liabilities on
pro rata basis, except that no impairment loss is allocated to inventories, contract assets, contract costs, financial
assets, deferred tax assets, employee benefit assets and investment property, which continue to be measured
in accordance with the Group’s accounting policies. Impairment losses on initial classification as held for sale
or distribution and subsequent gains or losses on remeasurement are recognised in profit or loss. Gains are not
recognised in excess of any cumulative impairment loss.
Intangible assets, property, plant and equipment and investment properties once classified as held for sale are not
amortised nor depreciated. In addition, equity accounting of equity-accounted investees ceases once classified as
held for sale.

Petroliam Nasional Berhad (PETRONAS)
Financial Report 2020
34 35
Notes to the Financial Statements31 December 2020
Notes to the Financial Statements31 December 2020
2. SIGNIFICANT ACCOUNTING POLICIES (CONTINUED)
2.12 Financial instruments
Recognition and initial measurement
A financial instrument is recognised in the statement of financial position when, and only when, the Group or the
Company becomes a party to the contractual provisions of the instrument.
Regular way purchases or sales were recognised on the trade date i.e. the date that the Group and the Company
commit to purchase or sell the financial asset.
A financial asset (unless it is a receivable without a significant financing component) and a financial liability is
measured at fair value plus or minus, in the case of a financial instrument not at fair value through profit or loss,
any directly attributable transaction cost incurred at the acquisition or issuance of the financial instrument. A
receivable that does not contain a significant financing component is initially measured at the transaction price.
Fair value adjustments on shareholder’s loans and advances at initial recognition, if any, are added to the carrying
value of investments in the Company’s financial statements.
Classification and subsequent measurement
(i) Financial assets
Financial assets are classified as measured at amortised cost, fair value through other comprehensive
income (“FVOCI”) and fair value through profit or loss (“FVTPL”), as appropriate.
The Group and the Company determine the classification of financial assets at initial recognition and are
not reclassified subsequent to their initial recognition unless the Group changes its business model for
managing financial assets in which case all affected financial assets are reclassified on the first day of the
first reporting period following the change in the business model.
Amortised cost
Amortised cost category comprises financial assets that are held within a business model whose objective is
to hold assets to collect contractual cash flows and its contractual terms give rise on specified dates to cash
flows that are solely payments of principal and interest on the principal amount outstanding. The financial
assets are not designated as fair value through profit or loss.
Subsequent measurement
Subsequent to initial recognition, these financial assets are measured at amortised cost using the effective
interest method (Note 2.12 (v)). Interest income and foreign exchange gains and losses are recognised in
profit or loss.
2. SIGNIFICANT ACCOUNTING POLICIES (CONTINUED)
2.12 Financial instruments (continued)
Classification and subsequent measurement (continued)
(i) Financial assets (continued)
Fair value through other comprehensive income
Debt instruments
This category comprises debt instruments where it is held within a business model whose objective is
achieved by both collecting contractual cash flows and selling financial assets, and its contractual terms
give rise on specified dates to cash flows that are solely payments of principal and interest on the principal
amount outstanding. The debt instruments are not designated as at fair value through profit or loss.
Equity instruments
Fair value through other comprehensive income category also comprises investment in equity that are
not held for trading, and the Group and the Company irrevocably elect to present subsequent changes in
the investment’s fair value in other comprehensive income. This election is made on an investment-by-
investment basis.
Subsequent measurement
Financial assets categorised as fair value through other comprehensive income are subsequently measured
at fair value with unrealised gains and losses recognised directly in other comprehensive income and
accumulated under fair value through other comprehensive income reserve in equity. For debt instruments,
when the investment is derecognised or determined to be impaired, the cumulative gain or loss previously
recorded in equity is reclassified to the profit or loss. For equity instruments, the gains or losses accumulated
in other comprehensive income are never reclassified to profit or loss.
Fair value through profit or loss
All financial assets not classified as measured at amortised cost or fair value through other comprehensive
income as described above are measured at fair value through profit or loss. These include derivative
financial assets (except for a derivative that is a financial guarantee contract as per Note 2.12 (iii)). On initial
recognition, the Group and the Company may irrevocably designate a financial asset that otherwise meets
the requirements to be measured at amortised cost or at fair value through other comprehensive income
as at fair value through profit or loss if doing so eliminates or significantly reduces an accounting mismatch
that would otherwise arise.
Subsequent measurement
Financial assets categorised as fair value through profit or loss are subsequently measured at their fair value
with gains or losses recognised in the profit or loss. The methods used to measure the fair value are stated
in Note 2.25.

Petroliam Nasional Berhad (PETRONAS)
Financial Report 2020
36 37
Notes to the Financial Statements31 December 2020
Notes to the Financial Statements31 December 2020
2. SIGNIFICANT ACCOUNTING POLICIES (CONTINUED)
2.12 Financial instruments (continued)
Classification and subsequent measurement (continued)
(ii) Financial liabilities
The categories of financial liabilities at initial recognition are as follows:
Fair value through profit or loss
Fair value through profit or loss category comprises financial liabilities that are derivatives (except for a
derivative that is a financial guarantee contract or a designated and effective hedging instrument), contingent
consideration in a business combination and financial liabilities that are specifically designated into this
category upon initial recognition.
On initial recognition, the Group or the Company may irrevocably designate a financial liability that
otherwise meets the requirements to be measured at amortised cost as at fair value through profit or loss:
a) if doing so eliminates or significantly reduces an accounting mismatch that would otherwise arise;
b) a group of financial liabilities or financial assets and financial liabilities is managed and its performance
is evaluated on a fair value basis, in accordance with a documented risk management or investment
strategy, and information about the Group is provided internally on that basis to the Group’s key
management personnel; or
c) if a contract contains one or more embedded derivatives and the host is not a financial asset in the
scope of MFRS 9 Financial Instruments, where the embedded derivative significantly modifies the
cash flows and separation is not prohibited.
Financial liabilities categorised as fair value through profit or loss are subsequently measured at their fair
value with gains or losses, including any interest expense are recognised in the profit or loss.
For financial liabilities where it is designated as fair value through profit or loss upon initial recognition,
the Group and the Company recognise the amount of change in fair value of the financial liability that
is attributable to change in credit risk in the other comprehensive income and remaining amount of the
change in fair value in the profit or loss, unless the treatment of the effects of changes in the liability’s credit
risk would create or enlarge an accounting mismatch.
Amortised cost
Subsequent to initial recognition, other financial liabilities are subsequently measured at amortised cost
using the effective interest method (see Note 2.12 (v)).
Gains and losses are recognised in the profit or loss when the liabilities are derecognised as well as through
the amortisation process.
2. SIGNIFICANT ACCOUNTING POLICIES (CONTINUED)
2.12 Financial instruments (continued)
Classification and subsequent measurement (continued)
(iii) Financial guarantee contracts
A financial guarantee contract is a contract that requires the issuer to make specified payments to reimburse
the holder for a loss it incurs because a specified debtor fails to make payment when due in accordance
with the terms of a debt instrument.
Financial guarantees issued are initially measured at fair value. Subsequently, they are measured at higher
of:
• the amount of the loss allowance; and
• the amount initially recognised less, when appropriate, the cumulative amount of income recognised
in accordance to the principles of MFRS 15 Revenue from Contracts with Customers.
Liabilities arising from financial guarantees are presented together with other provisions.
(iv) Derivative financial instruments
The Group and the Company use derivative financial instruments such as interest rate and foreign currency
swaps, forward rate contracts, futures and options, to manage certain exposures to fluctuations in foreign
currency exchange rates, interest rates and commodity prices.
Derivative financial instruments are initially recognised at fair value on the date on which a derivative
contract is entered into and are subsequently remeasured at fair value. Derivatives are carried as financial
assets when the fair value is positive and as financial liabilities when the fair value is negative.
Any gains and losses arising from changes in fair value on derivatives during the year are recognised in the
profit or loss.
In general, contracts to sell or purchase non-financial items to meet expected own use requirements are
not accounted for as financial instruments. However, contracts to sell or purchase commodities that can
be net settled or which contain written options are required to be recognised at fair value, with gains and
losses recognised in the profit or loss.
An embedded derivative is recognised separately from the host contract where the host contract is not
a financial asset, and accounted for separately if, and only if, the derivative is not closely related to the
economic characteristics and risks of the host contract and the host contract is not measured at fair value
through profit or loss. The host contract, in the event an embedded derivative is recognised separately, is
accounted for in accordance with policy applicable to the nature of the host contract.
(v) Effective interest method
Amortised cost was computed using the effective interest method. This method used effective interest rate
that exactly discounts estimated future cash receipts or payments through the expected life of the financial
instrument to the net carrying amount of the financial instrument. Amortised cost takes into account any
transaction costs and any discount or premium on settlement.

Petroliam Nasional Berhad (PETRONAS)
Financial Report 2020
38 39
Notes to the Financial Statements31 December 2020
Notes to the Financial Statements31 December 2020
2. SIGNIFICANT ACCOUNTING POLICIES (CONTINUED)
2.12 Financial instruments (continued)
Classification and subsequent measurement (continued)
(vi) Offsetting of financial instruments
Financial assets and financial liabilities are offset and the net amount is reported in the statement of financial
position if, and only if, there is a currently enforceable legal right to offset the recognised amounts and
there is an intention to settle on a net basis or to realise the assets and settle the liabilities simultaneously.
(vii) Amortised cost of financial instruments
Interest income is recognised by applying effective interest rate to the gross carrying amount except for
credit impaired financial assets (see Note 2.13 (i)) where effective interest rate is applied to the amortised
cost.
(viii) Derecognition of financial instruments
A financial asset is derecognised when the rights to receive cash flows from the asset have expired or, the
Group and the Company have transferred their rights to receive cash flows from the asset or have assumed
an obligation to pay the received cash flows in full without material delay to a third party under a “pass-
through” arrangement without retaining control of the asset or substantially all the risks and rewards of the
asset.
On derecognition of a financial asset, the difference between the carrying amount and the sum of the
consideration received (including any new asset obtained less any new liability assumed) and any
cumulative gain or loss that had been recognised in equity is recognised in the profit or loss, except for
equity investments at fair value through other comprehensive income where the gain or loss are recognised
in other comprehensive income.
A financial liability is derecognised when the obligation under the liability is discharged or cancelled or
expired. On derecognition of a financial liability, the difference between the carrying amount of the financial
liabilities extinguished or transferred to another party and the consideration paid, including any non-cash
assets transferred or liabilities assumed, is recognised in the profit or loss.
2.13 Impairment
(i) Financial assets, contract assets and finance lease receivables
The Group and the Company recognise loss allowances for expected credit losses on financial assets
measured at amortised cost, debt investments measured at fair value through other comprehensive income,
contract assets and finance lease receivables.
The Group and the Company measure loss allowances on debt securities and cash and cash equivalent at
an amount equal to lifetime expected credit loss, except for debt securities that are determined to have low
credit risk at the reporting date, other debt securities for which credit risk has not increased significantly
since initial recognition and finance lease receivables, which are measured as 12-month expected credit
loss.
2. SIGNIFICANT ACCOUNTING POLICIES (CONTINUED)
2.13 Impairment (continued)
(i) Financial assets, contract assets and finance lease receivables (continued)
Loss allowances for trade receivables and contract assets are always measured at an amount equal to
lifetime expected credit loss.
When determining whether the credit risk of a financial asset has increased significantly since initial
recognition and when estimating expected credit loss, the Group and the Company consider reasonable
and supportable information that is relevant and available without undue cost or effort. These include
both quantitative and qualitative information and analysis, based on the Group’s historical experience and
informed credit assessment and including forward-looking information, where available.
The Group and the Company assume that the credit risk on a financial asset has increased significantly if it
is past due.
The Group and the Company consider a financial asset to be in default when the borrower is unlikely to
pay its credit obligations to the Group in full, without recourse by the Group to actions such as realising
security.
Lifetime expected credit losses are the expected credit losses that result from all possible default events
over the expected life of a financial instrument, while 12-month expected credit losses are the portion
of expected credit losses that result from default events that are possible within the 12 months after the
reporting date.
The maximum period considered when estimating expected credit losses is the maximum contractual
period over which the Group is exposed to credit risk.
An impairment loss in respect of financial assets measured at amortised cost is recognised in profit or loss
and the carrying amount of the asset is reduced through the use of an allowance account.
An impairment loss in respect of debt investments measured at fair value through other comprehensive
income is recognised in profit or loss and the allowance account is recognised in other comprehensive
income.
All financial assets, except for those measured at fair value through profit or loss and equity investments
measured at fair value through other comprehensive income, contract asset and finance lease receivables
are subject to impairment (see Note 2.12(i)).
(ii) Other assets
The carrying amounts of other assets, other than inventories, deferred tax assets and non-current assets or
disposal groups classifies as held for sale, are reviewed at each reporting date to determine whether there
is any indication of impairment.
If any such indication exists, the asset’s recoverable amount is estimated. An impairment loss is recognised
if the carrying amount of an asset or the cash-generating unit to which it belongs exceeds its recoverable
amount. Impairment losses are recognised in the profit or loss.

Petroliam Nasional Berhad (PETRONAS)
Financial Report 2020
40 41
Notes to the Financial Statements31 December 2020
Notes to the Financial Statements31 December 2020
2. SIGNIFICANT ACCOUNTING POLICIES (CONTINUED)
2.13 Impairment (continued)
(ii) Other assets (continued)
A cash-generating unit is the smallest identifiable asset group that generates cash flows from continuing
use that are largely independent from other assets and groups. An impairment loss recognised in respect of
a cash-generating unit is allocated first to reduce the carrying amount of any goodwill allocated to the unit
and then to reduce the carrying amount of the other assets in the unit on a pro-rata basis.
The recoverable amount is the greater of the asset’s fair value less cost to sell and its value-in-use. In
assessing value-in-use, the estimated future cash flows are discounted to their present value using a pre-
tax discount rate that reflects current market assessments of the time value of money and the risks specific
to the asset. For an asset that does not generate largely independent cash inflows, the recoverable amount
is determined for the cash-generating unit to which the asset belongs.
For goodwill and intangible assets that have indefinite useful lives or that are not yet available for use, the
recoverable amount is estimated each period at the same time.
An impairment loss in respect of goodwill is not reversed in the subsequent period. In respect of other
assets, impairment losses are reversed if there has been a change in the estimates used to determine the
recoverable amount. An impairment loss is reversed only to the extent that the asset’s carrying amount does
not exceed the carrying amount that would have been determined, net of depreciation or amortisation, if
no impairment loss had been recognised.
Reversals of impairment losses are credited to the profit or loss in the year in which the reversals are
recognised.
2.14 Cash and cash equivalents
Cash and cash equivalents consist of cash on hand and bank balances, deposits with licensed financial institutions
and highly liquid investments which have an insignificant risk of changes in fair value and are used by the Group
and the Company in the management of their short-term commitments. For the purpose of the statements of
cash flows, cash and cash equivalents are presented net of bank overdrafts and deposits restricted, if any.
2.15 Contract assets and contract liabilities
Contract assets represent the Group’s and the Company’s right to consideration in exchange for goods or services
that the entity has transferred to a customer when that right is conditioned on something other than the passage
of time. Contract assets are subjected to impairment in accordance to MFRS 9 Financial Instruments (see Note
2.13 (i)).
Contract liabilities represent the Group’s and the Company’s obligation to transfer goods or services to a customer
for which the Group and Company have received consideration, or the amount is due from the customer.
2. SIGNIFICANT ACCOUNTING POLICIES (CONTINUED)
2.16 Inventories
Inventories are stated at the lower of cost and net realisable value. Net realisable value is the estimated selling
price in the ordinary course of business, less the estimated costs of completion and the estimated costs necessary
to make the sale.
Cost of crude oil and condensates includes costs of bringing the inventories to their present location and condition
and is determined on a weighted average basis.
Cost of petroleum products includes crude oil costs, export duty, transportation charges and processing costs and
is determined on a weighted average basis.
Cost of liquefied natural gas (“LNG”) and petrochemical products includes raw gas costs and production overheads
and is determined on a weighted average basis.
Cost of material stores and spares consists of the invoiced value from suppliers and import duty charges and is
determined on a weighted average basis.
Cost of developed properties held for sale and properties under development consists of costs associated with
the acquisition of land, all costs that are directly attributable to development activities, appropriate proportions
of common costs attributable to developing the properties, and interest expenses incurred during the period of
active development.
Lifting of offtake arrangements for crude oil and condensate produced in jointly-owned operations are such that
it is not practicable for each participant to receive or sell its precise share of the overall production during the
period. At each reporting date, the extent of underlift is recognised as an asset at the lower of the cost and net
realisable value, while overlift is recognised as a liability. The net movement in underlift and overlift is recognised
in the statement of comprehensive income in cost of revenue.
2.17 Provisions, contingent liabilities and contingent assets
Provisions
A provision is recognised if, as a result of a past event, the Group and the Company have a present legal or
constructive obligation that can be estimated reliably, and it is probable that an outflow of economic benefits
will be required to settle the obligation. Provisions are determined by discounting the expected future net cash
flows at a pre-tax rate that reflects current market assessments of the time value of money and the risks specific
to the liability. Where discounting is used, the accretion in the provision due to the passage of time is recognised
as finance cost.
The amount recognised as a provision is the best estimate of the expenditure required to settle the present
obligation at the reporting date. Provisions are reviewed at each reporting date and adjusted to reflect the current
best estimate.
Petroliam Nasional Berhad (PETRONAS)
Financial Report 2020
42 43
Notes to the Financial Statements31 December 2020
Notes to the Financial Statements31 December 2020
2. SIGNIFICANT ACCOUNTING POLICIES (CONTINUED)
2.17 Provisions, contingent liabilities and contingent assets (continued)
Contingent liabilities
Possible obligations whose existence will only be confirmed by the occurrence or non-occurrence of one or more
future events not wholly within the control of the Group, are not recognised in the financial statements but are
disclosed as contingent liabilities unless the possibility of an outflow of economic resources is considered remote.
Contingent assets
When an inflow of economic benefit of an asset is probable where it arises from past events and where existence
will be confirmed only by the occurrence or non-occurrence of one or more uncertain future events not wholly
within the control of the entity, the asset is not recognised in the statement of financial position but is disclosed as
a contingent asset. When the inflow of economic benefit is virtually certain, then the related asset is recognised.
In particular, information about provisions that have the most significant effect on the amount recognised in the
financial statements is described in Note 23.
2.18 Employee benefits
Short term benefits
Wages and salaries, bonuses and social security contributions are recognised as an expense in the year in which
the associated services are rendered by employees of the Group and the Company.
Defined contribution plans
As required by law, companies in Malaysia make contributions to the state pension scheme, the Employees
Provident Fund (“EPF”).
Some of the Group’s foreign subsidiaries make contributions to their respective countries’ statutory pension
schemes and certain other independently-administered funds which are defined contribution plans.
Such contributions are recognised as an expense in the profit or loss as incurred.
2.19 Taxation
Tax on the profit or loss for the year comprises current and deferred tax. Income tax is recognised in the profit or
loss except to the extent it relates to a business combination or items recognised directly in equity, in which case
it is recognised in equity or other comprehensive income.
Current tax
Current tax expense is the expected tax payable on the taxable income for the year, using the statutory tax rates
at the reporting date, and any adjustment to tax payable in respect of previous years.
2. SIGNIFICANT ACCOUNTING POLICIES (CONTINUED)
2.19 Taxation (continued)
Deferred tax
Deferred tax is provided for, using the liability method, on temporary differences at the reporting date between
the tax bases of assets and liabilities and their carrying amounts in the financial statements. In principle, deferred
tax liabilities are recognised for all taxable temporary differences and deferred tax assets are recognised for all
deductible temporary differences, unabsorbed capital allowances, unused reinvestment allowances, unused
investment tax allowances, unused tax losses and other unused tax credits to the extent that it is probable that
future taxable profit will be available against which the deductible temporary differences, unabsorbed capital
allowances, unused reinvestment allowances, unused investment tax allowances, unused tax losses and other
unused tax credits can be utilised.
Deferred tax is not recognised for the following temporary differences: the initial recognition of goodwill and
the initial recognition of an asset or liability in a transaction which is not a business combination and that affects
neither accounting nor taxable profit or loss.
Deferred tax is measured at the tax rates that are expected to apply in the period when the asset is realised or the
liability is settled, based on the laws that have been enacted or substantively enacted by the end of the reporting
period.
Deferred tax assets and liabilities are offset if there is a legally enforceable right to offset current tax liabilities
and assets, and they relate to income taxes levied by the same tax authority on the same taxable entity, or on
different tax entities where they intend to settle current tax liabilities and assets on a net basis or their tax assets
and liabilities will be realised simultaneously.
Deferred tax asset is reviewed at each reporting date and is reduced to the extent that it is no longer probable that
the future taxable profit will be available against which the related tax benefit can be realised.
2.20 Foreign currency transactions
In preparing the financial statements of individual entities in the Group, transactions in currencies other than the
entity’s functional currency (foreign currencies) are translated to the functional currencies at rates of exchange
ruling on the transaction dates.
Monetary assets and liabilities denominated in foreign currencies at the reporting date have been retranslated to
the functional currency at rates ruling on the reporting date.
Non-monetary assets and liabilities denominated in foreign currencies, which are measured at fair value, are
retranslated to the functional currency at the foreign exchange rates ruling at the date when the fair value was
determined. Non-monetary items that are measured in terms of historical cost in foreign currency are not
retranslated.
Gains and losses on exchange arising from retranslation are recognised in the profit or loss, except for differences
arising on the retranslation of equity instruments at FVOCI, which are recognised in equity and are never reclassified
to profit or loss.

Petroliam Nasional Berhad (PETRONAS)
Financial Report 2020
44 45
Notes to the Financial Statements31 December 2020
Notes to the Financial Statements31 December 2020
2. SIGNIFICANT ACCOUNTING POLICIES (CONTINUED)
2.20 Foreign currency transactions (continued)
On consolidation, the assets and liabilities of subsidiaries with functional currencies other than Ringgit Malaysia,
are translated into Ringgit Malaysia at the exchange rates ruling at reporting date, except for goodwill and fair
value adjustments arising from business combinations before 1 April 2011 which are treated as assets and liabilities
of the acquirer company pursuant to the adoption of MFRS framework.
The income and expenses are translated at the exchange rates at the dates of the transactions or an average rate
that approximates those rates. Foreign currency differences are recognised in other comprehensive income and
accumulated in the foreign currency translation reserve within equity.
In the consolidated financial statements, when settlement of a monetary item receivable from or payable to the
Group’s foreign operation is neither planned nor likely in the foreseeable future, foreign exchange gains and losses
arising from such a monetary item are considered to form part of the net investment in a foreign operation and
are reclassified to other comprehensive income and accumulated under foreign currency translation reserve in
equity. Upon disposal of the investment, the cumulative exchange differences previously recorded in equity are
reclassified to the consolidated profit or loss.
2.21 Borrowing costs and foreign currency exchange differences relating to projects-in-progress
Borrowing costs which are directly attributable to the acquisition, construction or production of qualifying assets,
which are assets that necessarily take a substantial period of time to be prepared for their intended use or sale, are
capitalised as part of the cost of those assets.
The capitalisation of borrowing costs as part of the cost of a qualifying asset commences when expenditure
for the assets is being incurred, borrowing costs are being incurred and activities that are necessary to prepare
the asset for its intended use or sale are in progress. Capitalisation of borrowing costs ceases when all activities
necessary to prepare the qualifying asset for its intended use or sale are completed.
Exchange differences arising from foreign currency borrowings, although regarded as an adjustment to borrowing
costs, are not capitalised but instead recognised in the profit or loss in the period in which they arise.
The capitalisation rate used to determine the amount of borrowing costs eligible for capitalisation is the weighted
average of borrowings that are outstanding during the year, other than borrowings made specifically for the
purpose of financing a specific qualifying asset, in which the actual borrowing cost incurred on that borrowing
less any investment income on the temporary investment of that borrowings, will be capitalised. Borrowing costs
incurred subsequently to the completion of a specific qualifying asset are included in the determination of the
capitalisation rate.
2.22 Revenue
Revenue from contract with customers is measured based on the consideration specified in a contract with a
customer and excludes amounts collected on behalf of third parties. The Group or the Company recognises
revenue when or as it transfers control over a product or service to customer. An asset is transferred when (or as)
the customer obtains control of the asset.
2. SIGNIFICANT ACCOUNTING POLICIES (CONTINUED)
2.22 Revenue (continued)
An entity transfers control of a good or service over time and, therefore, satisfies a performance obligation and
recognises revenue over time, if one of the following criteria is met:
(a) the customer simultaneously receives and consumes the benefits provided by the entity’s performance as
the entity performs;
(b) the entity’s performance creates or enhances an asset (for example, work-in-progress) that the customer
controls as the asset is created or enhanced; or
(c) the entity’s performance does not create an asset with an alternative use to the entity and the entity has an
enforceable right to payment for performance completed to date.
If a performance obligation is not satisfied over time in accordance with the above criteria, an entity satisfies the
performance obligation and recognises revenue at a point in time.
Revenue arising from shipping activities is mainly from freight income and charter income. Freight income and the
relevant discharged costs of cargoes loaded onto vessels up to the reporting date are accrued for in the profit or
loss based on percentage of completion method. Charter income is accrued on time accrual basis.
Revenue arising from rental income of investment properties is recognised on a straight-line basis over the term
of the lease under the lease arrangement per Note 2.7.
Revenue arising from assets yielding interest is recognised on a time proportion basis that takes into account the
effective yield on the assets.
Revenue arising from investments yielding dividend is recognised when the shareholders’ right to receive payment
is established.
Revenue arising from gas trading activities, where forward and future sale and purchase contracts for gas have
been determined to be for trading purposes, the associated sales and purchases are reported net within sales.
2.23 Financing costs
Financing costs comprise interest payable on borrowings and profit sharing margin on Islamic Financing Facilities,
as well as accretion in provision due to the passage of time.
All interest and other costs incurred in connection with borrowings are expensed as incurred, other than that
capitalised in accordance with the accounting policy stated in Note 2.21. The interest component of finance lease
payments is accounted for in accordance with the policy set out in Note 2.7.
2.24 Operating segments
An operating segment is a component of the Group and the Company that engages in business activities from
which it may earn revenues and incur expenses, including revenues and expenses that relate to transactions with
any of the Group’s and the Company’s other components, and for which discrete financial information is available.
An operating segment’s operating results are reviewed regularly by the chief operating decision maker, which in
this case is the PETRONAS Executive Leadership Team, to make decisions about resources to be allocated to the
segment and to assess its performance.

Petroliam Nasional Berhad (PETRONAS)
Financial Report 2020
46 47
Notes to the Financial Statements31 December 2020
Notes to the Financial Statements31 December 2020
2. SIGNIFICANT ACCOUNTING POLICIES (CONTINUED)
2.25 Fair value measurement
Fair value of an asset or a liability, except for lease transactions, is determined as the price that would be received to
sell an asset or paid to transfer a liability in an orderly transaction between market participants at the measurement
date. The measurement assumes that the transaction to sell the asset or transfer the liability takes place either in
the principal market or in the absence of a principal market, in the most advantageous market.
(i) Financial instruments
The fair value of financial instruments that are actively traded in organised financial markets are determined
by reference to quoted market prices at the close of business at the end of reporting date. For financial
instruments where there is no active market, fair value is determined using valuation techniques. Such
techniques may include using recent arm’s length market transactions; reference to the current fair value of
another instrument that is substantially the same; discounted cash flow analysis or other valuation models.
(ii) Non-financial assets
For non-financial assets, the fair value measurement takes into account a market participant’s ability to
generate economic benefits by using the asset in its highest and best use or by selling it to another market
participant that would use the asset in its highest and best use.
When measuring the fair value of an asset or a liability, the Group and the Company use observable market data
as far as possible. Fair value are categorised into different levels in a fair value hierarchy based on the input used
in the valuation technique as follows:
• Level 1 - Quoted prices (unadjusted) in active markets for identifiable assets or liabilities.
• Level 2 - Inputs other than quoted prices included within Level 1 that are observable for the asset or liability,
either directly (i.e. as prices) or indirectly (i.e. derived from prices).
• Level 3 - Inputs for the asset or liability that are not based on observable market data (unobservable input).
The fair value of an asset to be transferred between levels is determined as of the date of the event or change in
circumstances that caused the transfer.
The Group and the Company recognise transfers between levels of the fair value hierarchy as of the date of the
event or change in circumstances that caused the transfers.
2.26 Government grants
Government grants related to assets, including non-monetary grants at fair value, are deducted against the
construction cost of the assets. Subsequently, the grants are recognised in profit or loss on a systematic basis over
the life of the asset as a reduced depreciation expense.
3. PROPERTY, PLANT AND EQUIPMENT
Group
2020
In RM Mil
At
1.1.2020 Additions
Disposals/
write-offs
Acquisition/
(Disposal) of
subsidiaries
At cost:
Own use
Freehold land 2,693 6 - -
Oil and gas properties 351,674 4,163 (1,013) -
Buildings 20,175 742 (34) (2)
Plant and equipment 158,097 560 (849) (837)
Office equipment, furniture and fittings 3,969 86 (157) -
Computer software and hardware 4,555 92 (219) -
Motor vehicles 474 26 (27) -
Vessels 11,591 144 (159) -
Projects-in-progress
- oil and gas properties 28,483 9,113 (279) -
- other projects 52,447 16,298 (476) -
634,158 31,230 (3,213) (839)
Lease to others as operating lease
Buildings 25 - - -
Vessels 31,268 260 (783) -
Plant and equipment 18 4 - -
31,311 264 (783) -
Right-of-use
Leasehold land 9,335 75 (111) 59
Lease properties 1,278 13 - -
Oil and gas properties 4,600 167 - -
Buildings 930 123 (15) -
Plant and equipment 4,138 313 (15) -
Office equipment, furniture and fittings 2 - - -
Computer software and hardware 19 10 (1) -
Motor vehicles 132 20 (9) -
Vessels 4,616 1,572 (231) -
25,050 2,293 (382) 59
690,519 a33,787 (4,378) (780)
continue to next page
a Includes addition to future cost of decommissioning of certain property, plant and equipment amounting to RM1,410 million.

Petroliam Nasional Berhad (PETRONAS)
Financial Report 2020
48 49
Notes to the Financial Statements31 December 2020
Notes to the Financial Statements31 December 2020
3. PROPERTY, PLANT AND EQUIPMENT (CONTINUED)
Group
2020
In RM Mil
Transfers/
reclass/
adjustments
Translation
exchange
difference
At
31.12.2020
At cost:
Own use
Freehold land - (2) 2,697
Oil and gas properties 13,695 1,038 369,557
Buildings 1,621 (16) 22,486
Plant and equipment 14,254 (2,307) 168,918
Office equipment, furniture and fittings 200 (22) 4,076
Computer software and hardware 497 (50) 4,875
Motor vehicles (3) (10) 460
Vessels - (905) 10,671
Projects-in-progress
- oil and gas properties (11,209) (55) 26,053
- other projects (20,283) (533) 47,453
(1,228) (2,862) 657,246
Lease to others as operating lease
Buildings - - 25
Vessels 3,185 (416) 33,514
Plant and equipment - - 22
3,185 (416) 33,561
Right-of-use
Leasehold land 732 (71) 10,019
Lease properties (728) 2 565
Oil and gas properties (72) (53) 4,642
Buildings - (5) 1,033
Plant and equipment - (116) 4,320
Office equipment, furniture and fittings - (2) -
Computer software and hardware - - 28
Motor vehicles (1) (2) 140
Vessels - (449) 5,508
(69) (696) 26,255a,b,c1,888 (3,974) 717,062
continued from previous page
a Includes revision to future cost of decommissioning of oil and gas properties amounting to RM2,670 million.
b Includes net transfers out of RM950 million comprising transfers to assets held for sale of RM508 million, other receivables of RM751 million and
transfer in from intangible assets of RM309 million.
c Includes reclassification of certain asset from accumulated depreciation to cost of RM168 million.
3. PROPERTY, PLANT AND EQUIPMENT (CONTINUED)
Group
2020
In RM Mil
At
1.1.2020
Charge for
the year
Disposals/
write-offs
Acquisition/
(Disposal) of
subsidiaries
Accumulated depreciation and impairment
losses:
Own use
Freehold land - - - -
Oil and gas properties 239,485 20,795 (1,013) -
Buildings 8,252 621 (29) (2)
Plant and equipment 90,152 7,452 (782) (794)
Office equipment, furniture and fittings 2,798 287 (143) -
Computer software and hardware 3,619 461 (216) -
Motor vehicles 330 29 (25) -
Vessels 1,277 869 (146) -
Projects-in-progress
- oil and gas properties 130 - - -
- other projects 18 - - -
346,061 30,514 (2,354) (796)
Lease to others as operating lease
Buildings - 1 - -
Vessels 18,786 1,207 (573) -
Plant and equipment - 2 - -
18,786 1,210 (573) -
Right-of-use
Leasehold land 1,494 369 (14) 3
Lease properties 540 (144) - -
Oil and gas properties 1,565 909 - -
Buildings 175 128 (13) -
Plant and equipment 1,957 371 (4) -
Office equipment, furniture and fittings 1 - - -
Computer software and hardware 7 10 - -
Motor vehicles 46 32 (9) -
Vessels 683 912 (205) -
6,468 2,587 (245) 3
371,315 34,311 (3,172) (793)
continue to next page

Petroliam Nasional Berhad (PETRONAS)
Financial Report 2020
50 51
Notes to the Financial Statements31 December 2020
Notes to the Financial Statements31 December 2020
3. PROPERTY, PLANT AND EQUIPMENT (CONTINUED)
Group
2020
In RM Mil
Impairment
loss/(write-
back)
Transfers/
reclass/
adjustments
Translation
exchange
difference
At
31.12.2020
Accumulated depreciation and impairment
losses:
Own use
Freehold land - - - -
Oil and gas properties 11,126 447 975 271,815
Buildings 638 (36) (6) 9,438
Plant and equipment 6,316 (32) (1,702) 100,610
Office equipment, furniture and fittings 3 (3) (46) 2,896
Computer software and hardware 6 - (46) 3,824
Motor vehicles 1 (4) (6) 325
Vessels 179 - (135) 2,044
Projects-in-progress
- oil and gas properties 1,935 (97) (101) 1,867
- other projects 5,246 - (182) 5,082
25,450 275 (1,249) 397,901
Lease to others as operating lease
Buildings - - - 1
Vessels 20 (389) (199) 18,852
Plant and equipment - - - 2
20 (389) (199) 18,855
Right-of-use
Leasehold land - 318 (4) 2,166
Lease properties 25 (235) 2 188
Oil and gas properties - - (116) 2,358
Buildings 202 31 (15) 508
Plant and equipment - - (87) 2,237
Office equipment, furniture and fittings - (1) - -
Computer software and hardware 5 - - 22
Motor vehicles - 2 - 71
Vessels - (222) (129) 1,039
232 (107) (349) 8,589
25,702 a,b(221) (1,797) 425,345
continued from previous page
a Includes transfer out to asset held for sale of RM389 million.
b Includes reclassification of certain asset from accumulated depreciation to cost of RM168 million.
3. PROPERTY, PLANT AND EQUIPMENT (CONTINUED)
Group
2019
In RM Mil
At
1.1.2019 Additions
Disposals/
write-offs
Acquisition/
(Disposal) of
subsidiaries
At cost:
Own use
Freehold land 2,620 33 (4) -
Oil and gas properties 338,940 7,210 (3,285) -
Buildings 19,542 128 (106) 50
Plant and equipment 152,647 1,020 (1,034) 682
Office equipment, furniture and fittings 3,615 80 (99) 36
Computer software and hardware 4,200 152 (68) 3
Motor vehicles 468 25 (47) -
Vessels 11,267 16 - -
Projects-in-progress
- oil and gas properties 25,794 11,644 (458) -
- other projects 43,798 19,322 (153) 60
602,891 39,630 (5,254) 831
Lease to others as operating lease
Buildings - 25 - -
Vessels 32,572 342 (455) -
Plant and equipment - 18 - -
32,572 385 (455) -
Right-of-use
Leasehold land 9,373 43 (23) 85
Lease properties 1,256 21 - -
Oil and gas properties 3,757 850 - -
Buildings 959 60 (9) (84)
Plant and equipment 3,706 441 (2) -
Office equipment, furniture and fittings 2 - - -
Computer software and hardware 8 11 - -
Motor vehicles 76 59 (2) -
Vessels 1,231 3,660 (134) -
20,368 5,145 (170) 1
655,831 45,160 (5,879) 832
continue to next page

Petroliam Nasional Berhad (PETRONAS)
Financial Report 2020
52 53
Notes to the Financial Statements31 December 2020
Notes to the Financial Statements31 December 2020
3. PROPERTY, PLANT AND EQUIPMENT (CONTINUED)
Group
2019
In RM Mil
Transfers/
reclass/
adjustments
Translation
exchange
difference
At
31.12.2019
At cost:
Own use
Freehold land 47 (3) 2,693
Oil and gas properties 10,020 (1,211) 351,674
Buildings 580 (19) 20,175
Plant and equipment 5,692 (910) 158,097
Office equipment, furniture and fittings 342 (5) 3,969
Computer software and hardware 241 27 4,555
Motor vehicles 27 1 474
Vessels 614 (306) 11,591
Projects-in-progress
- oil and gas properties (8,403) (94) 28,483
- other projects (9,942) (638) 52,447
(782) (3,158) 634,158
Lease to others as operating lease
Buildings - - 25
Vessels (899) (292) 31,268
Plant and equipment - - 18
(899) (292) 31,311
Right-of-use
Leasehold land (132) (11) 9,335
Lease properties 3 (2) 1,278
Oil and gas properties 203 (210) 4,600
Buildings - 4 930
Plant and equipment - (7) 4,138
Office equipment, furniture and fittings - - 2
Computer software and hardware - - 19
Motor vehicles - (1) 132
Vessels - (141) 4,616
74 (368) 25,050a,b,c(1,607) (3,818) 690,519
continued from previous page
a Includes revision to future cost of decommissioning of oil and gas properties amounting to RM2,507 million.
b Includes net transfers out of RM4,079 million comprising transfers to assets held for sale of RM1,671 million, inventories of RM93 million, other
receivables of RM2,846 million and transfer in from intangible assets of RM531 million.
c Includes reclassification of certain asset from cost to accumulated depreciation of RM35 million.
3. PROPERTY, PLANT AND EQUIPMENT (CONTINUED)
Group
2019
In RM Mil
At
1.1.2019
Charge for
the year
Disposals/
write-offs
Acquisition/
(Disposal) of
subsidiaries
Accumulated depreciation and impairment
losses:
Own use
Freehold land - - - -
Oil and gas properties 216,878 22,856 (3,481) -
Buildings 7,466 521 (49) 13
Plant and equipment 80,680 6,723 (827) 68
Office equipment, furniture and fittings 2,577 310 (87) 19
Computer software and hardware 3,277 394 (59) 2
Motor vehicles 333 34 (41) (2)
Vessels 1,277 - - -
Projects-in-progress
- oil and gas properties 2,532 - - -
- other projects 11 13 - -
315,031 30,851 (4,544) 100
Lease to others as operating lease
Vessels 18,520 1,979 (370) -
Right-of-use
Leasehold land 1,340 170 (15) 3
Lease properties 567 43 - 1
Oil and gas properties 217 1,213 - -
Buildings 102 74 - 1
Plant and equipment 1,518 444 (2) -
Office equipment, furniture and fittings - 1 - -
Computer software and hardware - 7 - -
Motor vehicles 17 31 (1) -
Vessels - 696 (55) -
3,761 2,679 (73) 5
337,312 35,509 (4,987) 105
continue to next page

Petroliam Nasional Berhad (PETRONAS)
Financial Report 2020
54 55
Notes to the Financial Statements31 December 2020
Notes to the Financial Statements31 December 2020
3. PROPERTY, PLANT AND EQUIPMENT (CONTINUED)
Group
2019
In RM Mil
Impairment
loss/(write-
back)
Transfers/
reclass/
adjustments
Translation
exchange
difference
At
31.12.2019
Accumulated depreciation and impairment
losses:
Own use
Freehold land - - - -
Oil and gas properties 4,731 89 (1,588) 239,485
Buildings 131 179 (9) 8,252
Plant and equipment 3,792 121 (405) 90,152
Office equipment, furniture and fittings - (17) (4) 2,798
Computer software and hardware 6 (18) 17 3,619
Motor vehicles 1 4 1 330
Vessels - - - 1,277
Projects-in-progress
- oil and gas properties (2,332) (50) (20) 130
- other projects 1 - (7) 18
6,330 308 (2,015) 346,061
Lease to others as operating lease
Vessels 148 (1,151) (340) 18,786
Right-of-use
Leasehold land - (3) (1) 1,494
Lease properties - (69) (2) 540
Oil and gas properties - 125 10 1,565
Buildings - - (2) 175
Plant and equipment - - (3) 1,957
Office equipment, furniture and fittings - - - 1
Computer software and hardware - - - 7
Motor vehicles - - (1) 46
Vessels 61 - (19) 683
61 53 (18) 6,468
6,539 a,b(790) (2,373) 371,315
continued from previous page
a Includes reclassification of certain asset from cost to accumulated depreciation of RM35 million.
b Includes net transfers out of RM755 million comprising transfers to assets held for sale of RM760 million and other receivables of RM9 million and
transfer in from intangible assets of RM14 million.
3. PROPERTY, PLANT AND EQUIPMENT (CONTINUED)
Company
2020
In RM Mil
At
1.1.2020 Additions
Disposals/
write-offs
At cost:
Own use
Oil and gas properties 29,221 126 (370)
Buildings 277 - -
Plant and equipment 4 - -
Office equipment, furniture and fittings 87 - -
Computer software and hardware 439 - -
Motor vehicles 15 1 (1)
Projects-in-progress
- oil and gas properties 265 131 -
- other projects 1,091 217 -
31,399 475 (371)
Right-of-use
Leasehold land 322 27 -
Lease properties 2,962 3,611 -
Plant and equipment 1,485 - -
Vessels - - -
4,769 3,638 -
36,168 a4,113 (371)
continue to next page
a Includes addition to future cost of decommissioning of certain property, plant and equipment amounting to RM17 million.

Petroliam Nasional Berhad (PETRONAS)
Financial Report 2020
56 57
Notes to the Financial Statements31 December 2020
Notes to the Financial Statements31 December 2020
3. PROPERTY, PLANT AND EQUIPMENT (CONTINUED)
Company
2020
In RM Mil
Transfers/
reclass/
adjustments
At
31.12.2020
At cost:
Own use
Oil and gas properties 2,126 31,103
Buildings - 277
Plant and equipment 8 12
Office equipment, furniture and fittings - 87
Computer software and hardware 32 471
Motor vehicles - 15
Projects-in-progress
- oil and gas properties (117) 279
- other projects (312) 996
1,737 33,240
Right-of-use
Leasehold land - 349
Lease properties - 6,573
Plant and equipment - 1,485
Vessels - -
- 8,407a,b1,737 41,647
continued from previous page
a Includes revision to future cost of decommissioning of oil and gas properties amounting to RM2,126 million.
b Includes net transfers out of RM389 million comprising transfer to subsidiaries of RM273 million, transfer to intangible assets of RM66 million and
reclassification to profit or loss of RM50 million.
3. PROPERTY, PLANT AND EQUIPMENT (CONTINUED)
Company
2020
In RM Mil
At
1.1.2020
Charge for
the year Impairment
Accumulated depreciation and impairment losses:
Own use
Oil and gas properties 16,738 1,484 2,092
Buildings 46 6 -
Plant and equipment 4 1 -
Office equipment, furniture and fittings 82 1 -
Computer software and hardware 342 45 -
Motor vehicles 13 1 -
Projects-in-progress
- oil and gas properties - - -
- other projects - - -
17,225 1,538 2,092
Right-of-use
Leasehold land 30 6 -
Lease properties 428 352 -
Plant and equipment 729 218 -
Vessels - - -
1,187 576 -
18,412 2,114 2,092
continue to next page

Petroliam Nasional Berhad (PETRONAS)
Financial Report 2020
58 59
Notes to the Financial Statements31 December 2020
Notes to the Financial Statements31 December 2020
3. PROPERTY, PLANT AND EQUIPMENT (CONTINUED)
Company
2020
In RM Mil
Disposals/
write-offs
At
31.12.2020
Accumulated depreciation and impairment losses:
Own use
Oil and gas properties (370) 19,944
Buildings - 52
Plant and equipment - 5
Office equipment, furniture and fittings - 83
Computer software and hardware - 387
Motor vehicles (1) 13
Projects-in-progress
- oil and gas properties - -
- other projects - -
(371) 20,484
Right-of-use
Leasehold land - 36
Lease properties - 780
Plant and equipment - 947
Vessels - -
- 1,763
(371) 22,247
continued from previous page
3. PROPERTY, PLANT AND EQUIPMENT (CONTINUED)
Company
2019
In RM Mil
At
1.1.2019 Additions
Disposals/
write-offs
At cost:
Own use
Oil and gas properties 28,119 40 -
Buildings 207 1 -
Plant and equipment 4 - -
Office equipment, furniture and fittings 95 - (8)
Computer software and hardware 397 - (22)
Motor vehicles 18 1 (4)
Projects-in-progress
- oil and gas properties 174 106 -
- other projects 778 833 -
29,792 981 (34)
Right-of-use
Leasehold land 299 29 (4)
Lease properties 2,855 107 -
Plant and equipment 1,485 - -
Vessels 4,974 - (4,974)
9,613 136 (4,978)
39,405 1,117 (5,012)
continue to next page
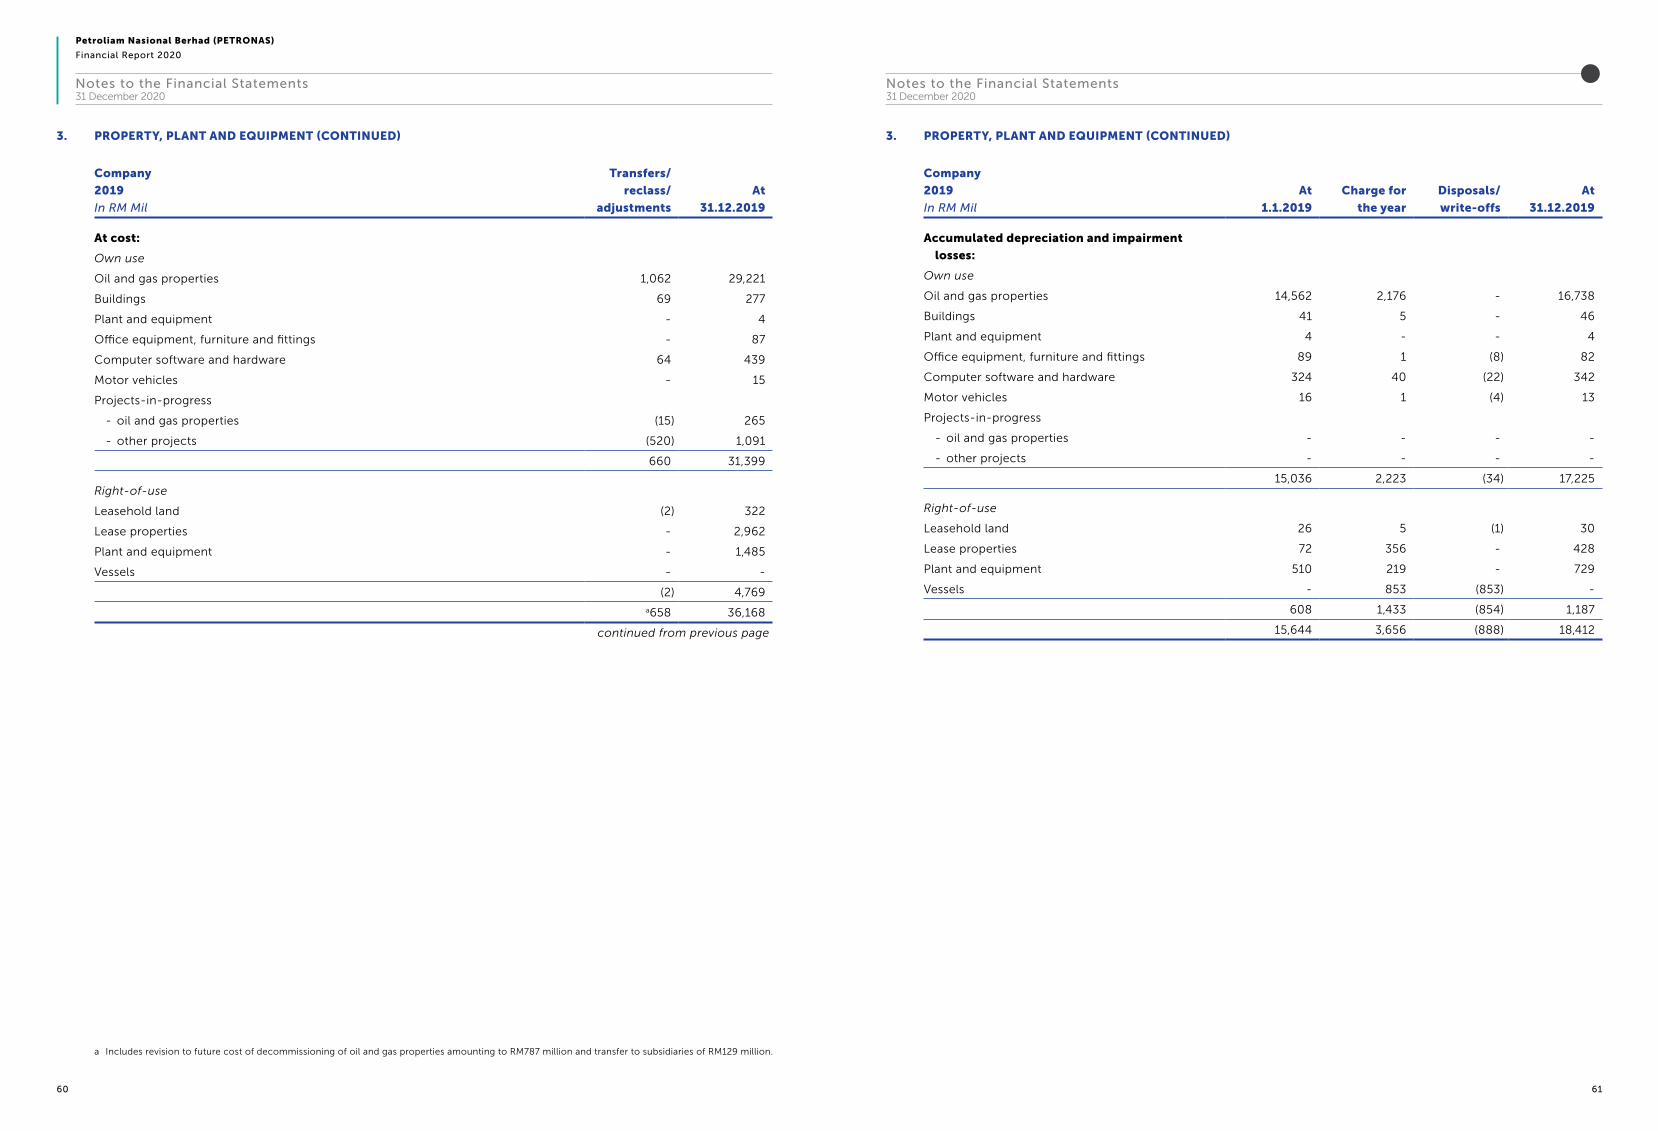
Petroliam Nasional Berhad (PETRONAS)
Financial Report 2020
60 61
Notes to the Financial Statements31 December 2020
Notes to the Financial Statements31 December 2020
3. PROPERTY, PLANT AND EQUIPMENT (CONTINUED)
Company
2019
In RM Mil
Transfers/
reclass/
adjustments
At
31.12.2019
At cost:
Own use
Oil and gas properties 1,062 29,221
Buildings 69 277
Plant and equipment - 4
Office equipment, furniture and fittings - 87
Computer software and hardware 64 439
Motor vehicles - 15
Projects-in-progress
- oil and gas properties (15) 265
- other projects (520) 1,091
660 31,399
Right-of-use
Leasehold land (2) 322
Lease properties - 2,962
Plant and equipment - 1,485
Vessels - -
(2) 4,769a658 36,168
continued from previous page
a Includes revision to future cost of decommissioning of oil and gas properties amounting to RM787 million and transfer to subsidiaries of RM129 million.
3. PROPERTY, PLANT AND EQUIPMENT (CONTINUED)
Company
2019
In RM Mil
At
1.1.2019
Charge for
the year
Disposals/
write-offs
At
31.12.2019
Accumulated depreciation and impairment
losses:
Own use
Oil and gas properties 14,562 2,176 - 16,738
Buildings 41 5 - 46
Plant and equipment 4 - - 4
Office equipment, furniture and fittings 89 1 (8) 82
Computer software and hardware 324 40 (22) 342
Motor vehicles 16 1 (4) 13
Projects-in-progress
- oil and gas properties - - - -
- other projects - - - -
15,036 2,223 (34) 17,225
Right-of-use
Leasehold land 26 5 (1) 30
Lease properties 72 356 - 428
Plant and equipment 510 219 - 729
Vessels - 853 (853) -
608 1,433 (854) 1,187
15,644 3,656 (888) 18,412

Petroliam Nasional Berhad (PETRONAS)
Financial Report 2020
62 63
Notes to the Financial Statements31 December 2020
Notes to the Financial Statements31 December 2020
3. PROPERTY, PLANT AND EQUIPMENT (CONTINUED)
In RM Mil Group Company
Carrying amount 2020 2019 2020 2019
Own use
Freehold land 2,697 2,693 - -
Oil and gas properties 97,742 112,189 11,159 12,483
Buildings 13,048 11,923 225 231
Plant and equipment 68,308 67,945 7 -
Office equipment, furniture and fittings 1,180 1,171 4 5
Computer software and hardware 1,051 936 84 97
Motor vehicles 135 144 2 2
Vessels 8,627 10,314 - -
Projects-in-progress
- oil and gas properties 24,186 28,353 279 265
- other projects 42,371 52,429 996 1,091
259,345 288,097 12,756 14,174
Leased to others as operating lease
Buildings 24 25 - -
Vessels 14,662 12,482 - -
Plant and equipment 20 18 - -
14,706 12,525 - -
Right-of-use
Leasehold land 7,853 7,841 313 292
Lease properties 377 738 5,793 2,534
Oil and gas properties 2,284 3,035 - -
Buildings 525 755 - -
Plant and equipment 2,083 2,181 538 756
Office equipment, furniture and fittings - 1 - -
Computer software and hardware 6 12 - -
Motor vehicles 69 86 - -
Vessels 4,469 3,933 - -
17,666 18,582 6,644 3,582
291,717 319,204 19,400 17,756
3. PROPERTY, PLANT AND EQUIPMENT (CONTINUED)
3.1 As a lessee
Right-of-use assets
Depreciation of right-of-use assets
In RM Mil
Group Company
2020 2019 2020 2019
Capitalised in property, plant and equipment 162 202 - -
Recognised in profit or loss 2,425 2,477 576 1,433
Total depreciation 2,587 2,679 576 1,433
Extension options
Some lease contracts contain extension options exercisable only by the Group and the Company before the
end of the non-cancellable contract period. Where practicable, the Group and the Company include extension
options in lease contracts to provide operational flexibility. The discounted potential future lease payments arising
from exercisable extension options has been included in the lease liabilities except for when the extension terms
are uncertain as the Group is finalising the extension terms as at reporting date.
Significant judgments and assumptions in relation to leases
The Group and the Company assess at lease commencement by applying significant judgment whether it is
reasonably certain to exercise the extension options. The Group and the Company consider all facts and
circumstances including their past practice and any cost that will be incurred to change the asset if an option to
extend is not taken, to help them determine the lease term.
The Group and the Company also applied judgment and assumptions in determining the incremental borrowing
rate of the respective leases. The Group and the Company first determine the closest available borrowing rates
before using significant judgment to determine the adjustments required to reflect the term, security, value or
economic environment of the respective leases.
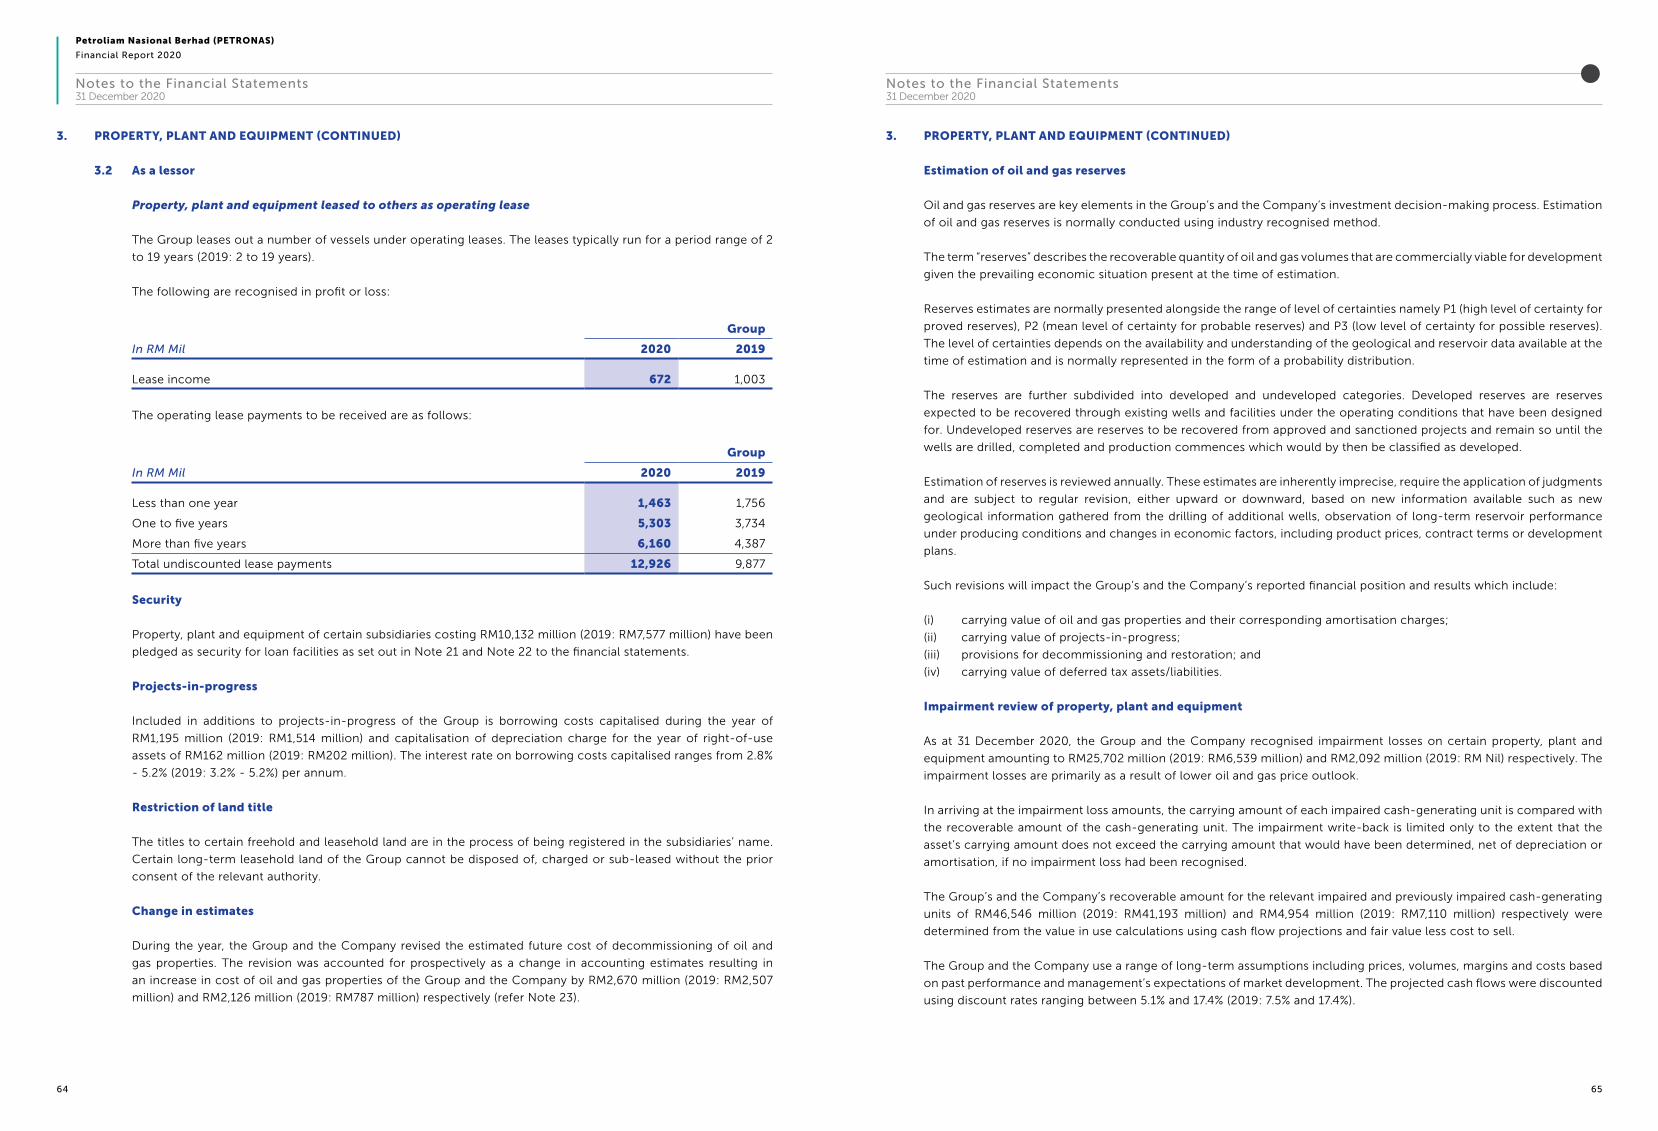
Petroliam Nasional Berhad (PETRONAS)
Financial Report 2020
64 65
Notes to the Financial Statements31 December 2020
Notes to the Financial Statements31 December 2020
3. PROPERTY, PLANT AND EQUIPMENT (CONTINUED)
3.2 As a lessor
Property, plant and equipment leased to others as operating lease
The Group leases out a number of vessels under operating leases. The leases typically run for a period range of 2
to 19 years (2019: 2 to 19 years).
The following are recognised in profit or loss:
In RM Mil
Group
2020 2019
Lease income 672 1,003
The operating lease payments to be received are as follows:
In RM Mil
Group
2020 2019
Less than one year 1,463 1,756
One to five years 5,303 3,734
More than five years 6,160 4,387
Total undiscounted lease payments 12,926 9,877
Security
Property, plant and equipment of certain subsidiaries costing RM10,132 million (2019: RM7,577 million) have been
pledged as security for loan facilities as set out in Note 21 and Note 22 to the financial statements.
Projects-in-progress
Included in additions to projects-in-progress of the Group is borrowing costs capitalised during the year of
RM1,195 million (2019: RM1,514 million) and capitalisation of depreciation charge for the year of right-of-use
assets of RM162 million (2019: RM202 million). The interest rate on borrowing costs capitalised ranges from 2.8%
- 5.2% (2019: 3.2% - 5.2%) per annum.
Restriction of land title
The titles to certain freehold and leasehold land are in the process of being registered in the subsidiaries’ name.
Certain long-term leasehold land of the Group cannot be disposed of, charged or sub-leased without the prior
consent of the relevant authority.
Change in estimates
During the year, the Group and the Company revised the estimated future cost of decommissioning of oil and
gas properties. The revision was accounted for prospectively as a change in accounting estimates resulting in
an increase in cost of oil and gas properties of the Group and the Company by RM2,670 million (2019: RM2,507
million) and RM2,126 million (2019: RM787 million) respectively (refer Note 23).
3. PROPERTY, PLANT AND EQUIPMENT (CONTINUED)
Estimation of oil and gas reserves
Oil and gas reserves are key elements in the Group’s and the Company’s investment decision-making process. Estimation
of oil and gas reserves is normally conducted using industry recognised method.
The term “reserves” describes the recoverable quantity of oil and gas volumes that are commercially viable for development
given the prevailing economic situation present at the time of estimation.
Reserves estimates are normally presented alongside the range of level of certainties namely P1 (high level of certainty for
proved reserves), P2 (mean level of certainty for probable reserves) and P3 (low level of certainty for possible reserves).
The level of certainties depends on the availability and understanding of the geological and reservoir data available at the
time of estimation and is normally represented in the form of a probability distribution.
The reserves are further subdivided into developed and undeveloped categories. Developed reserves are reserves
expected to be recovered through existing wells and facilities under the operating conditions that have been designed
for. Undeveloped reserves are reserves to be recovered from approved and sanctioned projects and remain so until the
wells are drilled, completed and production commences which would by then be classified as developed.
Estimation of reserves is reviewed annually. These estimates are inherently imprecise, require the application of judgments
and are subject to regular revision, either upward or downward, based on new information available such as new
geological information gathered from the drilling of additional wells, observation of long-term reservoir performance
under producing conditions and changes in economic factors, including product prices, contract terms or development
plans.
Such revisions will impact the Group’s and the Company’s reported financial position and results which include:
(i) carrying value of oil and gas properties and their corresponding amortisation charges;
(ii) carrying value of projects-in-progress;
(iii) provisions for decommissioning and restoration; and
(iv) carrying value of deferred tax assets/liabilities.
Impairment review of property, plant and equipment
As at 31 December 2020, the Group and the Company recognised impairment losses on certain property, plant and
equipment amounting to RM25,702 million (2019: RM6,539 million) and RM2,092 million (2019: RM Nil) respectively. The
impairment losses are primarily as a result of lower oil and gas price outlook.
In arriving at the impairment loss amounts, the carrying amount of each impaired cash-generating unit is compared with
the recoverable amount of the cash-generating unit. The impairment write-back is limited only to the extent that the
asset’s carrying amount does not exceed the carrying amount that would have been determined, net of depreciation or
amortisation, if no impairment loss had been recognised.
The Group’s and the Company’s recoverable amount for the relevant impaired and previously impaired cash-generating
units of RM46,546 million (2019: RM41,193 million) and RM4,954 million (2019: RM7,110 million) respectively were
determined from the value in use calculations using cash flow projections and fair value less cost to sell.
The Group and the Company use a range of long-term assumptions including prices, volumes, margins and costs based
on past performance and management’s expectations of market development. The projected cash flows were discounted
using discount rates ranging between 5.1% and 17.4% (2019: 7.5% and 17.4%).

Petroliam Nasional Berhad (PETRONAS)
Financial Report 2020
66 67
Notes to the Financial Statements31 December 2020
Notes to the Financial Statements31 December 2020
4. INVESTMENT PROPERTIES
Group
2020
In RM Mil
At
1.1.2020 Additions Disposals
At cost:
Freehold land 1,470 - -
Leasehold land - - -
Buildings 13,642 13 (2)
Projects-in-progress 443 101 (1)
15,555 114 (3)
continue to next page
At
1.1.2020
Charge for
the year Disposals
Impairment
loss
Accumulated depreciation and impairment losses:
Buildings 6,841 431 (2) 12
continue to next page
Group
2019
In RM Mil
At
1.1.2019 Additions
At cost:
Freehold land 1,440 30
Buildings 13,599 42
Projects-in-progress 211 232
15,250 304
continue to next page
At
1.1.2019
Charge for
the year
Accumulated depreciation and impairment losses:
Buildings 6,286 593
continue to next page
4. INVESTMENT PROPERTIES (CONTINUED)
Group
2020
In RM Mil
Acquisition
of a
subsidiary
Translation
exchange
difference
At
31.12.2020
At cost:
Freehold land - (1) 1,469
Leasehold land 990 - 990
Buildings - (65) 13,588
Projects-in-progress 1,127 - 1,670
2,117 (66) 17,717
continued from previous page
Acquisition
of a
subsidiary
Translation
exchange
difference
At
31.12.2020
Accumulated depreciation and impairment losses:
Buildings - (33) 7,249
continued from previous page
Group
2019
In RM Mil
Transfers/
reclass
Translation
exchange
difference
At
31.12.2019
At cost:
Freehold land - - 1,470
Buildings - 1 13,642
Projects-in-progress - - 443
- 1 15,555
continued from previous page
Transfers/
reclass
Translation
exchange
difference
At
31.12.2019
Accumulated depreciation:
Buildings - (38) 6,841
continued from previous page

Petroliam Nasional Berhad (PETRONAS)
Financial Report 2020
68 69
Notes to the Financial Statements31 December 2020
Notes to the Financial Statements31 December 2020
4. INVESTMENT PROPERTIES (CONTINUED)
Group
In RM Mil
Carrying amount
2020 2019
Freehold land 1,469 1,470
Leasehold land 990 -
Buildings 6,339 6,801
Projects-in-progress 1,670 443
10,468 8,714
Fair value information
The Directors have estimated the fair value of investment properties as at 31 December 2020 to be RM19,905 million
(2019: RM19,671 million).
The fair value of investment properties are categorised as follows:
Group
In RM Mil
Level 3
2020 2019
Freehold land 1,815 1,850
Leasehold land 1,000 -
Buildings 17,090 17,821
19,905 19,671
The Group uses various valuation techniques in determining the fair value of its investment properties. Such techniques
include discounted cash flows method, investment method and market comparable method.
Leases as lessor
The Group via its subsidiary has entered into non-cancellable operating lease agreements for Government Office
Buildings (“GOB”) in accordance with the Concession Agreement (“CA”) with the Government of Malaysia. Under the CA,
the Group will construct various parcels of GOB on land belonging to the Government. Upon completion of each parcel,
the Government will execute a 25-year lease agreement over the land of the said parcel to the Group. Simultaneously,
the Group will sub-lease the same land and buildings to the Government for the same period in return for lease rentals
based on predetermined rates per square foot per month. None of these leases include contingent rentals.
These leases have remaining period of non-cancellable lease terms between 6 and 22 years.
The future minimum lease receivable under non-cancellable operating leases contracted for a as at the reporting date
but not recognised as receivables are as follows:
In RM Mil
Group
2020 2019
Less than one year 1,949 1,870
Between one and five years 10,353 10,727
More than five years 2,642 3,680
14,944 16,277
5. LAND HELD FOR DEVELOPMENT
Included in land held for development is freehold land amounting to RM2,763 million (2019: RM2,776 million).
6. INVESTMENTS IN SUBSIDIARIES
In RM Mil
Company
2020 2019
Investments at cost
- quoted shares 14,907 16,410
- unquoted shares 136,202 132,569
Fair value adjustments on loans and advances and financial guarantee 9,271 9,083
160,380 158,062
Less: Impairment losses
- unquoted shares (4,884) (4,833)
155,496 153,229
Market value of quoted shares 85,385 93,800
Details of key subsidiaries are stated in Note 42 to the financial statements.
7. INVESTMENTS IN ASSOCIATES
In RM Mil
Group Company
2020 2019 2020 2019
Investments at cost
- quoted shares 263 263 302 302
- unquoted shares 6,220 6,440 - -
Share of post-acquisition profits and reserves 2,034 2,261 - -
8,517 8,964 302 302
Less: Impairment losses
- unquoted shares (2,762) (2,218) - -
5,755 6,746 302 302
Market value of quoted shares 1,010 1,110 502 584
The Group’s share of the current year losses and cumulative losses of certain associates amounting to RM32 million
(2019: RM201 million) and RM132 million (2019: RM100 million) respectively have not been recognised in the Group’s
profit or loss as equity accounting has ceased when the Group’s share of losses of these associates exceeded the carrying
amount of its investment in these associates since the Group has no obligation in respect of these losses.
Summarised financial information has not been included as the associates are not individually material to the Group.
Details of key associates are stated in Note 43 to the financial statements.

Petroliam Nasional Berhad (PETRONAS)
Financial Report 2020
70 71
Notes to the Financial Statements31 December 2020
Notes to the Financial Statements31 December 2020
8. INVESTMENT IN JOINT VENTURES
In RM Mil
Group Company
2020 2019 2020 2019
Investments at cost
- unquoted shares 5,009 6,737 475 624
Fair value adjustments on financial guarantee 377 377 377 377
Share of post-acquisition profits and reserves 1,544 2,131 - -
6,930 9,245 852 1,001
Less: Impairment losses (86) (89) (9) (9)
6,844 9,156 843 992
Share of joint ventures’ contingent liabilities:
Claims filed by/disputes with various parties (12) (13) (12) (13)
The Group’s share of the current year and cumulative losses of certain joint ventures amounting to RM48 million (2019:
RM57 million) and RM584 million (2019: RM511 million) respectively have not been recognised in the Group’s profit or
loss as equity accounting has ceased when the Group’s share of losses of these joint ventures exceeded the carrying
amount of its investment in these joint ventures since the Group has no obligation in respect of these losses. The
investments in these joint ventures have been fully impaired in the respective companies’ financial statements.
The shares of a joint venture are pledged as a security for a borrowing taken by a joint arrangement entity.
Summarised financial information has not been included as the joint ventures are not individually material to the Group.
Details of key joint ventures are stated in Note 44 to the financial statements.
9. INTANGIBLE ASSETS
Group
2020
In RM Mil
At
1.1.2020 Additions Write-offs
Effect upon
finalisation
of purchase
price
allocation
At cost:
Goodwill 6,833 - - (327)
Exploration expenditure 25,001 2,095 (1,864) -
Other intangible assets 35,990 992 (39) 498
67,824 3,087 (1,903) 171
continue to next page
Accumulated amortisation and impairment losses:
At
1.1.2020
Charge for
the year Write-offs
Goodwill 552 - -
Exploration expenditure 12,129 - (143)
Other intangible assets 28,883 1,422 (19)
41,564 1,422 (162)
continue to next page
2019
In RM Mil
At
1.1.2019 Additions
Disposals/
write-offs
At cost:
Goodwill 5,691 - -
Exploration expenditure 24,426 1,985 (996)
Other intangible assets 31,017 5,048 (14)
61,134 7,033 (1,010)
continue to next page
Accumulated amortisation and impairment losses:
At
1.1.2019
Charge for
the year
Disposals/
write-offs
Goodwill 561 - -
Exploration expenditure 11,828 - -
Other intangible assets 26,232 2,778 (8)
38,621 2,778 (8)
continue to next page

Petroliam Nasional Berhad (PETRONAS)
Financial Report 2020
72 73
Notes to the Financial Statements31 December 2020
Notes to the Financial Statements31 December 2020
9. INTANGIBLE ASSETS (CONTINUED)
Group
2020
In RM Mil
Acquisition
of a
subsidiary Transfers
Translation
exchange
difference
At
31.12.2020
At cost:
Goodwill 75 - (36) 6,545
Exploration expenditure - (309) (394) 24,529
Other intangible assets - - (10) 37,431
75 a(309) (440) 68,505
continued from previous page
Accumulated amortisation and
impairment losses:
Impairment
loss
Acquisition
of
subsidiaries Transfers
Translation
exchange
difference
At
31.12.2020
Goodwill 864 - - (28) 1,388
Exploration expenditure 3,973 - - 36 15,995
Other intangible assets 1,336 - - (544) 31,078
6,173 - - (536) 48,461
continued from previous page
2019
In RM Mil
Acquisition
of a
subsidiary Transfers
Translation
exchange
difference
At
31.12.2019
At cost:
Goodwill 1,129 36 (23) 6,833
Exploration expenditure - (540) 126 25,001
Other intangible assets 294 26 (381) 35,990
1,423 b,c(478) (278) 67,824
continued from previous page
Accumulated amortisation and
impairment losses:
Impairment
loss
Acquisition
of
subsidiaries Transfers
Translation
exchange
difference
At
31.12.2019
Goodwill - - - (9) 552
Exploration expenditure 328 - - (27) 12,129
Other intangible assets 154 12 21 (306) 28,883
482 12 c,d21 (342) 41,564
continued from previous page
a Includes net transfer out to property, plant and equipment of RM309 million.
b Includes net transfer out to property, plant and equipment of RM531 million and transfer in from assets held for sale of RM18 million.
c Includes reclassification of certain assets from cost to accumulated depreciation of RM35 million.
d Includes transfer out to property, plant and equipment of RM14 million.
9. INTANGIBLE ASSETS (CONTINUED)
Company
2020
In RM Mil
At
1.1.2020 Transfers Write-offs
At
31.12.2020
At cost:
Other intangible assets - 66 (20) 46
Accumulated amortisation:
At
1.1.2020
Charge for
the year Write-offs
At
31.12.2020
Other intangible assets - 10 - 10
Carrying amount
In RM Mil
Group Company
2020 2019 2020 2019
Goodwill 5,157 6,281 - -
Exploration expenditure 8,534 12,872 - -
Other intangible assets 6,353 7,107 36 -
20,044 26,260 36 -
Impairment review of goodwill
For the purpose of impairment testing, goodwill is allocated to groups of cash-generating units which represent the
lowest level within the Group and at which the goodwill is monitored for internal management purposes.
In assessing whether goodwill has been impaired, the carrying amount of the cash-generating unit (including goodwill)
is compared with the recoverable amount of the cash-generating unit. The recoverable amount is the higher of fair value
less costs to sell and value in use. In the absence of any information about the fair value of a cash-generating unit, the
value in use is deemed to be the recoverable amount.
Included in goodwill is an amount of RM3,987 million (2019: RM3,987 million) arising from the acquisition of PETRONAS
Lubricants Italy S.p.A Group (“PLI Group”). The recoverable amount of PLI Group unit was based on its value in use and
was determined with the assistance of an independent valuer. The value in use was determined by using the discounted
cash flow method based on management’s business plan cash flow projections for five financial years from 2021 to
2025, adjusted with an estimated terminal value. The cash flow assumes a long term growth rate of Nil (2019: Nil) and is
discounted to present value using discount rate of between 6.7% and 7.2% (2019: 5.9% and 7.2%).
Based on the above, the carrying amount of the unit was determined to be higher than its recoverable amount and
therefore, an impairment of RM864 million was recognised. The above estimates are sensitive in the following areas:
(i) A decrease of 0.5 percentage point in long term growth rate used would have increased the impairment by RM248
million.
(ii) An increase of 0.5 percentage point in discount rate used would have increased the impairment by RM327 million.

Petroliam Nasional Berhad (PETRONAS)
Financial Report 2020
74 75
Notes to the Financial Statements31 December 2020
Notes to the Financial Statements31 December 2020
9. INTANGIBLE ASSETS (CONTINUED)
Impairment review of goodwill (continued)
The value in use of other remaining goodwill is derived from the respective cash-generating units’ business plan cash
flow projections, adjusted with an estimated terminal value. The cash flows assumes a long term average growth rate
of the respective industries those units are engaged in and are discounted to present value using discount rate of 6.9%
(2019: 6.9%).
Based on the above, the recoverable amount of other goodwill of certain units were determined to be higher than their
carrying amount, thus no impairment loss was recognised during the year.
Impairment review of exploration expenditure
As at 31 December 2020, the Group recognised net impairment losses on certain exploration expenditure amounting to
RM3,973 million (2019: RM328 million) related to an oil and gas exploration cash-generating unit and certain wells no
longer capable of commercial development. The impairment on well costs will be subsequently written off in accordance
with the policy set out in Note 2.10.
10. LONG-TERM RECEIVABLES
In RM Mil Note
Group Company
2020 2019 2020 2019
Term loans and advances:
Loans and advances due from subsidiaries 10.1 - - 89,668 93,649
Loans and advances due from associates
and joint ventures 10.2 7,138 6,225 5,795 5,061
7,138 6,225 95,463 98,710
Contract assets 10.3 13 8 - -
Net investment in lease 10.4 9,670 9,331 - -
Other receivables and prepayments 10.5 5,450 5,869 25,482 23,284
Derivative assets 12 59 12 - -
22,330 21,445 120,945 121,994
Less: Allowance for impairment losses
- Term loans and advances (975) (919) (516) (163)
- Other receivables and prepayments (123) (143) - -
21,232 20,383 120,429 121,831
10.1 Included in the Company’s loans and advances due from subsidiaries is an amount of RM88,049 million (2019:
RM92,320 million), which bears interest at rates ranging from 0.46% - 5.20% (2019: 2.00% to 5.40%) per annum.
10.2 Included in the Group’s and the Company’s loans and advances due from associates and joint ventures is an amount
of RM7,079 million (2019: RM6,225 million) and RM5,795 million (2019: RM5,061 million), which bear interest at
rates ranging from 2.24% to 10.00% (2019: 3.91% to 10.00%) and 2.24% (2019: 3.91%) per annum respectively.
10. LONG-TERM RECEIVABLES (CONTINUED)
10.3 Contract assets represent revenue attributable to a concession arrangement entered into by a subsidiary of the
Group with the Government of Malaysia to construct government buildings on a Build-Lease-Maintain-Transfer
basis. The concession period is 28 years and six months commencing from the construction date.
The Group recognises the incremental costs of obtaining contracts as an expense when incurred if the amortisation
period of the assets is more than one year.
10.4 Net investment in lease
Net investment in lease represent lease rental and interest receivable due from customers in relation to the lease
of offshore floating assets and office buildings, both entered by subsidiaries of the Group.
In RM Mil
Group
2020 2019
At 1 January 9,331 10,272
Addition 1,261 150
Interest income 5 7
Lease payments received (927) (1,341)
Others - 243
At 31 December 9,670 9,331
In RM Mil
Group
2020 2019
Minimum lease receivables:
Not later than 1 year 1,597 1,754
Later than 1 year and not later than 2 years 1,476 1,658
Later than 2 years and not later than 5 years 4,029 4,309
Later than 5 years 7,678 6,366
14,780 14,087
Less: Future finance income (4,079) (3,669)
Less: Allowance for impairment losses (55) (10)
Present value of finance lease assets 10,646 10,408
Present value of finance lease assets:
Not later than 1 year 976 1,077
Later than 1 year and not later than 2 years 923 1,115
Later than 2 years and not later than 5 years 2,697 3,061
Later than 5 years 6,105 5,165
10,701 10,418
Less: Allowance for impairment losses (55) (10)
10,646 10,408
Analysed as:
Due within 12 months (Note 15) 976 1,077
Due after 12 months 9,670 9,331
10,646 10,408

Petroliam Nasional Berhad (PETRONAS)
Financial Report 2020
76 77
Notes to the Financial Statements31 December 2020
Notes to the Financial Statements31 December 2020
10. LONG-TERM RECEIVABLES (CONTINUED)
10.4 Net investment in lease (continued)
The following table sets out a maturity analysis of lease receivables, showing undiscounted lease payments to be
received after the reporting date.
In RM Mil
Group
2020 2019
Less than one year 1,661 1,842
One to two years 1,510 1,658
Two to three years 1,472 1,456
Three to four years 1,405 1,462
Four to five years 1,994 2,063
More than five years 7,291 7,042
Total undiscounted lease payments 15,333 15,523
Unearned interest income (4,074) (3,672)
Net investment in lease 11,259 11,851
The effective interest rate of the Group’s lease receivables is between 3.75% to 7.57% (2019: 4.10% to 7.60%).
Included in minimum lease receivables are the estimated unguaranteed residual values of the leased assets of
RM32 million (2019: RM17 million).
10.5 Included in the Company’s other receivables and prepayments is abandonment cess contribution to the
Abandonment Cess Fund (“ACF”), which is reimbursable to the Company upon execution of the abandonment of
the oil and gas properties in accordance with the terms of the production sharing contracts (“PSCs”) as described
in Note 38. The amount of cess payable to the PSC Contractors is disclosed in Note 23.
11. FUND AND OTHER INVESTMENTS
In RM Mil
Group Company
2020 2019 2020 2019
Non-current
Fair value through profit or loss
Unquoted shares 63 65 - -
Quoted securities 41 48 - -
Other unquoted securities 191 57 - -
295 170 - -
Fair value through other comprehensive income
Quoted shares - 418 - -
Unquoted shares 187 178 73 73
187 596 73 73
Amortised cost
Long-term deposits 127 1,163 90 977
Unquoted securities 400 - 230 -
527 1,163 320 977
Total non-current investments 1,009 1,929 393 1,050
Current
Fair value through profit or loss
Quoted securities 140 135 - -
Quoted shares 1,106 739 6 7
Corporate Bonds and Sukuk 8,219 7,198 4,812 3,467
Malaysian Government Securities 290 610 254 518
9,755 8,682 5,072 3,992
Fair value through other comprehensive income
Quoted shares 24 28 - -
Total current investments 9,779 8,710 5,072 3,992
Total fund and other investments 10,788 10,639 5,465 5,042
Representing items:
At amortised cost 527 1,163 320 977
At fair value 10,261 9,476 5,145 4,065
10,788 10,639 5,465 5,042
Included in fund and other investments of the Group is an amount of RM2,151 million (2019: RM2,122 million) which are
held for the purpose of future decommissioning activities of oil and gas properties.
Included in Corporate Bonds and Sukuk of the Company are securities issued by subsidiaries and a joint venture amounting
to RM381 million (2019: RM355 million).

Petroliam Nasional Berhad (PETRONAS)
Financial Report 2020
78 79
Notes to the Financial Statements31 December 2020
Notes to the Financial Statements31 December 2020
12. DERIVATIVE ASSETS/(LIABILITIES)
In RM Mil Note
Group Company
2020 2019 2020 2019
Derivative assets
Non-current
Interest rate swaps 7 9 - -
Forward foreign exchange contracts 52 3 - -
59 12 - -
Current
Commodity swaps 11 2 - -
Forward gas contracts 327 585 - -
Forward foreign exchange contracts 94 58 17 10
Forward oil/gas price swaps 34 142 - -
466 787 17 10
Included within:
Long-term receivables 10 59 12 - -
Trade and other receivables 15 466 787 17 10
525 799 17 10
Derivative liabilities
Non-current
Interest rate swaps (546) (167) - -
Forward foreign exchange contracts - (19) - -
(546) (186) - -
Current
Commodity swaps (12) (27) - -
Forward oil/gas contracts (651) (359) - -
Forward foreign exchange contracts (53) (55) (21) (18)
Forward oil/gas price swaps (933) (14) - -
(1,649) (455) (21) (18)
Included within:
Other long-term liabilities and provisions 23 (546) (186) - -
Trade and other payables 24 (1,649) (455) (21) (18)
(2,195) (641) (21) (18)
In the normal course of business, the Group and the Company enter into derivative financial instruments to manage their
normal business exposures in relation to commodity prices, foreign currency exchange rates and interest rates, including
management of the balance between floating rate and fixed rate debt, consistent with risk management policies and
objectives.
Certain subsidiaries of the Group adopt hedge accounting whereby hedges meeting the criteria for hedge accounting
are classified as cash flow hedges. The effective portion of the gain or loss on the hedging instruments is recognised
directly in equity until the hedged transaction occurs, while the ineffective portion is recognised in the profit or loss. As
at 31 December 2020, the balance recognised under capital reserves in equity amounts to RM1,429 million (2019: RM73
million). As these amounts are not material to the Group, no full disclosure of hedge accounting is presented in the
Group’s financial statements.
13. DEFERRED TAX
Recognised deferred tax assets/(liabilities)
Deferred tax assets and liabilities are attributable to the following:
In RM Mil
Assets Liabilities Net
2020 2019 2020 2019 2020 2019
Group
Property, plant and equipment 9,511 1,577 (20,775) (12,963) (11,264) (11,386)
Lease liabilities 2,023 455 - - 2,023 455
Unused tax losses 10,765 7,532 - - 10,765 7,532
Unabsorbed capital allowances 1,874 2,466 - - 1,874 2,466
Unused reinvestment allowances 435 210 - - 435 210
Unused investment tax allowances 5,254 4,044 - - 5,254 4,044
Provision for decommissioning of oil
and gas properties
3,834 4,543 - - 3,834 4,543
Others 1,232 546 (1,986) (435) (754) 111
Tax assets/(liabilities) 34,928 21,373 (22,761) (13,398) 12,167 7,975
Set off tax (14,306) (800) 14,306 800 - -
Net tax assets/(liabilities) 20,622 20,573 (8,455) (12,598) 12,167 7,975
Company
Property, plant and equipment 225 224 (979) (1,000) (754) (776)
Unused tax losses 2,692 6,303 - - 2,692 6,303
Unabsorbed capital allowances 34 55 - - 34 55
Provision for decommissioning of oil
and gas properties
4,302 4,164 - - 4,302 4,164
Others 169 181 - - 169 181
Tax assets/(liabilities) 7,422 10,927 (979) (1,000) 6,443 9,927
Set off tax (979) (1,000) 979 1,000 - -
Net tax assets/(liabilities) 6,443 9,927 - - 6,443 9,927
Unrecognised deferred tax assets
Deferred tax assets have not been recognised in respect of the following items (stated at gross):
In RM Mil
Group Company
2020 2019 2020 2019
Deductible temporary differences 1,430 431 - -
Unabsorbed capital allowances 2,732 1,013 - -
Unused tax losses 54,378 36,119 20,599 781
Unused reinvestment allowances 27 - - -
Unused investment tax allowances 163 267 - -
58,730 37,830 20,599 781

Petroliam Nasional Berhad (PETRONAS)
Financial Report 2020
80 81
Notes to the Financial Statements31 December 2020
Notes to the Financial Statements31 December 2020
13. DEFERRED TAX (CONTINUED)
Unrecognised deferred tax assets (continued)
In accordance with the provision of Malaysian Finance Act 2018, the unused tax losses are available for utilisation in
the next seven years. Any excess at the end of the seventh year will be disregarded. Deferred tax assets have not been
recognised in respect of these items because it is not probable that future taxable profit will be available against which
the subsidiaries can utilise the benefits.
Unabsorbed capital allowances and unused investment tax allowances do not expire under current tax legislation.
The Group and the Company have unused tax losses carried forward of approximately RM99,232 million (2019: RM67,502
million) and RM31,816 million (2019: RM27,044 million) respectively, which give rise to the recognised and unrecognised
deferred tax assets as above.
The Group also has unabsorbed capital allowances, unused investment tax allowances and unused reinvestment
allowances of approximately RM10,540 million (2019: RM11,288 million), RM22,055 million (2019: RM17,117 million) and
RM1,840 million (2019: RM875 million) respectively, which give rise to the recognised and unrecognised deferred tax
assets as above.
The components and movements of deferred tax liabilities and assets during the year prior to offsetting are as follows:
Group
2020
In RM Mil
At
1.1.2020
Charged/
(credited)
to profit
or loss
Acquisition
of
subsidiaries Equity
Translation
exchange
difference
At
31.12.2020
Deferred tax liabilities
Property, plant and equipment 12,963 8,040 1 13 (242) 20,775
Others 435 1,674 - 3 (126) 1,986
13,398 a9,714 1 16 (368) 22,761
Deferred tax assets
Property, plant and equipment (1,577) (7,844) - 40 (130) (9,511)
Lease liabilities (455) (1,514) - - (54) (2,023)
Unused tax losses (7,532) (3,548) - 21 294 (10,765)
Unabsorbed capital allowances (2,466) 571 - 16 5 (1,874)
Unused reinvestment allowances (210) (225) - - - (435)
Unused investment tax allowances (4,044) (1,249) - - 39 (5,254)
Provision for decommissioning of oil
and gas properties (4,543) 713 - - (4) (3,834)
Others (546) (636) (1) 3 (52) (1,232)
(21,373) b(13,732) (1) 80 98 (34,928)
Total (7,975) (4,018) - 96 (270) (12,167)
a,b Includes reclassification between deferred tax liabilities and deferred tax assets.
13. DEFERRED TAX (CONTINUED)
Group
2019
In RM Mil
At
1.1.2019
Charged/
(credited) to
profit or loss Equity
Translation
exchange
difference
At
31.12.2019
Deferred tax liabilities
Property, plant and equipment 14,773 (2,139) 386 (57) 12,963
Others 603 (18) (163) 13 435
15,376 (2,157) 223 (44) 13,398
Deferred tax assets
Property, plant and equipment (660) (902) (19) 4 (1,577)
Lease liabilities (114) (345) - 4 (455)
Unused tax losses (7,736) 202 - 2 (7,532)
Unabsorbed capital allowances (2,459) 362 (373) 4 (2,466)
Unused reinvestment allowances (218) 8 - - (210)
Unused investment tax allowances (3,413) (678) 47 - (4,044)
Provision for decommissioning of
oil and gas properties (4,397) (145) - (1) (4,543)
Others (648) 71 18 13 (546)
(19,645) (1,427) (327) 26 (21,373)
Total (4,269) (3,584) (104) (18) (7,975)
Company
2020
In RM Mil
At
1.1.2020
(Credited)/
charged to
profit or loss
At
31.12.2020
Deferred tax assets
Property, plant and equipment 776 (22) 754
Unused tax losses (6,303) 3,611 (2,692)
Unabsorbed capital allowances (55) 21 (34)
Provision for decommissioning of oil and gas properties (4,164) (138) (4,302)
Others (181) 12 (169)
(9,927) 3,484 (6,443)
Company
2019
In RM Mil
At
1.1.2019
(Credited)/
charged to
profit or loss
At
31.12.2019
Deferred tax assets
Property, plant and equipment 1,041 (265) 776
Unused tax losses (6,005) (298) (6,303)
Unabsorbed capital allowances (79) 24 (55)
Provision for decommissioning of oil and gas properties (4,019) (145) (4,164)
Others (288) 107 (181)
(9,350) (577) (9,927)
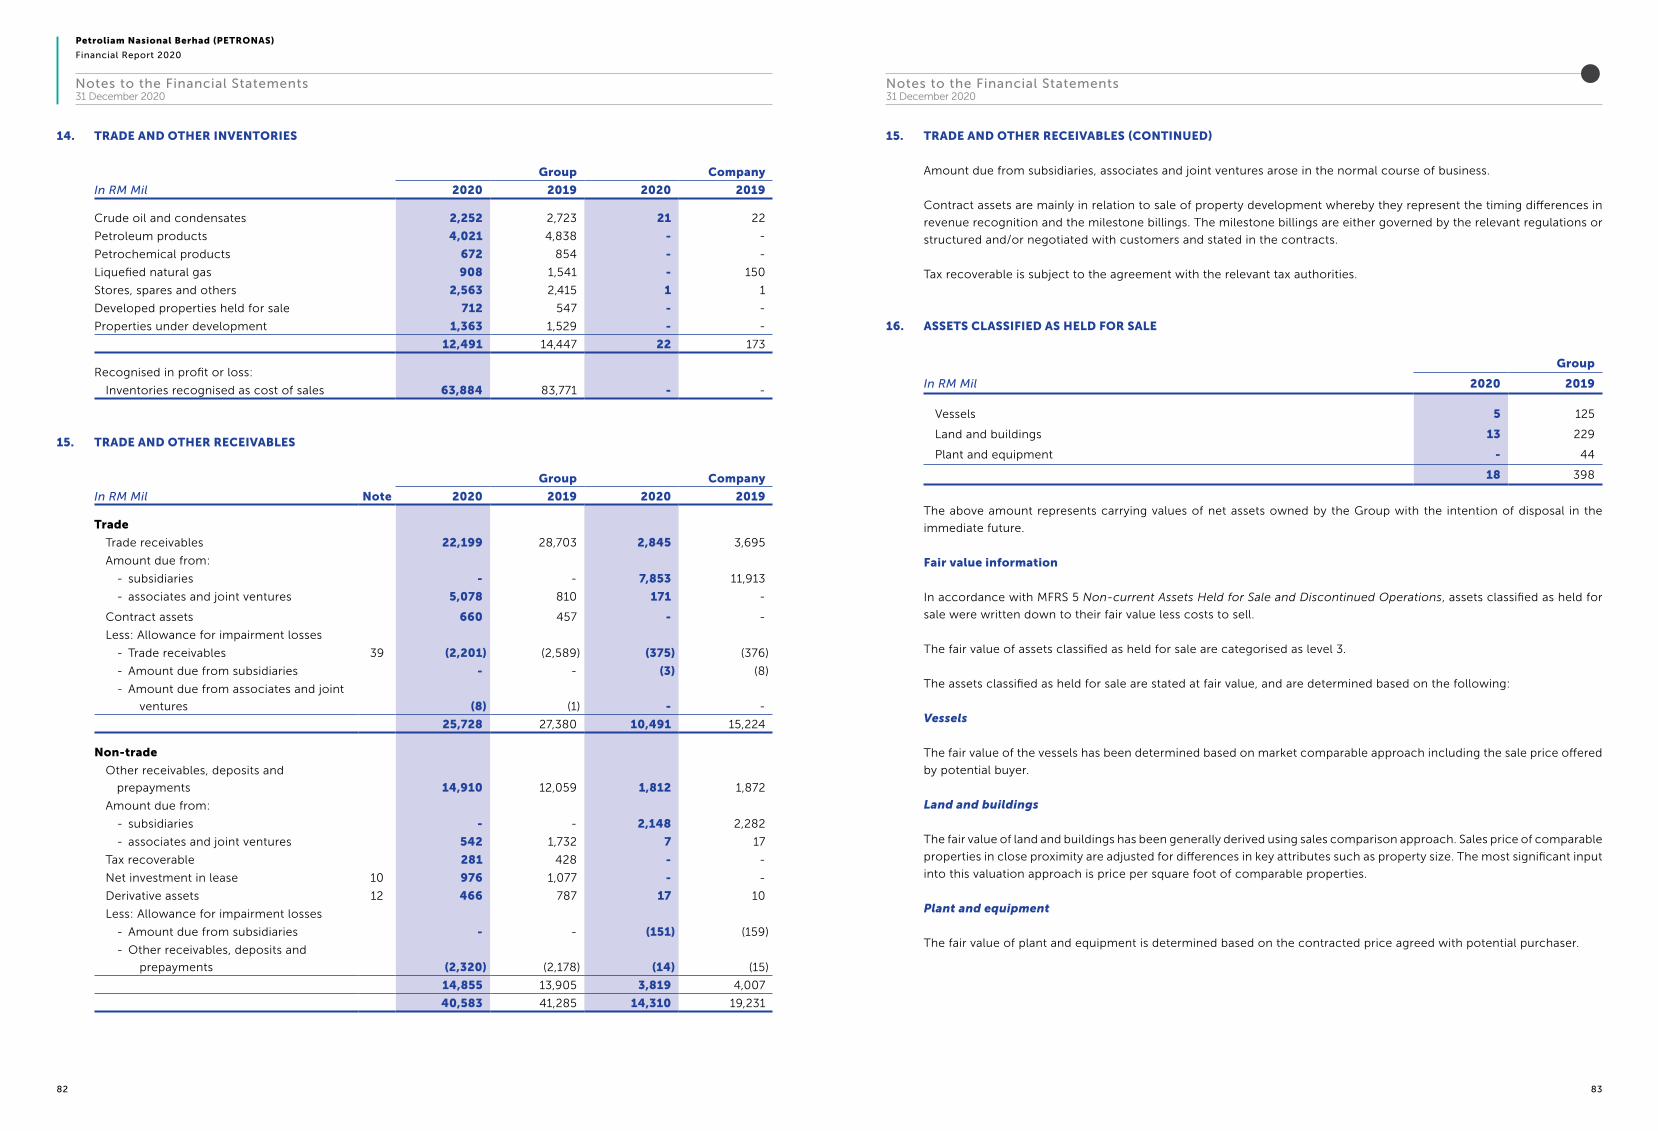
Petroliam Nasional Berhad (PETRONAS)
Financial Report 2020
82 83
Notes to the Financial Statements31 December 2020
Notes to the Financial Statements31 December 2020
14. TRADE AND OTHER INVENTORIES
In RM Mil
Group Company
2020 2019 2020 2019
Crude oil and condensates 2,252 2,723 21 22
Petroleum products 4,021 4,838 - -
Petrochemical products 672 854 - -
Liquefied natural gas 908 1,541 - 150
Stores, spares and others 2,563 2,415 1 1
Developed properties held for sale 712 547 - -
Properties under development 1,363 1,529 - -
12,491 14,447 22 173
Recognised in profit or loss:
Inventories recognised as cost of sales 63,884 83,771 - -
15. TRADE AND OTHER RECEIVABLES
In RM Mil Note
Group Company
2020 2019 2020 2019
Trade
Trade receivables 22,199 28,703 2,845 3,695
Amount due from:
- subsidiaries - - 7,853 11,913
- associates and joint ventures 5,078 810 171 -
Contract assets 660 457 - -
Less: Allowance for impairment losses
- Trade receivables 39 (2,201) (2,589) (375) (376)
- Amount due from subsidiaries - - (3) (8)
- Amount due from associates and joint
ventures (8) (1) - -
25,728 27,380 10,491 15,224
Non-trade
Other receivables, deposits and
prepayments 14,910 12,059 1,812 1,872
Amount due from:
- subsidiaries - - 2,148 2,282
- associates and joint ventures 542 1,732 7 17
Tax recoverable 281 428 - -
Net investment in lease 10 976 1,077 - -
Derivative assets 12 466 787 17 10
Less: Allowance for impairment losses
- Amount due from subsidiaries - - (151) (159)
- Other receivables, deposits and
prepayments (2,320) (2,178) (14) (15)
14,855 13,905 3,819 4,007
40,583 41,285 14,310 19,231
15. TRADE AND OTHER RECEIVABLES (CONTINUED)
Amount due from subsidiaries, associates and joint ventures arose in the normal course of business.
Contract assets are mainly in relation to sale of property development whereby they represent the timing differences in
revenue recognition and the milestone billings. The milestone billings are either governed by the relevant regulations or
structured and/or negotiated with customers and stated in the contracts.
Tax recoverable is subject to the agreement with the relevant tax authorities.
16. ASSETS CLASSIFIED AS HELD FOR SALE
In RM Mil
Group
2020 2019
Vessels 5 125
Land and buildings 13 229
Plant and equipment - 44
18 398
The above amount represents carrying values of net assets owned by the Group with the intention of disposal in the
immediate future.
Fair value information
In accordance with MFRS 5 Non-current Assets Held for Sale and Discontinued Operations, assets classified as held for
sale were written down to their fair value less costs to sell.
The fair value of assets classified as held for sale are categorised as level 3.
The assets classified as held for sale are stated at fair value, and are determined based on the following:
Vessels
The fair value of the vessels has been determined based on market comparable approach including the sale price offered
by potential buyer.
Land and buildings
The fair value of land and buildings has been generally derived using sales comparison approach. Sales price of comparable
properties in close proximity are adjusted for differences in key attributes such as property size. The most significant input
into this valuation approach is price per square foot of comparable properties.
Plant and equipment
The fair value of plant and equipment is determined based on the contracted price agreed with potential purchaser.

Petroliam Nasional Berhad (PETRONAS)
Financial Report 2020
84 85
Notes to the Financial Statements31 December 2020
Notes to the Financial Statements31 December 2020
17. CASH AND CASH EQUIVALENTS
In RM Mil
Group Company
2020 2019 2020 2019
Cash and bank balances 9,094 12,721 2,228 3,359
Deposits placed 121,429 128,901 92,457 103,342
130,523 141,622 94,685 106,701
Less: Subsidiaries’ cash with PETRONAS Integrated
Financial Shared Service Centre - - (40,574) (50,740)
130,523 141,622 54,111 55,961
The Company manages the cash and cash equivalents on behalf of certain subsidiaries through its Integrated Financial
Shared Service Centre in order to allow for more efficient management of cash. The cash and cash equivalents reported
in the Company’s financial statements do not include the amounts managed on behalf of the subsidiaries.
Included in cash and bank balances of the Group and the Company are interest-bearing balances amounting to RM7,504
million (2019: RM10,779 million) and RM2,228 million (2019: RM3,359 million) respectively.
Included in cash and bank balances of the Group is the retention account of RM1,303 million (2019: RM1,290 million)
which is restricted for use because it is pledged to the bank for the purpose of acquisition of vessels.
Included in cash and bank balances of the Group are RM21 million (2019: RM Nil) held by a trustee. The amount represents
the unutilised value of e-wallet monies and amount due to service providers for value utilised.
Included in deposits with banks of the Group is an amount of RM21,062 million (2019: RM18,063 million) which is held
for the purpose of future decommissioning activities of oil and gas properties.
Included in deposits placed with banks of the Group is an amount of RM1 million (2019: RM2 million) being deposits held
under designated accounts for redemption of Islamic Financing Facilities.
Included in deposits placed with banks of the Group is an amount of RM335 million (2019: RM70 million) which is
restricted for certain payments under the requirements of the borrowing facilities agreement.
18. SHARE CAPITAL
In RM Mil
Company
2020 2019
Issued and fully paid shares with no par value classified as equity instrument:
100,000 ordinary shares of RM1,000 each 100 100
Ordinary shares
The holders of ordinary shares are entitled to receive dividends as declared from time to time, and are entitled to one
vote per share at meetings of the Company. Ordinary share has no par value.
19. RESERVES
The Company has sufficient retained profits to distribute the following dividends:
(i) Dividends paid out of income derived from petroleum operations which are not chargeable to tax pursuant to the
Petroleum (Income Tax) Act, 1967.
(ii) Single tier dividends paid out of income derived from other operations other than petroleum which are exempt in
the hands of shareholder pursuant to Paragraph 12B, Schedule 6 of the Income Tax Act, 1967.
(iii) Exempt dividends paid out of income which are exempt pursuant to Section 12 of Income Tax (Amendment) Act,
1999, Paragraph 28, Schedule 6 and Schedule 7A of the Income Tax Act, 1967.
Capital and other reserves
Capital reserves represent primarily reserves created upon issuance of bonus shares and redemption of preference shares
by subsidiaries. Other reserves comprise primarily gain or loss on the hedging instrument in the cash flow hedge that is
determined to be an effective hedge and the Group’s share of its associate and joint venture companies’ reserves.
Foreign currency translation reserve
The foreign currency translation reserve comprises all foreign currency differences arising from the translation of the
financial statements of subsidiaries whose functional currencies are different from that of the Company’s functional
currency as well as foreign currency differences arising from the translation of monetary items that are considered to
form part of a net investment in a foreign operation.
Fair value through other comprehensive income reserve
This reserve records the changes in fair value of equity securities designated at fair value through other comprehensive
income. On disposal or impairment of equity securities, the cumulative changes in fair value are transferred to the
retained profits.
General reserve
General reserve represents appropriation of retained profits for general purposes rather than for a specific item of future
loss or expense. In effect, it is a reserve for unspecified possible events.
20. NON-CONTROLLING INTERESTS
This consists of the non-controlling interests’ proportion of share capital and reserves of partly-owned subsidiaries.

Petroliam Nasional Berhad (PETRONAS)
Financial Report 2020
86 87
Notes to the Financial Statements31 December 2020
Notes to the Financial Statements31 December 2020
21. BORROWINGS
In RM Mil
Group Company
2020 2019 2020 2019
Non-current
Secured
Term loans 14,097 9,749 - -
Islamic financing facilities 1,547 1,750 - -
Lease liabilities 11,324 12,603 7,268 4,417
Total non-current secured borrowings 26,968 24,102 7,268 4,417
Unsecured
Term loans 768 4,812 - -
Notes and Bonds 45,014 21,371 45,014 21,371
Islamic financing facilities 4,058 3,137 - -
Total non-current unsecured borrowings 49,840 29,320 45,014 21,371
Total non-current borrowings 76,808 53,422 52,282 25,788
Current
Secured
Term loans 1,923 3,699 - -
Islamic financing facilities 776 644 - -
Lease liabilities 1,405 1,063 572 344
Total current secured borrowings 4,104 5,406 572 344
Unsecured
Term loans 2,809 2,051 - -
Islamic financing facilities 770 5,654 - 5,121
Revolving credits 1,384 1,347 - -
Bankers’ acceptances 1,656 449 - -
Bank overdrafts 698 409 - -
Total current unsecured borrowings 7,317 9,910 - 5,121
Total current borrowings 11,421 15,316 572 5,465
Total borrowings 88,229 68,738 52,854 31,253
21. BORROWINGS (CONTINUED)
Terms and debt repayment schedule
Group
In RM Mil Total
Under
1 year
1-2
years
2-5
years
Over 5
years
Secured
Term loans 16,020 1,923 2,203 4,669 7,225
Islamic financing facilities 2,323 776 196 614 737
Lease liabilities 12,729 1,405 1,555 2,667 7,102
31,072 4,104 3,954 7,950 15,064
Unsecured
Term loans 3,577 2,809 122 498 148
Notes and Bonds 45,014 - 7,044 6,009 31,961
Islamic financing facilities 4,828 770 574 1,909 1,575
Revolving credits 1,384 1,384 - - -
Bankers’ acceptances 1,656 1,656 - - -
Bank overdrafts 698 698 - - -
57,157 7,317 7,740 8,416 33,684
88,229 11,421 11,694 16,366 48,748
Company
Secured
Lease liabilities 7,840 572 442 1,505 5,321
Unsecured
Notes and Bonds 45,014 - 7,044 6,009 31,961
52,854 572 7,486 7,514 37,282
Islamic financing facilities
Details of Islamic financing facilities are included in Note 22.

Petroliam Nasional Berhad (PETRONAS)
Financial Report 2020
88 89
Notes to the Financial Statements31 December 2020
Notes to the Financial Statements31 December 2020
21. BORROWINGS (CONTINUED)
Secured term loans
The secured term loans obtained by the subsidiaries and joint operation company primarily comprise:
In Mil Securities 2020 2019
USD Term loans Secured by way of a charge over certain vessels,
property, plant and equipment, together with charter
agreements and insurance of the relevant assets of
certain subsidiaries, as well as ordinary shares and
land lease rights of joint arrangement entities.
US$4,715 US$2,364
RM Term loans Secured by way of a charge over certain property,
plant and equipment and investment properties
and insurance of the relevant property, plant and
equipment of certain subsidiaries.
RM877 RM477
The secured term loans bear interest at rates ranging from 0.84% to 4.49% (2019: 1.10% to 4.49%) per annum and are fully
repayable at their various due dates from 2021 to 2034.
Unsecured term loans
The unsecured term loans obtained by the subsidiaries primarily comprise:
In Mil 2020 2019
USD Term loans US$1,277 US$3,490
EUR Term loans €436 €436
These unsecured term loans bear interest at rates ranging from 0.30% to 5.40% (2019: 0.39% to 6.50%) per annum and
are fully repayable at their various due dates from 2021 to 2023.
Unsecured Notes and Bonds
The unsecured Notes and Bonds comprises:
In Mil 2020 2019
USD Notes and Bonds:
7 7/8% Notes due 2022^ US$1,000 US$1,000
3 1/8% Guaranteed Notes due 2022^ US$750 US$750
3 1/2% Guaranteed Notes due 2025^ US$1,500 US$1,500
7 5/8% Bonds due 2026# US$500 US$500
4 1/2% Guaranteed Notes due 2045^ US$1,500 US$1,500
3 1/2% Guaranteed Notes due 2030^ US$2,250 -
4 4/5% Guaranteed Notes due 2060^ US$1,000 -
4 11/20% Guaranteed Notes due 2050^ US$2,750 -
# Obtained by the Company.
^ Obtained by the Company via a subsidiary.
21. BORROWINGS (CONTINUED)
Unsecured revolving credits and bank overdrafts
The unsecured revolving credits and bank overdrafts are obtained by the subsidiaries and primarily bear interest at rates
ranging from 2.19% to 7.60% (2019: 1.00% to 7.60%) per annum.
Unsecured Notes and Bonds
In connection with the long term borrowing facility agreements, the Group and the Company have agreed on the
following significant covenants with the bondholders:
(i) not to allow any material indebtedness (the minimum aggregate amount exceeding USD30,000,000 for seven
7/8% Guaranteed Notes due 2022 and USD200,000,000 for the remaining Guaranteed Notes or its equivalent in
any other currency) for borrowed money of the Company to become due or capable of being declared due before
its stated maturity, any guarantee of the Company for material indebtedness of any other person is not discharged
at maturity or when validly called or the Company goes into default;
(ii) the Company (not including any of its subsidiaries) not to create, incur or have outstanding any mortgage, pledge,
lien, charge, encumbrance or any other lien upon the whole or any part of its property or assets, present or future
indebtedness of itself or any other person, unless the aggregate outstanding principal amount of all such secured
indebtedness (other than indebtedness secured by the liens already in existence) plus attributable debt of the
Company in respect of sales and leaseback transactions would not exceed 10% of the consolidated net tangible
assets;
(iii) the Company (not including any of its subsidiaries) not to enter into any sale and leaseback transaction, unless the
attributable debt in respect of such sale and leaseback transaction and all other sale and leaseback transaction plus
the aggregate outstanding principal amount of indebtedness for borrowed money secured by security interests
(other than permitted security interests) then outstanding which have not equally and rateably secured the total
outstanding would not exceed 10% of the Company’s consolidated net tangible assets provided that, within 12
months after such sale and leaseback transaction, it applies to the retirement of indebtedness for borrowed money
the repayment obligations hereunder and which are not secured by any security interest, an amount to the greater
of:
• the net proceeds of the sale or transfer of the property or other assets which are the subject of such sale
and leaseback transaction as determined by the Company; or
• the fair market value of the property or other assets so leased as determined by the Company;
(iv) neither the Company nor PETRONAS Capital Limited (“PCL”), without consent of a majority bondholders may
consolidate with, or merge into, or sell, transfer, lease or convey substantially all of its assets to any corporation
unless any successor corporation expressly assumes the obligations of the Company or PCL, as the case may be
under the Notes and Bonds.

Petroliam Nasional Berhad (PETRONAS)
Financial Report 2020
90 91
Notes to the Financial Statements31 December 2020
Notes to the Financial Statements31 December 2020
22. ISLAMIC FINANCING FACILITIES
Secured Islamic financing facilities
The secured Islamic financing facilities obtained by the subsidiaries comprise:
In RM Mil 2020 2019
Al Bai’bithaman Ajil Facilities 300 300
Bai’ Al-Dayn Note Issuance Facilities 206 206
Murabahah Medium Term Notes 1,510 1,510
The secured Islamic financing facilities bear a yield payable/profit rate ranging from 4.15% to 7.25% (2019: 4.15% to 7.25%)
per annum and are fully repayable at their various due dates from 2021 to 2026.
The Islamic financing facilities are secured by way of a charge over certain property, plant and equipment and investment
properties.
Unsecured Islamic financing facilities
The unsecured Islamic financing facilities obtained by the subsidiaries comprise:
In Mil 2020 2019
Murabahah Note Issuance Facilities - RM5
Murabahah Note Issuance Facilities RMB216 RMB216
Sukuk Musyarakah RM5,682 RM3,982
Bai’ Al-Dayn Note Issuance Facilities - RM25
Trust Certificates^ - US$1,250
^ Obtained by the Company via a subsidiary.
The unsecured Islamic financing facilities bear a yield payable ranging from 3.50% to 6.17% (2019: 2.71% to 6.17%) per
annum and are fully repayable at their various due dates from 2021 to 2040.
23. OTHER LONG-TERM LIABILITIES AND PROVISIONS
In RM Mil
Group Company
2020 2019 2020 2019
Provision for decommissioning of:
- oil and gas properties 39,764 36,663 17,159 15,740
- other property, plant and equipment 1,364 407 - -
Financial guarantees - - - 16
Derivative liabilities (Note 12) 546 186 - -
Contract liabilities 1,201 1,585 8,016 8,792
Others 8,181 5,645 11,631 9,761
51,056 44,486 36,806 34,309
23. OTHER LONG-TERM LIABILITIES AND PROVISIONS (CONTINUED)
Provision for decommissioning of oil and gas properties and other property, plant and equipment is recognised when
there is an obligation to abandon a facility or an item of property, plant and equipment and to restore the site on which
it is located, and when a reasonable estimate of that liability can be made. In the case of provision for decommissioning
of oil and gas properties, the obligation is stipulated in production sharing contracts (“PSC”) as described in Note 38.
Included in other long-term liabilities of the Group and the Company are amount of abandonment cess payable to the
PSC Contractors of RM3,834 million and RM11,471 million (2019: RM3,143 million and RM9,743 million) respectively as
described in Note 38.
The provision recognised is the present value of the Group’s and the Company’s obligations of the estimated future costs
determined in accordance with current conditions and requirements.
A corresponding asset of an amount equivalent to the provision is also created. This asset is depreciated in accordance
with the policy set out in Note 2.4. The increase in the present value of the provision for the expected costs due to the
passage of time is included within finance costs.
Most of these removal events are many years in the future and precise requirements that will have to be met when the
removal events actually occur are uncertain. The actual timing and net cash outflows can differ from estimates due to
changes in laws, regulations, public expectations, technology, prices and conditions, therefore, the carrying amounts of
provisions, together with the interest rate used in discounting the cash flows and inflation rate, are regularly reviewed
and adjusted to take account of such changes. The interest rate and inflation rate used to determine the significant
obligations as at 31 December 2020 range from 0.88% to 7.17% (2019: 0.41% to 8.00%) and 0.90% to 4.31% (2019: 1.15%
to 4.67%) respectively.
Changes in the expected future costs are reflected in both the provision and the asset.
The movements of provision for decommissioning during the financial year are as follows:
In RM Mil Group Company
At 1 January 2020 37,070 15,740
Addition 1,410 17
Net changes in provision 2,301 1,031
Transfer to current liabilities (472) -
Provision utilised (463) (161)
Unwinding of discount 1,282 532
At 31 December 2020 41,128 17,159
Net changes in provision include foreign exchange gains or losses arising from retranslation of the provision and are
adjusted against the carrying amount of the corresponding asset accordingly.
During the year, the Group and the Company revised the provision for decommissioning of oil and gas properties resulting
from changes in estimated cash flows. The adjustment was accounted for prospectively as a change in accounting
estimates resulting in the following:
In RM Mil Group Company
Increase in provision for decommisioning 2,301 1,031
Increase in cost of property, plant and equipment 2,670 2,126
Increase in profits 369 1,095

Petroliam Nasional Berhad (PETRONAS)
Financial Report 2020
92 93
Notes to the Financial Statements31 December 2020
Notes to the Financial Statements31 December 2020
24. TRADE AND OTHER PAYABLES
In RM Mil
Group Company
2020 2019 2020 2019
Trade payables 9,489 16,884 1,272 1,843
Other payables 31,327 35,511 7,110 9,700
Contract liabilities 8 2 - -
Amount due to:
- subsidiaries - - 3,541 5,844
- associates and joint ventures 1,255 1,116 10 11
Derivative liabilities (Note 12) 1,649 455 21 18
43,728 53,968 11,954 17,416
Included in other payables of the Group are amounts owing to suppliers, contractors and joint operation partners mainly
arose in the normal course of business as well as purchase of property, plant and equipment and cash payment to Federal
and State Governments of Malaysia.
Included in other payables of the Company are financial guarantees amounting to RM32 million (2019: RM Nil).
Amount due to subsidiaries, associates and joint ventures arose in the normal course of business.
25. REVENUE
In RM Mil
Group Company
2020 2019 2020 2019
Revenue from contracts with customers 168,436 226,439 58,597 85,109
Other revenue
- shipping and shipping related services 2,577 2,780 - -
- rental of properties 2,090 2,372 - -
- rendering of services 1,044 1,105 404 1,275
- others 448 1,266 1,172 2,877
6,159 7,523 1,576 4,152
- dividend income
Quoted
- subsidiaries - - 3,252 3,754
- associates - - 13 24
- investments 23 23 1 1
Unquoted
- subsidiaries - - 7,752 24,910
- associates and joint ventures 22 521 130 142
- investments - 19 - 19
45 563 11,148 28,850
- interest income 4,101 5,738 2,139 3,091
Total revenue 178,741 240,263 73,460 121,202
25. REVENUE (CONTINUED)
Disaggregation of revenue from contracts with customers
In the following table, revenue is disaggregated by primary geographical markets and major products/services lines.
Group 2020
In RM Mil Upstream
Gas and
New Energy Downstream
Corporate
and others Total
Primary geographical markets
- Asia 11,467 19,684 23,950 - 55,101
- Malaysia 2,875 13,150 29,532 4,209 49,766
- Japan 606 16,203 776 - 17,585
- South Africa - - 14,894 - 14,894
- Rest of the worlda 12,216 4,305 14,569 - 31,090
27,164 53,342 83,721 4,209 168,436
Major products/services lines
- Petroleum products 251 - 62,454 - 62,705
- Crude oil and condensates 19,147 227 4,336 - 23,710
- Liquefied natural gas - 37,668 1 - 37,669
- Natural and processed gas 7,377 14,871 57 - 22,305
- Petrochemical products - - 14,177 - 14,177
- Construction contracts - - - 1,125 1,125
- Sales of properties - - - 117 117
- Others 389 576 2,696 2,967 6,628
27,164 53,342 83,721 4,209 168,436
Revenue from contracts with
customers 27,164 53,342 83,721 4,209 168,436
Other revenue 1,570 1,279 462 6,994 10,305
Total revenue 28,734 54,621 84,183 11,203 178,741
a Comprises revenue individually not material.
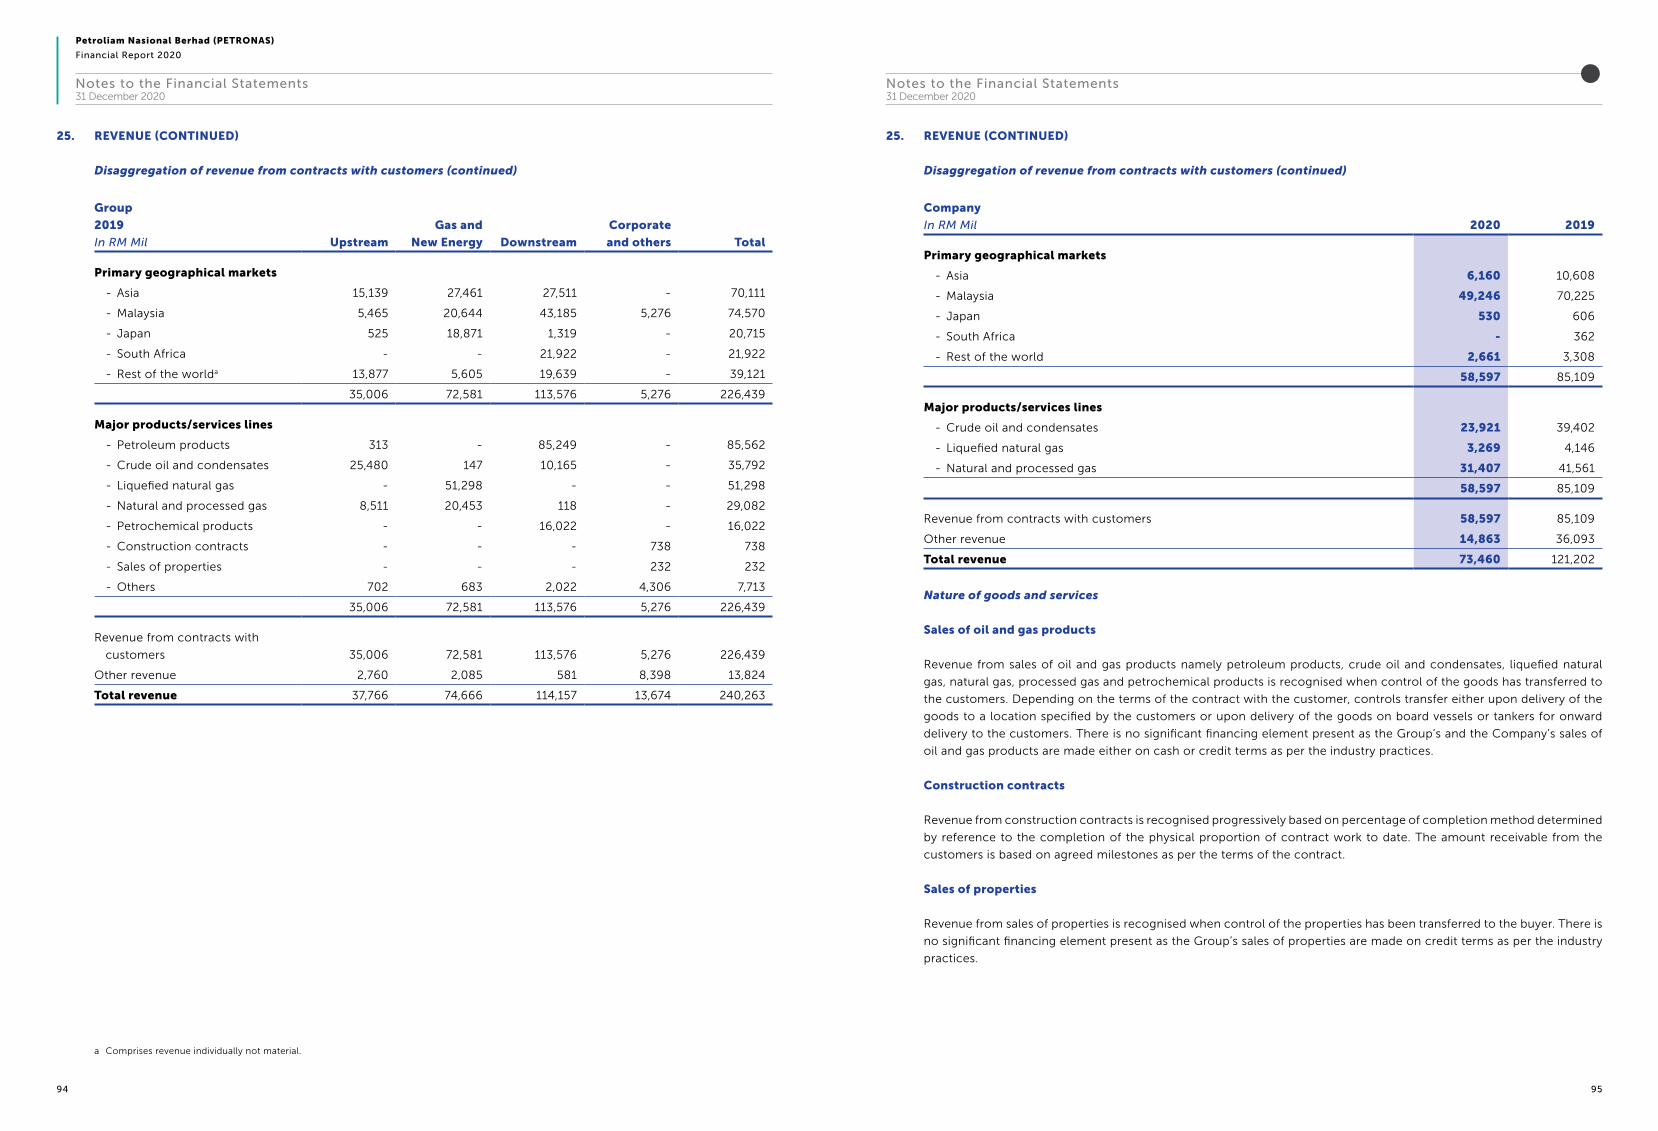
Petroliam Nasional Berhad (PETRONAS)
Financial Report 2020
94 95
Notes to the Financial Statements31 December 2020
Notes to the Financial Statements31 December 2020
25. REVENUE (CONTINUED)
Disaggregation of revenue from contracts with customers (continued)
Group
2019
In RM Mil Upstream
Gas and
New Energy Downstream
Corporate
and others Total
Primary geographical markets
- Asia 15,139 27,461 27,511 - 70,111
- Malaysia 5,465 20,644 43,185 5,276 74,570
- Japan 525 18,871 1,319 - 20,715
- South Africa - - 21,922 - 21,922
- Rest of the worlda 13,877 5,605 19,639 - 39,121
35,006 72,581 113,576 5,276 226,439
Major products/services lines
- Petroleum products 313 - 85,249 - 85,562
- Crude oil and condensates 25,480 147 10,165 - 35,792
- Liquefied natural gas - 51,298 - - 51,298
- Natural and processed gas 8,511 20,453 118 - 29,082
- Petrochemical products - - 16,022 - 16,022
- Construction contracts - - - 738 738
- Sales of properties - - - 232 232
- Others 702 683 2,022 4,306 7,713
35,006 72,581 113,576 5,276 226,439
Revenue from contracts with
customers 35,006 72,581 113,576 5,276 226,439
Other revenue 2,760 2,085 581 8,398 13,824
Total revenue 37,766 74,666 114,157 13,674 240,263
a Comprises revenue individually not material.
25. REVENUE (CONTINUED)
Disaggregation of revenue from contracts with customers (continued)
Company
In RM Mil 2020 2019
Primary geographical markets
- Asia 6,160 10,608
- Malaysia 49,246 70,225
- Japan 530 606
- South Africa - 362
- Rest of the world 2,661 3,308
58,597 85,109
Major products/services lines
- Crude oil and condensates 23,921 39,402
- Liquefied natural gas 3,269 4,146
- Natural and processed gas 31,407 41,561
58,597 85,109
Revenue from contracts with customers 58,597 85,109
Other revenue 14,863 36,093
Total revenue 73,460 121,202
Nature of goods and services
Sales of oil and gas products
Revenue from sales of oil and gas products namely petroleum products, crude oil and condensates, liquefied natural
gas, natural gas, processed gas and petrochemical products is recognised when control of the goods has transferred to
the customers. Depending on the terms of the contract with the customer, controls transfer either upon delivery of the
goods to a location specified by the customers or upon delivery of the goods on board vessels or tankers for onward
delivery to the customers. There is no significant financing element present as the Group’s and the Company’s sales of
oil and gas products are made either on cash or credit terms as per the industry practices.
Construction contracts
Revenue from construction contracts is recognised progressively based on percentage of completion method determined
by reference to the completion of the physical proportion of contract work to date. The amount receivable from the
customers is based on agreed milestones as per the terms of the contract.
Sales of properties
Revenue from sales of properties is recognised when control of the properties has been transferred to the buyer. There is
no significant financing element present as the Group’s sales of properties are made on credit terms as per the industry
practices.

Petroliam Nasional Berhad (PETRONAS)
Financial Report 2020
96 97
Notes to the Financial Statements31 December 2020
Notes to the Financial Statements31 December 2020
25. REVENUE (CONTINUED)
Transaction price allocated to remaining performance obligations
The Group and the Company entered into long-term contracts for the sales of various oil and gas products with
remaining tenures ranging between 2 to 22 years. The future revenue of the Group and of the Company is dependent
on the prevailing market price, exchange rate on the transaction date as well as production volume, which is based on
contractual requirements.
In addition to the above, the Group and the Company entered into spot and short term contracts for the sales of various
oil and gas products with remaining tenures less than 1 year.
The Group also entered into long-term construction contracts. The following table shows revenue expected to be
recognised in the future related to performance obligations that are unsatisfied (or partially unsatisfied) as at 31 December
2020. The disclosure is only providing information for contracts that have a duration of more than one year.
Group
In RM Mil Under 1 year 1-5 years Total
Construction contracts 2,812 5,137 7,949
26. OPERATING (LOSS)/PROFIT
In RM Mil
Group Company
2020 2019 2020 2019
Included in operating profit are the following
charges:
Audit fees 40 38 2 2
Amortisation of:
- intangible assets 1,422 2,778 10 -
- contract costs 24 - - -
Bad debts written off:
- trade and other receivables 65 18 12 7
Intangible asset written off 20 - 20 -
Contribution to Tabung Amanah Negara 100 600 100 600
Depreciation of property, plant and equipment and
investment properties
34,580 35,900 2,114 3,656
Net impairment losses on:
- property, plant and equipment 25,702 6,539 2,092 -
- investment properties 12 - - -
- intangible assets 5,648 204 - -
- investment in an associate 151 230 - -
- receivables - 69 - -
- loan and advances to subsidiaries - - 353 -
- loan and advances to joint ventures 71 62 - -
- investments in subsidiaries - - 51 2,889
- other investments - 251 - -
Net impairment/write-off on well costs 2,246 1,248 - -
Net inventories written down to net realisable value/
written off
37 35 - -
Loss on disposal of:
- property, plant and equipment 19 69 - -
Property, plant and equipment written off 234 136 - -
Rental of facilities and equipments 220 296 51 52
Research and development expenditure 3 132 2 11
Staff costs:
- wages, salaries and others 10,080 11,488 2,281 2,523
- contributions to pension fund 1,184 1,145 344 331
Write-off trade receivables and loss of
remeasurement of finance lease receivables
846 - - -
Net loss on:
- derivatives 275 64 - -
- foreign exchange 1,093 235 1,162 458
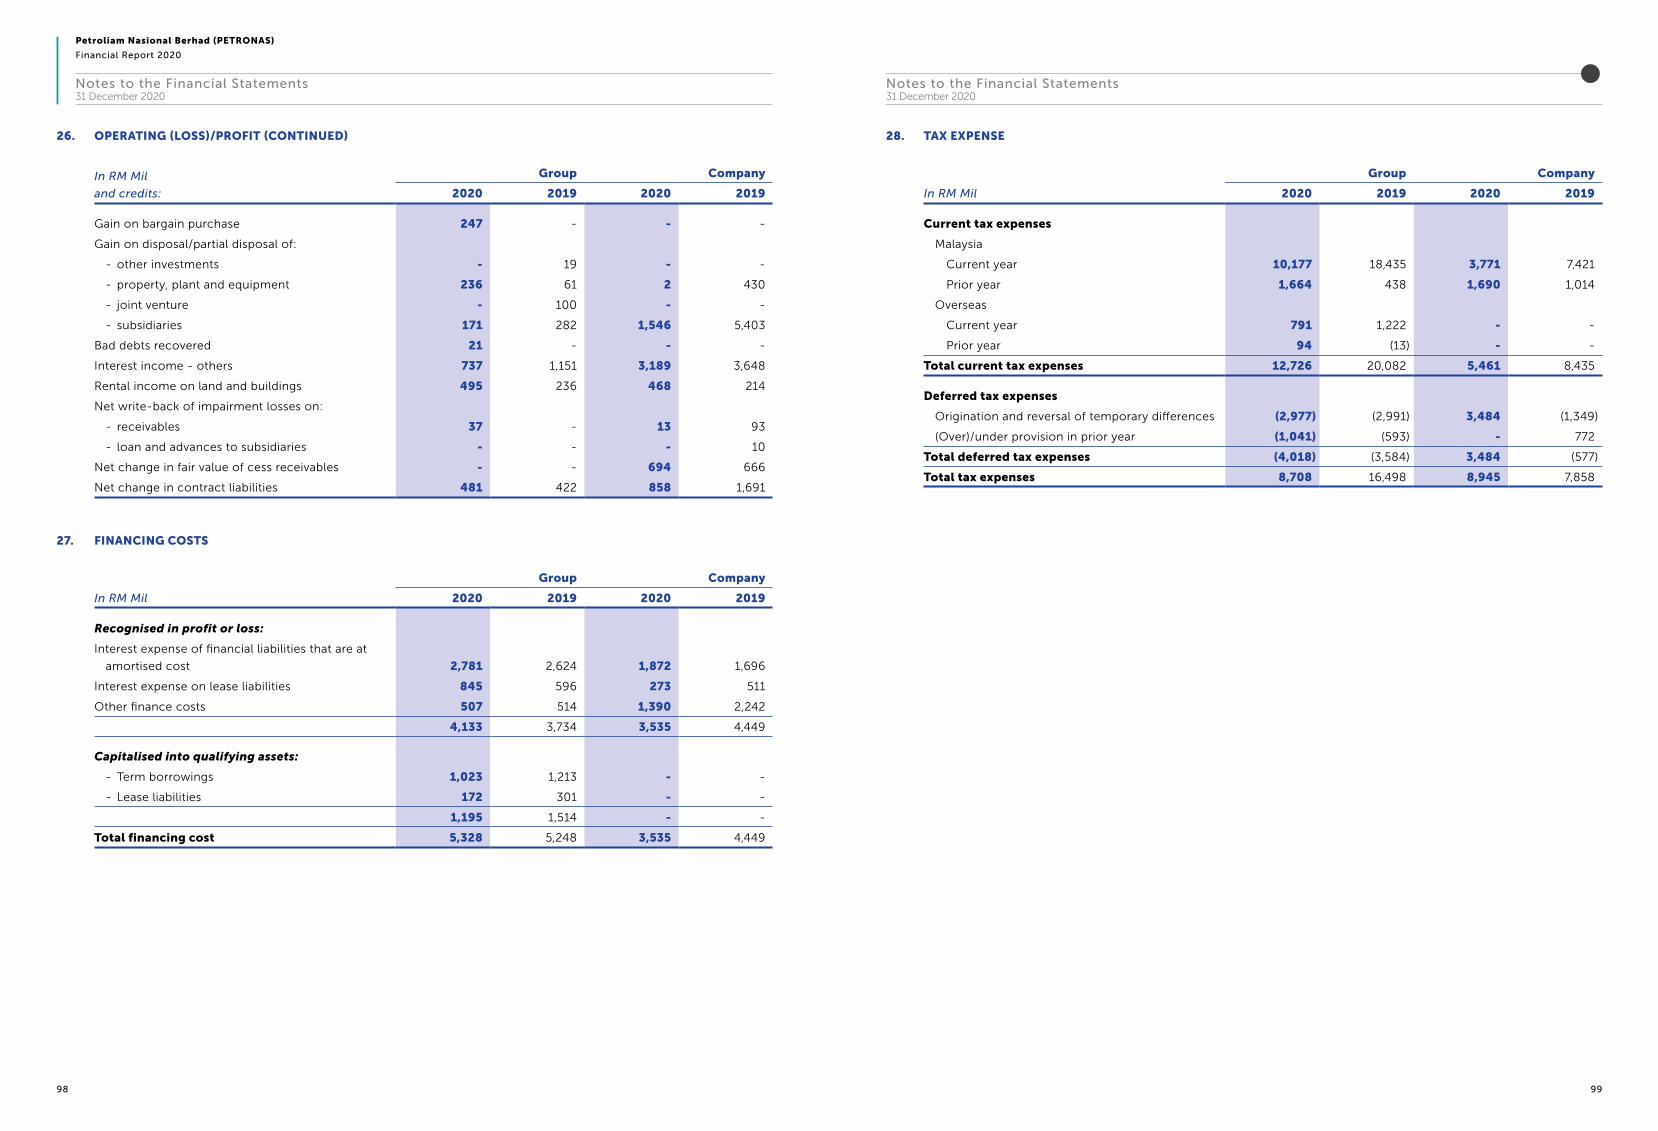
Petroliam Nasional Berhad (PETRONAS)
Financial Report 2020
98 99
Notes to the Financial Statements31 December 2020
Notes to the Financial Statements31 December 2020
26. OPERATING (LOSS)/PROFIT (CONTINUED)
In RM Mil
and credits:
Group Company
2020 2019 2020 2019
Gain on bargain purchase 247 - - -
Gain on disposal/partial disposal of:
- other investments - 19 - -
- property, plant and equipment 236 61 2 430
- joint venture - 100 - -
- subsidiaries 171 282 1,546 5,403
Bad debts recovered 21 - - -
Interest income - others 737 1,151 3,189 3,648
Rental income on land and buildings 495 236 468 214
Net write-back of impairment losses on:
- receivables 37 - 13 93
- loan and advances to subsidiaries - - - 10
Net change in fair value of cess receivables - - 694 666
Net change in contract liabilities 481 422 858 1,691
27. FINANCING COSTS
In RM Mil
Group Company
2020 2019 2020 2019
Recognised in profit or loss:
Interest expense of financial liabilities that are at
amortised cost 2,781 2,624 1,872 1,696
Interest expense on lease liabilities 845 596 273 511
Other finance costs 507 514 1,390 2,242
4,133 3,734 3,535 4,449
Capitalised into qualifying assets:
- Term borrowings 1,023 1,213 - -
- Lease liabilities 172 301 - -
1,195 1,514 - -
Total financing cost 5,328 5,248 3,535 4,449
28. TAX EXPENSE
In RM Mil
Group Company
2020 2019 2020 2019
Current tax expenses
Malaysia
Current year 10,177 18,435 3,771 7,421
Prior year 1,664 438 1,690 1,014
Overseas
Current year 791 1,222 - -
Prior year 94 (13) - -
Total current tax expenses 12,726 20,082 5,461 8,435
Deferred tax expenses
Origination and reversal of temporary differences (2,977) (2,991) 3,484 (1,349)
(Over)/under provision in prior year (1,041) (593) - 772
Total deferred tax expenses (4,018) (3,584) 3,484 (577)
Total tax expenses 8,708 16,498 8,945 7,858

Petroliam Nasional Berhad (PETRONAS)
Financial Report 2020
100 101
Notes to the Financial Statements31 December 2020
Notes to the Financial Statements31 December 2020
28. TAX EXPENSE (CONTINUED)
A reconciliation of income tax expense applicable to (loss)/profit before taxation at the statutory income tax rate to
income tax expense at the effective income tax rate of the Group and of the Company is as follows:
In RM Mil
Group % 2020 % 2019
(Loss)/Profit before taxation (12,321) 56,970
Taxation at Malaysian statutory tax rate 24 (2,957) 24 13,673
Effect of different tax rates in foreign jurisdictions 9 (1,142) (1) (766)
Effect of different tax rates between corporate income tax and
petroleum income tax (10) 1,260 4 2,530
Effect of changes in tax rates - 21 - (84)
Non deductible expenses, net of non assessable income (64) 7,945 6 3,137
Tax exempt income 5 (575) (2) (922)
Tax incentives 14 (1,729) (1) (464)
Effect of deferred tax benefits not recognised (27) 3,364 - -
Effect of deferred tax benefits previously not recognised 22 (2,731) (1) (481)
Reversal of deferred tax benefits previously recognised (36) 4,383 - -
Foreign exchange translation difference (1) 152 - 43
(64) 7,991 29 16,666
Under/(Over) provision in prior years 717 (168)
Tax expense 8,708 16,498
Company
Profit before taxation 17,655 49,452
Taxation at Malaysian statutory tax rate 24 4,237 24 11,868
Effect of different tax rates between corporate income tax and
petroleum income tax 6 1,072 6 2,985
Non deductible expenses, net of non assessable income 2 379 (3) (1,303)
Effect of deferred tax benefits not recognised 2 373 - 188
Reversal of deferred tax benefits previously recognised 25 4,383 - -
Tax exempt income (18) (3,189) (16) (7,666)
41 7,255 11 6,072
Under provision in prior years 1,690 1,786
Tax expense 8,945 7,858
In measuring the provision for taxation and deferred taxation at reporting date, the management applied judgments
and estimates in relation to certain interpretation of tax legislation in arriving at the Company’s tax position. Judgments
and estimates are based on the current tax legislation and best available information as at the reporting date. The
management continuously reassesses its judgments and estimates whenever there is a change in circumstances.
29. DIVIDENDS
2020
In RM Mil Total
In respect of financial year ended 31 December 2019
Final dividend of RM240,000 per ordinary share 24,000
In respect of financial year ended 31 December 2020
Dividend of RM100,000 per ordinary share 10,000
Total 34,000
2019
In RM Mil
In respect of financial year ended 31 December 2018
Final dividend of RM240,000 per ordinary share 24,000
Total 24,000
The Directors had on 25 February 2021 declared a dividend of RM180,000 per ordinary share amounting to RM18 billion.
This dividend has not been accounted for in the financial statements for the year ended 31 December 2020.

Petroliam Nasional Berhad (PETRONAS)
Financial Report 2020
102 103
Notes to the Financial Statements31 December 2020
Notes to the Financial Statements31 December 2020
30. NET CASH (USED IN)/GENERATED FROM INVESTING ACTIVITIES
The cash (used in)/generated from investing activities comprise:
In RM Mil
Group Company
2020 2019 2020 2019
Acquisition of:
- subsidiaries, net of cash acquired (Note 32) (158) (1,763) - -
- additional shares in subsidiaries - - (5,008) (5,193)
Dividends received 1,279 1,666 11,148 28,850
Investment in:
- associates, joint ventures and unquoted
companies (82) (807) - -
- securities and other investments (4,237) (5,269) (2,572) (3,124)
Long-term receivables and advances (to)/repaid
from:
- subsidiaries - - 4,235 (2,934)
- a joint venture (861) (3,547) (861) (3,547)
Proceeds from disposal/partial disposal of:
- investment in subsidiaries, net of cash disposed
(Note 33) 64 187 3,048 6,227
- investment in a joint venture - 687 - -
- property, plant and equipment 584 617 2 -
- securities and other investments 2,944 1,295 1,284 889
Proceeds from redemption of preference shares in
joint ventures 670 - 150 -
Purchase of property, plant and equipment,
investment properties, intangible assets and land
held for development (33,117) (45,243) (486) (936)
Redemption of preference shares in subsidiaries - - 1,374 1,335
(32,914) (52,177) 12,314 21,567
31. NET CASH USED IN FINANCING ACTIVITIES
The cash used in financing activities comprise:
In RM Mil
Group Company
2020 2019 2020 2019
Dividends paid (34,000) (54,000) (34,000) (54,000)
Dividends paid to non-controlling interests (4,703) (5,638) - -
Drawdown of:
- Islamic financing facilities 1,691 275 - -
- term loans 11,247 9,270 - -
- Notes and Bonds 26,097 - 26,097 -
- bankers’ acceptances 1,311 447 - -
- revolving credits 2,738 210 - -
Payment of lease liabilities (Note (a)) (4,232) (2,921) (805) (1,851)
Repayment of:
- Islamic financing facilities (5,983) (691) (5,368) -
- term loans (11,916) (9,479) - -
- Notes and Bonds - (12,569) - (12,569)
- bankers’ acceptances (117) (116) - -
- revolving credits (2,677) (822) - -
Payment to non-controlling interests on redemption
of redeemable preference shares - (73) - -
Proceeds from partial disposal of equity interest to
non-controlling interests 3,077 6,227 - -
(17,467) (69,880) (14,076) (68,420)
(a) Payment of lease liabilities comprises mainly of principal and interest paid in relation to lease liabilities.

Petroliam Nasional Berhad (PETRONAS)
Financial Report 2020
104 105
Notes to the Financial Statements31 December 2020
Notes to the Financial Statements31 December 2020
31. NET CASH USED IN FINANCING ACTIVITIES (CONTINUED)
Reconciliation of movement of liabilities to cash flows arising from financing activities:
2020
In RM Mil Borrowings
Group
Dividends Borrowings
Company
Dividends
Balance at 1 January 2020 68,738 - 31,253 -
Changes from financing cash flows
(Repayment)/Drawdown of:
Term loans (669) - - -
Islamic financing facilities (4,292) - (5,368) -
Revolving credits 61 - - -
Notes and Bonds 26,097 - 26,097 -
Bankers’ acceptances 1,194 - - -
Lease liabilities (3,384) - (805) -
Bank overdrafts 247 - - -
Dividends paid - (34,000) - (34,000)
Total changes from financing cash flows 19,254 (34,000) 19,924 (34,000)
Changes arising from obtaining or losing control
of subsidiaries or other business
Lease liabilities 37 - - -
The effect of changes in foreign exchange rates
Islamic financing facilities 266 - 247 -
Term loans (111) - - -
Lease liabilities (736) - (15) -
Bankers’ acceptances 13 - - -
Bank overdrafts 1 - - -
Notes and Bonds (2,459) - (2,454) -
Revolving credits (23) - - -
(3,049) - (2,222) -
Liability-related other changes
Dividend declared - 34,000 - 34,000
Acquisition of new leases 1,655 - - -
Re-measurement of lease liabilities 760 - 3,611 -
Financing costs 834 - 288 -
Total liability-related other changes 3,249 34,000 3,899 34,000
Balance at 31 December 2020 88,229 - 52,854 -
31. NET CASH USED IN FINANCING ACTIVITIES (CONTINUED)
2019
In RM Mil Borrowings
Group
Dividends Borrowings
Company
Dividends
Balance at 1 January 2019 79,343 30,000 49,734 30,000
Changes from financing cash flows
(Repayment)/Drawdown of:
Term loans (209) - - -
Islamic financing facilities (416) - - -
Revolving credits (728) - - -
Notes and Bonds (12,569) - (12,569) -
Bankers’ acceptances 447 - - -
Lease liabilities (2,324) - (1,851) -
Bank overdrafts (85) - - -
Dividends paid - (54,000) - (54,000)
Total changes from financing cash flows (15,884) (54,000) (14,420) (54,000)
Changes arising from obtaining or losing control
of subsidiaries or other business
Term loans 536 - - -
Lease liabilities 82 - - -
Bank overdrafts 34 - - -
652 - - -
The effect of changes in foreign exchange rates
Islamic financing facilities (56) - 78 -
Term loans (255) - - -
Lease liabilities (440) - 117 -
Bankers’ acceptances 2 - - -
Bank overdrafts 3 - - -
Notes and Bonds (239) - (233) -
(985) - (38) -
Liability-related other changes
Dividend declared - 24,000 - 24,000
Acquisition of new leases 4,754 - - -
Termination of lease (2) - (4,553) -
Financing costs 860 - 530 -
Total liability-related other changes 5,612 24,000 (4,023) 24,000
Balance at 31 December 2019 68,738 - 31,253 -

Petroliam Nasional Berhad (PETRONAS)
Financial Report 2020
106 107
Notes to the Financial Statements31 December 2020
Notes to the Financial Statements31 December 2020
32. ACQUISITION OF SUBSIDIARIES
Acquisition of a Subsidiary
On 4 September 2020, PETRONAS via its wholly-owned subsidiary, Amplus Energy Solutions Pte. Ltd. (“AESPL”), has
fulfilled all the conditions of its Sale and Purchase Agreement entered with ACME Solar Holding Private Limited for the
acquisition of 100% equity interest in Acme Rewari Solar Private Limited and Acme Kurukshetra Solar Private Limited
(“ACME”). ACME are operating utility-based plants in the state of Karnataka, India. Following this acquisition, ACME has
become a wholly-owned subsidiary of AESPL.
The results contributed by ACME from the date of acquisition is not material in relation to the Group’s financial statements.
Step up acquisition of a Joint Venture
On 15 June 2020, PETRONAS via its wholly-owned subsidiary, KLCC Holdings Sdn. Bhd. (“KLCCH”), has fulfilled all the
conditions of the Third Supplemental Joint Venture Agreement signed with QD Asia Pacific Ltd. for the subscription of
additional 18.75% equity interests in Cititower Sdn. Bhd. (“CTSB”). With the completion of the transaction, KLCCH now
holds 68.75% equity interests in CTSB which has become a partly-owned subsidiary of KLCCH. The principal activity of
CTSB is property investment.
The results contributed by this subsidiary from the date of acquisition is not material in relation to the Group’s financial
statements.
33. DISPOSAL/PARTIAL DISPOSAL OF SUBSIDIARIES AND EQUITY INTERESTS
Disposal of Subsidiaries
PETRONAS via its wholly-owned subsidiary, PETRONAS Energy Trading Limited (“PETL”), disposed off Humbly Grove
Energy Limited and its subsidiaries. The results of these subsidiaries from 1 January 2020 to the date of disposal is not
material in relation to the Group’s financial statements.
Partial Disposal of Equity Interests in MISC Berhad (“MISC”) and KLCC Property Holdings Berhad (“KLCCP”)
On 10 December 2020, PETRONAS has partially disposed off its equity interests in MISC Berhad (“MISC”) and KLCC
Property Holdings Berhad (“KLCCP”) of 6.56% and 8.53% respectively. With the completion of the transaction, the Group
now holds 51.00% and 66.94% equity interests in MISC and KLCCP respectively.
34. COMMITMENTS
Outstanding commitments in respect of capital expenditure at the end of the reporting year not provided for in the
financial statements are:
In RM Mil
Group Company
2020 2019 2020 2019
Capital expenditure
Approved and contracted for
Less than one year 11,740 18,832 477 176
Between one and five years 21,032 24,833 3,149 2,744
More than five years 82 - - -
32,854 43,665 3,626 2,920
Approved but not contracted for
Less than one year 13,395 20,723 - 1
Between one and five years 61,968 57,085 84 4
More than five years 1,380 - - -
76,743 77,808 84 5
109,597 121,473 3,710 2,925
Share of capital expenditure of joint venture
Approved and contracted for
Less than one year 8,432 3,565 - -
Between one and five years 10,833 19,192 - -
More than five years 898 2,117 - -
20,163 24,874 - -
Approved but not contracted for
Less than one year 3,498 1,947 - -
Between one and five years 23,530 23,310 - -
More than five years 9,248 188 - -
36,276 25,445 - -
56,439 50,319 - -
166,036 171,792 3,710 2,925

Petroliam Nasional Berhad (PETRONAS)
Financial Report 2020
108 109
Notes to the Financial Statements31 December 2020
Notes to the Financial Statements31 December 2020
35. CONTINGENT LIABILITIES
Material litigation
In 2019, the State of Sarawak brought a legal suit against PETRONAS in the Kuching High Court, alleging that PETRONAS
failed to make payments of RM1,345 million for the state sales tax (“SST”) imposed on petroleum products including
interests and penalties under the Sarawak Sales Tax Ordinance 1998 (as amended in 2018). In response, PETRONAS had
filed a judicial review to challenge the jurisdiction of the State of Sarawak over the imposition of sales tax on petroleum
products. At the same time, PETRONAS filed a defence against the civil suit and a stay of proceedings of the civil suit
pending the disposal of the judicial review and determination of certain points of law to the Federal Court.
Notwithstanding PETRONAS’ legal position, in order to achieve mutual benefit to PETRONAS and State of Sarawak and
to create a stable environment for investment in Sarawak, PETRONAS on 3 August 2020, withdrew its appeal against the
High Court of Kuching’s decision in relation to the judicial review. On 6 August 2020, Sarawak State also withdrew their
civil suit against PETRONAS. PETRONAS and the affected subsidiaries have accordingly submitted their respective SST
returns. On 15 September 2020, PETRONAS and the affected subsidiaries paid a total of RM2,957 million to the State of
Sarawak, being the final and full settlement for the financial year 2019. In addition, PETRONAS has achieved a commercial
resolution with the State of Sarawak on the SST and other matters raised by the State of Sarawak with the entry into the
Commercial Settlement Agreement between PETRONAS and the State of Sarawak on 7 December 2020.
There were no other material contingent liabilities or contingent assets since the last audited consolidated statement of
financial position as at 31 December 2019.
Other guarantees
Other than those disclosed elsewhere in the financial statements, the Group and the Company had entered into agreements
which may include agreements to provide guarantees to third parties for the benefit of subsidiaries, associates and joint
ventures (“Guaranteed Entities”). Such unsecured guarantees are normally provided in support of the Guaranteed Entities’
normal and on-going business requirements, consistent with generally acceptable and recognised industry practices.
The liability of the Group and the Company is therefore contingent and would only trigger upon the default of the
Guaranteed Entities’ obligation under the guarantee.
36. RELATED PARTY DISCLOSURES
For the purposes of these financial statements, parties are considered to be related to the Company if the Company has
the ability, directly or indirectly, to control or jointly control the party or exercise significant influence over the party in
making financial and operating decisions, or vice versa, or where the Group or the Company and the party are subject to
common control. Related parties may be individuals or other entities.
Related parties also include key management personnel defined as those persons having authority and responsibility for
planning, directing and controlling the activities of the Group either directly or indirectly and an entity that provides key
management personnel services to the Group. The key management personnel include all the Directors of the Company.
The Company’s related parties include key management personnel, subsidiaries, associates, joint ventures as well as the
Government of Malaysia and its related entities as the Company is wholly-owned by the Government of Malaysia.
36. RELATED PARTY DISCLOSURES (CONTINUED)
Key management personnel compensation
In RM Mil
Group and Company
2020 2019
Director fees, emoluments, remuneration and gratuity 26 19
The estimated monetary value of Directors’ benefits-in-kind is RM78,000 (2019: RM100,000).
Significant transactions with related parties
In addition to the transactions detailed elsewhere in the financial statements, the Group and the Company had the
following transactions with related parties during the financial year:
Group
In RM Mil 2020 2019
Federal and State Governments of Malaysia:
Petroleum proceeds (6,404) (9,826)
Lease income 1,286 1,420
Sales of petroleum products 228 307
Sales of utilities 179 160
Building maintenance income 342 100
Government of Malaysia’s related entities:
Sales of petroleum products and processed gas 5,490 11,369
Associate companies:
Sales of petrochemical products and processed gas 7,617 8,247
Joint arrangements:
Sales of industrial utilities 1,640 1,200
Allocated expenses charged out 641 804
Site services charges 414 290
Sales of petrochemical products 308 299
Project expenses (310) (230)
Other expenses (166) (170)
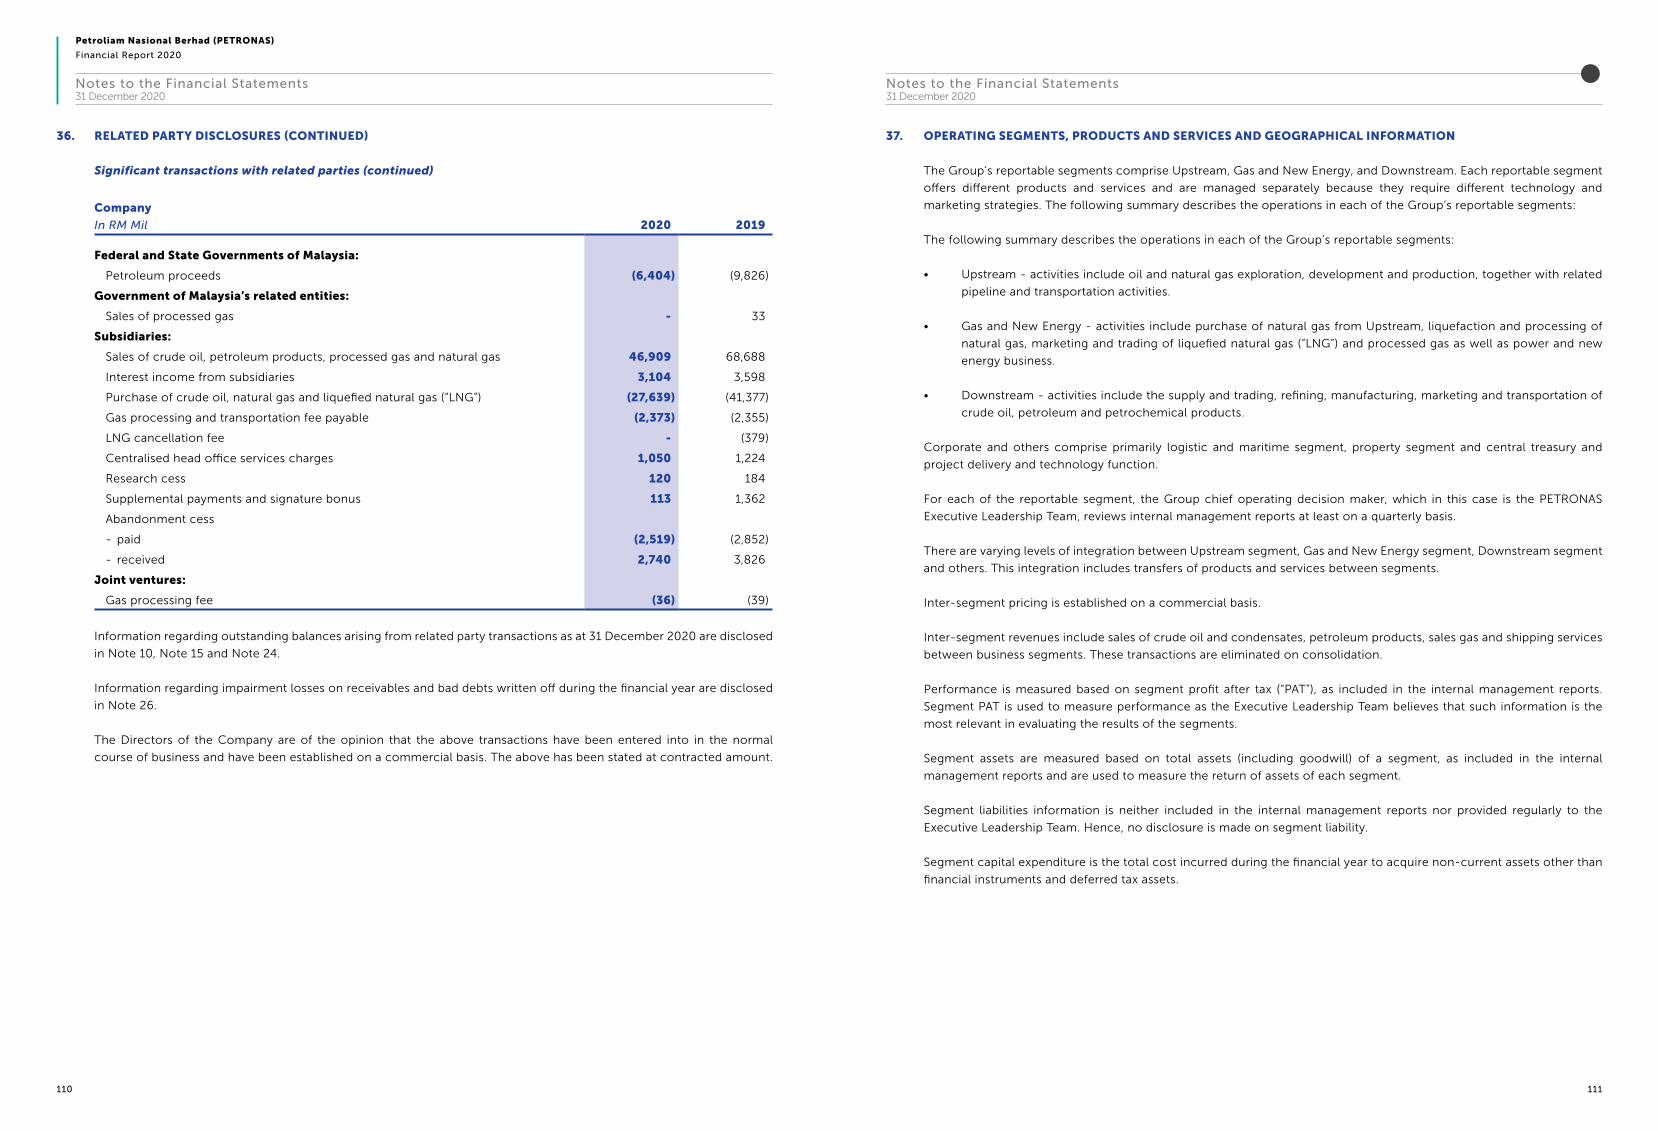
Petroliam Nasional Berhad (PETRONAS)
Financial Report 2020
110 111
Notes to the Financial Statements31 December 2020
Notes to the Financial Statements31 December 2020
36. RELATED PARTY DISCLOSURES (CONTINUED)
Significant transactions with related parties (continued)
Company
In RM Mil 2020 2019
Federal and State Governments of Malaysia:
Petroleum proceeds (6,404) (9,826)
Government of Malaysia’s related entities:
Sales of processed gas - 33
Subsidiaries:
Sales of crude oil, petroleum products, processed gas and natural gas 46,909 68,688
Interest income from subsidiaries 3,104 3,598
Purchase of crude oil, natural gas and liquefied natural gas (“LNG”) (27,639) (41,377)
Gas processing and transportation fee payable (2,373) (2,355)
LNG cancellation fee - (379)
Centralised head office services charges 1,050 1,224
Research cess 120 184
Supplemental payments and signature bonus 113 1,362
Abandonment cess
- paid (2,519) (2,852)
- received 2,740 3,826
Joint ventures:
Gas processing fee (36) (39)
Information regarding outstanding balances arising from related party transactions as at 31 December 2020 are disclosed
in Note 10, Note 15 and Note 24.
Information regarding impairment losses on receivables and bad debts written off during the financial year are disclosed
in Note 26.
The Directors of the Company are of the opinion that the above transactions have been entered into in the normal
course of business and have been established on a commercial basis. The above has been stated at contracted amount.
37. OPERATING SEGMENTS, PRODUCTS AND SERVICES AND GEOGRAPHICAL INFORMATION
The Group’s reportable segments comprise Upstream, Gas and New Energy, and Downstream. Each reportable segment
offers different products and services and are managed separately because they require different technology and
marketing strategies. The following summary describes the operations in each of the Group’s reportable segments:
The following summary describes the operations in each of the Group’s reportable segments:
• Upstream - activities include oil and natural gas exploration, development and production, together with related
pipeline and transportation activities.
• Gas and New Energy - activities include purchase of natural gas from Upstream, liquefaction and processing of
natural gas, marketing and trading of liquefied natural gas (“LNG”) and processed gas as well as power and new
energy business.
• Downstream - activities include the supply and trading, refining, manufacturing, marketing and transportation of
crude oil, petroleum and petrochemical products.
Corporate and others comprise primarily logistic and maritime segment, property segment and central treasury and
project delivery and technology function.
For each of the reportable segment, the Group chief operating decision maker, which in this case is the PETRONAS
Executive Leadership Team, reviews internal management reports at least on a quarterly basis.
There are varying levels of integration between Upstream segment, Gas and New Energy segment, Downstream segment
and others. This integration includes transfers of products and services between segments.
Inter-segment pricing is established on a commercial basis.
Inter-segment revenues include sales of crude oil and condensates, petroleum products, sales gas and shipping services
between business segments. These transactions are eliminated on consolidation.
Performance is measured based on segment profit after tax (“PAT”), as included in the internal management reports.
Segment PAT is used to measure performance as the Executive Leadership Team believes that such information is the
most relevant in evaluating the results of the segments.
Segment assets are measured based on total assets (including goodwill) of a segment, as included in the internal
management reports and are used to measure the return of assets of each segment.
Segment liabilities information is neither included in the internal management reports nor provided regularly to the
Executive Leadership Team. Hence, no disclosure is made on segment liability.
Segment capital expenditure is the total cost incurred during the financial year to acquire non-current assets other than
financial instruments and deferred tax assets.

Petroliam Nasional Berhad (PETRONAS)
Financial Report 2020
112 113
Notes to the Financial Statements31 December 2020
Notes to the Financial Statements31 December 2020
37. OPERATING SEGMENTS, PRODUCTS AND SERVICES AND GEOGRAPHICAL INFORMATION (CONTINUED)
Group
2020
In RM Mil Upstream
Gas and
New Energy Downstream
Corporate
and
others
Consolidation
adjustments
and
eliminations Total
Revenue
Third parties 28,734 54,621 84,183 11,203 - 178,741
Inter-segment 42,033 7,566 1,194 5,124 (55,917) -
Total revenue 70,767 62,187 85,377 16,327 (55,917) 178,741
Reportable segment (loss)/
profit (10,218) (9,983) (3,458) 242 2,388 (21,029)
Included in the measure of segment (loss)/profit are:
Depreciation and amortisation (22,728) (4,983) (4,724) (3,591) - (36,026)
Net impairment losses on assets
and write-off on well costs (17,845) (13,568) (1,673) (707) - (33,793)
Interest income 1,493 251 405 5,848 (3,159) 4,838
Interest expense (4,533) (1,941) (325) (2,606) 5,272 (4,133)
Share of profit/(loss) after tax
and non-controlling
interests of equity
accounted associates and
joint ventures 261 52 (384) 399 - 328
Tax expense (2,985) (3,416) (479) (1,175) (653) (8,708)
Segment assets 245,163 101,748 123,788 162,194 (58,822) 574,071
Included in the measure of segment assets are:
Investments in associates and
joint ventures 4,719 756 6,322 802 - 12,599
Additions to non-current assets
other than financial
instruments and deferred tax
assets 14,351 7,637 4,965 6,404 - 33,357
37. OPERATING SEGMENTS, PRODUCTS AND SERVICES AND GEOGRAPHICAL INFORMATION (CONTINUED)
Group
2019
In RM Mil Upstream
Gas and
New Energy Downstream
Corporate
and
others
Consolidation
adjustments
and
eliminations Total
Revenue
Third parties 37,766 74,666 114,157 13,674 - 240,263
Inter-segment 64,826 8,652 1,328 4,211 (79,017) -
Total revenue 102,592 83,318 115,485 17,885 (79,017) 240,263
Reportable segment profit 22,199 9,780 5,166 4,675 (1,348) 40,472
Included in the measure of segment profit are:
Depreciation and amortisation (26,320) (4,824) (3,799) (3,735) - (38,678)
Impairment losses on assets
and write-off on well costs (2,366) (5,780) (216) (241) - (8,603)
Interest income 2,128 516 725 7,379 (3,859) 6,889
Interest expense (4,526) (2,254) (294) (2,453) 5,793 (3,734)
Share of profit after tax
and non-controlling
interests of equity
accounted associates and
joint ventures 330 368 42 279 - 1,019
Tax expense (11,947) (3,971) (302) (495) 217 (16,498)
Segment assets 258,218 120,580 131,014 171,035 (58,426) 622,421
Included in the measure of segment assets are:
Investments in associates and
joint ventures 5,355 841 7,492 2,214 - 15,902
Additions to non-current assets
other than financial
instruments and deferred tax
assets 23,984 8,416 11,005 4,408 - 47,813

Petroliam Nasional Berhad (PETRONAS)
Financial Report 2020
114 115
Notes to the Financial Statements31 December 2020
Notes to the Financial Statements31 December 2020
37. OPERATING SEGMENTS, PRODUCTS AND SERVICES AND GEOGRAPHICAL INFORMATION (CONTINUED)
Products and services information
The following are revenue from external customers by products and services:
Group
In RM Mil 2020 2019
Petroleum products 62,705 85,562
Crude oil and condensates 23,710 35,792
Liquefied natural gas 37,669 51,298
Natural and processed gas 22,305 29,082
Petrochemical products 14,177 16,022
Shipping services 2,577 2,780
Investment income 4,101 5,738
Others 11,497 13,989
178,741 240,263
Geographical information
Geographical revenue is determined based on location of customers. The amounts presented in non-current assets
are based on the geographical location of the assets and do not include financial instruments (including investments in
associates and joint ventures) nor deferred tax assets.
Group
In RM Mil
Revenue
2020 2019
Asia 54,006 70,113
Malaysia 56,098 79,433
Japan 17,608 20,760
South Africa 14,873 23,993
Rest of the worlda 36,156 45,964
178,741 240,263
Group
In RM Mil
Non-current assets
2020 2019
Malaysia 238,264 248,619
Rest of the worlda 86,951 108,553
325,215 357,172
Major customers
As at 31 December 2020 and 31 December 2019, there are no major customers with revenue that contribute to more
than 10 percent of the Group’s revenue.
a Comprises revenue and non-current assets individually not material.
38. PETROLEUM ARRANGEMENTS
The Petroleum Development Act, 1974 vests the entire ownership, rights, powers, liberties and privileges of exploiting
petroleum resources on land and offshore Malaysia in PETRONAS. In addition, the Group via its subsidiaries participated
in various petroleum arrangements outside Malaysia as contractors.
Production sharing contracts (“PSCs”)
Malaysia
The monetisation of petroleum resources is carried out primarily by means of PSCs between PETRONAS, its subsidiaries
and other oil and gas companies (“PSC Contractors”). Under the terms of the various PSCs, the PSC Contractors shall
bear all the costs and may recover their costs in barrels of crude oil or gas equivalent in accordance with the terms of
their respective PSCs.
Certain terms of the PSCs are:
i. Research cess, supplemental payments and crude oil or gas entitlement
The determination of research cess, supplemental payments, and PETRONAS’ and the PSC Contractors’ entitlements
to crude oil or gas produced subsequent to 31 December 1992 have been based on the returns submitted by PSC
Contractors and is dependent on agreement being reached on the method of valuation of crude oil or gas and the
quantum of costs incurred and claimed by contractors subject to the maximum rate provided under the respective
PSCs for the year. PETRONAS’ entitlements to crude oil and natural gas are taken up as income on the basis of
liftings and sales respectively made by the Company. Research cess and supplemental payment are not applicable
for certain PSCs that are reaching tail end of production life cycle.
ii. Property, plant and equipment and intangible assets
Title to all equipment and other assets purchased or acquired by PSC Contractors exclusively for the purpose
of petroleum operations, and which costs are recoverable in barrels of cost oil or gas equivalent, is vested with
PETRONAS. However, the values of these assets are not taken up in the financial statements of PETRONAS other
than:
• the property, plant and equipment of a subsidiary which is also a contractor to PETRONAS under certain
PSCs; and
• the estimated costs of decommissioning and removing the assets and restoring the site on which they are
located where there is an obligation to do so.
iii. Inventories
Title to all crude oil held in inventories by the PSC Contractors lies with PETRONAS and title to the contractors’
entitlement passes only upon delivery at point of export.
iv. Abandonment
The PSCs stipulate the rights and obligation of PETRONAS and the PSC Contractors (“PSC Parties”) in relation to the
abandonment of the oil and gas properties. The PSC Contractors have the obligation to undertake abandonment
activities during the PSC period except for certain PSCs or facilities where the abandonment obligation lies with
PETRONAS.
In addition, the PSC Contractors are also required to make abandonment cess contribution to Abandonment Cess
Fund via PETRONAS in accordance with the terms of the PSCs. The PSC Contractors have the rights to request
PETRONAS to reimburse the abandonment cess up to the cumulative amount paid upon the execution of the
abandonment activities.

Petroliam Nasional Berhad (PETRONAS)
Financial Report 2020
116 117
Notes to the Financial Statements31 December 2020
Notes to the Financial Statements31 December 2020
38. PETROLEUM ARRANGEMENTS (CONTINUED)
Concession agreement
Under the terms of Concession Agreements, the subsidiaries of the Group participate in Consortium Agreements for
the rights to carry out exploration and exploitation activities. The Consortium bears all costs as outlined in the Annual
Work Programme and Budget. Title to all equipment and other assets purchased and acquired by the consortium for the
purpose of petroleum operations will remain with the consortium for the duration of the Concession Agreements and the
equity value of the assets is recognised in the financial statements of the relevant subsidiaries of the Group as property,
plant and equipment as per accounting policies set out in Note 2.4.
Upon production, the title to the crude oil produced to which the consortium is entitled to, shall pass to the consortium
at the point of production at the wellhead. Each member of the consortium shall own and may separately take or dispose
of its own share of the crude oil.
The consortium shall pay the host authority a royalty on the consortium’s total production of the crude oil for each
calendar month in-kind or in-cash. By virtue of its petroleum operations, the consortium is subject to direct tax on
profits, where each member of the consortium shall separately calculate its taxable income and shall remain responsible
for its own corporate income tax return.
39. FINANCIAL INSTRUMENTS
Categories of financial instruments
The following table provides an analysis of financial instruments categorised as follows:
(i) Fair value through profit or loss (“FVTPL”)
- Mandatorily required by MFRS 9
- Designated upon initial recognition (“DUIR”)
(ii) Fair value through other comprehensive income (“FVOCI”)
- Debt instrument (“DI”)
- Equity instrument designated upon initial recognition (“EIDUIR”)
(iii) Amortised cost (“AC”)
38. PETROLEUM ARRANGEMENTS (CONTINUED)
Production sharing contracts (“PSCs”) (continued)
Outside Malaysia
In the international PSC arrangements, where the Group acts as a contractor, has largely similar arrangements as per
Malaysia PSCs subject to the relevant laws and regulations in the respective countries. In respect of abandonment for
most of the countries, the Group makes contribution into escrow accounts/any other approved accounts.
Service contracts
Risk Service Contract (“RSCs”) Malaysia
Under the terms of the RSC, RSC Contractors provide services for the development and production of oil and gas
resources on behalf of PETRONAS, in return of cost reimbursement upon commercial production and performance
based remuneration fees. PETRONAS retains ownership of the assets and crude oil and gas produced.
Development and Production Service Contracts (“DPSCs”)
Under the terms of DPSC, the subsidiaries of the Group act as contractors that provide services for development and
production of oil and gas resources on behalf of host authority.
Certain terms of DPSCs are:
i. Crude oil and gas entitlement
DPSC contractors shall incur all upfront costs during the initial period of investment and will be reimbursed once
the contractual obligation upon production of crude oil and gas is met. Under the terms of DPSCs, the host
authority own the title to all equipment and other assets acquired by the contractors during the contractual period
of the DPSCs.
Contractors are entitled to recover their expenditure incurred in relation to the petroleum operations of the
DPSCs, based on the provisions stipulated in the DPSCs.
Contractors are also entitled to remuneration fees which commensurate with their performance as stipulated in
the provision of the DPSCs.
All barrels of crude oil and gas produced belong to the host authority. The Group’s entitlements to oil and gas are
recognised as revenue based on two elements, costs reimbursement and remuneration fees.
ii. Intangible assets and other financial assets
Title to all equipment and other assets constructed belong to the host authority and contractually, the contractors
acquire the right to use these assets for the duration specified under the DPSCs. The right to use these assets is
recognised in the financial statements of the Group as intangible assets, as per accounting policies set out in Note
2.9.
In circumstances where the contractors have the right to receive cash or other financial assets for their services
from or at the discretion of the host authority, these assets are recognised as trade receivables.
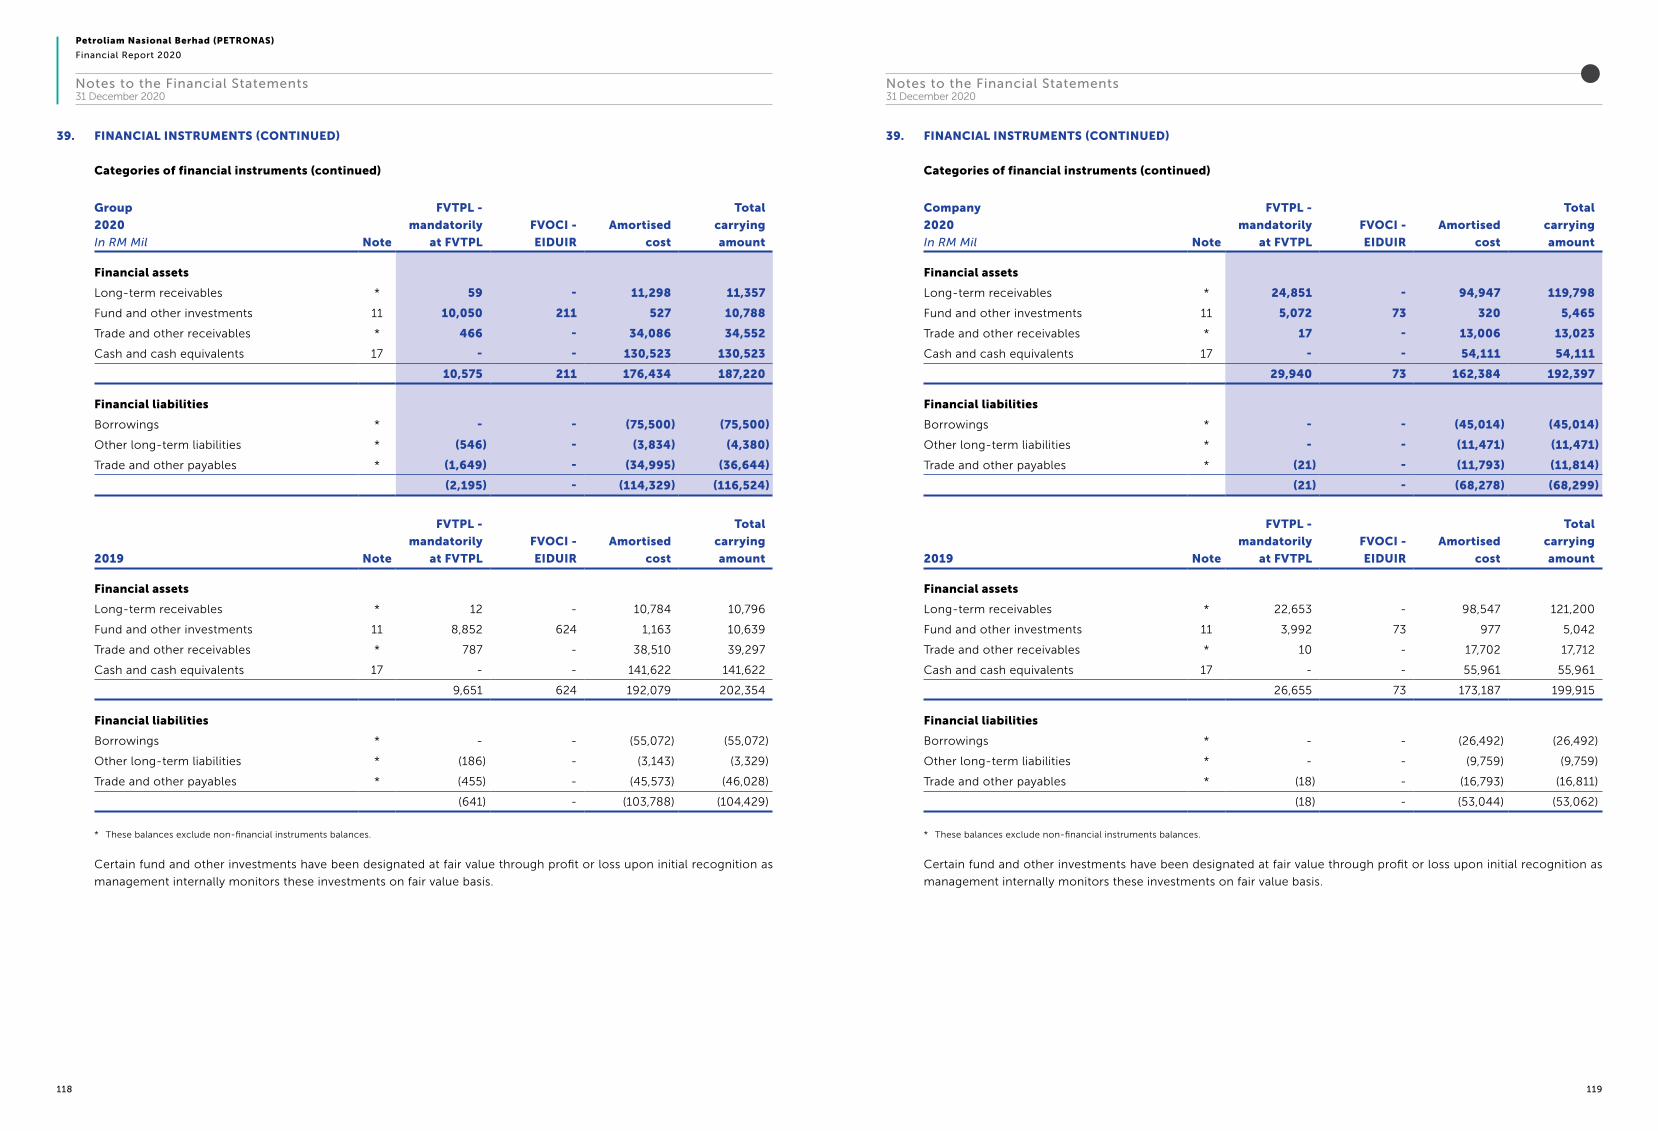
Petroliam Nasional Berhad (PETRONAS)
Financial Report 2020
118 119
Notes to the Financial Statements31 December 2020
Notes to the Financial Statements31 December 2020
39. FINANCIAL INSTRUMENTS (CONTINUED)
Categories of financial instruments (continued)
Company
2020
In RM Mil Note
FVTPL -
mandatorily
at FVTPL
FVOCI -
EIDUIR
Amortised
cost
Total
carrying
amount
Financial assets
Long-term receivables * 24,851 - 94,947 119,798
Fund and other investments 11 5,072 73 320 5,465
Trade and other receivables * 17 - 13,006 13,023
Cash and cash equivalents 17 - - 54,111 54,111
29,940 73 162,384 192,397
Financial liabilities
Borrowings * - - (45,014) (45,014)
Other long-term liabilities * - - (11,471) (11,471)
Trade and other payables * (21) - (11,793) (11,814)
(21) - (68,278) (68,299)
2019 Note
FVTPL -
mandatorily
at FVTPL
FVOCI -
EIDUIR
Amortised
cost
Total
carrying
amount
Financial assets
Long-term receivables * 22,653 - 98,547 121,200
Fund and other investments 11 3,992 73 977 5,042
Trade and other receivables * 10 - 17,702 17,712
Cash and cash equivalents 17 - - 55,961 55,961
26,655 73 173,187 199,915
Financial liabilities
Borrowings * - - (26,492) (26,492)
Other long-term liabilities * - - (9,759) (9,759)
Trade and other payables * (18) - (16,793) (16,811)
(18) - (53,044) (53,062)
* These balances exclude non-financial instruments balances.
Certain fund and other investments have been designated at fair value through profit or loss upon initial recognition as
management internally monitors these investments on fair value basis.
39. FINANCIAL INSTRUMENTS (CONTINUED)
Categories of financial instruments (continued)
Group
2020
In RM Mil Note
FVTPL -
mandatorily
at FVTPL
FVOCI -
EIDUIR
Amortised
cost
Total
carrying
amount
Financial assets
Long-term receivables * 59 - 11,298 11,357
Fund and other investments 11 10,050 211 527 10,788
Trade and other receivables * 466 - 34,086 34,552
Cash and cash equivalents 17 - - 130,523 130,523
10,575 211 176,434 187,220
Financial liabilities
Borrowings * - - (75,500) (75,500)
Other long-term liabilities * (546) - (3,834) (4,380)
Trade and other payables * (1,649) - (34,995) (36,644)
(2,195) - (114,329) (116,524)
2019 Note
FVTPL -
mandatorily
at FVTPL
FVOCI -
EIDUIR
Amortised
cost
Total
carrying
amount
Financial assets
Long-term receivables * 12 - 10,784 10,796
Fund and other investments 11 8,852 624 1,163 10,639
Trade and other receivables * 787 - 38,510 39,297
Cash and cash equivalents 17 - - 141,622 141,622
9,651 624 192,079 202,354
Financial liabilities
Borrowings * - - (55,072) (55,072)
Other long-term liabilities * (186) - (3,143) (3,329)
Trade and other payables * (455) - (45,573) (46,028)
(641) - (103,788) (104,429)
* These balances exclude non-financial instruments balances.
Certain fund and other investments have been designated at fair value through profit or loss upon initial recognition as
management internally monitors these investments on fair value basis.

Petroliam Nasional Berhad (PETRONAS)
Financial Report 2020
120 121
Notes to the Financial Statements31 December 2020
Notes to the Financial Statements31 December 2020
39. FINANCIAL INSTRUMENTS (CONTINUED)
Receivables and contract assets (continued)
Risk management objectives, policies and processes for managing the risk (continued)
The gross carrying amounts of credit impaired trade receivables and contract assets are written off (either partially
or in full) when there is no realistic prospect of recovery. This is generally the case when the Group or the Company
determines that the debtor does not have assets or sources of income that could generate sufficient cash flows to repay
the amounts subject to the write-off. Nevertheless, trade receivables and contract assets that are written off could still
be subject to enforcement activities.
Exposure to credit risk, credit quality and collateral
As at the end of the reporting period, the maximum exposure to credit risk arising from trade receivables and contract
assets are represented by the carrying amounts in the statement of financial position.
At each reporting date, the Group and the Company assess whether financial assets carried at amortised cost and
debt securities at FVOCI are credit-impaired. A financial asset is ‘credit-impaired’ when one or more events that have a
detrimental impact on the estimated future cash flows of the financial asset have occurred.
Evidence that a financial asset is credit-impaired includes the following observable data:
(i) significant financial difficulty of the customer;
(ii) a breach of contract such as a default; or
(iii) it is probable that the customer will enter bankruptcy or other financial reorganisation.
Exposure to losses increases with concentrations of credit risk which may exist when a number of counterparties are
involved in similar activities or operate in the same industry sector or geographical area, which may result in their ability
to meet contractual obligations being impacted by changes in economic, political or other conditions. The Group’s
principal customers with which it conducts business are located globally and there is no significant concentration of
credit risk at reporting date.
Recognition and measurement of impairment loss
In managing credit risk of trade receivables and contract assets, the Group manages its debtors and takes appropriate
actions (including but not limited to legal actions) to recover long overdue balances.
The Group and the Company perform credit rating assessment of all its counterparties in order to measure Expected
Credit Loss (“ECL”) of trade receivables for all segments using the PETRONAS Credit Risk Rating system. This credit rating
assessment considers quantitative assessment using the counterparties’ financial statements or a qualitative assessment
of the counterparties which includes but is not limited to their reputation, competitive position, industry and geopolitical
outlook.
In determining the ECL, the probability of default assigned to each counterparty is based on their individual credit rating.
This probability of default is derived by benchmarking against available third party and market information, which also
incorporates forward looking information.
Loss given default is the assumption of the proportion of financial asset that cannot be recovered by conversion of
collateral to cash or by legal process, and is assessed based on the Group’s and the Company’s historical experience.
39. FINANCIAL INSTRUMENTS (CONTINUED)
Financial risk management
As an integrated oil and gas company, the Group and the Company are exposed to various risks that are particular to its
core business of upstream and downstream operations. These risks, which arise in the normal course of the Group’s and
of the Company’s business, comprise credit risk, liquidity risk and market risk relating to interest rates, foreign currency
exchange rates, equity prices and commodity prices.
The Group has policies and guidelines in place that sets the foundation for a consistent approach towards establishing
an effective financial risk management across the PETRONAS Group.
Risk taking activities are undertaken within acceptable level of risk or risk appetite, whereby the risk appetite level reflects
business considerations and capacity to assume such risks. The risk appetite is established at Board level, where relevant,
based on defined methodology and translated into operational thresholds.
The Group’s and the Company’s goal in risk management are to ensure that the management understands, measures and
monitors the various risks that arise in connection with their operations. Policies and guidelines have been developed to
identify, analyse, appraise and monitor the dynamic risks facing the Group and the Company. Based on this assessment,
each business unit adopts appropriate measures to mitigate these risks in accordance with the business unit’s view of the
balance between risk and reward.
Credit risk
Credit risk is the potential exposure of the Group and of the Company to losses in the event of non- performance by
counterparties. The Group’s and the Company’s exposures to credit risk arise principally from their receivables from
customers, fund and other investments and financial guarantees given to financial institutions for credit facilities granted
to subsidiaries, joint ventures and associates. Credit risks are controlled by individual subsidiaries in line with PETRONAS’
policies and guidelines.
Receivables and contract assets
Risk management objectives, policies and processes for managing the risk
The Group and the Company minimise credit risk by ensuring that all potential third party counterparties are assessed
prior to registration and entering into new contracts. Existing third party counterparties are also subject to regular reviews,
including re-appraisal and approval of granted limits. The creditworthiness of counterparties is assessed based on an
analysis of all available quantitative and qualitative data regarding business risks and financial standing, together with the
review of any relevant third party and market information. Reports are prepared and presented to the management that
cover the Group’s overall credit exposure against limits and securities, exposure by segment and overall quality of the
portfolio.
Depending on the types of transactions and counterparty creditworthiness, the Group and the Company further mitigate
and limit risks related to credit by requiring collateral or other credit enhancements such as cash deposits, letter of credit
and bank guarantees.
Management has taken reasonable steps to ensure that receivables that are neither past due nor impaired are stated at
their realisable values.
At each reporting date, the Group and the Company assess whether any of the trade receivables and contract assets are
credit impaired.
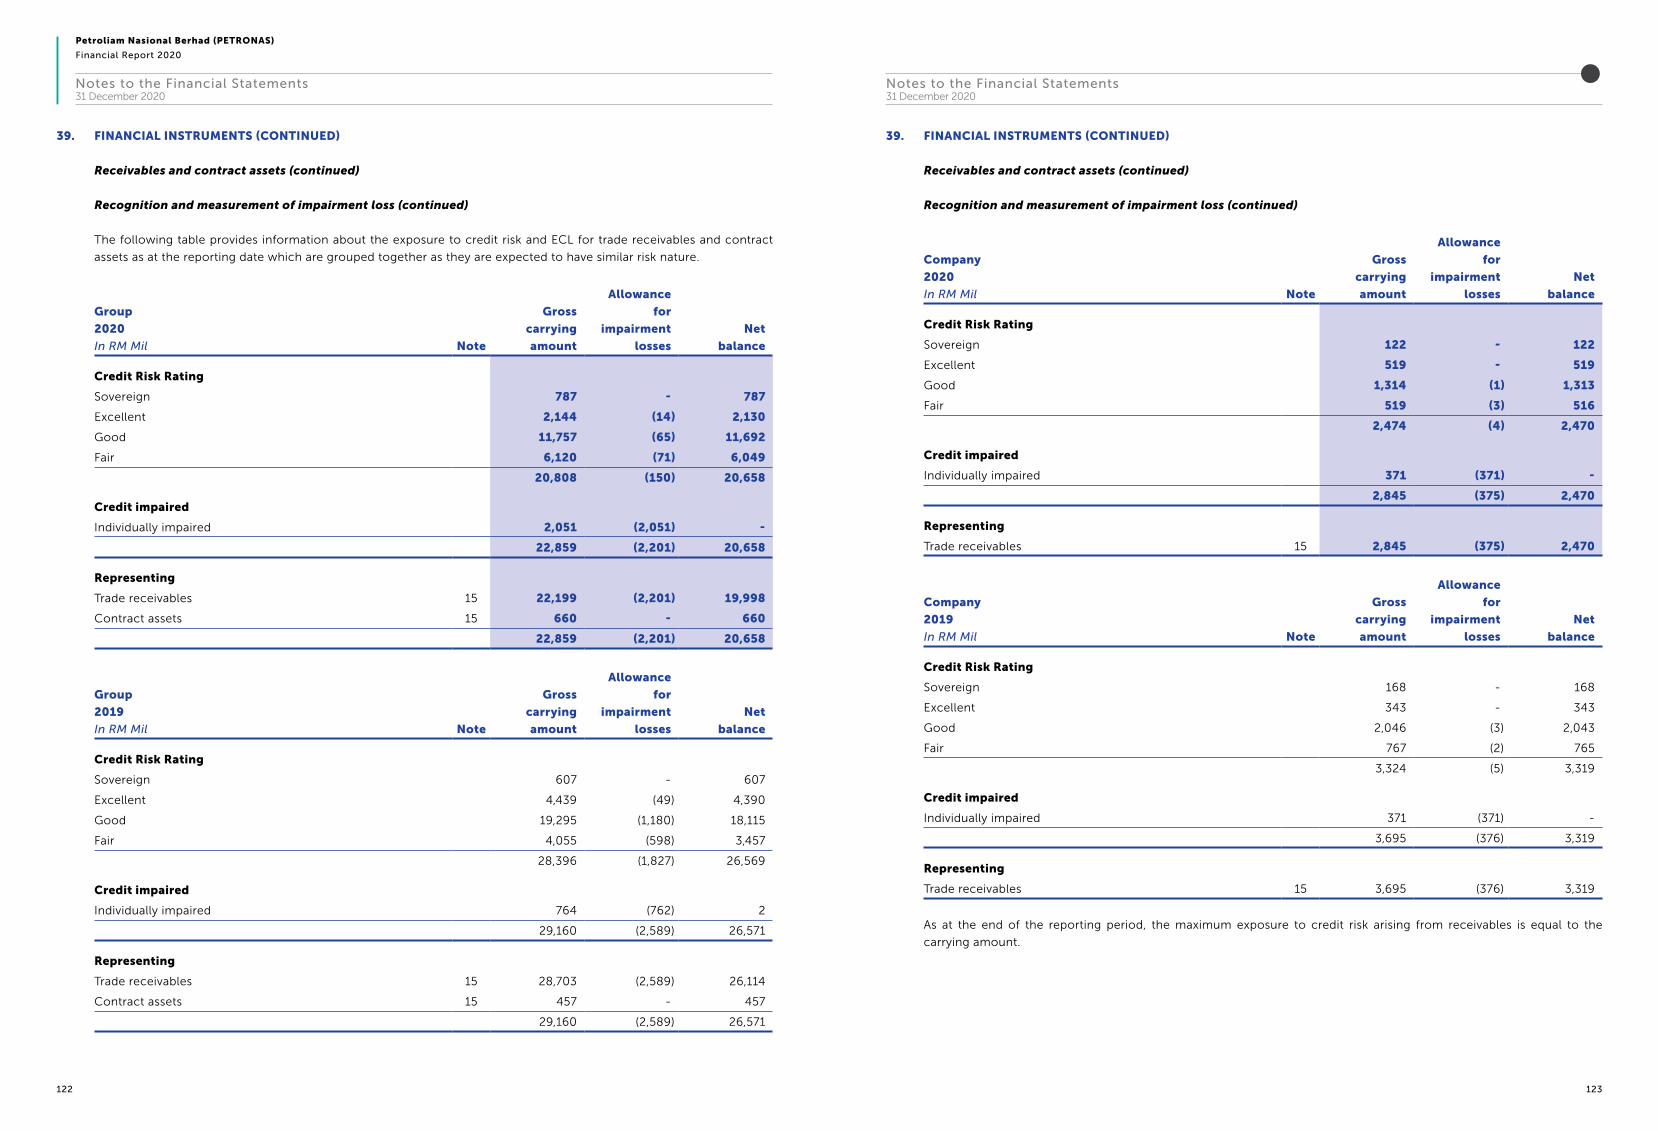
Petroliam Nasional Berhad (PETRONAS)
Financial Report 2020
122 123
Notes to the Financial Statements31 December 2020
Notes to the Financial Statements31 December 2020
39. FINANCIAL INSTRUMENTS (CONTINUED)
Receivables and contract assets (continued)
Recognition and measurement of impairment loss (continued)
Company
2020
In RM Mil Note
Gross
carrying
amount
Allowance
for
impairment
losses
Net
balance
Credit Risk Rating
Sovereign 122 - 122
Excellent 519 - 519
Good 1,314 (1) 1,313
Fair 519 (3) 516
2,474 (4) 2,470
Credit impaired
Individually impaired 371 (371) -
2,845 (375) 2,470
Representing
Trade receivables 15 2,845 (375) 2,470
Company
2019
In RM Mil Note
Gross
carrying
amount
Allowance
for
impairment
losses
Net
balance
Credit Risk Rating
Sovereign 168 - 168
Excellent 343 - 343
Good 2,046 (3) 2,043
Fair 767 (2) 765
3,324 (5) 3,319
Credit impaired
Individually impaired 371 (371) -
3,695 (376) 3,319
Representing
Trade receivables 15 3,695 (376) 3,319
As at the end of the reporting period, the maximum exposure to credit risk arising from receivables is equal to the
carrying amount.
39. FINANCIAL INSTRUMENTS (CONTINUED)
Receivables and contract assets (continued)
Recognition and measurement of impairment loss (continued)
The following table provides information about the exposure to credit risk and ECL for trade receivables and contract
assets as at the reporting date which are grouped together as they are expected to have similar risk nature.
Group
2020
In RM Mil Note
Gross
carrying
amount
Allowance
for
impairment
losses
Net
balance
Credit Risk Rating
Sovereign 787 - 787
Excellent 2,144 (14) 2,130
Good 11,757 (65) 11,692
Fair 6,120 (71) 6,049
20,808 (150) 20,658
Credit impaired
Individually impaired 2,051 (2,051) -
22,859 (2,201) 20,658
Representing
Trade receivables 15 22,199 (2,201) 19,998
Contract assets 15 660 - 660
22,859 (2,201) 20,658
Group
2019
In RM Mil Note
Gross
carrying
amount
Allowance
for
impairment
losses
Net
balance
Credit Risk Rating
Sovereign 607 - 607
Excellent 4,439 (49) 4,390
Good 19,295 (1,180) 18,115
Fair 4,055 (598) 3,457
28,396 (1,827) 26,569
Credit impaired
Individually impaired 764 (762) 2
29,160 (2,589) 26,571
Representing
Trade receivables 15 28,703 (2,589) 26,114
Contract assets 15 457 - 457
29,160 (2,589) 26,571

Petroliam Nasional Berhad (PETRONAS)
Financial Report 2020
124 125
Notes to the Financial Statements31 December 2020
Notes to the Financial Statements31 December 2020
39. FINANCIAL INSTRUMENTS (CONTINUED)
Fund and other investments (continued)
As at the reporting date, the Group and the Company have invested 99% (2019: 99%) and 100% (2019: 100%) of the
investments in domestic securities respectively.
The fund and other investments are unsecured, however, in view of the sound credit rating of counterparties, management
does not expect any counterparty to fail to meet its obligation.
Financial guarantees
The Group and the Company provide financial guarantees to banks in respect of banking facilities granted to certain
subsidiaries, joint ventures and associates (“Group entities”). The Group and the Company monitor on an ongoing basis,
the results of the Group entities and repayments made by the Group entities.
The Group’s certain joint arrangement entities have undertaken project financing facilities (the “Borrower”), under an
integrated borrowing structure for the repayment of bridge loan facilities and other expenditures. Under the integrated
borrowing structure, the Borrowers provide cross guarantee to the project financing lenders on each other’s loan. Upon
failure to pay by a Borrower, the project financing lenders would have primary recourse to that Borrower as well as to the
other Borrower under the cross-guarantee.
The Group’s share of maximum exposure to credit risk relating to the cross-guarantee provided by the joint operation
company to a joint venture amounts to RM16,688 million (2019: RM16,897 million), which represents the outstanding
loans of the joint venture as at financial year end. Similarly, the cross-guarantee provided by the joint venture to the
Group’s joint operation company as at financial year end is RM1,965 million (2019: RM1,983* million), being the Group’s
share in the joint operation company.
The maximum exposure to credit risk for the Company amounted to RM3,834 million (2019: RM2,314 million), which
represents the outstanding banking facilities of the Group entities as at reporting date. As at reporting date, there was no
indication that any entities would default on repayment. The fair value of the financial guarantee recognised is disclosed
in Note 23 and Note 24.
Liquidity risk
Liquidity risk is the risk that the Group and the Company will not be able to meet their financial obligations as they fall
due. The Group’s and the Company’s exposure to liquidity risk arises principally from their trade and other payables, and
borrowings. In managing its liquidity risk, the Group and the Company maintains sufficient cash and liquid marketable
assets. The Company’s current credit rating enables it to access banking facilities in excess of current and immediate
future requirements of the Group and of the Company. The Group’s and the Company’s borrowing power is not limited
by its Articles of Association. However, certain covenants included in agreements impose limited restrictions on some of
the debt level of PETRONAS’ subsidiaries.
Maturity analysis
The following table below summarises the maturity profile of the Group’s and of the Company’s financial liabilities as at
the reporting date based on undiscounted contractual payments:
* The amount excludes transaction costs
39. FINANCIAL INSTRUMENTS (CONTINUED)
Receivables and contract assets (continued)
Recognition and measurement of impairment loss (continued)
The ageing of trade receivables net of impairment amount as at the end of the reporting period is analysed below:
In RM Mil
Group Company
2020 2019 2020 2019
At net
Current 16,412 23,850 1,084 3,012
Past due 1 to 30 days 859 973 1,332 64
Past due 31 to 60 days 421 146 - -
Past due 61 to 90 days 439 105 2 2
Past due more than 90 days 1,867 1,040 52 241
19,998 26,114 2,470 3,319
The Group and the Company have not recognised any loss allowance for trade receivables that are secured by collateral
and/or other credit enhancements such as cash deposits, letter of credit and bank guarantees.
The movements in the allowance for impairment losses of trade receivables during the year are as follows:
In RM Mil
Group Company
2020 2019 2020 2019
Opening balance 2,589 3,376 376 763
Impairment losses/(write-back) recognised 3 (760) (1) (104)
Impairment written-off (56) (4) - (283)
Translation exchange difference (335) (23) - -
Closing balance 2,201 2,589 375 376
Fund and other investments
The Group and the Company are also exposed to counterparty credit risk from financial institutions, government and
corporate counterparties through fund and other investment activities comprising primarily money market placement
and investments in bonds and equities. These exposures are managed in accordance with existing policies and guidelines
that define the parameters within which the investment activities shall be undertaken in order to achieve the Group’s
investment objective of preserving capital and generating optimal returns above appropriate benchmarks within allowable
risk parameters.
Investments are only made with approved counterparties who met the appropriate rating and other relevant criteria,
and within approved credit limits, as stipulated in the policies and guidelines. The treasury function is governed by a
counterparty credit risk management framework.
The maximum exposure to credit risk is represented by the carrying amounts in the statement of financial position.
The credit risk on a financial instrument is considered low, if the financial instrument has a low risk of default, the
borrower has a strong capacity to meet its contractual cash flow obligations in the near term and adverse changes in
economic and business conditions in the longer term may, but will not necessarily, reduce the ability of the borrower
to fulfil its contractual cash flow obligations. The Group and the Company assume that there is a significant increase in
credit risk when it is past due.

Petroliam Nasional Berhad (PETRONAS)
Financial Report 2020
126 127
Notes to the Financial Statements31 December 2020
Notes to the Financial Statements31 December 2020
39. FINANCIAL INSTRUMENTS (CONTINUED)
Liquidity risk (continued)
Maturity analysis (continued)
Group
2020
In RM Mil
Carrying
amount
Contractual
interest/profit
rates per
annum %
Contractual
cash flows
Amortised cost (continued)
Unsecured bank overdrafts
ZAR bank overdrafts 695 7.60 695
Other bank overdrafts 3 5.18 4
Secured Islamic financing facilities
RM Islamic financing facilities 2,323 4.52 3,033
Unsecured Islamic financing facilities
RM Islamic financing facilities 4,695 3.41 5,135
RMB Islamic financing facilities 133 6.17 147
Other long-term liabilities 3,834 - 5,055
Financial guarantee - - 16,747
Trade and other payables 34,995 - 34,995
Fair value through profit or loss
Derivative liabilities 2,195 - 2,195
129,253 189,427
continue to next page
39. FINANCIAL INSTRUMENTS (CONTINUED)
Liquidity risk (continued)
Maturity analysis (continued)
Group
2020
In RM Mil
Carrying
amount
Contractual
interest/profit
rates per
annum %
Contractual
cash flows Amortised cost
Lease liabilities 12,729 1.00 - 13.80 21,044
Secured term loans
USD floating rate loans 11,452 1.16 12,440
USD fixed rate loans 3,166 3.22 3,166
RM floating rate loans 390 4.37 390
Other floating rate loans 1,012 2.41 1,012
Unsecured term loans
USD floating rate loans 402 4.65 403
USD fixed rate loans 498 2.19 756
EUR floating rate loans 2,153 0.30 2,195
Other fixed rate loans 444 5.31 443
Other floating rate loans 80 2.07 87
Unsecured Notes and Bonds
USD Notes 4,029 7.88 4,644
USD Guaranteed Notes 38,971 4.10 68,808
USD Bonds 2,014 7.63 2,993
Unsecured revolving credits
USD floating revolving credits 355 1.33 355
USD fixed revolving credits 804 2.19 804
RM floating revolving credits 10 2.89 10
RM fixed revolving credits 65 2.68 65
Other floating revolving credits 150 3.90 150
Unsecured bankers’ acceptances
CAD fixed bankers’ acceptances 1,656 2.00 1,656
continue to next page

Petroliam Nasional Berhad (PETRONAS)
Financial Report 2020
128 129
Notes to the Financial Statements31 December 2020
Notes to the Financial Statements31 December 2020
39. FINANCIAL INSTRUMENTS (CONTINUED)
Liquidity risk (continued)
Maturity analysis (continued)
Group
2020
In RM Mil
Within
1 year 1-2 years 2-5 years
More than
5 years
Amortised cost (continued)
Unsecured bank overdrafts
ZAR bank overdrafts 695 - - -
Other bank overdrafts 4 - - -
Secured Islamic financing facilities
RM Islamic financing facilities 946 331 907 849
Unsecured Islamic financing facilities
RM Islamic financing facilities 934 676 1,940 1,585
RMB Islamic financing facilities 8 6 133 -
Other long-term liabilities 114 - 955 3,986
Financial guarantee 16,747 - - -
Trade and other payables 34,995 - - -
Fair value through profit or loss
Derivative liabilities 2,195 - - -
69,119 14,675 24,936 80,697
continued from previous page
39. FINANCIAL INSTRUMENTS (CONTINUED)
Liquidity risk (continued)
Maturity analysis (continued)
Group
2020
In RM Mil
Within
1 year 1-2 years 2-5 years
More than
5 years
Amortised cost (continued)
Lease liabilities 1,949 2,125 4,049 12,921
Secured term loans
USD floating rate loans 1,655 2,021 3,588 5,176
USD fixed rate loans 283 287 867 1,729
RM floating rate loans 12 19 357 2
Other floating rate loans 276 35 435 266
Unsecured term loans
USD floating rate loans - - 254 149
USD fixed rate loans 756 - - -
EUR floating rate loans 2,195 - - -
Other fixed rate loans 77 - 366 -
Other floating rate loan 87 - - -
Unsecured Notes and Bonds
USD Notes 331 4,313 - -
USD Guaranteed Notes 1,660 4,704 10,616 51,828
USD Bonds 160 158 469 2,206
Unsecured revolving credits
USD floating revolving credits 355 - - -
USD fixed revolving credits 804 - - -
RM floating revolving credits 10 - - -
RM fixed revolving credits 65 - - -
Other floating revolving credits 150 - - -
Unsecured bankers’ acceptances
CAD fixed bankers’ acceptance 1,656 - - -
continued from previous page

Petroliam Nasional Berhad (PETRONAS)
Financial Report 2020
130 131
Notes to the Financial Statements31 December 2020
Notes to the Financial Statements31 December 2020
39. FINANCIAL INSTRUMENTS (CONTINUED)
Liquidity risk (continued)
Maturity analysis (continued)
Group
2019
In RM Mil
Carrying
amount
Contractual
interest/profit
rates per
annum %
Contractual
cash flows
Amortised cost (continued)
Unsecured bank overdrafts
ZAR bank overdrafts 393 7.63 393
Other bank overdrafts 16 6.25 17
Secured Islamic financing facilities
RM Islamic financing facilities 2,394 4.52 3,262
Unsecured Islamic financing facilities
USD Islamic financing facilities 5,121 2.71 5,151
RM Islamic financing facilities 3,543 3.79 4,143
RMB Islamic financing facilities 127 6.30 156
Other long-term liabilities 3,143 - 4,728
Financial guarantee - - 16,966
Trade and other payables 45,573 - 45,573
Fair value through profit or loss
Derivative liabilities 641 - 641
118,095 150,884
continue to next page
39. FINANCIAL INSTRUMENTS (CONTINUED)
Liquidity risk (continued)
Maturity analysis (continued)
Group
2019
In RM Mil
Carrying
amount
Contractual
interest/profit
rates per
annum %
Contractual
cash flows Amortised cost
Lease liabilities 13,666 0.42 - 13.80 16,274
Secured term loans
USD floating rate loans 11,874 1.49 12,194
USD fixed rate loans 514 2.33 514
RM floating rate loans 387 4.39 387
Other fixed rate loans 8 12.50 8
Other floating rate loans 665 5.97 664
Unsecured term loans
USD floating rate loans 3,489 2.87 3,643
USD fixed rate loans 518 6.18 525
EUR floating rate loans 1,994 0.40 2,013
Other fixed rate loans 862 5.56 868
Unsecured Notes and Bonds
USD Notes 4,100 7.88 4,907
USD Guaranteed Notes 15,221 3.83 22,944
USD Bonds 2,050 7.63 3,111
Unsecured revolving credits
USD revolving credits 808 2.53 808
GBP revolving credits 263 1.14 263
RM revolving credits 242 4.55 247
Other revolving credits 34 7.14 34
Unsecured bankers’ acceptances
CAD bankers' acceptances 399 2.01 399
Other bankers' acceptances 50 3.92 51
continue to next page

Petroliam Nasional Berhad (PETRONAS)
Financial Report 2020
132 133
Notes to the Financial Statements31 December 2020
Notes to the Financial Statements31 December 2020
39. FINANCIAL INSTRUMENTS (CONTINUED)
Liquidity risk (continued)
Maturity analysis (continued)
Group
2019
In RM Mil
Within
1 year 1-2 years 2-5 years
More than
5 years
Amortised cost (continued)
Unsecured bank overdrafts
ZAR bank overdrafts 393 - - -
Other bank overdrafts 17 - - -
Secured Islamic financing facilities
RM Islamic financing facilities 830 353 1,028 1,051
Unsecured Islamic financing facilities
USD Islamic financing facilities 5,151 - - -
RM Islamic financing facilities 725 786 1,653 979
RMB Islamic financing facilities 8 8 140 -
Other long-term liabilities - - 147 4,581
Financial guarantee 16,966 - - -
Trade and other payables 45,573 - - -
Fair value through profit or loss
Derivative liabilities 455 186 - -
80,547 8,254 23,659 38,424
continued from previous page
39. FINANCIAL INSTRUMENTS (CONTINUED)
Liquidity risk (continued)
Maturity analysis (continued)
Group
2019
In RM Mil
Within
1 year 1-2 years 2-5 years
More than
5 years
Amortised cost (continued)
Lease liabilities 1,675 2,638 5,591 6,370
Secured term loans
USD floating rate loans 3,456 816 2,755 5,167
USD fixed rate loans 48 48 156 262
RM floating rate loans 18 14 30 325
Other fixed rate loans 2 2 4 -
Other floating rate loans 197 122 342 3
Unsecured term loans
USD floating rate loans 1,258 71 2,314 -
USD fixed rate loans 82 92 165 186
EUR floating rate loans 8 2,005 - -
Other fixed rate loans 816 46 6 -
Unsecured Notes and Bonds
USD Notes 323 323 4,261 -
USD Guaranteed Notes 588 588 4,598 17,170
USD Bonds 156 156 469 2,330
Unsecured revolving credits
USD revolving credits 808 - - -
GBP revolving credits 263 - - -
RM revolving credits 247 - - -
Other revolving credits 34 - - -
Unsecured bankers’ acceptances
CAD fixed bankers’ acceptance 399 - - -
Other bankers' acceptances 51 - - -
continued from previous page

Petroliam Nasional Berhad (PETRONAS)
Financial Report 2020
134 135
Notes to the Financial Statements31 December 2020
Notes to the Financial Statements31 December 2020
39. FINANCIAL INSTRUMENTS (CONTINUED)
Liquidity risk (continued)
Maturity analysis (continued)
Company
2020
In RM Mil
Within
1 year 1-2 years 2-5 years
More than
5 years
Amortised cost (continued)
Lease liabilities 826 848 2,495 8,196
Unsecured Notes and Bonds
USD Notes 331 4,313 - -
USD Guaranteed Notes 1,660 4,704 10,616 51,828
USD Bonds 160 158 469 2,206
Unsecured Islamic financing facilities
USD Islamic financing facilities - - - -
Other long-term liabilities 159 95 1,971 14,031
Financial guarantee 3,834 - - -
Trade and other payables 11,793 - - -
Fair value through profit or loss
Derivative liabilities 21 - - -
18,784 10,118 15,551 76,261
continued from previous page
2019
In RM Mil
Within
1 year 1-2 years 2-5 years
More than
5 years
Amortised cost (continued)
Lease liabilities 802 819 2,464 1,780
Unsecured Notes and Bonds
USD Notes 323 323 4,261 -
USD Guaranteed Notes 588 588 4,598 17,170
USD Bonds 156 156 469 2,330
Unsecured Islamic financing facilities
USD Islamic financing facilities 5,151 - - -
Other long-term liabilities 14 470 498 13,959
Financial guarantee 2,314 - - -
Trade and other payables 16,793 - - -
Fair value through profit or loss
Derivative liabilities 18 - - -
26,159 2,356 12,290 35,239
continued from previous page
39. FINANCIAL INSTRUMENTS (CONTINUED)
Liquidity risk (continued)
Maturity analysis (continued)
Company
2020
In RM Mil
Carrying
amount
Contractual
interest/profit
rates per
annum %
Contractual
cash flows
Amortised cost
Lease liabilities 7,840 5.41 12,365
Unsecured Notes and Bonds
USD Notes 4,029 7.88 4,644
USD Guaranteed Notes 38,971 4.10 68,808
USD Bonds 2,014 7.63 2,993
Unsecured Islamic financing facilities
USD Islamic financing facilities - - -
Other long-term liabilities 11,471 - 16,256
Financial guarantee - - 3,834
Trade and other payables 11,793 - 11,793
Fair value through profit or loss
Derivative liabilities 21 - 21
76,139 120,714
continue to next page
2019
In RM Mil
Carrying
amount
Contractual
interest/profit
rates per
annum %
Contractual
cash flows
Amortised cost
Lease liabilities 4,761 5.65 5,865
Unsecured Notes and Bonds
USD Notes 4,100 7.88 4,907
USD Guaranteed Notes 15,221 3.83 22,944
USD Bonds 2,050 7.63 3,111
Unsecured Islamic financing facilities
USD Islamic financing facilities 5,121 2.71 5,151
Other long-term liabilities 9,759 - 14,941
Financial guarantee - - 2,314
Trade and other payables 16,793 - 16,793
Fair value through profit or loss
Derivative liabilities 18 - 18
57,823 76,044
continue to next page

Petroliam Nasional Berhad (PETRONAS)
Financial Report 2020
136 137
Notes to the Financial Statements31 December 2020
Notes to the Financial Statements31 December 2020
39. FINANCIAL INSTRUMENTS (CONTINUED)
Market risk (continued)
Foreign exchange risk (continued)
The Group’s and the Company’s foreign exchange management policy are to minimise economic and significant
transactional exposures arising from currency movements. The Group coordinates the handling of foreign exchange
risks centrally typically by matching receipts and payments for the same currency. For major capital projects, the Group
performs assessment of potential foreign exchange risk exposure at the investment decision phase to determine the
appropriate foreign exchange risk management strategy. Residual net positions are actively managed and monitored
against prescribed policies and control procedures. When deemed necessary and appropriate, the Group will enter into
derivative financial instruments to hedge and minimise its exposures to the foreign currency movements.
The Group’s and the Company’s significant exposure to foreign currency risk, based on carrying amounts as at the
reporting date is as follows:
Group
In RM Mil 2020 2019
Denominated in USD
Financial assets
Loan and advances to subsidiaries and a joint venture 75,418 76,082
Cash and cash equivalents 25,469 1,629
Trade and other receivables 6,639 7,211
Long-term receivables 23 175
Fund and other investments 101 297
Other financial assets 10 67
107,660 85,461
Financial liabilities
Loan and advances from holding company (8,282) (4,348)
Borrowings (45,213) (32,968)
Trade and other payables (6,466) (5,688)
Other financial liabilities (2,708) (2,633)
(62,669) (45,637)
Net exposure 44,991 39,824
Denominated in RM
Financial assets
Cash and cash equivalents 781 1,220
Trade and other receivables 1,778 2,938
Long-term receivables 16 10
2,575 4,168
Financial liabilities
Borrowings (191) (276)
Trade and other payables (5,416) (5,213)
(5,607) (5,489)
Net exposure (3,032) (1,321)
39. FINANCIAL INSTRUMENTS (CONTINUED)
Market risk
Market risk is the risk or uncertainty arising from change in market prices and their impact on the performance of the
business. The market price changes that the Group and the Company are exposed to include interest rates, foreign
currency exchange rates, commodity prices, equity prices and other indices that could affect the value of the Group’s
and the Company’s financial assets, liabilities or expected future cash flows.
Interest rate risk
The Group’s and the Company’s investments in fixed rate debt securities and fixed rate borrowings are exposed to a risk
of change in their fair values due to changes in interest rates. The Group’s variable rate borrowings are exposed to a risk
of change in cash flows due to changes in interest rates. Investments in equity securities and short-term receivables and
payables are not significantly exposed to interest rate risk.
All interest rate exposures are monitored and managed proactively in line with PETRONAS’ policies and guidelines. The
Group enters into hedging transactions with respect to interest rate on certain long-term borrowings and other debts
where necessary and appropriate, in accordance with policies and guidelines.
The interest rate profile of the Group’s and the Company’s interest-bearing financial instruments based on carrying
amount as at reporting date is as follows:
In RM Mil
Group Company
2020 2019 2020 2019
Fixed rate instruments
Financial assets 141,463 152,655 103,729 109,601
Financial liabilities (78,529) (52,617) (52,854) (31,253)
62,934 100,038 50,875 78,348
Floating rate instruments
Financial assets 3,616 2,404 49,101 48,710
Financial liabilities (9,700) (16,121) - -
(6,084) (13,717) 49,101 48,710
Since most of the Group’s and the Company’s financial assets and liabilities are fixed rate instruments measured at
amortised cost, a change in interest rate is not expected to have material impact on the Group’s and the Company’s profit
or loss.
The Group has entered into an interest rate swaps to hedge the cash flow risk in relation to the floating interest rate of the
USD term loan of USD322 million. The interest rate swaps have the same nominal value of USD322 million and is settled
every quarter, consistent with the interest repayment schedule of the term loan. During the year, the interest risk swaps
was discontinued as the Group had fully settled the USD term loan.
Foreign exchange risk
The Group and the Company are exposed to varying levels of foreign exchange risk when they enter into transactions
that are not denominated in the respective companies’ functional currencies and when foreign currency monetary assets
and liabilities are translated at the reporting date. The main underlying economic currencies of the Group’s cash flows
are Ringgit Malaysia and US Dollars.

Petroliam Nasional Berhad (PETRONAS)
Financial Report 2020
138 139
Notes to the Financial Statements31 December 2020
Notes to the Financial Statements31 December 2020
39. FINANCIAL INSTRUMENTS (CONTINUED)
Market risk (continued)
Foreign exchange risk (continued)
The following table demonstrates the indicative pre-tax effects on the profit or loss and equity of applying reasonably
foreseeable market movements in the following currency exchange rates:
2020
In RM Mil
Appreciation
in foreign currency rate %
Group Company
Equity Profit or loss Equity Profit or loss
USD 10 3,179 1,320 - 4,686
MYR 10 - (303) - -
2019
USD 10 3,300 535 - 4,732
MYR 10 - (132) - -
A depreciation in foreign currency rate above would have had equal but opposite effect, on the basis that all other
variables remain constant.
Equity price risk
Equity price risk arises from the Group’s and the Company’s investments in equity securities. Exposures to equity price
risk are managed in accordance with the Group’s existing policies and guidelines. The Group and the Company monitor
the equity investments on a portfolio basis and a performance benchmark is established for each investment portfolio
giving consideration to portfolio objectives and return expectation. All buy and sell decisions are monitored by the Group
Treasury Division.
The Group and the Company also hold equity investments for strategic purposes, that are classified as FVTPL and FVOCI
financial assets. Reports on the equity portfolio performance are submitted to the Group’s and the Company’s senior
management on a regular basis.
The Group’s and the Company’s exposure to equity price risk based on carrying amounts as at the reporting date is as
follows:
In RM Mil
Group Company
2020 2019 2020 2019
Local equities 960 543 6 7
Foreign equities 170 642 - -
1,130 1,185 6 7
39. FINANCIAL INSTRUMENTS (CONTINUED)
Market risk (continued)
Foreign exchange risk (continued)
Company
In RM Mil 2020 2019
Denominated in USD
Financial assets
Loan and advances to subsidiaries and a joint venture 66,981 70,427
Cash and cash equivalents 47,346 28,613
Trade and other receivables 5,941 5,489
120,268 104,529
Financial liabilities
Cash and cash equivalents - subsidiaries’ cash with PETRONAS
Integrated Financial Shared Service Centre (22,377) (27,817)
Borrowings (45,014) (26,492)
Trade and other payables (4,902) (1,562)
Other financial liabilities (1,118) (1,336)
(73,411) (57,207)
Net exposure 46,857 47,322
Sensitivity analysis for a given market variable provided in this note, discloses the effect on profit or loss and equity
as at 31 December 2020 assuming that a reasonably possible change in the relevant market variable had occurred at
31 December 2020 and been applied to the risk exposures in existence at that date to show the effects of reasonably
possible changes in price on profit or loss and equity to the next annual reporting date. Reasonably possible changes
in market variables used in the sensitivity analysis are based on implied volatilities, where available, or historical data for
equity and commodity prices and foreign exchange rates. Reasonably possible changes in interest rates are based on
management judgment and historical experience.
The sensitivity analysis is hypothetical and should not be considered to be predictive of future performance because
the Group’s actual exposure to market prices is constantly changing with changes in the Group’s portfolio of among
others, commodity, debt and foreign currency contracts. Changes in fair values or cash flows based on a variation in a
market variable cannot be extrapolated because the relationship between the change in market variable and the change
in fair value or cash flows may not be linear. In addition, the effect of a change in a given market variable is calculated
independently of any change in another assumption and mitigating actions that would be taken by the Group. In reality,
changes in one factor may contribute to changes in another, which may magnify or counteract the sensitivities.

Petroliam Nasional Berhad (PETRONAS)
Financial Report 2020
140 141
Notes to the Financial Statements31 December 2020
Notes to the Financial Statements31 December 2020
39. FINANCIAL INSTRUMENTS (CONTINUED)
Fair value information (continued)
Group
2020
In RM Mil
Fair value of financial instruments carried at fair value
Level 1 Level 2 Level 3 Total
Financial assets
Quoted shares 1,130 - - 1,130
Quoted securities 181 - - 181
Unquoted shares - - 250 250
Commodity swaps - 11 - 11
Malaysian Government Securities - 290 - 290
Corporate Bonds and Sukuk - 8,219 - 8,219
Forward foreign exchange contracts - 146 - 146
Forward gas contracts 327 - - 327
Forward oil/gas price swaps 34 - - 34
Interest rate swaps - 7 - 7
1,672 8,673 250 10,595
Financial liabilities
Commodity swaps - (12) - (12)
Forward foreign exchange contracts - (53) - (53)
Forward oil/gas contracts (651) - - (651)
Forward oil/gas price swaps (933) - - (933)
Interest rate swaps - (546) - (546)
(1,584) (611) - (2,195)
Group
2020
In RM Mil
Fair value of financial instruments not carried
at fair value Carrying
amountLevel 2 Level 3 Total
Financial assets
Unquoted securities - 400 400 400
Deposits with licensed bank - 127 127 127
Long-term receivables - 11,298 11,298 11,298
Finance lease receivables - 9,670 9,670 9,670
- 21,495 21,495 21,495
Financial liabilities
Notes and Bonds (56,156) - (56,156) (45,014)
Term loans - (14,868) (14,868) (14,865)
Islamic financing facilities - (5,605) (5,605) (5,605)
Other long-term liabilities - (3,834) (3,834) (3,834)
(56,156) (24,307) (80,463) (69,318)
39. FINANCIAL INSTRUMENTS (CONTINUED)
Market risk (continued)
Equity price risk (continued)
The following table demonstrates the indicative pre-tax effects on the profit or loss and equity of applying reasonably
foreseeable market movements in the following equities:
2020
In RM Mil
Increase in price based on
average change in index rate %
Group Company
Equity Profit or loss Equity Profit or loss
Local equities 10 - 154 - 1
Foreign equities 15 to 20 15 - - -
2019
Local equities 10 1 151 - 1
Foreign equities 15 to 20 20 - - -
A decrease in price based on average change in index rate above would have had equal but opposite effect, on the basis
that all other variables remain constant.
Commodity price risk
The Group is exposed to changes in crude oil, gas and petroleum products prices which may affect the value of the
Group’s assets, liabilities or expected future cash flows. To mitigate these exposures from a business perspective, the
Group enters into various financial instruments. In effecting these transactions, the Group operates within policies,
guidelines and procedures designed to ensure that risks are minimised. All financial instruments positions are marked-
to-market by independent risk management department and reported to management for performance monitoring and
risk management purposes on a daily basis.
Since the Group undertakes hedging using commodity derivatives for the majority of its transactions, a change in
commodity price is not likely to result in a significant impact on the Group’s profit or loss and equity.
Fair value information
The carrying amounts of cash and cash equivalents, short-term receivables and payables and short-term borrowings,
reasonably approximate their fair values due to the relatively short-term nature of these financial instruments.
It was not practicable to estimate the fair value of the Group’s investment in unquoted shares due to the lack of comparable
quoted prices in an active market and the fair value cannot be reliably measured.
The following table analyses financial instruments carried at fair value and those not carried at fair value for which fair
value is disclosed, together with their fair values and carrying amounts shown in the statement of financial position.

Petroliam Nasional Berhad (PETRONAS)
Financial Report 2020
142 143
Notes to the Financial Statements31 December 2020
Notes to the Financial Statements31 December 2020
39. FINANCIAL INSTRUMENTS (CONTINUED)
Fair value information (continued)
Company
2020
In RM Mil
Fair value of financial instruments carried at fair value
Level 1 Level 2 Level 3 Total
Financial assets
Quoted shares 6 - - 6
Unquoted shares - - 73 73
Malaysian Government Securities - 254 - 254
Corporate Bonds and Sukuk - 4,812 - 4,812
Forward foreign exchange contracts - 17 - 17
Long-term receivables - - 24,851 24,851
6 5,083 24,924 30,013
Financial liabilities
Forward foreign exchange contracts - (21) - (21)
Company
2020
In RM Mil
Fair value of financial instruments not carried
at fair value Carrying
amountLevel 2 Level 3 Total
Financial assets
Long-term receivables - 104,107 104,107 94,947
Unquoted securities - 230 230 230
Deposits with licensed bank - 90 90 90
- 104,427 104,427 95,267
Financial liabilities
Notes and Bonds (56,156) - (56,156) (45,014)
Other long-term liabilities - (11,471) (11,471) (11,471)
(56,156) (11,471) (67,627) (56,485)
39. FINANCIAL INSTRUMENTS (CONTINUED)
Fair value information (continued)
Group
2019
In RM Mil
Fair value of financial instruments carried at fair value
Level 1 Level 2 Level 3 Total
Financial assets
Quoted shares 780 35 - 815
Quoted securities 135 - - 135
Unquoted shares - - 292 292
Commodity swaps - 2 - 2
Malaysian Government Securities - 610 - 610
Corporate Bonds and Sukuk - 7,198 - 7,198
Forward foreign exchange contracts - 58 - 58
Forward gas contracts 427 158 - 585
Forward oil/gas price swaps 142 - - 142
Interest rate swaps - 2 - 2
1,484 8,063 292 9,839
Financial liabilities
Commodity swaps - (27) - (27)
Forward foreign exchange contracts - (74) - (74)
Forward gas contracts (352) (7) - (359)
Forward oil/gas price swaps (14) - - (14)
Interest rate swaps - (160) - (160)
(366) (268) - (634)
Group
2019
In RM Mil
Fair value of financial instruments not carried
at fair value Carrying
amountLevel 2 Level 3 Total
Financial assets
Long-term receivables - 11,897 11,897 11,897
Finance lease receivables - 8,525 8,525 8,525
- 20,422 20,422 20,422
Financial liabilities
Notes and Bonds (24,074) - (24,074) (21,371)
Term loans - (20,297) (20,297) (20,311)
Islamic financing facilities (5,141) (11,432) (16,573) (11,185)
Other long-term liabilities - (3,143) (3,143) (3,143)
(29,215) (34,872) (64,087) (56,010)

Petroliam Nasional Berhad (PETRONAS)
Financial Report 2020
144 145
Notes to the Financial Statements31 December 2020
Notes to the Financial Statements31 December 2020
39. FINANCIAL INSTRUMENTS (CONTINUED)
Income/(expense), net gains and losses arising from financial instruments
Group
2020
In RM Mil
Interest
income
Interest
expense
Net
impairment
losses/
write-off Others Total
Financial assets at fair value through
profit or loss:
- mandatorily required by MFRS 9 458 - - 234 692
Financial assets at fair value through
OCI:
- recognised in equity - - - 13 13
Financial assets at amortised cost:
- recognised in profit or loss 4,380 - 78 (3,287) 1,171
- recognised in equity - - - (308) (308)
Financial liabilities at amortised cost - (2,781) - 2,194 (587)
Total 4,838 (2,781) 78 (1,154) 981
2019
Financial assets at fair value through
profit or loss:
- mandatorily required by MFRS 9 334 - - 158 492
Financial assets at fair value through
OCI:
- recognised in equity - - - 40 40
Financial assets at amortised cost:
- recognised in profit or loss 6,555 - 28 (233) 6,350
- recognised in equity - - - (38) (38)
Financial liabilities at amortised cost - (2,427) - 195 (2,232)
Total 6,889 (2,427) 28 122 4,612
39. FINANCIAL INSTRUMENTS (CONTINUED)
Fair value information (continued)
Company
2019
In RM Mil
Fair value of financial instruments carried at fair value
Level 1 Level 2 Level 3 Total
Financial assets
Quoted shares 7 - - 7
Unquoted shares - - 73 73
Malaysian Government Securities - 518 - 518
Corporate Bonds and Sukuk - 3,467 - 3,467
Forward foreign exchange contracts - 10 - 10
Long-term receivables - - 22,653 22,653
7 3,995 22,726 26,728
Financial liabilities
Forward foreign exchange contracts - (18) - (18)
Company
2019
In RM Mil
Fair value of financial instruments not carried
at fair value Carrying
amountLevel 2 Level 3 Total
Financial assets
Long-term receivables - 101,961 101,961 98,547
Deposits with licensed bank - 977 977 977
- 102,938 102,938 99,524
Financial liabilities
Notes and Bonds (24,074) - (24,074) (21,371)
Islamic financing facilities (5,125) - (5,125) (5,121)
Other long-term liabilities - (9,795) (9,795) (9,759)
(29,199) (9,795) (38,994) (36,251)
Derivatives
The calculation of fair value for derivative financial instruments depends on the type of instruments. The fair value of
interest rate swap agreements are estimated by discounting expected future cash flows using current market interest
rates and yield curve over the remaining term of the instrument. The fair value of forward foreign currency exchange
contracts is based on the fair value difference between forward exchange rates and the contracted rate. The fair value
of commodity swap and commodity forward contracts is based on the fair value difference between market price at the
date of measurement and the contracted price.
Non-derivative financial instruments
Fair value, which is determined for disclosure purposes, is calculated based on the present value of future principal
and interest cash flows, discounted at the market rate of interest at the end of the reporting period. In respect of the
liability component of convertible notes, the market rate of interest is determined by reference to similar liabilities that
do not have a conversion option. For other borrowings, the market rate of interest is determined by reference to similar
borrowing arrangements.

Petroliam Nasional Berhad (PETRONAS)
Financial Report 2020
146 147
Notes to the Financial Statements31 December 2020
Notes to the Financial Statements31 December 2020
41. AMENDMENTS TO MFRS AND PRONOUNCEMENTS ISSUED BY MASB
Adoption of new and revised pronouncements
As of 1 January 2020, the Group and the Company adopted the following pronouncements that have been issued by the
MASB and are applicable as listed below:
Effective for annual periods beginning on or after 1 January 2020
Amendments to MFRS 3 Business Combinations (Definition of a Business)
Amendments to MFRS 9 Financial Instruments, MFRS 139 Financial Instruments: Recognition and Measurement
and MFRS 7 Financial Instruments: Disclosures - Interest Rate Benchmark Reform
Amendment to MFRS 16 Leases (COVID-19 Related Rent Concessions)
Amendments to MFRS 101 Presentation of Financial Statements (Definition of Material)
Amendments to MFRS 108 Accounting Policies, Changes in Accounting Estimates and Errors (Definition of Material)
The Group and the Company have early adopted the Amendment to MFRS 16 Leases (COVID-19 Related Rent Concessions)
issued by MASB in June 2020, in response to the COVID-19 pandemic. The amendment is effective for annual periods
beginning on or after 1 June 2020.
The initial application of the above-mentioned pronouncements did not have any material impact to the financial
statements of the Group and the Company.
Pronouncements yet in effect
The following pronouncements that have been issued by the MASB will become effective in future financial reporting
periods and have not been adopted by the Group and the Company in these financial statements:
Effective for annual periods beginning on or after 1 January 2021
Amendments to MFRS 9 Financial Instruments, MFRS 139 Financial Instruments: Recognition and Measurement, MFRS 7
Financial Instruments: Disclosures, MFRS 4 Insurance Contracts and MFRS 16 Leases (Interest Rate Benchmark Reform -
Phase 2)
Effective for annual periods beginning on or after 1 January 2022
Amendments to MFRS 9 Financial Instruments (Annual Improvements to MFRS Standards 2018−2020)
Amendments to Illustrative Examples accompanying MFRS 16 Leases (Annual Improvements to MFRS Standards
2018−2020)
Amendments to MFRS 3 Business Combinations (Reference to the Conceptual Framework)
Amendments to MFRS 116 Property, Plant and Equipment (Property, Plant and Equipment−Proceeds before
Intended Use)
Amendments to MFRS 137 Provisions, Contingent Liabilities and Contingent Assets (Onerous Contracts−Cost of
Fulfilling a Contract)
Effective for annual periods beginning on or after 1 January 2023
MFRS 17 Insurance Contracts
Amendments to MFRS 101 Presentation of Financial Statements (Classification of Liabilities as Current or Non-current)
39. FINANCIAL INSTRUMENTS (CONTINUED)
Income/(expense), net gains and losses arising from financial instruments (continued)
Company
2020
In RM Mil
Interest
income
Interest
expense
Net
impairment
losses/
write-back Others Total
Financial assets at fair value through
profit or loss:
- mandatorily required by MFRS 9 306 - - 1,552 1,858
Financial assets at amortised cost: 5,022 - (340) (3,356) 1,326
Financial liabilities at amortised cost - (2,733) - 2,194 (539)
Total 5,328 (2,733) (340) 390 2,645
2019
Financial assets at fair value through
profit or loss:
- mandatorily required by MFRS 9 164 — — 2,357 2,521
Financial assets at amortised cost: 6,575 — 103 (653) 6,025
Financial liabilities at amortised cost — (3,387) — 195 (3,192)
Total 6,739 (3,387) 103 1,899 5,354
Others relate to gains and losses arising from financial instruments such as realised and unrealised foreign exchange
gains or losses, dividend income and fair value gains or losses.
40. CAPITAL MANAGEMENT
The Group, as an essential part of its capital management strategy, is committed towards achieving financial resilience
and ensuring long-term business sustainability as outlined in the PETRONAS Financial Policy (formerly known as Group
Corporate Financial Policy). The Group’s capital structure consists of consolidated equity plus debt, defined as the current
and long-term portions of the Group’s debt.
The objective of the Group’s capital management is to maintain an optimal capital structure and ensure availability of
funds in order to meet financial obligations, support business growth and maximise shareholders’ value. The Group
monitors and maintains a prudent level of total debt to total assets ratio so as to enable compliance with all covenants.
There were no changes in the Group’s approach to capital management during the year.

Petroliam Nasional Berhad (PETRONAS)
Financial Report 2020
148 149
Notes to the Financial Statements31 December 2020
Notes to the Financial Statements31 December 2020
42. KEY SUBSIDIARIES AND ACTIVITIES (CONTINUED)
Effective ownership
interest and voting
interest
Country of
Incorporation Principal Activities
2020
%
2019
%
PETRONAS Carigali Iraq Holding
B.V.
100 100 Netherlands Petroleum operations
PETRONAS Carigali Chad
Exploration & Production Inc.
100 100 Cayman Islands Investment holding
PETRONAS Carigali (Chad EP) Inc. 100 100 Cayman Islands Petroleum operations
PETRONAS Chad Marketing Inc. 100 100 Cayman Islands Marketing and selling of
crude oil
PETRONAS Australia Pty Limited 100 100 Australia Investment holding
PAPL (Upstream) Pty Limited 100 100 Australia Exploration and production of
coal seam gas
PAPL (Downstream) Pty Limited 100 100 Australia Production and transportation of
liquefied natural gas for export
PETRONAS Carigali (Jabung) Ltd. 100 100 Bahamas Petroleum operations
PETRONAS Carigali Nile Ltd. 100 100 Republic of
Mauritius
Petroleum operations
PETRONAS (E&P) Overseas Ventures
Sdn. Bhd.
100 100 Malaysia Investment holding
Natuna 1 B.V. 100 100 Netherlands Petroleum operations
PETRONAS Carigali Canada B.V. 100 100 Netherlands Investment holding
PETRONAS Energy Canada Ltd. 100 100 Canada Petroleum and gas exploration,
development and production
North Montney LNG Limited
Partnership
100 100 Canada Participation in LNG Canada
construction and operations
activities, liquefaction of
natural gas as LNG, storage,
marketing of LNG
PETRONAS E&P Argentina S.A. 100 100 Argentina Petroleum and gas exploration,
development and production
PETRONAS South Caucasus S.à r.l. 100 100 Luxembourg Investment holding
PETRONAS Azerbaijan (Shah Deniz)
S.à r.l.
100 100 Luxembourg Petroleum operations
PETRONAS Carigali (Turkmenistan)
Sdn. Bhd.
100 100 Malaysia Petroleum operations
∞ PICL (Egypt) Corporation Ltd. 100 100 Malaysia Investment holding, exploration
and production of oil and gas
PC Oman Ventures Ltd. 100 100 Mauritius Petroleum operations
PETRONAS Petróleo Brasil Ltda. 100 100 Brazil Petroleum operations
PETRONAS Power Sdn. Bhd. 100 100 Malaysia Investment holding
PETRONAS LNG Sdn. Bhd. 100 100 Malaysia Investment holding
∞ PETRONAS LNG Ltd. 100 100 Malaysia Trading of natural gas and LNG
41. AMENDMENTS TO MFRS AND PRONOUNCEMENTS ISSUED BY MASB (CONTINUED)
Pronouncements yet in effect (continued)
Effective for a date yet to be confirmed
Amendments to MFRS 10 Consolidated Financial Statements: Sale or Contribution of Assets between an Investor and its
Associate or Joint Venture
Amendments to MFRS 128 Investments in Associates and Joint Ventures: Sale or Contribution of Assets between an
Investor and its Associate or Joint Venture
The Group and the Company are expected to apply the above-mentioned pronouncements beginning from the respective
dates the pronouncements become effective. The initial application of the above-mentioned pronouncements are not
expected to have any material impacts to the financial statements of the Group and the Company.
New pronouncements not applicable to the Group and the Company
The MASB has issued pronouncements which is not relevant to the Group and the Company and hence, no further
disclosure is warranted.
Effective for annual periods beginning on or after 1 January 2022
Amendments to MFRS 1 First-time Adoption of Malaysian Financial Reporting Standards (Annual Improvements to MFRS
Standards 2018−2020)
Amendments to MFRS 141 Agriculture (Annual Improvements to MFRS Standards 2018−2020)
42. KEY SUBSIDIARIES AND ACTIVITIES
The subsidiary undertakings of the Company at 31 December 2020 and 2019 and the Group percentage of share capital
are set out below.
Effective ownership
interest and voting
interest
Country of
Incorporation Principal Activities
2020
%
2019
% * PETRONAS Carigali Sdn. Bhd. 100 100 Malaysia Petroleum exploration,
development and production
PC JDA Limited 100 100 Republic of
Mauritius
Petroleum operations
PETRONAS Carigali Overseas
Sdn. Bhd.
100 100 Malaysia Investment holding and
petroleum operations
E&P Malaysia Venture Sdn. Bhd. 100 100 Malaysia Petroleum operations
Vestigo Petroleum Sdn. Bhd. 100 100 Malaysia Petroleum operations
∞* PETRONAS International
Corporation Ltd.
100 100 Malaysia Investment holding

Petroliam Nasional Berhad (PETRONAS)
Financial Report 2020
150 151
Notes to the Financial Statements31 December 2020
Notes to the Financial Statements31 December 2020
42. KEY SUBSIDIARIES AND ACTIVITIES (CONTINUED)
Effective ownership
interest and voting
interest
Country of
Incorporation Principal Activities
2020
%
2019
%
Pengerang LNG (Two) Sdn. Bhd. 33.2 33.2 Malaysia Manage and operate LNG
regasification terminal
* PETRONAS Refinery &
Petrochemical Corporation
Sdn. Bhd.
100 100 Malaysia Development and ownership of
Refinery and Petrochemical
Integrated Complex
PRPC Utilities & Facilities Sdn. Bhd. 100 100 Malaysia Supply and service of utilities
and common facilities and
infrastructures
Pengerang Power Sdn. Bhd. 100 100 Malaysia Developing and operating a
power generation plant and
distribution of electricity and
steam
* PETRONAS Penapisan (Melaka)
Sdn. Bhd.
100 100 Malaysia Refining and condensation of
crude oil
* Malaysian Refining Company
Sdn. Bhd.
100 100 Malaysia Refining and condensation of
crude oil
* PETRONAS Penapisan (Terengganu)
Sdn. Bhd.
100 100 Malaysia Refining and condensation of
crude oil
* PETRONAS Trading Corporation
Sdn. Bhd.
100 100 Malaysia Marketing of crude oil and
trading in crude oil and
petroleum products and
investment holding
∞ PETCO Trading Labuan Company
Ltd.
100 100 Malaysia Marketing of crude oil and
trading in crude oil and
petroleum products
PETCO Trading (UK) Limited 100 100 United Kingdom Marketing of crude oil and
trading in crude oil and
petroleum products
PETCO Trading DMCC 100 100 United Arab
Emirates
Trading of petroleum products
@* PETRONAS Chemicals Group
Berhad
64.3 64.3 Malaysia Investment holding
PETRONAS Chemical Isononanol
Sdn. Bhd.
64.3 64.3 Malaysia Production and sale of
processed chemicals and all
petrochemicals and chemicals
products
∞ PETRONAS Chemicals Marketing
(Labuan) Ltd.
64.3 64.3 Malaysia Marketing and trading of
petrochemical products
PETRONAS Chemicals Fertiliser
Kedah Sdn. Bhd.
64.3 64.3 Malaysia Production and sale of urea,
ammonia and methanol
PETRONAS Chemicals Marketing
Sdn. Bhd.
64.3 64.3 Malaysia Investment holding
42. KEY SUBSIDIARIES AND ACTIVITIES (CONTINUED)
Effective ownership
interest and voting
interest
Country of
Incorporation Principal Activities
2020
%
2019
%
PETRONAS Energy Trading Limited 100 100 United Kingdom Trading of energy and gas
marketing
* PETRONAS Gas & New Energy
Sdn.Bhd. (f.k.a. PETRONAS
eLearning Solutions Sdn. Bhd.)
100 100 Malaysia Investment holding
* Malaysia LNG Sdn. Bhd. 90 90 Malaysia Liquefaction and sale of LNG
* Malaysia LNG Dua Sdn. Bhd. 80 80 Malaysia Liquefaction and sale of LNG
* Malaysia LNG Tiga Sdn. Bhd. 60 60 Malaysia Liquefaction and sale of LNG
* PETRONAS LNG 9 Sdn. Bhd. 65 65 Malaysia Purchase and liquefaction of
natural gas and marketing of
LNG
∞* PETRONAS Floating LNG 1 (L) Ltd. 100 100 Malaysia Purchase and
liquefaction of natural gas and
marketing of LNG
∞* PETRONAS Floating LNG 2 (L) Ltd. 100 100 Malaysia Developing, constructing,
owning, operating and
maintaining an integrated
floating natural gas
liquefaction, storage and off
loading facility
* PETRONAS Energy & Gas Trading
Sdn. Bhd.
100 100 Malaysia Trading and marketing of
processed gas
* PETRONAS International Power
Corporation (Mauritius) Ltd.
100 100 Mauritius Investment holding
* PETRONAS International Power
Corporation B.V.
100 100 Netherlands Investment holding
Amplus Energy Solutions Pte. Ltd.
(Singapore)
100 100 Singapore Investment holding of
solar power generation entities
in India
* PETRONAS Marketing International
Sdn. Bhd.
100 100 Malaysia Investment holding
Engen Limited 74 74 South Africa Refining of crude oil and
marketing of refined petroleum
products
@* PETRONAS Dagangan Berhad 63.9 63.9 Malaysia Domestic marketing of
petroleum products
@* PETRONAS Gas Berhad 51 51 Malaysia Processing and transmission of
natural gas
Regas Terminal (Sg. Udang)
Sdn. Bhd.
51 51 Malaysia Manage and operate LNG
regasification terminal
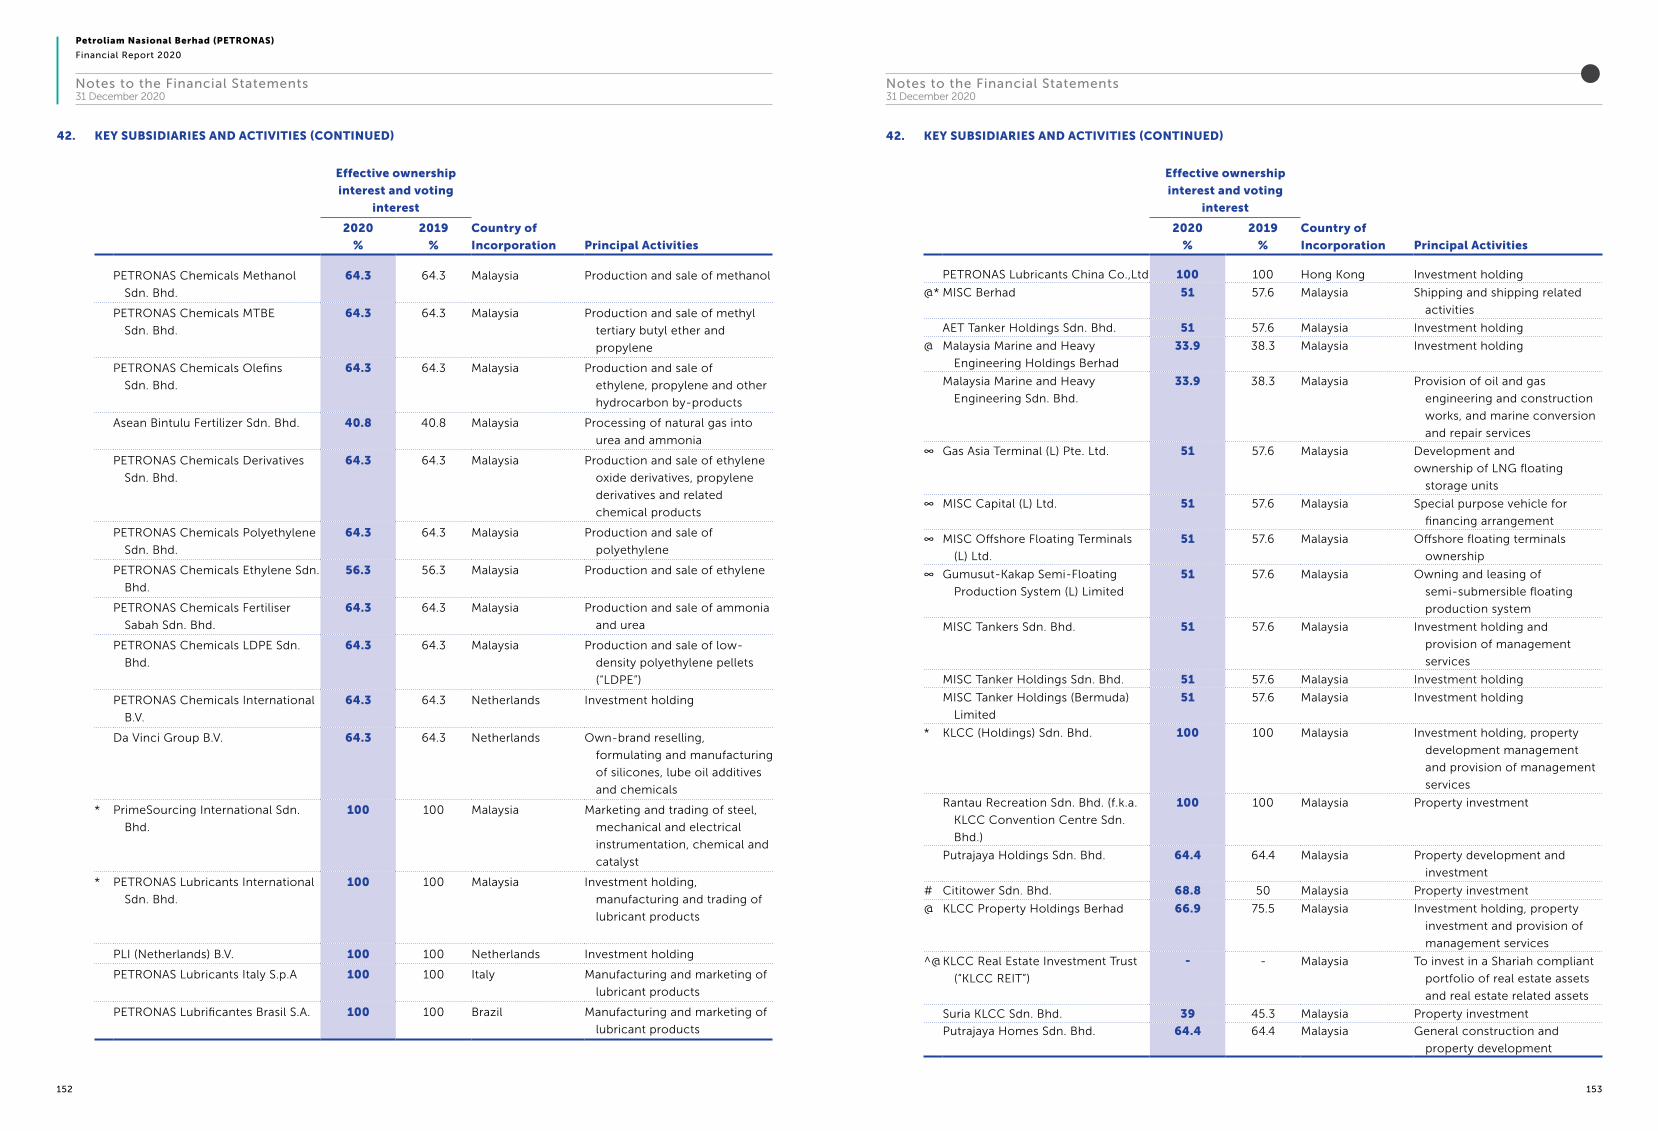
Petroliam Nasional Berhad (PETRONAS)
Financial Report 2020
152 153
Notes to the Financial Statements31 December 2020
Notes to the Financial Statements31 December 2020
42. KEY SUBSIDIARIES AND ACTIVITIES (CONTINUED)
Effective ownership
interest and voting
interest
Country of
Incorporation Principal Activities
2020
%
2019
%
PETRONAS Lubricants China Co.,Ltd 100 100 Hong Kong Investment holding
@* MISC Berhad 51 57.6 Malaysia Shipping and shipping related
activities
AET Tanker Holdings Sdn. Bhd. 51 57.6 Malaysia Investment holding
@ Malaysia Marine and Heavy
Engineering Holdings Berhad
33.9 38.3 Malaysia Investment holding
Malaysia Marine and Heavy
Engineering Sdn. Bhd.
33.9 38.3 Malaysia Provision of oil and gas
engineering and construction
works, and marine conversion
and repair services
∞ Gas Asia Terminal (L) Pte. Ltd. 51 57.6 Malaysia Development and
ownership of LNG floating
storage units
∞ MISC Capital (L) Ltd. 51 57.6 Malaysia Special purpose vehicle for
financing arrangement
∞ MISC Offshore Floating Terminals
(L) Ltd.
51 57.6 Malaysia Offshore floating terminals
ownership
∞ Gumusut-Kakap Semi-Floating
Production System (L) Limited
51 57.6 Malaysia Owning and leasing of
semi-submersible floating
production system
MISC Tankers Sdn. Bhd. 51 57.6 Malaysia Investment holding and
provision of management
services
MISC Tanker Holdings Sdn. Bhd. 51 57.6 Malaysia Investment holding
MISC Tanker Holdings (Bermuda)
Limited
51 57.6 Malaysia Investment holding
* KLCC (Holdings) Sdn. Bhd. 100 100 Malaysia Investment holding, property
development management
and provision of management
services
Rantau Recreation Sdn. Bhd. (f.k.a.
KLCC Convention Centre Sdn.
Bhd.)
100 100 Malaysia Property investment
Putrajaya Holdings Sdn. Bhd. 64.4 64.4 Malaysia Property development and
investment
# Cititower Sdn. Bhd. 68.8 50 Malaysia Property investment
@ KLCC Property Holdings Berhad 66.9 75.5 Malaysia Investment holding, property
investment and provision of
management services
^@ KLCC Real Estate Investment Trust
(“KLCC REIT”)
- - Malaysia To invest in a Shariah compliant
portfolio of real estate assets
and real estate related assets
Suria KLCC Sdn. Bhd. 39 45.3 Malaysia Property investment
Putrajaya Homes Sdn. Bhd. 64.4 64.4 Malaysia General construction and
property development
42. KEY SUBSIDIARIES AND ACTIVITIES (CONTINUED)
Effective ownership
interest and voting
interest
Country of
Incorporation Principal Activities
2020
%
2019
%
PETRONAS Chemicals Methanol
Sdn. Bhd.
64.3 64.3 Malaysia Production and sale of methanol
PETRONAS Chemicals MTBE
Sdn. Bhd.
64.3 64.3 Malaysia Production and sale of methyl
tertiary butyl ether and
propylene
PETRONAS Chemicals Olefins
Sdn. Bhd.
64.3 64.3 Malaysia Production and sale of
ethylene, propylene and other
hydrocarbon by-products
Asean Bintulu Fertilizer Sdn. Bhd. 40.8 40.8 Malaysia Processing of natural gas into
urea and ammonia
PETRONAS Chemicals Derivatives
Sdn. Bhd.
64.3 64.3 Malaysia Production and sale of ethylene
oxide derivatives, propylene
derivatives and related
chemical products
PETRONAS Chemicals Polyethylene
Sdn. Bhd.
64.3 64.3 Malaysia Production and sale of
polyethylene
PETRONAS Chemicals Ethylene Sdn.
Bhd.
56.3 56.3 Malaysia Production and sale of ethylene
PETRONAS Chemicals Fertiliser
Sabah Sdn. Bhd.
64.3 64.3 Malaysia Production and sale of ammonia
and urea
PETRONAS Chemicals LDPE Sdn.
Bhd.
64.3 64.3 Malaysia Production and sale of low-
density polyethylene pellets
(“LDPE”)
PETRONAS Chemicals International
B.V.
64.3 64.3 Netherlands Investment holding
Da Vinci Group B.V. 64.3 64.3 Netherlands Own-brand reselling,
formulating and manufacturing
of silicones, lube oil additives
and chemicals
* PrimeSourcing International Sdn.
Bhd.
100 100 Malaysia Marketing and trading of steel,
mechanical and electrical
instrumentation, chemical and
catalyst
* PETRONAS Lubricants International
Sdn. Bhd.
100 100 Malaysia Investment holding,
manufacturing and trading of
lubricant products
PLI (Netherlands) B.V. 100 100 Netherlands Investment holding
PETRONAS Lubricants Italy S.p.A 100 100 Italy Manufacturing and marketing of
lubricant products
PETRONAS Lubrificantes Brasil S.A. 100 100 Brazil Manufacturing and marketing of
lubricant products
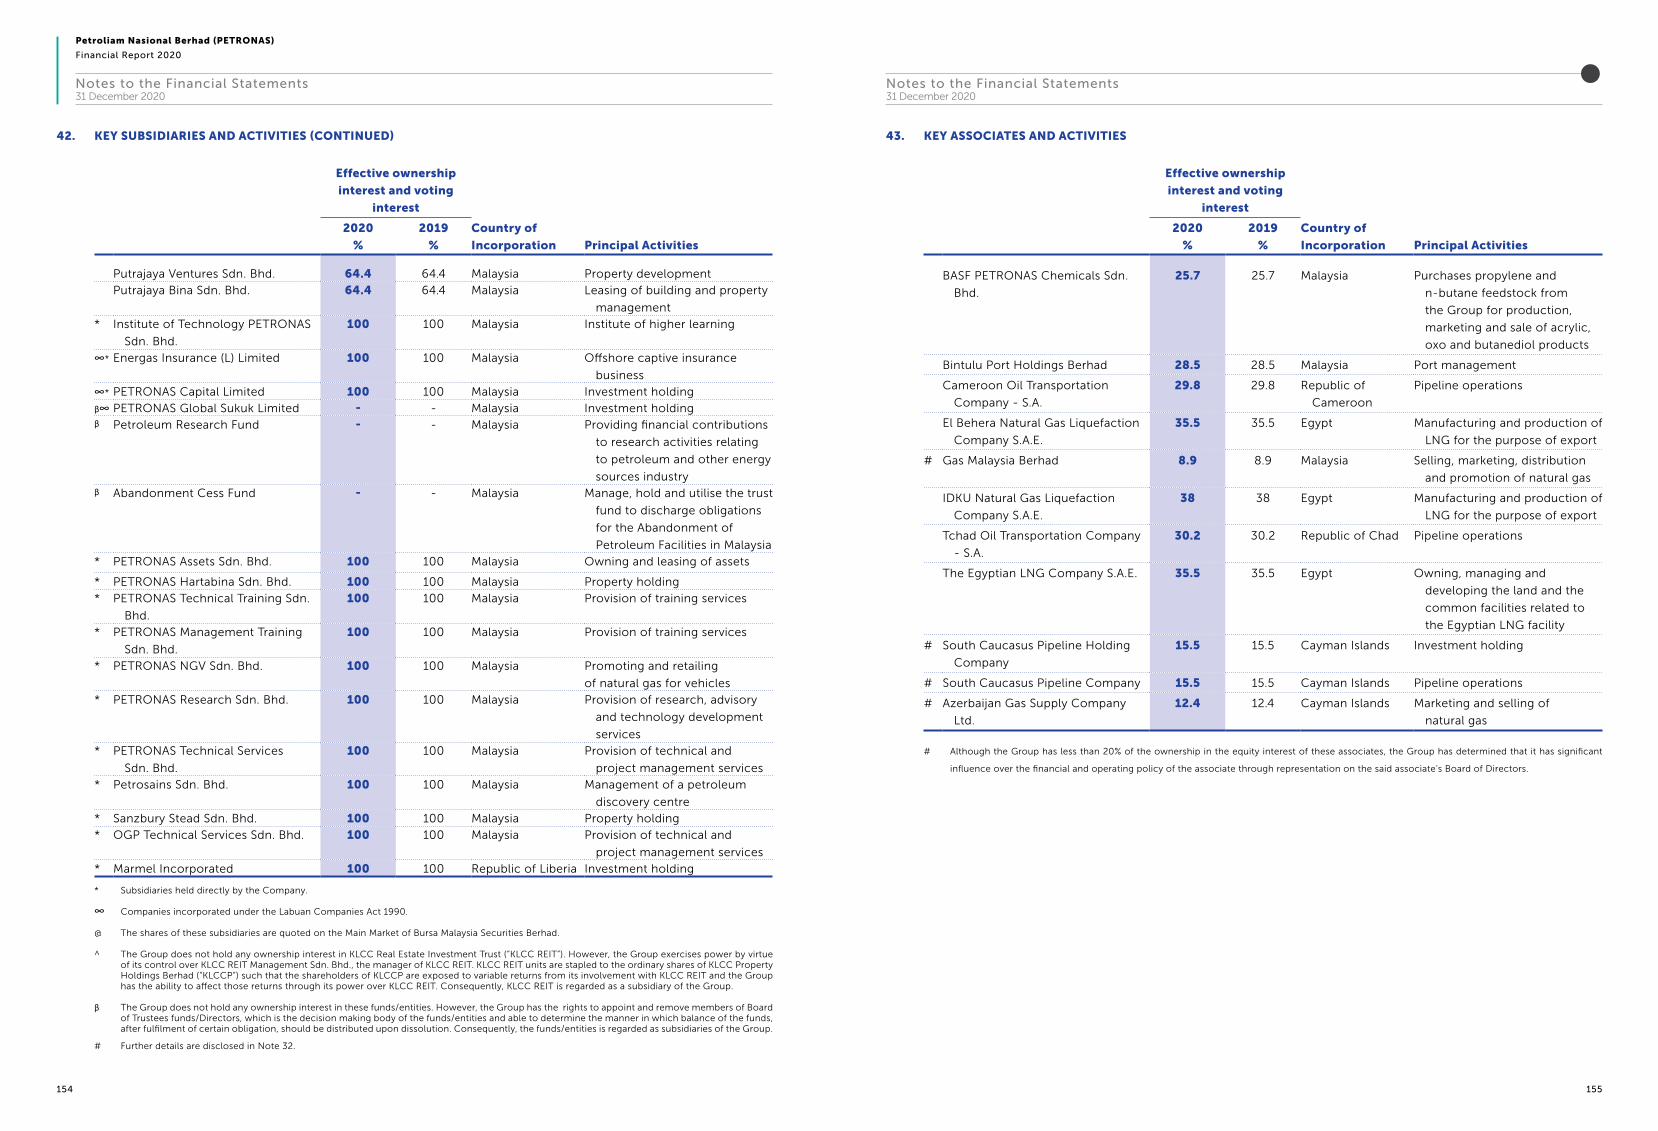
Petroliam Nasional Berhad (PETRONAS)
Financial Report 2020
154 155
Notes to the Financial Statements31 December 2020
Notes to the Financial Statements31 December 2020
43. KEY ASSOCIATES AND ACTIVITIES
Effective ownership
interest and voting
interest
Country of
Incorporation Principal Activities
2020
%
2019
%
BASF PETRONAS Chemicals Sdn.
Bhd.
25.7 25.7 Malaysia Purchases propylene and
n-butane feedstock from
the Group for production,
marketing and sale of acrylic,
oxo and butanediol products
Bintulu Port Holdings Berhad 28.5 28.5 Malaysia Port management
Cameroon Oil Transportation
Company - S.A.
29.8 29.8 Republic of
Cameroon
Pipeline operations
El Behera Natural Gas Liquefaction
Company S.A.E.
35.5 35.5 Egypt Manufacturing and production of
LNG for the purpose of export
# Gas Malaysia Berhad 8.9 8.9 Malaysia Selling, marketing, distribution
and promotion of natural gas
IDKU Natural Gas Liquefaction
Company S.A.E.
38 38 Egypt Manufacturing and production of
LNG for the purpose of export
Tchad Oil Transportation Company
- S.A.
30.2 30.2 Republic of Chad Pipeline operations
The Egyptian LNG Company S.A.E. 35.5 35.5 Egypt Owning, managing and
developing the land and the
common facilities related to
the Egyptian LNG facility
# South Caucasus Pipeline Holding
Company
15.5 15.5 Cayman Islands Investment holding
# South Caucasus Pipeline Company 15.5 15.5 Cayman Islands Pipeline operations
# Azerbaijan Gas Supply Company
Ltd.
12.4 12.4 Cayman Islands Marketing and selling of
natural gas
# Although the Group has less than 20% of the ownership in the equity interest of these associates, the Group has determined that it has significant
influence over the financial and operating policy of the associate through representation on the said associate’s Board of Directors.
42. KEY SUBSIDIARIES AND ACTIVITIES (CONTINUED)
Effective ownership
interest and voting
interest
Country of
Incorporation Principal Activities
2020
%
2019
%
Putrajaya Ventures Sdn. Bhd. 64.4 64.4 Malaysia Property development
Putrajaya Bina Sdn. Bhd. 64.4 64.4 Malaysia Leasing of building and property
management
* Institute of Technology PETRONAS
Sdn. Bhd.
100 100 Malaysia Institute of higher learning
∞* Energas Insurance (L) Limited 100 100 Malaysia Offshore captive insurance
business
∞* PETRONAS Capital Limited 100 100 Malaysia Investment holding
β∞ PETRONAS Global Sukuk Limited - - Malaysia Investment holdingβ Petroleum Research Fund - - Malaysia Providing financial contributions
to research activities relating
to petroleum and other energy
sources industryβ Abandonment Cess Fund - - Malaysia Manage, hold and utilise the trust
fund to discharge obligations
for the Abandonment of
Petroleum Facilities in Malaysia
* PETRONAS Assets Sdn. Bhd. 100 100 Malaysia Owning and leasing of assets
* PETRONAS Hartabina Sdn. Bhd. 100 100 Malaysia Property holding
* PETRONAS Technical Training Sdn.
Bhd.
100 100 Malaysia Provision of training services
* PETRONAS Management Training
Sdn. Bhd.
100 100 Malaysia Provision of training services
* PETRONAS NGV Sdn. Bhd. 100 100 Malaysia Promoting and retailing
of natural gas for vehicles
* PETRONAS Research Sdn. Bhd. 100 100 Malaysia Provision of research, advisory
and technology development
services
* PETRONAS Technical Services
Sdn. Bhd.
100 100 Malaysia Provision of technical and
project management services
* Petrosains Sdn. Bhd. 100 100 Malaysia Management of a petroleum
discovery centre
* Sanzbury Stead Sdn. Bhd. 100 100 Malaysia Property holding
* OGP Technical Services Sdn. Bhd. 100 100 Malaysia Provision of technical and
project management services
* Marmel Incorporated 100 100 Republic of Liberia Investment holding
* Subsidiaries held directly by the Company.
∞ Companies incorporated under the Labuan Companies Act 1990.
@ The shares of these subsidiaries are quoted on the Main Market of Bursa Malaysia Securities Berhad.
^ The Group does not hold any ownership interest in KLCC Real Estate Investment Trust (“KLCC REIT”). However, the Group exercises power by virtue of its control over KLCC REIT Management Sdn. Bhd., the manager of KLCC REIT. KLCC REIT units are stapled to the ordinary shares of KLCC Property Holdings Berhad (“KLCCP”) such that the shareholders of KLCCP are exposed to variable returns from its involvement with KLCC REIT and the Group has the ability to affect those returns through its power over KLCC REIT. Consequently, KLCC REIT is regarded as a subsidiary of the Group.
β The Group does not hold any ownership interest in these funds/entities. However, the Group has the rights to appoint and remove members of Board of Trustees funds/Directors, which is the decision making body of the funds/entities and able to determine the manner in which balance of the funds, after fulfilment of certain obligation, should be distributed upon dissolution. Consequently, the funds/entities is regarded as subsidiaries of the Group.
# Further details are disclosed in Note 32.

Petroliam Nasional Berhad (PETRONAS)
Financial Report 2020
156 157
Notes to the Financial Statements31 December 2020
REPORT ON THE AUDIT OF THE FINANCIAL STATEMENTS
Opinion
We have audited the financial statements of Petroliam Nasional Berhad, which comprise the statements of financial position as
at 31 December 2020 of the Group and of the Company, and the statements of profit or loss and other comprehensive income,
statements of changes in equity and statements of cash flows of the Group and of the Company for the year then ended, and
notes to the financial statements, including a summary of significant accounting policies, as set out on pages 8 to 156.
In our opinion, the accompanying financial statements give a true and fair view of the financial position of the Group and of
the Company as at 31 December 2020, and of their financial performance and their cash flows for the year then ended in
accordance with Malaysian Financial Reporting Standards, International Financial Reporting Standards and the requirements of
the Companies Act 2016 in Malaysia.
Basis for Opinion
We conducted our audit in accordance with approved standards on auditing in Malaysia and International Standards on Auditing.
Our responsibilities under those standards are further described in the Auditors’ Responsibilities for the Audit of the Financial
Statements section of our auditors’ report. We believe that the audit evidence we have obtained is sufficient and appropriate
to provide a basis for our opinion.
Independence and Other Ethical Responsibilities
We are independent of the Group and of the Company in accordance with the By Laws (on Professional Ethics, Conduct and
Practice) of the Malaysian Institute of Accountants (“By-Laws”) and the International Ethics Standards Board for Accountants’
International Code of Ethics for Professional Accountants (including International Independence Standards) (“IESBA Code”), and
we have fulfilled our other ethical responsibilities in accordance with the By-Laws and the IESBA Code.
Key Audit Matters
Key audit matters are those matters that, in our professional judgment, were of most significance in our audit of the financial
statements of the Group and of the Company for the current year. These matters were addressed in the context of our audit
of the financial statements of the Group and of the Company as a whole, and in forming our opinion thereon, and we do not
provide a separate opinion on these matters.
44. KEY JOINT ARRANGEMENTS AND ACTIVITIES
Effective ownership
interest and voting
interest
Country of
Incorporation Principal Activities
2020
%
2019
%
BP PETRONAS Acetyls Sdn. Bhd. 19.3 19.3 Malaysia Manufacture, sell and distribute
acetic acid
Trans Thai-Malaysia (Thailand) Ltd. 50 50 Thailand Gas pipeline transportation and
gas separation services
Trans Thai-Malaysia (Malaysia)
Sdn. Bhd.
50 50 Malaysia Transporting and delivering gas
products
Indianoil PETRONAS Private
Limited
50 50 India Manufacture and bottling
services of Liquid Petroleum
Gas (“LPG”)
Kimanis Power Sdn. Bhd. 30.6 30.6 Malaysia Generation and sale of electricity
Taninthayi Pipeline Co. LLC 40.9 40.9 Cayman Islands Transportation of gas
∞ Malaysia Deepwater Floating
Terminal (Kikeh) Ltd.
26.0 29.4 Malaysia Floating production storage and
off-loading (“FPSO”) owner
Guangxi Beihai Yuchai High Quality
Lube Co., Ltd.
50 50 China Manufacturing and marketing of
lubricant products
Guangxi Nanning Yuchai Lube
Co., Ltd.
50 50 China Manufacturing and marketing of
lubricant products
Pengerang Terminals (Two)
Sdn. Bhd.
40 40 Malaysia Undertake activities
related to terminal storage
facilities for petroleum and
petrochemical products
Pengerang Refining Company
Sdn. Bhd.
50 50 Malaysia Undertake blending, processing
or cracking of crude,
condensates, feedstock or
intermediate feedstock
Pengerang Petrochemical
Company Sdn. Bhd.
32 32 Malaysia Sales of products within ethane
and propane chains and
ethane derivatives to the joint
operators
∞ Company incorporated under the Labuan Companies Act 1990.
Independent Auditors’ ReportTo the Members of Petroliam Nasional Berhad

Petroliam Nasional Berhad (PETRONAS)
Financial Report 2020
158 159
Key Audit Matters
Measurement of provision for decommissioning, dismantling, removal and
restoration (“DDRR”)
Refer to Note 23 - Other Long-term Liabilities and Provisions.
The key audit matter How the matter was addressed in our audit
The provision outstanding for DDRR of the Group and the
Company amounts to RM41,128 million (2019: RM37,070
million) and RM17,159 million (2019: RM15,740 million) (refer
Note 23) respectively as at the end of current financial year,
which represents 30% (2019: 33%) and 19% (2019: 26%) of
the Group’s and Company’s non - current liabilities.
The estimation of DDRR provision, especially for assets under
Upstream operating segment (“Upstream assets”), involves a
high level of judgment, complex calculations and estimation
uncertainty.
Furthermore, DDRR activity of the Group and the Company
especially on Upstream assets is rather preliminary, where
majority of the assets are still in production stage. As such,
there is limited historical precedent which the Group and the
Company can benchmark against on the expected future
costs to be incurred. These factors increase the degree of
complexity in estimating the DDRR provision.
The Group reviews the DDRR provision on an annual basis,
of which key components in the computation include the
interest rate, inflation rate and expected future costs.
We performed the following audit procedures, among others:
i) Assessed the appropriateness of data used in the
calculation of the DDRR provision to the originating
source.
ii) Evaluated key assumptions used in the DDRR provision
calculation, among others:
• interest and inflation rates - compared to
information from external sources; and
• expected future costs - compared to costs
incurred on recent similar transactions.
iii) Performed consistency testing on the application of
key assumptions to respective oil fields.
iv) Re-performed the calculation of the DDRR provision
for mathematical accuracy.
Based on the above procedures, the measurement of
provision for DDRR of the Group and the Company are
appropriate.
Information Other than the Financial Statements and Auditors’ Report Thereon
The Directors of the Company are responsible for the other information. The other information comprises the information
included in the Directors’ Report, but does not include the financial statements of the Group and of the Company and our
auditors’ report thereon, which we obtained prior to the date of this auditors’ report, and the remaining parts of the annual
report, which are expected to be made available to us after that date.
Our opinion on the financial statements of the Group and of the Company does not cover the Directors’ Report and we do not
express any form of assurance conclusion thereon.
In connection with our audit of the financial statements of the Group and of the Company, our responsibility is to read the
Directors’ Report and, in doing so, consider whether the Directors’ Report is materially inconsistent with the financial statements
of the Group and of the Company or our knowledge obtained in the audit, or otherwise appears to be materially misstated.
If, based on the work we have performed, we conclude that there is a material misstatement of the Directors’ Report, we are
required to report that fact. We have nothing to report in this regard.
When we read remaining parts of the annual report, if we conclude that there is a material misstatement therein, we are required
to communicate the matter to the Directors of the Company and take appropriate actions in accordance with approved
standards on auditing in Malaysia and International Standards on Auditing.
Key Audit Matters
Impairment of property, plant and equipment (“PPE”) and intangible assets (“IA”)
Refer to Note 3 - Property, Plant and Equipment and Note 9 - Intangible Assets.
The key audit matter How the matter was addressed in our audit
The Group operates in the oil and gas sector which has
been affected by the continued fluctuation in the oil and gas
prices. This gives rise to a risk that the carrying amount of
the Group’s property, plant and equipment and intangible
assets consisting of goodwill, exploration expenditures and
other intangible assets, especially in the Upstream operating
segment might exceed their recoverable amount, and
therefore the carrying amount needs to be impaired.
The Group has estimated the recoverable amount for each
cash generating unit (“CGU”) by forecasting and discounting
future cash flows relevant to the CGU. As a result, net
impairment loss of RM25,702 million (2019: RM6,539 million)
for PPE and net impairment loss of RM5,648 million (2019:
RM204 million) for IA (refer Note 26) were recognised in the
current financial year.
We have identified the evaluation of the carrying amount
of the Group’s PPE and IA of RM291,717 million (2019:
RM319,204 million) (refer Note 3) and RM20,044 million
(2019: RM26,260 million) (refer Note 9) respectively at 31
December 2020 as a key audit matter because:
• it is material in the consolidated financial statements
and represents 54% (2019: 56%) of Group’s total
assets; and
• the estimation of recoverable amounts involves
a significant degree of judgment exercised and
assumptions made by the Group. Key judgmental
aspects include assumptions of oil and gas prices,
expenditures, production profile and the use of an
appropriate discount rate.
We performed the following audit procedures, among others:
i) Considered the appropriateness of Group’s
determination of CGUs based on our knowledge of
the Group’s business and its internal reporting.
ii) Evaluated key assumptions used in the estimation of
recoverable amount, among others:
• production profile - assessed whether the
production profile is within the field/reserve
lives;
• long term outlook of prices - compared to
information pubilshed by external analysts;
• expenditures - compared to information
included in the Group’s approved budget and
actual historical information; and
• discount rate - challenged the appropriateness
of the discount rate used.
iii) Performed stress test over the projected oil price.
iv) Reviewed component auditor’s testing on projected
capital expenditure against actual incurred.
v) Considered the adequacy of the Group’s disclosures
about those assumptions to which the outcome of the
impairment assessment is most sensitive.
Based on the above procedures, the carrying amount of the
Group’s PPE and IA is appropriate.
Independent Auditors’ ReportTo the Members of Petroliam Nasional Berhad
Independent Auditors’ ReportTo the Members of Petroliam Nasional Berhad

Petroliam Nasional Berhad (PETRONAS)
Financial Report 2020
160 161
Auditors’ Responsibilities for the Audit of the Financial Statements (continued)
We communicate with the Directors regarding, among other matters, the planned scope and timing of the audit and significant
audit findings, including any significant deficiencies in internal control that we identify during our audit.
From the matters communicated with the Directors, we determine those matters that were of most significance in the audit
of the financial statements of the Group and of the Company for the current year and are therefore the key audit matters.
We describe these matters in our auditors’ report unless law or regulation precludes public disclosure about the matter or
when, in extremely rare circumstances, we determine that a matter should not be communicated in our auditors’ report
because the adverse consequences of doing so would reasonably be expected to outweigh the public interest benefits of such
communication.
Report on Other Legal and Regulatory Requirements
In accordance with the requirements of the Companies Act 2016 in Malaysia, we report that the subsidiaries of which we have
not acted as auditors are disclosed in Appendix I.
Other Matter
This report is made solely to the members of the Company, as a body, in accordance with Section 266 of the Companies Act
2016 in Malaysia and for no other purpose. We do not assume responsibility to any other person for the content of this report.
KPMG PLT
(LLP0010081-LCA & AF 0758)
Chartered Accountants
Petaling Jaya, Malaysia
Date: 25 February 2021
Muhammad Azman Bin Che Ani
Approval Number: 02922/04/2022 J
Chartered Accountant
Responsibilities of the Directors for the Financial Statements
The Directors of the Company are responsible for the preparation of financial statements of the Group and of the Company
that give a true and fair view in accordance with the Malaysian Financial Reporting Standards, International Financial Reporting
Standards and the requirements of the Companies Act 2016 in Malaysia. The Directors are also responsible for such internal
control as the Directors determine is necessary to enable the preparation of financial statements of the Group and of the
Company that are free from material misstatement, whether due to fraud or error.
In preparing the financial statements of the Group and of the Company, the Directors are responsible for assessing the ability
of the Group and of the Company to continue as a going concern, disclosing, as applicable, matters related to going concern
and using the going concern basis of accounting unless the Directors either intend to liquidate the Group or the Company or
to cease operations, or have no realistic alternative but to do so.
Auditors’ Responsibilities for the Audit of the Financial Statements
Our objectives are to obtain reasonable assurance about whether the financial statements of the Group and of the Company as
a whole are free from material misstatement, whether due to fraud or error, and to issue an auditors’ report that includes our
opinion. Reasonable assurance is a high level of assurance, but is not a guarantee that an audit conducted in accordance with
approved standards on auditing in Malaysia and International Standards on Auditing will always detect a material misstatement
when it exists. Misstatements can arise from fraud or error and are considered material if, individually or in the aggregate, they
could reasonably be expected to influence the economic decisions of users taken on the basis of these financial statements.
As part of an audit in accordance with approved standards on auditing in Malaysia and International Standards on Auditing, we
exercise professional judgment and maintain professional scepticism throughout the audit. We also:
• Identify and assess the risks of material misstatement of the financial statements of the Group and of the Company,
whether due to fraud or error, design and perform audit procedures responsive to those risks, and obtain audit evidence
that is sufficient and appropriate to provide a basis for our opinion. The risk of not detecting a material misstatement
resulting from fraud is higher than for one resulting from error, as fraud may involve collusion, forgery, intentional
omissions, misrepresentations, or the override of internal control.
• Obtain an understanding of internal control relevant to the audit in order to design audit procedures that are appropriate
in the circumstances, but not for the purpose of expressing an opinion on the effectiveness of the internal control of the
Group and of the Company.
• Evaluate the appropriateness of accounting policies used and the reasonableness of accounting estimates and related
disclosures made by the Directors.
• Conclude on the appropriateness of the Directors’ use of the going concern basis of accounting and, based on the audit
evidence obtained, whether a material uncertainty exists related to events or conditions that may cast significant doubt
on the ability of the Group or of the Company to continue as a going concern. If we conclude that a material uncertainty
exists, we are required to draw attention in our auditors’ report to the related disclosures in the financial statements of
the Group and of the Company or, if such disclosures are inadequate, to modify our opinion. Our conclusions are based
on the audit evidence obtained up to the date of our auditors’ report. However, future events or conditions may cause
the Group or the Company to cease to continue as a going concern.
• Evaluate the overall presentation, structure and content of the financial statements of the Group and of the Company,
including the disclosures, and whether the financial statements of the Group and of the Company represent the underlying
transactions and events in a manner that gives a true and fair view.
• Obtain sufficient appropriate audit evidence regarding the financial information of the entities or business activities
within the Group to express an opinion on the financial statements of the Group. We are responsible for the direction,
supervision and performance of the group audit. We remain solely responsible for our audit opinion.
Independent Auditors’ ReportTo the Members of Petroliam Nasional Berhad
Independent Auditors’ ReportTo the Members of Petroliam Nasional Berhad
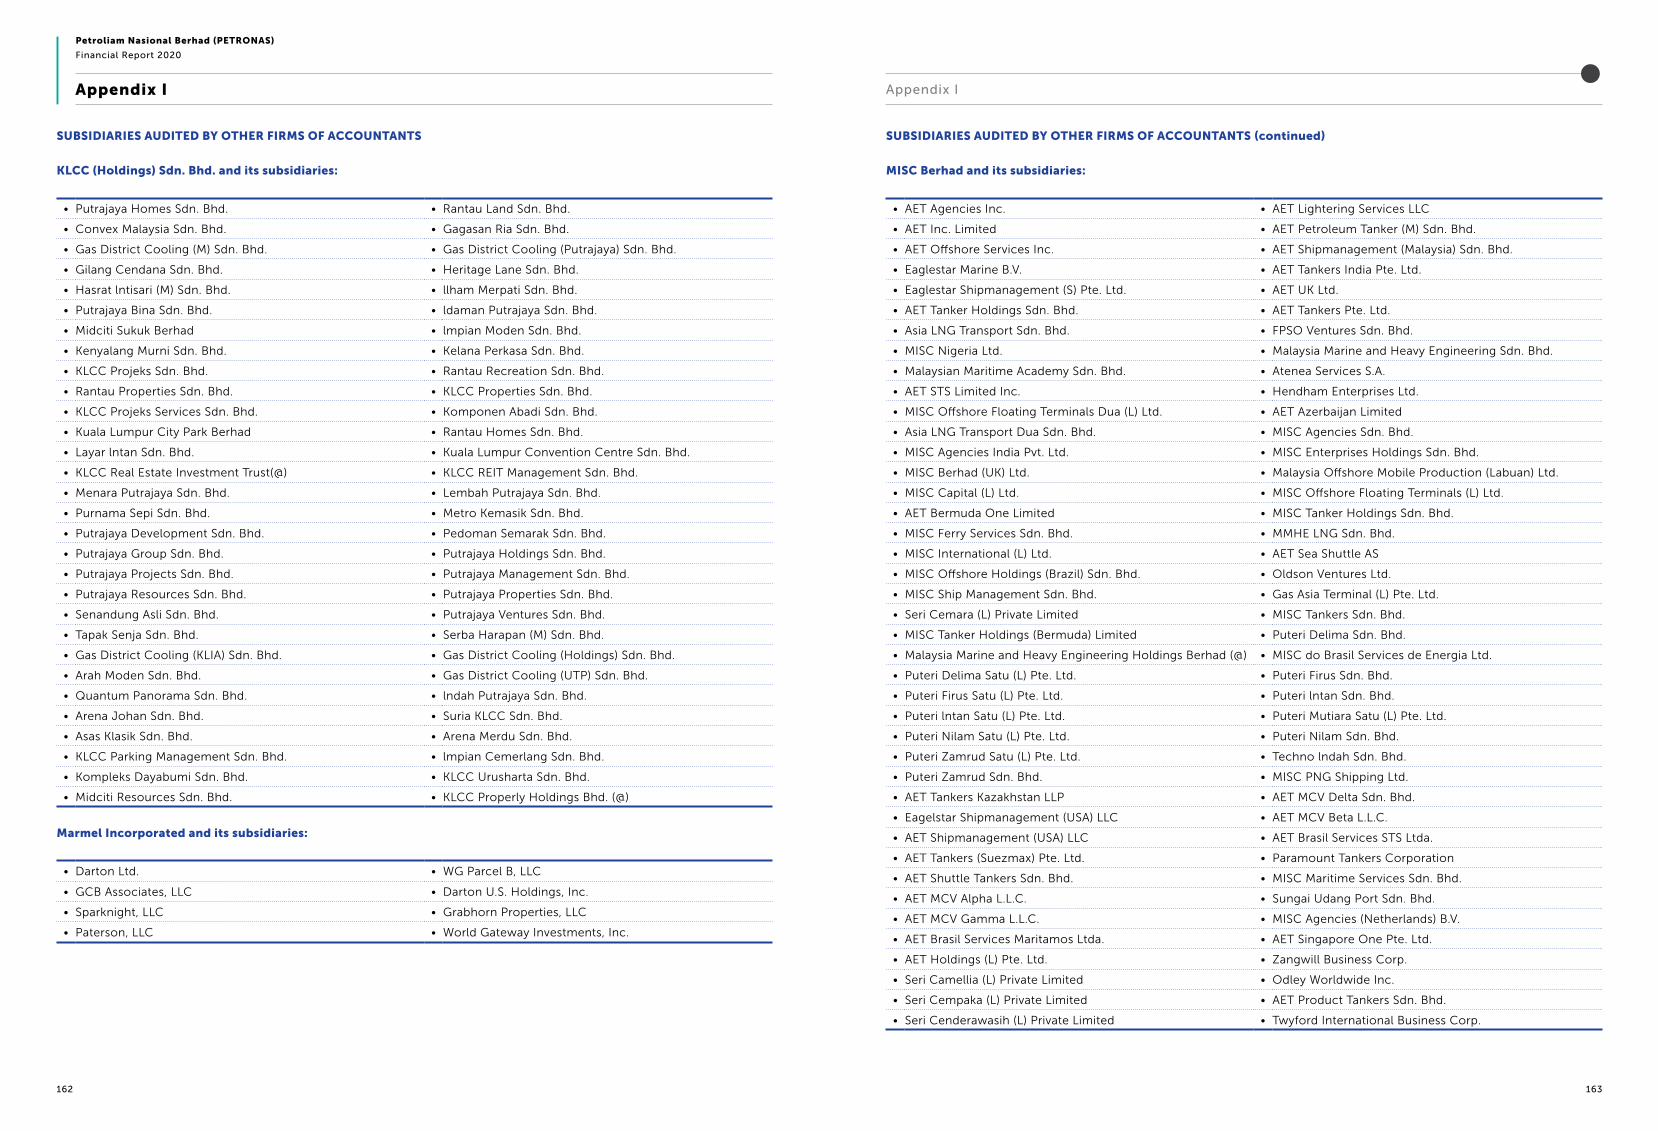
Petroliam Nasional Berhad (PETRONAS)
Financial Report 2020
162 163
SUBSIDIARIES AUDITED BY OTHER FIRMS OF ACCOUNTANTS
KLCC (Holdings) Sdn. Bhd. and its subsidiaries:
• Putrajaya Homes Sdn. Bhd. • Rantau Land Sdn. Bhd.
• Convex Malaysia Sdn. Bhd. • Gagasan Ria Sdn. Bhd.
• Gas District Cooling (M) Sdn. Bhd. • Gas District Cooling (Putrajaya) Sdn. Bhd.
• Gilang Cendana Sdn. Bhd. • Heritage Lane Sdn. Bhd.
• Hasrat lntisari (M) Sdn. Bhd. • llham Merpati Sdn. Bhd.
• Putrajaya Bina Sdn. Bhd. • ldaman Putrajaya Sdn. Bhd.
• Midciti Sukuk Berhad • lmpian Moden Sdn. Bhd.
• Kenyalang Murni Sdn. Bhd. • Kelana Perkasa Sdn. Bhd.
• KLCC Projeks Sdn. Bhd. • Rantau Recreation Sdn. Bhd.
• Rantau Properties Sdn. Bhd. • KLCC Properties Sdn. Bhd.
• KLCC Projeks Services Sdn. Bhd. • Komponen Abadi Sdn. Bhd.
• Kuala Lumpur City Park Berhad • Rantau Homes Sdn. Bhd.
• Layar lntan Sdn. Bhd. • Kuala Lumpur Convention Centre Sdn. Bhd.
• KLCC Real Estate Investment Trust(@) • KLCC REIT Management Sdn. Bhd.
• Menara Putrajaya Sdn. Bhd. • Lembah Putrajaya Sdn. Bhd.
• Purnama Sepi Sdn. Bhd. • Metro Kemasik Sdn. Bhd.
• Putrajaya Development Sdn. Bhd. • Pedoman Semarak Sdn. Bhd.
• Putrajaya Group Sdn. Bhd. • Putrajaya Holdings Sdn. Bhd.
• Putrajaya Projects Sdn. Bhd. • Putrajaya Management Sdn. Bhd.
• Putrajaya Resources Sdn. Bhd. • Putrajaya Properties Sdn. Bhd.
• Senandung Asli Sdn. Bhd. • Putrajaya Ventures Sdn. Bhd.
• Tapak Senja Sdn. Bhd. • Serba Harapan (M) Sdn. Bhd.
• Gas District Cooling (KLIA) Sdn. Bhd. • Gas District Cooling (Holdings) Sdn. Bhd.
• Arah Moden Sdn. Bhd. • Gas District Cooling (UTP) Sdn. Bhd.
• Quantum Panorama Sdn. Bhd. • lndah Putrajaya Sdn. Bhd.
• Arena Johan Sdn. Bhd. • Suria KLCC Sdn. Bhd.
• Asas Klasik Sdn. Bhd. • Arena Merdu Sdn. Bhd.
• KLCC Parking Management Sdn. Bhd. • lmpian Cemerlang Sdn. Bhd.
• Kompleks Dayabumi Sdn. Bhd. • KLCC Urusharta Sdn. Bhd.
• Midciti Resources Sdn. Bhd. • KLCC Properly Holdings Bhd. (@)
Marmel Incorporated and its subsidiaries:
• Darton Ltd. • WG Parcel B, LLC
• GCB Associates, LLC • Darton U.S. Holdings, Inc.
• Sparknight, LLC • Grabhorn Properties, LLC
• Paterson, LLC • World Gateway Investments, Inc.
SUBSIDIARIES AUDITED BY OTHER FIRMS OF ACCOUNTANTS (continued)
MISC Berhad and its subsidiaries:
• AET Agencies Inc. • AET Lightering Services LLC
• AET Inc. Limited • AET Petroleum Tanker (M) Sdn. Bhd.
• AET Offshore Services Inc. • AET Shipmanagement (Malaysia) Sdn. Bhd.
• Eaglestar Marine B.V. • AET Tankers India Pte. Ltd.
• Eaglestar Shipmanagement (S) Pte. Ltd. • AET UK Ltd.
• AET Tanker Holdings Sdn. Bhd. • AET Tankers Pte. Ltd.
• Asia LNG Transport Sdn. Bhd. • FPSO Ventures Sdn. Bhd.
• MISC Nigeria Ltd. • Malaysia Marine and Heavy Engineering Sdn. Bhd.
• Malaysian Maritime Academy Sdn. Bhd. • Atenea Services S.A.
• AET STS Limited Inc. • Hendham Enterprises Ltd.
• MISC Offshore Floating Terminals Dua (L) Ltd. • AET Azerbaijan Limited
• Asia LNG Transport Dua Sdn. Bhd. • MISC Agencies Sdn. Bhd.
• MISC Agencies India Pvt. Ltd. • MISC Enterprises Holdings Sdn. Bhd.
• MISC Berhad (UK) Ltd. • Malaysia Offshore Mobile Production (Labuan) Ltd.
• MISC Capital (L) Ltd. • MISC Offshore Floating Terminals (L) Ltd.
• AET Bermuda One Limited • MISC Tanker Holdings Sdn. Bhd.
• MISC Ferry Services Sdn. Bhd. • MMHE LNG Sdn. Bhd.
• MISC International (L) Ltd. • AET Sea Shuttle AS
• MISC Offshore Holdings (Brazil) Sdn. Bhd. • Oldson Ventures Ltd.
• MISC Ship Management Sdn. Bhd. • Gas Asia Terminal (L) Pte. Ltd.
• Seri Cemara (L) Private Limited • MISC Tankers Sdn. Bhd.
• MISC Tanker Holdings (Bermuda) Limited • Puteri Delima Sdn. Bhd.
• Malaysia Marine and Heavy Engineering Holdings Berhad (@) • MISC do Brasil Services de Energia Ltd.
• Puteri Delima Satu (L) Pte. Ltd. • Puteri Firus Sdn. Bhd.
• Puteri Firus Satu (L) Pte. Ltd. • Puteri lntan Sdn. Bhd.
• Puteri lntan Satu (L) Pte. Ltd. • Puteri Mutiara Satu (L) Pte. Ltd.
• Puteri Nilam Satu (L) Pte. Ltd. • Puteri Nilam Sdn. Bhd.
• Puteri Zamrud Satu (L) Pte. Ltd. • Techno lndah Sdn. Bhd.
• Puteri Zamrud Sdn. Bhd. • MISC PNG Shipping Ltd.
• AET Tankers Kazakhstan LLP • AET MCV Delta Sdn. Bhd.
• Eagelstar Shipmanagement (USA) LLC • AET MCV Beta L.L.C.
• AET Shipmanagement (USA) LLC • AET Brasil Services STS Ltda.
• AET Tankers (Suezmax) Pte. Ltd. • Paramount Tankers Corporation
• AET Shuttle Tankers Sdn. Bhd. • MISC Maritime Services Sdn. Bhd.
• AET MCV Alpha L.L.C. • Sungai Udang Port Sdn. Bhd.
• AET MCV Gamma L.L.C. • MISC Agencies (Netherlands) B.V.
• AET Brasil Services Maritamos Ltda. • AET Singapore One Pte. Ltd.
• AET Holdings (L) Pte. Ltd. • Zangwill Business Corp.
• Seri Camellia (L) Private Limited • Odley Worldwide Inc.
• Seri Cempaka (L) Private Limited • AET Product Tankers Sdn. Bhd.
• Seri Cenderawasih (L) Private Limited • Twyford International Business Corp.
Appendix IAppendix I

Petroliam Nasional Berhad (PETRONAS)
Financial Report 2020
164 165
SUBSIDIARIES AUDITED BY OTHER FIRMS OF ACCOUNTANTS (continued)
MISC Berhad and its subsidiaries (continued):
• Seri Camar (L) Private Limited • Eaglestar Shipmanagement (L) Pte. Ltd.
• MMHE International Sdn. Bhd. • Eaglestar Marine (S) Pte. Ltd.
• MMHE EPIC Marine & Services Sdn. Bhd. • Portovenere and Lerici (Labuan) Pte. Ltd.
• Eaglestar Marine Holdings (L) Pte. Ltd. • Portovenere and Lerici (Singapore) Pte. Ltd.
• Gumusut-Kakap Semi-Floating Production System (L) Limited • Malaysia Offshore Mobile Production Dua (Labuan) Ltd.
• AET Labuan One Pte. Ltd. • AET Shutter Thankers II Pte Ltd.
• Malaysia Marine and Heavy Engineering Saudi Limited • AET Pte Ltd
• Mekar Bergading Offshore Floating (L) Limited • AET Brasil Services Maritamos Ltda
• AET Labuan Pte. Ltd • AET Tanker India Pte. Ltd.
• AET Bermuda Holding Ltd • SOL-X Pte Ltd
• AET Singapore Holding Pte Ltd • Spares CNX Pte. Ltd.
• Eaglestar Marine India Private Limited • Chord X Pte. Ltd.
• AET Sea Shuttle II AS
• Malaysia Marine & Heavy Engineering Sdn. Bhd.
PETRONAS Carigali Sdn. Bhd. and its subsidiaries:
• E&P Venture Solutions Co. Sdn. Bhd. • E&P Malaysia Venture Sdn. Bhd.
• PC JDA Ltd. • PC Randugunting Ltd.
• PETRONAS Carigali (Australia) Pty. Ltd. • PETRONAS Carigali Overseas Sdn. Bhd.
• PETRONAS Carigali (Ketapang) Ltd. • PC Ketapang II Ltd.
• PETRONAS Carigali (Surumana) Ltd. • PETRONAS Carigali Nigeria Limited
• E&P O&M Services Sdn. Bhd. • PETRONAS Carigali (West Glagah Kambuna) Ltd.
• Vestigo Petroleum Sdn. Bhd.
• PETRONAS Carigali White Nile (5B) Ltd.
PETRONAS Lubricants International Sdn. Bhd.’s subsidiaries:
• PETRONAS Lubricants Italy S.p.A (a) • PETRONAS Lubricants Poland Sp. Zo.o (a)
• PETRONAS Lubricants Africa Ltd. (a) • PETRONAS Lubricants Argentina S.A. (a)
• PETRONAS Lubrificantes Brasil S.A. (a) • PETRONAS Lubricants Great Britain Limited (a)
• PETRONAS Lubricants France S.a.s. (a) • PETRONAS Lubricants Deutschland Gmbh (a)
• PT PLI Indonesia • PLAL Egypt LLC
• PETRONAS Lubricants Netherlands B.V. (a) • PETRONAS Marketing China Company Limited (a)
• PETRONAS Lubricants Belgium N.V. (a) • PETRONAS Lubricants (India) Private Limited (a) (Y)
• PETRONAS Madeni Yaglar TIC Limited STI (a) • PETRONAS Lubricants Shandong Company Limited (a)
• PETRONAS Lubricants Spain S.L.U. (a) • PLI Australia Pty. Limited (Y)
• Arexons Srl. (a) • PETRONAS Lubricants Africa Limited (a)
• PETRONAS Lubricants Portugal Lda (a) • PLI (Netherlands) B.V
• PLI (Netherlands) B.V.
• PETRONAS Lubricants China Company Limited (a)
• PLAL Dubai Multi Commodities Centre (PLAL DMCC) (a)
SUBSIDIARIES AUDITED BY OTHER FIRMS OF ACCOUNTANTS (continued)
PETRONAS International Corporation Ltd. and its subsidiaries:
• PETRONAS Carigali Brunei Ltd. • PETRONAS LNG Ltd.
• Labuan Energy Corporation Limited • MITCO Labuan Co. Limited
• PETRONAS Suriname E&P B.V. • Myanmar PETRONAS Trading Co. Ltd.
• PAPL (Upstream) Pty. Ltd. • LEC Ireland Employment Ltd.
• PC North Madura II Ltd • Nada Properties Company Ltd.
• PC Muriah Ltd. • Natuna 1 B.V.
• PC Myanmar (Hong Kong) Limited • PC Gabon Upstream S.A
• PAPL Services Pty. Limited • PETRONAS LNG (UK) Limited
• PAPL (Upstream 11) Pty. Ltd. • Parsi International Ltd.
• PSE Kinsale Energy Limited • PC Madura Ltd.
• PETRONAS Energy Trading Limited • PAPL (Downstream) Pty. Ltd.
• PETRONAS Carigali Myanmar Inc. • PC (Myanmar) Holdings Limited (Y)
• PETRONAS Carigali Nile Ltd. • PC Vietnam Ltd.
• PC Carigali Mexico Oil and Gas Holding S.A. de C.V. • PETRONAS Angola E&P Ltd.
• PETRONAS Carigali Myanmar Ill Inc. • PETRONAS Carigali (Chad EP) Inc.
• PETRONAS Philippines Inc. (a) (Y) • PETRONAS Australia Pty. Ltd.
• Doba Pipeline Investment Inc. • PETRONAS Carigali (Jabung) Ltd.
• North Montney LNG Ltd. Partnership • PETRONAS Carigali (Turkmenistan) Sdn. Bhd.
• Argentinean Pipeline Holding Company S.A.(a) (Y) • PETRONAS (E&P) Overseas Ventures Sdn. Bhd.
• PETRONAS Thailand Co. Ltd. (a) • PC Kuala Kurun Ltd
• Japan Malaysia LNG Co. Ltd. • PETRONAS Brasil E&P Limitada
• PETRONAS LNG Sdn. Bhd. • PC Sakakemang Ltd.
• PETRONAS Carigali Canada B.V. • PETRONAS Energy Canada Ltd. (a)
• PETRONAS Carigali International E&P B.V. • PETRONAS Azerbaijan Upstream Sdn. Bhd.
• PICL (Egypt) Corporation Ltd. • PETRONAS South Caucasus S.a.r.l.
• PSE Seven Head Limited • PETRONAS Azerbaijan Shah Deniz S.a.r.l.
• PETRONAS Carigali Chad Exploration & Production Inc. • PC Mauritania II B.Y. (a)
• PETRONAS Carigali Carigali Holding B.V. • Petroliam Manpower Support Services Mexico S.A. de C.V.
• PETRONAS Carigali International Sdn. Bhd. • PC Gabon Upstream S.A.
• PICL Marketing Thailand Ltd. • PETRONAS West Papua IV Indonesia B.V.
• PETRONAS Gebang Indonesia B.V. • Labuan Energy Corporation Ltd.
• PETRONAS Aru Indonesia B.V. • PCM (Thailand) Co Ltd
• LNG Investments Europe Limited • PC Mauritania 1 Pty. Ltd. (a)
Appendix IAppendix I

Petroliam Nasional Berhad (PETRONAS)
Financial Report 2020
166 167
SUBSIDIARIES AUDITED BY OTHER FIRMS OF ACCOUNTANTS (continued)
PETRONAS Dagangan Berhad and its subsidiary:
• PETRONAS International Marketing (Thailand) Co. Ltd.
PETRONAS Marketing International Sdn. Bhd. and its subsidiaries:
• Azania Petroleum (Pty.) Ltd. • Engen Company (Mauritius) Ltd.
• Citycat Properties (Pty.) Ltd. • Engen Botswana Limited (β)
• Petroleum Investment Holding Ltd. • Engen Holdings (Pty.) Ltd.
• Engen Holdings (Ghana) Ltd. • Engen Limited
• Engen Lesotho (Pty.) Ltd. • Engen Marketing Ltd.
• Engen Marketing Botswana (Pty.) Ltd. • Engen Namibia (Pty.) Ltd.
• Engen (Nigeria) Ltd. (a) • Engen Producing (Nigeria) Ltd. (a)
• Engen Swaziland (Pty.) Ltd. • Engen Petroleum (DRC) Ltd.
• Enpet Insurance Ltd. • Renaissance Petroleum (Pty.) Ltd.
• lmtrasel (Pty.) Ltd. • Enpet Africa Insurance Ltd.
• Trek Petroleum (Pty.) Ltd. • Engen Oil Lesotho (Pty.) Ltd.
• Engen Petroleum (Mauritius) Ltd. • Zenex Oil (Pty.) Ltd.
• Pakenzyl (Pty.) Ltd. • Engen Petroleum Ltd.
• Engen DRC SARL
PETRONAS Assets Sdn. Bhd. and its subsidiaries:
• PETRONAS Digital Sdn. Bhd. (f.k.a PETRONAS ICT Sdn. Bhd.) • Petrofibre Network (M) Sdn. Bhd.
• Virtus iP Sdn. Bhd.
PETRONAS Trading Corporation Sdn. Bhd.’s subsidiaries:
• PETCO Trading (UK) Limited (a) • PETCO Trading DMCC (a)
• PT PETRONAS Niaga Indonesia
PETRONAS Technical Services Sdn. Bhd. ’s subsidiary:
• PTSSB DMCC
PETRONAS Chemicals Group Berhad’s subsidiaries:
• PCM (Thailand) Company Limited (Y) • PCM Chemical India Private Limited
• PCM (China) Company Limited (a) • PT PCM Kimia Indonesia
• Kertih Port Sdn. Bhd. • Vinyl Chloride (Malaysia) Sdn. Bhd
• Polypropylene Malaysia Sdn. Bhd. • PETRONAS Chemicals Derivatives Sdn. Bhd.
• PETRONAS Chemicals Olefins Sdn. Bhd. • PETRONAS Chemicals Glycols Sdn. Bhd.
• PETRONAS Chemicals LDPE Sdn. Bhd.
SUBSIDIARIES AUDITED BY OTHER FIRMS OF ACCOUNTANTS (continued)
Da Vinci Group B.V. and its subsidiaries:
• BRB Central Eastern Europe Sp. z.o.o. • BRB Hong Kong Limited
• BRB SIL Invest B.V. (f.k.a BRB Invest B.V.and merge with
Karan B.V.)
• BRB North America Inc.
• BRB International B.V. • BRB Real Estate Canada Inc.
• BRB LAC Invest B.V. • BRB Silicones South Africa Pty. Ltd.
• BRB LAC Singapore Pte. Ltd. • BRB Singapore Pte. Ltd.
• BRB Lube Oil Additives & Chemicals B.V. • BRB Malaysia Sdn. Bhd.
• BRB South America Representacao • Qingdao BRB Trading Co. Ltd.
• Viscotech Asia Pte. Ltd. • BRB ST Kimyasal Sanayl ve Ticaret A.S.
PETRONAS International Power Corporation BV’s subsidiaries:
• Amplus Energy Solutions Pvt. Ltd (India) • Amplus Power Solutions Pte Ltd
• Amplus Solar Power Pte Ltd • Amplus KN Solar Pte Ltd
• Amplus Solar Solutions Pte Ltd • Amplus KN One Power Pte Ltd
• Amplus Andhra Power Pte Ltd • Amplus Management Svcs Pte Ltd
• Amplus Sun Solutions Pte Ltd • Amplus Solar Power MH Pte Ltd
• Amplus Coastal Power Pte Ltd • Amplus RJ Solar Pte Ltd
• Amplus Green Power Pte Ltd • Amplus Power Supply Pte Ltd
• Solbridge Energy Pte Ltd • Ananth Solar Power Maharashtra
• Amplus Jyotimangal Energy Pte Ltd • Amplus Sunshine Pte Ltd
• Amplus Green One Power Pte Ltd • Amplus Sunlight Pte Ltd
• Sunterrace Energy One Pte Ltd • Amplus Superior Solar Pte Ltd
• Wednesday Solar Pte Ltd • Wattvolt Energy Pte Ltd
• Fourvolt Solar Pte Ltd • Sungaze Power Pte Ltd
• Amplus Energy Solutions FZE • Amplus Energy Solutions (Thailand) Co. Ltd.
Institute of Technology PETRONAS Sdn. Bhd. and its other subsidiary:
• UTP Futuretech Sdn Bhd
Subsidiaries held directly by the Company:
• Energas Insurance (L) Limited • PETRONAS Capital Limited
• PETRONAS NGV Sdn. Bhd. • PETRONAS Hartabina Sdn. Bhd
• PETRONAS Management Training Sdn. Bhd. • PETRONAS Technical Training Sdn. Bhd.
• PETRONAS Gas & New Energy Sdn Bhd (f.k.a. eLearning
Solutions Sdn Bhd)
a Audited by affiliates of KPMG.
@ The shares of this subsidiary are quoted on the Main Market of Bursa Malaysia Securities Berhad.
Y Consolidated based on management financial statements.
β The shares of this subsidiary are quoted on the Botswana Stock Exchange.
Appendix IAppendix I

This page is intentionally left blank.

www.petronas.com
Petroliam Nasional Berhad (PETRONAS) 197401002911 (20076-K)
Tower 1, PETRONAS Twin Towers, Kuala Lumpur City Centre50088 Kuala Lumpur, Malaysia
PETRONAS