Embed Size (px)
Citation preview
Program 2 – Moving Brisbane
- 53 -
Moving Brisbane
Program Goal
Brisbane's transport network enables efficient and sustainable movement of people and freight. The city's accessibility and liveability is maintained and all have access to a high quality road network, high quality public transport (bus and ferry) services and active travel alternatives, with an understanding that investment in each transport mode is required to cater for the differing needs of users.
Program Description
Council recognises the need to maintain Brisbane as an easy city to get around. The community pays the costs of traffic congestion in increased costs of goods and services, reduced amenity and inconvenience. Relief of traffic congestion through a balanced strategy of road upgrades and investment in public and active transport is therefore a high priority.
The Transport Plan for Brisbane outlines how increased public transport use, walking and cycling can assist a program of targeted road investment to manage travel demand and reduce congestion on Brisbane's road network. The Plan introduces corridor planning, a process of developing multi-modal management plans for main arterial corridors and their local transport networks. From this planning, a rolling program of projects will be developed and budgeted for. A $100 million program of investment in provision of cycling and pedestrian infrastructure was completed in 2012 and an additional $120 million will be invested between 2013 and 2016.
Council's Road Action Program has upgraded a significant number of the city's highest priority road network links in recent years.
The TransApex vision is nearing completion with construction of Legacy W ay continuing. The Airport Link project as well as Clem7 and the Go-Between Bridge have been completed.
Brisbane is the centre of the fastest growing region in Australia. Record investment over recent years in public transport has resulted in more than 66% growth in combined bus and ferry patronage since 2003-04. This was achieved by: • an unprecedented program of acquisition of environmentally friendly air conditioned and wheelchair
accessible buses • acquiring additional CityCats, bringing the total fleet to 19 • the rollout of Bus Upgrade Zones (BUZ), the Blue CityGlider and the Maroon CityGlider.
Major initiatives in 2013-14 include: • delivering 90 new air conditioned and wheelchair accessible rigid equivalent buses to continue the
acquisition of new buses to ensure that Council's fleet is one of the most modern in Australia • completing and opening the Eagle Farm Bus Depot • continuing the Better Bikeways 4 Suburbs program to provide $120 million in new bikeway
infrastructure over four years to improve bikeway links and connections to Brisbane's top employment areas
• replacement of CityCats consistent with an appropriate asset management plan • continued funding of the new free CityHopper, Brisbane's first free inner city ferry service • roll out of a new ferry terminal in Milton • upgrading the Bulimba ferry terminal • upgrading existing terminals following the January 2011 flood • continuing operation of the Blue CityGlider and the Maroon CityGlider Bus Rapid Transit Routes • continuing the upgrade of Disability Discrimination Act (2002) bus stops and ferry terminals.
Program 2 – Moving Brisbane
- 54 -
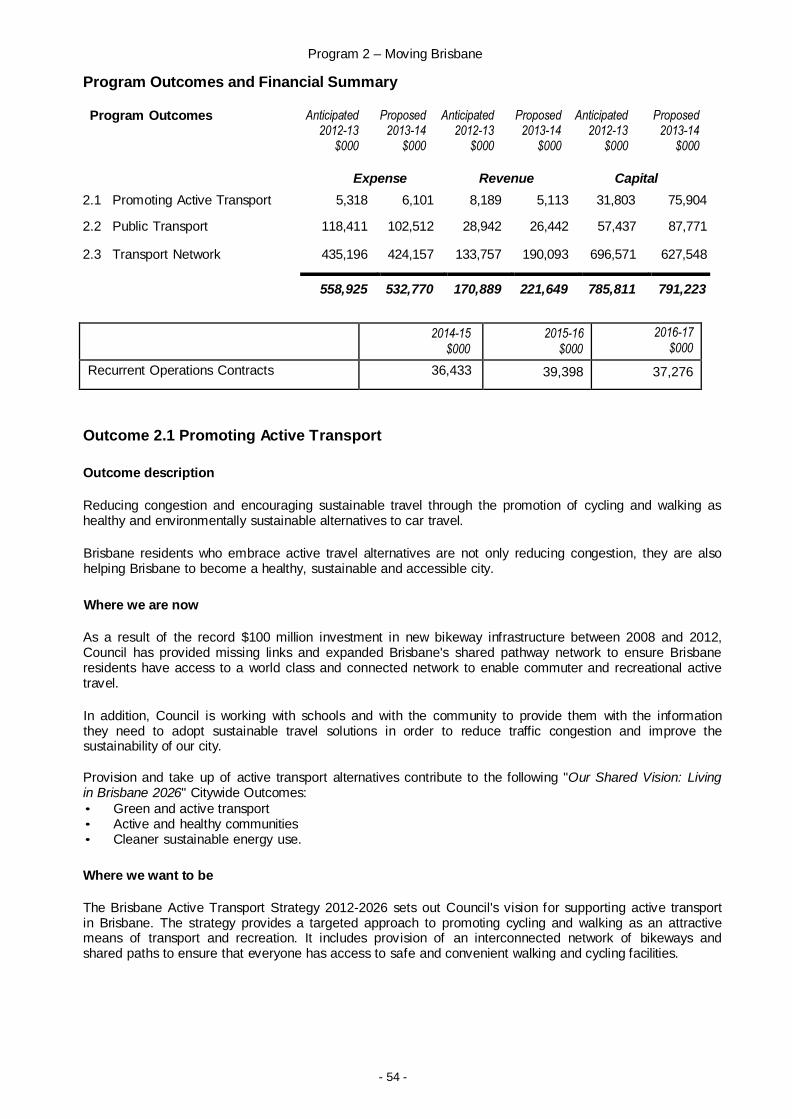
Program Outcomes and Financial Summary
Program Outcomes Anticipated Proposed Anticipated Proposed Anticipated Proposed 2012-13 2013-14 2012-13 2013-14 2012-13 2013-14 $000 $000 $000 $000 $000 $000
Expense Revenue Capital
2.1 Promoting Active Transport 5,318 6,101 8,189 5,113 31,803 75,904
2.2 Public Transport 118,411 102,512 28,942 26,442 57,437 87,771
2.3 Transport Network 435,196 424,157 133,757 190,093 696,571 627,548
558,925 532,770 170,889 221,649 785,811 791,223
2014-15 2015-16 2016-17
$000 $000 $000
Recurrent Operations Contracts 36,433 39,398 37,276
Outcome 2.1 Promoting Active Transport
Outcome description
Reducing congestion and encouraging sustainable travel through the promotion of cycling and walking as healthy and environmentally sustainable alternatives to car travel.
Brisbane residents who embrace active travel alternatives are not only reducing congestion, they are also helping Brisbane to become a healthy, sustainable and accessible city.
Where we are now
As a result of the record $100 million investment in new bikeway infrastructure between 2008 and 2012, Council has provided missing links and expanded Brisbane's shared pathway network to ensure Brisbane residents have access to a world class and connected network to enable commuter and recreational active travel.
In addition, Council is working with schools and with the community to provide them with the information they need to adopt sustainable travel solutions in order to reduce traffic congestion and improve the sustainability of our city.
Provision and take up of active transport alternatives contribute to the following "Our Shared Vision: Living in Brisbane 2026" Citywide Outcomes:
• Green and active transport • Active and healthy communities • Cleaner sustainable energy use.
Where we want to be
The Brisbane Active Transport Strategy 2012-2026 sets out Council's vision for supporting active transport in Brisbane. The strategy provides a targeted approach to promoting cycling and walking as an attractive means of transport and recreation. It includes provision of an interconnected network of bikeways and shared paths to ensure that everyone has access to safe and convenient walking and cycling facilities.
Program 2 – Moving Brisbane
- 55 -
Strategy 2.1.1 Promote Sustainable Transport
Encourage people to travel actively in order to reduce congestion and support a sustainable city.
Service 2.1.1.1 Promote Sustainable Travel Choices
This service will continue to promote the uptake of active travel and provide schools and the community with the information needed to change travel behaviours and help reduce traffic congestion.
The majority of family car trips to school are less than three kilometres. The Active School Travel Program (AST) encourages a shift towards walking, riding, public transport and car-pooling as ways for children to travel to and from school. The benefits are twofold. Firstly, the program relieves traffic congestion around schools making the road environment around schools safer for both commuters and students. Secondly, the program encourages healthier and more active school communities as well as increasing the amenity of neighbourhoods around schools.
In addition to the 20 schools participating in the Active School Travel program in 2013, the program will continue to support schools that have previously participated in the program by assisting them to embed active travel behaviour. In 2013-14, the AST program will be expanded to include secondary schools.
Both the Brisbane Active Transport Strategy and Brisbane Bikeway Network Plan were updated in 2011-12. The new Brisbane Active Transport Strategy 2012-2026 provides the strategic framework for encouraging increased community uptake of active transport options.
A new aspect is the Active Communities Program where improvements are being made in ten suburbs to make walking and cycling easier and safer. The focus is on improving access to schools, public transport, shops and community facilities.
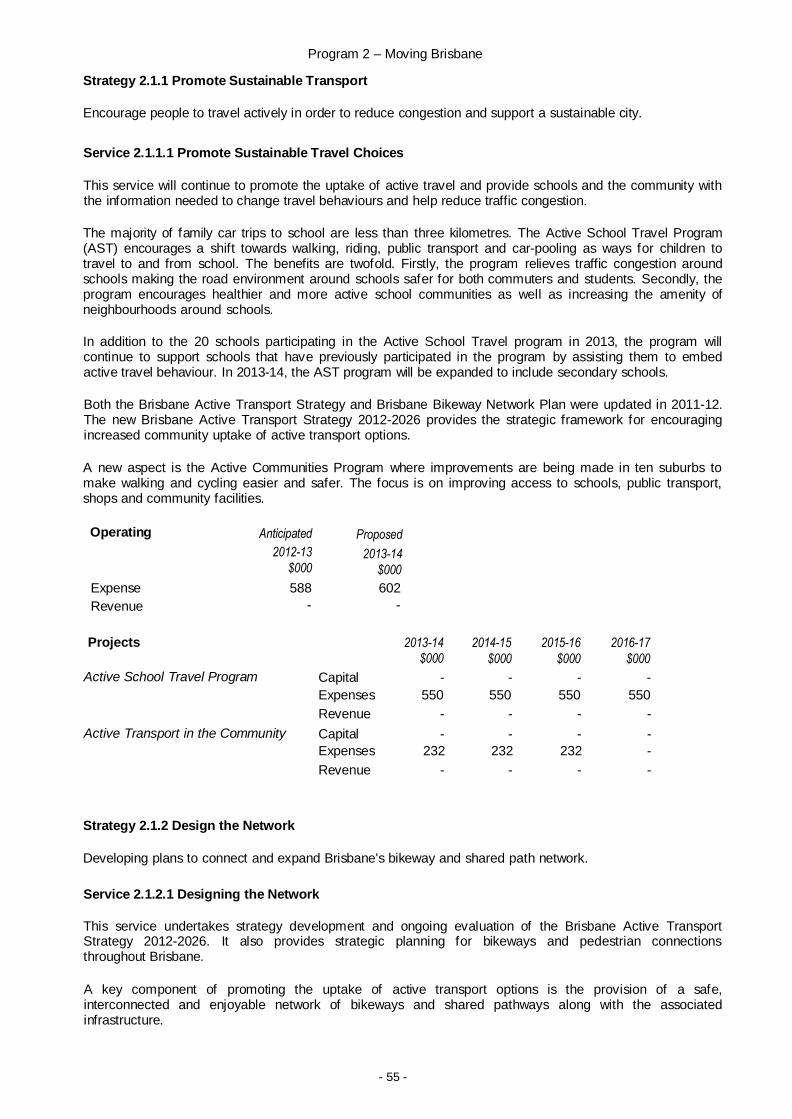
Operating Anticipated
2012-13
Proposed
2013-14 $000 $000
Expense 588 602
Revenue - -
Projects 2013-14 $000
2014-15
$000
2015-16
$000
2016-17
$000
Active School Travel Program Capital - - - -
Expenses 550 550 550 550
Revenue - - - -
Active Transport in the Community Capital
Expenses
-
232
-
232
-
232
-
-
Revenue - - - -
Strategy 2.1.2 Design the Network
Developing plans to connect and expand Brisbane's bikeway and shared path network.
Service 2.1.2.1 Designing the Network
This service undertakes strategy development and ongoing evaluation of the Brisbane Active Transport Strategy 2012-2026. It also provides strategic planning for bikeways and pedestrian connections throughout Brisbane.
A key component of promoting the uptake of active transport options is the provision of a safe, interconnected and enjoyable network of bikeways and shared pathways along with the associated infrastructure.
Program 2 – Moving Brisbane
- 56 -
Council will actively work with the State and Federal governments to ensure a collaborative approach to the planning and provision of new bikeway facilities.
As the commitment to delivering $100 million in new bikeway infrastructure has completed, Council is now investing $120 million, across the Council term, to link the commuter cycling network to service Brisbane's top employment areas, and local suburban bikeway improvements including lighting, signage, bicycle racks, mid-trip facilities and safety improvements.
Operating Anticipated
2012-13
Proposed
2013-14 $000 $000
Expense 463 475
Revenue - -
Strategy 2.1.3 Provide Cycling Infrastructure
Building a connected, expanded and safe bikeway network for Brisbane.
Service 2.1.3.1 Providing Cycling Infrastructure
Delivery of the $120 million Better Bikeways 4 Brisbane program is underway. Over the next three years, Council will create a commuter network of bikeways servicing Brisbane's top employment areas in conjunction with a focus on improving bikeways linking to suburban shopping strips, schools and public transport hubs.
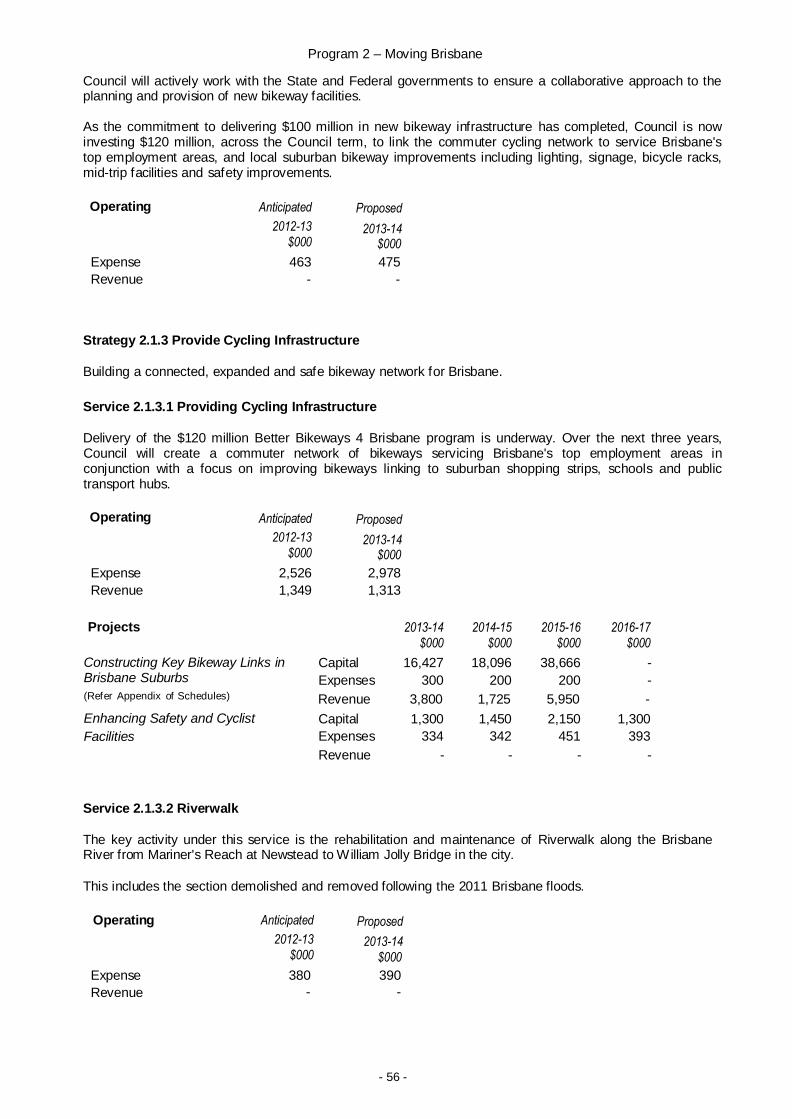
Operating Anticipated
2012-13
Proposed
2013-14 $000 $000
Expense 2,526 2,978
Revenue 1,349 1,313
Projects 2013-14 $000
2014-15 $000
2015-16 $000
2016-17 $000
Constructing Key Bikeway Links in Capital 16,427 18,096 38,666 - Brisbane Suburbs Expenses 300 200 200 - (Refer Appendix of Schedules) Revenue 3,800 1,725 5,950 -
Enhancing Safety and Cyclist Capital 1,300 1,450 2,150 1,300
Facilities Expenses 334 342 451 393
Revenue - - - -
Service 2.1.3.2 Riverwalk
The key activity under this service is the rehabilitation and maintenance of Riverwalk along the Brisbane River from Mariner's Reach at Newstead to W illiam Jolly Bridge in the city.
This includes the section demolished and removed following the 2011 Brisbane floods.
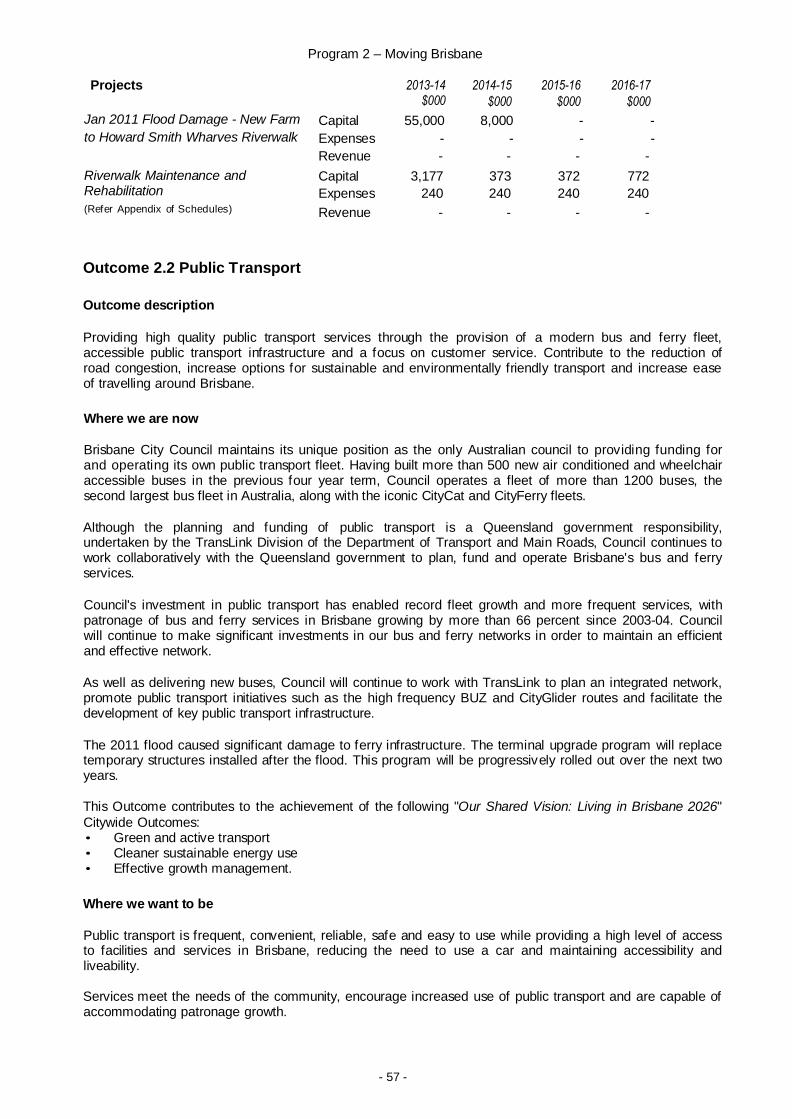
Operating Anticipated Proposed
2012-13 2013-14 $000 $000
Expense 380 390
Revenue - -
Program 2 – Moving Brisbane
- 57 -
Projects 2013-14 2014-15 2015-16 2016-17 $000 $000 $000 $000
Jan 2011 Flood Damage - New Farm Capital 55,000 8,000 - -
to Howard Smith Wharves Riverwalk Expenses - - - -
Revenue - - - -
Riverwalk Maintenance and Capital 3,177 373 372 772 Rehabilitation Expenses 240 240 240 240 (Refer Appendix of Schedules) Revenue - - - -
Outcome 2.2 Public Transport
Outcome description
Providing high quality public transport services through the provision of a modern bus and ferry fleet, accessible public transport infrastructure and a focus on customer service. Contribute to the reduction of road congestion, increase options for sustainable and environmentally friendly transport and increase ease of travelling around Brisbane.
Where we are now
Brisbane City Council maintains its unique position as the only Australian council to providing funding for and operating its own public transport fleet. Having built more than 500 new air conditioned and wheelchair accessible buses in the previous four year term, Council operates a fleet of more than 1200 buses, the second largest bus fleet in Australia, along with the iconic CityCat and CityFerry fleets.
Although the planning and funding of public transport is a Queensland government responsibility, undertaken by the TransLink Division of the Department of Transport and Main Roads, Council continues to work collaboratively with the Queensland government to plan, fund and operate Brisbane's bus and ferry services.
Council's investment in public transport has enabled record fleet growth and more frequent services, with patronage of bus and ferry services in Brisbane growing by more than 66 percent since 2003-04. Council will continue to make significant investments in our bus and ferry networks in order to maintain an efficient and effective network.
As well as delivering new buses, Council will continue to work with TransLink to plan an integrated network, promote public transport initiatives such as the high frequency BUZ and CityGlider routes and facilitate the development of key public transport infrastructure.
The 2011 flood caused significant damage to ferry infrastructure. The terminal upgrade program will replace temporary structures installed after the flood. This program will be progressively rolled out over the next two years.
This Outcome contributes to the achievement of the following "Our Shared Vision: Living in Brisbane 2026"
Citywide Outcomes: • Green and active transport • Cleaner sustainable energy use • Effective growth management.
Where we want to be
Public transport is frequent, convenient, reliable, safe and easy to use while providing a high level of access to facilities and services in Brisbane, reducing the need to use a car and maintaining accessibility and liveability.
Services meet the needs of the community, encourage increased use of public transport and are capable of accommodating patronage growth.
Program 2 – Moving Brisbane
- 58 -
Council is committed to upgrading the city's bus and ferry network to provide improved access for people with disabilities. All future upgrades and delivery of new public transport assets are to comply with or exceed the minimum requirements for public transport in the Disability Discrimination Act 1992 (DDA), Disability Standards for Accessible Transport (DSAPT) 2002 and the Disability Standards 2010 (Premises Standards).
Strategy 2.2.1 Providing a High Quality Ferry Service
Providing river travel along the Brisbane River including the iconic CityCat service and Brisbane's first free inner city ferry service, the CityHopper. The CityHopper is designed to make Brisbane a tourist friendly destination and complements the free City Loop service.
Council's passenger ferries are a city icon. They provide an enjoyable and unique service for commuter, tourist and recreational travel. They assist in reducing car travel and congestion and are an important part of the city's public transport network.
The CityCat fleet has grown from eight vessels when the service commenced in 1996 to 19 vessels, with the commencement of the Spirit of Brisbane in service in 2011. Funding has been allocated for two additional CityCat vessels to be delivered over the next three years in recognition that as the oldest vessels in the CityCat fleet reach retirement age an appropriate asset disposal program will be implemented.
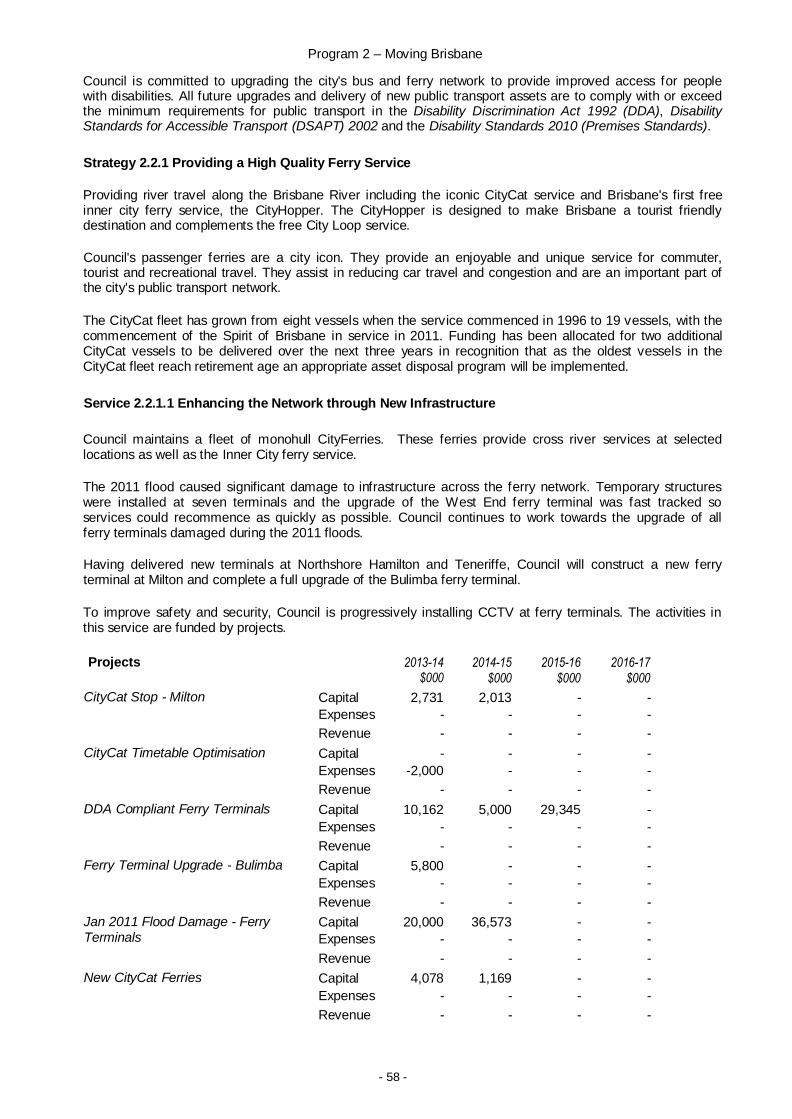
Service 2.2.1.1 Enhancing the Network through New Infrastructure
Council maintains a fleet of monohull CityFerries. These ferries provide cross river services at selected locations as well as the Inner City ferry service.
The 2011 flood caused significant damage to infrastructure across the ferry network. Temporary structures were installed at seven terminals and the upgrade of the West End ferry terminal was fast tracked so services could recommence as quickly as possible. Council continues to work towards the upgrade of all ferry terminals damaged during the 2011 floods.
Having delivered new terminals at Northshore Hamilton and Teneriffe, Council will construct a new ferry terminal at Milton and complete a full upgrade of the Bulimba ferry terminal.
To improve safety and security, Council is progressively installing CCTV at ferry terminals. The activities in this service are funded by projects.
Projects 2013-14 $000
2014-15 $000
2015-16 $000
2016-17 $000
CityCat Stop - Milton Capital 2,731 2,013 - -
Expenses - - - -
Revenue - - - -
CityCat Timetable Optimisation Capital - - - -
Expenses -2,000 - - -
Revenue - - - -
DDA Compliant Ferry Terminals Capital 10,162 5,000 29,345 -
Expenses - - - -
Revenue - - - -
Ferry Terminal Upgrade - Bulimba Capital 5,800 - - -
Expenses - - - -
Revenue - - - -
Jan 2011 Flood Damage - Ferry Capital 20,000 36,573 - - Terminals Expenses - - - -
Revenue - - - -
New CityCat Ferries Capital 4,078 1,169 - -
Expenses - - - -
Revenue - - - -
Program 2 – Moving Brisbane
- 59 -
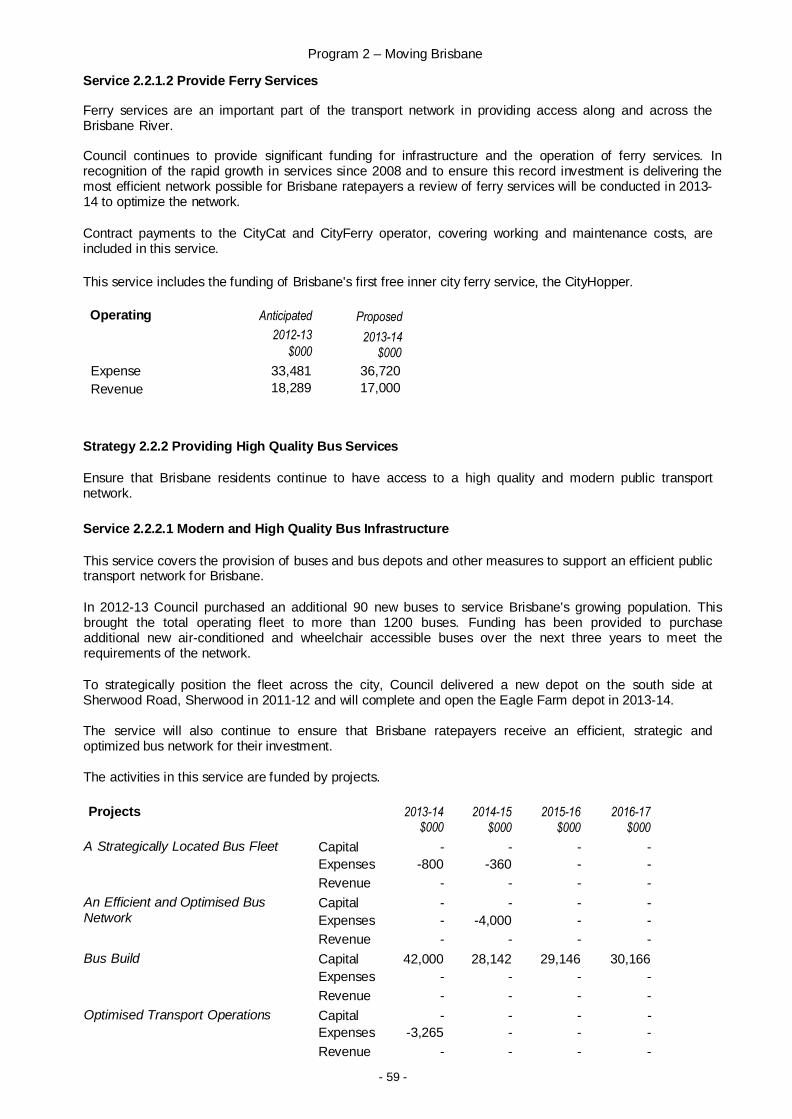
Service 2.2.1.2 Provide Ferry Services
Ferry services are an important part of the transport network in providing access along and across the Brisbane River.
Council continues to provide significant funding for infrastructure and the operation of ferry services. In recognition of the rapid growth in services since 2008 and to ensure this record investment is delivering the most efficient network possible for Brisbane ratepayers a review of ferry services will be conducted in 2013- 14 to optimize the network.
Contract payments to the CityCat and CityFerry operator, covering working and maintenance costs, are included in this service.
This service includes the funding of Brisbane's first free inner city ferry service, the CityHopper.
Operating Anticipated
2012-13
Proposed
2013-14 $000 $000
Expense 33,481 36,720
Revenue 18,289 17,000
Strategy 2.2.2 Providing High Quality Bus Services
Ensure that Brisbane residents continue to have access to a high quality and modern public transport network.
Service 2.2.2.1 Modern and High Quality Bus Infrastructure
This service covers the provision of buses and bus depots and other measures to support an efficient public transport network for Brisbane.
In 2012-13 Council purchased an additional 90 new buses to service Brisbane's growing population. This brought the total operating fleet to more than 1200 buses. Funding has been provided to purchase additional new air-conditioned and wheelchair accessible buses over the next three years to meet the requirements of the network.
To strategically position the fleet across the city, Council delivered a new depot on the south side at Sherwood Road, Sherwood in 2011-12 and will complete and open the Eagle Farm depot in 2013-14.
The service will also continue to ensure that Brisbane ratepayers receive an efficient, strategic and optimized bus network for their investment.
The activities in this service are funded by projects.
Projects 2013-14 $000
2014-15 $000
2015-16 $000
2016-17 $000
A Strategically Located Bus Fleet Capital - - - -
Expenses -800 -360 - -
Revenue - - - -
An Efficient and Optimised Bus Capital - - - - Network Expenses - -4,000 - -
Revenue - - - -
Bus Build Capital 42,000 28,142 29,146 30,166
Expenses - - - -
Revenue - - - -
Optimised Transport Operations Capital - - - -
Expenses -3,265 - - -
Revenue - - - -
Program 2 – Moving Brisbane
- 60 -
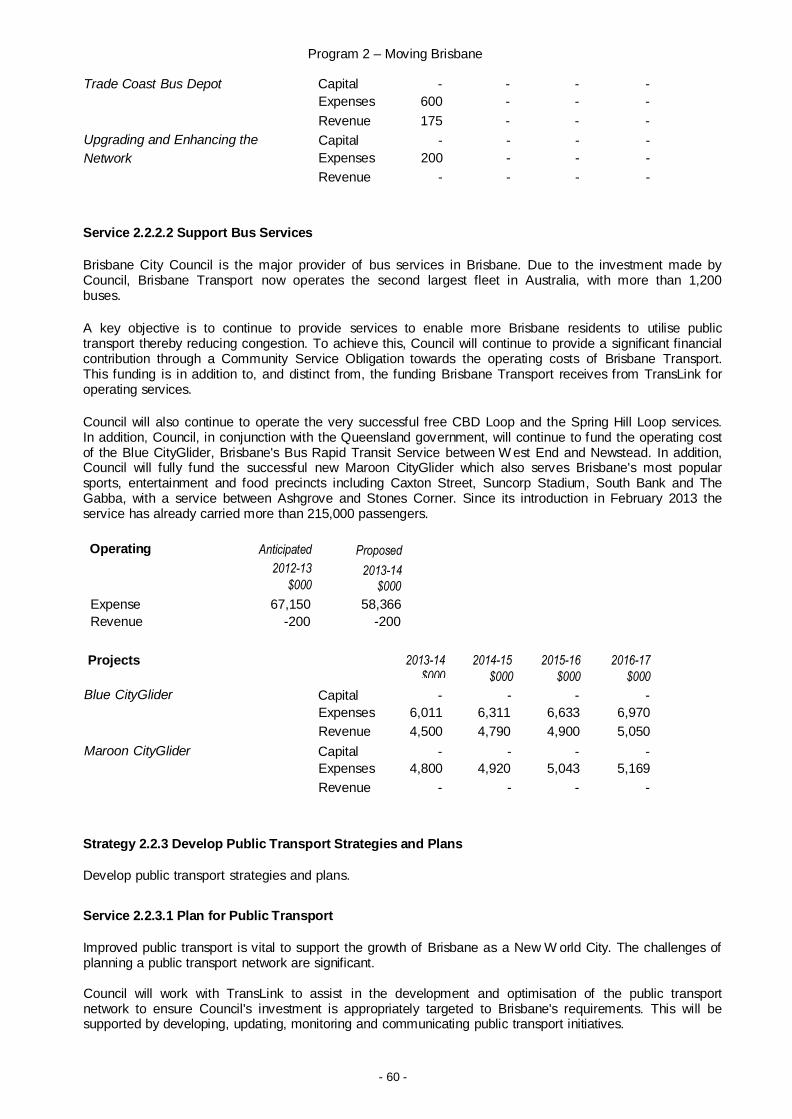
Trade Coast Bus Depot Capital
Expenses
-
600
-
-
-
-
-
-
Revenue 175 - - -
Upgrading and Enhancing the
Network
Capital
Expenses
-
200
-
-
-
-
-
-
Revenue - - - -
Service 2.2.2.2 Support Bus Services
Brisbane City Council is the major provider of bus services in Brisbane. Due to the investment made by Council, Brisbane Transport now operates the second largest fleet in Australia, with more than 1,200 buses.
A key objective is to continue to provide services to enable more Brisbane residents to utilise public transport thereby reducing congestion. To achieve this, Council will continue to provide a significant financial contribution through a Community Service Obligation towards the operating costs of Brisbane Transport. This funding is in addition to, and distinct from, the funding Brisbane Transport receives from TransLink for operating services.
Council will also continue to operate the very successful free CBD Loop and the Spring Hill Loop services. In addition, Council, in conjunction with the Queensland government, will continue to fund the operating cost of the Blue CityGlider, Brisbane's Bus Rapid Transit Service between W est End and Newstead. In addition, Council will fully fund the successful new Maroon CityGlider which also serves Brisbane's most popular sports, entertainment and food precincts including Caxton Street, Suncorp Stadium, South Bank and The Gabba, with a service between Ashgrove and Stones Corner. Since its introduction in February 2013 the service has already carried more than 215,000 passengers.
Operating Anticipated
2012-13
Proposed
2013-14 $000 $000
Expense 67,150 58,366
Revenue -200 -200
Projects 2013-14 2014-15 2015-16 2016-17
$000 $000 $000 $000
Blue CityGlider Capital
Expenses
-
6,011
-
6,311
-
6,633
-
6,970
Revenue 4,500 4,790 4,900 5,050 Maroon CityGlider Capital - - - -
Expenses 4,800 4,920 5,043 5,169 Revenue - - - -
Strategy 2.2.3 Develop Public Transport Strategies and Plans
Develop public transport strategies and plans.
Service 2.2.3.1 Plan for Public Transport
Improved public transport is vital to support the growth of Brisbane as a New W orld City. The challenges of planning a public transport network are significant.
Council will work with TransLink to assist in the development and optimisation of the public transport network to ensure Council's investment is appropriately targeted to Brisbane's requirements. This will be supported by developing, updating, monitoring and communicating public transport initiatives.
Program 2 – Moving Brisbane
- 61 -
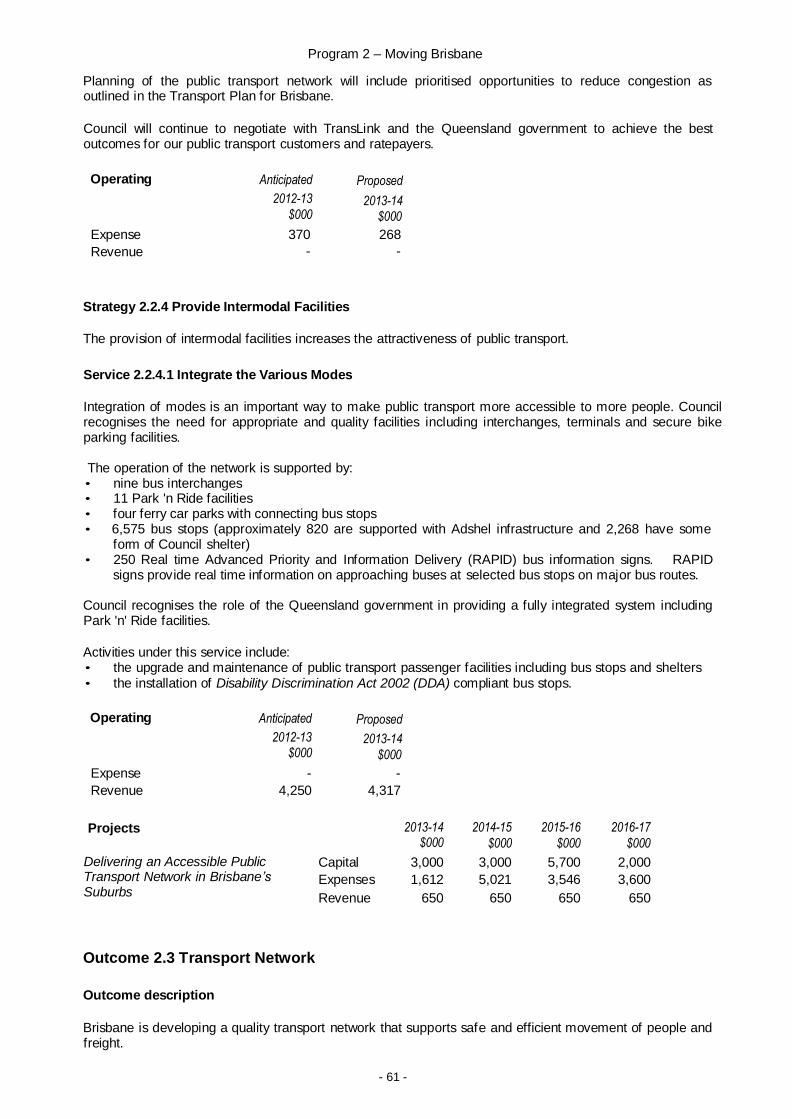
Planning of the public transport network will include prioritised opportunities to reduce congestion as outlined in the Transport Plan for Brisbane.
Council will continue to negotiate with TransLink and the Queensland government to achieve the best outcomes for our public transport customers and ratepayers.
Operating Anticipated
2012-13
Proposed
2013-14 $000 $000
Expense 370 268
Revenue - -
Strategy 2.2.4 Provide Intermodal Facilities
The provision of intermodal facilities increases the attractiveness of public transport.
Service 2.2.4.1 Integrate the Various Modes
Integration of modes is an important way to make public transport more accessible to more people. Council recognises the need for appropriate and quality facilities including interchanges, terminals and secure bike parking facilities.
The operation of the network is supported by: • nine bus interchanges • 11 Park 'n Ride facilities • four ferry car parks with connecting bus stops • 6,575 bus stops (approximately 820 are supported with Adshel infrastructure and 2,268 have some
form of Council shelter) • 250 Real time Advanced Priority and Information Delivery (RAPID) bus information signs. RAPID
signs provide real time information on approaching buses at selected bus stops on major bus routes.
Council recognises the role of the Queensland government in providing a fully integrated system including Park 'n' Ride facilities.
Activities under this service include: • the upgrade and maintenance of public transport passenger facilities including bus stops and shelters • the installation of Disability Discrimination Act 2002 (DDA) compliant bus stops.
Operating Anticipated
2012-13
Proposed
2013-14 $000 $000
Expense - -
Revenue 4,250 4,317
Projects 2013-14 2014-15 2015-16 2016-17
$000 $000 $000 $000
Delivering an Accessible Public Capital 3,000 3,000 5,700 2,000
Transport Network in Brisbane’s Suburbs
Expenses
Revenue
1,612
650
5,021
650
3,546
650
3,600
650
Outcome 2.3 Transport Network
Outcome description
Brisbane is developing a quality transport network that supports safe and efficient movement of people and freight.
Program 2 – Moving Brisbane
- 62 -
Where we are now
Brisbane's transport network is extensive and Council is responsible for the vast majority of this network. Council controls more than 5,600 kilometres of road within the Brisbane Local Government Area, while the Queensland government controls just 170 kilometres of road.
This presents a unique funding challenge for our city. W hile the Federal and State governments collect a range of taxes and charges from Brisbane motorists, including fuel excise and GST on fuel and motor vehicle registration, this revenue does not flow to Brisbane City Council for the specific purpose of maintaining and upgrading our city's road network. This means that costly road and transport network improvements within Brisbane must ultimately be funded from general rates revenue or alternative financing arrangements.
Furthermore, as a capital city with a growing economy, Brisbane's road and transport network is used daily by residents of other local government areas who do not contribute financially to the cost of maintaining and upgrading the network.
This growth means the current transport system is under increasing pressure. The community has concerns about levels of congestion on the network and the impacts of future population on traffic growth. Failure to invest in the road network has severe economic and accessibility impacts.
Where we want to be
Continued investment in Brisbane's road and transport network is made through cooperation and partnerships, both with other levels of government and the private sector, to ensure that our city's key infrastructure meets future challenges.
The road network provides for safe and efficient movement of people and goods on the road network by the most appropriate modes and routes. The network has sufficient capacity to cope with the transport demands of the city, provides access to destinations and enhances the liveability of the city. The network is well managed and quickly adapts to traffic incidents. This keeps Brisbane moving. Projects and services are highly integrated and deliver best value for the city.
This outcome contributes to the "Our Shared Vision: Living in Brisbane 2026" Citywide Outcome 'Effective
Road Network' and delivers Corporate Plan objectives. Strategy 2.3.1 Plan and Design the Network
Plan and design the transport network using principles of transport planning and asset and financial management.
Service 2.3.1.1 Plan and Design the Network
The objective of this service is to plan and design a quality transport network using principles of transport planning as well as asset and financial management.
In delivering a quality transport network, the key activities under this service include: • monitoring and communicating the updated Transport Plan • integrated transport network planning and development • prioritisation and detailed planning and design of transport projects • developing corridor plans for designated transport corridors • integrating major developments and transport projects into the wider transport network.
Planning and design of the city's transport network will also include consideration of land use, economic, environmental and community lifestyle issues. The program will also integrate Brisbane's transport network with state and federal transport networks.
Program 2 – Moving Brisbane
- 63 -
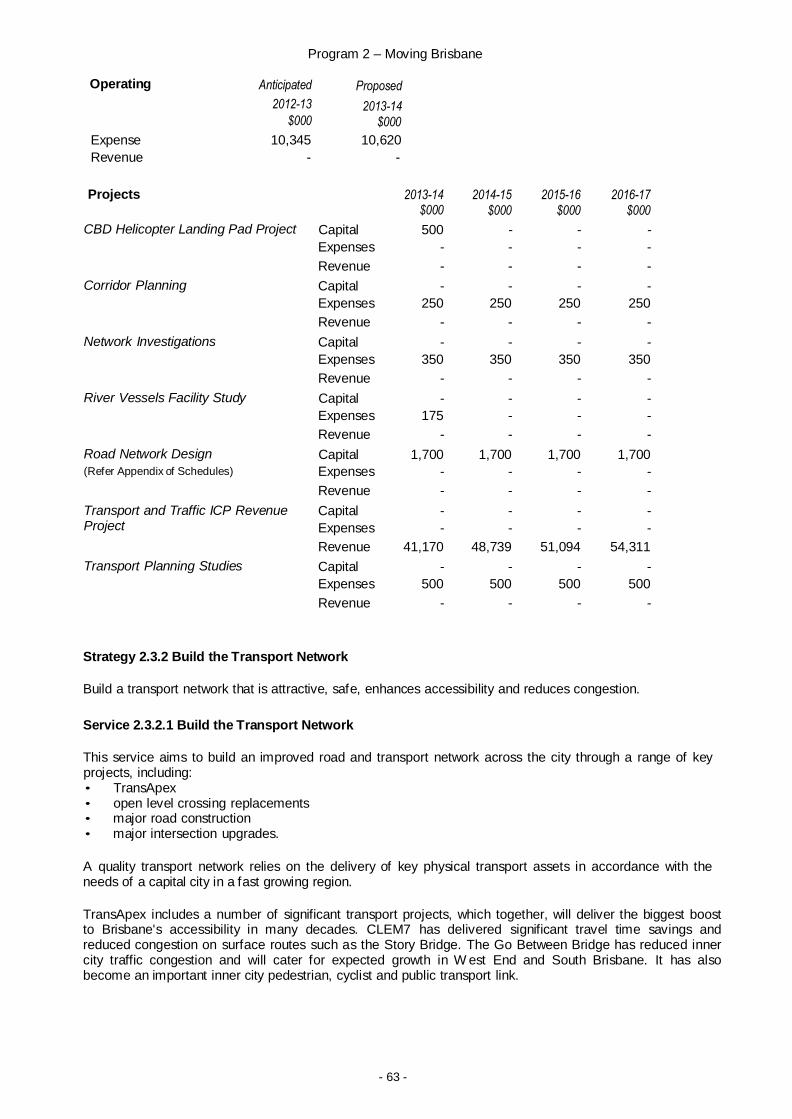
Operating Anticipated
2012-13
Proposed
2013-14 $000 $000
Expense 10,345 10,620
Revenue - -
Projects 2013-14 $000
2014-15 $000
2015-16 $000
2016-17 $000
CBD Helicopter Landing Pad Project Capital 500 - - -
Expenses - - - -
Revenue - - - -
Corridor Planning Capital - - - -
Expenses 250 250 250 250
Revenue - - - -
Network Investigations Capital - - - -
Expenses 350 350 350 350
Revenue - - - -
River Vessels Facility Study Capital - - - -
Expenses 175 - - -
Revenue - - - -
Road Network Design Capital 1,700 1,700 1,700 1,700
(Refer Appendix of Schedules) Expenses - - - -
Revenue - - - -
Transport and Traffic ICP Revenue Capital - - - - Project Expenses - - - -
Revenue 41,170 48,739 51,094 54,311
Transport Planning Studies Capital - - - -
Expenses 500 500 500 500
Revenue - - - -
Strategy 2.3.2 Build the Transport Network
Build a transport network that is attractive, safe, enhances accessibility and reduces congestion.
Service 2.3.2.1 Build the Transport Network
This service aims to build an improved road and transport network across the city through a range of key projects, including: • TransApex • open level crossing replacements • major road construction • major intersection upgrades.
A quality transport network relies on the delivery of key physical transport assets in accordance with the needs of a capital city in a fast growing region.
TransApex includes a number of significant transport projects, which together, will deliver the biggest boost to Brisbane's accessibility in many decades. CLEM7 has delivered significant travel time savings and reduced congestion on surface routes such as the Story Bridge. The Go Between Bridge has reduced inner city traffic congestion and will cater for expected growth in W est End and South Brisbane. It has also become an important inner city pedestrian, cyclist and public transport link.
Program 2 – Moving Brisbane
- 64 -
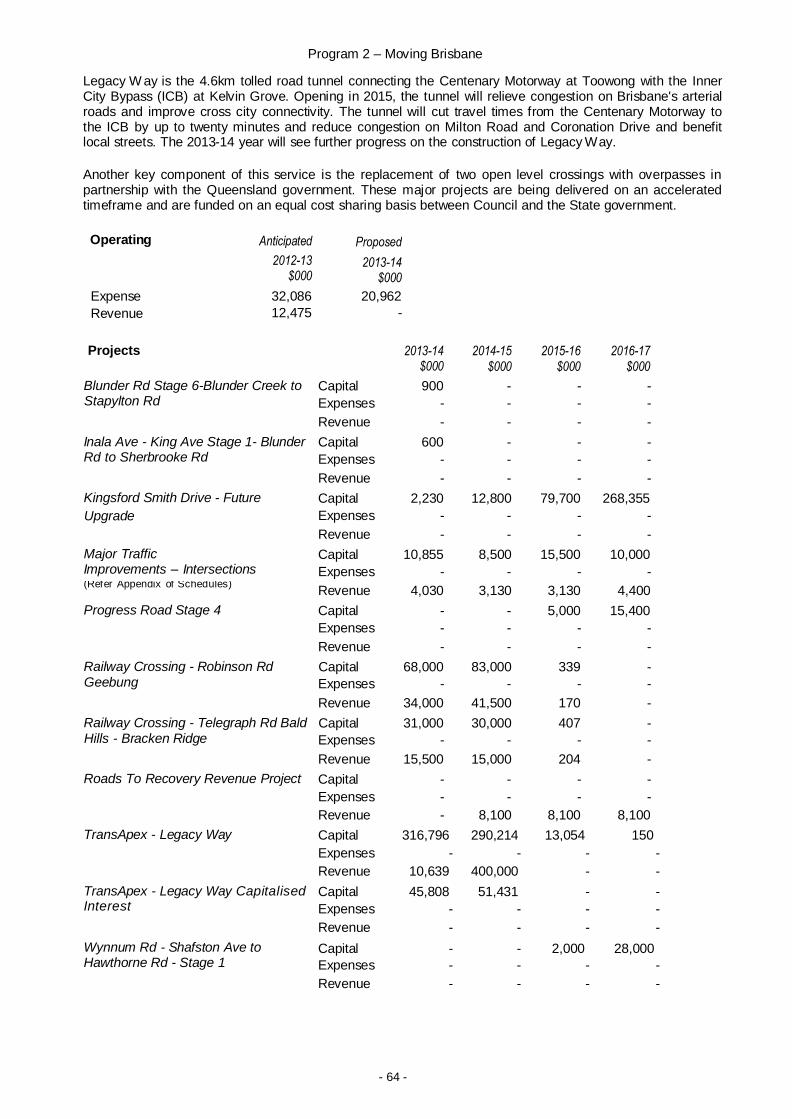
Legacy W ay is the 4.6km tolled road tunnel connecting the Centenary Motorway at Toowong with the Inner City Bypass (ICB) at Kelvin Grove. Opening in 2015, the tunnel will relieve congestion on Brisbane's arterial roads and improve cross city connectivity. The tunnel will cut travel times from the Centenary Motorway to the ICB by up to twenty minutes and reduce congestion on Milton Road and Coronation Drive and benefit local streets. The 2013-14 year will see further progress on the construction of Legacy W ay.
Another key component of this service is the replacement of two open level crossings with overpasses in partnership with the Queensland government. These major projects are being delivered on an accelerated timeframe and are funded on an equal cost sharing basis between Council and the State government.
Operating Anticipated
Proposed
2012-13 $000
2013-14 $000
Expense 32,086 20,962 Revenue 12,475 -
Projects 2013-14 $000
2014-15 $000
2015-16 $000
2016-17 $000
Blunder Rd Stage 6-Blunder Creek to Capital 900 - - - Stapylton Rd Expenses - - - -
Revenue - - - -
Inala Ave - King Ave Stage 1- Blunder Capital 600 - - - Rd to Sherbrooke Rd Expenses - - - -
Revenue - - - -
Kingsford Smith Drive - Future Capital 2,230 12,800 79,700 268,355
Upgrade Expenses - - - -
Revenue - - - -
Major Traffic Capital 10,855 8,500 15,500 10,000 Improvements – Intersections Expenses - - - - (Refer Appendix of Schedules)
Revenue 4,030 3,130 3,130 4,400
Progress Road Stage 4 Capital - - 5,000 15,400
Expenses - - - -
Revenue - - - -
Railway Crossing - Robinson Rd Capital 68,000 83,000 339 - Geebung Expenses - - - -
Revenue 34,000 41,500 170 -
Railway Crossing - Telegraph Rd Bald Capital 31,000 30,000 407 - Hills - Bracken Ridge Expenses - - - -
Revenue 15,500 15,000 204 -
Roads To Recovery Revenue Project Capital - - - -
Expenses - - - -
Revenue - 8,100 8,100 8,100
TransApex - Legacy Way Capital 316,796 290,214 13,054 150
Expenses - - - -
Revenue 10,639 400,000 - -
TransApex - Legacy Way Capitalised Capital 45,808 51,431 - - Interest Expenses - - - -
Revenue - - - -
Wynnum Rd - Shafston Ave to Capital - - 2,000 28,000 Hawthorne Rd - Stage 1 Expenses - - - -
Revenue - - - -
Program 2 – Moving Brisbane
- 65 -
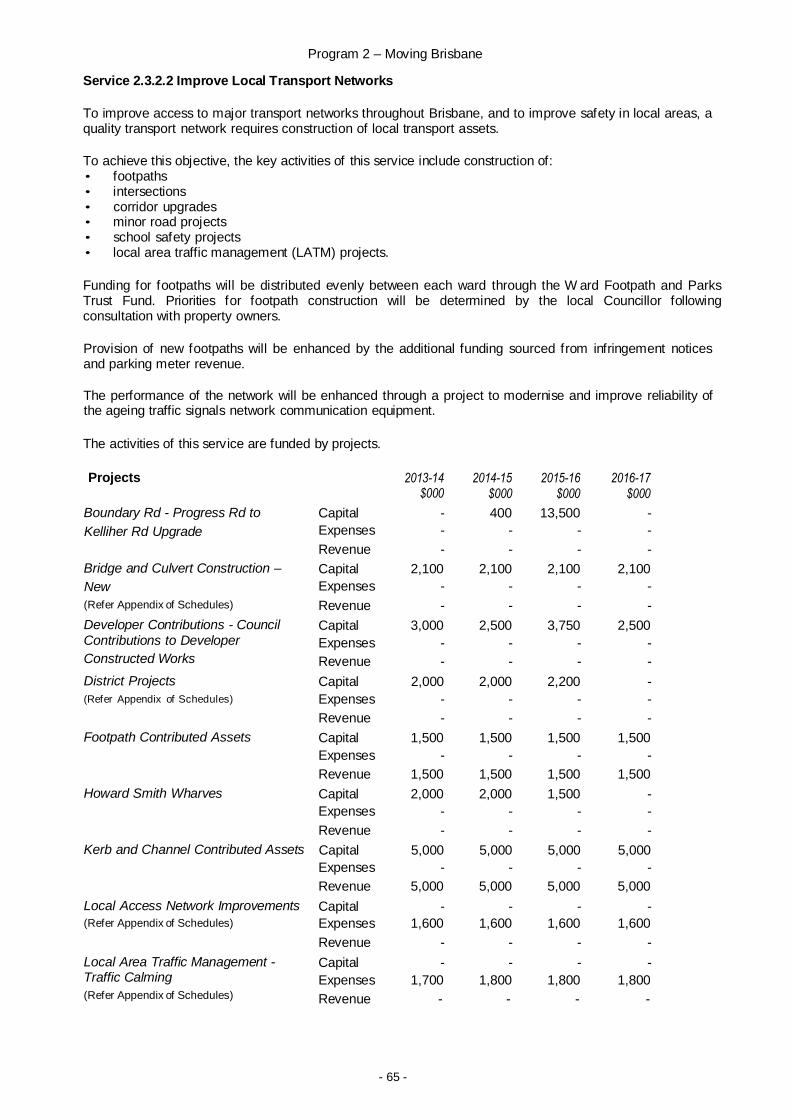
Service 2.3.2.2 Improve Local Transport Networks
To improve access to major transport networks throughout Brisbane, and to improve safety in local areas, a quality transport network requires construction of local transport assets.
To achieve this objective, the key activities of this service include construction of: • footpaths • intersections • corridor upgrades • minor road projects • school safety projects • local area traffic management (LATM) projects.
Funding for footpaths will be distributed evenly between each ward through the W ard Footpath and Parks Trust Fund. Priorities for footpath construction will be determined by the local Councillor following consultation with property owners.
Provision of new footpaths will be enhanced by the additional funding sourced from infringement notices and parking meter revenue.
The performance of the network will be enhanced through a project to modernise and improve reliability of the ageing traffic signals network communication equipment.
The activities of this service are funded by projects.
Projects 2013-14 $000
2014-15 $000
2015-16 $000
2016-17 $000
Boundary Rd - Progress Rd to Capital - 400 13,500 -
Kelliher Rd Upgrade Expenses - - - -
Revenue - - - -
Bridge and Culvert Construction – Capital 2,100 2,100 2,100 2,100
New Expenses - - - -
(Refer Appendix of Schedules) Revenue - - - -
Developer Contributions - Council Contributions to Developer
Constructed Works
Capital
Expenses
Revenue
3,000
-
-
2,500
-
-
3,750
-
-
2,500
-
-
District Projects Capital 2,000 2,000 2,200 -
(Refer Appendix of Schedules) Expenses - - - -
Revenue - - - -
Footpath Contributed Assets Capital 1,500 1,500 1,500 1,500
Expenses - - - -
Revenue 1,500 1,500 1,500 1,500
Howard Smith Wharves Capital 2,000 2,000 1,500 -
Expenses - - - -
Revenue - - - -
Kerb and Channel Contributed Assets Capital 5,000 5,000 5,000 5,000
Expenses - - - -
Revenue 5,000 5,000 5,000 5,000
Local Access Network Improvements Capital - - - -
(Refer Appendix of Schedules) Expenses 1,600 1,600 1,600 1,600
Revenue - - - -
Local Area Traffic Management - Traffic Calming
(Refer Appendix of Schedules)
Capital
Expenses
Revenue
-
1,700
-
-
1,800
-
-
1,800
-
-
1,800
-
Program 2 – Moving Brisbane
- 66 -
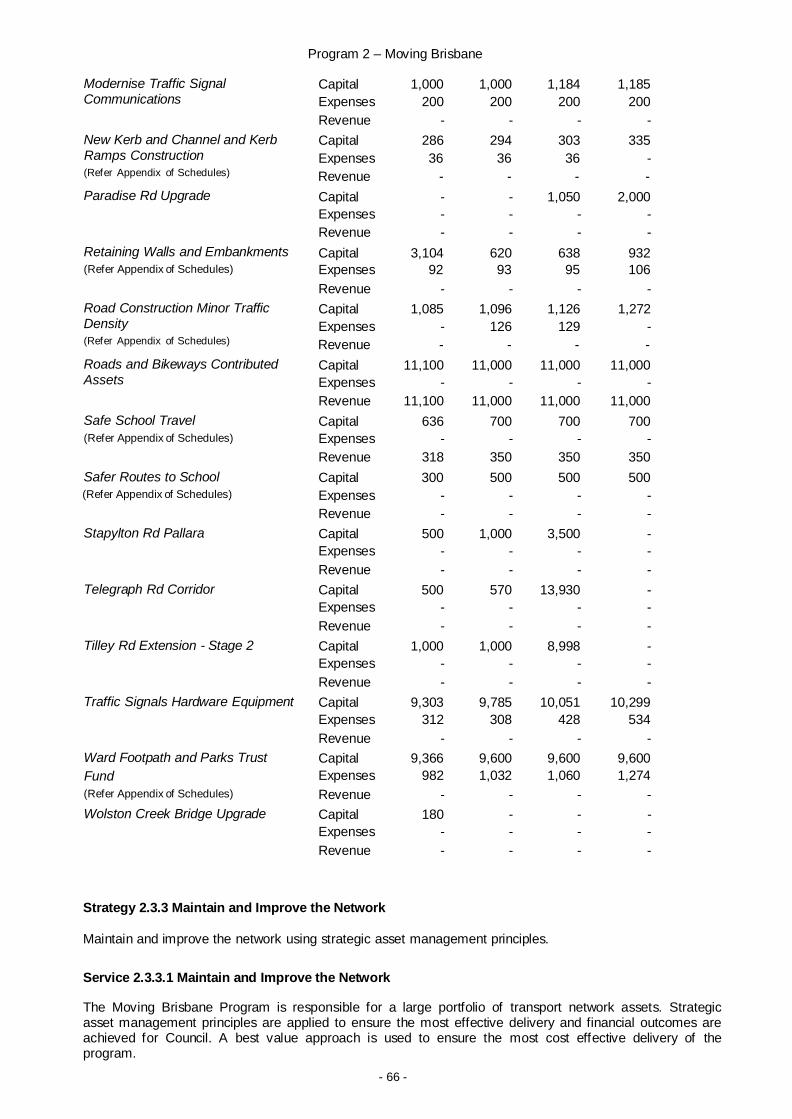
Modernise Traffic Signal Capital 1,000 1,000 1,184 1,185 Communications Expenses 200 200 200 200
Revenue - - - -
New Kerb and Channel and Kerb Capital 286 294 303 335 Ramps Construction Expenses 36 36 36 - (Refer Appendix of Schedules) Revenue - - - -
Paradise Rd Upgrade Capital - - 1,050 2,000
Expenses - - - -
Revenue - - - -
Retaining Walls and Embankments Capital 3,104 620 638 932 (Refer Appendix of Schedules) Expenses 92 93 95 106
Revenue - - - -
Road Construction Minor Traffic Capital 1,085 1,096 1,126 1,272 Density Expenses - 126 129 - (Refer Appendix of Schedules) Revenue - - - -
Roads and Bikeways Contributed Capital 11,100 11,000 11,000 11,000 Assets Expenses - - - -
Revenue 11,100 11,000 11,000 11,000
Safe School Travel Capital 636 700 700 700
(Refer Appendix of Schedules) Expenses - - - -
Revenue 318 350 350 350
Safer Routes to School Capital 300 500 500 500
(Refer Appendix of Schedules) Expenses - - - -
Revenue - - - -
Stapylton Rd Pallara Capital 500 1,000 3,500 -
Expenses - - - -
Revenue - - - -
Telegraph Rd Corridor Capital 500 570 13,930 -
Expenses - - - -
Revenue - - - -
Tilley Rd Extension - Stage 2 Capital 1,000 1,000 8,998 -
Expenses - - - -
Revenue - - - -
Traffic Signals Hardware Equipment Capital 9,303 9,785 10,051 10,299
Expenses 312 308 428 534
Revenue - - - -
Ward Footpath and Parks Trust Capital 9,366 9,600 9,600 9,600
Fund Expenses 982 1,032 1,060 1,274
(Refer Appendix of Schedules) Revenue - - - -
Wolston Creek Bridge Upgrade Capital 180 - - -
Expenses - - - -
Revenue - - - -
Strategy 2.3.3 Maintain and Improve the Network
Maintain and improve the network using strategic asset management principles.
Service 2.3.3.1 Maintain and Improve the Network
The Moving Brisbane Program is responsible for a large portfolio of transport network assets. Strategic asset management principles are applied to ensure the most effective delivery and financial outcomes are achieved for Council. A best value approach is used to ensure the most cost effective delivery of the program.
Program 2 – Moving Brisbane
- 67 -
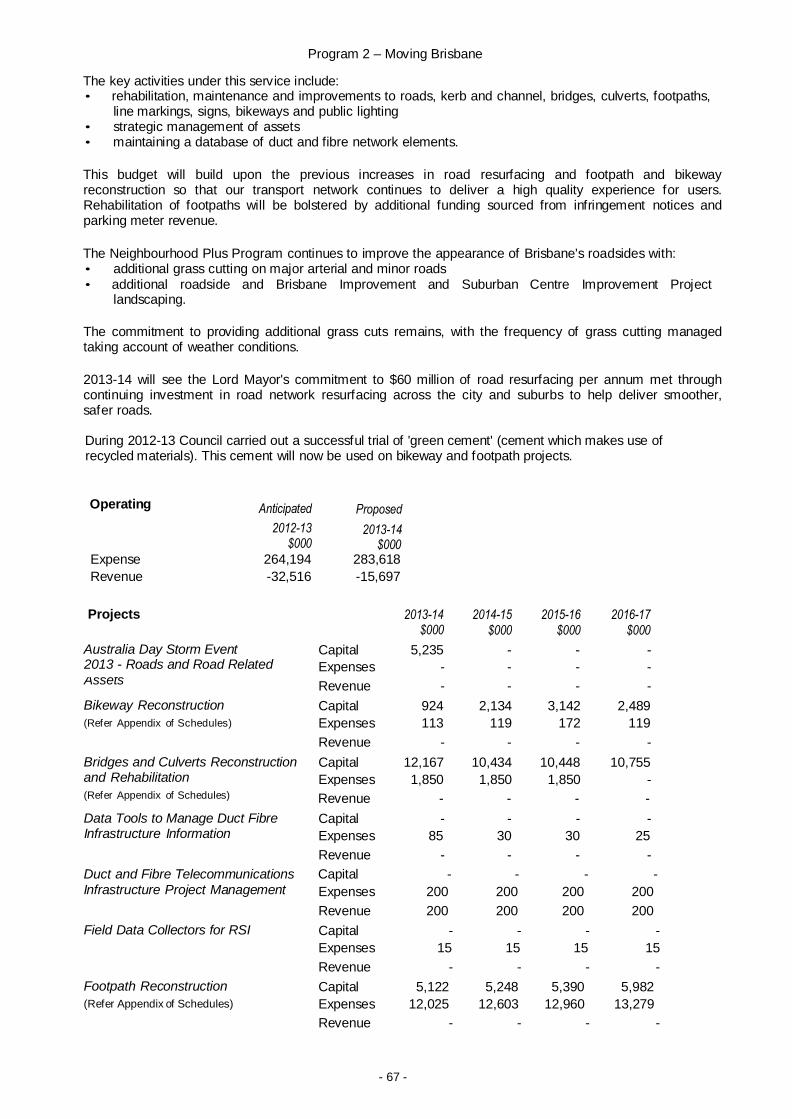
The key activities under this service include: • rehabilitation, maintenance and improvements to roads, kerb and channel, bridges, culverts, footpaths,
line markings, signs, bikeways and public lighting • strategic management of assets • maintaining a database of duct and fibre network elements.
This budget will build upon the previous increases in road resurfacing and footpath and bikeway reconstruction so that our transport network continues to deliver a high quality experience for users. Rehabilitation of footpaths will be bolstered by additional funding sourced from infringement notices and parking meter revenue.
The Neighbourhood Plus Program continues to improve the appearance of Brisbane's roadsides with: • additional grass cutting on major arterial and minor roads • additional roadside and Brisbane Improvement and Suburban Centre Improvement Project
landscaping.
The commitment to providing additional grass cuts remains, with the frequency of grass cutting managed taking account of weather conditions.
2013-14 will see the Lord Mayor's commitment to $60 million of road resurfacing per annum met through continuing investment in road network resurfacing across the city and suburbs to help deliver smoother, safer roads.
During 2012-13 Council carried out a successful trial of 'green cement' (cement which makes use of recycled materials). This cement will now be used on bikeway and footpath projects.
Operating Anticipated
2012-13
Proposed
2013-14 $000 $000
Expense 264,194 283,618
Revenue -32,516 -15,697
Projects 2013-14 $000
2014-15 $000
2015-16 $000
2016-17 $000
Australia Day Storm Event Capital 5,235 - - - 2013 - Roads and Road Related Expenses - - - - Assets Revenue - - - -
Bikeway Reconstruction Capital 924 2,134 3,142 2,489
(Refer Appendix of Schedules) Expenses 113 119 172 119
Revenue - - - -
Bridges and Culverts Reconstruction Capital 12,167 10,434 10,448 10,755 and Rehabilitation Expenses 1,850 1,850 1,850 - (Refer Appendix of Schedules) Revenue - - - -
Data Tools to Manage Duct Fibre Capital - - - - Infrastructure Information Expenses 85 30 30 25
Revenue - - - -
Duct and Fibre Telecommunications Capital - - - - Infrastructure Project Management Expenses 200 200 200 200
Revenue 200 200 200 200
Field Data Collectors for RSI Capital - - - -
Expenses 15 15 15 15
Revenue - - - -
Footpath Reconstruction Capital 5,122 5,248 5,390 5,982
(Refer Appendix of Schedules) Expenses 12,025 12,603 12,960 13,279
Revenue - - - -
Program 2 – Moving Brisbane
- 68 -
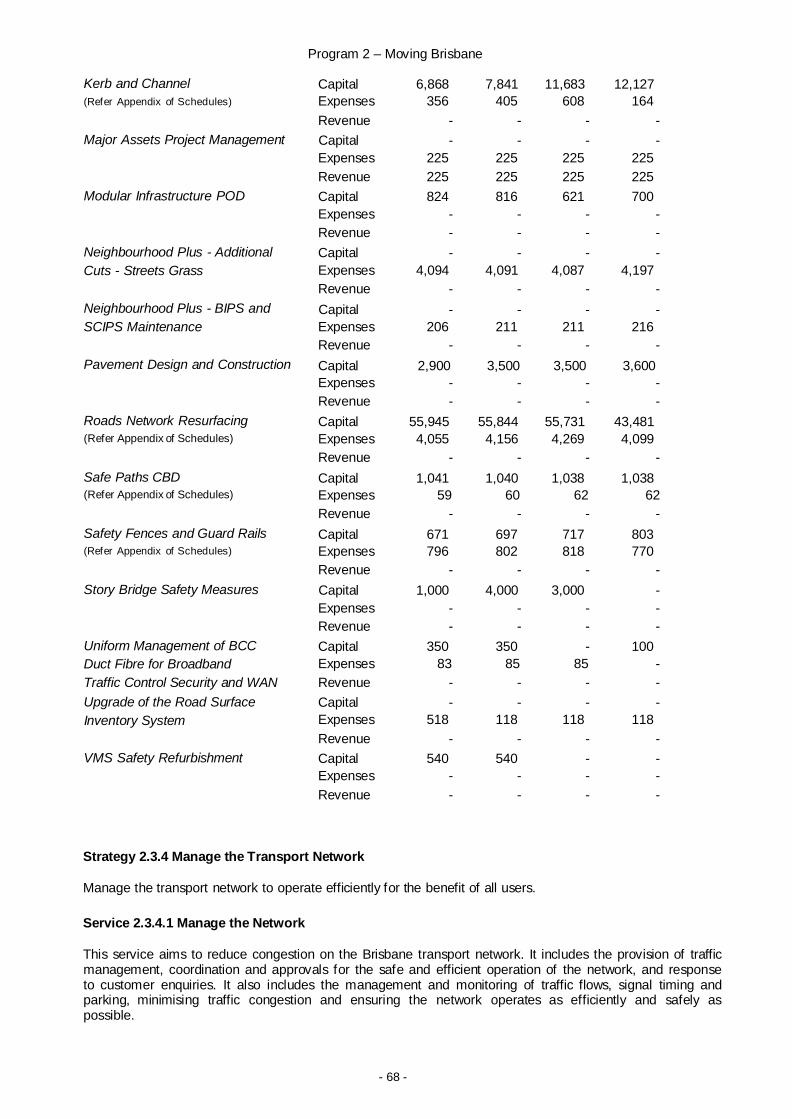
Kerb and Channel Capital 6,868 7,841 11,683 12,127
(Refer Appendix of Schedules) Expenses 356 405 608 164
Revenue - - - -
Major Assets Project Management Capital - - - -
Expenses 225 225 225 225
Revenue 225 225 225 225
Modular Infrastructure POD Capital 824 816 621 700
Expenses - - - -
Revenue - - - -
Neighbourhood Plus - Additional Capital - - - -
Cuts - Streets Grass Expenses 4,094 4,091 4,087 4,197
Revenue - - - -
Neighbourhood Plus - BIPS and Capital - - - -
SCIPS Maintenance Expenses 206 211 211 216
Revenue - - - -
Pavement Design and Construction Capital
Expenses
2,900
-
3,500
-
3,500
-
3,600
-
Revenue - - - -
Roads Network Resurfacing Capital 55,945 55,844 55,731 43,481
(Refer Appendix of Schedules) Expenses 4,055 4,156 4,269 4,099
Revenue - - - -
Safe Paths CBD Capital 1,041 1,040 1,038 1,038 (Refer Appendix of Schedules) Expenses 59 60 62 62
Revenue - - - -
Safety Fences and Guard Rails Capital 671 697 717 803 (Refer Appendix of Schedules) Expenses 796 802 818 770
Revenue - - - -
Story Bridge Safety Measures Capital 1,000 4,000 3,000 -
Expenses - - - -
Revenue - - - -
Uniform Management of BCC Capital 350 350 - 100
Duct Fibre for Broadband Expenses 83 85 85 -
Traffic Control Security and WAN Revenue - - - -
Upgrade of the Road Surface Capital - - - -
Inventory System Expenses 518 118 118 118
Revenue - - - -
VMS Safety Refurbishment Capital 540 540 - -
Expenses - - - -
Revenue - - - -
Strategy 2.3.4 Manage the Transport Network
Manage the transport network to operate efficiently for the benefit of all users.
Service 2.3.4.1 Manage the Network
This service aims to reduce congestion on the Brisbane transport network. It includes the provision of traffic management, coordination and approvals for the safe and efficient operation of the network, and response to customer enquiries. It also includes the management and monitoring of traffic flows, signal timing and parking, minimising traffic congestion and ensuring the network operates as efficiently and safely as possible.
Program 2 – Moving Brisbane
- 69 -
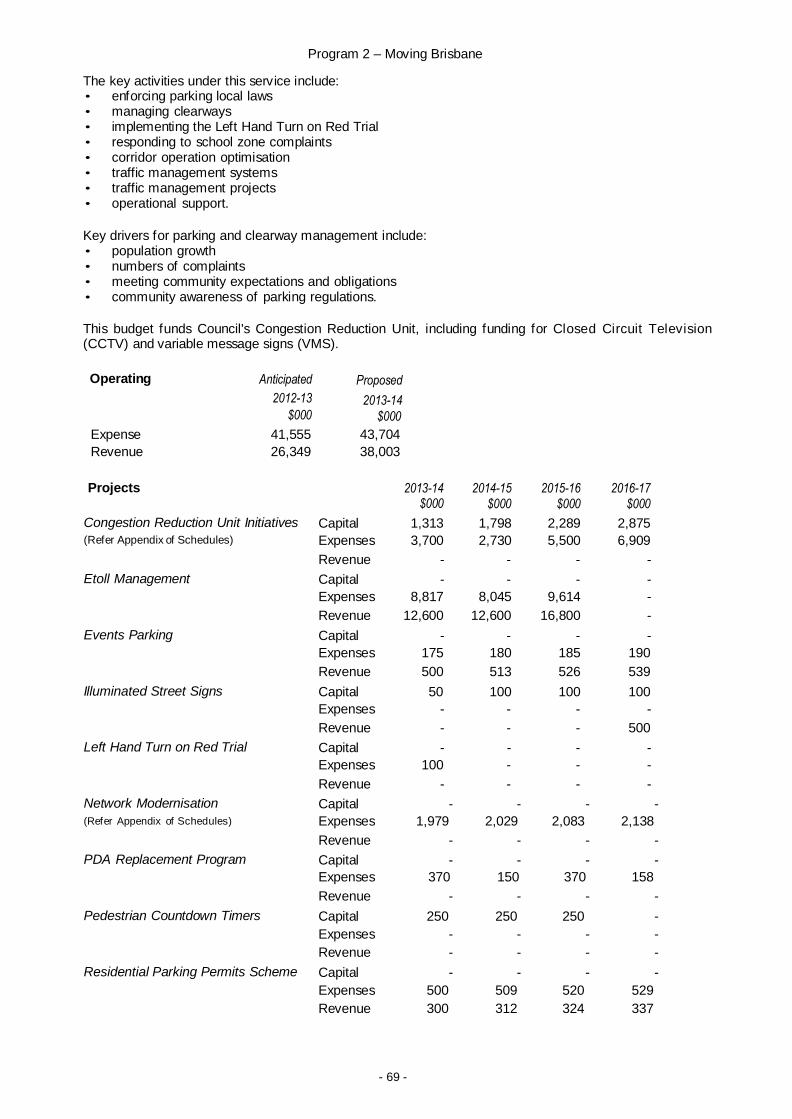
The key activities under this service include: • enforcing parking local laws • managing clearways • implementing the Left Hand Turn on Red Trial • responding to school zone complaints • corridor operation optimisation • traffic management systems • traffic management projects • operational support.
Key drivers for parking and clearway management include: • population growth • numbers of complaints • meeting community expectations and obligations • community awareness of parking regulations.
This budget funds Council's Congestion Reduction Unit, including funding for Closed Circuit Telev ision (CCTV) and variable message signs (VMS).
Operating Anticipated
2012-13
Proposed
2013-14 $000 $000
Expense 41,555 43,704
Revenue 26,349 38,003
Projects 2013-14 $000
2014-15 $000
2015-16 $000
2016-17 $000
Congestion Reduction Unit Initiatives Capital 1,313 1,798 2,289 2,875
(Refer Appendix of Schedules) Expenses 3,700 2,730 5,500 6,909
Revenue - - - -
Etoll Management Capital - - - -
Expenses 8,817 8,045 9,614 -
Revenue 12,600 12,600 16,800 -
Events Parking Capital - - - -
Expenses 175 180 185 190
Revenue 500 513 526 539
Illuminated Street Signs Capital 50 100 100 100
Expenses - - - -
Revenue - - - 500
Left Hand Turn on Red Trial Capital - - - -
Expenses 100 - - -
Revenue - - - -
Network Modernisation Capital - - - -
(Refer Appendix of Schedules) Expenses 1,979 2,029 2,083 2,138 Revenue - - - -
PDA Replacement Program Capital
Expenses
-
370
-
150
-
370
158
-
Revenue - - - -
Pedestrian Countdown Timers Capital 250 250 250 -
Expenses - - - -
Revenue - - - -
Residential Parking Permits Scheme Capital - - - -
Expenses 500 509 520 529 Revenue 300 312 324 337
Program 2 – Moving Brisbane
- 70 -
Signs and Lines - Roadmarkings Capital
Expenses
-
3,315
-
3,546
-
3,642
3,816
-
Revenue - - - -
Suburban Amenity Improvements Capital
Expenses
-
2,697
-
2,747
-
2,801
2,856
-
Revenue - - - -
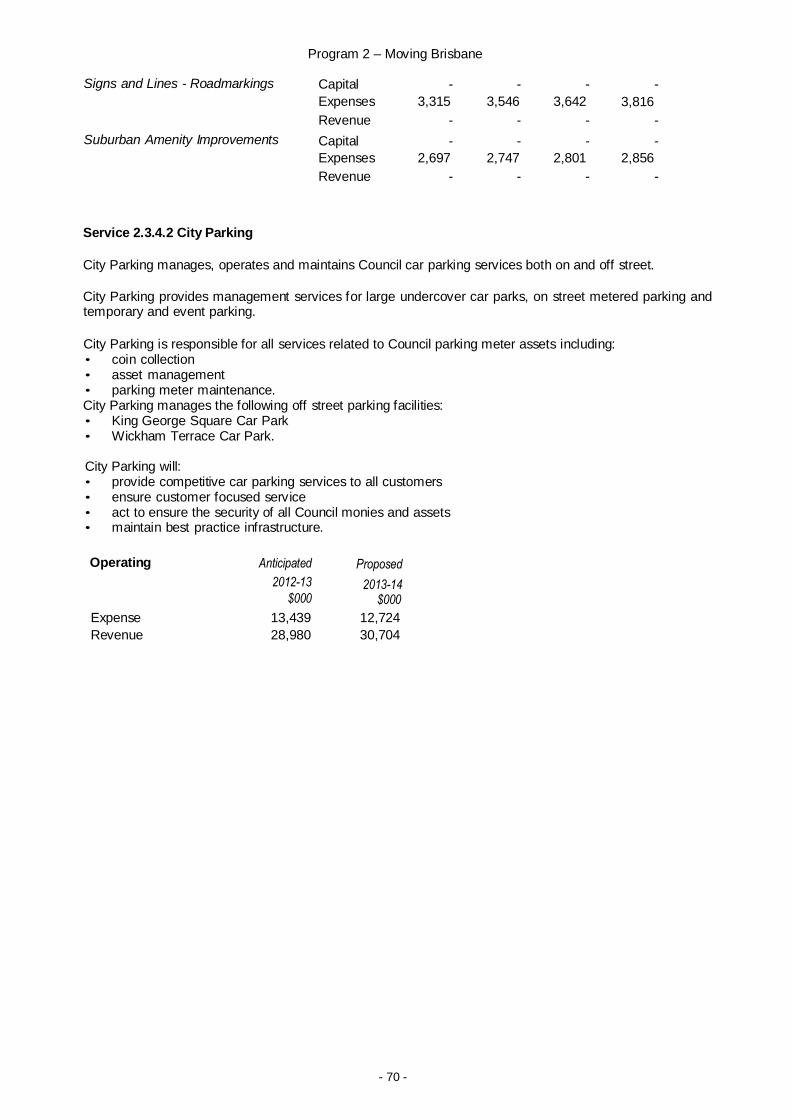
Service 2.3.4.2 City Parking
City Parking manages, operates and maintains Council car parking services both on and off street.
City Parking provides management services for large undercover car parks, on street metered parking and temporary and event parking.
City Parking is responsible for all services related to Council parking meter assets including: • coin collection • asset management • parking meter maintenance. City Parking manages the following off street parking facilities: • King George Square Car Park • Wickham Terrace Car Park.
City Parking will: • provide competitive car parking services to all customers • ensure customer focused service • act to ensure the security of all Council monies and assets • maintain best practice infrastructure.
Operating Anticipated
2012-13
Proposed
2013-14 $000 $000
Expense 13,439 12,724
Revenue 28,980 30,704
Program 2 – Moving Brisbane
- 71 -
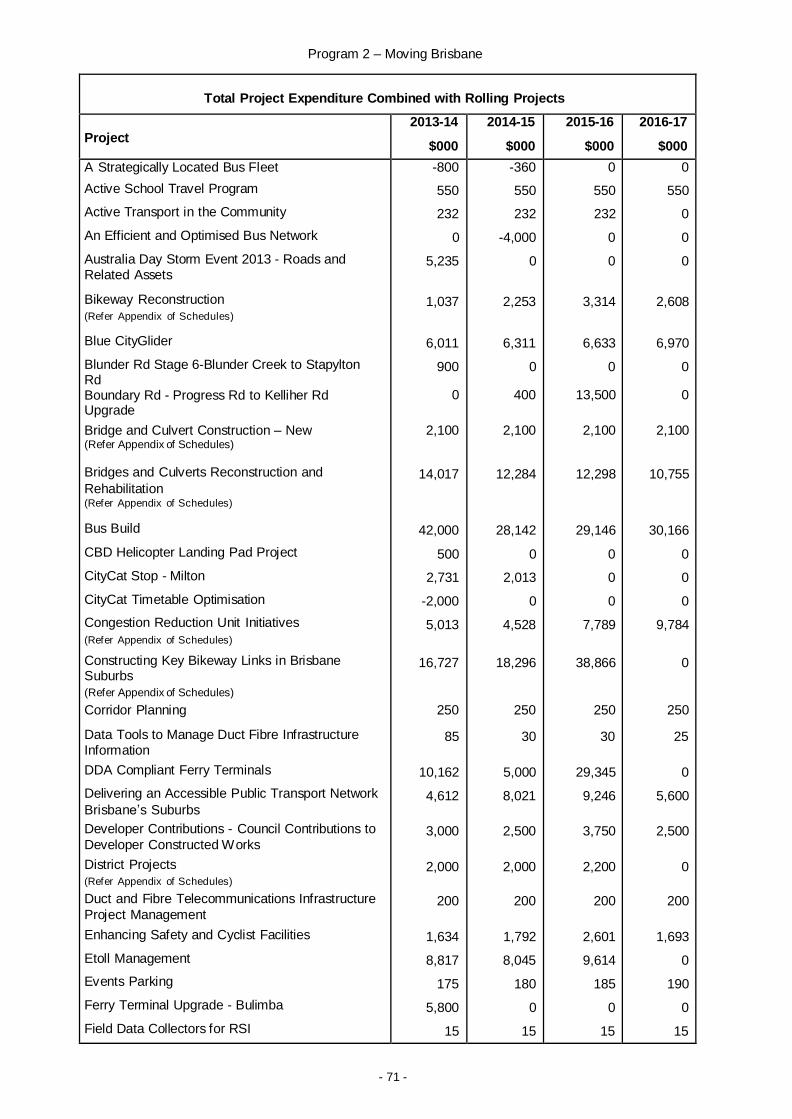
Total Project Expenditure Combined with Rolling Projects
Project
2013-14
$000
2014-15
$000
2015-16
$000
2016-17
$000
A Strategically Located Bus Fleet
Active School Travel Program
Active Transport in the Community
An Efficient and Optimised Bus Network
Australia Day Storm Event 2013 - Roads and Related Assets
Bikeway Reconstruction
(Refer Appendix of Schedules)
Blue CityGlider
Blunder Rd Stage 6-Blunder Creek to Stapylton Rd Boundary Rd - Progress Rd to Kelliher Rd Upgrade
Bridge and Culvert Construction – New (Refer Appendix of Schedules)
Bridges and Culverts Reconstruction and
Rehabilitation (Refer Appendix of Schedules)
Bus Build
CBD Helicopter Landing Pad Project
CityCat Stop - Milton
CityCat Timetable Optimisation
Congestion Reduction Unit Initiatives
(Refer Appendix of Schedules)
Constructing Key Bikeway Links in Brisbane Suburbs
(Refer Appendix of Schedules)
Corridor Planning
Data Tools to Manage Duct Fibre Infrastructure Information
DDA Compliant Ferry Terminals
Delivering an Accessible Public Transport Network
Brisbane’s Suburbs
Developer Contributions - Council Contributions to
Developer Constructed W orks
District Projects
(Refer Appendix of Schedules)
Duct and Fibre Telecommunications Infrastructure
Project Management
Enhancing Safety and Cyclist Facilities
Etoll Management
Events Parking
Ferry Terminal Upgrade - Bulimba
Field Data Collectors for RSI
-800
550
232
0
5,235
1,037
6,011
900
0
2,100
14,017
42,000
500
2,731
-2,000
5,013
16,727
250
85
10,162
4,612
3,000
2,000
200
1,634
8,817
175
5,800
15
-360
550
232
-4,000
0
2,253
6,311
0
400
2,100
12,284
28,142
0
2,013
0
4,528
18,296
250
30
5,000
8,021
2,500
2,000
200
1,792
8,045
180
0
15
0
550
232
0
0
3,314
6,633
0
13,500
2,100
12,298
29,146
0
0
0
7,789
38,866
250
30
29,345
9,246
3,750
2,200
200
2,601
9,614
185
0
15
0
550
0
0
0
2,608
6,970
0
0
2,100
10,755
30,166
0
0
0
9,784
0
250
25
0
5,600
2,500
0
200
1,693
0
190
0
15
Program 2 – Moving Brisbane
- 72 -
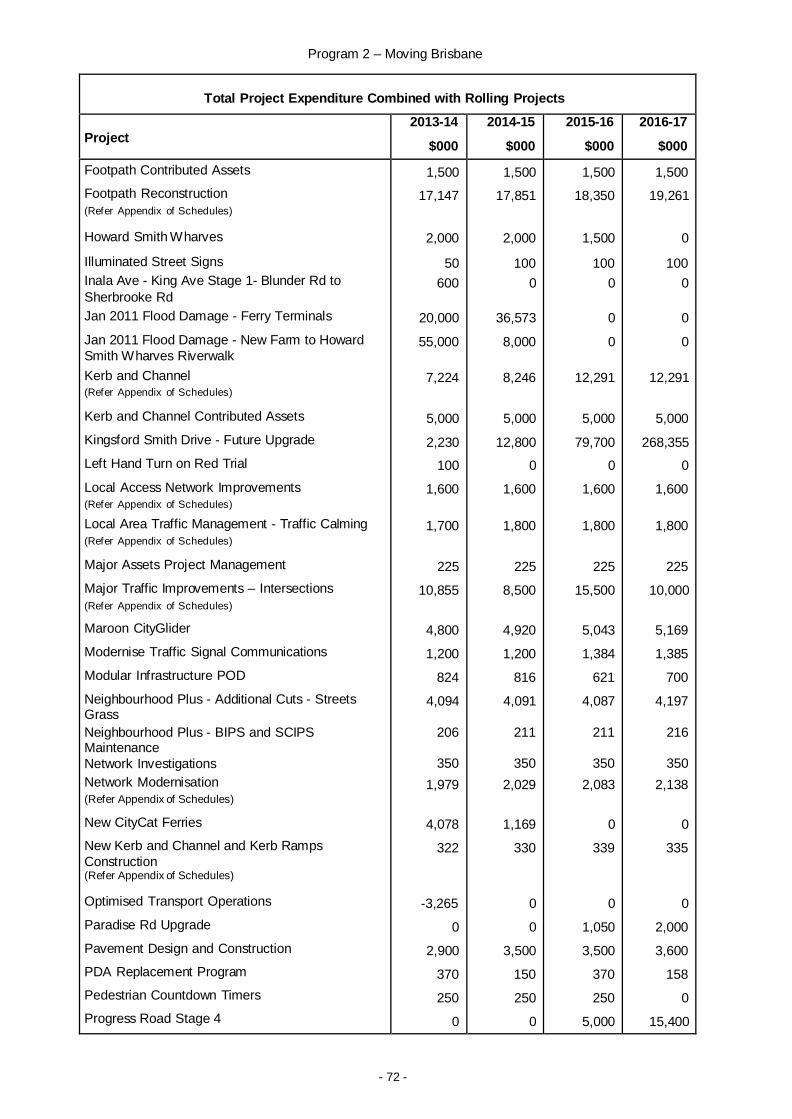
Total Project Expenditure Combined with Rolling Projects
Project
2013-14
$000
2014-15
$000
2015-16
$000
2016-17
$000
Footpath Contributed Assets
Footpath Reconstruction
(Refer Appendix of Schedules)
Howard Smith W harves
Illuminated Street Signs
Inala Ave - King Ave Stage 1- Blunder Rd to
Sherbrooke Rd
Jan 2011 Flood Damage - Ferry Terminals
Jan 2011 Flood Damage - New Farm to Howard
Smith W harves Riverwalk
Kerb and Channel (Refer Appendix of Schedules)
Kerb and Channel Contributed Assets
Kingsford Smith Drive - Future Upgrade
Left Hand Turn on Red Trial
Local Access Network Improvements
(Refer Appendix of Schedules)
Local Area Traffic Management - Traffic Calming
(Refer Appendix of Schedules)
Major Assets Project Management
Major Traffic Improvements – Intersections
(Refer Appendix of Schedules)
Maroon CityGlider
Modernise Traffic Signal Communications
Modular Infrastructure POD
Neighbourhood Plus - Additional Cuts - Streets Grass
Neighbourhood Plus - BIPS and SCIPS Maintenance
Network Investigations
Network Modernisation
(Refer Appendix of Schedules)
New CityCat Ferries
New Kerb and Channel and Kerb Ramps
Construction (Refer Appendix of Schedules)
Optimised Transport Operations
Paradise Rd Upgrade
Pavement Design and Construction
PDA Replacement Program
Pedestrian Countdown Timers
Progress Road Stage 4
1,500
17,147
2,000
50
600
20,000
55,000
7,224
5,000
2,230
100
1,600
1,700
225
10,855
4,800
1,200
824
4,094
206
350
1,979
4,078
322
-3,265
0
2,900
370
250
0
1,500
17,851
2,000
100
0
36,573
8,000
8,246
5,000
12,800
0
1,600
1,800
225
8,500
4,920
1,200
816
4,091
211
350
2,029
1,169
330
0
0
3,500
150
250
0
1,500
18,350
1,500
100
0
0
0
12,291
5,000
79,700
0
1,600
1,800
225
15,500
5,043
1,384
621
4,087
211
350
2,083
0
339
0
1,050
3,500
370
250
5,000
1,500
19,261
0
100
0
0
0
12,291
5,000
268,355
0
1,600
1,800
225
10,000
5,169
1,385
700
4,197
216
350
2,138
0
335
0
2,000
3,600
158
0
15,400
Program 2 – Moving Brisbane
- 73 -
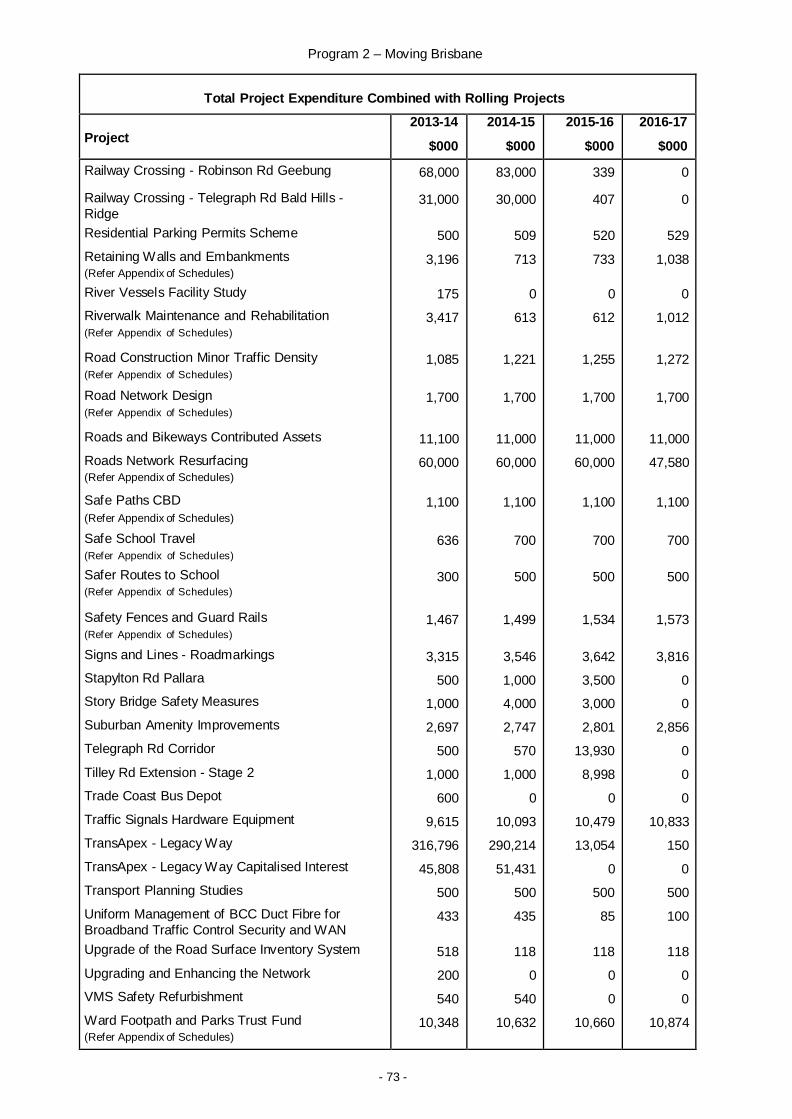
Total Project Expenditure Combined with Rolling Projects
Project
2013-14
$000
2014-15
$000
2015-16
$000
2016-17
$000
Railway Crossing - Robinson Rd Geebung Railway Crossing - Telegraph Rd Bald Hills -
Ridge
Residential Parking Permits Scheme
Retaining W alls and Embankments
(Refer Appendix of Schedules)
River Vessels Facility Study
Riverwalk Maintenance and Rehabilitation
(Refer Appendix of Schedules)
Road Construction Minor Traffic Density
(Refer Appendix of Schedules)
Road Network Design
(Refer Appendix of Schedules)
Roads and Bikeways Contributed Assets
Roads Network Resurfacing
(Refer Appendix of Schedules)
Safe Paths CBD
(Refer Appendix of Schedules)
Safe School Travel
(Refer Appendix of Schedules)
Safer Routes to School
(Refer Appendix of Schedules) Safety Fences and Guard Rails
(Refer Appendix of Schedules)
Signs and Lines - Roadmarkings
Stapylton Rd Pallara
Story Bridge Safety Measures
Suburban Amenity Improvements
Telegraph Rd Corridor
Tilley Rd Extension - Stage 2
Trade Coast Bus Depot
Traffic Signals Hardware Equipment
TransApex - Legacy W ay
TransApex - Legacy W ay Capitalised Interest
Transport Planning Studies
Uniform Management of BCC Duct Fibre for
Broadband Traffic Control Security and WAN
Upgrade of the Road Surface Inventory System
Upgrading and Enhancing the Network
VMS Safety Refurbishment
Ward Footpath and Parks Trust Fund
(Refer Appendix of Schedules)
68,000
31,000
500
3,196
175
3,417
1,085
1,700
11,100
60,000
1,100
636
300
1,467
3,315
500
1,000
2,697
500
1,000
600
9,615
316,796
45,808
500
433
518
200
540
10,348
83,000
30,000
509
713
0
613
1,221
1,700
11,000
60,000
1,100
700
500
1,499
3,546
1,000
4,000
2,747
570
1,000
0
10,093
290,214
51,431
500
435
118
0
540
10,632
339
407
520
733
0
612
1,255
1,700
11,000
60,000
1,100
700
500
1,534
3,642
3,500
3,000
2,801
13,930
8,998
0
10,479
13,054
0
500
85
118
0
0
10,660
0
0
529
1,038
0
1,012
1,272
1,700
11,000
47,580
1,100
700
500
1,573
3,816
0
0
2,856
0
0
0
10,833
150
0
500
100
118
0
0
10,874
- 74 -
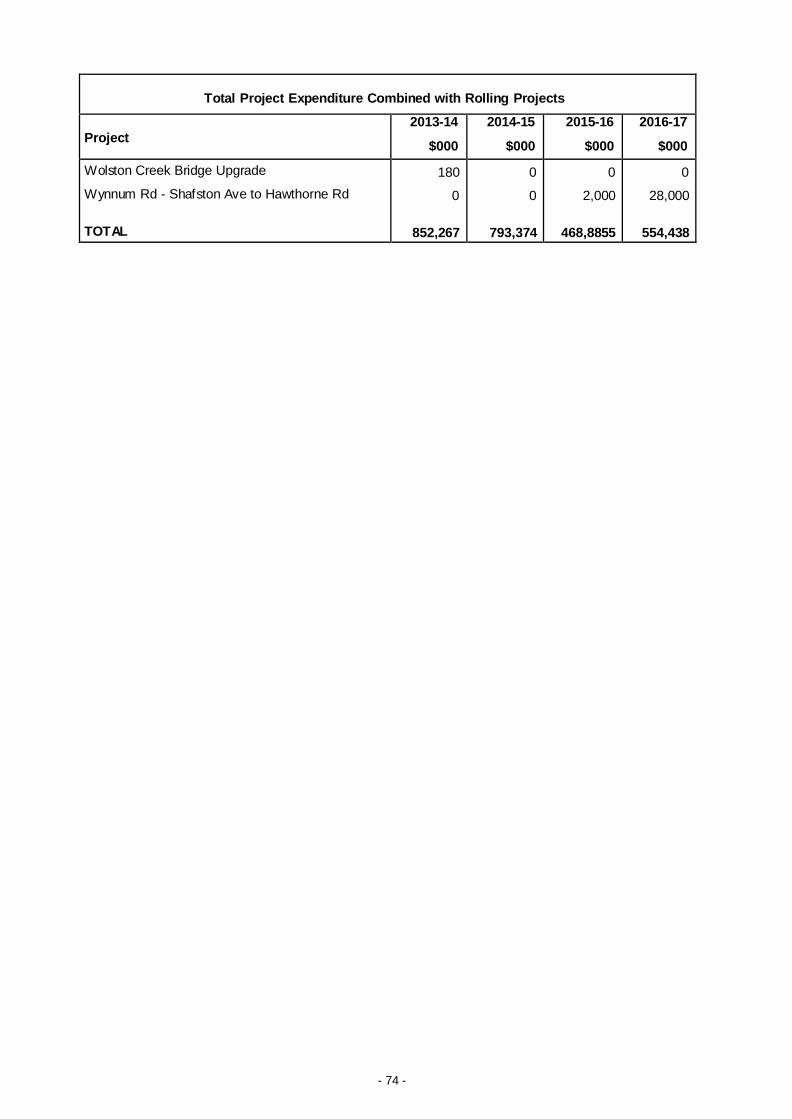
Total Project Expenditure Combined with Rolling Projects
Project
2013-14
$000
2014-15
$000
2015-16
$000
2016-17
$000
Wolston Creek Bridge Upgrade
Wynnum Rd - Shafston Ave to Hawthorne Rd
TOTAL
180
0
852,267
0
0
793,374
0
2,000
468,8855
0
28,000
554,438