Embed Size (px)
Citation preview
Contents• Executive summary
• Introduction
• Central London leasing market
• Central London net take-up
• Expansion space
• Migration trends
• Distance moved
• In-movers and out-movers
• Focus on Aldgate & Whitechapel
• Case study
• Occupier loyalty
• New operations in Central London
• Relocation trends by sector
• Summary and outlook
2Cushman & Wakefield | Movers & Shakers
Cushman & Wakefield has analysed migration trends since 2013 and this report focuses on patterns recorded in 2016.
Executive summary
• Just under half of all occupiers moved some or all of their operation to a new submarket
• The proportion of relocations between submarkets decreased compared with 2015
• The shift from West to East continued - 20 moves from West to East compared with 6 moves from East to West
• The average distance moved was 1.1 miles, which was a shorter distance than seen in the last two years
• City Core and Mayfair accounted for the largest number of out-movers
• The City Core also saw the greatest number of in-movers, along with Aldgate & Whitechapel
• Overall, Aldgate and Whitechapel and Clerkenwell and Shoreditch recorded the highest net positive balance (in-movers less out-movers)
• Longer term, the City Core, Canary Wharf and Aldgate and Whitechapel have attracted more in-movers in comparison to those moving out
• Media and tech companies were the most likely to relocate, followed by Professional services companies
• As in previous years, insurance companies were most loyal to their existing submarkets
• Net absorption as a direct result of leasing activity totalled 3.0 million sq ft in 2016, which was down on 2015 (3.2 million sq ft)
• This growth was driven by the tech sector who recorded a year on year increase in occupied floorspace
• Overflow or short term expansion space accounted for a higher proportion of leasing activity in comparison to previous years
• Government, public and associations, along with legal and insurance companies were the most likely to take overflow space
3Cushman & Wakefield | Movers & Shakers
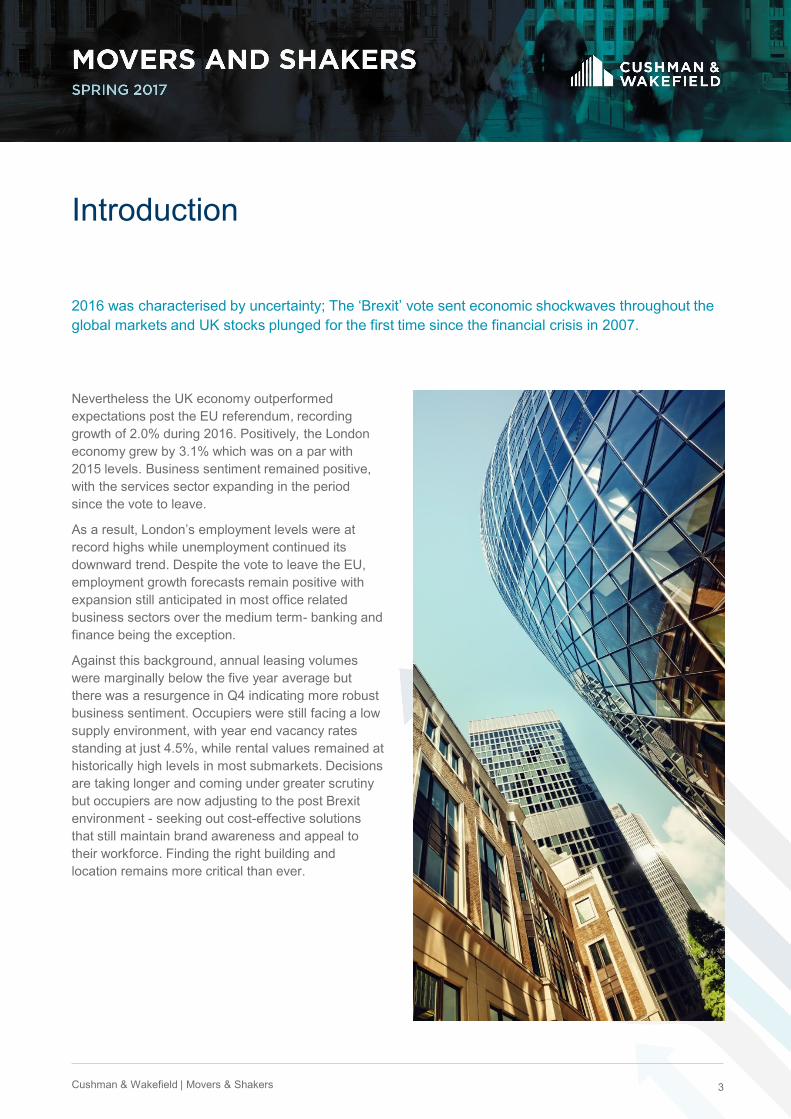
2016 was characterised by uncertainty; The ‘Brexit’ vote sent economic shockwaves throughout the global markets and UK stocks plunged for the first time since the financial crisis in 2007.
Introduction
Nevertheless the UK economy outperformed expectations post the EU referendum, recording growth of 2.0% during 2016. Positively, the London economy grew by 3.1% which was on a par with 2015 levels. Business sentiment remained positive, with the services sector expanding in the period since the vote to leave.
As a result, London’s employment levels were at record highs while unemployment continued its downward trend. Despite the vote to leave the EU, employment growth forecasts remain positive with expansion still anticipated in most office related business sectors over the medium term- banking and finance being the exception.
Against this background, annual leasing volumes were marginally below the five year average but there was a resurgence in Q4 indicating more robust business sentiment. Occupiers were still facing a low supply environment, with year end vacancy rates standing at just 4.5%, while rental values remained at historically high levels in most submarkets. Decisions are taking longer and coming under greater scrutiny but occupiers are now adjusting to the post Brexit environment - seeking out cost-effective solutions that still maintain brand awareness and appeal to their workforce. Finding the right building and location remains more critical than ever.
4Cushman & Wakefield | Movers & Shakers
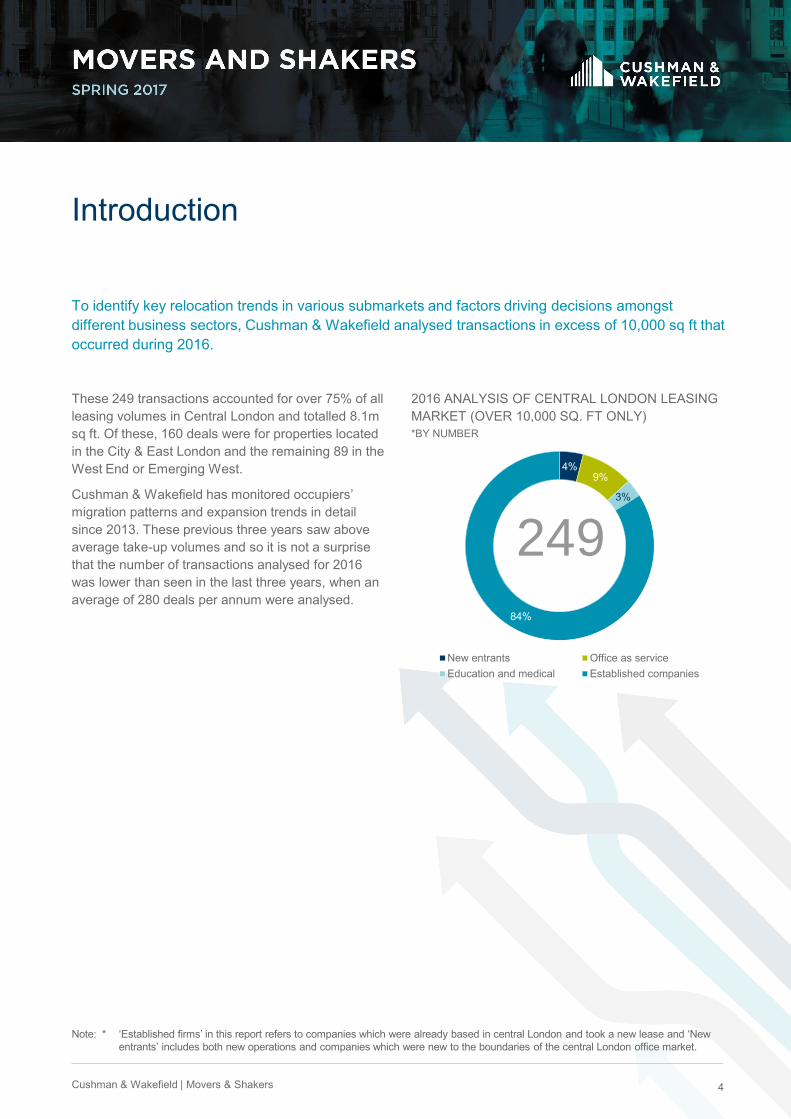
To identify key relocation trends in various submarkets and factors driving decisions amongst different business sectors, Cushman & Wakefield analysed transactions in excess of 10,000 sq ft that occurred during 2016.
Introduction
These 249 transactions accounted for over 75% of all leasing volumes in Central London and totalled 8.1m sq ft. Of these, 160 deals were for properties located in the City & East London and the remaining 89 in the West End or Emerging West.
Cushman & Wakefield has monitored occupiers’ migration patterns and expansion trends in detail since 2013. These previous three years saw above average take-up volumes and so it is not a surprise that the number of transactions analysed for 2016 was lower than seen in the last three years, when an average of 280 deals per annum were analysed.
2016 ANALYSIS OF CENTRAL LONDON LEASING MARKET (OVER 10,000 SQ. FT ONLY)
4%9%
3%
84%
New entrants Office as serviceEducation and medical Established companies
249
Note: * ‘Established firms’ in this report refers to companies which were already based in central London and took a new lease and ‘New entrants’ includes both new operations and companies which were new to the boundaries of the central London office market.
*BY NUMBER
5Cushman & Wakefield | Movers & Shakers
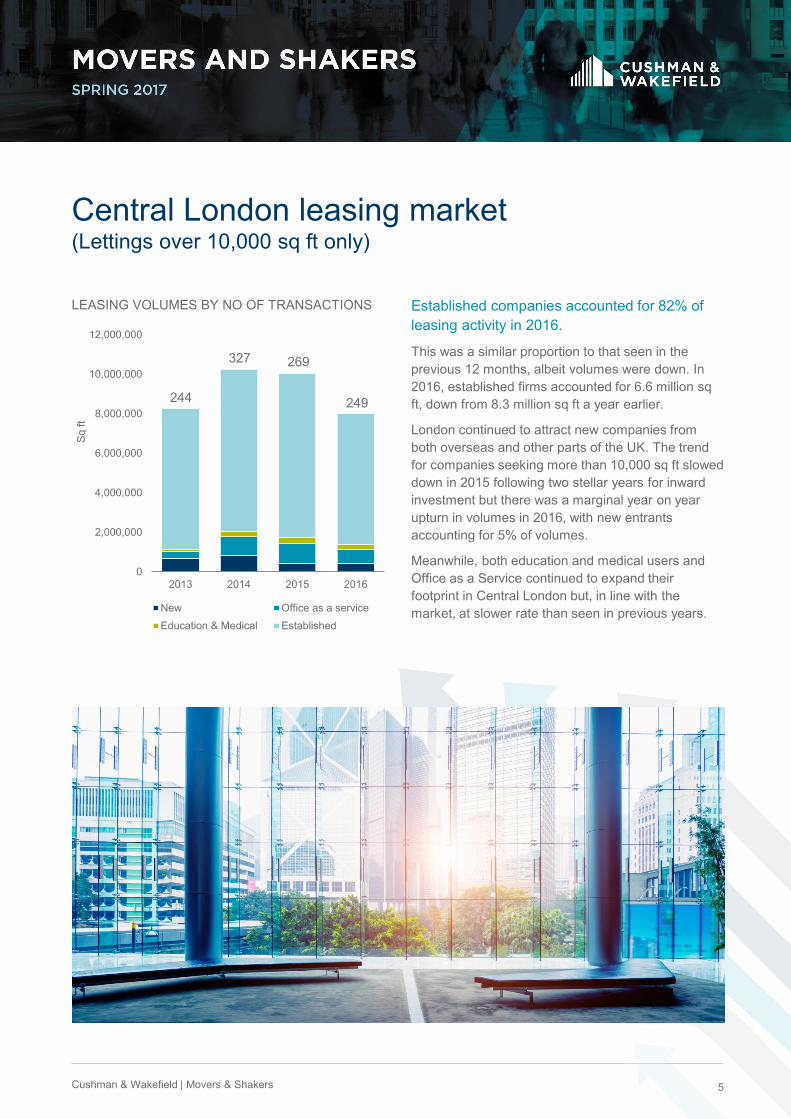
0
2,000,000
4,000,000
6,000,000
8,000,000
10,000,000
12,000,000
2013 2014 2015 2016
Sq
ft
New Office as a serviceEducation & Medical Established
244
327 269
249
LEASING VOLUMES BY NO OF TRANSACTIONS
Central London leasing market (Lettings over 10,000 sq ft only)
Established companies accounted for 82% of leasing activity in 2016.
This was a similar proportion to that seen in the previous 12 months, albeit volumes were down. In 2016, established firms accounted for 6.6 million sq ft, down from 8.3 million sq ft a year earlier.
London continued to attract new companies from both overseas and other parts of the UK. The trend for companies seeking more than 10,000 sq ft slowed down in 2015 following two stellar years for inward investment but there was a marginal year on year upturn in volumes in 2016, with new entrants accounting for 5% of volumes.
Meanwhile, both education and medical users and Office as a Service continued to expand their footprint in Central London but, in line with the market, at slower rate than seen in previous years.
6Cushman & Wakefield | Movers & Shakers
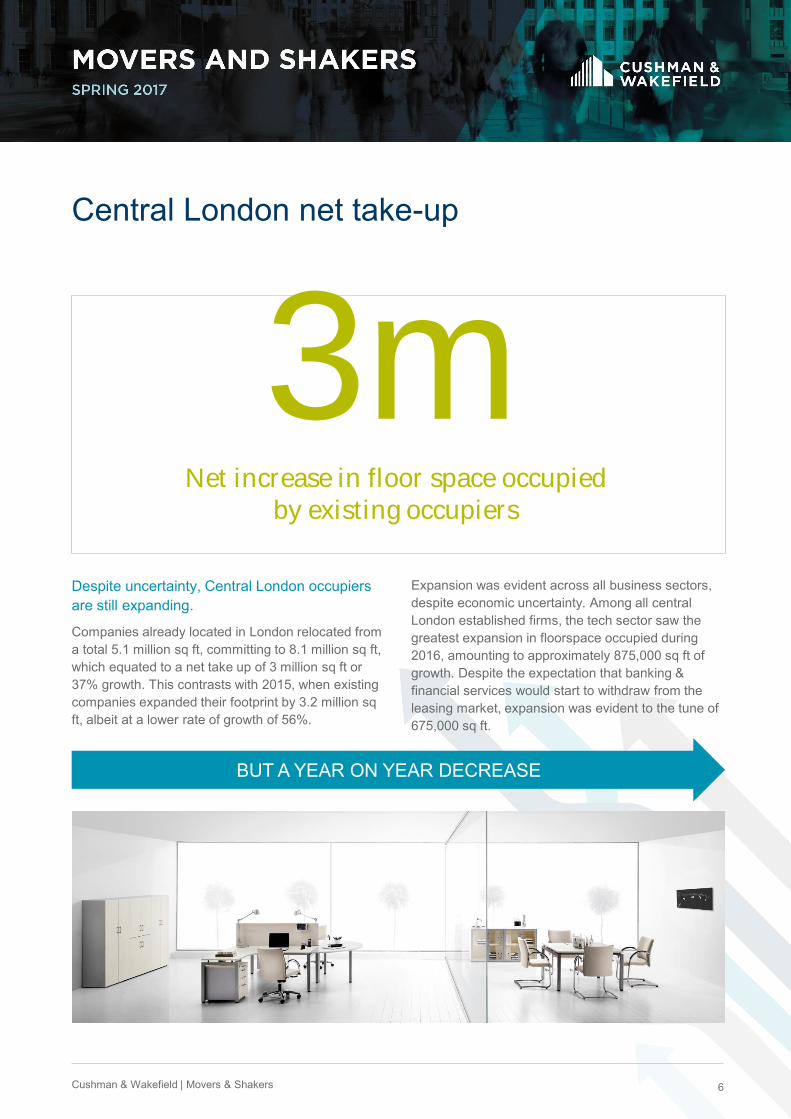
3mNet increase in floor space occupied
by existing occupiers
BUT A YEAR ON YEAR DECREASE
Despite uncertainty, Central London occupiers are still expanding.
Companies already located in London relocated from a total 5.1 million sq ft, committing to 8.1 million sq ft, which equated to a net take up of 3 million sq ft or 37% growth. This contrasts with 2015, when existing companies expanded their footprint by 3.2 million sq ft, albeit at a lower rate of growth of 56%.
Central London net take-up
Expansion was evident across all business sectors, despite economic uncertainty. Among all central London established firms, the tech sector saw the greatest expansion in floorspace occupied during 2016, amounting to approximately 875,000 sq ft of growth. Despite the expectation that banking & financial services would start to withdraw from the leasing market, expansion was evident to the tune of 675,000 sq ft.
7Cushman & Wakefield | Movers & Shakers
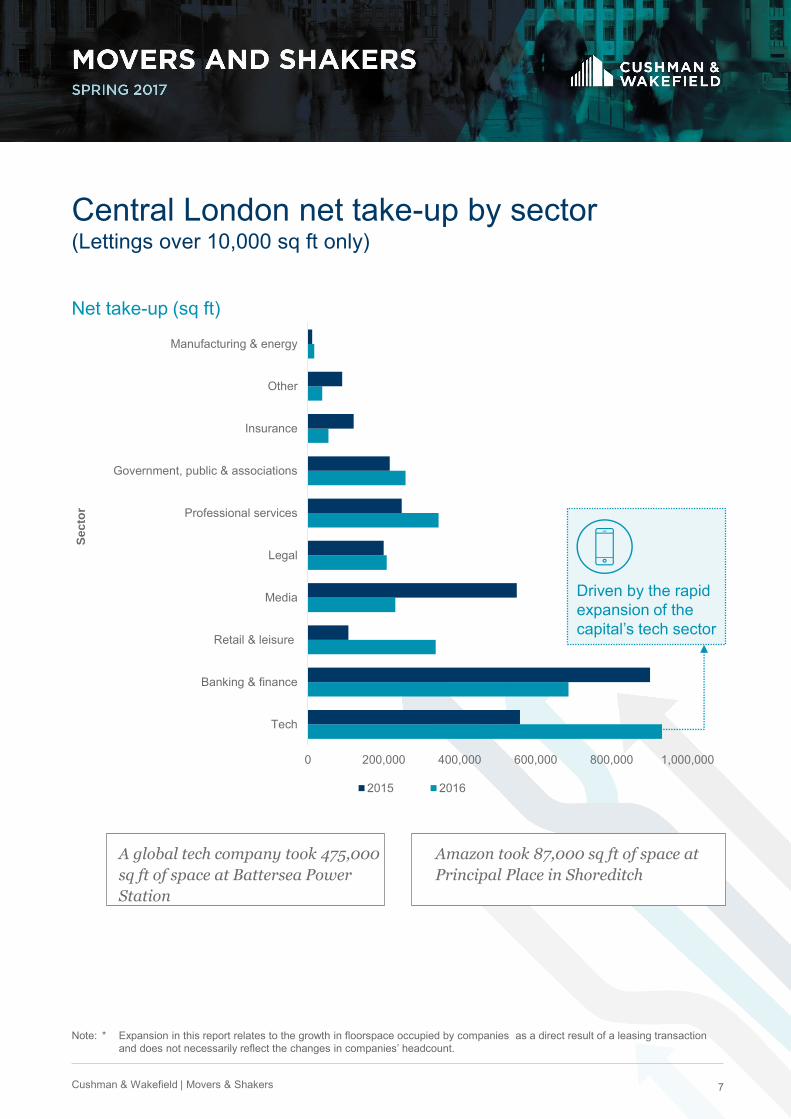
Driven by the rapid expansion of the capital’s tech sector
0 200,000 400,000 600,000 800,000 1,000,000
Tech
Banking & finance
Retail & leisure
Media
Legal
Professional services
Government, public & associations
Insurance
Other
Manufacturing & energy
Se
cto
r
2015 2016
Note: * Expansion in this report relates to the growth in floorspace occupied by companies as a direct result of a leasing transaction and does not necessarily reflect the changes in companies’ headcount.
Net take-up (sq ft)
Central London net take-up by sector (Lettings over 10,000 sq ft only)
A global tech company took 475,000
sq ft of space at Battersea Power
Station
Amazon took 87,000 sq ft of space at
Principal Place in Shoreditch
8Cushman & Wakefield | Movers & Shakers
The trend to take overflow or short term expansion space continued in 2016, with an estimated 1.3m sq ft of take up above 10,000 sq ft accounted for by companies who either took extra space in their existing properties or expanded their Central London operation with additional sites nearby rather than a full relocation.
Expansion space
This is a similar volume to 2015, but represents a higher proportion of leasing activity overall. Economic uncertainty coupled with the cost of relocating and the relatively limited choice, particularly for larger companies has supported this trend for overflow space rather than committing to a full scale move.
The tech sector saw the greatest levels of growth, as a sector that continues to expand across London. London is the third largest tech sector in the world and is anticipated to see further expansion as digital disruption and artificial intelligence permeate into the more traditional business sectors. Tech companies increased their footprint three-fold in 2016, and at a faster pace than recorded the previous year. Apple’s commitment to c500,000 sq ft of space at Battersea Power Station was a key driver of this growth but Palantir, Adobe, Deliveroo and Amazon were other key examples of companies expanding across London.
While both the media and banking and financial services sectors increased their floor space during 2016, the volume of expansion slowed year on year. Both sectors saw significant activity in 2015 which has not been maintained during the year of Brexit. In particular, location strategies of banks are coming under greater scrutiny as companies consider how to respond to the potential loss of passporting rights when the UK exits the EU. It is no surprise that a number of the investment banks are delaying hiring intentions and considering alternative locations. Counter to this though, banks are investing in other areas of business such as digitalisation, with HSBC digital for example leasing 65,000 sq ft in the Blue Fin Building, SE1.
2016 business growth in the media sector was the lowest for several years, as marketing and advertising budgets were broadly flat year on year and this is likely to have impacted on real estate decisions. The largest media transactions were Thomson Reuters, who are consolidating from a number of offices into 315,000 sq ft at 5 Canada Square, E14 to achieve efficiency gains, and the FT, who following their sale to Japanese media organisation Nikkei Inc, are relocating back into the City at Bracken House (183,000 sq ft) but neither of these involved any major expansion.

9Cushman & Wakefield | Movers & Shakers
Banking & Finance
Retail & Leisure
Sectors
increasing their net
take-up
Y-O-Y
Sectors
reducingtheir net
take-up
Y-O-Y Media
Tech
Expansion space-sector analysis
10Cushman & Wakefield | Movers & Shakers
HAMMERSMITH
KENSINGTON
KNIGHTSBRIDGE
PADDINGTON
EUSTON & MARYLEBONE
KING’S CROSS
NORTH OF OXFORD STREET
MAYFAIR & ST JAMES’S
VICTORIA
SOUTHBANK
BLOOMSBURY
CLERKENWELL & SHOREDITCH
CITY CORE
ALD
GAT
E &
WH
OTE
CH
APEL
CANARY WHARF
DOCKLANDS
SOHO & COVENT GARDEN
MIDTOWN
STRATFORD
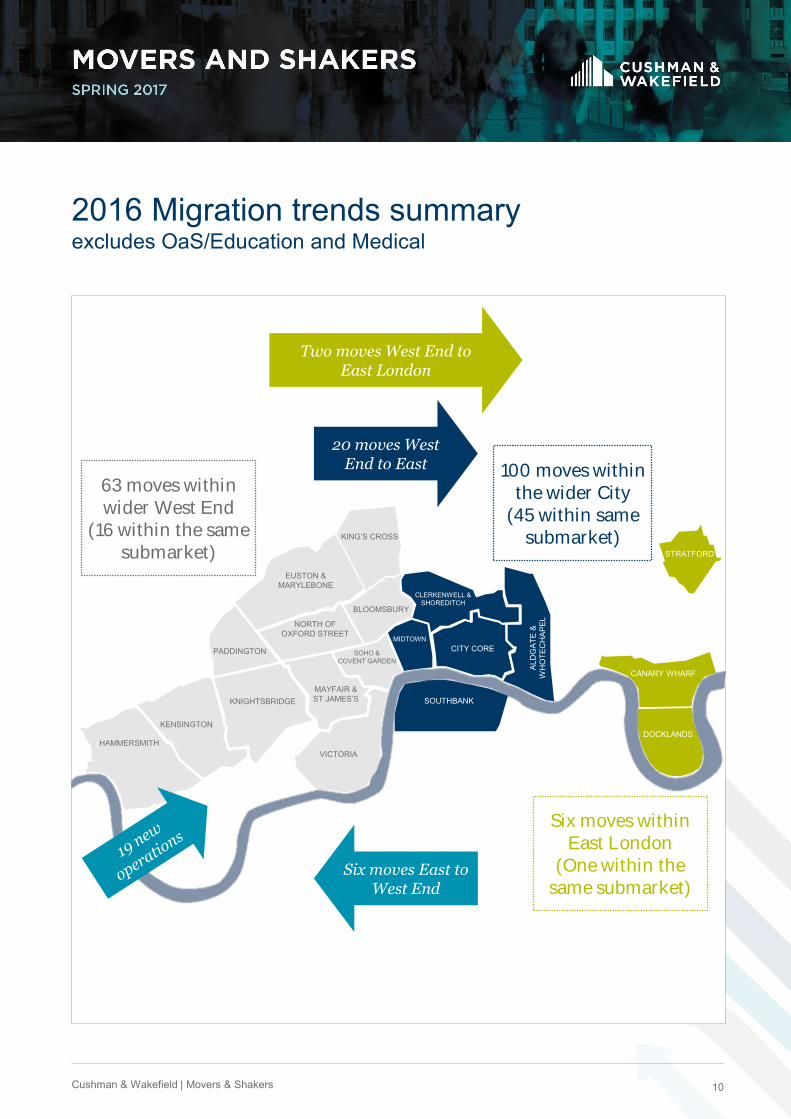
2016 Migration trends summary excludes OaS/Education and Medical
20 moves West End to East
63 moves within wider West End
(16 within the same submarket)
100 moves within the wider City
(45 within same submarket)
Two moves West End to East London
Six moves East to West End
Six moves within East London
(One within the same submarket)

How far do occupiers really move?
the average distance occupiers moved in
2016
12Cushman & Wakefield | Movers & Shakers
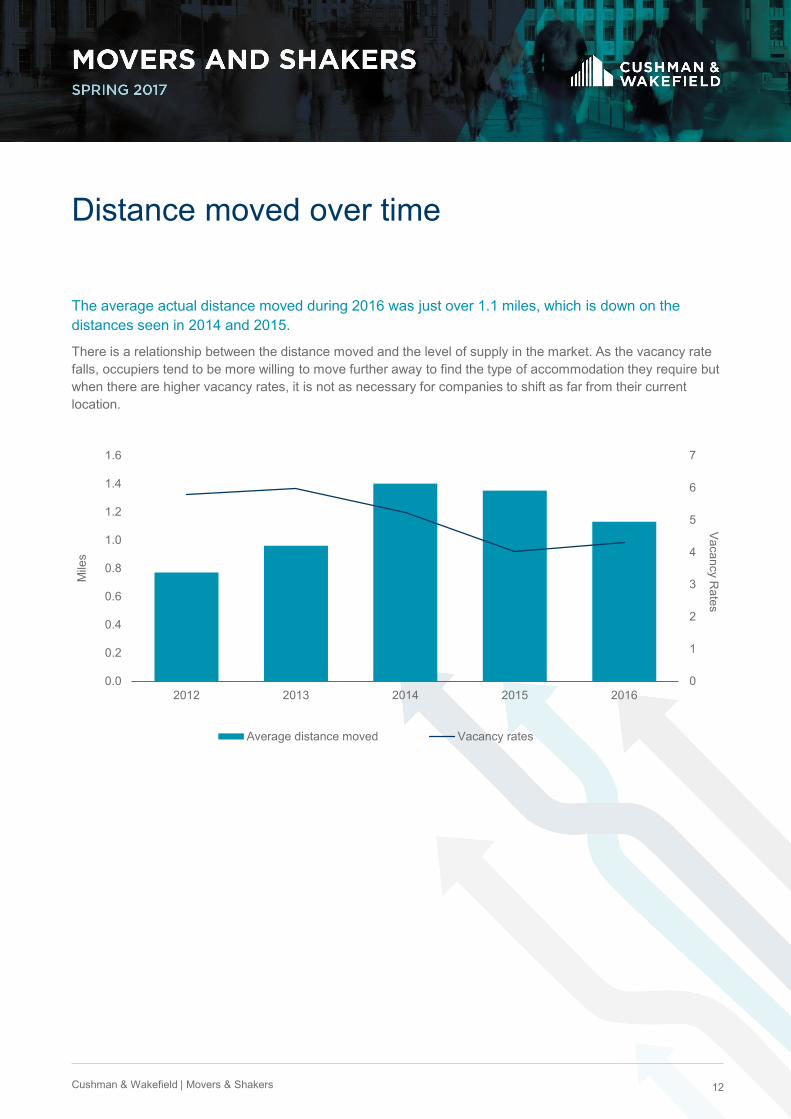
The average actual distance moved during 2016 was just over 1.1 miles, which is down on the distances seen in 2014 and 2015.
There is a relationship between the distance moved and the level of supply in the market. As the vacancy rate falls, occupiers tend to be more willing to move further away to find the type of accommodation they require but when there are higher vacancy rates, it is not as necessary for companies to shift as far from their current location.
Distance moved over time
0
1
2
3
4
5
6
7
0.0
0.2
0.4
0.6
0.8
1.0
1.2
1.4
1.6
2012 2013 2014 2015 2016
Vacancy R
atesM
iles
Average distance moved Vacancy rates
13Cushman & Wakefield | Movers & Shakers
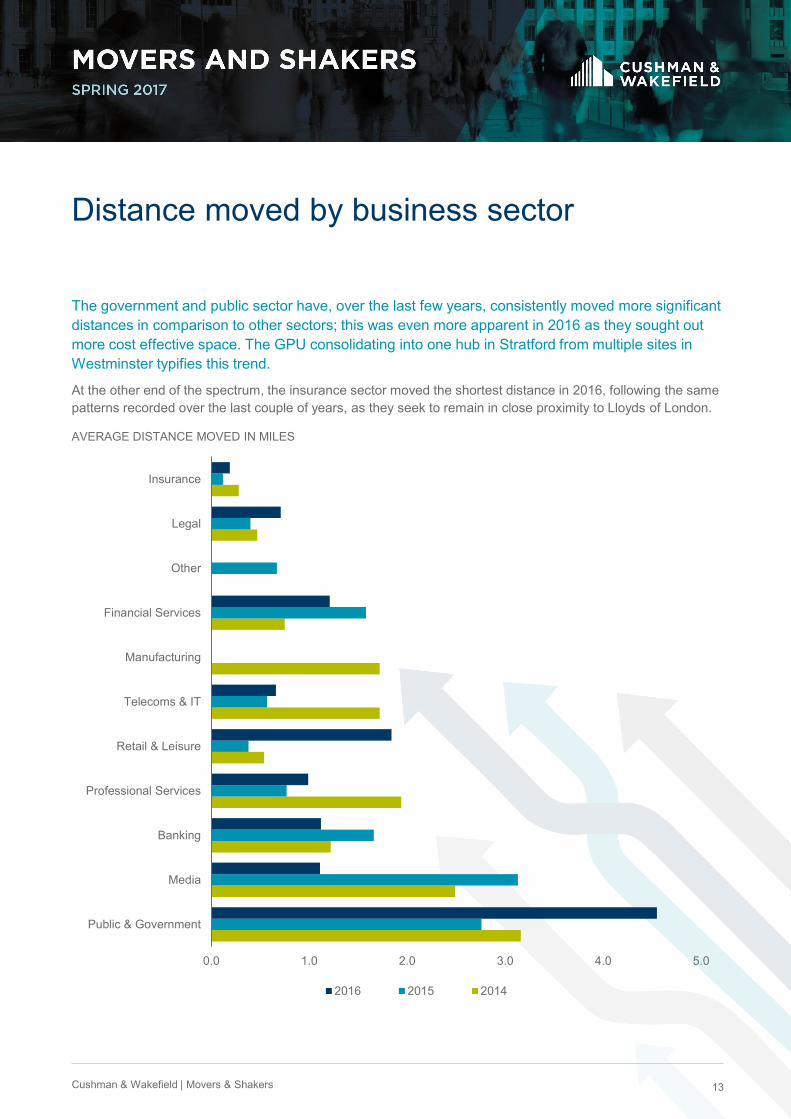
The government and public sector have, over the last few years, consistently moved more significant distances in comparison to other sectors; this was even more apparent in 2016 as they sought out more cost effective space. The GPU consolidating into one hub in Stratford from multiple sites in Westminster typifies this trend.
At the other end of the spectrum, the insurance sector moved the shortest distance in 2016, following the same patterns recorded over the last couple of years, as they seek to remain in close proximity to Lloyds of London.
Distance moved by business sector
0.0 1.0 2.0 3.0 4.0 5.0
Public & Government
Media
Banking
Professional Services
Retail & Leisure
Telecoms & IT
Manufacturing
Financial Services
Other
Legal
Insurance
2016 2015 2014
AVERAGE DISTANCE MOVED IN MILES
14Cushman & Wakefield | Movers & Shakers
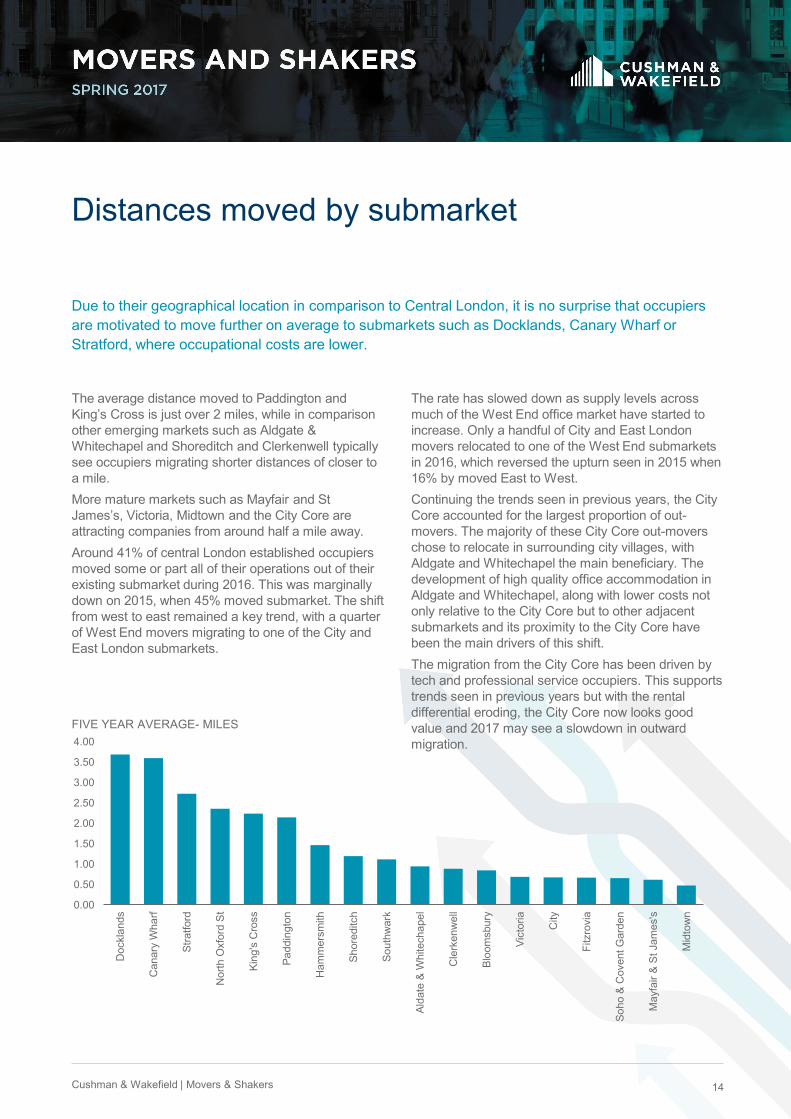
Due to their geographical location in comparison to Central London, it is no surprise that occupiers are motivated to move further on average to submarkets such as Docklands, Canary Wharf or Stratford, where occupational costs are lower.
Distances moved by submarket
The average distance moved to Paddington and King’s Cross is just over 2 miles, while in comparison other emerging markets such as Aldgate & Whitechapel and Shoreditch and Clerkenwell typically see occupiers migrating shorter distances of closer to a mile.More mature markets such as Mayfair and St James’s, Victoria, Midtown and the City Core are attracting companies from around half a mile away.Around 41% of central London established occupiers moved some or part all of their operations out of their existing submarket during 2016. This was marginally down on 2015, when 45% moved submarket. The shift from west to east remained a key trend, with a quarter of West End movers migrating to one of the City and East London submarkets.
The rate has slowed down as supply levels across much of the West End office market have started to increase. Only a handful of City and East London movers relocated to one of the West End submarkets in 2016, which reversed the upturn seen in 2015 when 16% by moved East to West. Continuing the trends seen in previous years, the City Core accounted for the largest proportion of out-movers. The majority of these City Core out-movers chose to relocate in surrounding city villages, with Aldgate and Whitechapel the main beneficiary. The development of high quality office accommodation in Aldgate and Whitechapel, along with lower costs not only relative to the City Core but to other adjacent submarkets and its proximity to the City Core have been the main drivers of this shift. The migration from the City Core has been driven by tech and professional service occupiers. This supports trends seen in previous years but with the rental differential eroding, the City Core now looks good value and 2017 may see a slowdown in outward migration.
0.00
0.50
1.00
1.50
2.00
2.50
3.00
3.50
4.00
Doc
klan
ds
Can
ary
Wha
rf
Stra
tford
Nor
th O
xfor
d S
t
King
's C
ross
Padd
ingt
on
Ham
mer
smith
Shor
editc
h
Sout
hwar
k
Alda
te &
Whi
tech
apel
Cle
rken
wel
l
Bloo
msb
ury
Vict
oria
City
Fitz
rovi
a
Soho
& C
oven
t Gar
den
May
fair
& S
t Jam
es's
Mid
tow
n
FIVE YEAR AVERAGE- MILES
15Cushman & Wakefield | Movers & Shakers
0
2
4
6
8
10
12
14
City
cor
e
May
fair
Vic
toria
Fitz
rovi
a
Mid
tow
n
Cle
rken
wel
l & S
hore
ditc
h
St J
ames
's
Eus
ton
Nor
th o
f Oxf
ord
Stre
et
Sou
thba
nk
Ald
gate
& W
hite
chap
el
Blo
omsb
ury
Soh
o
Cam
den
Kin
gs C
ross
Cov
ent G
arde
n
Can
ary
Wha
rf
Num
ber o
f Tra
nsac
tions
Outmovers Inmovers
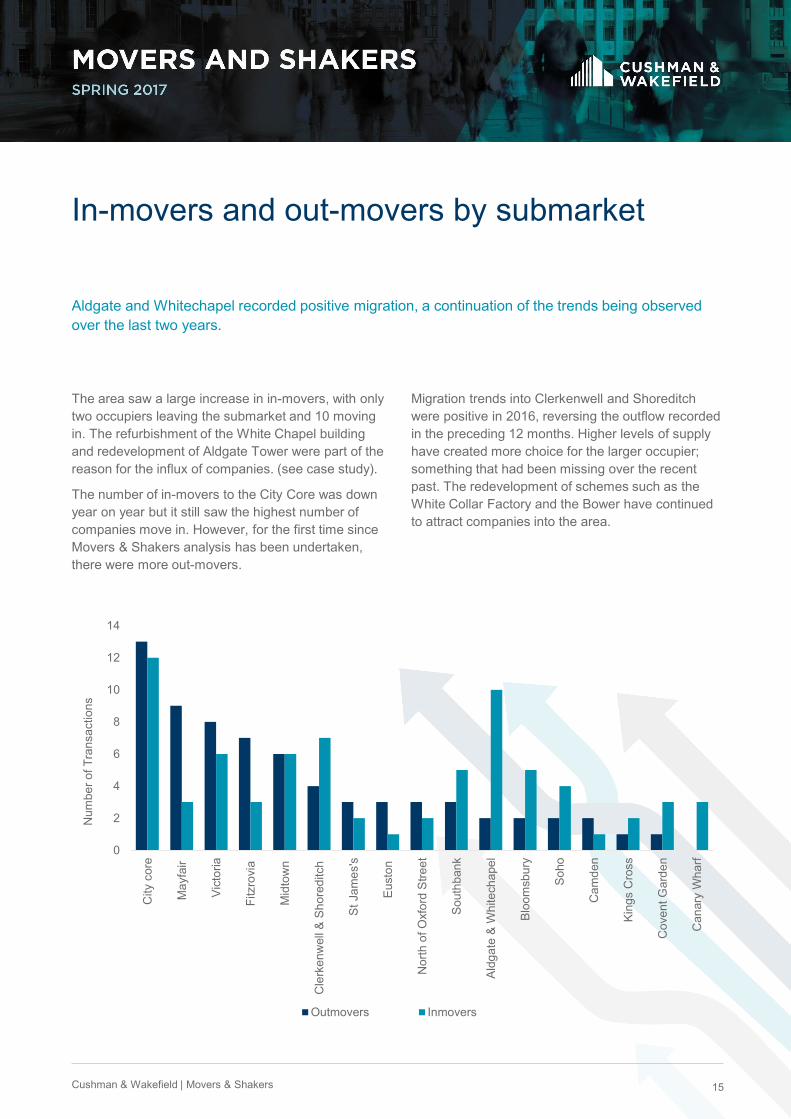
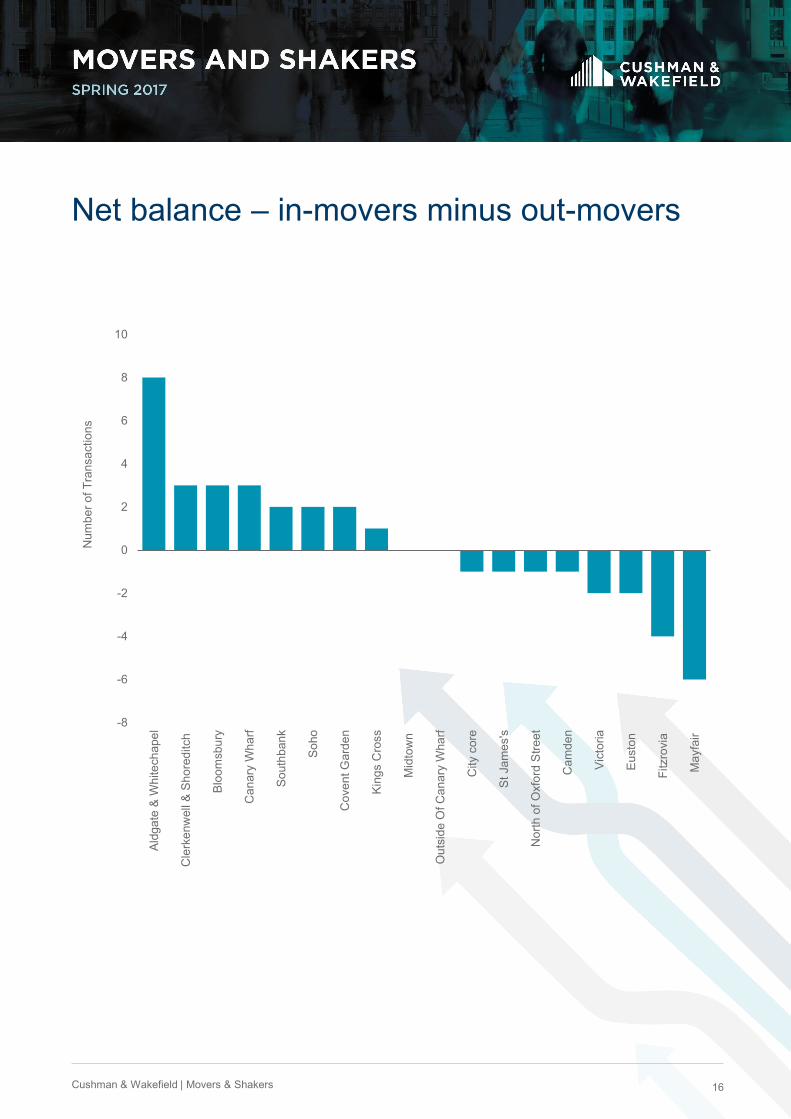
Aldgate and Whitechapel recorded positive migration, a continuation of the trends being observed over the last two years.
In-movers and out-movers by submarket
The area saw a large increase in in-movers, with only two occupiers leaving the submarket and 10 moving in. The refurbishment of the White Chapel building and redevelopment of Aldgate Tower were part of the reason for the influx of companies. (see case study).
The number of in-movers to the City Core was down year on year but it still saw the highest number of companies move in. However, for the first time since Movers & Shakers analysis has been undertaken, there were more out-movers.
Migration trends into Clerkenwell and Shoreditch were positive in 2016, reversing the outflow recorded in the preceding 12 months. Higher levels of supply have created more choice for the larger occupier; something that had been missing over the recent past. The redevelopment of schemes such as the White Collar Factory and the Bower have continued to attract companies into the area.
16Cushman & Wakefield | Movers & Shakers
-8
-6
-4
-2
0
2
4
6
8
10
Ald
gate
& W
hite
chap
el
Cle
rken
wel
l & S
hore
ditc
h
Blo
omsb
ury
Can
ary
Wha
rf
Sou
thba
nk
Soh
o
Cov
ent G
arde
n
Kin
gs C
ross
Mid
tow
n
Out
side
Of C
anar
y W
harf
City
cor
e
St J
ames
's
Nor
th o
f Oxf
ord
Stre
et
Cam
den
Vic
toria
Eus
ton
Fitz
rovi
a
May
fair
Num
ber o
f Tra
nsac
tions
Net balance – in-movers minus out-movers
17Cushman & Wakefield | Movers & Shakers
-50
-40
-30
-20
-10
0
10
20
30
40
City
cor
e
Can
ary
Wha
rf &
Doc
klan
ds
Ald
gate
& W
hite
chap
el
Vic
toria
Kin
gs C
ross
Fitz
rovi
a
Eus
ton
Mid
tow
n
Sou
thba
nk
Nor
th o
f Oxf
ord
Stre
et
Cle
rken
wel
l & S
hore
ditc
h
Soh
o &
Cov
ent G
arde
n
May
fair
& S
t Jam
es's
Num
ber o
f Tra
nsac
tions
2014 2015 2016
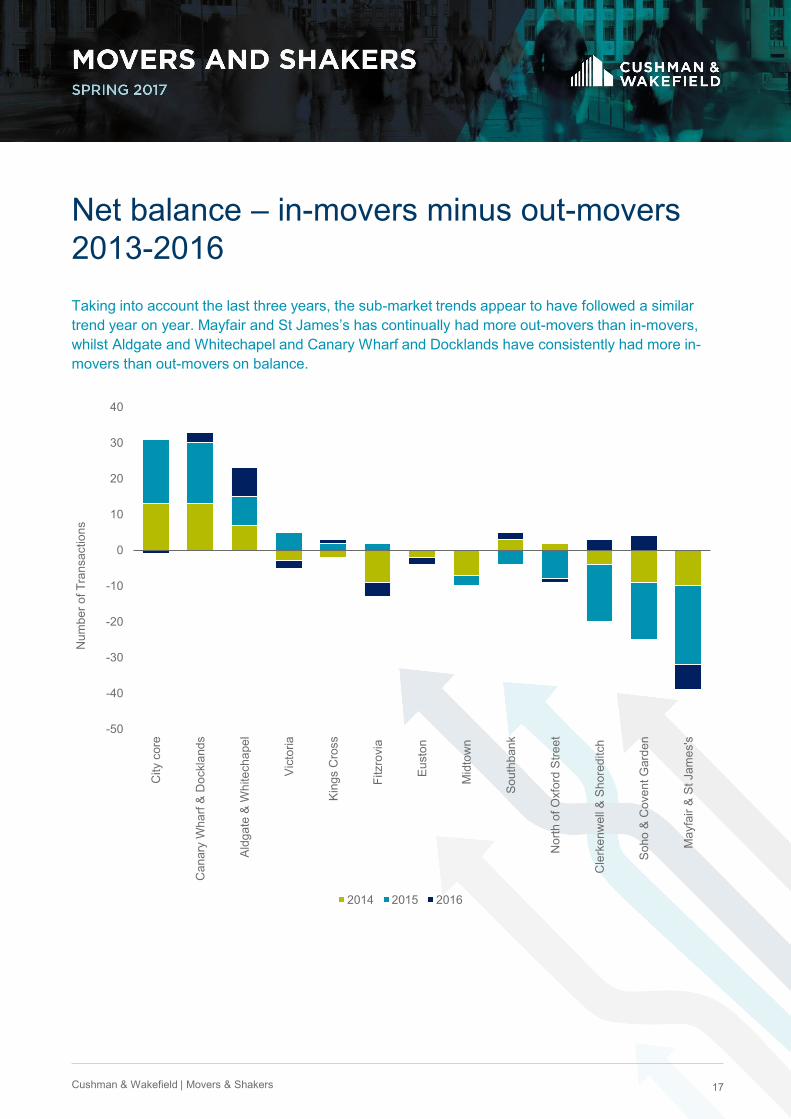
Taking into account the last three years, the sub-market trends appear to have followed a similar trend year on year. Mayfair and St James’s has continually had more out-movers than in-movers, whilst Aldgate and Whitechapel and Canary Wharf and Docklands have consistently had more in-movers than out-movers on balance.
Net balance – in-movers minus out-movers 2013-2016
18Cushman & Wakefield | Movers & Shakers
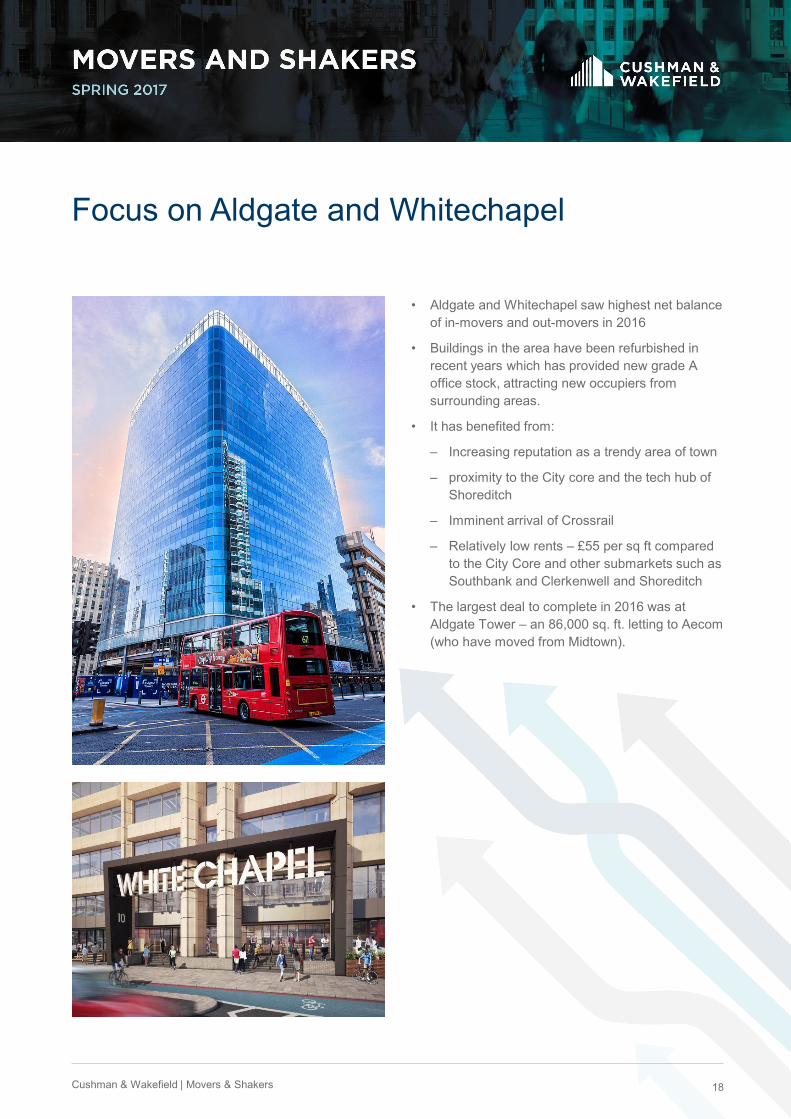
Focus on Aldgate and Whitechapel
• Aldgate and Whitechapel saw highest net balance of in-movers and out-movers in 2016
• Buildings in the area have been refurbished in recent years which has provided new grade A office stock, attracting new occupiers from surrounding areas.
• It has benefited from:
– Increasing reputation as a trendy area of town
– proximity to the City core and the tech hub of Shoreditch
– Imminent arrival of Crossrail
– Relatively low rents – £55 per sq ft compared to the City Core and other submarkets such as Southbank and Clerkenwell and Shoreditch
• The largest deal to complete in 2016 was at Aldgate Tower – an 86,000 sq. ft. letting to Aecom (who have moved from Midtown).
19Cushman & Wakefield | Movers & Shakers
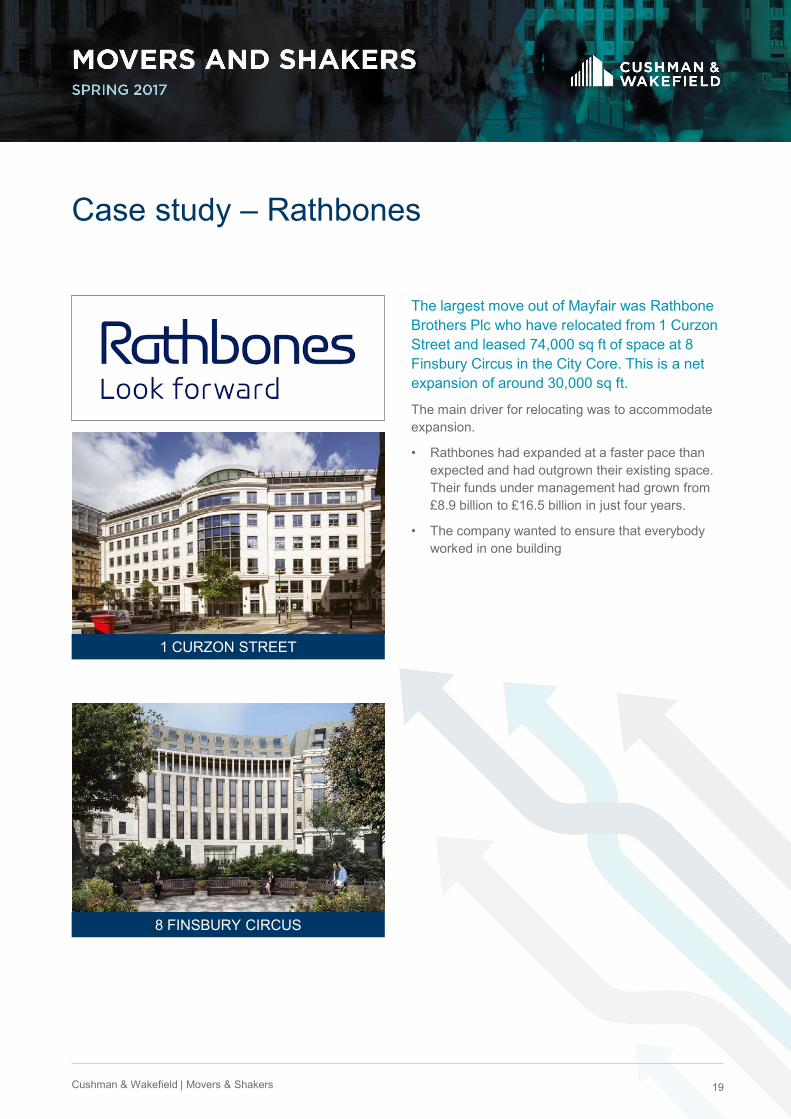
Case study – Rathbones
The largest move out of Mayfair was Rathbone Brothers Plc who have relocated from 1 Curzon Street and leased 74,000 sq ft of space at 8 Finsbury Circus in the City Core. This is a net expansion of around 30,000 sq ft.
The main driver for relocating was to accommodate expansion.
• Rathbones had expanded at a faster pace than expected and had outgrown their existing space. Their funds under management had grown from £8.9 billion to £16.5 billion in just four years.
• The company wanted to ensure that everybody worked in one building
8 FINSBURY CIRCUS
1 CURZON STREET
20Cushman & Wakefield | Movers & Shakers
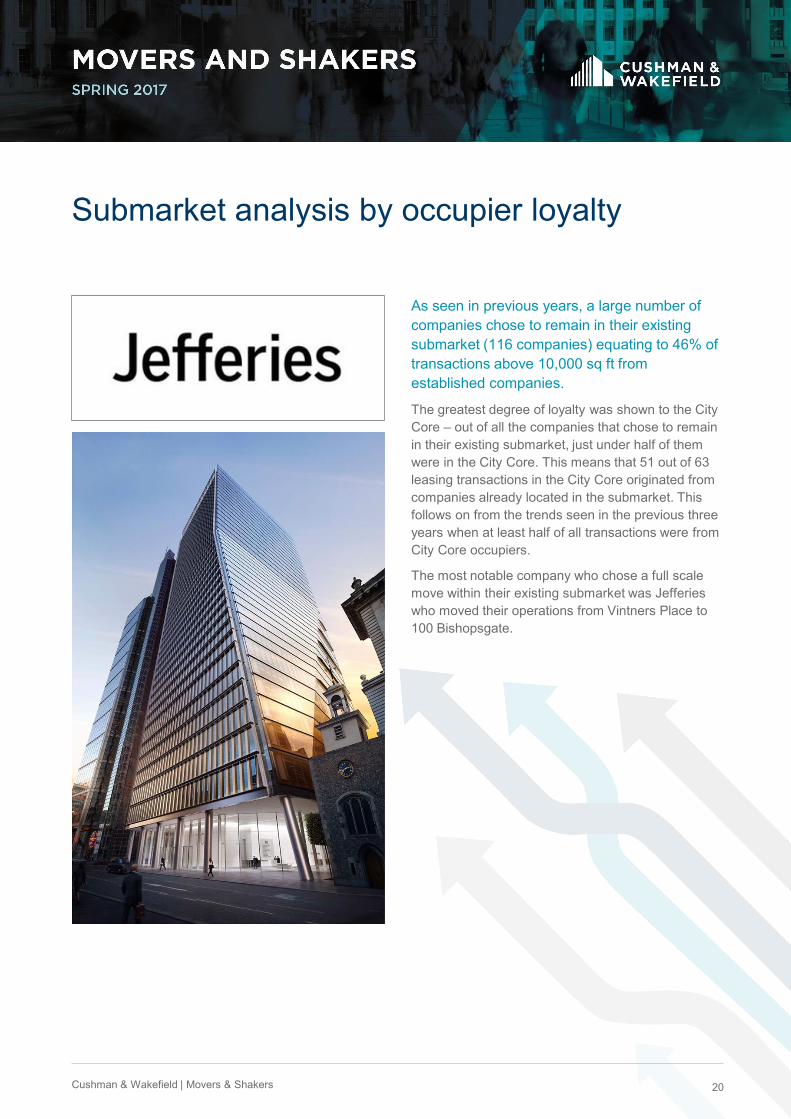
Submarket analysis by occupier loyalty
As seen in previous years, a large number of companies chose to remain in their existing submarket (116 companies) equating to 46% of transactions above 10,000 sq ft from established companies.
The greatest degree of loyalty was shown to the City Core – out of all the companies that chose to remain in their existing submarket, just under half of them were in the City Core. This means that 51 out of 63 leasing transactions in the City Core originated from companies already located in the submarket. This follows on from the trends seen in the previous three years when at least half of all transactions were from City Core occupiers.
The most notable company who chose a full scale move within their existing submarket was Jefferies who moved their operations from Vintners Place to 100 Bishopsgate.
19 new
companiesmade London their home. Where did they go?
New operations
22Cushman & Wakefield | Movers & Shakers
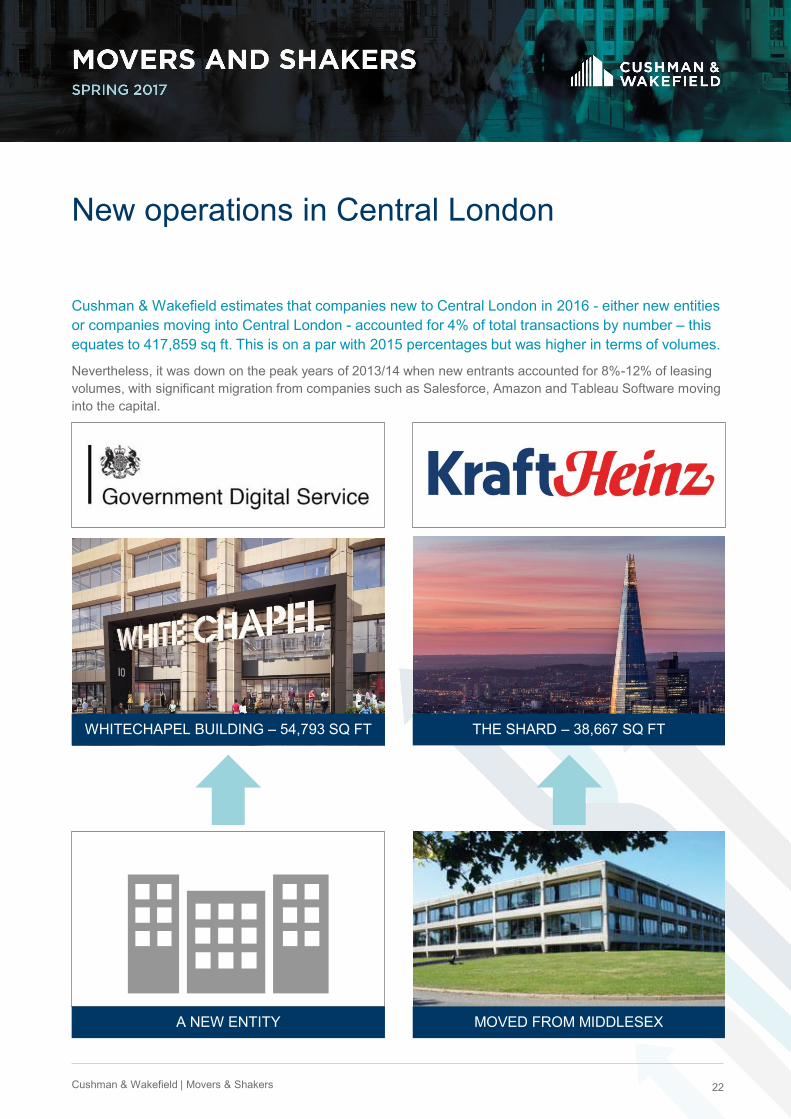
Cushman & Wakefield estimates that companies new to Central London in 2016 - either new entities or companies moving into Central London - accounted for 4% of total transactions by number – this equates to 417,859 sq ft. This is on a par with 2015 percentages but was higher in terms of volumes.
Nevertheless, it was down on the peak years of 2013/14 when new entrants accounted for 8%-12% of leasing volumes, with significant migration from companies such as Salesforce, Amazon and Tableau Software moving into the capital.
New operations in Central London
THE SHARD – 38,667 SQ FT WHITECHAPEL BUILDING – 54,793 SQ FT
MOVED FROM MIDDLESEXA NEW ENTITY
23Cushman & Wakefield | Movers & Shakers
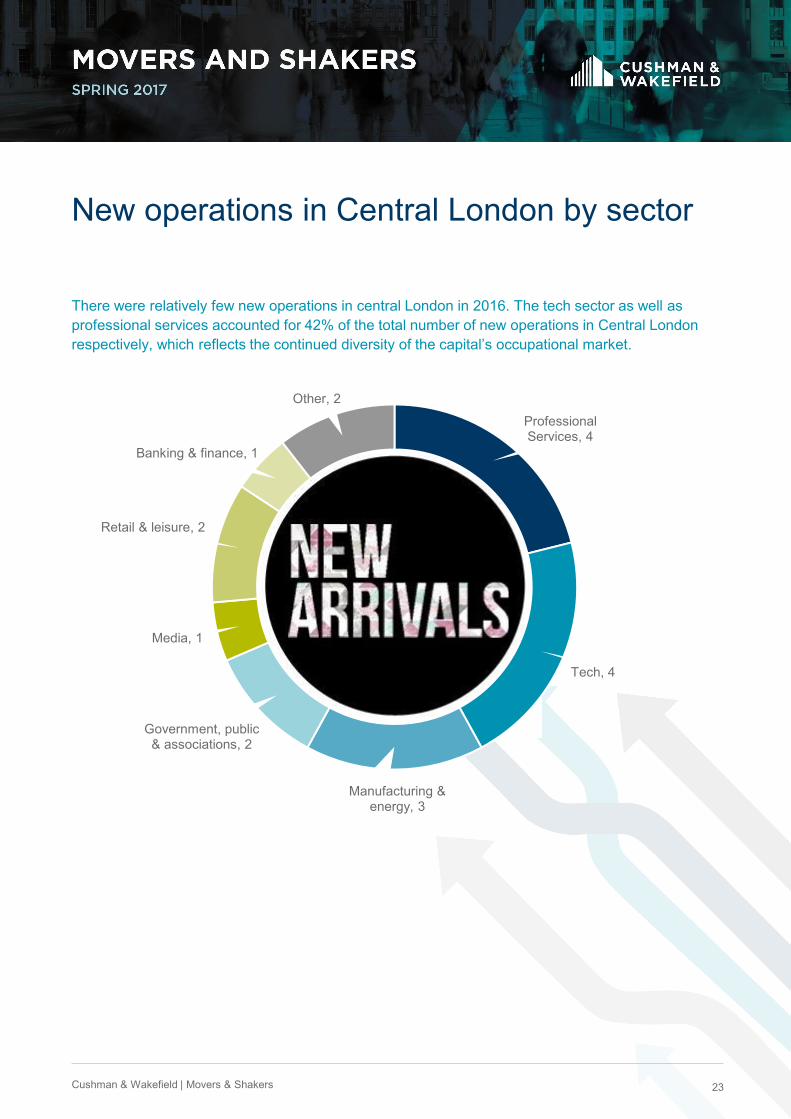
Professional Services, 4
Tech, 4
Manufacturing & energy, 3
Government, public & associations, 2
Media, 1
Retail & leisure, 2
Banking & finance, 1
Other, 2
There were relatively few new operations in central London in 2016. The tech sector as well as professional services accounted for 42% of the total number of new operations in Central London respectively, which reflects the continued diversity of the capital’s occupational market.
New operations in Central London by sector
24Cushman & Wakefield | Movers & Shakers
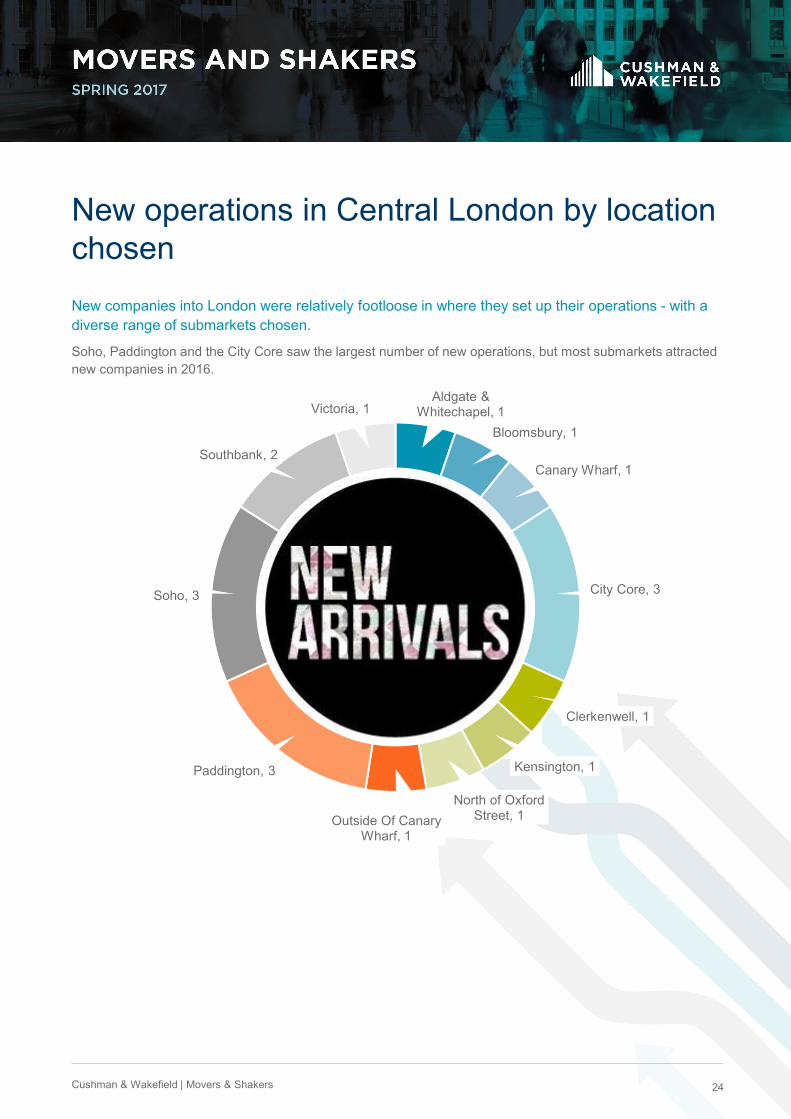
Aldgate & Whitechapel, 1
Bloomsbury, 1
Canary Wharf, 1
City Core, 3
Clerkenwell, 1
Kensington, 1
North of Oxford Street, 1Outside Of Canary
Wharf, 1
Paddington, 3
Soho, 3
Southbank, 2
Victoria, 1
New companies into London were relatively footloose in where they set up their operations - with a diverse range of submarkets chosen.
Soho, Paddington and the City Core saw the largest number of new operations, but most submarkets attracted new companies in 2016.
New operations in Central London by location chosen
25Cushman & Wakefield | Movers & Shakers
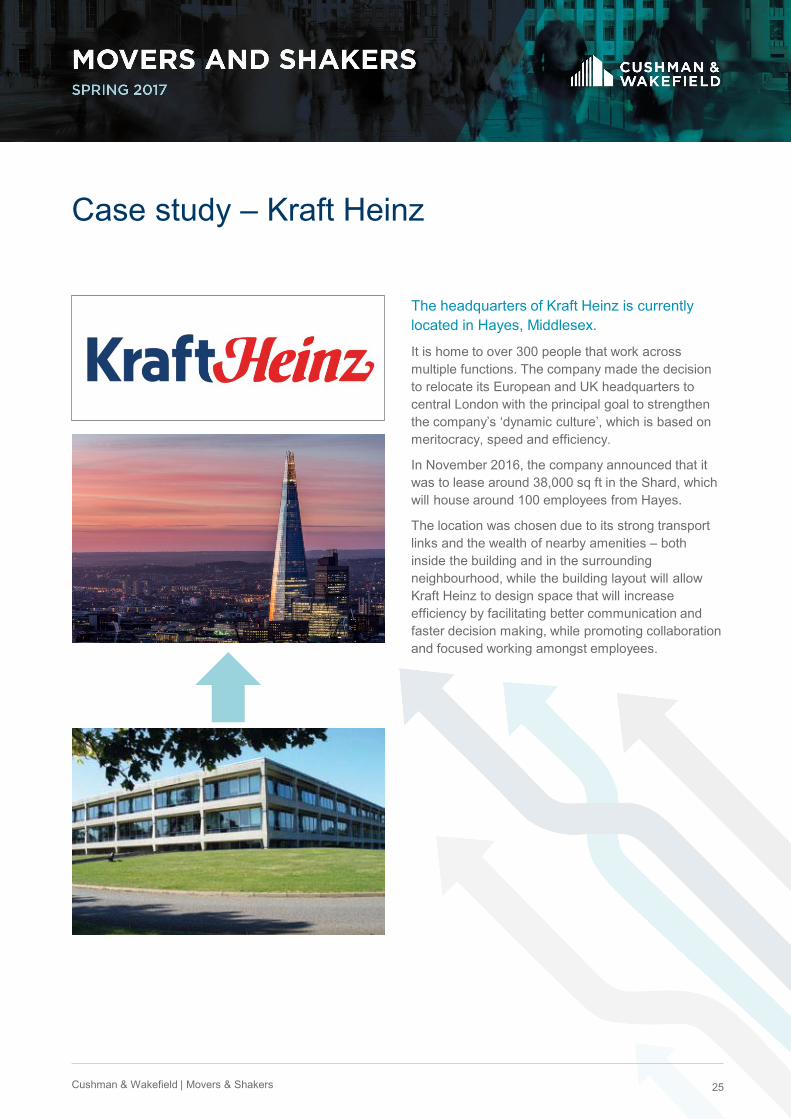
Case study – Kraft Heinz
The headquarters of Kraft Heinz is currently located in Hayes, Middlesex.
It is home to over 300 people that work across multiple functions. The company made the decision to relocate its European and UK headquarters to central London with the principal goal to strengthen the company’s ‘dynamic culture’, which is based on meritocracy, speed and efficiency.
In November 2016, the company announced that it was to lease around 38,000 sq ft in the Shard, which will house around 100 employees from Hayes.
The location was chosen due to its strong transport links and the wealth of nearby amenities – both inside the building and in the surrounding neighbourhood, while the building layout will allow Kraft Heinz to design space that will increase efficiency by facilitating better communication and faster decision making, while promoting collaboration and focused working amongst employees.
26Cushman & Wakefield | Movers & Shakers
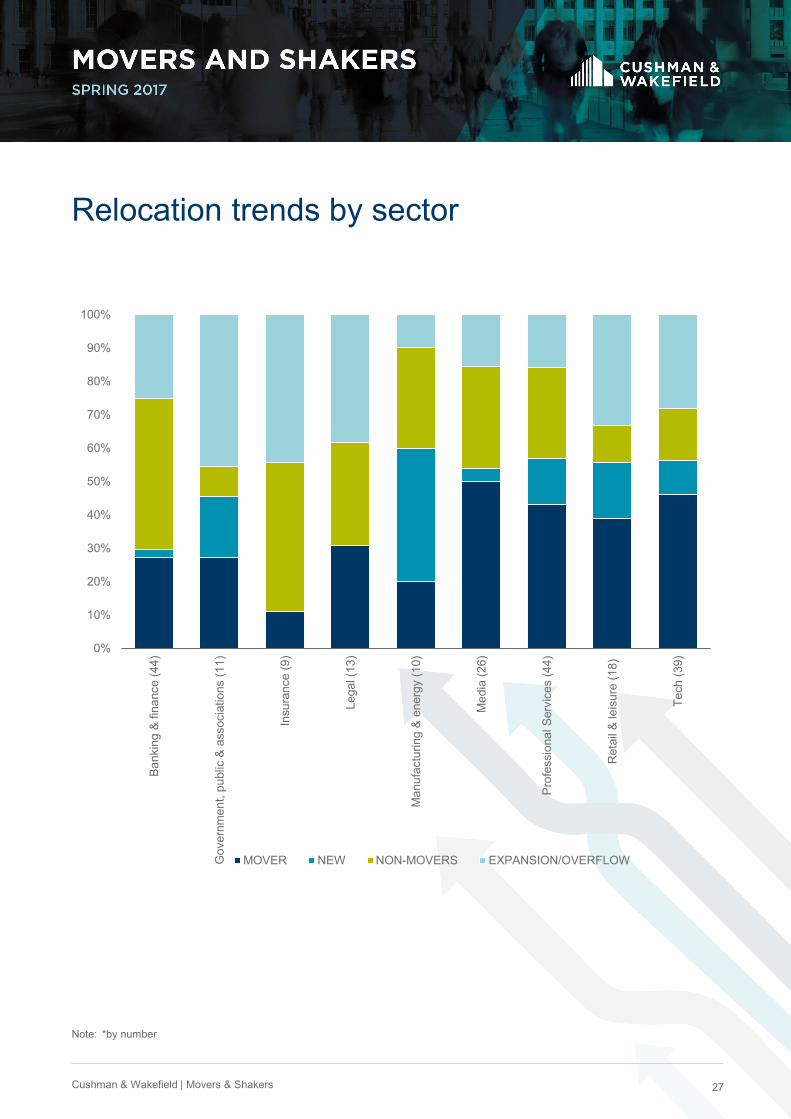
As in previous years, tech companies showed the greatest willingness to move location, with 18 occupiers relocating submarket, and only six remaining in their existing sub-market.
There were four tech companies new to London, and a further 11 companies took expansion space in their existing submarkets.
Tech occupiers who moved submarkets relocated from a variety of locations. The greatest loser was the City core (six occupiers moving out) while the biggest winner was Aldgate and Whitechapel (four occupiers moved in).
Media companies were also relatively footloose, continuing the trends seen in previous years. Half of media companies moved submarkets but there was no dominant location chosen by the sector. A number of media companies moved their operations to Southbank, as the area cements its reputation as an established media hub. These included Dods Publishing, who relocated to the Shard, and Brands2Life, who moved to the Blue Fin Building both migrating from Victoria. As in 2015, the sector was one of the main drivers of the west to east migration.
‘Hopes pinned on tech sector riding to London’s rescue in post-Brexit world’
Relocation trends by sector
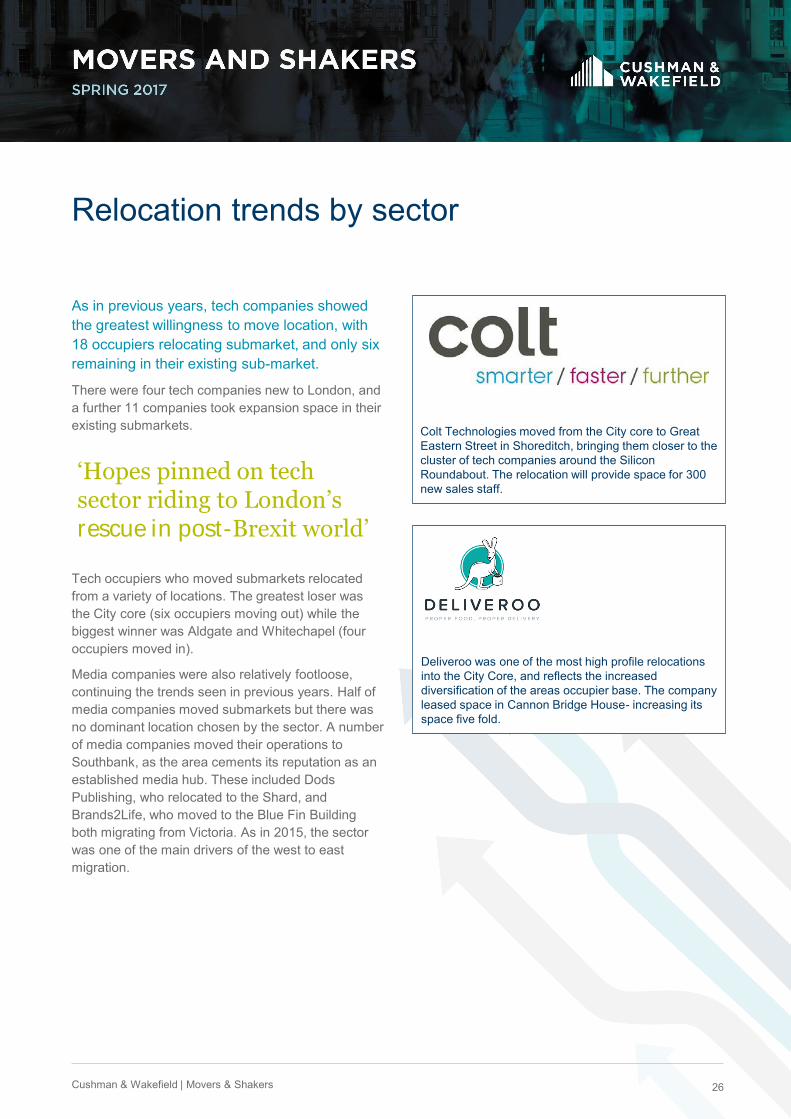
Colt Technologies moved from the City core to Great Eastern Street in Shoreditch, bringing them closer to the cluster of tech companies around the Silicon Roundabout. The relocation will provide space for 300 new sales staff.
Deliveroo was one of the most high profile relocations into the City Core, and reflects the increased diversification of the areas occupier base. The company leased space in Cannon Bridge House- increasing its space five fold.
27Cushman & Wakefield | Movers & Shakers
Note: *by number
0%
10%
20%
30%
40%
50%
60%
70%
80%
90%
100%
Ban
king
& fi
nanc
e (4
4)
Gov
ernm
ent,
publ
ic &
ass
ocia
tions
(11)
Insu
ranc
e (9
)
Lega
l (13
)
Man
ufac
turin
g &
ene
rgy
(10)
Med
ia (2
6)
Pro
fess
iona
l Ser
vice
s (4
4)
Ret
ail &
leis
ure
(18)
Tech
(39)
MOVER NEW NON-MOVERS EXPANSION/OVERFLOW
Relocation trends by sector
28Cushman & Wakefield | Movers & Shakers
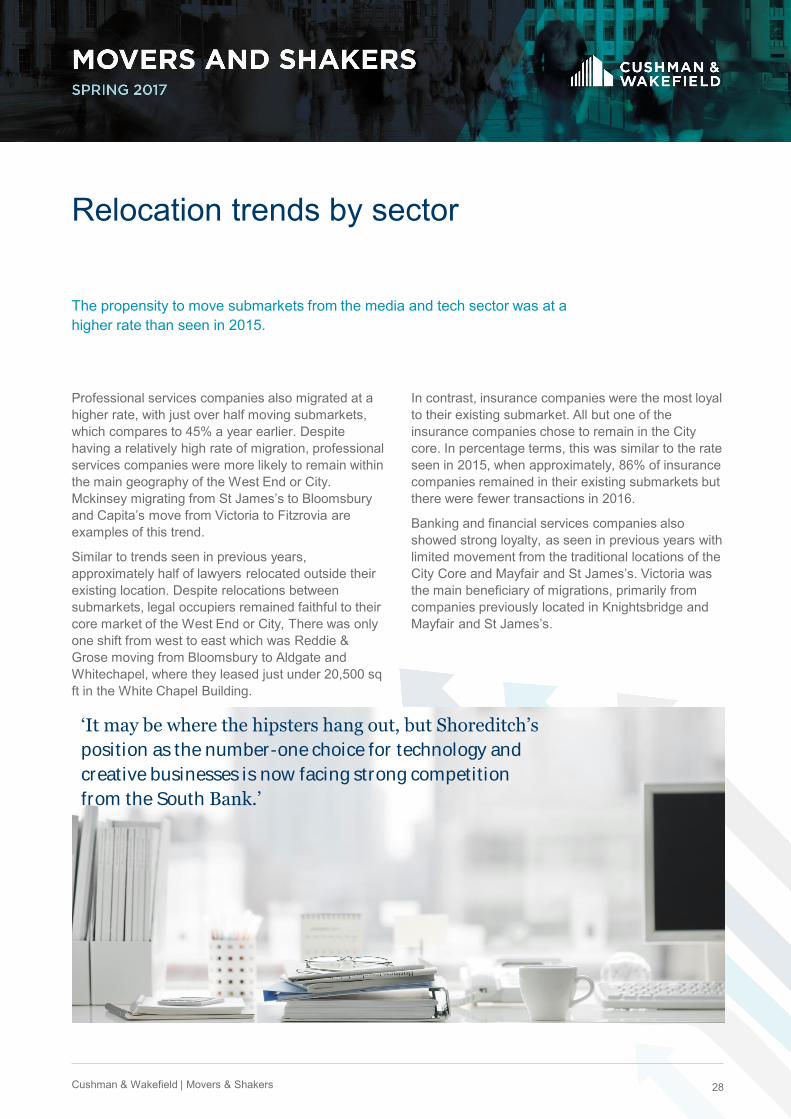
‘It may be where the hipsters hang out, but Shoreditch’s
position as the number-one choice for technology and
creative businesses is now facing strong competition
from the South Bank.’
The propensity to move submarkets from the media and tech sector was at a higher rate than seen in 2015.
Relocation trends by sector
Professional services companies also migrated at a higher rate, with just over half moving submarkets, which compares to 45% a year earlier. Despite having a relatively high rate of migration, professional services companies were more likely to remain within the main geography of the West End or City. Mckinsey migrating from St James’s to Bloomsbury and Capita’s move from Victoria to Fitzrovia are examples of this trend.
Similar to trends seen in previous years, approximately half of lawyers relocated outside their existing location. Despite relocations between submarkets, legal occupiers remained faithful to their core market of the West End or City, There was only one shift from west to east which was Reddie & Grose moving from Bloomsbury to Aldgate and Whitechapel, where they leased just under 20,500 sq ft in the White Chapel Building.
In contrast, insurance companies were the most loyal to their existing submarket. All but one of the insurance companies chose to remain in the City core. In percentage terms, this was similar to the rate seen in 2015, when approximately, 86% of insurance companies remained in their existing submarkets but there were fewer transactions in 2016.
Banking and financial services companies also showed strong loyalty, as seen in previous years with limited movement from the traditional locations of the City Core and Mayfair and St James’s. Victoria was the main beneficiary of migrations, primarily from companies previously located in Knightsbridge and Mayfair and St James’s.
29Cushman & Wakefield | Movers & Shakers
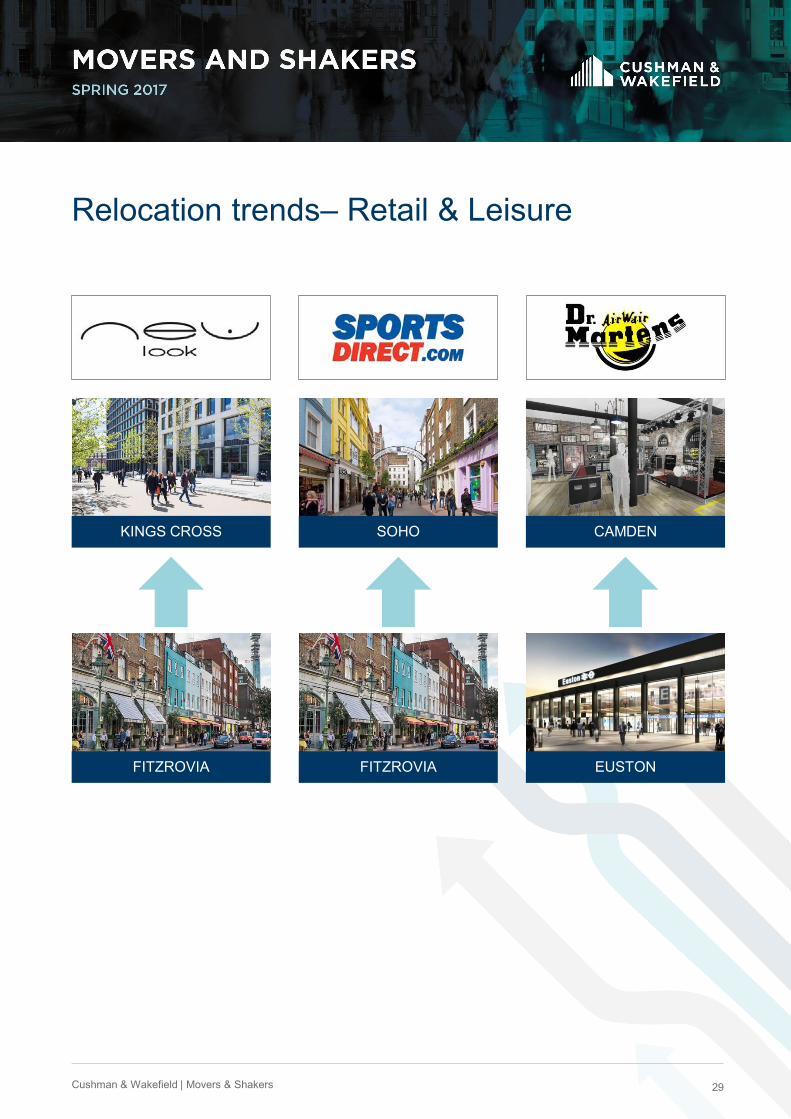
Relocation trends– Retail & Leisure
CAMDEN
EUSTON
KINGS CROSS
FITZROVIA
SOHO
FITZROVIA
30Cushman & Wakefield | Movers & Shakers
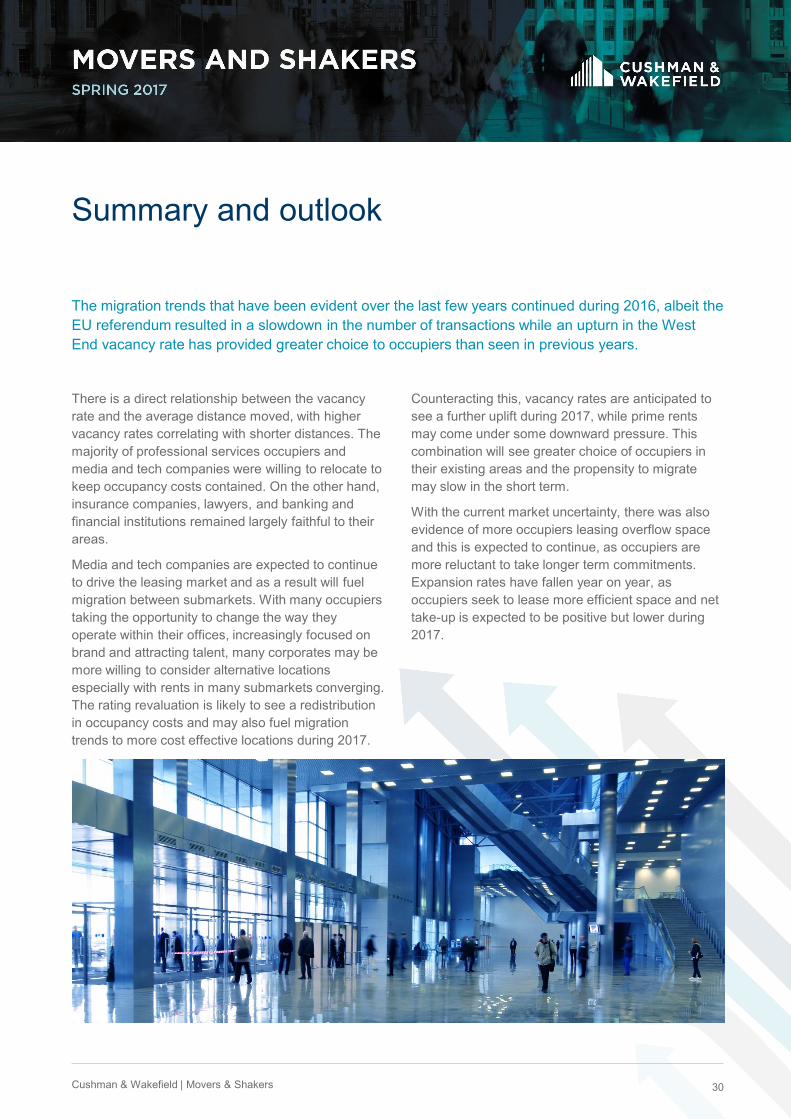
The migration trends that have been evident over the last few years continued during 2016, albeit the EU referendum resulted in a slowdown in the number of transactions while an upturn in the West End vacancy rate has provided greater choice to occupiers than seen in previous years.
Summary and outlook
There is a direct relationship between the vacancy rate and the average distance moved, with higher vacancy rates correlating with shorter distances. The majority of professional services occupiers and media and tech companies were willing to relocate to keep occupancy costs contained. On the other hand, insurance companies, lawyers, and banking and financial institutions remained largely faithful to their areas.
Media and tech companies are expected to continue to drive the leasing market and as a result will fuel migration between submarkets. With many occupiers taking the opportunity to change the way they operate within their offices, increasingly focused on brand and attracting talent, many corporates may be more willing to consider alternative locations especially with rents in many submarkets converging. The rating revaluation is likely to see a redistribution in occupancy costs and may also fuel migration trends to more cost effective locations during 2017.
Counteracting this, vacancy rates are anticipated to see a further uplift during 2017, while prime rents may come under some downward pressure. This combination will see greater choice of occupiers in their existing areas and the propensity to migrate may slow in the short term.
With the current market uncertainty, there was also evidence of more occupiers leasing overflow space and this is expected to continue, as occupiers are more reluctant to take longer term commitments. Expansion rates have fallen year on year, as occupiers seek to lease more efficient space and net take-up is expected to be positive but lower during 2017.

Elaine RossallPartner
London Markets Research & Insight
This information contained in this report is for information purposes only. Accordingly, the information contained herein should not be relied upon or used as a basis for any business decision. Any such decision should be based only on suitable and specific professional advice. This report is not directed to, or intended for distribution or use in, any jurisdiction where such distribution or use would be prohibited. To the extent permitted by law, Cushman & Wakefield accepts no duty of care and cannot be held responsible or liable for any loss or damages which may be incurred by any person (directly or indirectly) as a consequence of relying or otherwise acting on the information contained in this report.
© Cushman & Wakefield 2017
Christopher DunnLondon Markets Research & Insight
Hayley ArmstrongLondon Markets Research & Insight