Embed Size (px)
Citation preview

Movement patterns of Brook Trout in a restoredcoastal stream system in southern MassachusettsErin L. Snook1, Benjamin H. Letcher2, Todd L. Dubreuil2, Joseph Zydlewski3, Matthew J. O’Donnell2,Andrew R. Whiteley1, Stephen T. Hurley4, Andy J. Danylchuk11Department of Environmental Conservation, University of Massachusetts, Amherst, MA, USA2U.S. Geological Survey, Silvio Conte Anadromous Fish Research Center, Turners Falls, MA, USA3U.S. Geological Survey, Maine Cooperative Fish and Wildlife Research Unit, University of Maine, Orono, ME, USA4Massachusetts Division of Fisheries and Wildlife, Southeast District, Buzzards Bay, MA, USA
Accepted for publication January 9, 2015
Abstract – Coastal Brook Trout (Salvelinus fontinalis) populations are found from northern Canada to New England.The extent of anadromy generally decreases with latitude, but the ecology and movements of more southernpopulations are poorly understood. We conducted a 33-month acoustic telemetry study of Brook Trout in Red Brook,MA, and adjacent Buttermilk Bay (marine system) using 16 fixed acoustic receivers and surgically implanting acoustictransmitters in 84 individuals. Tagged Brook Trout used the stream, estuary (50% of individuals) and bay (10% ofindividuals). Movements into full sea water were brief when occurring. GAMM models revealed that transitionsbetween habitat areas occurred most often in spring and fall. Environmental data suggest that use of the salineenvironment is limited by summer temperatures in the bay. Movements may also be related to moon phase. Comparedto more northern coastal populations of Brook Trout, the Red Brook population appears to be less anadromous overall,yet the estuarine segment of the system may have considerable ecological importance as a food resource.
Key words: Brook Trout; salvelinus; anadromy; migration; acoustic telemetry
Introduction
Anadromous populations of Brook Trout (Salvelinusfontinalis), also known as brook charr, occur along thecoast of northeast North America from Long Island,NY, to northern Canada (Ryther 1997). Brook Troutare thought to be the least anadromous of salmonidsbecause of factors including total time spent at sea,extent of migration into the sea and occurrence offreshwater forms (Rounsefell 1957; Hutchings & Mor-ris 1985). Migration for Brook Trout is not obligatory,occurring only in populations with access to the mar-ine environment and even then only in certain individ-uals within populations (Rounsefell 1957; Power1980). Evolutionarily, this partial-facultative anadr-omy in brook trout is likely the result of freshwaterforms emerging from anadromous individuals (Curryet al. 2010). Several studies have indicated a lesserdegree of anadromy in Brook Trout and populationsof other salmonid species as one moves southward inthe Northern Hemisphere (Rounsefell 1958; Nordeng1961; Vladykov 1963; Scott & Crossman 1973).
Adoption of the resident or anadromous life his-tory appears to be highly environmentally sensitive(Curry et al. 2010), and growth rate and growthrate efficiency appear to be the most importantproximate factors linked to their expression (Morin-ville and Rasmussen 2003; Theriault et al. 2007).Once migration to the ocean is initiated, specifictriggers, such as water flow, decrease in water tem-perature and moon phase, and social interactionhave been reported for some salmonids (Castonguayet al. 1982; Hutchings & Myers 1994, Sykes et al.2009, Hvidsten et al. 1995; Curry et al. 2006). Paststudies have found that Brook Trout movement hasseasonal peaks. Upstream movement is most pro-nounced from April through June (Mullan 1958;Smith & Saunders 1958) and from July to Septem-ber as Brook Trout move upstream to spawninggrounds (Lenormand et al. 2004, Curry et al.2006). Total time spent in the marine environmenthas been documented from an average of 65 to150 days, but is highly variable among BrookTrout populations, and evidence suggests it
Correspondence: E. Snook, USGS Leetown Science Center, 11649 Leetown Rd Kearneysville, WV 25430, USA. E-mail: [email protected]
doi: 10.1111/eff.12216 1
Ecology of Freshwater Fish 2015 � 2015 John Wiley & Sons A/S. Published by John Wiley & Sons Ltd
ECOLOGY OFFRESHWATER FISH
decreases in more southern populations (White1942; Naiman et al. 1987; Curry et al. 2006).Understanding the degree of anadromy for Brook
Trout in coastal streams is imperative for their conser-vation and management. Life-history diversity in pop-ulations of an individual species, such as migratorytendency in Brook Trout, provides greater resiliencefor a species and enhances ecosystem services thatspecies provides (Schindler et al. 2010). Consideringthat worldwide rates of population extinction are threetimes greater than species extinction (Hughes et al.1997), documenting and preserving life-history diver-sity is worthwhile. Habitat degradation including thedestruction and modification of freshwater and estua-rine habitats is the most common factor associatedwith declines in anadromous salmonids (Nehlsen et al.1991) and impacts more than 50% of Massachusettssubwatersheds (Eastern Brook Trout: Status andThreats, Eastern Brook Trout Join Venture 2006).Anadromous fish populations that become isolated bydams often experience a loss of migratory tendency,
as observed in white-spotted char (Salvelinus leuco-maenis; Morita et al. 2009). This can reduce popula-tion size, increase the risk for local extinction andpossibly increase the risk for system-wide (metapopu-lation) extinctions (Letcher et al. 2007).Red Brook in south-eastern Massachusetts is an
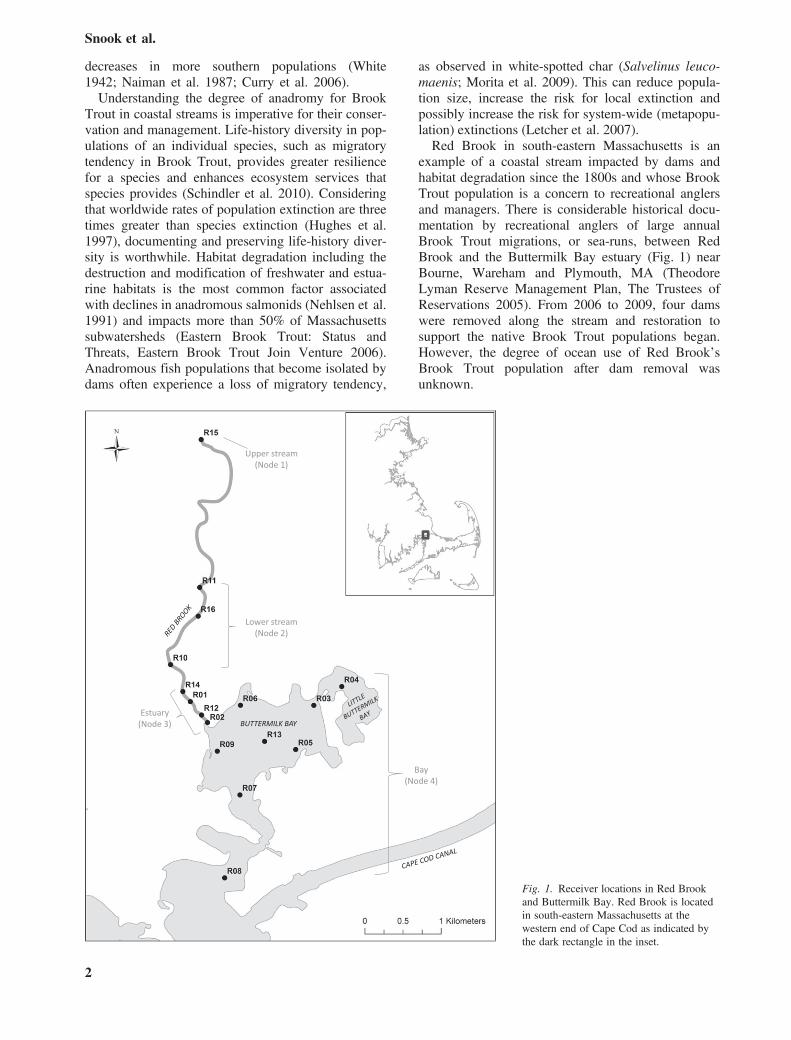
example of a coastal stream impacted by dams andhabitat degradation since the 1800s and whose BrookTrout population is a concern to recreational anglersand managers. There is considerable historical docu-mentation by recreational anglers of large annualBrook Trout migrations, or sea-runs, between RedBrook and the Buttermilk Bay estuary (Fig. 1) nearBourne, Wareham and Plymouth, MA (TheodoreLyman Reserve Management Plan, The Trustees ofReservations 2005). From 2006 to 2009, four damswere removed along the stream and restoration tosupport the native Brook Trout populations began.However, the degree of ocean use of Red Brook’sBrook Trout population after dam removal wasunknown.
BUTTERMILK BAY
Upper stream(Node 1)
Lower stream(Node 2)
Bay(Node 4)
Estuary(Node 3)
Fig. 1. Receiver locations in Red Brookand Buttermilk Bay. Red Brook is locatedin south-eastern Massachusetts at thewestern end of Cape Cod as indicated bythe dark rectangle in the inset.
2
Snook et al.

The purpose of this study was to quantify BrookTrout movement patterns within Red Brook and thecoastal waters of Buttermilk Bay. We employedacoustic telemetry to facilitate the contiguous moni-toring of Brook Trout among freshwater, estuarineand marine habitats (Curry et al. 2006). Studying themovements of anadromous Brook Trout will help tocharacterise the biology and ecology of this speciesat its southern coastal range. Furthermore, the resultsof this study will help to inform management deci-sions as more degraded coastal streams are restoredto promote Brook Trout populations.
Methods
Study site
Red Brook is a small coastal stream in south-easternMassachusetts (41°45028.70″N, 70°37020.77″W) thatflows into Buttermilk Bay. It is a 7.25-km, low-gradi-ent stream with an average width of 2 m and averagedepth of 1 m. The headwaters of Red Brook are in acranberry bog where the water flow is partially regu-lated. Average daily stream temperatures in RedBrook range from 0 to 21 °C. Substrate in the area ismainly glacial till through which groundwater seepsfrom the Plymouth Carver Aquifer (Moog 1987, Val-iela & Costa 1988). Springs in the stream create coldpools throughout the year. Red Brook is the largestsource of freshwater input into Buttermilk Bay (withdischarges of 8,360,255 m3�year�1 in 1985 and14,311,866 m3�year�1 in 1986) (Moog 1987).Buttermilk Bay is located at the northern end of
Buzzards Bay, bordered by the towns of Plymouth,Wareham and Bourne and densely populated byhumans. Buttermilk Bay has a surface area of
2.14 km2 and a mean low water depth of 0.9 m, andit experiences two tidal cycles per day with a meantidal range of 1 m (Valiela & Costa 1988). Valiela &Costa (1988) observed salinity stratification only nearthe mouth of streams or along beaches with ground-water discharge and noted that water in the centre ofButtermilk Bay is fresher than the average ButtermilkBay salinity of 30.9 ppt.Mean daily stream temperature over the study per-
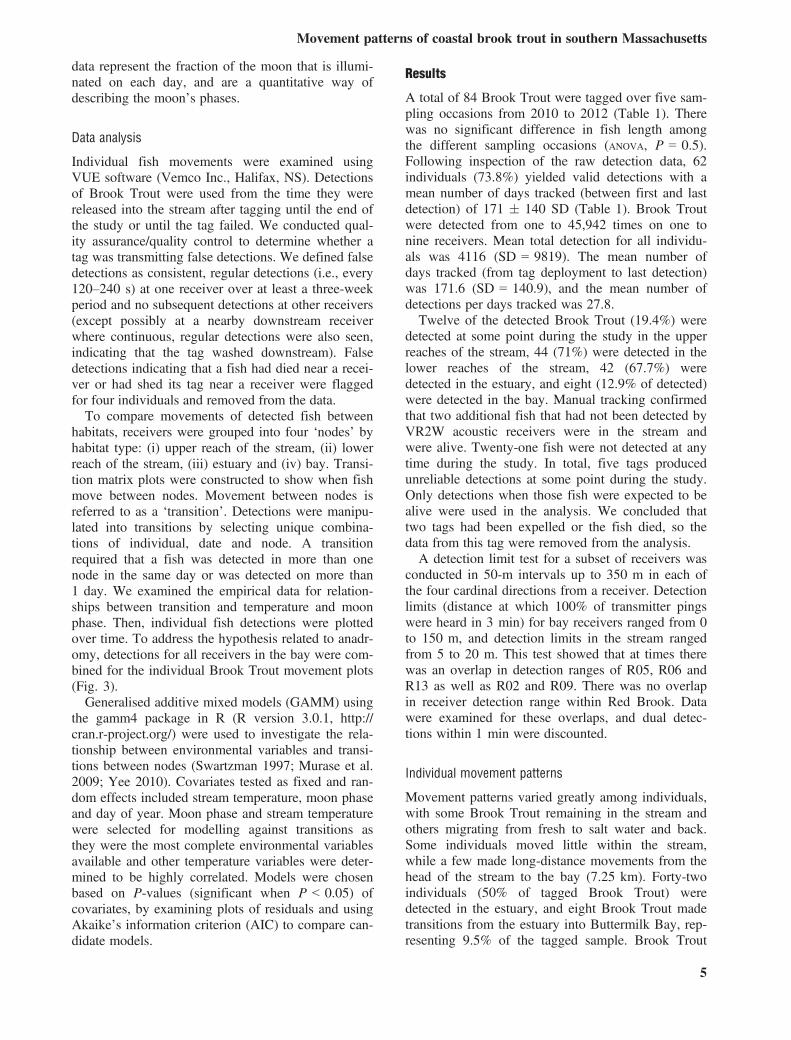
iod was 11 °C (�4.8), while mean daily temperaturein Buttermilk Bay just outside the mouth of RedBrook was 13.1 °C (�6.4) over 411 days (06 Octo-ber 2011–20 December 2012). In fall and spring,Buttermilk Bay temperatures were just above streamtemperature; in the winter, the bay was colder; and inthe summer, the bay was much warmer than thestream (Fig. 2). Average mean daily temperatureacross all loggers in Buttermilk Bay was 10.6 °C(�5.2) over 264 days (06 October 2011–28 June2012).
Acoustic receiver array
Acoustic telemetry is the most practical technique fortracking fish that use both freshwater streams andmarine environments (see Koehn 2003, Cooke et al.2012). Sixteen fixed acoustic receivers (VR2W,Vemco Inc., Halifax, NS) were deployed throughoutRed Brook, the estuary and Buttermilk Bay (Fig. 1).The region of greatest interest to this study is thezone where fish move from freshwater to salt water,so receivers were first placed in the lower part of thestream and estuary. Coverage of the mouth of theestuary opening into Buttermilk Bay was essential,because it is the entrance to the marine environment.To obtain greater coverage of migration patterns, two
0
5
10
15
20
25
Sep Oct
Nov
Dec Jan
Feb
Mar
Apr
May Jun
Jul
Aug
Sep Oct
Nov
Dec Jan
Date
Tem
pera
ture
Red Brook
Buttermilk Bay
Fig. 2. Mean daily temperature for RedBrook (stream) and Buttermilk Bay fromfall 2011 to winter 2011.
3
Movement patterns of coastal brook trout in southern Massachusetts

receivers (R10 and 11) were added upstream inpotential spawning and overwintering areas on 17February 2011. Two more receivers (R12 and 13)were added on 05 October 2011, another two (R14and 15) on 21 October 2011, and a final receiver(R16) on 07 February 2012 (Fig. 1). In total, onereceiver was placed at the headwaters of Red Brook,just below the cranberry bog, three receivers wereplaced at the mid to lower reach of the stream, fourwere placed in the estuary, and eight were placed inthe marine environment, which includes ButtermilkBay, Little Buttermilk Bay (a smaller, shallow bayconnected to eastern Buttermilk Bay) and the channelto Buzzards Bay.Receivers were moored to navigation aids or
attached to metal bars affixed to cement pavingstones and were placed with the transducer endpointing upward. A line attached to a buoy allowedfor easy location of and access to receivers in theestuary and bay. Because Brook Trout are likely toremain in shallow (<1.7 m), near-shore (<500 m)areas in marine environments (Curry et al. 2006)where they can take cover from predators and arelikely to find the most suitable prey items, most ofthe receivers in Buttermilk Bay were placed near theshore as detection nodes. Depth of stationary receiv-ers in Buttermilk Bay ranged from 1.2 to 2.6 mfrom the bottom. Two receivers were placed in thechannel from Buttermilk to Buzzards Bay to recordfish leaving the system. Receivers were inspectedevery 3–6 months, and detection data were down-loaded. A detection limit test was conducted todetermine possible overlap in receiver detectionranges. Several receivers were inadvertently removedor were lost due to wear on moorings or excessivewinter icing. They were replaced at the same site assoon as possible. As such, there are varying periodsof time for which some receivers were collectingdata. The final downloads of receivers occurred on14 March 2013.
Brook Trout tagging procedures
Brook Trout were captured using a backpack electro-fishing unit (FS 1001A-24DC Pelican Products, Tor-rance CA, USA) in Red Brook on five separateoccasions in the spring or the fall (avoiding spawningtimes). Beginning approximately 500 m upstream ofthe mouth, the stream was divided into sections thatwere individually fished. The sampling area ofapproximately 900 m of stream represents about 13%of Red Brook’s length. Sampling sections 1–5 are inareas where salt water has been detected (the head ofthe tide is usually between sections 4 and 5, nearReceiver 14). Fish from each section were retained inseparate labelled holding tanks prior to tagging.
Adult Brook Trout greater than 160 mm forklength (FL) were retained for tagging with acoustictransmitters. This size threshold was used to reducetag weight burden on Brook Trout. In addition, largerBrook Trout greater than 140 mm FL are able to sur-vive sea water (McCormick & Naiman 1984b). Fishto be tagged were transferred from the stream to atagging station <5 m away from the stream bank.Fish condition (e.g., coordinated movements, equilib-rium and opercular movements) was continuouslymonitored. Brook Trout were handled using wet soft-mesh nets and wetted hands to minimise injuriesrelated to transfer. Brook Trout were anesthetizedusing MS-222 (100 mg l�1), until stage 4 anaesthesiawas achieved, and fork length and mass were mea-sured (to the nearest mm and 0.1 g).Fish selected for tagging were then placed on a
wetted, wedged sponge for the surgical procedure.Transmitters and surgical tools were disinfected withisopropyl alcohol. A 20-mm incision was made usinga scalpel on the ventral surface between the pectoraland anal fin. Once the incision was made, a VemcoV9 acoustic transmitter (weighing 4.7 g in air, with arandom delay of 120–240 s at a frequency of69 kHz, estimated tag life 407 days, Vemco Inc.,Halifax, NS) was inserted. A PIT tag was alsoimplanted in each fish as part of a separate study.The incision was closed with two to three interruptedsutures (Ethicon 3-0, 2-mm-diameter monofilamentsynthetic absorbable suture with a CP-2 26-mmcurved, reverse cutting needle, Johnson and Johnson,New Jersey). Total surgery time for each fish was2–3 min. Fish were then placed in an aerated recov-ery tank and monitored until they regained equilib-rium and displayed coordinated fin movements for atleast 10 min, after which they were released backinto the section of stream where they were captured.
Environmental data collection
Temperature/light data loggers (HOBO Pendant Tem-perature/Light Data Logger 64K – UA-002-64, OnsetCorp, Onset MA) were attached to eight receivers inthe estuary and bay to record hourly water tempera-tures (eight total loggers located at receivers R03-09and R13). Stream temperature was collected for theentire study period from a water level and tempera-ture data logger (HOBO U20, Onset Corp., Onset,MA) approximately 60 m upstream of R10, wherethere is no influence by tide. Because moon phasehas been shown to influence movements of manyanimal species including fish (Curry et al. 2006),moon phase data for the study period was obtainedfor the Eastern Standard time zone from the UnitedStates Naval Observatory website (http://aa.usno.navy.mil/data/docs/MoonFraction.php). The geocentric
4
Snook et al.
data represent the fraction of the moon that is illumi-nated on each day, and are a quantitative way ofdescribing the moon’s phases.
Data analysis
Individual fish movements were examined usingVUE software (Vemco Inc., Halifax, NS). Detectionsof Brook Trout were used from the time they werereleased into the stream after tagging until the end ofthe study or until the tag failed. We conducted qual-ity assurance/quality control to determine whether atag was transmitting false detections. We defined falsedetections as consistent, regular detections (i.e., every120–240 s) at one receiver over at least a three-weekperiod and no subsequent detections at other receivers(except possibly at a nearby downstream receiverwhere continuous, regular detections were also seen,indicating that the tag washed downstream). Falsedetections indicating that a fish had died near a recei-ver or had shed its tag near a receiver were flaggedfor four individuals and removed from the data.To compare movements of detected fish between
habitats, receivers were grouped into four ‘nodes’ byhabitat type: (i) upper reach of the stream, (ii) lowerreach of the stream, (iii) estuary and (iv) bay. Transi-tion matrix plots were constructed to show when fishmove between nodes. Movement between nodes isreferred to as a ‘transition’. Detections were manipu-lated into transitions by selecting unique combina-tions of individual, date and node. A transitionrequired that a fish was detected in more than onenode in the same day or was detected on more than1 day. We examined the empirical data for relation-ships between transition and temperature and moonphase. Then, individual fish detections were plottedover time. To address the hypothesis related to anadr-omy, detections for all receivers in the bay were com-bined for the individual Brook Trout movement plots(Fig. 3).Generalised additive mixed models (GAMM) using
the gamm4 package in R (R version 3.0.1, http://cran.r-project.org/) were used to investigate the rela-tionship between environmental variables and transi-tions between nodes (Swartzman 1997; Murase et al.2009; Yee 2010). Covariates tested as fixed and ran-dom effects included stream temperature, moon phaseand day of year. Moon phase and stream temperaturewere selected for modelling against transitions asthey were the most complete environmental variablesavailable and other temperature variables were deter-mined to be highly correlated. Models were chosenbased on P-values (significant when P < 0.05) ofcovariates, by examining plots of residuals and usingAkaike’s information criterion (AIC) to compare can-didate models.
Results
A total of 84 Brook Trout were tagged over five sam-pling occasions from 2010 to 2012 (Table 1). Therewas no significant difference in fish length amongthe different sampling occasions (ANOVA, P = 0.5).Following inspection of the raw detection data, 62individuals (73.8%) yielded valid detections with amean number of days tracked (between first and lastdetection) of 171 � 140 SD (Table 1). Brook Troutwere detected from one to 45,942 times on one tonine receivers. Mean total detection for all individu-als was 4116 (SD = 9819). The mean number ofdays tracked (from tag deployment to last detection)was 171.6 (SD = 140.9), and the mean number ofdetections per days tracked was 27.8.Twelve of the detected Brook Trout (19.4%) were
detected at some point during the study in the upperreaches of the stream, 44 (71%) were detected in thelower reaches of the stream, 42 (67.7%) weredetected in the estuary, and eight (12.9% of detected)were detected in the bay. Manual tracking confirmedthat two additional fish that had not been detected byVR2W acoustic receivers were in the stream andwere alive. Twenty-one fish were not detected at anytime during the study. In total, five tags producedunreliable detections at some point during the study.Only detections when those fish were expected to bealive were used in the analysis. We concluded thattwo tags had been expelled or the fish died, so thedata from this tag were removed from the analysis.A detection limit test for a subset of receivers was
conducted in 50-m intervals up to 350 m in each ofthe four cardinal directions from a receiver. Detectionlimits (distance at which 100% of transmitter pingswere heard in 3 min) for bay receivers ranged from 0to 150 m, and detection limits in the stream rangedfrom 5 to 20 m. This test showed that at times therewas an overlap in detection ranges of R05, R06 andR13 as well as R02 and R09. There was no overlapin receiver detection range within Red Brook. Datawere examined for these overlaps, and dual detec-tions within 1 min were discounted.
Individual movement patterns
Movement patterns varied greatly among individuals,with some Brook Trout remaining in the stream andothers migrating from fresh to salt water and back.Some individuals moved little within the stream,while a few made long-distance movements from thehead of the stream to the bay (7.25 km). Forty-twoindividuals (50% of tagged Brook Trout) weredetected in the estuary, and eight Brook Trout madetransitions from the estuary into Buttermilk Bay, rep-resenting 9.5% of the tagged sample. Brook Trout
5
Movement patterns of coastal brook trout in southern Massachusetts

were detected in Buttermilk Bay mostly in the falland winter (Table 2). Half of the individuals thatmoved into the bay (n = 4) made repeat tripsbetween the estuary and bay and half moved directlyfrom the estuary to the bay without returning to theestuary. The maximum time that an individual wasdetected in the marine environment ranged from30 min to 54 days (one tag was detected only in thebay for 377 days and was likely an expelled tag ormortality, but could not be assigned based on QA/QC criteria). Only two of the eight Brook Troutwere detected back in the estuary or stream aftermoving out into Buttermilk Bay and had only spent30 min and 2 days in the bay. We cannot confirmthe fate of individuals that did not return to RedBrook, but we know that three of the tags likely lostbattery function (Vemco estimated tag life is407 days) while the fish were at sea (Table 2).These individuals may have returned to Red Brook,but we were not able to detect the expired tags. Ofcourse, it is also possible that these fish died in themarine environment. One individual was lastdetected at R08 heading out of the system, and itstag was recorded for the next 3 days on a receiver ina separate acoustic tag array on the west side of theCape Cod Canal (unpublished data, B. Hoffman,MA Division of Marine Fisheries).Four individuals were selected as representatives of
distinctly different movement patterns observed(Fig. 3). Fish A spent most of its time in the estuaryin the fall and winter but frequently moved betweenreceivers. It recorded a slightly above average num-ber of detections (5343) and registered a slightlyabove average detection time span (235 days). It wasdetected on six receivers and in three nodes includingButtermilk Bay. Fish A was tagged on 01 June 2011and was first detected in the estuary in September2011. In October and November, it moved up to thelower stream. In December 2011, this individualmade an initial downstream movement from R14 allthe way to R09 in Buttermilk Bay in 3 days. In lateDecember, fish A continued to move between theestuary and bay receivers until January when itremained in the estuary, but continued movingbetween three receivers.
Fish B moved long distances between habitats andchanged from moving upstream in one fall to down-stream in the next. It recorded a slightly above aver-age number of detections (6896) over a relativelylong detection time span (406 days). Fish B wasdetected on seven receivers and was the only BrookTrout to be detected in all four nodes. This individualwas tagged on 20 September 2011 and was firstdetected at R14 in the estuary in October. In Novem-ber, fish B moved from the lower stream to the upperstream, covering approximately 3.6 km in less than38 h. In April 2012, this individual made anotherquick migration, this time back downstream to R14where it spent the summer. In the second fall of itsdeployment, fish B made a quick migration downthrough the estuary and into Buttermilk Bay. It waslast detected several times on two receivers in Butter-milk Bay (R05 and R13) in early November 2012(Fig. 3). The battery in tag B likely died while theindividual was at sea, so whether the individualreturned to Red Brook is not known.Fish C slowly moved downstream from fall to
spring as it moved from the lower stream to the bay.It recorded an above average number of detections(23,434) over a nearly average detection time span(190 days). It was detected on six receivers, butremained within the lower stream and estuary, thusvisiting the average number of nodes (2). Fish C wastagged on 20 September 2011 just below R10 andwas first detected at R10 in the lower stream inNovember. This individual made more of a gradualdownstream movement through the estuary during thewinter, registering numerous consecutive detections
Table 1. Summary of Brook Trout tagged and released at Red Brook.
Date n FL mm (� 1 SD) Min (mm) Max (mm)
08 June 10 10 230 � 35 195 30516 September 10 20 222 � 22 201 28501 June 11 20 216 � 31 167 29021 September 11 20 215 � 43 177 31230 May 12 14 217 � 33 173 274
Table 2. Summary of individuals that transitioned into Buttermilk Bayincluding the months that the tag was detected in the bay, whether theindividual made repeat trips from the estuary to the bay, whether the tagwas detected back in the stream (Red Brook) after having been in the bay,the maximum time the tag was detected in the bay or at sea and thenumber of days from tagging to last detection.
TransmitterID
Month(s)in bay
Repeattrips
Finalreturnto stream
Max. timeat sea (days)
Days fromtagging tolastdetection
3066 Nov N N <1 (8 h) 406†33398 Dec N N 4* 9833420 Sep–Nov Y N 54 411†33427 Nov, Dec Y N 4 7840111 Dec Y Y 2 23540116 July Y N 377** 411†60666 Jan N Y <1 (30 min) 36960669 Aug–Sep N N 32 86
*This tag was then detected on Mass Maritime receiver in Cape Cod Canal.**Probable expelled tag or mortality; however, this tag did not meet QA/QCcriteria for false detections.†Acoustic tag batteries probably died while individual was at sea, and esti-mated tag life is 407 days.
6
Snook et al.

at R01 from January to March 2012. In the beginningof March, fish C was detected mostly on R01, makingexcursions down to R12. Throughout March, it wasdetected mostly on R12, making excursions down toR02 (Fig. 3).Fish D recorded the maximum number of detec-
tions (45,942) for all Brook Trout tagged as part ofthis study and registered an above average detectiontime span length (283 days). However, this individ-ual’s movement pattern is representative of many ofthe tagged Brook Trout as it was detected on an aver-age number of receivers (3, mean = 2.61) and in anaverage number of nodes (2, mean = 2). It spent themajority of its time in the estuary, did not makelong-distance movements and did not migrate intoButtermilk Bay. After tagging on 30 May 2012, FishD spent the summer at R14 near the head of the tide(Fig. 3). In September, it moved downstream to R01where it stayed until December when it made a rela-tively quick upstream movement past the head of thetide and into the lower stream where it was detectedon three consecutive days. Fish D then moved backdownstream to R01 where it overwintered, except forone short excursion up to R14 in January.
Movement by date and environmental factors
Of the 54 individuals in the transition analysis thatwere detected in more than one node or were detectedon two or more days across the study period, 33made transitions between nodes. Downstream transi-tions were made by 25 individuals and accounted for70 of the 142 transitions (mean = 2.5 transitions perindividual). Upstream transitions were made by 32individuals and accounted for 72 (50.7%) of the totaltransitions (mean=2.8 transitions per individual).Downstream transitions from the upper stream tolower stream (n = 4) occurred in April and May,while upstream transitions from the lower stream toupper stream (n = 7) occurred in March, April, Octo-ber and November. Downstream and upstream transi-tions between the lower stream and the estuary(n = 75) occurred most frequently in October andNovember (mean transitions per month in Decemberand November = 18.75, as compared to mean transi-tions in all other months = 1.8). Between estuary andthe bay, the greatest number of transitions (n = 17)occurred in December, fewer transitions occurred dur-ing the late winter to summer months (mean = 4.43
ESTUARY
LOWER STREAM
BAY
LOWER STREAMUPPER STREAM
BAY
ESTUARY
LOWER STREAMUPPER STREAM
BAY
LOWER STREAMUPPER STREAM
BAY
(a) (b)
(c) (d)
Fig. 3. Detection histories of four representative Brook Trout for the entire periods over which they were each tracked. On the y-axis arethe receivers ordered upstream to downstream (Bay receivers are grouped).
7
Movement patterns of coastal brook trout in southern Massachusetts

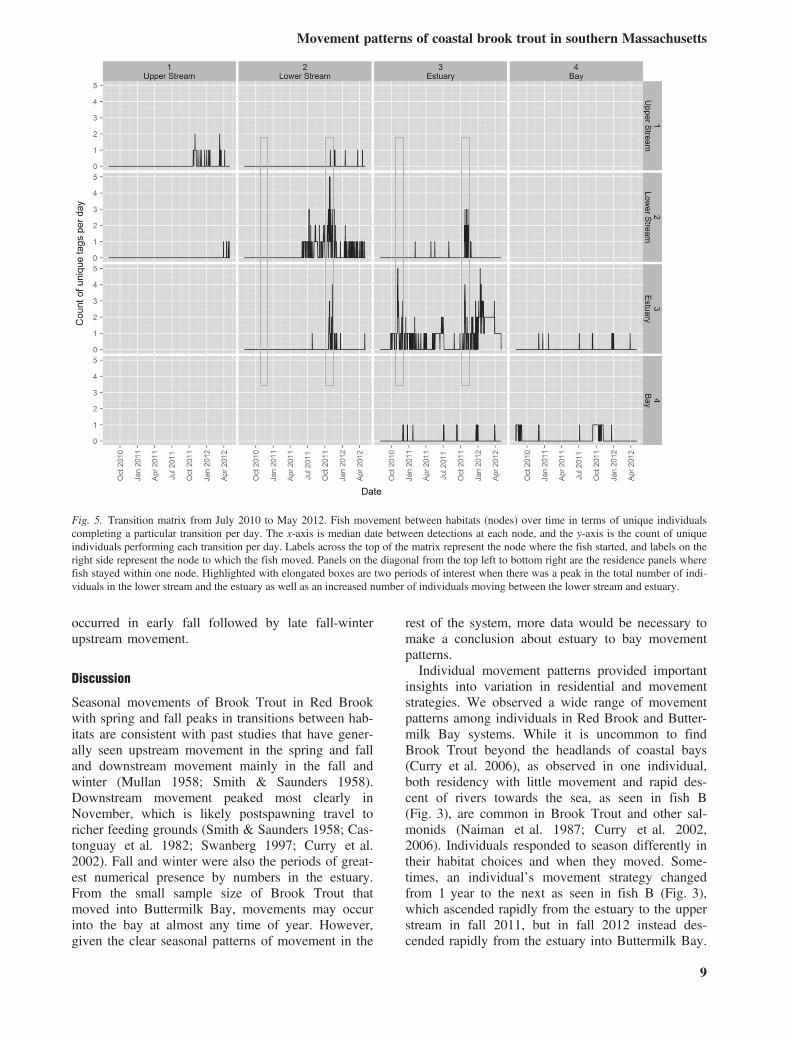
transitions per month), and no transitions occurredfrom April to June, August and October (Fig. 4).Two transition matrices were selected to illustrate
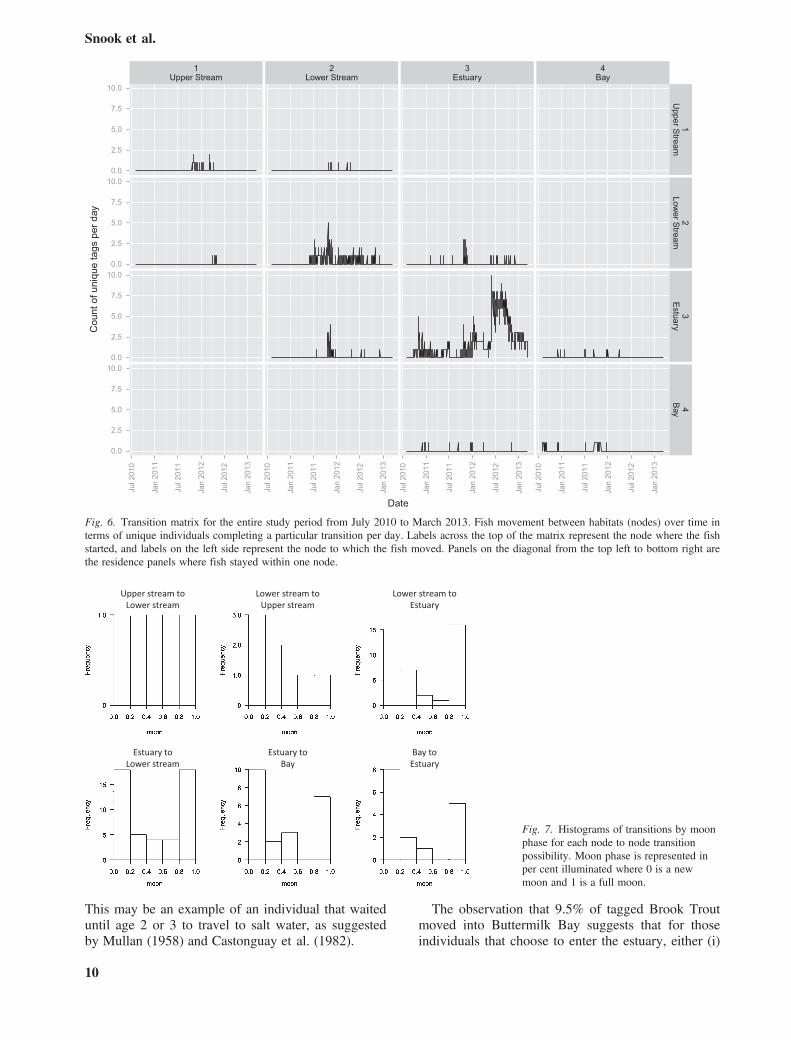
important periods when movement occurred. Across2 years of the study, there were autumn peaks inthe total number of individuals in the lower streamand the estuary, as well as an increased number ofindividuals moving between the lower stream andestuary (Fig. 5). From 21 October 2011 to 03 Janu-ary 2012, 14 individuals (20% of total tagsdeployed at the time) completed 37 downstreamtransitions from the stream to the estuary, with amaximum of seven transitions per individual. Thispeak is visible in November 2010 in the estuary,but was not seen in the lower stream in 2010because receivers were not placed in the lowerstream until February 2011. There were several daysin spring and summer 2012 when an increased num-ber of individuals were residing in the estuary(Fig. 6). The majority of fish detected in the estuaryduring this time were detected at one receiver(R14). Fourteen Brook Trout were detected between30 May 2012 and 20 September 2012. Three ofthese fish had been tagged at previous samplingperiods, and 11 were tagged on 30 May. Of the lat-ter group, six had been initially captured andreleased in the estuary below R14 (up to 190 mdownstream) and five had been captured andreleased in the two sampling sections above R14(up to 75 m upstream). Seven fish of the 14 (50%)were detected on other receivers during the May–September period in addition to R14 (mean= 2.43receivers/fish), and 10 of the 14 fish were detectedon other receivers after the period (mean=2.22receivers/fish), verifying their continued viability.Three of the 14 fish were only detected on R14during the period and were not detected afterwards.However, their detections were not regular, so they
could not be considered mortalities or dropped tags.After September, four individuals moved upstreamand six moved further into the estuary with onetransitioning into Buttermilk Bay.Fish were detected more often throughout the sys-
tem at new and full moon phases. Downstream andupstream transitions also occurred more frequentlyduring new and full moons (Fig. 7). Migration fromthe estuary to bay occurred almost exclusively duringnew moon and full moons. Fifty per cent of down-stream transitions by Brook Trout occurred whenstream temperature was between 7.9 and 12.0 °C.The maximum number of fish moving downstreamper day (n = 5) occurred at a temperature of 10.9 °C.
GAMM models
The best-fit GAMM models for upstream and down-stream (Fig. 8) transitions included date (centred onmedian date) as the sole smoothed fixed effect. Inthis model, centred moon (per cent illuminated) andcentred stream temperature by Fish ID were set asrandom effects and helped to account for more ofthe variation in the model, suggesting that they playan important, but less crucial role in transition.Transitions by day of year, stream temperature andmoon phase varied by year (Fig. 8), indicating thatfish responded differently to these variables eachyear. Both models predicted that Brook Trout aremost likely to transition in the spring and in thefall. Brook Trout moved upstream in winter 2010 tospring 2011, followed by a spring peak in down-stream transitions. Downstream and upstream transi-tions peaked around the same time in fall 2011. Asmall peak in downstream movement was then clo-sely followed by a spring upstream peak in 2012.While the movement peaks were much smaller inthe latter part of 2012, downstream movement
Upper stream to Lower stream
Lower stream toUpper stream
Lower stream toEstuary
Bay toEstuary
Estuary toBay
Estuary toLower stream
Fig. 4. Histograms of transitions by monthfor each transition possibility.
8
Snook et al.
occurred in early fall followed by late fall-winterupstream movement.
Discussion
Seasonal movements of Brook Trout in Red Brookwith spring and fall peaks in transitions between hab-itats are consistent with past studies that have gener-ally seen upstream movement in the spring and falland downstream movement mainly in the fall andwinter (Mullan 1958; Smith & Saunders 1958).Downstream movement peaked most clearly inNovember, which is likely postspawning travel toricher feeding grounds (Smith & Saunders 1958; Cas-tonguay et al. 1982; Swanberg 1997; Curry et al.2002). Fall and winter were also the periods of great-est numerical presence by numbers in the estuary.From the small sample size of Brook Trout thatmoved into Buttermilk Bay, movements may occurinto the bay at almost any time of year. However,given the clear seasonal patterns of movement in the
rest of the system, more data would be necessary tomake a conclusion about estuary to bay movementpatterns.Individual movement patterns provided important
insights into variation in residential and movementstrategies. We observed a wide range of movementpatterns among individuals in Red Brook and Butter-milk Bay systems. While it is uncommon to findBrook Trout beyond the headlands of coastal bays(Curry et al. 2006), as observed in one individual,both residency with little movement and rapid des-cent of rivers towards the sea, as seen in fish B(Fig. 3), are common in Brook Trout and other sal-monids (Naiman et al. 1987; Curry et al. 2002,2006). Individuals responded to season differently intheir habitat choices and when they moved. Some-times, an individual’s movement strategy changedfrom 1 year to the next as seen in fish B (Fig. 3),which ascended rapidly from the estuary to the upperstream in fall 2011, but in fall 2012 instead des-cended rapidly from the estuary into Buttermilk Bay.
Fig. 5. Transition matrix from July 2010 to May 2012. Fish movement between habitats (nodes) over time in terms of unique individualscompleting a particular transition per day. The x-axis is median date between detections at each node, and the y-axis is the count of uniqueindividuals performing each transition per day. Labels across the top of the matrix represent the node where the fish started, and labels on theright side represent the node to which the fish moved. Panels on the diagonal from the top left to bottom right are the residence panels wherefish stayed within one node. Highlighted with elongated boxes are two periods of interest when there was a peak in the total number of indi-viduals in the lower stream and the estuary as well as an increased number of individuals moving between the lower stream and estuary.
9
Movement patterns of coastal brook trout in southern Massachusetts
This may be an example of an individual that waiteduntil age 2 or 3 to travel to salt water, as suggestedby Mullan (1958) and Castonguay et al. (1982).
The observation that 9.5% of tagged Brook Troutmoved into Buttermilk Bay suggests that for thoseindividuals that choose to enter the estuary, either (i)
1Upper Stream
2Lower Stream
3Estuary
4Bay
0.0
2.5
5.0
7.5
10.0
0.0
2.5
5.0
7.5
10.0
0.0
2.5
5.0
7.5
10.0
0.0
2.5
5.0
7.5
10.0
1U
pper Stream
2Low
er Stream
3E
stuary4Bay
Jul 2
010
Jan
2011
Jul 2
011
Jan
2012
Jul 2
012
Jan
2013
Jul 2
010
Jan
2011
Jul 2
011
Jan
2012
Jul 2
012
Jan
2013
Jul 2
010
Jan
2011
Jul 2
011
Jan
2012
Jul 2
012
Jan
2013
Jul 2
010
Jan
2011
Jul 2
011
Jan
2012
Jul 2
012
Jan
2013
Date
Cou
nt o
f uni
que
tags
per
day
Fig. 6. Transition matrix for the entire study period from July 2010 to March 2013. Fish movement between habitats (nodes) over time interms of unique individuals completing a particular transition per day. Labels across the top of the matrix represent the node where the fishstarted, and labels on the left side represent the node to which the fish moved. Panels on the diagonal from the top left to bottom right arethe residence panels where fish stayed within one node.
Upper stream to Lower stream
Lower stream toUpper stream
Lower stream toEstuary
Bay toEstuary
Estuary toBay
Estuary toLower stream
Fig. 7. Histograms of transitions by moonphase for each node to node transitionpossibility. Moon phase is represented inper cent illuminated where 0 is a newmoon and 1 is a full moon.
10
Snook et al.

Upstream Downstream
Fig. 8. Comparison of GAMM models. The first upstream and downstream plots show the expected probabilities of transitions by date,including all of the effects from the models. The bottom six plots are the fitted variables in the upstream and downstream GAMM modelsincluding date, the smoothed variable, as well as day of year and the random effects variables mean daily stream temperature and moonphase. The y-axis is the probability of a Brook Trout transitioning between nodes. Colours on the bottom six plots represent the year from2010 to 2013.
11
Movement patterns of coastal brook trout in southern Massachusetts

the estuary is an area with sufficient food resource,(ii) physiological constraints to the environment dis-courage travel further into the bay, or (iii) they areresiding in the estuary to acclimate to and eventuallymove to salt water, which did not occur within thetime of our study. Smith & Saunders (1958) observeda greater percentage of Brook Trout migrating to seain Prince Edward Island, which varied annually (over6 years) but ranged from 12% to 35%. They attrib-uted Brook Trout movement out of salt water backinto the river to adverse sea temperatures (Smith &Saunders 1958). In a study in New Brunswick, Can-ada, only one acoustic tagged Brook Trout of sixchoose to enter the marine environment even thoughit was accessible to all, potentially indicating thatBrook Trout are restricted by their physical environ-ment, which limits saltwater migration (Curry et al.2002).High occupancy of the estuary by coastal Brook
Trout could be related to high prey availability. Halfof the tagged Brook Trout in Red Brook weredetected in the estuary, suggesting that this area isimportant. It is well documented that anadromousBrook Trout obtain greater fitness through richermarine food resources (larger and more abundantprey) than their resident counterparts (Wilder 1952;Power 1980; Hutchings & Morris 1985; Hutchings1991; Jonsson & Jonsson 1993; Thorpe 1994;Einum & Fleming 1999; Morinville & Rasmussen2006). When food is scarce in freshwater, most indi-viduals of a partially anadromous population tend tobecome migrants, but few or none migrate whenfood is plentiful (Smith & Saunders 1958; Olssonet al. 2006).Brook Trout residing in the Red Brook estuary
may also have been preparing for seaward movementthrough a period of saltwater acclimation. In otherstudies, Brook Trout have been observed concentrat-ing in small areas in channels that are mixing zonesbetween fresh and salt waters (Castonguay et al.1982; Curry et al. 2002). This is likely becauseBrook Trout do not smoltify like other salmonids andtherefore require a period of adaptation in the estuarybefore they move to the marine environment (McCor-mick 1994).The fact that many of the individuals that moved
into Buttermilk Bay did so only for brief periodsmight be related to physiological restrictions imposedby temperature and salinity. As discussed by Curryet al. (2010), the environment dictates how sea-run-ning behaviour is expressed. Temperature preferencesfor Brook Trout vary by study location, but rangefrom 11 to 19 °C (Smith & Saunders 1958; Power1980; Power et al. 1999; Hartel et al. 2002). Thatsaid, Curry et al. (2006) found Brook Trout in tem-peratures from 5 to 18 °C, and they are known to
perform adequately from 5 to 20 °C (Power 1980).Die-offs of adult Brook Trout have been observedwhen river temperatures rose to 31.4 °C (Huntsman1946) and when air temperatures in the Hudson Bayrose above 30 °C (Gunn & Snucins 2010).While Brook Trout are able to tolerate the salinity
of sea water after a period of estuarine residence(McCormick et al. 1985), ability to adapt to saltwater is severely inhibited at temperatures <3 °C(Claireaux & Audet 1999). This suggests that as tem-perature varies, there is a limit to the habitats avail-able to Brook Trout. Castonguay et al. (1982) studieda population of Brook Trout in Quebec whose migra-tory individuals spent the first 2–3 years in the river,then 1 year in the estuary. When they finally movedto salt water, Brook Trout remained there 2–3 months and then returned to the river (Castonguayet al. 1982). Besner & Pelletier (1991)) found thatBrook Trout survival in salt water was least likely inthe summer and most likely in the spring.Although water temperature as measured in Red
Brook did not directly trigger Brook Trout movementin the model, variation in water temperature on smal-ler spatial scales may have influenced the way BrookTrout select seasonal habitats. In a New BrunswickBrook Trout population, Curry et al. (2002) docu-mented increased movement when river temperaturesrose above 15 °C, whereas in Red Brook, transitionsbetween habitats occurred mostly when mean dailystream temperatures were between 8 and 12 °C.Water temperature is a controlling factor in within-stream habitat selection (Baltz et al. 1987), andBrook Trout may aggregate in areas of coolergroundwater springs, or thermal refugia, as watertemperatures warm to avoid detrimental effects onactivity, appetite and enzyme efficiency that reducegrowth rate (Power et al. 1999). In Buttermilk Bay,water temperature warms faster than Red Brook andstays warmer through the summer due to the bay’sshallow nature. Therefore, it may be that Red Brookprovides the thermal refugia with its cold watersprings and that warmer Buttermilk Bay temperatures(sometimes 9 °C warmer, with mean daily tempera-ture reaching 25.6 °C in summer) create a barrier thatmany Brook Trout are reluctant to cross. Further-more, in the winter, Buttermilk Bay mean daily tem-perature just outside the mouth of the estuary is oftencolder than stream temperatures (up to 3.3 °C colder)and reaches 2.4 °C, which is below the acceptabletemperature for saltwater adaptation (Claireaux &Audet 1999).Thermal refugia may explain the summer residency
observed in 14 individuals in summer 2012 near thehead of the tide. During this period, these individualsmoved between the stream and the estuary regardlessof moon phase. When these transition observations
12
Snook et al.

are removed from the data, the overall relationshipbetween transition and moon phase becomes stronger.This suggests that there was some other factor,probably temperature or food, with a stronger influ-ence on habitat selection during this period. In sum-mer 2012, air temperature was 0.8 °C above the 30-year average and rainfall was 4.4 cm above normal.Increased water volume could have increased theappeal of a groundwater spring at the receiver nearthe head of the tide (R14), providing refugia fromheightened surface water temperatures (UMass EastWareham weather station data, http://www.umas-s.edu/cranberry/cropinfo/weather_2012.html). Habitatselection at fine spatial scales within Red Brook is anarea worth further investigation and could be accom-plished with the use of stream thermographs and tem-perature loggers at known sites of Brook Troutaggregation. There are life-cycle variations from theclassical example of anadromy on the species, popu-lation and individual level (Power 1980; Gross1987). Riverine fish populations have both stationaryor resident individuals and migratory or mobile indi-viduals (Jonsson & Jonsson 1993; Radinger & Wol-ter 2013), as seen in the current study. In comparisonto other coastal salmonids such as salmon in the Paci-fic Northwest which are obligatory migrators, theRed Brook population has fewer migratory individu-als that travel shorter distances and spend less time atsea. Noncoastal, stream-resident Brook Trout lackaccess to rich marine habitats, but may still exhibitfacultative movement, travelling several kilometers insearch of feeding or spawning areas (Gowan &Fausch 1996). Adfluvial Brook Trout have a life his-tory similar to anadromous forms, migrating betweenstreams and lakes instead of marine habitats. Lacus-trine Brook Trout, such as those in Lake Superior, onthe other hand, spend most of their life cycle within alake’s nearshore habitats (up to 400 m from shore)and move into streams for an average of 46 days tospawn in the fall (Mucha & Mackereth 2008). Anadr-omy may be less developed in the Red Brook popula-tion than for other more northern coastal Brook Troutpopulations due to differences in geographical loca-tion and climate. Most individuals that moved intoButtermilk Bay were detected there for a few hoursto a few days. This is vastly different than migrationsseen in Canadian coastal streams where Brook Trouttypically spend 65–150 days in the marine environ-ment (White 1942; Naiman et al. 1987; Curry et al.2006, 2010) and reinforces the idea that anadromy insalmonids decreases with decreasing latitude (Roun-sefell 1958; Nordeng 1961; Vladykov 1963; Scott &Crossman 1973).After moving into Buttermilk Bay, six of eight
Brook Trout were not detected back in Red Brook.Predation, an example of the costs related to the
anadromous life history, may have been the fate ofnonreturning sea-run Brook Trout. Other possibleexplanations for Brook Trout not returning to RedBrook could include expired tag batteries and move-ment to a different river. At least three of the tagslikely lost battery function while the fish were atsea. This means that fish may have returned to thestream but could not be detected by receivers.Another possibility is that some of the Brook Troutmay have moved to a nearby river. In general,Brook Trout at sea stay close to their natal riversand have a strong homing tendency; however, Curryet al. (2002) recorded one member of an otherwiseriver resident population swimming through thefreshwater lens of a brackish estuary to visit anotherriver <5 km away. One of the Red Brook acoustictagged Brook Trout was detected on a receiver thatwas a part of a separate acoustic tracking study onthe west side of the Cape Cod Canal, 3.4 km fromthe mouth of Red Brook. Brook Trout in Cape Codrivers are known to travel through salt water toreturn to their home stream after being experimen-tally placed in a neighbouring river (S. Hurley,unpublished data).Prior to restoration, informal observers believed that
brook trout were not able to access the estuary or bayand return to the stream. We have shown that, postres-toration, brook trout can indeed access these habitats.If the restoration of Red Brook is consistent with otherdam-removal projects, brook trout are likely to con-tinue make use of this habitat that was once availableto their species before dams were constructed (Bedn-arek 2001; Hitt et al. 2012). As movement distancesincrease over time for riverine fish species (Radinger& Wolter 2013), habitat exploration and dispersal canbe expected to increase for populations near newlyrehabilitated habitats such as Red Brook.Although the environmental variables measured in
this study did not contribute strongly to transitionsmodels, temperature and lunar cycle do explain partof the variation in Brook Trout movement. Moonphase seems to influence movements throughout thesystem, but that influence was particularly clear dur-ing movements from the estuary to Buttermilk Bay,which were undertaken especially at new and fullmoons (Fig. 7). Brook Trout may be further encour-aged to move by higher spring tides that result fromnew and full moons phases (Castonguay et al. 1982).Other environmental variables not measured in this
study could play a role in triggering movements ofBrook Trout in Red Brook. Variables such as photo-period, stream flow rate, diel period, and tidal cycleand height, which have been shown to influence sal-monid migration (Castonguay et al. 1982; McCor-mick & Naiman 1984a,b; Curry et al. 2006), maycreate a stronger model and clearer picture of migra-
13
Movement patterns of coastal brook trout in southern Massachusetts

tion triggers. The current study was also limited to theadult life stage of Brook Trout due to the size ofacoustic tags used, but it has been suggested that mat-uration and spawning override other stimuli thatwould otherwise influence movement (Smith & Saun-ders 1958). Incorporating PIT tag data or otherwisetracking juveniles and younger individuals could helpto inform whether the population behaves more likethat described by Mullan (1958) and Castonguayet al. (1982) in which Brook Trout wait until theyhave reached age 1 or 2 to travel to salt water orwhether juveniles also move down into the estuary asobserved by Lenormand et al. (2004). Examiningbody size and growth rate of resident versus migratoryindividuals would require a larger sample size, butwould provide more information about how thiscoastal Brook Trout population might differ from oth-ers in the way and to what extent individuals exploitthe marine environment.
Acknowledgements
We thank the crew at the S.E. District Mass Fisheries andWildlife office that assisted our project with countless hoursof skilled hard work during sampling and downloading. Wethank M. Hopper, W. Winders, and Geof Day and the SeaRun Brook Trout Coalition for funding and support. Thanksto the volunteers from Trout Unlimited and The Trustees ofReservations who helped with Red Brook restoration and thePIT tagging and acoustic telemetry field work. Thanks to J.Snook, for two long days of range testing in Buttermilk Bay.Thanks to J. Finn and B. Timm for their help with data analy-sis. In addition, we thank the following partners for their sup-port: MA Division of Ecological Restoration, U.S. Fish andWildlife Service, U.S. Geological Survey Conte AnadromousFish Lab, U.S. Geological Survey Maine Cooperative Fishand Wildlife Research Unit, Coalition for Buzzards Bay andthe UMass Intercampus Marine Science Program.
References
Baltz, D.M., Vondracek, B., Brown, L.R. & Moyle, P.B.1987. Influence of temperature on microhabitat choice byfishes in a California stream. Transactions of the AmericanFisheries Society 116: 12–20.
Bednarek, A.T. 2001. Undamming rivers: a review of the eco-logical impacts of dam removal. Environmental Manage-ment 27: 803–814.
Besner, M. & Pelletier, D. 1991. Adaptation of the brooktrout, Salvelinus fontinalis, to direct transfer to sea water inspring and summer. Aquaculture 97: 217–230.
Castonguay, M., FitzGerald, G.J. & Cot�e, Y. 1982. Life his-tory and movements of anadromous brook charr, Salvelinusfontinalis, in the St-Jean River, Gasp�e, Qu�ebec. CanadianJournal of Zoology 60: 3084–3091.
Claireaux, G. & Audet, C. 1999. Seasonal changes in thehypo-osmoregulatory ability of brook charr: the role of envi-ronmental factors. Journal of Fish Biology 56: 347–373.
Cooke, S.J., Hinch, S.G., Lucas, M.C. & Lutcavage, M. 2012.Chapter 18 – biotelemetry and biologging. In: Zale, A.V.,Parrish, D.L. & Sutton, T.M., eds. Fisheries techniques, 3rdedn. Bethesda, MD: American Fisheries Society, pp. 819–860.
Curry, R.A., Sparks, D. & van de Sande, J. 2002. Spatial andtemporal movements of a riverine Brook Trout population.Transactions of the American Fisheries Society 131: 551–560.
Curry, R.A., van de Sande, J. & Whoriskey, F.G. Jr 2006.Temporal and spatial habitats of anadromous brook charr inthe Laval River and its estuary. Environmental Biology ofFishes 76: 361–370.
Curry, R.A., Bernatchez, L., Whoriskey, F. Jr & Audet, C.2010. The origins and persistence of anadromy in brookcharr. Reviews in Fish Biology and Fisheries 20: 557–570.
Einum, S. & Fleming, I.A. 1999. Maternal effects of egg sizein brown trout (Salmo trutta): norms of reaction to environ-mental quality. Proceedings of the Royal Society of London.Series B: Biological Sciences 266: 2095.
Gowan, C. & Fausch, K.D. 1996. Mobile brook trout in twohigh-elevation Colorado streams: re-evaluating the conceptof restricted movement. Canadian Journal of Fisheries andAquatic Sciences 53: 1370–1381.
Gross, M. 1987. Evolution of diadromy in fishes. In: Dad-swell, M.J., Klauda, R.J., Moffitt, C.M., Saunders, R.L.,Rulifson, R.A. & Cooper, J.E., eds. American fisheries soci-ety symposium. 1: pp. 14–25.
Gunn, J. & Snucins, E. 2010. Brook charr mortalities duringextreme temperature events in Sutton River, Hudson BayLowlands, Canada. Hydrobiologia 650: 79–84.
Hartel, K., Halliwell, D. & Launer, A. 2002. Inland fishes ofMassachusetts. Lincoln, MA: Massachusetts Audubon Soci-ety.
Hitt, N.P., Eyler, S. & Wofford, J.E. 2012. Dam removalincreases American eel abundance in distant headwaterstreams. Transactions of the American Fisheries Society141: 1171–1179.
Hughes, J.B., Daily, G.C. & Ehrlich, P.R. 1997. Populationdiversity: its extent and extinction. Science 278: 689–692.
Huntsman, A. 1946. Heat stroke in Canadian maritimestream fishes. Journal of the Fisheries Board of Canada 6:476–482.
Hutchings, J.A. 1991. Fitness consequences of variation inegg size and food abundance in Brook Trout Salvelinus fon-tinalis. Evolution 45: 1162–1168.
Hutchings, J.A. & Morris, D.W. 1985. The influence of phy-logeny, size and behaviour on patterns of covariation in sal-monid life histories. Oikos 45: 118–124.
Hutchings, J.A. & Myers, R.A. 1994. The evolution of alter-native mating strategies in variable environments. Evolution-ary Ecology 8: 256–268.
Hvidsten, N., Jensen, A., Vivaas, H., Bakke, O. & Heggber-get, T. 1995. Downstream migration of Atlantic salmonsmolts in relation to water flow, water temperature, moonphase and social interaction. Nordic Journal of FreshwaterResearch 70: 38–48.
Jonsson, B. & Jonsson, N. 1993. Partial migration: niche shiftversus sexual maturation in fishes. Reviews in Fish Biologyand Fisheries 3: 348–365.
14
Snook et al.

Koehn, J.D. 2012. Chapter 3 – designing studies based onacoustic or radio telemetry, pp. 21–44. In: Adams, N.S., Be-eman, J.W. & Eiler, J.H., eds. Telemetry techniques: a userguide for fisheries research. Bethesda, MD: American Fish-eries Society, 518 pp.
Letcher, B.H., Nislow, K.H., Coombs, J.A., O’Donnell, M.J.& Dubreuil, T.L. 2007. Population response to habitat frag-mentation in a stream-dwelling Brook Trout population.PLoS ONE 2: e1139.
Lenormand, S., Dodson, J.J. & Menard, A. 2004. Seasonaland ontogenetic patterns in the migration of anadromousbrook charr (Salvelinus fontinalis). Canadian Journal ofFisheries and Aquatic Sciences 61: 54–67.
McCormick, S.D. 1994. Ontogeny and evolution of salinitytolerance in anadromous salmonids: hormones and hetero-chrony. Estuaries 17: 26–33.
McCormick, S.D. & Naiman, R. 1984a. Osmoregulation inthe Brook Trout, Salvelinus fontinalis. I. Diel, photoperiodand growth related physiological changes in freshwater.Comparative Biochemistry and Physiology Part A: Physiol-ogy 79A: 7–16.
McCormick, S.D. & Naiman, R.J. 1984b. Osmoregulation inthe Brook Trout, Salvelinus fontinalis,—II. Effects of size,age and photoperiod on seawater survival and ionic regula-tion. Comparative Biochemistry and Physiology Part A:Physiology 79: 17–28.
McCormick, S.D., Naiman, R.J. & Montgomery, E.T. 1985.Physiological smolt characteristics of anadromous and non-anadromous Brook Trout (Salvelinus fontinalis) and Atlanticsalmon (Salmo salar). Canadian Journal of Fisheries andAquatic Sciences 42: 529–538.
Moog, P.L. 1987. The hydrology and freshwater influx ofButtermilk with regard to the circulation of coliform andpollutants. Boston, MA: Master’s Thesis, Boston UniversityGraduate School.
Morinville, G.R. & Rasmussen, J.B. 2003. Early juvenile bio-energetic differences between anadromous and residentbrook trout (Salvelinus fontinalis). Canadian Journal of Fish-eries and Aquatic Sciences 60: 401–410.
Morinville, G.R. & Rasmussen, J.B. 2006. Marine feedingpatterns of anadromous brook trout (Salvelinus fontinalis)inhabiting an estuarine river fjord. Canadian Journal of Fish-eries and Aquatic Sciences 63(9): 2011–2027.
Mucha, J.M. & Mackereth, R.W. 2008. Habitat use and move-ment patterns of Brook Trout in Nipigon Bay, Lake Supe-rior. Transactions of the American Fisheries Society 137:1203–1212.
Mullan, J.W. 1958. The sea-run or” salter” Brook Trout (Salv-elinus fontinalis) fishery of the coastal streams of Cape Cod,Massachusetts. Boston, MA: Massachusetts Division ofFisheries and Game.
Murase, H., Nagashima, H., Yonezaki, S., Matsukura, R. &Kitakado, T. 2009. Application of a generalized additivemodel (GAM) to reveal relationships between environmentalfactors and distributions of pelagic fish and krill: a casestudy in Sendai Bay, Japan. ICES Journal of Marine Sci-ence: Journal Du Conseil 66: 1417–1424.
Naiman, R., McCormick, S., Montgomery, W. & Morin, R.1987. Anadromous brook charr, Salvelinus fontinalis: oppor-tunities and constraints for population enhancement. MarineFisheries Review 49: 1–13.
Nehlsen, W., Williams, J.E. & Lichatowich, J.A. 1991. Paci-fic salmon at the crossroads: stocks at risk from California,Oregon, Idaho and Washington. Fisheries (Bethesda) 16:4–21.
Nordeng, H. 1961. On the biology of char (Salmo alpinus L.)in Salangen, North Norway. Norwegian Journal of Zoology10: 67–132.
Olsson, I.C., Greenberg, L.A., Bergman, E. & Wysujack, K.2006. Environmentally induced migration: the importance offood. Ecology Letters 9: 645–651.
Power, G. 1980. The brook charr, Salvelinus fontinalis. In:Balon, E., ed. Charrs: salmonid fishes of the genusSalvelinus. The Hague: Dr. W. Junk Publishers, pp 141–203.
Power, G., Brown, R. & Imhof, J. 1999. Groundwater andfish—insights from northern North America. HydrologicalProcesses 13: 401–422.
Radinger, J. & Wolter, C. 2013. Patterns and predictors of fishdispersal in rivers. Fish and Fisheries 15: 456–473.
Rounsefell, G.A. 1957. Fecundity of North AmericanSalmonidae. Washington, D.C.: US Government PrintingOffice.
Rounsefell, G.A. 1958. Anadromy in North American Sal-monidae. Washington, D.C.: US Government PrintingOffice.
Ryther, J.H. & Trout Unlimited. 1997. Anadromous brooktrout: biology, status and enhancement. Arlington, VA:Trout Unlimited.
Schindler, D.E., Hilborn, R., Chasco, B., Boatright, C.P.,Quinn, T.P., Rogers, L.A. & Webster, M.S. 2010. Popula-tion diversity and the portfolio effect in an exploited species.Nature 465: 609–612.
Scott, W.B. & Crossman, E.J. 1973. Freshwater fishes of Can-ada. Ottawa: Fisheries Research Board of Canada Bulletin.184 pp.
Smith, M. & Saunders, J. 1958. Movements of Brook Trout,Salvelinus fontinalis (Mitchill), between and within freshand salt water. Journal of the Fisheries Board of Canada 15:1403–1449.
Swanberg, T.R. 1997. Movements of and habitat use by flu-vial bull trout in the Blackfoot River, Montana. Transactionsof the American Fisheries Society 126: 735–746.
Swartzman, G. 1997. Analysis of the summer distribution offish schools in the Pacific Eastern Boundary Current.ICES Journal of Marine Science: Journal Du Conseil 54:105–116.
Sykes, G.E., Johnson, C.J. & Shrimpton, J.M. 2009. Tempera-ture and flow effects on migration timing of Chinook sal-mon smolts. Transactions of the American Fisheries Society138: 1252–1265.
Thorpe, J. 1994. Salmonid fishes and the estuarine environ-ment. Estuaries 17: 76–93.
Th�eriault, V., Garant, D., Bernatchez, L. & Dodson, J.J. 2007.Heritability of life history tactics and genetic correlationwith body size in a natural population of brook charr (Salv-elinus fontinalis). Journal of Evolutionary Biology 20:2266–2277.
Valiela, I. & Costa, J.E. 1988. Eutrophication of ButtermilkBay, a Cape Cod coastal embayment: concentrations ofnutrients and watershed nutrient budgets. EnvironmentalManagement 12: 539–553.
15
Movement patterns of coastal brook trout in southern Massachusetts

Vladykov, V.D. 1963. A review of salmonid genera and theirbroad geographical distribution. Transactions of Royal Soci-ety of Canada 1: 450–504.
White, H. 1942. Sea life of the Brook Trout (Salvelinus fonti-nalis). Journal of the Fisheries Board of Canada 5: 471–473.
Wilder, D. 1952. A comparative study of anadromous andfreshwater populations of Brook Trout (Salvelinus fontinalis
(Mitchill)). Journal of the Fisheries Research Board of Can-ada 9: 169–203.
Yee, T.W. 2010. VGLMs and VGAMs: an overview for appli-cations in fisheries research. Fisheries Research 101: 116–126.
16
Snook et al.