Embed Size (px)
Citation preview

Mouse phenotypes anddisease genomics
Caleb WebberMRC Functional Genomics Unit,
Oxford University, UK
No conflicts of interest to declare
Why are dispersed loci involved in similar phenotypes?
PHENOTYPE

Comparing Patient Phenotypes - evidence
Patient 1Phenotype APhenotype FPhenotype NPhenotype W
VSPatient 2Phenotype CPhenotype FPhenotype OPhenotype Z
Patient 1Phenotype A
?Phenotype F
?Phenotype NPhenotype W
?
Patient 2
?Phenotype CPhenotype FPhenotype O
??
Phenotype Z

Comparing Patient Phenotypes - language
Patient 2
Phenotype CPhenotype FPhenotype O
Phenotype Z
Patient 1Phenotype A
Phenotype F
Phenotype NPhenotype W
Phenotype Z Phenotype W
Human Phenotype Ontology

“Pathways” and convergent phenotypesHPO phenotypes
~4,000 patientswith developmental
abnormalities
systematically phenotyped and
annotated using the Human Phenotype
Ontology (HPO)
Genes affected by copy number variants
in these patients genomes
Functional enrichment
tests

“Pathways” and convergent phenotypes
All patients with a specific
phenotype
Patients with the specific henotype whose variant genes form part of a particular “pathway”:
Q: Are these patients more phenotypically-
similar?
p

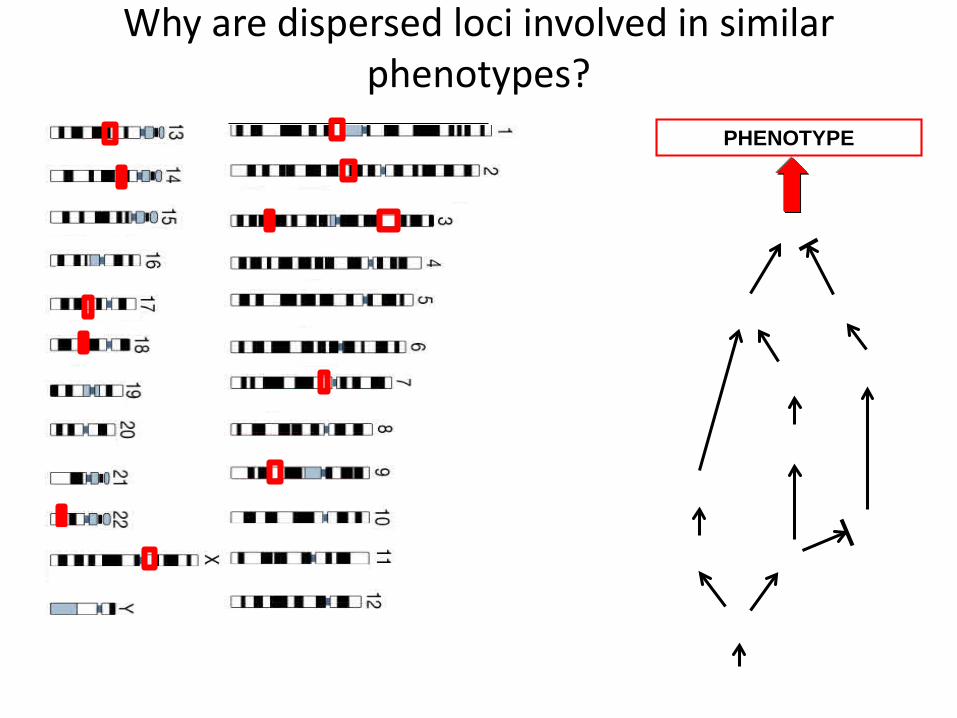
Similarity in patients whose variant genes contribute to the same “pathway” term
phenotypically similar patients
share term
Random
phenotypically dissimilar
patients share term
PMID: 25781962

Same pathway = patients share a more specific phenotype?
A
A1 A2
A1a A1b A2a
B
B1 B2
B1a B1b B2a
C
C1 C2
C1a C1b C2a
Same “pathway” = more specific phenotype
Same “pathway” = similar patterns of phenotypes
Pathway associated phenotype
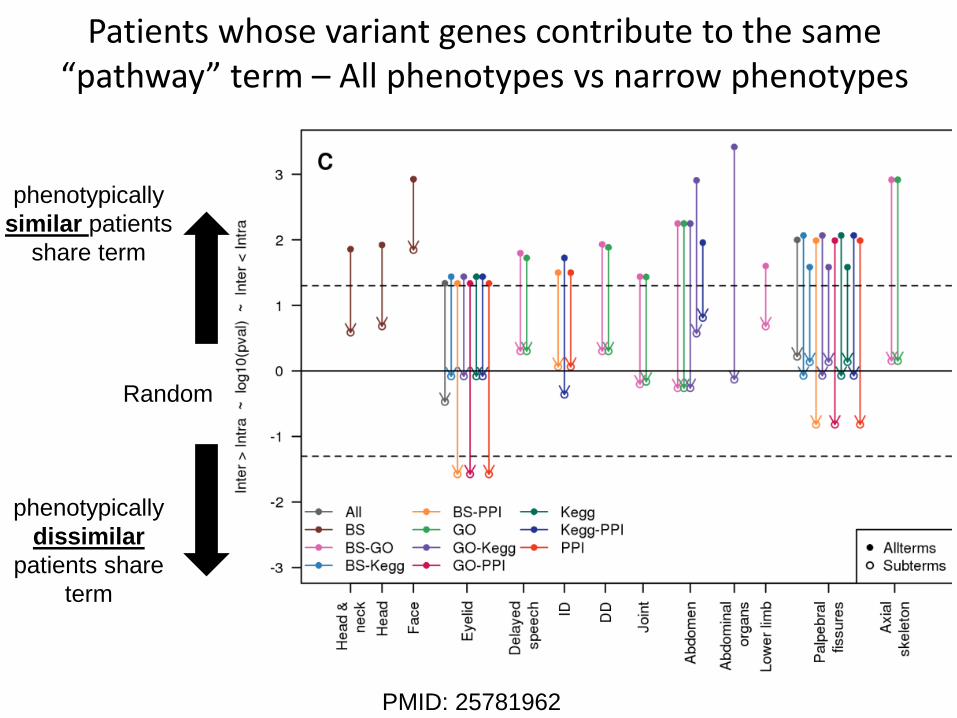
Patients whose variant genes contribute to the same “pathway” term – All phenotypes vs narrow phenotypes
phenotypically similar patients
share term
Random
phenotypically dissimilar
patients share term
PMID: 25781962

Same pathway = same pattern of phenotypes
A
A1 A2
A1a A1b A2a
B
B1 B2
B1a B1b B2a
C
C1 C2
C1a C1b C2a
Same “pathway” = similar patterns of phenotype

Take homes
1. Patients whose variants disrupt the same “pathway” share a broad range of phenotypic similarities

Functionally-linking genes through orthogonal data sources
protein interaction from high-
throughput study
protein interaction from low-
throughput study
Similar gene annotations
Mouse models have similar phenotypes
Genetically-interact in yeast
What does functionally-similar mean?
Do I trust these experiments equally?
What is the chance of seeing this by random?

Functional-linkage networks: Integration of functional genomics resources to identify
human disease genes
A B C
D E F
a gene
Protein interactiongene co-expressionintegrated

Predicting human phenotypic associations
Increasing similarity in “functionality” between genes
Pair of genes
Pair of genesUninformativeRandom
human disease phenotypes
associated with both genes are
similar
human disease phenotypes
associated with both genes are
dissimilar

Ability to predict whether 2 genes are involved in the same disorder
The value of mouse phenotypic data (MGI) compared to Gene Ontology (GO) annotations
Increasing similarity in functional annotation (either GO or MGI) between genes
Predict they are
Predict they are not
Know nothing

Weighting functional informationThe data types are assessed and weighted according to how well they predict
shared mouse phenotypesMouse orthologue KO
phenotypes
more simila
less simila
Gene expression
r
r
PMID: 25166029

Comparison of functional data sources
Mouse orthologue KO phenotypes
more similar
less similar
Frank HontiPMID: 25166029

Comparison of functional data sources
Mouse orthologue KO phenotypes
more simil
less simila
ar
r
Frank HontiPMID: 25166029
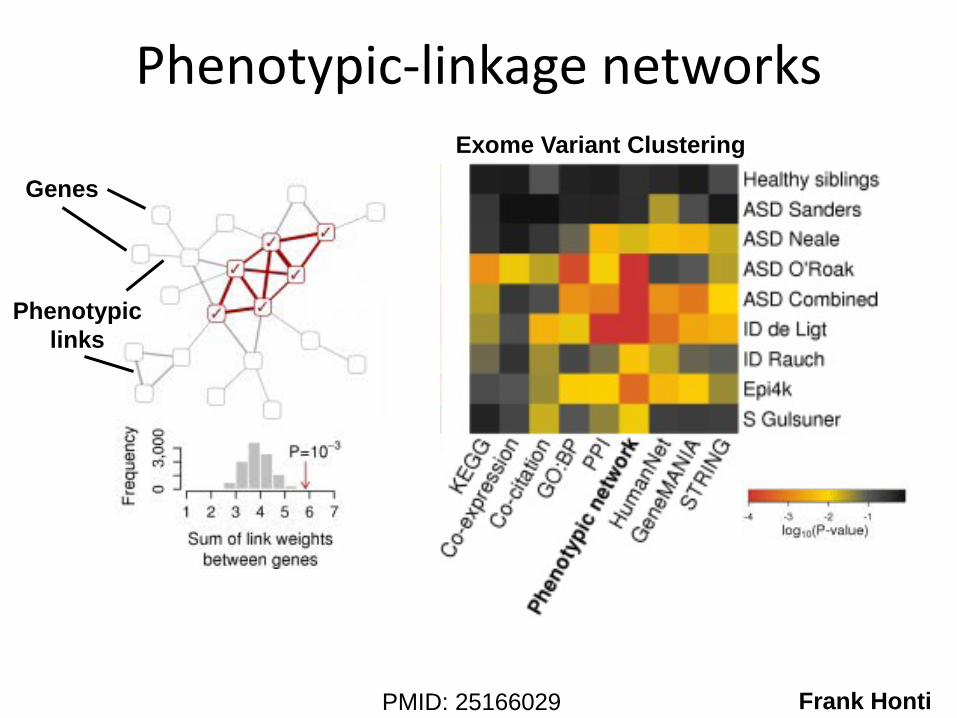
Phenotypic-linkage networks
Genes
Phenotypic links
Exome Variant Clustering
Frank HontiPMID: 25166029

Disorder-specific networks – tuning data to specific disorders
Type 2 Diabetes relevant phenotypes
more similar diabetes-relevant
phenotypes
less similar diabetes-relevant
phenotypes
Gene property
Cyn
MP:0005379 endocrine/exocrine gland phenotypeMP:0005376 homeostasis/metabolism phenotypeMP:0005375 adipose tissue phenotype
thia Sandor
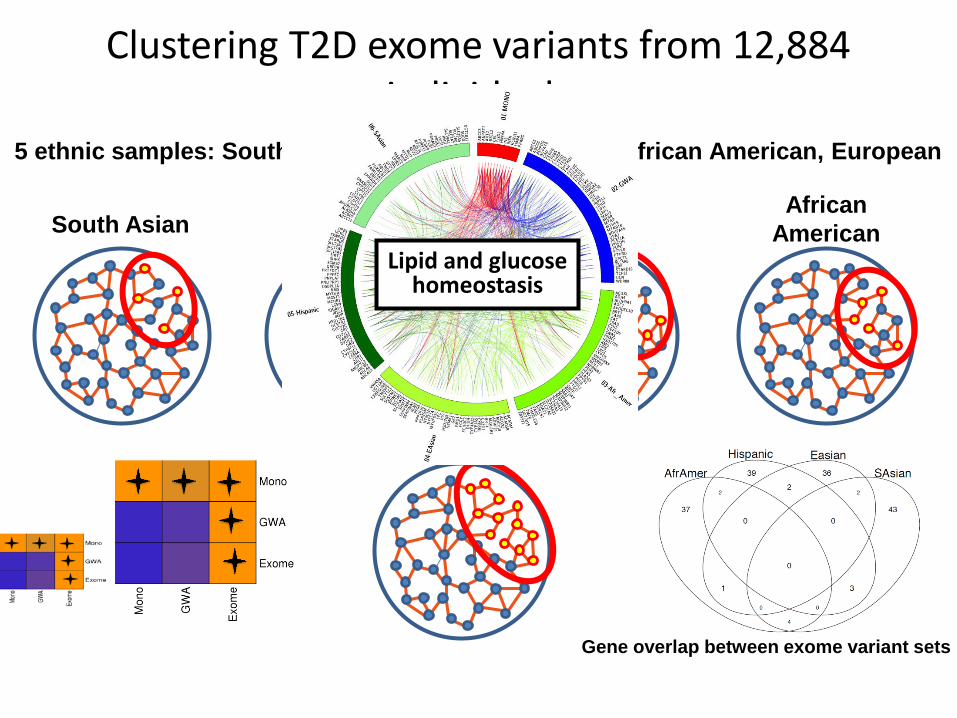
Gene overlap between exome variant sets
East Asian South Asian African
AmericanHispanic
Clustering T2D exome variants from 12,884 individuals
5 ethnic samples: South Asian, East Asian, Hispanic, African American, European
Lipid and glucose homeostasis

Take homes
1. Patients whose variants disrupt the same “pathway” share a broad range of phenotypic similarities
2. Use the mouse phenotypic data to evaluate other functional data, especially for particular phenotypes of interest

Steinberg et al, NAR,
Pred
ictio
n A
ccur
acy
(MC
C)
Study Bias in haploinsufficiency prediction
Human Data
Mouse Data

Take homes
1. Patients whose variants disrupt the same “pathway” share a broad range of phenotypic similarities
2. Use the mouse phenotypic data to evaluate other functional data, especially for particular phenotypes of interest
3. We need less studied genes phenotyped to help our estimates of variant deleteriousness

Disease Genomics Programme, FGU, Oxford University
Webber Group
Stuart Grice Avi Taylor Cynthia Sandor Steph Millin Tallulah Andrews
Viola Volpato Frank Wessely Kieran Campbell Katarina Vrcelj Julia Steinberg
Diabetes exomes in collaboration with Mark McCarthy;Nijmegen CNVs with Bert DeVries