Embed Size (px)
Citation preview
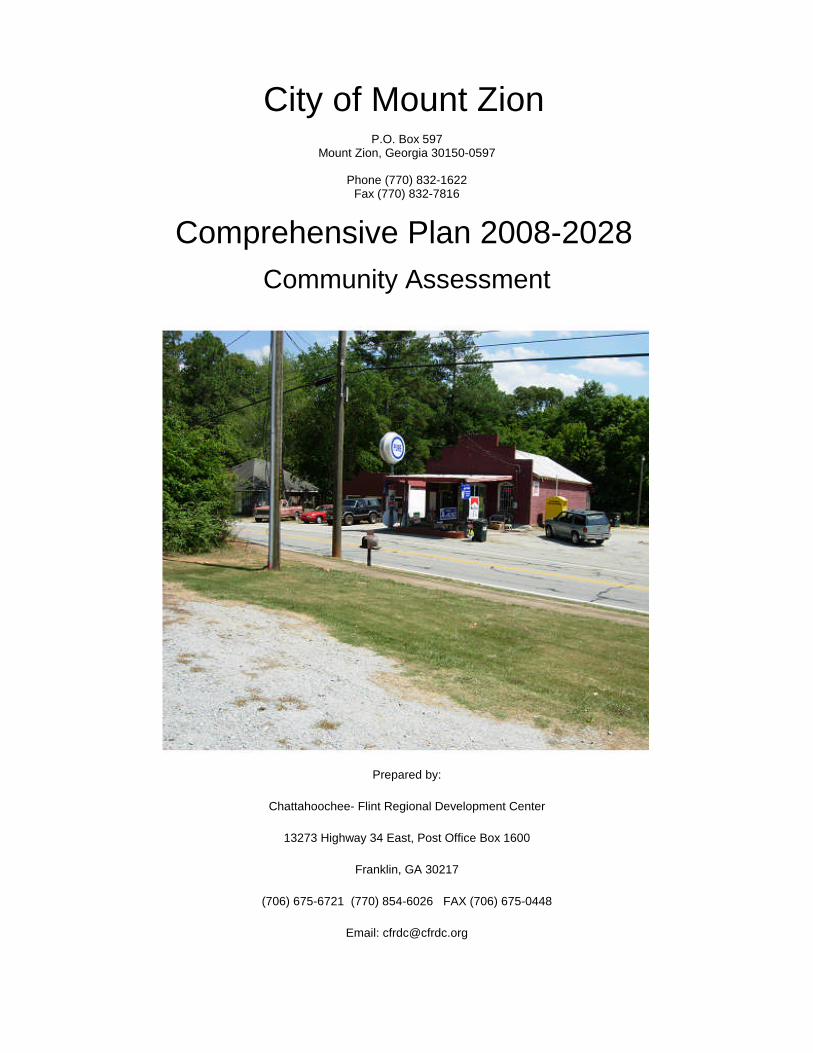
City of Mount ZionP.O. Box 597
Mount Zion, Georgia 30150-0597
Phone (770) 832-1622Fax (770) 832-7816
Comprehensive Plan 2008-2028
Community Assessment
Prepared by:
Chattahoochee- Flint Regional Development Center
13273 Highway 34 East, Post Office Box 1600
Franklin, GA 30217
(706) 675-6721 (770) 854-6026 FAX (706) 675-0448
Email: [email protected]
Page 2 of 2
CITY OF MOUNT ZION
COMPREHENSIVE PLAN
2008 - 2028
Sue Bloodworth - Mayor
Donald Newnan - Council Member
Ellis Webb - Council Member
Jane Cammons - Council Member
Kathy Albright - Council Member
Adopted by ResolutionOn:
December 16, 2008
Prepared with technical assistance by
CHATTAHOOCHEE-FLINT REGIONAL DEVELOPMENT CENTER
P. 0. Box 1600 Franklin, Georgia 30217
(404) 675-6721
Page 3 of 3
Table of Contents
INTRODUCTION 10
PREVIOUS PLAN 10
REQUIREMENTS 10
Community Assessment 10
Community Participation Program 10
Community Agenda 10
LIST OF POTENTIAL ISSUES AND OPPORTUNITIES 11
Population Trends 11
Households 11
Age 11
Race 12
Educational Attainment 12
Income 13
Economic Development 14
Employment by Industry Issues 14
Labor Force 15
Housing Occupancy 15
Housing Condition 15
Cost and Cost Burdened Housing 16
Special Housing Needs 17
Job-Housing Balance 17
Natural and cultural Resources 17
Other Environmentally Sensitive Areas 18
Significant Natural Resources 18
Recreation Areas 18
Significant Cultural Areas 19
Page 4 of 4
Sewage System and Wastewater Treatment 19
Fire Protection 20
Police 20
Storm Water Management 20
Solid Waste Management 21
ANALYSIS OF EXISTING DEVELOPMENT PATTERNS 23
ANALYSIS OF CONSISTENCY WITH QUALITY COMMUNITY
OBJECTIVES 25
COMPLIANCE WITH RULES FOR ENVIRONMENTAL PLANNING
CRITERIA 35
UPDATE OF SERVICE DELIVERY STRATEGY 35
Community Assessment - Appendix 36
ANALYSIS OF SUPPORTING DATA 37
IDENTIFICATION OF POTENTIAL ISSUES 37
POPULATION 37
Issues 39
ECONOMIC DEVELOPMENT 44
Economic Base 45
Labor Force 49
HOUSING 51
Housing Types and Mixes 51
Housing Occupancy 52
Housing Condition 53
Cost and Cost Burdened Housing 54
Special Housing Needs 55
Job-Housing Balance 56
Page 5 of 5
NATURAL AND CULTURAL RESOURCES 58
Environmental Planning Criteria 58
Other Environmentally Sensitive Areas 59
Significant Natural Resources 60
Scenic Views 60
Agricultural Land & Forest Land 60
Soil Descriptions 62
Recreation Areas 63
J. Ebb Duncan Lake 63
John Tanner State Park 63
Dillard Park 63
Community/Senior Center 63
Conservation Areas 63
Significant Cultural Areas 64
Community Facilities and Services 67
Water Supply and Treatment 67
Sewage System and Wastewater Treatment 67
Septic Tanks 68
Public Safety 68
Fire Protection 68
Police 69
Emergency Medical Service 70
Solid Waste Management 70
Sources for the Community Assessment 72
Figure 6 – Transmittal Resolution 72
Page 6 of 6
FIGURES
Figure 1 - Geographic Location ......................................8
Figure 2 - Location Map .............................................9
Figure 3 - Existing Land Use Map ...................................22
Figure 4 - Recommended Character Areas .............................24
Figure 5 - Map of Significant Natural Resources ....................57
Figure 6 – Transmittal Resolution ..................................73
Figure 7 - Approval Letter from DCA ................................74
Figure 8 – Adoption Resolution .....................................75
Page 7 of 7
Tables
Table 1– Assessment of Consistency with Quality Community Objective ....... 25
Table 2- Mount Zion Population ............................................ 37
Table 3 - Carroll County Population ....................................... 37
Table 4 - Mount Zion Number of Households ................................. 38
Table 5 – Carroll County Number of Households ............................. 38
Table 6 – Population by Age ............................................... 39
Table 7 – Mount Zion Racial Composition ................................... 40
Table 8 – Mount Zion Educational Attainment ............................... 42
Table 9 – Mount Zion Per Capita Income .................................... 43
Table 10 – Carroll County Per Capita Income ............................... 43
Table 11 – State Per Capita Income ........................................ 43
Table 12 – Average Household Income City, County, State ................... 44
Table 13 – Employment by Industry Mount Zion and Carroll County ........... 48
Table 14 – Labor Force Participation Mount Zion and Carroll County ........ 49
Table 15 – Mount Zion Types of Housing .................................... 51
Table 16 – Occupancy Characteristics Mount Zion and Carroll County ........ 52
Table 17 – Condition of Housing, Mount Zion, Carroll County, State ........ 53
Table 18 – Housing Cost Mount Zion, Carroll County, State ................. 54
Table 19 – Cost Burdened Mount Zion, Carroll County, State ................ 55
Table 20 – Mount Zion Protected Animals and Plants ........................ 60
Table 21 – Mount Zion Soils ............................................... 61
Table 22 – Significant Cultural Resources ................................. 65
Table 23 - Carroll County Water Authority Units Sold to Mount Zion ........ 67
Table 24 – Solid Waste Generation Projections ............................. 71
Page 8 of 8
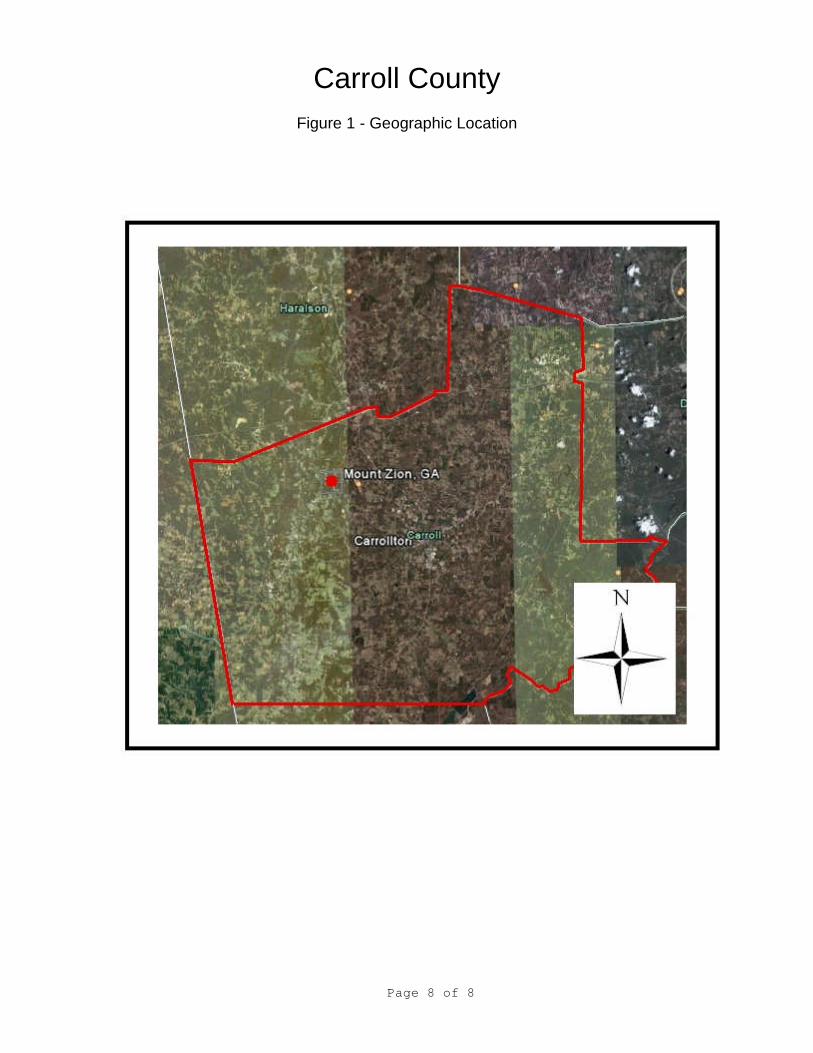
Carroll County
Figure 1 - Geographic Location
Page 9 of 9
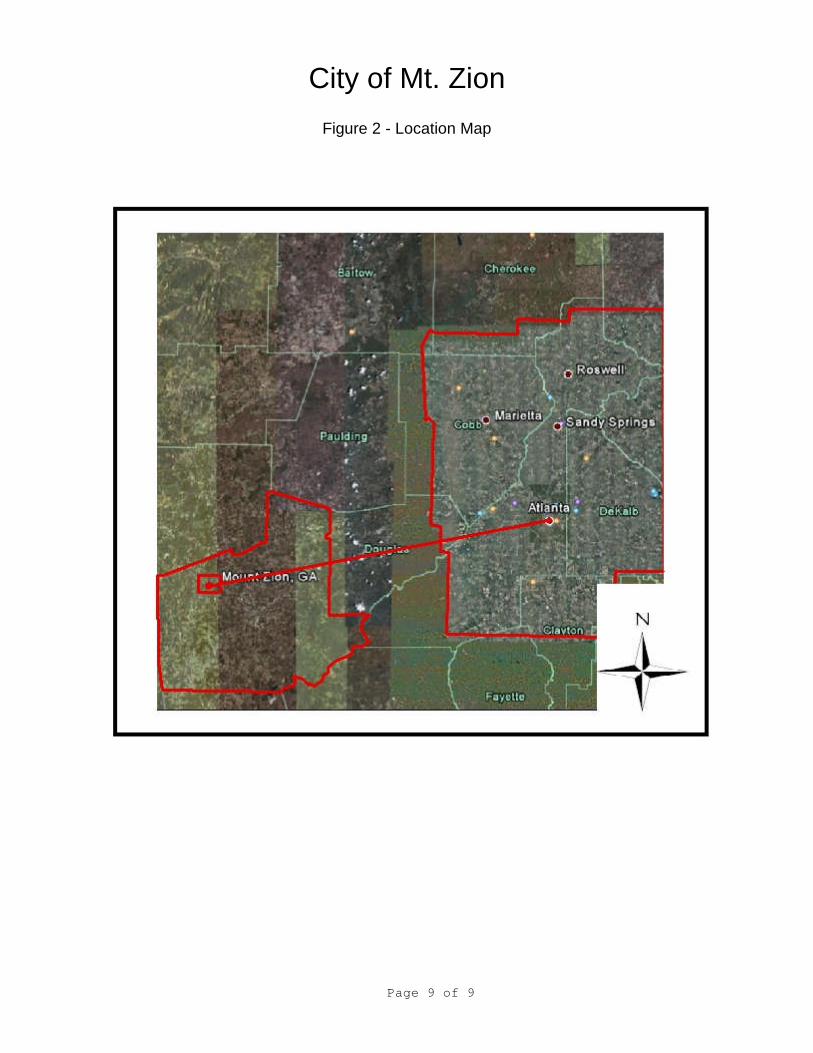
City of Mt. Zion
Figure 2 - Location Map
Page 10 of 10
INTRODUCTION
PREVIOUS PLAN
Mount Zion previous Comprehensive Plan looked at the City’s needs and resources to the year 2012 andemployed the Intermediate Planning Standards. After review by the Department of Community Affairs(DCA) it was determined that the City could plan under the Basic Standards as required by DCA. Thus,this plan update will employ the new standards and format under the Basic Plan Standards.
REQUIREMENTS
In May of 2005, the Department of Community affairs changed the requirements to the body of thecomprehensive plans. A Basic Planning Level applies to Georgia counties and municipalities locatedwithin counties that fall within the following thresholds:
A population of 15,000 to 19,999 with an average annual growth rate of less than 2.50% for theprevious decade; or
A population of less than 15,000
Basic Planning Level plans must include the following components: (1) A Community Assessment (2) ACommunity Participation Program (3) A Community Agenda
Community Assessment
The first part of the comprehensive plan is an objective and professional assessment of data andinformation about the community that is intended to be prepared without extensive direct publicparticipation.
Community Participation Program
The second part of the comprehensive plan is a Community Participation Program that describes thelocal government’s strategy for ensuring adequate public and stakeholder involvement in the preparationof the Community Agenda portion of the plan.
Community Agenda
The third part of the comprehensive plan is the most important, for it includes the community’s vision forthe future as well as its strategy for achieving this vision.
Page 11 of 11
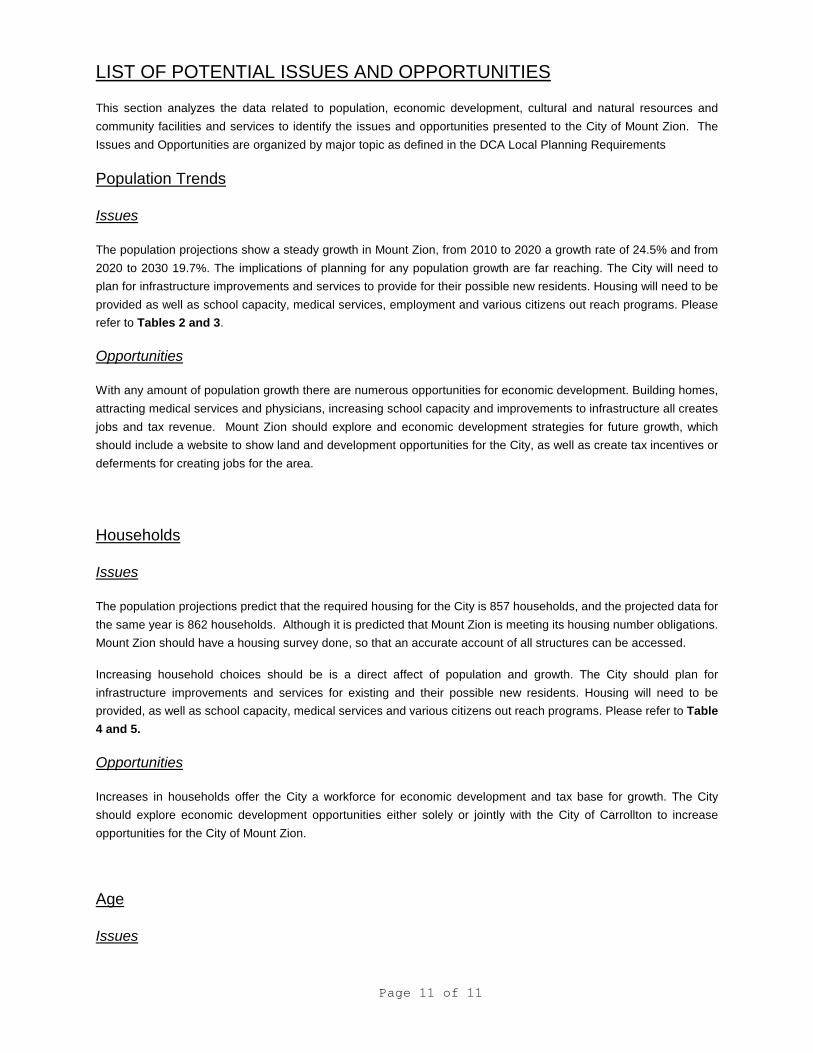
LIST OF POTENTIAL ISSUES AND OPPORTUNITIES
This section analyzes the data related to population, economic development, cultural and natural resources and
community facilities and services to identify the issues and opportunities presented to the City of Mount Zion. The
Issues and Opportunities are organized by major topic as defined in the DCA Local Planning Requirements
Population Trends
Issues
The population projections show a steady growth in Mount Zion, from 2010 to 2020 a growth rate of 24.5% and from
2020 to 2030 19.7%. The implications of planning for any population growth are far reaching. The City will need to
plan for infrastructure improvements and services to provide for their possible new residents. Housing will need to be
provided as well as school capacity, medical services, employment and various citizens out reach programs. Please
refer to Tables 2 and 3.
Opportunities
With any amount of population growth there are numerous opportunities for economic development. Building homes,
attracting medical services and physicians, increasing school capacity and improvements to infrastructure all creates
jobs and tax revenue. Mount Zion should explore and economic development strategies for future growth, which
should include a website to show land and development opportunities for the City, as well as create tax incentives or
deferments for creating jobs for the area.
Households
Issues
The population projections predict that the required housing for the City is 857 households, and the projected data for
the same year is 862 households. Although it is predicted that Mount Zion is meeting its housing number obligations.
Mount Zion should have a housing survey done, so that an accurate account of all structures can be accessed.
Increasing household choices should be is a direct affect of population and growth. The City should plan for
infrastructure improvements and services for existing and their possible new residents. Housing will need to be
provided, as well as school capacity, medical services and various citizens out reach programs. Please refer to Table
4 and 5.
Opportunities
Increases in households offer the City a workforce for economic development and tax base for growth. The City
should explore economic development opportunities either solely or jointly with the City of Carrollton to increase
opportunities for the City of Mount Zion.
Age
Issues
Page 12 of 12
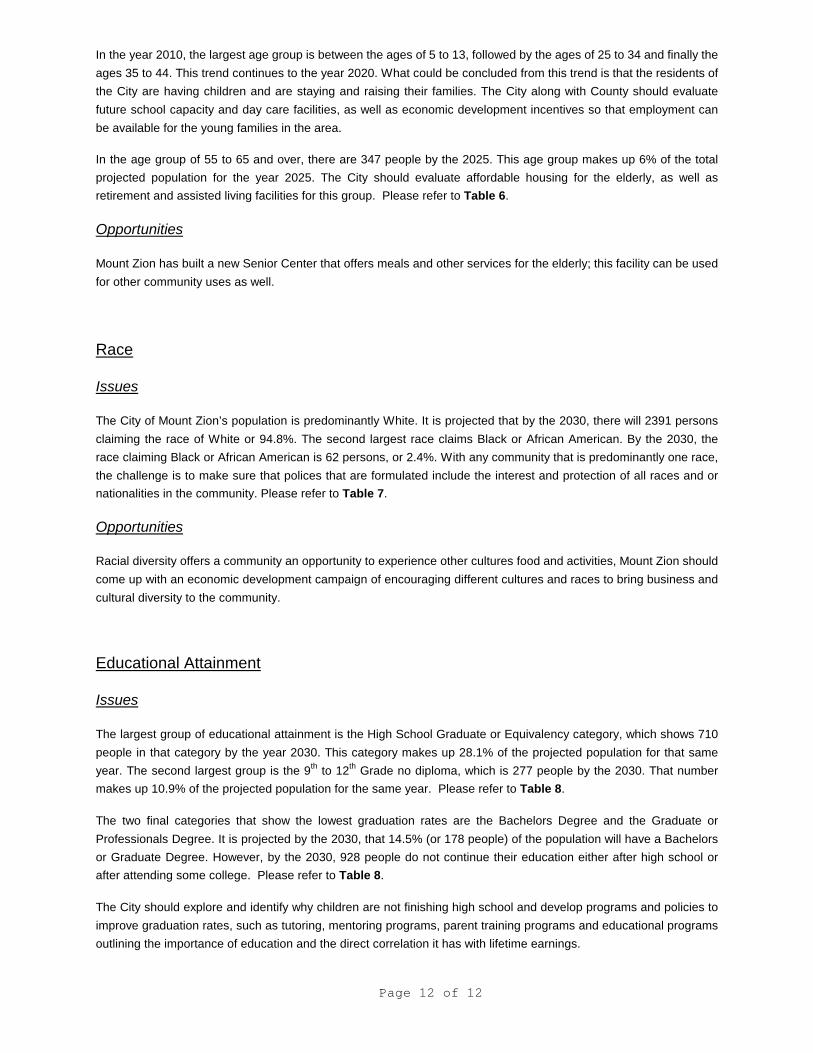
In the year 2010, the largest age group is between the ages of 5 to 13, followed by the ages of 25 to 34 and finally the
ages 35 to 44. This trend continues to the year 2020. What could be concluded from this trend is that the residents of
the City are having children and are staying and raising their families. The City along with County should evaluate
future school capacity and day care facilities, as well as economic development incentives so that employment can
be available for the young families in the area.
In the age group of 55 to 65 and over, there are 347 people by the 2025. This age group makes up 6% of the total
projected population for the year 2025. The City should evaluate affordable housing for the elderly, as well as
retirement and assisted living facilities for this group. Please refer to Table 6.
Opportunities
Mount Zion has built a new Senior Center that offers meals and other services for the elderly; this facility can be used
for other community uses as well.
Race
Issues
The City of Mount Zion’s population is predominantly White. It is projected that by the 2030, there will 2391 persons
claiming the race of White or 94.8%. The second largest race claims Black or African American. By the 2030, the
race claiming Black or African American is 62 persons, or 2.4%. With any community that is predominantly one race,
the challenge is to make sure that polices that are formulated include the interest and protection of all races and or
nationalities in the community. Please refer to Table 7.
Opportunities
Racial diversity offers a community an opportunity to experience other cultures food and activities, Mount Zion should
come up with an economic development campaign of encouraging different cultures and races to bring business and
cultural diversity to the community.
Educational Attainment
Issues
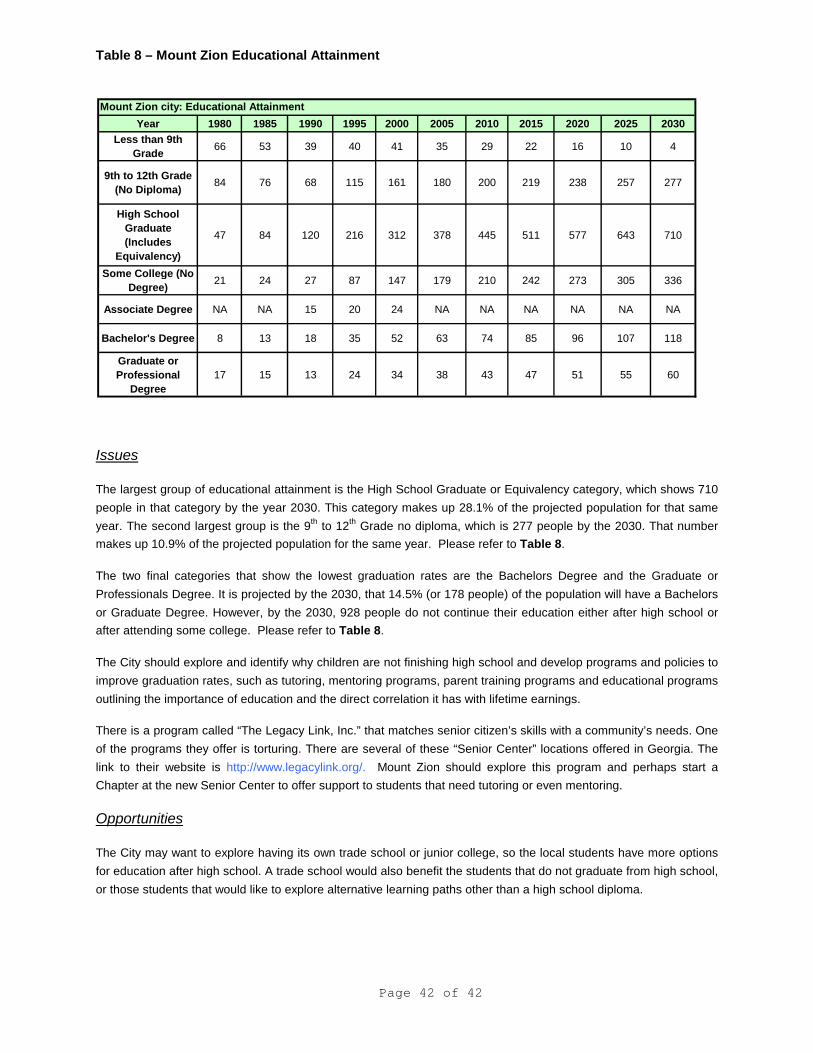
The largest group of educational attainment is the High School Graduate or Equivalency category, which shows 710
people in that category by the year 2030. This category makes up 28.1% of the projected population for that same
year. The second largest group is the 9th
to 12th
Grade no diploma, which is 277 people by the 2030. That number
makes up 10.9% of the projected population for the same year. Please refer to Table 8.
The two final categories that show the lowest graduation rates are the Bachelors Degree and the Graduate or
Professionals Degree. It is projected by the 2030, that 14.5% (or 178 people) of the population will have a Bachelors
or Graduate Degree. However, by the 2030, 928 people do not continue their education either after high school or
after attending some college. Please refer to Table 8.
The City should explore and identify why children are not finishing high school and develop programs and policies to
improve graduation rates, such as tutoring, mentoring programs, parent training programs and educational programs
outlining the importance of education and the direct correlation it has with lifetime earnings.
Page 13 of 13
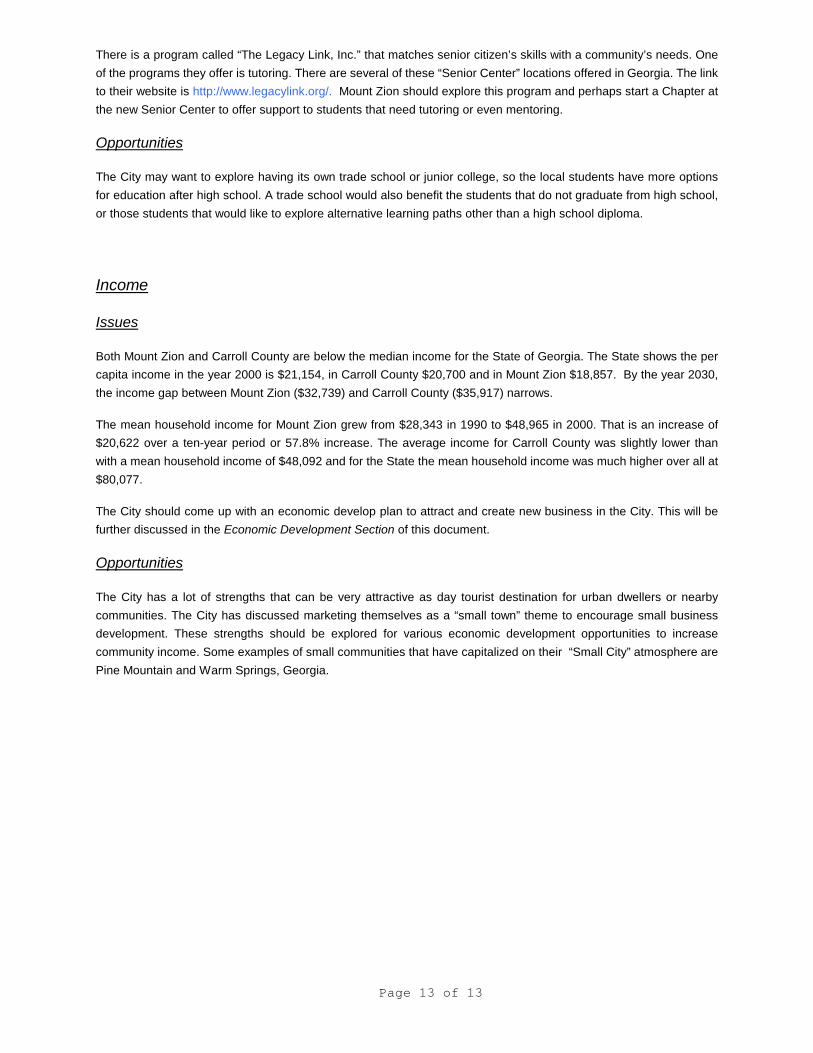
There is a program called “The Legacy Link, Inc.” that matches senior citizen’s skills with a community’s needs. One
of the programs they offer is tutoring. There are several of these “Senior Center” locations offered in Georgia. The link
to their website is http://www.legacylink.org/. Mount Zion should explore this program and perhaps start a Chapter at
the new Senior Center to offer support to students that need tutoring or even mentoring.
Opportunities
The City may want to explore having its own trade school or junior college, so the local students have more options
for education after high school. A trade school would also benefit the students that do not graduate from high school,
or those students that would like to explore alternative learning paths other than a high school diploma.
Income
Issues
Both Mount Zion and Carroll County are below the median income for the State of Georgia. The State shows the per
capita income in the year 2000 is $21,154, in Carroll County $20,700 and in Mount Zion $18,857. By the year 2030,
the income gap between Mount Zion ($32,739) and Carroll County ($35,917) narrows.
The mean household income for Mount Zion grew from $28,343 in 1990 to $48,965 in 2000. That is an increase of
$20,622 over a ten-year period or 57.8% increase. The average income for Carroll County was slightly lower than
with a mean household income of $48,092 and for the State the mean household income was much higher over all at
$80,077.
The City should come up with an economic develop plan to attract and create new business in the City. This will be
further discussed in the Economic Development Section of this document.
Opportunities
The City has a lot of strengths that can be very attractive as day tourist destination for urban dwellers or nearby
communities. The City has discussed marketing themselves as a “small town” theme to encourage small business
development. These strengths should be explored for various economic development opportunities to increase
community income. Some examples of small communities that have capitalized on their “Small City” atmosphere are
Pine Mountain and Warm Springs, Georgia.
Page 14 of 14
Economic Development
Issues
The City should establish a website of the various public officials and department contacts. This website should be
used as an update with news for residents and future meetings. In addition, the website should be elaborated on to
include economic development information and available parcels or areas, that the City would like to encourage
development or redevelopment.
The City of Mount Zion has a limited amount of funds for improvement to infrastructure to promote economic
development.
There has been no designated “City Center” or “Main Street” boundaries established through ordinance and or map.
Establishing a “main street” area is encouraged. It gives the economic development a geographical starting point.
The City may want to consider a theme or architectural style that would start and continue architectural continuity
throughout the City. There are not many vacant buildings available, but those that are available should be
redeveloped.
Opportunities
The greatest opportunity that the City has is its small town appearance and that it is virtually a blank slate to promote
and encourage growth and economic development. This means the City has an opportunity to market their city in
any manner or direction that they agree upon.
It is a plus to be located so near to the City of Carrollton, so the City can be marketed as a bedroom community.
The City also does offer the residents and visitors beautiful parks for recreation, such as John Tanner State Park and
J. Ebb Duncan Lake and multiple historic resources that give the City a unique character. These attributes should be
used as marketing tools for visitors and new residents to the City.
Employment by Industry
Issues
By the year 2030, 1,312 persons will be participating in the labor force. The three largest sectors of the economy are
Construction (177), Manufacturing (211) and Retail Trade (192). The three sectors that remain almost static or show
little to no growth are, Agriculture- Forestry- Fishing- Hunting- Mining, Transportation-Warehousing and Utilities,
Professional Scientific-Management -Administrative and Waste management and Public Administration.
Mount Zion needs more diversification of business sectors of employment to expand their tax base and encourage
economic development.
The City should also explore opening a trade school to add skilled labor and diversification to the employment base.
In addition, the trade school would add professional jobs for the City.
Opportunities
In the areas that are static, there a multiple opportunities to build off of. In agriculture, many communities are starting
community gardens and farmers markets, this can be attractor for local residents to regional residents. A farmer’s
market is an opportunity to use the land-zoned agriculture for an economic development purpose. Depending on the
Page 15 of 15
size of the land and harvest would be contingent on the jobs provided, but it is a wonderful use for vacant agriculture
zoned parcels.
Utilities jobs can be provided if grants are made available for infrastructure improvements and perhaps water or
sewer treatment facility can be built. This is a type of employment that does not suffer from fluctuations in the
economy.
Labor Force
Issues
In the year 2000, there were 952 people in the work force, 660 of those people were participating in the labor force or
69% of the total population. Total males were 502 compared to total females of 217. Males that are not considered in
the labor force were 106 and females that are not considered in the labor force were 186. There were zero men and
women in the armed forces. The amount of people in the workforce grew, as the population grew.
There is a need for more people in the work force as well as more varied available workforce in the City. There is also
a need as discussed before to create economic development from a theme or plan that the City decides upon.
Opportunities
There are opportunities to create growth in the City with a “small-town” theme such as, have a community garden and
farmers market, antique store, restaurants, novelty shops, hair salons, art studios, Live work art studios, expand on
recreational areas and facilities, create and attract day tourism revenue, plan yearly festivals and events.
Housing Occupancy
Issues
There are not enough housing units built to keep up with population growth, which for the year 2000 was 1,275
persons total for the City, and versus 501 houses built. There are very few options for renters in housing choices,
which in the City make up 19.1% and in the County 27.3%. The City should encourage re-use of vacant buildings for
rental housing.
Opportunities
There are opportunities for the City to look at providing more rentals housing opportunities and choices to their
citizens. The City and the County have high occupancy rates for homes ownership. The City needs to look at the
vacant buildings that they have and encourage the owner to rehab them into rentals units.
Housing Condition
Issues
Of the 501 total housing units in Mount Zion for the year 2000, 4 lacks complete plumbing facilities, and 8 lacks
complete kitchen facilities. In Carroll County, of the 34, 067 total units, 252 lacks complete plumbing facilities and
274 lack complete kitchen facilities.
Page 16 of 16
The City should identify the location, owner and use of the units that do not have complete plumbing facilities and
work on monies or grants to address those housing units. It should also be viewed as a public health issue, such as
the waste from an outhouse could have the opportunity to contaminate the ground water.
Opportunities
There is an opportunity for community participation in updating or assisting those residents that do not have updated
plumbing facilities through grants and community donations from local businesses. It should be a goal of the City to
make sure that all the residents have indoor plumbing facilities.
Cost and Cost Burdened Housing
Issues
In the year 2000, the City showed a cost burden amount of 23 persons or 1.8% of the total population. However, the
City shows a slightly greater amount of severely cost burdened persons at 29 or 2.2% of the total population.
Although Mount Zion’s numbers are not very high, (these numbers are from 2000) affordable housing is an issue that
is a problem that many communities not just in Georgia, but the Country face. How to provide affordable housing in a
community is as varied as the places themselves.
One factor that everyone can agree on is, affordable housing is an essential tool for economic development and
community prosperity. If your workforce cannot afford to live in the community that it works, it can pose special
challenges to the community. People are more invested in the community where they live and not as invested in a
community where they only work. In addition, with the gas rising to all time highs, people are going to want to shorten
their commute or eliminate them all together. The retiree or disabled component to affordable housing; the community
should explore housing cost alternatives for seniors and the disabled on a fixed income. Please refer to Table 18 and
19.
Opportunities
Providing affordable housing is a wonderful opportunity for the community to shape the communities housing stock in
any fashion that would like. Some examples would be requiring that developers seeking to build with in the
community provide a certain amount of affordable housing.
Redevelopment of abandoned buildings is a great way to provide affordable housing as well as modular or
manufactured homes (which is explained in the housing section of this document), which is an ecstatically pleasing
and cost effective way of providing affordable housing.
Page 17 of 17
Special Housing Needs
There is no special housing available within the City of Mt. Zion.
Issues
The City does have an aging population. The City should evaluate their affordable special housing needs for seniors.
In addition, the City should encourage building assisted living facilities as well as nursing homes.
Opportunities
Providing special needs housing is another means of generating economic development for the City.
Job-Housing Balance
Issues
In the year 2005, the per capita income for the City of Mount Zion was $18,857. Under the definition of cost burden
households an individual could not afford more than $471.42 for monthly housing costs. In the year 2000, the City’s
of Mount Zion’s median rent was $586.00 per month and a median property value of $82,700. With a property valued
of $82,700 would translate approximately into a house payment of $827.00 per month. In the year 2010, it is
predicted that the per capita income will be $21,633, which would allow for $540.82 for monthly housing costs.
With a per captia income in the City of $18, 857 in 2005, rental housing is much more obtainable than home
ownership, but the rents are even high for that per capita income. The City should explore manufactured or modular
homes as an alternative to mobile homes and trailers, and as another form of rental housing.
Opportunities
Because the City has only a few housing types, this allows the City the opportunity to set design guidelines for the
zoning ordinance, or a stand-alone ordinance.
Natural and cultural Resources
Issues
Wetlands are an integral part of the natural water system and are defined by three parameters: hydrologic conditions,
hydric soils, and hydrophilic vegetation. According to the U.S. Fish and Wildlife Service's National Wetlands
Inventory, Mount Zion has several small areas identified as freshwater wetland habitats. The wetland locations are
shown on page 56, Figure 5.
The City should identify and map the areas of wetlands in the City for protection of development.
The City limits of Mount Zion lies totally within the Little Tallapoosa River watershed basin. The primary source of raw
water for Carrollton is the Upper Little Tallapoosa River (ULTR). The City should map and identify the areas that are
part of the watershed and the ground water discharge.
Opportunities
Page 18 of 18
Wetlands are another opportunity for the City to use what they have to their advantage. Wetlands produce and
house an entire ecosystem that many cities in Florida have been used as an attractor for bird and wildlife watchers,
artists and outdoors enthusiasts.
Other Environmentally Sensitive Areas
Issues
In the City of Mount Zion, drinking water is obtained from two equally sensitive sources: groundwater and surface
water. Both these resources respond to environmental stressors and require adequate protective measures to insure
their quality.
The City of Mount Zion is located within the Central Uplands physiographic district, which is characterized by low
linear ridges 1300-1500 feet above sea level, separated by broad, open valleys.
In the last update it was discussed that the Flood Protection Ordinance is administered on behalf of the City by the
County Codes Enforcement program, a review of the effectiveness of this program is needed to determine whether
any changes or further regulation is warranted.
Again septic tanks should be inspected to determine their effectiveness from contaminating groundwater.
Opportunities
None at this time
Significant Natural Resources
Issues
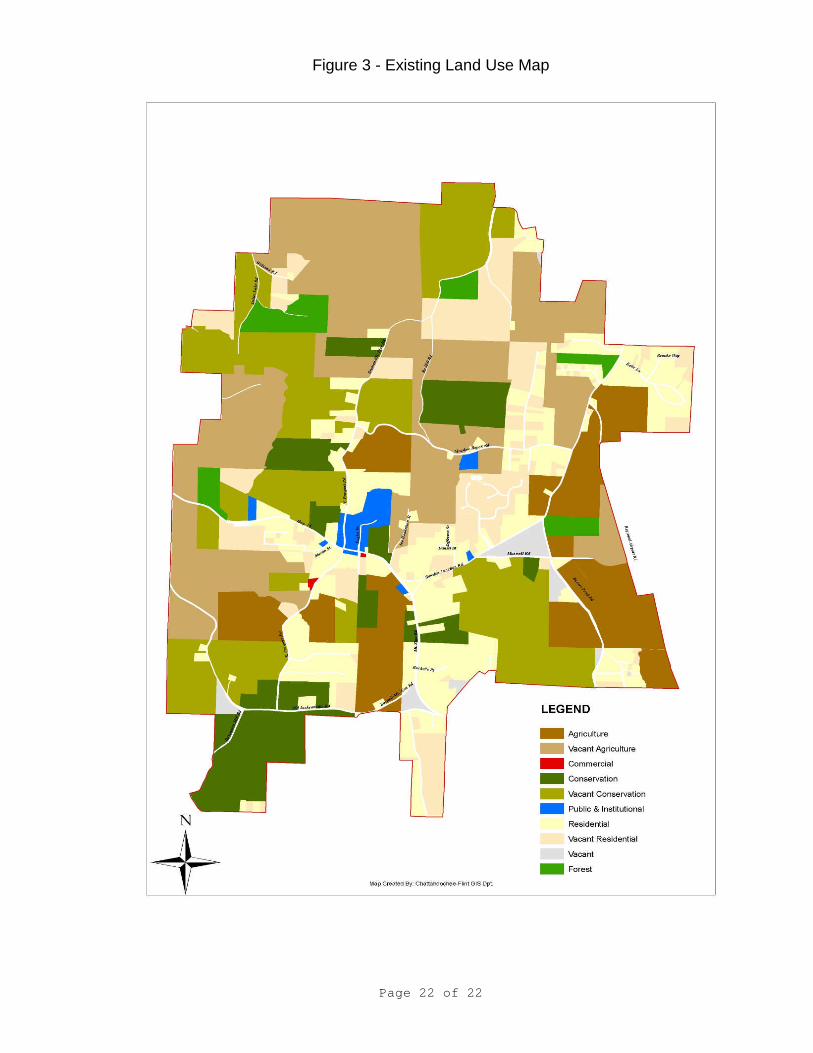
Based on assessment of parcels from the Existing Land Use Map in Figure 3 and the Mount Zion Zoning Map, the
City has an abundance of Agricultural zoned land. The City should look at their inventory of agricultural land and see
if there are changes they would like to make to certain parcels of that designation.
Due to the lush land and abundance of trees, the City should explore adopting a tree ordinance to protect the old
trees and maintain the lush environment that presently exists.
Opportunities
The City has a lot of agricultural land that can be used to supply fresh fruits and vegetable directly to its residents, by
way of a local farmers market. The City needs to explore ways to use the agriculture-zoned land to its advantage.
Agriculture touring is becoming very popular in Georgia and other states. The City should look at tours as another
means of an economic opportunity.
Recreation Areas
Issues
Page 19 of 19
The City presently has no designated public park area. Although the City is looking into annexing John Tanner State
park, since they already some services to the park.
The City should promote their recreation areas as tool for economic development, in alignment with the theme of
“Day Tourism”. In addition, J. Ebb Duncan Lake agreement needs to be revisited in regards to the City’s public
ownership of the Lake and the uses that the City would like to promote there.
Opportunities
Green Space is always a local attractor will become more and more scarce as Georgia continues to grow. One of
Mount Zion’s strengths is its amount of green space available to its residents. Mount Zion needs to continue to
improvement the recreation areas that it presently has and to plan for future recreation and parks.
Significant Cultural Areas
Issues
A Windshield Survey of Historic Resources conducted on July 24, 2008 by Jack Dorsey, local historian and resident
of Mount Zion, and Carter Thompson, Senior Planner CFRDC, identified over 70 structures that were over 50 years
old. Six (6) of these historic structures are listed in the Table 22.
The City will need a more thorough survey made with someone from the State Historic Preservation Department to
determine what structures would be eligible for designation to the National Historic Register. The City needs to work
the National Register of Historic Places in determining if any of the resources listed above could be designated on the
National Register.
Opportunities
Historic resources give the City its character; it has been discussed at the kick off meeting that a theme to future
development of the City is to play off its past and small city appeal. The City should explore ways to use its historic
resources as an attractor for economic development and to maintain the unique character of the City.
Sewage System and Wastewater Treatment
Issues
Due to an ongoing drought that Georgia is facing, it is recommended that the City should prepare for their water
needs separate of the County. The City should look at innovative ways to conserve water through policies and
building code enforcement and the public should be educated on water conservation as well.
The City should pursue grants and low interest loans for a sewage and wastewater treatment system.
The City should to do an inventory of septic systems and evaluate the efficiency of those systems; especially those
located on the southern portion of the City that houses the ground water recharge area.
Opportunities
If the City can get some financial assistance for improving their infrastructure as a whole, this will aid in the economic
development for the City.
Page 20 of 20
Fire Protection
Issues
The City presently has one fire station located within the City limits; perhaps pursuing another would be worth
exploring for the safety and job creation benefits.
Opportunities
If a new station were located in the City it would provide emergency and fire services closer to the City’s residents.
The station would also provide jobs for the City’s residents.
Police
Issues
The Police Department is presently located within City Hall. The Police department needs a separate space from City
Hall to conduct daily operations. In addition, the department needs a holding cell for those arrested and waiting
transport to Carroll County jail.
The City has a problem with illegal drug use and selling. The Chief would like to explore ways to cut down on this
issue in the City.
Since the police department is taking care of code enforcement, the City should look at implementing a code
enforcement officer to the city payroll. In addition, the codes need to be updated to reflect the issues that the City is
having.
Opportunities
If the Police Department can expand, this may be another opportunity to create jobs and perhaps hire a new officer
that just takes care of code enforcement issues for the City.
Storm Water Management
Issues
The City presently does not provide any monitoring of storm water at this time.
The City should monitor their existing storm water ponds; because of the amount of groundwater they use for
drinking. A self-monitoring ordinance could be drafted for future development, which gives the responsibility of
monitoring to the homeowners associations or the developer, if the project is being developed in stages.
Opportunities
Monitoring storm water management gives the City and opportunity to ensures that chemicals or pollutants are not
getting into the ground water of their residents drinking water.
Page 21 of 21
Solid Waste Management
Issues
Presently the City does not have any recycling stations or centers in designated. The City should provide recycling
stations in the City for its residents and public works should develop a campaign to educate residents on the
importance of recycling and locations of the nearby stations that recyclables can be taken. Please refer to Table 24.
Opportunities
Education on recycling efforts and providing recycling stations or centers could provide the City’s residents with some
additional employment opportunities.
Page 22 of 22
Figure 3 - Existing Land Use Map
Page 23 of 23
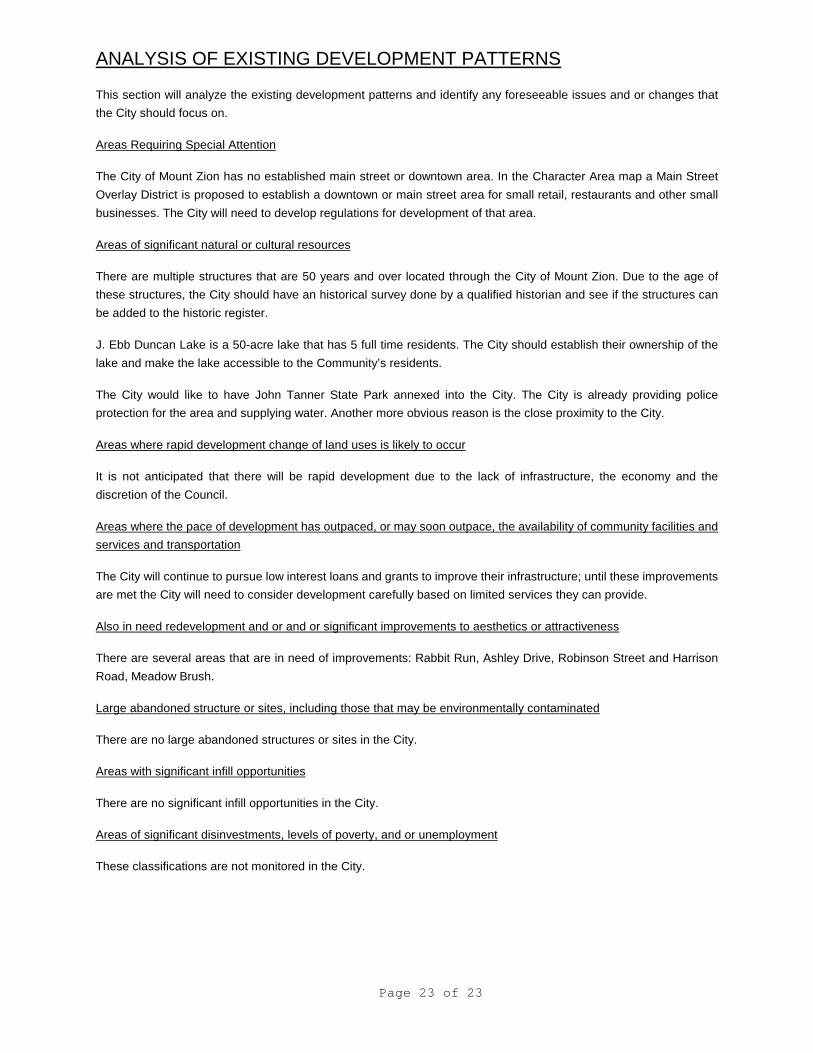
ANALYSIS OF EXISTING DEVELOPMENT PATTERNS
This section will analyze the existing development patterns and identify any foreseeable issues and or changes that
the City should focus on.
Areas Requiring Special Attention
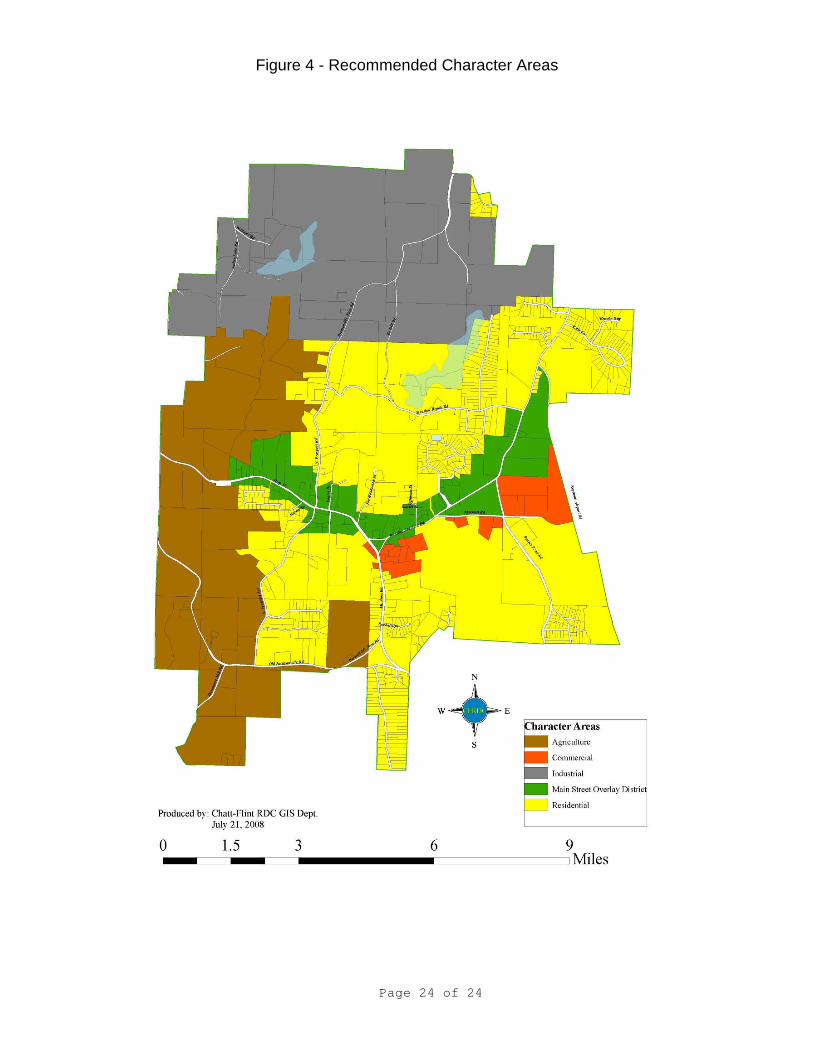
The City of Mount Zion has no established main street or downtown area. In the Character Area map a Main Street
Overlay District is proposed to establish a downtown or main street area for small retail, restaurants and other small
businesses. The City will need to develop regulations for development of that area.
Areas of significant natural or cultural resources
There are multiple structures that are 50 years and over located through the City of Mount Zion. Due to the age of
these structures, the City should have an historical survey done by a qualified historian and see if the structures can
be added to the historic register.
J. Ebb Duncan Lake is a 50-acre lake that has 5 full time residents. The City should establish their ownership of the
lake and make the lake accessible to the Community’s residents.
The City would like to have John Tanner State Park annexed into the City. The City is already providing police
protection for the area and supplying water. Another more obvious reason is the close proximity to the City.
Areas where rapid development change of land uses is likely to occur
It is not anticipated that there will be rapid development due to the lack of infrastructure, the economy and the
discretion of the Council.
Areas where the pace of development has outpaced, or may soon outpace, the availability of community facilities and
services and transportation
The City will continue to pursue low interest loans and grants to improve their infrastructure; until these improvements
are met the City will need to consider development carefully based on limited services they can provide.
Also in need redevelopment and or and or significant improvements to aesthetics or attractiveness
There are several areas that are in need of improvements: Rabbit Run, Ashley Drive, Robinson Street and Harrison
Road, Meadow Brush.
Large abandoned structure or sites, including those that may be environmentally contaminated
There are no large abandoned structures or sites in the City.
Areas with significant infill opportunities
There are no significant infill opportunities in the City.
Areas of significant disinvestments, levels of poverty, and or unemployment
These classifications are not monitored in the City.
Page 24 of 24
Figure 4 - Recommended Character Areas
Page 25 of 25
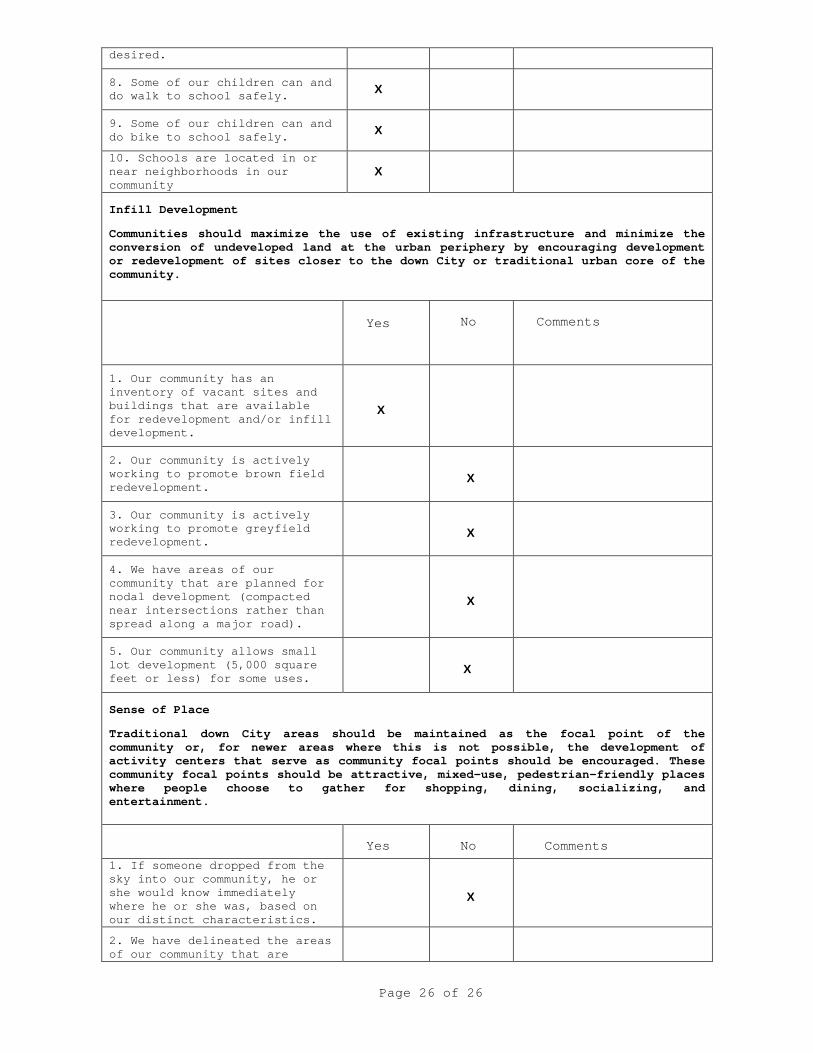
ANALYSIS OF CONSISTENCY WITH QUALITY COMMUNITY
OBJECTIVES
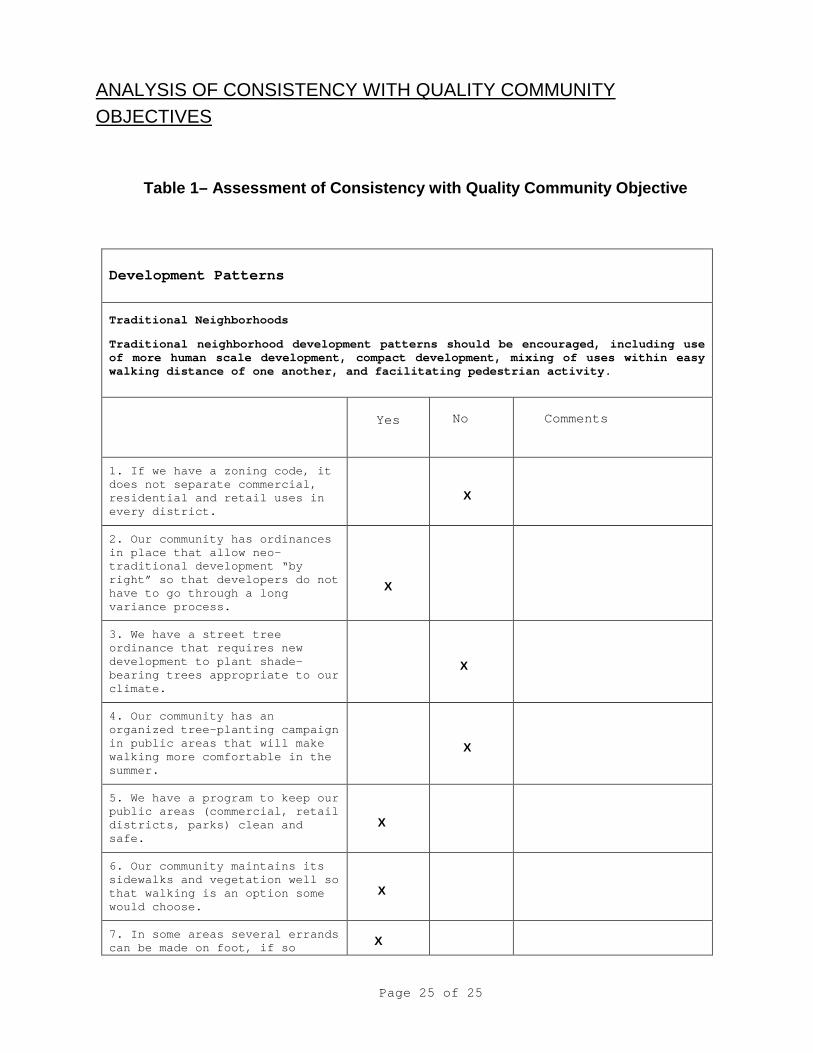
Table 1– Assessment of Consistency with Quality Community Objective
Development Patterns
Traditional Neighborhoods
Traditional neighborhood development patterns should be encouraged, including useof more human scale development, compact development, mixing of uses within easywalking distance of one another, and facilitating pedestrian activity.
Yes No Comments
1. If we have a zoning code, itdoes not separate commercial,residential and retail uses inevery district.
X
2. Our community has ordinancesin place that allow neo-traditional development “byright” so that developers do nothave to go through a longvariance process.
X
3. We have a street treeordinance that requires newdevelopment to plant shade-bearing trees appropriate to ourclimate.
X
4. Our community has anorganized tree-planting campaignin public areas that will makewalking more comfortable in thesummer.
X
5. We have a program to keep ourpublic areas (commercial, retaildistricts, parks) clean andsafe.
X
6. Our community maintains itssidewalks and vegetation well sothat walking is an option somewould choose.
X
7. In some areas several errandscan be made on foot, if so
X
Page 26 of 26
desired.
8. Some of our children can anddo walk to school safely.
X
9. Some of our children can anddo bike to school safely.
X
10. Schools are located in ornear neighborhoods in ourcommunity
X
Infill Development
Communities should maximize the use of existing infrastructure and minimize theconversion of undeveloped land at the urban periphery by encouraging developmentor redevelopment of sites closer to the down City or traditional urban core of thecommunity.
Yes No Comments
1. Our community has aninventory of vacant sites andbuildings that are availablefor redevelopment and/or infilldevelopment.
X
2. Our community is activelyworking to promote brown fieldredevelopment.
X
3. Our community is activelyworking to promote greyfieldredevelopment.
X
4. We have areas of ourcommunity that are planned fornodal development (compactednear intersections rather thanspread along a major road).
X
5. Our community allows smalllot development (5,000 squarefeet or less) for some uses.
X
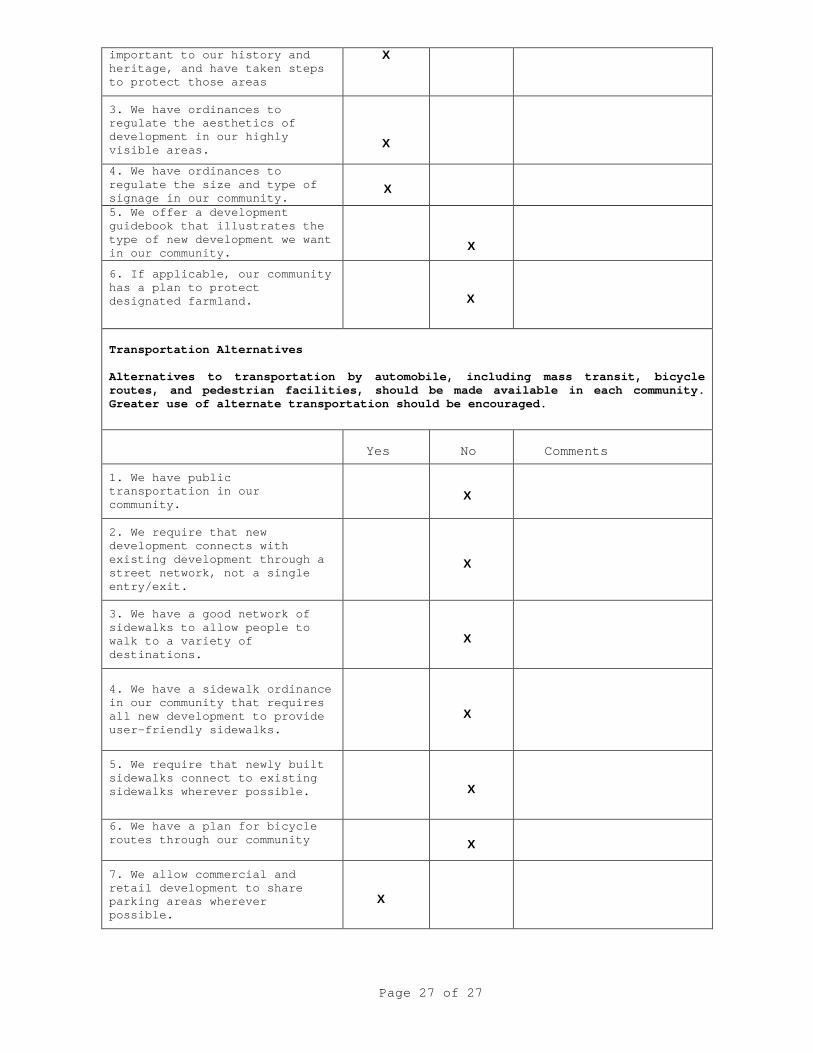
Sense of Place
Traditional down City areas should be maintained as the focal point of thecommunity or, for newer areas where this is not possible, the development ofactivity centers that serve as community focal points should be encouraged. Thesecommunity focal points should be attractive, mixed-use, pedestrian-friendly placeswhere people choose to gather for shopping, dining, socializing, andentertainment.
Yes No Comments
1. If someone dropped from thesky into our community, he orshe would know immediatelywhere he or she was, based onour distinct characteristics.
X
2. We have delineated the areasof our community that are
X
Page 27 of 27
important to our history andheritage, and have taken stepsto protect those areas
X
3. We have ordinances toregulate the aesthetics ofdevelopment in our highlyvisible areas.
X
4. We have ordinances toregulate the size and type ofsignage in our community.
X
5. We offer a developmentguidebook that illustrates thetype of new development we wantin our community.
X
6. If applicable, our communityhas a plan to protectdesignated farmland. X
Transportation Alternatives
Alternatives to transportation by automobile, including mass transit, bicycleroutes, and pedestrian facilities, should be made available in each community.Greater use of alternate transportation should be encouraged.
Yes No Comments
1. We have publictransportation in ourcommunity.
X
2. We require that newdevelopment connects withexisting development through astreet network, not a singleentry/exit.
X
3. We have a good network ofsidewalks to allow people towalk to a variety ofdestinations.
X
4. We have a sidewalk ordinancein our community that requiresall new development to provideuser-friendly sidewalks.
X
5. We require that newly builtsidewalks connect to existingsidewalks wherever possible. X
6. We have a plan for bicycleroutes through our community X
7. We allow commercial andretail development to shareparking areas whereverpossible.
X
Page 28 of 28
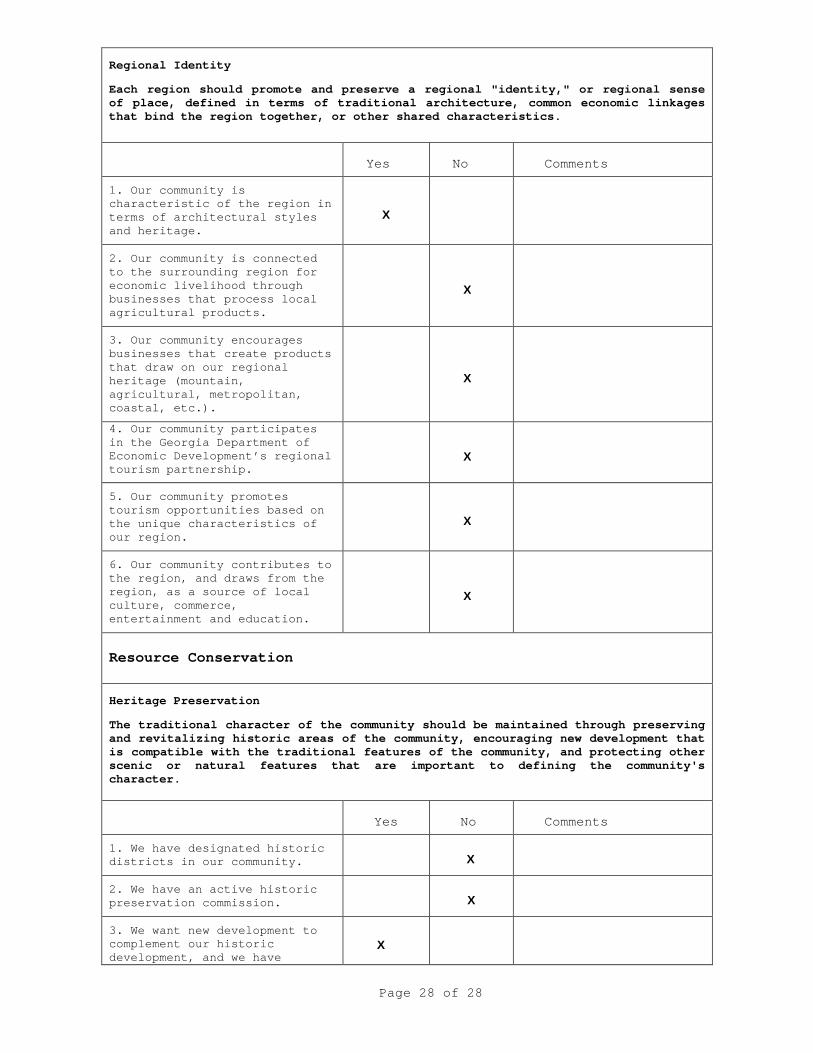
Regional Identity
Each region should promote and preserve a regional "identity," or regional senseof place, defined in terms of traditional architecture, common economic linkagesthat bind the region together, or other shared characteristics.
Yes No Comments
1. Our community ischaracteristic of the region interms of architectural stylesand heritage.
X
2. Our community is connectedto the surrounding region foreconomic livelihood throughbusinesses that process localagricultural products.
X
3. Our community encouragesbusinesses that create productsthat draw on our regionalheritage (mountain,agricultural, metropolitan,coastal, etc.).
X
4. Our community participatesin the Georgia Department ofEconomic Development’s regionaltourism partnership.
X
5. Our community promotestourism opportunities based onthe unique characteristics ofour region.
X
6. Our community contributes tothe region, and draws from theregion, as a source of localculture, commerce,entertainment and education.
X
Resource Conservation
Heritage Preservation
The traditional character of the community should be maintained through preservingand revitalizing historic areas of the community, encouraging new development thatis compatible with the traditional features of the community, and protecting otherscenic or natural features that are important to defining the community'scharacter.
Yes No Comments
1. We have designated historicdistricts in our community. X
2. We have an active historicpreservation commission. X
3. We want new development tocomplement our historicdevelopment, and we have
X
Page 29 of 29
ordinances in place to ensurethis.
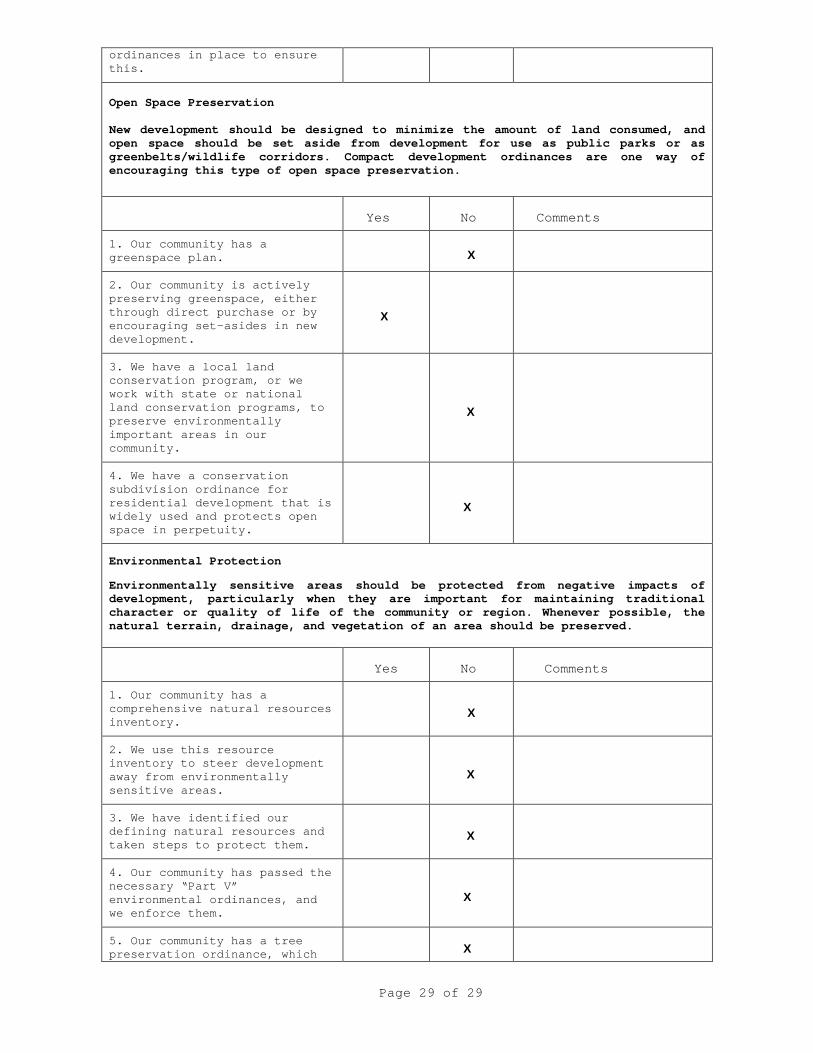
Open Space Preservation
New development should be designed to minimize the amount of land consumed, andopen space should be set aside from development for use as public parks or asgreenbelts/wildlife corridors. Compact development ordinances are one way ofencouraging this type of open space preservation.
Yes No Comments
1. Our community has agreenspace plan. X
2. Our community is activelypreserving greenspace, eitherthrough direct purchase or byencouraging set-asides in newdevelopment.
X
3. We have a local landconservation program, or wework with state or nationalland conservation programs, topreserve environmentallyimportant areas in ourcommunity.
X
4. We have a conservationsubdivision ordinance forresidential development that iswidely used and protects openspace in perpetuity.
X
Environmental Protection
Environmentally sensitive areas should be protected from negative impacts ofdevelopment, particularly when they are important for maintaining traditionalcharacter or quality of life of the community or region. Whenever possible, thenatural terrain, drainage, and vegetation of an area should be preserved.
Yes No Comments
1. Our community has acomprehensive natural resourcesinventory.
X
2. We use this resourceinventory to steer developmentaway from environmentallysensitive areas.
X
3. We have identified ourdefining natural resources andtaken steps to protect them.
X
4. Our community has passed thenecessary “Part V”environmental ordinances, andwe enforce them.
X
5. Our community has a treepreservation ordinance, which X
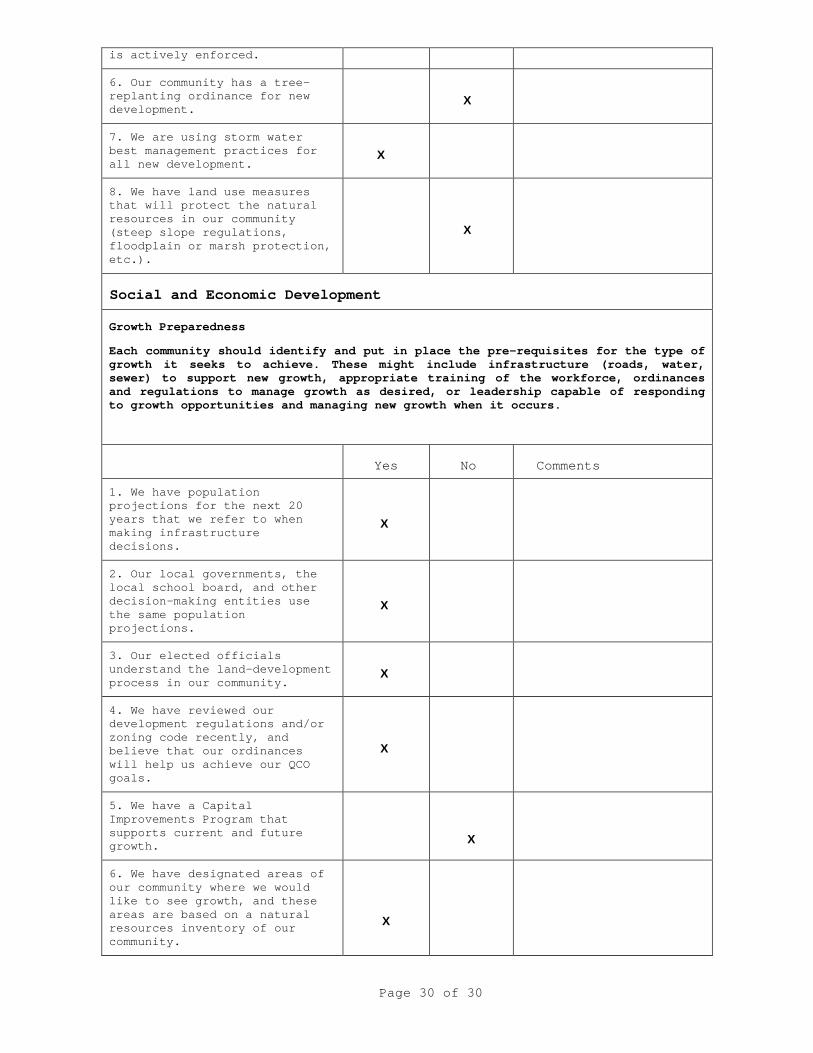
Page 30 of 30
is actively enforced.
6. Our community has a tree-replanting ordinance for newdevelopment.
X
7. We are using storm waterbest management practices forall new development.
X
8. We have land use measuresthat will protect the naturalresources in our community(steep slope regulations,floodplain or marsh protection,etc.).
X
Social and Economic Development
Growth Preparedness
Each community should identify and put in place the pre-requisites for the type ofgrowth it seeks to achieve. These might include infrastructure (roads, water,sewer) to support new growth, appropriate training of the workforce, ordinancesand regulations to manage growth as desired, or leadership capable of respondingto growth opportunities and managing new growth when it occurs.
Yes No Comments
1. We have populationprojections for the next 20years that we refer to whenmaking infrastructuredecisions.
X
2. Our local governments, thelocal school board, and otherdecision-making entities usethe same populationprojections.
X
3. Our elected officialsunderstand the land-developmentprocess in our community.
X
4. We have reviewed ourdevelopment regulations and/orzoning code recently, andbelieve that our ordinanceswill help us achieve our QCOgoals.
X
5. We have a CapitalImprovements Program thatsupports current and futuregrowth.
X
6. We have designated areas ofour community where we wouldlike to see growth, and theseareas are based on a naturalresources inventory of ourcommunity.
X
Page 31 of 31
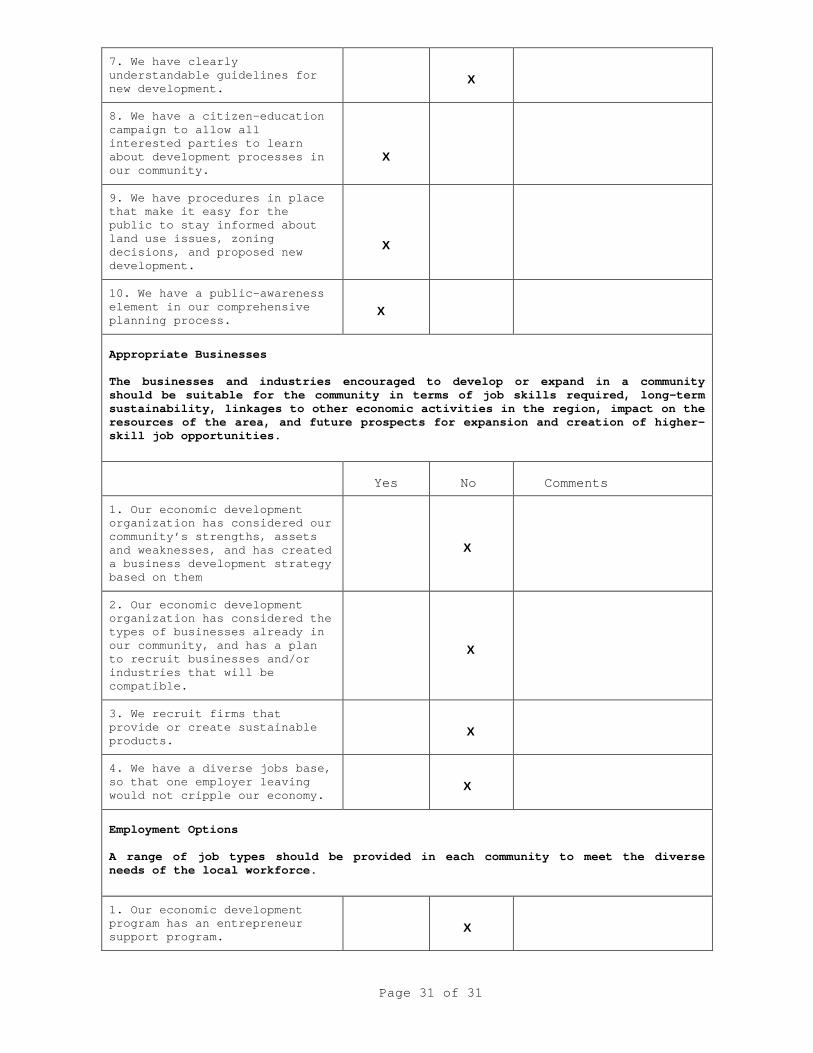
7. We have clearlyunderstandable guidelines fornew development.
X
8. We have a citizen-educationcampaign to allow allinterested parties to learnabout development processes inour community.
X
9. We have procedures in placethat make it easy for thepublic to stay informed aboutland use issues, zoningdecisions, and proposed newdevelopment.
X
10. We have a public-awarenesselement in our comprehensiveplanning process.
X
Appropriate Businesses
The businesses and industries encouraged to develop or expand in a communityshould be suitable for the community in terms of job skills required, long-termsustainability, linkages to other economic activities in the region, impact on theresources of the area, and future prospects for expansion and creation of higher-skill job opportunities.
Yes No Comments
1. Our economic developmentorganization has considered ourcommunity’s strengths, assetsand weaknesses, and has createda business development strategybased on them
X
2. Our economic developmentorganization has considered thetypes of businesses already inour community, and has a planto recruit businesses and/orindustries that will becompatible.
X
3. We recruit firms thatprovide or create sustainableproducts.
X
4. We have a diverse jobs base,so that one employer leavingwould not cripple our economy.
X
Employment Options
A range of job types should be provided in each community to meet the diverseneeds of the local workforce.
1. Our economic developmentprogram has an entrepreneursupport program.
X
Page 32 of 32
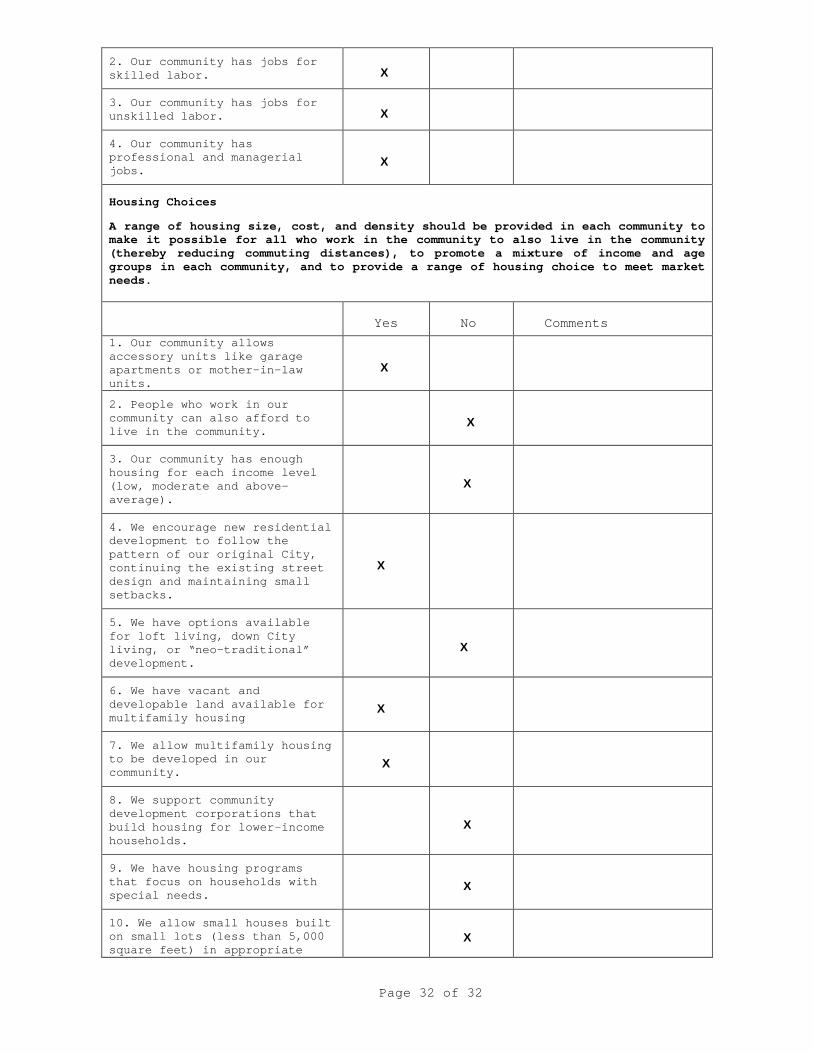
2. Our community has jobs forskilled labor. X
3. Our community has jobs forunskilled labor. X
4. Our community hasprofessional and managerialjobs.
X
Housing Choices
A range of housing size, cost, and density should be provided in each community tomake it possible for all who work in the community to also live in the community(thereby reducing commuting distances), to promote a mixture of income and agegroups in each community, and to provide a range of housing choice to meet marketneeds.
Yes No Comments
1. Our community allowsaccessory units like garageapartments or mother-in-lawunits.
X
2. People who work in ourcommunity can also afford tolive in the community.
X
3. Our community has enoughhousing for each income level(low, moderate and above-average).
X
4. We encourage new residentialdevelopment to follow thepattern of our original City,continuing the existing streetdesign and maintaining smallsetbacks.
X
5. We have options availablefor loft living, down Cityliving, or “neo-traditional”development.
X
6. We have vacant anddevelopable land available formultifamily housing
X
7. We allow multifamily housingto be developed in ourcommunity.
X
8. We support communitydevelopment corporations thatbuild housing for lower-incomehouseholds.
X
9. We have housing programsthat focus on households withspecial needs.
X
10. We allow small houses builton small lots (less than 5,000square feet) in appropriate
X
Page 33 of 33
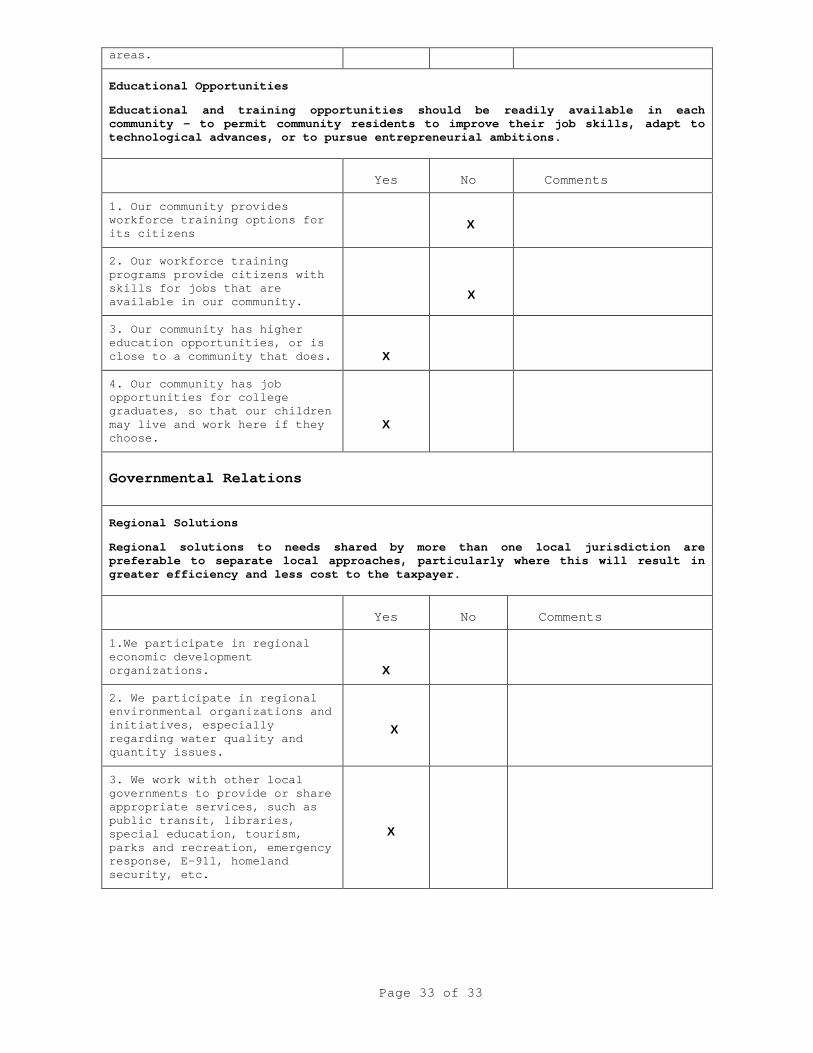
areas.
Educational Opportunities
Educational and training opportunities should be readily available in eachcommunity – to permit community residents to improve their job skills, adapt totechnological advances, or to pursue entrepreneurial ambitions.
Yes No Comments
1. Our community providesworkforce training options forits citizens
X
2. Our workforce trainingprograms provide citizens withskills for jobs that areavailable in our community.
X
3. Our community has highereducation opportunities, or isclose to a community that does. X
4. Our community has jobopportunities for collegegraduates, so that our childrenmay live and work here if theychoose.
X
Governmental Relations
Regional Solutions
Regional solutions to needs shared by more than one local jurisdiction arepreferable to separate local approaches, particularly where this will result ingreater efficiency and less cost to the taxpayer.
Yes No Comments
1.We participate in regionaleconomic developmentorganizations. X
2. We participate in regionalenvironmental organizations andinitiatives, especiallyregarding water quality andquantity issues.
X
3. We work with other localgovernments to provide or shareappropriate services, such aspublic transit, libraries,special education, tourism,parks and recreation, emergencyresponse, E-911, homelandsecurity, etc.
X
Page 34 of 34
4. Our community thinksregionally, especially in termsof issues like land use,transportation and housing,understanding that these gobeyond local governmentborders.
X
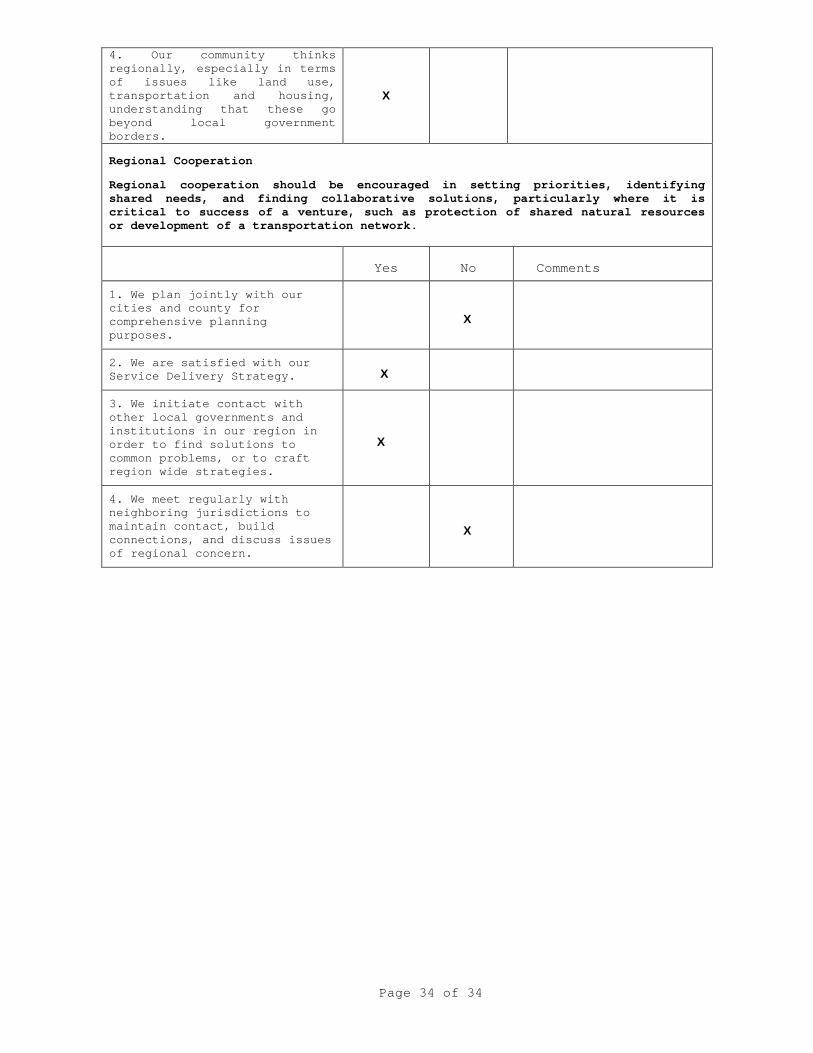
Regional Cooperation
Regional cooperation should be encouraged in setting priorities, identifyingshared needs, and finding collaborative solutions, particularly where it iscritical to success of a venture, such as protection of shared natural resourcesor development of a transportation network.
Yes No Comments
1. We plan jointly with ourcities and county forcomprehensive planningpurposes.
X
2. We are satisfied with ourService Delivery Strategy. X
3. We initiate contact withother local governments andinstitutions in our region inorder to find solutions tocommon problems, or to craftregion wide strategies.
X
4. We meet regularly withneighboring jurisdictions tomaintain contact, buildconnections, and discuss issuesof regional concern.
X
Page 35 of 35
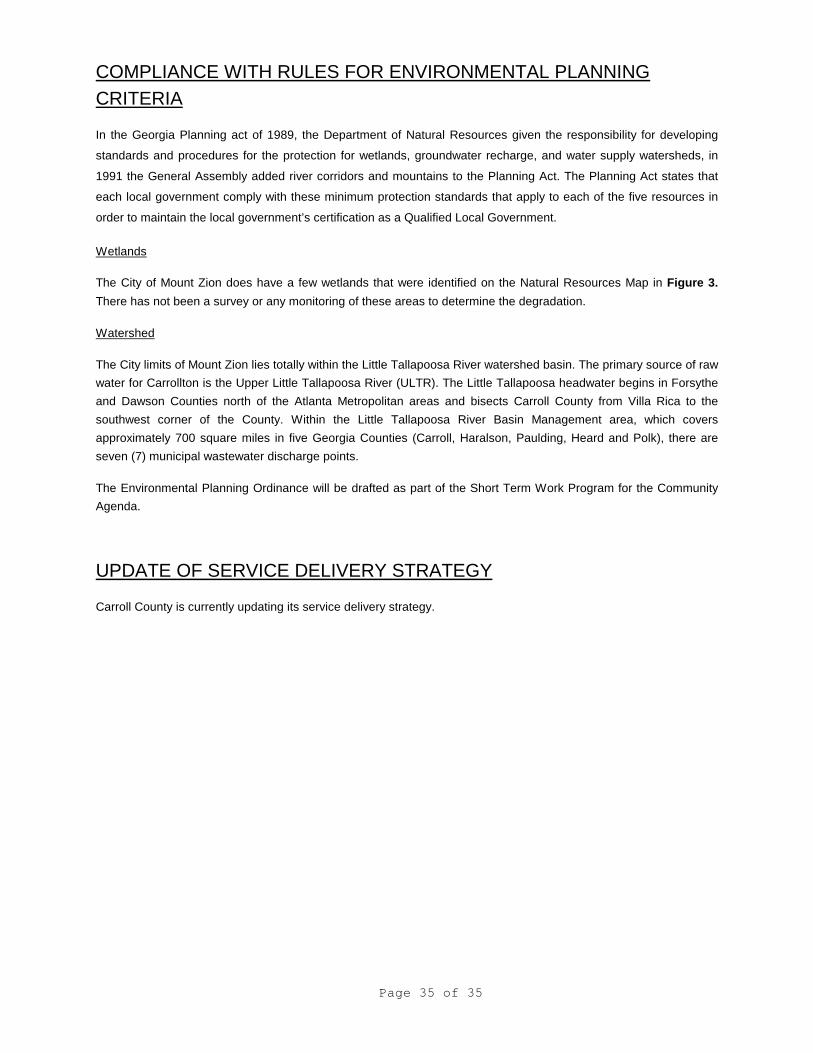
COMPLIANCE WITH RULES FOR ENVIRONMENTAL PLANNING
CRITERIA
In the Georgia Planning act of 1989, the Department of Natural Resources given the responsibility for developing
standards and procedures for the protection for wetlands, groundwater recharge, and water supply watersheds, in
1991 the General Assembly added river corridors and mountains to the Planning Act. The Planning Act states that
each local government comply with these minimum protection standards that apply to each of the five resources in
order to maintain the local government’s certification as a Qualified Local Government.
Wetlands
The City of Mount Zion does have a few wetlands that were identified on the Natural Resources Map in Figure 3.
There has not been a survey or any monitoring of these areas to determine the degradation.
Watershed
The City limits of Mount Zion lies totally within the Little Tallapoosa River watershed basin. The primary source of raw
water for Carrollton is the Upper Little Tallapoosa River (ULTR). The Little Tallapoosa headwater begins in Forsythe
and Dawson Counties north of the Atlanta Metropolitan areas and bisects Carroll County from Villa Rica to the
southwest corner of the County. Within the Little Tallapoosa River Basin Management area, which covers
approximately 700 square miles in five Georgia Counties (Carroll, Haralson, Paulding, Heard and Polk), there are
seven (7) municipal wastewater discharge points.
The Environmental Planning Ordinance will be drafted as part of the Short Term Work Program for the Community
Agenda.
UPDATE OF SERVICE DELIVERY STRATEGY
Carroll County is currently updating its service delivery strategy.
Page 36 of 36
City of Mount ZionP.O. Box 597
Mount Zion, Georgia 30150-0597
Phone (770) 832-1622Fax (770) 832-7816
Comprehensive Plan 2008-2028
Community Assessment - Appendix
Analysis of Supporting Data
Prepared by:
Chattahoochee- Flint Regional Development Center
13273 Highway 34 East, Post Office Box 1600
Franklin, GA 30217
(706) 675-6721 (770) 854-6026 FAX (706) 675-0448
Email: [email protected]
Page 37 of 37
ANALYSIS OF SUPPORTING DATA
The analysis of data was an essential tool in viewing the City of Mount Zion in a micro and macro way, to plan for
growth over next twenty (20) years. Through this analysis, opportunities of the City to expand on were identified, as
well as issue’s that should be looked at addressed.
IDENTIFICATION OF POTENTIAL ISSUES
This section analyzes the data related to population, economic development, cultural and natural resources and
community facilities and services to identify the issues and opportunities presented to the City of Mount Zion. The
Issues and Opportunities are organized by major topic as defined in the DCA Local Planning Requirements.
POPULATION
The population trends observed in any given area provides a good indication of what factors have influenced
development and growth in that area. The socio-economic characteristics of Mount Zion are provided as a
prospective of current growth trends. Population estimates and projections are based on U. S. Census data
projections provided by the Department of Community Affairs.
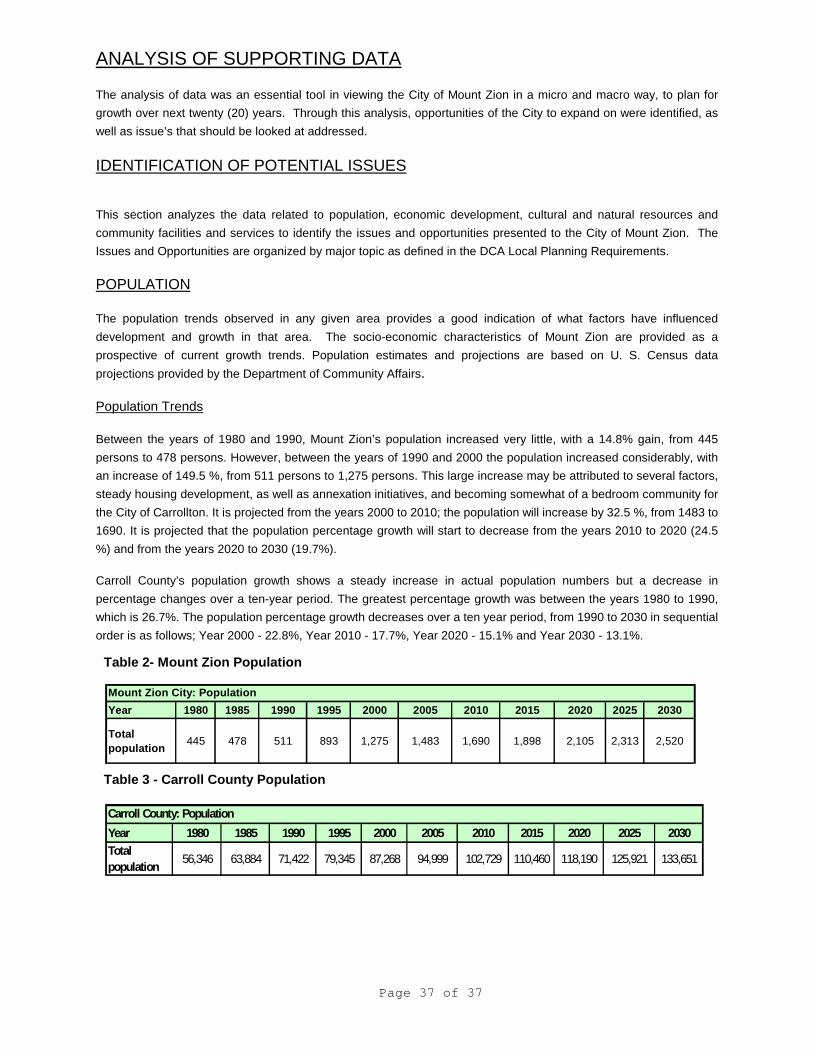
Population Trends
Between the years of 1980 and 1990, Mount Zion’s population increased very little, with a 14.8% gain, from 445
persons to 478 persons. However, between the years of 1990 and 2000 the population increased considerably, with
an increase of 149.5 %, from 511 persons to 1,275 persons. This large increase may be attributed to several factors,
steady housing development, as well as annexation initiatives, and becoming somewhat of a bedroom community for
the City of Carrollton. It is projected from the years 2000 to 2010; the population will increase by 32.5 %, from 1483 to
1690. It is projected that the population percentage growth will start to decrease from the years 2010 to 2020 (24.5
%) and from the years 2020 to 2030 (19.7%).
Carroll County’s population growth shows a steady increase in actual population numbers but a decrease in
percentage changes over a ten-year period. The greatest percentage growth was between the years 1980 to 1990,
which is 26.7%. The population percentage growth decreases over a ten year period, from 1990 to 2030 in sequential
order is as follows; Year 2000 - 22.8%, Year 2010 - 17.7%, Year 2020 - 15.1% and Year 2030 - 13.1%.
Table 2- Mount Zion Population
Table 3 - Carroll County Population
Year 1980 1985 1990 1995 2000 2005 2010 2015 2020 2025 2030
Total
population445 478 511 893 1,275 1,483 1,690 1,898 2,105 2,313 2,520
Mount Zion City: Population
Year 1980 1985 1990 1995 2000 2005 2010 2015 2020 2025 2030
Total
population56,346 63,884 71,422 79,345 87,268 94,999 102,729 110,460 118,190 125,921 133,651
Carroll County: Population
Page 38 of 38
Issues
The population projections show a steady growth in Mount Zion, from 2010 to 2020 a growth rate of 24.5% and from
2020 to 2030 19.7% (Refer to Table 2 and 3). The implications of planning for any population growth are far
reaching. The City will need to plan for infrastructure improvements and services to provide for their possible new
residents. Housing will need to be provided as well as school capacity, medical services, employment and various
citizens out reach programs. Please refer to Tables 2 and 3.
Opportunities
With any amount of population growth there are numerous opportunities for economic development. Building homes,
attracting medical services and physicians, increasing school capacity and improvements to infrastructure all creates
jobs and tax revenue. Mount Zion should explore and economic development strategies for future growth, which
should include a website to show land and development opportunities for the City, as well as create tax incentives or
deferments for creating jobs for the area.
Households
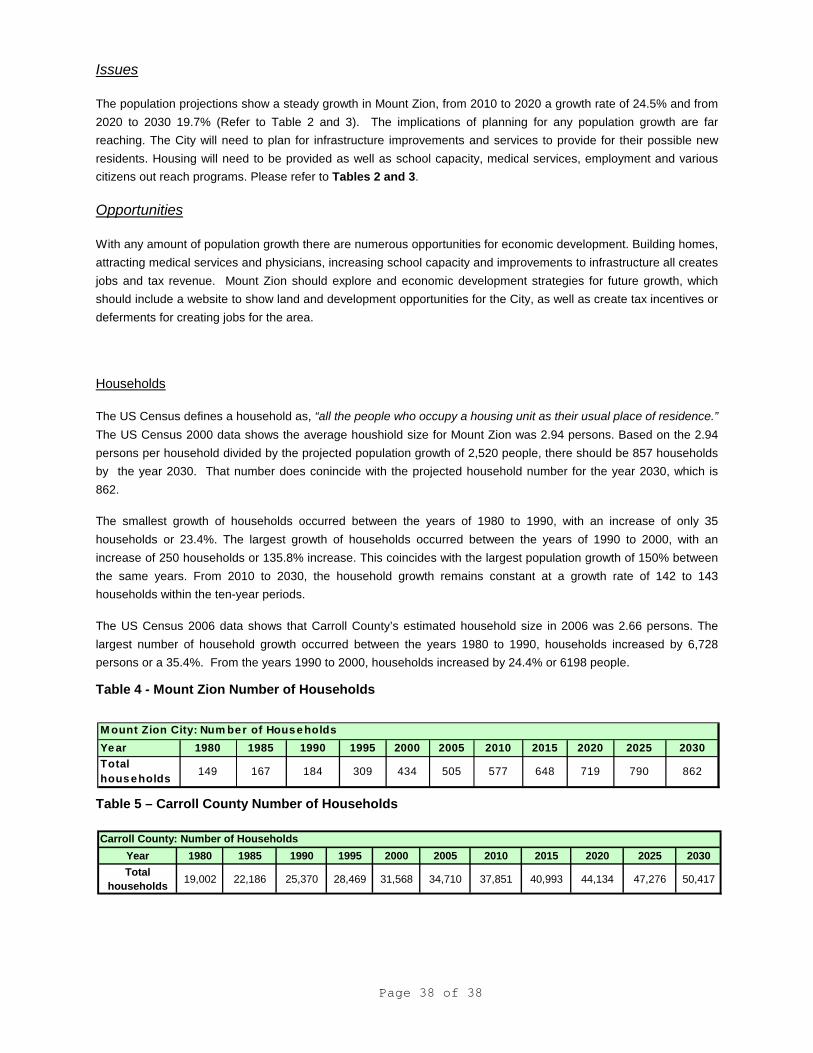
The US Census defines a household as, “all the people who occupy a housing unit as their usual place of residence.”
The US Census 2000 data shows the average houshiold size for Mount Zion was 2.94 persons. Based on the 2.94
persons per household divided by the projected population growth of 2,520 people, there should be 857 households
by the year 2030. That number does conincide with the projected household number for the year 2030, which is
862.
The smallest growth of households occurred between the years of 1980 to 1990, with an increase of only 35
households or 23.4%. The largest growth of households occurred between the years of 1990 to 2000, with an
increase of 250 households or 135.8% increase. This coincides with the largest population growth of 150% between
the same years. From 2010 to 2030, the household growth remains constant at a growth rate of 142 to 143
households within the ten-year periods.
The US Census 2006 data shows that Carroll County’s estimated household size in 2006 was 2.66 persons. The
largest number of household growth occurred between the years 1980 to 1990, households increased by 6,728
persons or a 35.4%. From the years 1990 to 2000, households increased by 24.4% or 6198 people.
Table 4 - Mount Zion Number of Households
Table 5 – Carroll County Number of Households
Year 1980 1985 1990 1995 2000 2005 2010 2015 2020 2025 2030
Total
households19,002 22,186 25,370 28,469 31,568 34,710 37,851 40,993 44,134 47,276 50,417
Carroll County: Number of Households
Ye ar 1980 1985 1990 1995 2000 2005 2010 2015 2020 2025 2030
Total
hous eholds149 167 184 309 434 505 577 648 719 790 862
M ount Zion City: Num ber of House holds
Page 39 of 39
Issues
The population projections predict that the required housing for the City is 857 households, and the projected data for
the same year is 862 households.
Although it is predicted that Mount Zion is meeting its housing number obligations. Mount Zion should have a housing
survey done, so that an accurate account of all structures can be accessed.
Increasing household choices should be is a direct affect of population and growth. The City should plan for
infrastructure improvements and services for existing and their possible new residents. Housing will need to be
provided, as well as school capacity, medical services and various citizens out reach programs. Please refer to Table
4 and 5.
Opportunities
Increases in households offer the City a workforce for economic development and tax base for growth. The City
should explore economic development opportunities either solely or jointly with the City of Carrollton to increase
opportunities for the City of Mount Zion.
Age
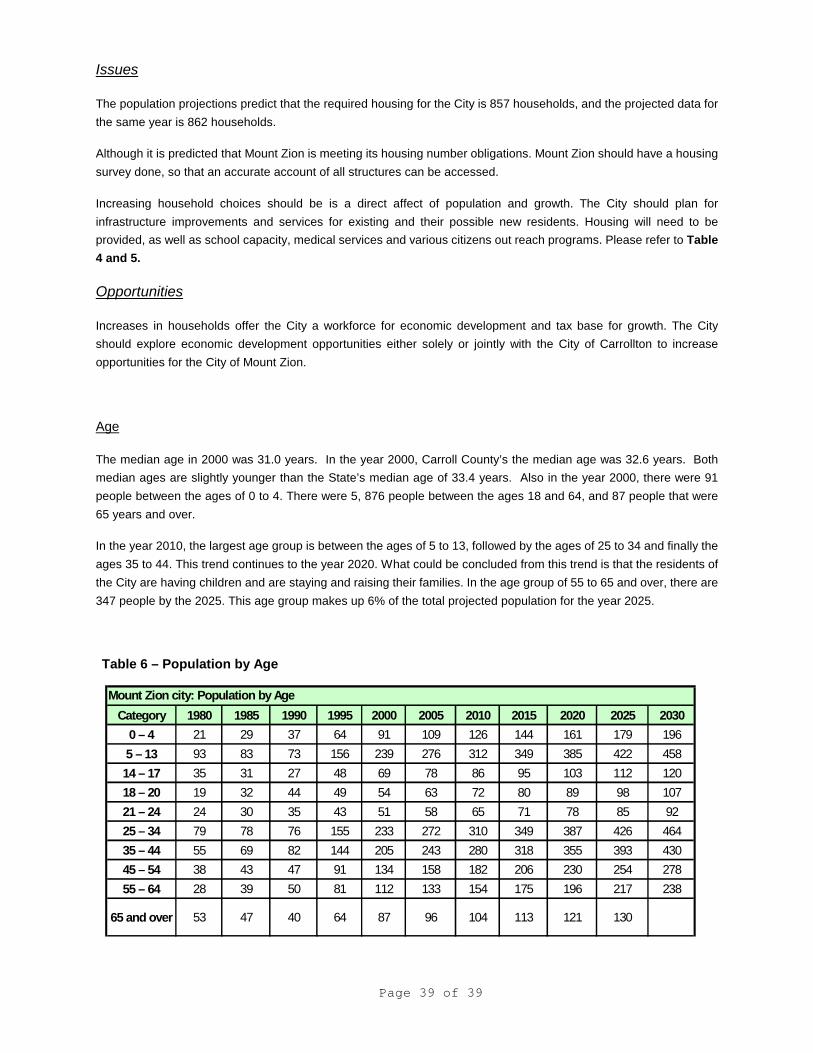
The median age in 2000 was 31.0 years. In the year 2000, Carroll County’s the median age was 32.6 years. Both
median ages are slightly younger than the State’s median age of 33.4 years. Also in the year 2000, there were 91
people between the ages of 0 to 4. There were 5, 876 people between the ages 18 and 64, and 87 people that were
65 years and over.
In the year 2010, the largest age group is between the ages of 5 to 13, followed by the ages of 25 to 34 and finally the
ages 35 to 44. This trend continues to the year 2020. What could be concluded from this trend is that the residents of
the City are having children and are staying and raising their families. In the age group of 55 to 65 and over, there are
347 people by the 2025. This age group makes up 6% of the total projected population for the year 2025.
Table 6 – Population by Age
Category 1980 1985 1990 1995 2000 2005 2010 2015 2020 2025 2030
0 – 4 21 29 37 64 91 109 126 144 161 179 196
5 – 13 93 83 73 156 239 276 312 349 385 422 458
14 – 17 35 31 27 48 69 78 86 95 103 112 120
18 – 20 19 32 44 49 54 63 72 80 89 98 107
21 – 24 24 30 35 43 51 58 65 71 78 85 92
25 – 34 79 78 76 155 233 272 310 349 387 426 464
35 – 44 55 69 82 144 205 243 280 318 355 393 430
45 – 54 38 43 47 91 134 158 182 206 230 254 278
55 – 64 28 39 50 81 112 133 154 175 196 217 238
65 and over 53 47 40 64 87 96 104 113 121 130
Mount Zion city: Population by Age
Page 40 of 40
Issues
In the year 2010, the largest age group is between the ages of 5 to 13, followed by the ages of 25 to 34 and finally the
ages 35 to 44. This trend continues to the year 2020. What could be concluded from this trend is that the residents of
the City are having children and are staying and raising their families. The City along with County should evaluate
future school capacity and day care facilities, as well as economic development incentives so that employment can
be available for the young families in the area.
In the age group of 55 to 65 and over, there are 347 people by the 2025. This age group makes up 6% of the total
projected population for the year 2025. The City should evaluate affordable housing for the elderly, as well as
retirement and assisted living facilities for this group. Please refer to Table 6.
Opportunities
Mount Zion has built a new Senior Center that offers meals and other services for the elderly; this facility can be used
for other community uses as well.
Race
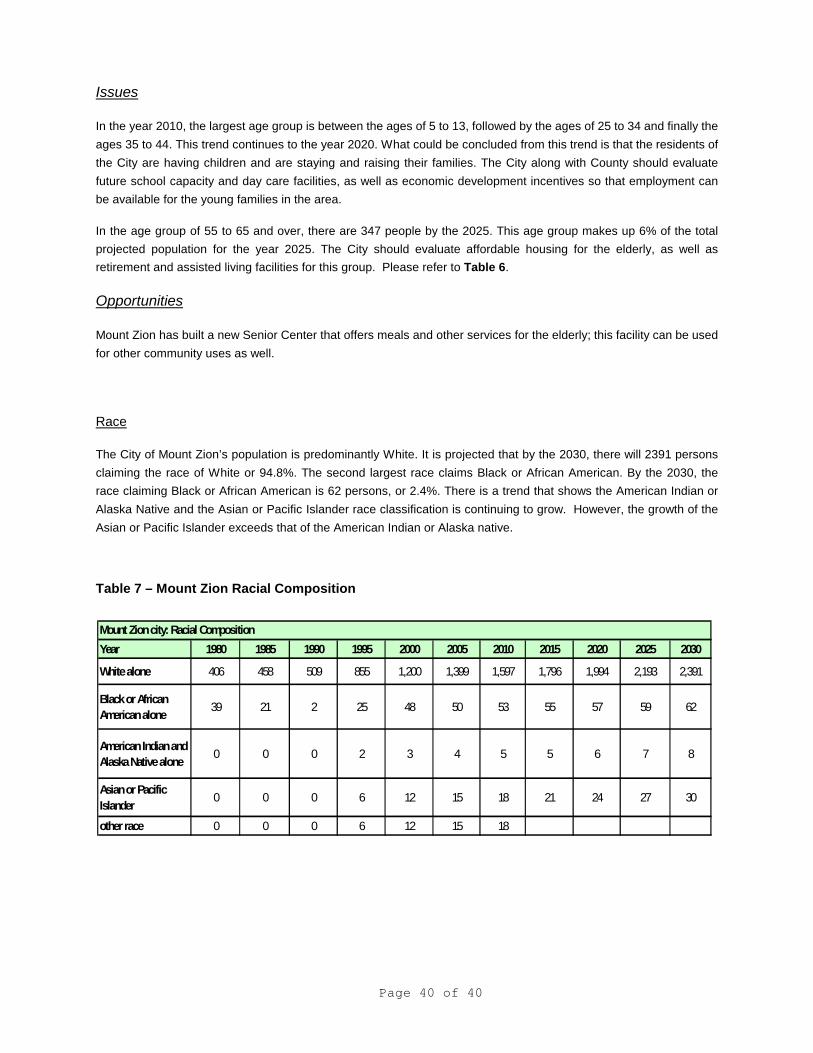
The City of Mount Zion’s population is predominantly White. It is projected that by the 2030, there will 2391 persons
claiming the race of White or 94.8%. The second largest race claims Black or African American. By the 2030, the
race claiming Black or African American is 62 persons, or 2.4%. There is a trend that shows the American Indian or
Alaska Native and the Asian or Pacific Islander race classification is continuing to grow. However, the growth of the
Asian or Pacific Islander exceeds that of the American Indian or Alaska native.
Table 7 – Mount Zion Racial Composition
Year 1980 1985 1990 1995 2000 2005 2010 2015 2020 2025 2030
Whitealone 406 458 509 855 1,200 1,399 1,597 1,796 1,994 2,193 2,391
BlackorAfrican
Americanalone39 21 2 25 48 50 53 55 57 59 62
AmericanIndianand
AlaskaNativealone0 0 0 2 3 4 5 5 6 7 8
AsianorPacific
Islander0 0 0 6 12 15 18 21 24 27 30
otherrace 0 0 0 6 12 15 18
MountZioncity:Racial Composition
Page 41 of 41
Issues
The City of Mount Zion’s population is predominantly White. It is projected that by the 2030, there will 2391 persons
claiming the race of White or 94.8%. The second largest race claims Black or African American. By the 2030, the
race claiming Black or African American is 62 persons, or 2.4%. With any community that is predominantly one race,
the challenge is to make sure that polices that are formulated include the interest and protection of all races and or
nationalities in the community. Please refer to Table 7.
Opportunities
Racial diversity offers a community an opportunity to experience other cultures food and activities. Mount Zion should
come up with an economic development campaign of encouraging different cultures and races to bring business and
cultural diversity to the community.
Educational Attainment
The largest group of educational attainment is the High School Graduate or Equivalency category, which shows 710
people in that category by the year 2030. This category makes up 28.1% of the projected population for that same
year. The second largest group is the 9th
to 12th
Grade no diploma, which is 277 people by the 2030. That number
makes up 10.9% of the projected population for the same year. The two final categories that show the lowest
graduation rates are the Bachelors Degree and the Graduate or Professionals Degree. It is projected by the 2030,
that 14.5% (or 178 people) of the population will have a Bachelors or Graduate Degree. However, by the 2030, 928
people do not continue their education either after high school or after attending some college.
Carroll County follows a similar trend. By the year 2030 the largest category of educational attainment is High School
Graduate or Equivalency with 33,173 persons or 24.8%. Carroll County’s some College no Degree category shows
17,913 people or 13.4% of the population. It is projected by the year 2030, that 16,872 persons will have obtained a
Bachelors Degree or Graduate Degree or 12.4% of the projected population.
Carroll County offers bachelors degree and graduate degree programs at University of West Georgia in the Arts and
Sciences, Business Administration, Public Administration, and Education. In addition, the County houses West
Central Technical College that provides associate degrees in applied sciences in 16 categories, technical diplomas in
23 categories and technical certificates in 44 categories. The County also operates programs through the Job
Training and Partnership Act (JTPA) that provides training for low-income persons who are unemployed or
underemployed or have special employment needs. The County also operates Especially for Single Parents (ESP),
and adult literacy programs. Georgia Quick Start is housed at West Central Technical College and will provide
specific customized training to new and/or expanding industry
Page 42 of 42
Table 8 – Mount Zion Educational Attainment
Issues
The largest group of educational attainment is the High School Graduate or Equivalency category, which shows 710
people in that category by the year 2030. This category makes up 28.1% of the projected population for that same
year. The second largest group is the 9th
to 12th
Grade no diploma, which is 277 people by the 2030. That number
makes up 10.9% of the projected population for the same year. Please refer to Table 8.
The two final categories that show the lowest graduation rates are the Bachelors Degree and the Graduate or
Professionals Degree. It is projected by the 2030, that 14.5% (or 178 people) of the population will have a Bachelors
or Graduate Degree. However, by the 2030, 928 people do not continue their education either after high school or
after attending some college. Please refer to Table 8.
The City should explore and identify why children are not finishing high school and develop programs and policies to
improve graduation rates, such as tutoring, mentoring programs, parent training programs and educational programs
outlining the importance of education and the direct correlation it has with lifetime earnings.
There is a program called “The Legacy Link, Inc.” that matches senior citizen’s skills with a community’s needs. One
of the programs they offer is torturing. There are several of these “Senior Center” locations offered in Georgia. The
link to their website is http://www.legacylink.org/. Mount Zion should explore this program and perhaps start a
Chapter at the new Senior Center to offer support to students that need tutoring or even mentoring.
Opportunities
The City may want to explore having its own trade school or junior college, so the local students have more options
for education after high school. A trade school would also benefit the students that do not graduate from high school,
or those students that would like to explore alternative learning paths other than a high school diploma.
Year 1980 1985 1990 1995 2000 2005 2010 2015 2020 2025 2030
Less than 9th
Grade66 53 39 40 41 35 29 22 16 10 4
9th to 12th Grade
(No Diploma)84 76 68 115 161 180 200 219 238 257 277
High School
Graduate
(Includes
Equivalency)
47 84 120 216 312 378 445 511 577 643 710
Some College (No
Degree)21 24 27 87 147 179 210 242 273 305 336
Associate Degree NA NA 15 20 24 NA NA NA NA NA NA
Bachelor's Degree 8 13 18 35 52 63 74 85 96 107 118
Graduate or
Professional
Degree
17 15 13 24 34 38 43 47 51 55 60
Mount Zion city: Educational Attainment
Page 43 of 43
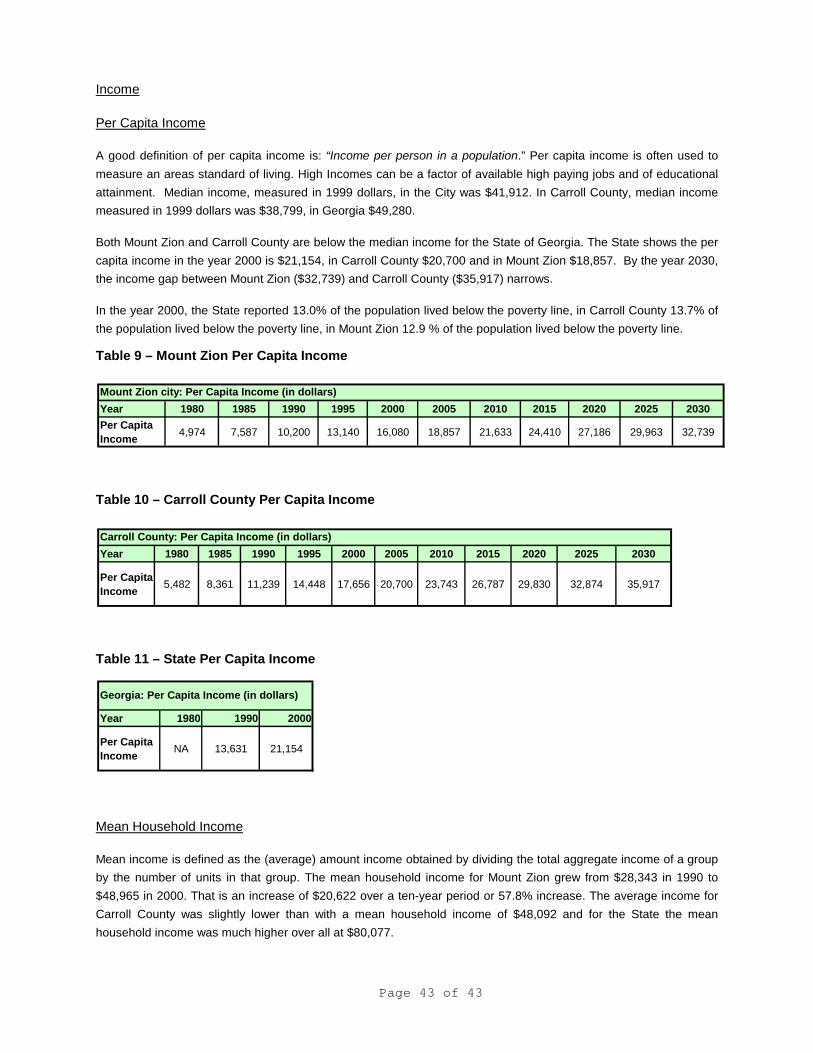
Income
Per Capita Income
A good definition of per capita income is: “Income per person in a population.” Per capita income is often used to
measure an areas standard of living. High Incomes can be a factor of available high paying jobs and of educational
attainment. Median income, measured in 1999 dollars, in the City was $41,912. In Carroll County, median income
measured in 1999 dollars was $38,799, in Georgia $49,280.
Both Mount Zion and Carroll County are below the median income for the State of Georgia. The State shows the per
capita income in the year 2000 is $21,154, in Carroll County $20,700 and in Mount Zion $18,857. By the year 2030,
the income gap between Mount Zion ($32,739) and Carroll County ($35,917) narrows.
In the year 2000, the State reported 13.0% of the population lived below the poverty line, in Carroll County 13.7% of
the population lived below the poverty line, in Mount Zion 12.9 % of the population lived below the poverty line.
Table 9 – Mount Zion Per Capita Income
Table 10 – Carroll County Per Capita Income
Table 11 – State Per Capita Income
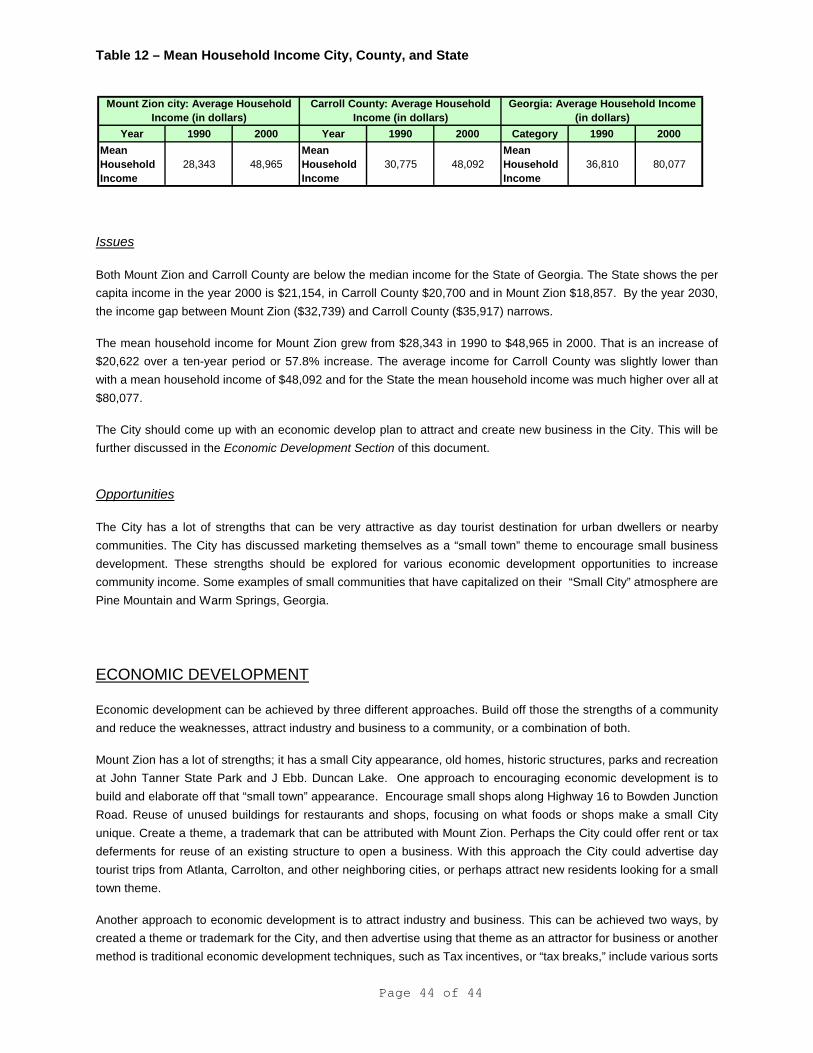
Mean Household Income
Mean income is defined as the (average) amount income obtained by dividing the total aggregate income of a group
by the number of units in that group. The mean household income for Mount Zion grew from $28,343 in 1990 to
$48,965 in 2000. That is an increase of $20,622 over a ten-year period or 57.8% increase. The average income for
Carroll County was slightly lower than with a mean household income of $48,092 and for the State the mean
household income was much higher over all at $80,077.
Year 1980 1985 1990 1995 2000 2005 2010 2015 2020 2025 2030
Per Capita
Income4,974 7,587 10,200 13,140 16,080 18,857 21,633 24,410 27,186 29,963 32,739
Mount Zion city: Per Capita Income (in dollars)
Year 1980 1985 1990 1995 2000 2005 2010 2015 2020 2025 2030
Per Capita
Income5,482 8,361 11,239 14,448 17,656 20,700 23,743 26,787 29,830 32,874 35,917
Carroll County: Per Capita Income (in dollars)
Year 1980 1990 2000
Per Capita
IncomeNA 13,631 21,154
Georgia: Per Capita Income (in dollars)
Page 44 of 44
Table 12 – Mean Household Income City, County, and State
Issues
Both Mount Zion and Carroll County are below the median income for the State of Georgia. The State shows the per
capita income in the year 2000 is $21,154, in Carroll County $20,700 and in Mount Zion $18,857. By the year 2030,
the income gap between Mount Zion ($32,739) and Carroll County ($35,917) narrows.
The mean household income for Mount Zion grew from $28,343 in 1990 to $48,965 in 2000. That is an increase of
$20,622 over a ten-year period or 57.8% increase. The average income for Carroll County was slightly lower than
with a mean household income of $48,092 and for the State the mean household income was much higher over all at
$80,077.
The City should come up with an economic develop plan to attract and create new business in the City. This will be
further discussed in the Economic Development Section of this document.
Opportunities
The City has a lot of strengths that can be very attractive as day tourist destination for urban dwellers or nearby
communities. The City has discussed marketing themselves as a “small town” theme to encourage small business
development. These strengths should be explored for various economic development opportunities to increase
community income. Some examples of small communities that have capitalized on their “Small City” atmosphere are
Pine Mountain and Warm Springs, Georgia.
ECONOMIC DEVELOPMENT
Economic development can be achieved by three different approaches. Build off those the strengths of a community
and reduce the weaknesses, attract industry and business to a community, or a combination of both.
Mount Zion has a lot of strengths; it has a small City appearance, old homes, historic structures, parks and recreation
at John Tanner State Park and J Ebb. Duncan Lake. One approach to encouraging economic development is to
build and elaborate off that “small town” appearance. Encourage small shops along Highway 16 to Bowden Junction
Road. Reuse of unused buildings for restaurants and shops, focusing on what foods or shops make a small City
unique. Create a theme, a trademark that can be attributed with Mount Zion. Perhaps the City could offer rent or tax
deferments for reuse of an existing structure to open a business. With this approach the City could advertise day
tourist trips from Atlanta, Carrolton, and other neighboring cities, or perhaps attract new residents looking for a small
town theme.
Another approach to economic development is to attract industry and business. This can be achieved two ways, by
created a theme or trademark for the City, and then advertise using that theme as an attractor for business or another
method is traditional economic development techniques, such as Tax incentives, or “tax breaks,” include various sorts
Year 1990 2000 Year 1990 2000 Category 1990 2000
Mean
Household
Income
28,343 48,965
Mean
Household
Income
30,775 48,092
Mean
Household
Income
36,810 80,077
Mount Zion city: Average Household
Income (in dollars)
Carroll County: Average Household
Income (in dollars)
Georgia: Average Household Income
(in dollars)
Page 45 of 45
of abatements, credits, and exemptions. These incentives may be available to all businesses or they may be
negotiated on a case-by-case basis.
Public borrowing means that local governments lend money to private business firms at below-market rates to induce
investment. Debt financing may take the form of direct loans for construction or expansion of industrial plants or the
purchase of machinery and equipment. In other cases, the state or local government guarantees loans. Recipients
generally are expected to seek financing on the private market first, but the creditworthiness of the firm rarely has
been a barrier to access to publicly subsidized lending programs. States capitalize these lending programs both by
issuing bonds and through legislative appropriations. Community Development Block Grants are also used by
localities for a variety of community development activities, including housing rehabilitation, public works, and
planning. Usually 8 to 15 percent of CDBG funds are used for economic development purposes.
The City of Mount Zion needs to come up with an comprehensive economic development plan, that includes not just
bringing in business, attracting industry or building new businesses, but also looks at infrastructure improvements,
sidewalk and landscape installation design and boundaries for the city center or main street area with compatible
zoning laws to encourage various types of development and applying for all financial assistance available for
municipalities of this size, on a local, state and federal levels.
Issues
The City should establish a website of the various public officials and department contacts. This website should be
used as an update with news for residents and future meetings. In addition, the website should be elaborated on to
include economic development information and available parcels or areas, that the City would like to encourage
development or redevelopment.
The City of Mount Zion has a limited amount of funds for improvement to infrastructure to promote economic
development.
There has been no designated “City Center” or “Main Street” boundaries established through ordinance and or map.
Establishing a “main street” area is encouraged. It gives the economic development a geographical starting point.
The City may want to consider a theme or architectural style that would start and continue architectural continuity
throughout the City. There are not many vacant buildings available, but those that are available should be
redeveloped.
Opportunities
The greatest opportunity that the City has is its small town appearance and that it is virtually a blank slate to promote
and encourage growth and economic development. This means the City has an opportunity to market their city in
any manner or direction that they agree upon.
It is a plus to be located so near to the City of Carrollton, so the City can be marketed as a bedroom community.
The City also does offer the residents and visitors beautiful parks for recreation, such as John Tanner State Park and
J. Ebb Duncan Lake and multiple historic resources that give the City a unique character. These attributes should be
used as marketing tools for visitors and new residents to the City.
Economic Base
An economic base is defined as the companies that provide jobs in a given community or geographic location. This
section will briefly discuss those employers with the City of Mount Zion.
Page 46 of 46
Employment by Industry
In the City of Mount Zion, the three largest existing and projected employment growth industries are: manufacturing,
construction and retail trade. In the year 2010, it is projected that 861 persons will be part of the labor force, which
makes up 50.9% of the total projected population for that year. In the year 2010, of the 861 persons in the labor force,
158 will work in Manufacturing, 113 will work in construction and 121will work in retail.
By the year 2030, 1,312 persons will be participating in the labor force. The three largest sectors of the economy are
Construction (177), Manufacturing (211) and Retail Trade (192). The three sectors that remain almost static or show
little to no growth are, Agriculture- Forestry- Fishing- Hunting- Mining, Transportation-Warehousing and Utilities,
Professional Scientific-Management -Administrative and Waste management and Public Administration.
In Carroll County there, is a similar trend, the three large sectors in 2010 are projected to be, Construction
Manufacturing and Retail Trade. However, Carroll County’s largest employer in 2010 is projected to be Education
Health and Social Services. University of West Georgia, 10 elementary schools, 6 middle schools and 7 highs
schools can explain the large Education sector. There are also 4 hospitals in Carroll County that would also account
for the spike in the Educational and Social Services category of industry.
In the year 2000, the State shows Educational, Health & Social Services is the largest industry category, followed in
sequential order by Manufacturing, Retail Trade, Professional Scientific Administrative, and Waste Management
Services and Construction. The State statistics differ from Carroll County and the City of Mount Zion by exceeding in
Professional Scientific Administrative, and Waste Management Services. Although waste management facilities can
be expensive to build, the pay off may be worth for the City, in jobs and a stable source of income for its residents
that does not fluctuate with the economy.
There are 17 businesses that are licensed in Mount Zion in 2008, including:
8 contractors (building, landscaping, concrete pour, well drilling, custom fencing, signs, small equipment
repair etc.)
5 retail shops (apparel, gun store, nuts and bolts, other)
1 hair salon
I custom sign making company
There is one Carroll County public school located in Mount Zion:
Mount Zion Elementary, Grades PK-5, with 610 students
Issues
By the year 2030, 1,312 persons will be participating in the labor force. The three largest sectors of the economy are
Construction (177), Manufacturing (211) and Retail Trade (192). The three sectors that remain almost static or show
little to no growth are, Agriculture- Forestry- Fishing- Hunting- Mining, Transportation-Warehousing and Utilities,
Professional Scientific-Management -Administrative and Waste management and Public Administration.
Mount Zion needs more diversification of business sectors of employment to expand their tax base and encourage
economic development.
The City should also explore opening a trade school to add skilled labor and diversification to the employment base.
In addition, the trade school would add professional jobs for the City.
Opportunities

Page 47 of 47
In the areas that are static, there a multiple opportunities to build off of. In agriculture, many communities are starting
community gardens and farmers markets, this can be attractor for local residents to regional residents. A farmer’s
market is an opportunity to use the land-zoned agriculture for an economic development purpose. Depending on the
size of the land and harvest would be contingent on the jobs provided, but it is a wonderful use for vacant agriculture
zoned parcels.
Utilities jobs can be provided if grants are made available for infrastructure improvements and perhaps water or
sewer treatment facility can be built. This is a type of employment that does not suffer from fluctuations in the
economy.
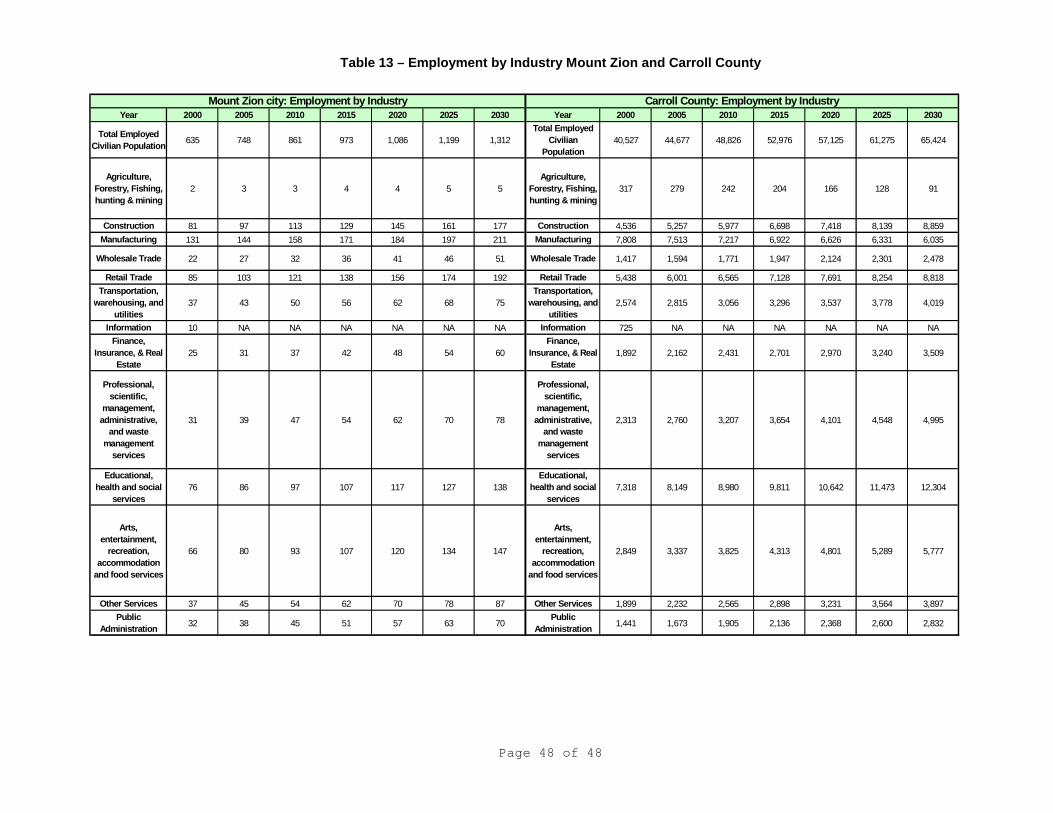
Page 48 of 48
Table 13 – Employment by Industry Mount Zion and Carroll County
Year 2000 2005 2010 2015 2020 2025 2030 Year 2000 2005 2010 2015 2020 2025 2030
Total Employed
Civilian Population635 748 861 973 1,086 1,199 1,312
Total Employed
Civilian
Population
40,527 44,677 48,826 52,976 57,125 61,275 65,424
Agriculture,
Forestry, Fishing,
hunting & mining
2 3 3 4 4 5 5
Agriculture,
Forestry, Fishing,
hunting & mining
317 279 242 204 166 128 91
Construction 81 97 113 129 145 161 177 Construction 4,536 5,257 5,977 6,698 7,418 8,139 8,859
Manufacturing 131 144 158 171 184 197 211 Manufacturing 7,808 7,513 7,217 6,922 6,626 6,331 6,035
Wholesale Trade 22 27 32 36 41 46 51 Wholesale Trade 1,417 1,594 1,771 1,947 2,124 2,301 2,478
Retail Trade 85 103 121 138 156 174 192 Retail Trade 5,438 6,001 6,565 7,128 7,691 8,254 8,818
Transportation,
warehousing, and
utilities
37 43 50 56 62 68 75
Transportation,
warehousing, and
utilities
2,574 2,815 3,056 3,296 3,537 3,778 4,019
Information 10 NA NA NA NA NA NA Information 725 NA NA NA NA NA NA
Finance,
Insurance, & Real
Estate
25 31 37 42 48 54 60
Finance,
Insurance, & Real
Estate
1,892 2,162 2,431 2,701 2,970 3,240 3,509
Professional,
scientific,
management,
administrative,
and waste
management
services
31 39 47 54 62 70 78
Professional,
scientific,
management,
administrative,
and waste
management
services
2,313 2,760 3,207 3,654 4,101 4,548 4,995
Educational,
health and social
services
76 86 97 107 117 127 138
Educational,
health and social
services
7,318 8,149 8,980 9,811 10,642 11,473 12,304
Arts,
entertainment,
recreation,
accommodation
and food services
66 80 93 107 120 134 147
Arts,
entertainment,
recreation,
accommodation
and food services
2,849 3,337 3,825 4,313 4,801 5,289 5,777
Other Services 37 45 54 62 70 78 87 Other Services 1,899 2,232 2,565 2,898 3,231 3,564 3,897
Public
Administration32 38 45 51 57 63 70
Public
Administration1,441 1,673 1,905 2,136 2,368 2,600 2,832
Mount Zion city: Employment by Industry Carroll County: Employment by Industry
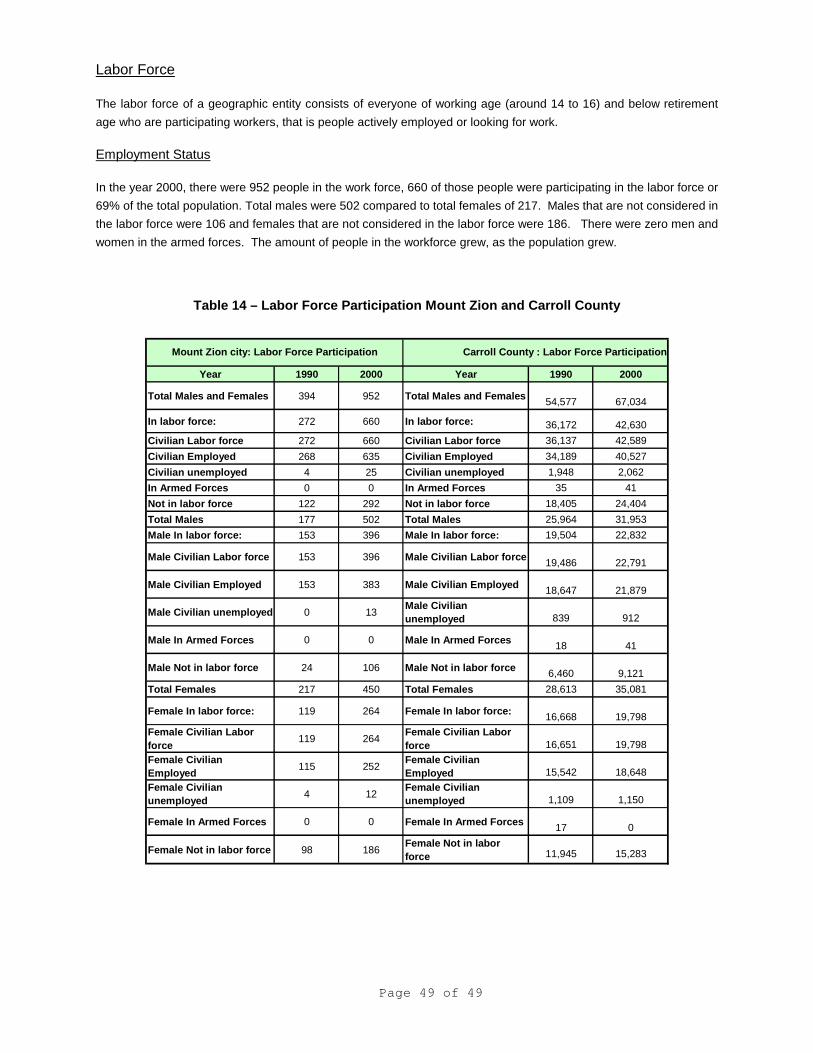
Page 49 of 49
Labor Force
The labor force of a geographic entity consists of everyone of working age (around 14 to 16) and below retirement
age who are participating workers, that is people actively employed or looking for work.
Employment Status
In the year 2000, there were 952 people in the work force, 660 of those people were participating in the labor force or
69% of the total population. Total males were 502 compared to total females of 217. Males that are not considered in
the labor force were 106 and females that are not considered in the labor force were 186. There were zero men and
women in the armed forces. The amount of people in the workforce grew, as the population grew.
Table 14 – Labor Force Participation Mount Zion and Carroll County
Year 1990 2000 Year 1990 2000
Total Males and Females 394 952 Total Males and Females54,577 67,034
In labor force: 272 660 In labor force: 36,172 42,630
Civilian Labor force 272 660 Civilian Labor force 36,137 42,589
Civilian Employed 268 635 Civilian Employed 34,189 40,527
Civilian unemployed 4 25 Civilian unemployed 1,948 2,062
In Armed Forces 0 0 In Armed Forces 35 41
Not in labor force 122 292 Not in labor force 18,405 24,404
Total Males 177 502 Total Males 25,964 31,953
Male In labor force: 153 396 Male In labor force: 19,504 22,832
Male Civilian Labor force 153 396 Male Civilian Labor force19,486 22,791
Male Civilian Employed 153 383 Male Civilian Employed18,647 21,879
Male Civilian unemployed 0 13Male Civilian
unemployed 839 912
Male In Armed Forces 0 0 Male In Armed Forces18 41
Male Not in labor force 24 106 Male Not in labor force6,460 9,121
Total Females 217 450 Total Females 28,613 35,081
Female In labor force: 119 264 Female In labor force:16,668 19,798
Female Civilian Labor
force119 264
Female Civilian Labor
force 16,651 19,798
Female Civilian
Employed115 252
Female Civilian
Employed 15,542 18,648
Female Civilian
unemployed4 12
Female Civilian
unemployed 1,109 1,150
Female In Armed Forces 0 0 Female In Armed Forces17 0
Female Not in labor force 98 186Female Not in labor
force 11,945 15,283
Mount Zion city: Labor Force Participation Carroll County : Labor Force Participation
Page 50 of 50
Economic Resources
Carroll County Chamber of Commerce
Chattahoochee-Flint Regional Development Center
Carroll Electric Membership Corporation
Georgia Power Company
Carroll County Development Authority
Carroll County Convention & Visitors Association
Georgia Tech Regional Office
West Central Georgia Private Industry County
Georgia Department of Labor, Carrollton Field Office
Georgia Quick Start/Carroll Technical Institute
West Georgia College
West Georgia Development Association
Programs, Tools and Education
Until the infrastructure is in place to accommodate industrial uses, The City of Mt. Zion will not promote industrial
growth at this time. However, they have planned for both commercial and manufacturing development in their zoning
ordinance. Federal programs that are available to the City that will fund economic development are the Industrial
Development Grant Program, and the Intermediary Relending Program administered through the Farmers Home
Administration. Funds that the State of Georgia administers are the Small Cities Community Development Block:
Grant Fund, the Local Development Fund, and the Georgia Environmental Facilities Authority fund.
Issues
In the year 2000, there were 952 people in the work force, 660 of those people were participating in the labor force or
69% of the total population. Total males were 502 compared to total females of 217. Males that are not considered in
the labor force were 106 and females that are not considered in the labor force were 186. There were zero men and
women in the armed forces. The amount of people in the workforce grew, as the population grew.
There is a need for more people in the work force as well as more varied available workforce in the City. There is also
a need as discussed before to create economic development from a theme or plan that the City decides upon.
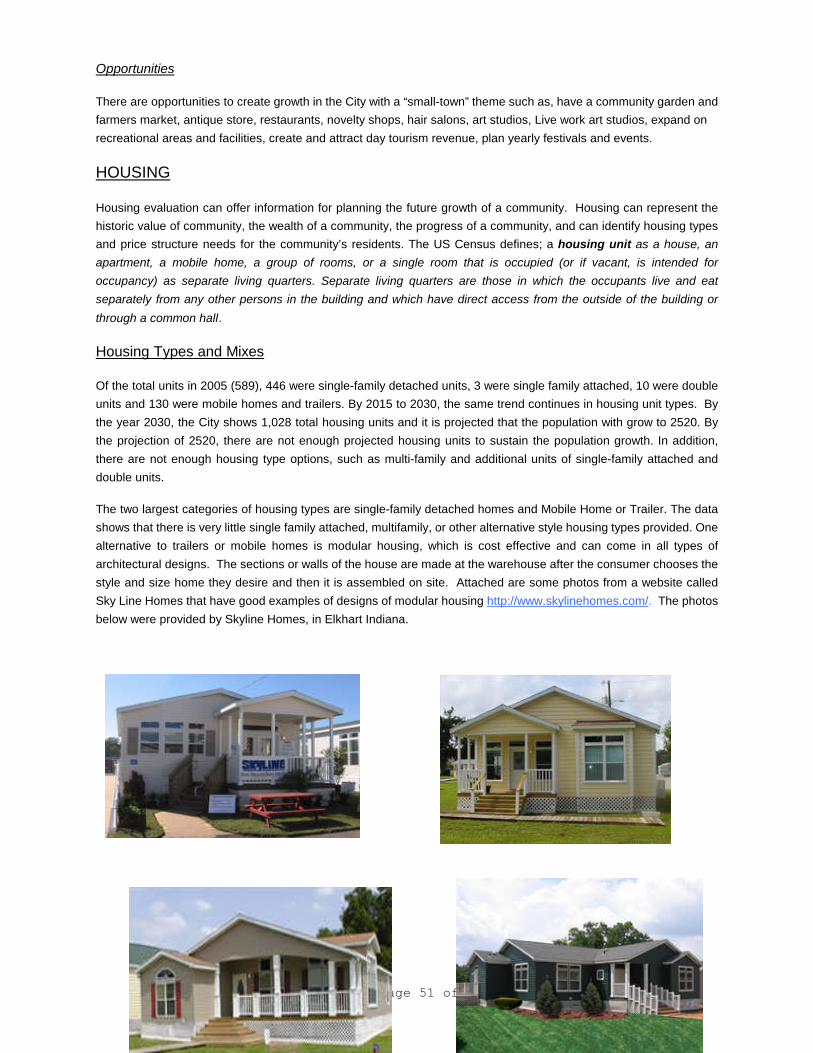
Page 51 of 51
Opportunities
There are opportunities to create growth in the City with a “small-town” theme such as, have a community garden and
farmers market, antique store, restaurants, novelty shops, hair salons, art studios, Live work art studios, expand on
recreational areas and facilities, create and attract day tourism revenue, plan yearly festivals and events.
HOUSING
Housing evaluation can offer information for planning the future growth of a community. Housing can represent the
historic value of community, the wealth of a community, the progress of a community, and can identify housing types
and price structure needs for the community’s residents. The US Census defines; a housing unit as a house, an
apartment, a mobile home, a group of rooms, or a single room that is occupied (or if vacant, is intended for
occupancy) as separate living quarters. Separate living quarters are those in which the occupants live and eat
separately from any other persons in the building and which have direct access from the outside of the building or
through a common hall.
Housing Types and Mixes
Of the total units in 2005 (589), 446 were single-family detached units, 3 were single family attached, 10 were double
units and 130 were mobile homes and trailers. By 2015 to 2030, the same trend continues in housing unit types. By
the year 2030, the City shows 1,028 total housing units and it is projected that the population with grow to 2520. By
the projection of 2520, there are not enough projected housing units to sustain the population growth. In addition,
there are not enough housing type options, such as multi-family and additional units of single-family attached and
double units.
The two largest categories of housing types are single-family detached homes and Mobile Home or Trailer. The data
shows that there is very little single family attached, multifamily, or other alternative style housing types provided. One
alternative to trailers or mobile homes is modular housing, which is cost effective and can come in all types of
architectural designs. The sections or walls of the house are made at the warehouse after the consumer chooses the
style and size home they desire and then it is assembled on site. Attached are some photos from a website called
Sky Line Homes that have good examples of designs of modular housing http://www.skylinehomes.com/. The photos
below were provided by Skyline Homes, in Elkhart Indiana.
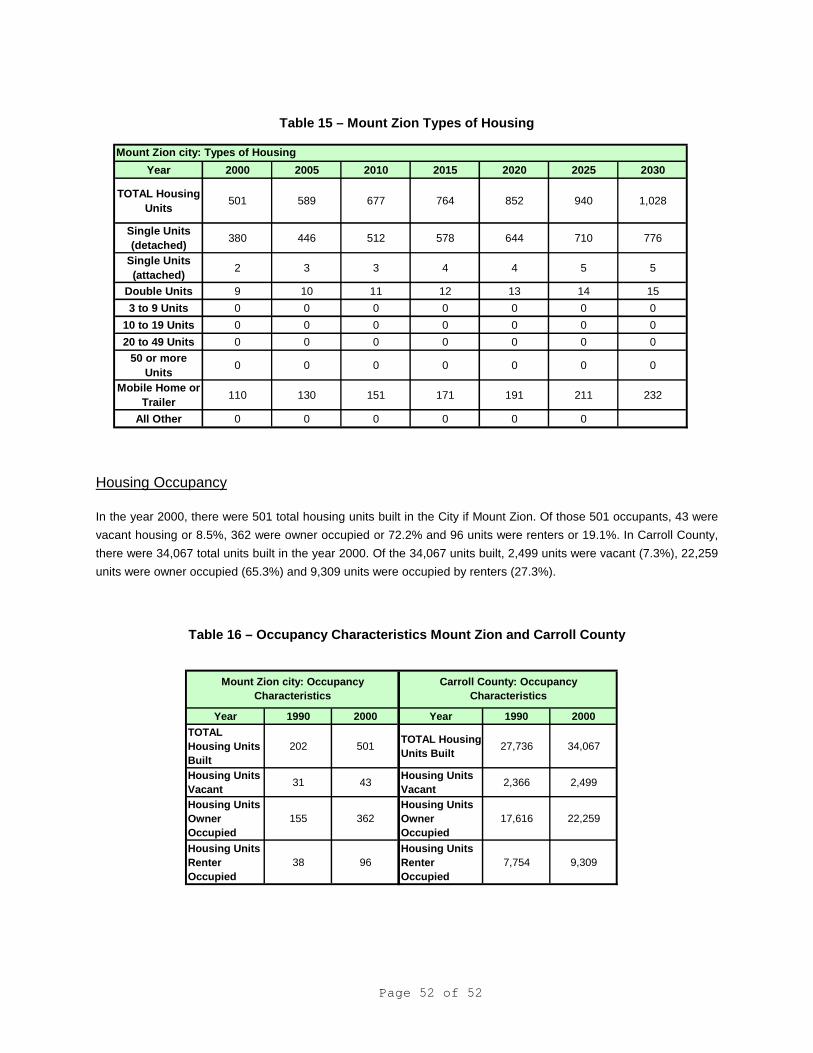
Page 52 of 52
Table 15 – Mount Zion Types of Housing
Housing Occupancy
In the year 2000, there were 501 total housing units built in the City if Mount Zion. Of those 501 occupants, 43 were
vacant housing or 8.5%, 362 were owner occupied or 72.2% and 96 units were renters or 19.1%. In Carroll County,
there were 34,067 total units built in the year 2000. Of the 34,067 units built, 2,499 units were vacant (7.3%), 22,259
units were owner occupied (65.3%) and 9,309 units were occupied by renters (27.3%).
Table 16 – Occupancy Characteristics Mount Zion and Carroll County
Year 2000 2005 2010 2015 2020 2025 2030
TOTAL Housing
Units501 589 677 764 852 940 1,028
Single Units
(detached)380 446 512 578 644 710 776
Single Units
(attached)2 3 3 4 4 5 5
Double Units 9 10 11 12 13 14 15
3 to 9 Units 0 0 0 0 0 0 0
10 to 19 Units 0 0 0 0 0 0 0
20 to 49 Units 0 0 0 0 0 0 0
50 or more
Units0 0 0 0 0 0 0
Mobile Home or
Trailer110 130 151 171 191 211 232
All Other 0 0 0 0 0 0
Mount Zion city: Types of Housing
Year 1990 2000 Year 1990 2000
TOTAL
Housing Units
Built
202 501TOTAL Housing
Units Built27,736 34,067
Housing Units
Vacant31 43
Housing Units
Vacant2,366 2,499
Housing Units
Owner
Occupied
155 362
Housing Units
Owner
Occupied
17,616 22,259
Housing Units
Renter
Occupied
38 96
Housing Units
Renter
Occupied
7,754 9,309
Mount Zion city: Occupancy
Characteristics
Carroll County: Occupancy
Characteristics
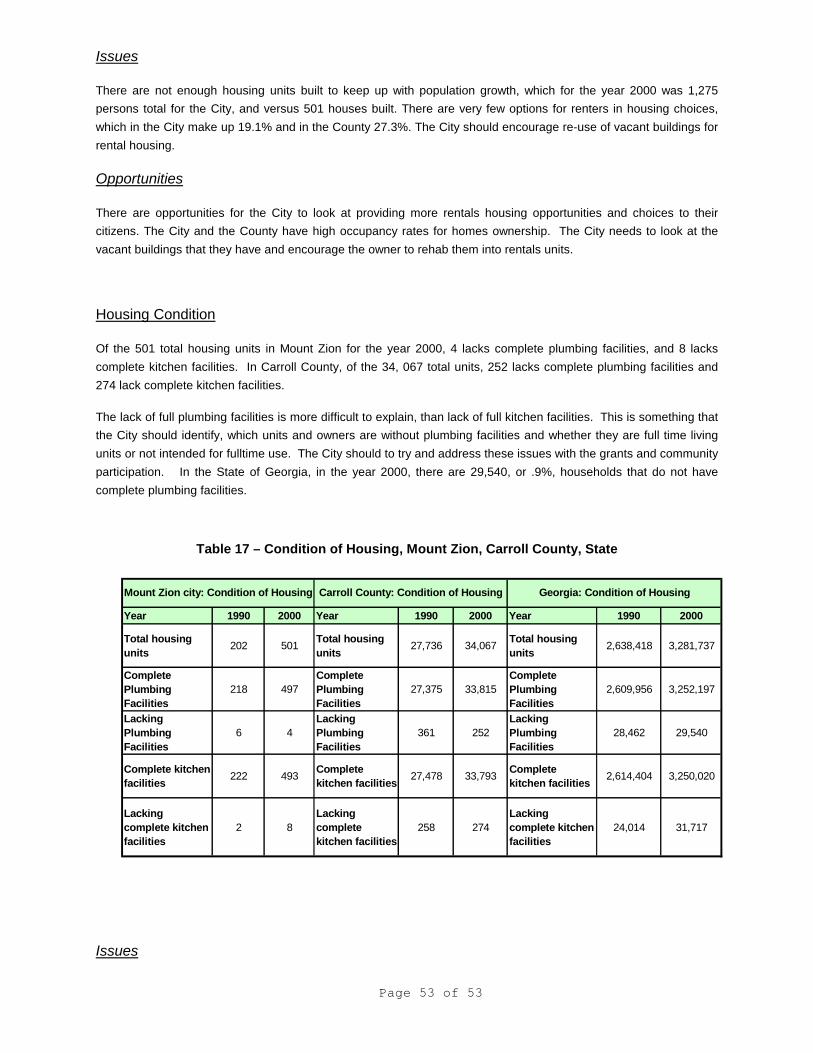
Page 53 of 53
Issues
There are not enough housing units built to keep up with population growth, which for the year 2000 was 1,275
persons total for the City, and versus 501 houses built. There are very few options for renters in housing choices,
which in the City make up 19.1% and in the County 27.3%. The City should encourage re-use of vacant buildings for
rental housing.
Opportunities
There are opportunities for the City to look at providing more rentals housing opportunities and choices to their
citizens. The City and the County have high occupancy rates for homes ownership. The City needs to look at the
vacant buildings that they have and encourage the owner to rehab them into rentals units.
Housing Condition
Of the 501 total housing units in Mount Zion for the year 2000, 4 lacks complete plumbing facilities, and 8 lacks
complete kitchen facilities. In Carroll County, of the 34, 067 total units, 252 lacks complete plumbing facilities and
274 lack complete kitchen facilities.
The lack of full plumbing facilities is more difficult to explain, than lack of full kitchen facilities. This is something that
the City should identify, which units and owners are without plumbing facilities and whether they are full time living
units or not intended for fulltime use. The City should to try and address these issues with the grants and community
participation. In the State of Georgia, in the year 2000, there are 29,540, or .9%, households that do not have
complete plumbing facilities.
Table 17 – Condition of Housing, Mount Zion, Carroll County, State
Issues
Year 1990 2000 Year 1990 2000 Year 1990 2000
Total housing
units202 501
Total housing
units27,736 34,067
Total housing
units2,638,418 3,281,737
Complete
Plumbing
Facilities
218 497
Complete
Plumbing
Facilities
27,375 33,815
Complete
Plumbing
Facilities
2,609,956 3,252,197
Lacking
Plumbing
Facilities
6 4
Lacking
Plumbing
Facilities
361 252
Lacking
Plumbing
Facilities
28,462 29,540
Complete kitchen
facilities222 493
Complete
kitchen facilities27,478 33,793
Complete
kitchen facilities2,614,404 3,250,020
Lacking
complete kitchen
facilities
2 8
Lacking
complete
kitchen facilities
258 274
Lacking
complete kitchen
facilities
24,014 31,717
Mount Zion city: Condition of Housing Carroll County: Condition of Housing Georgia: Condition of Housing
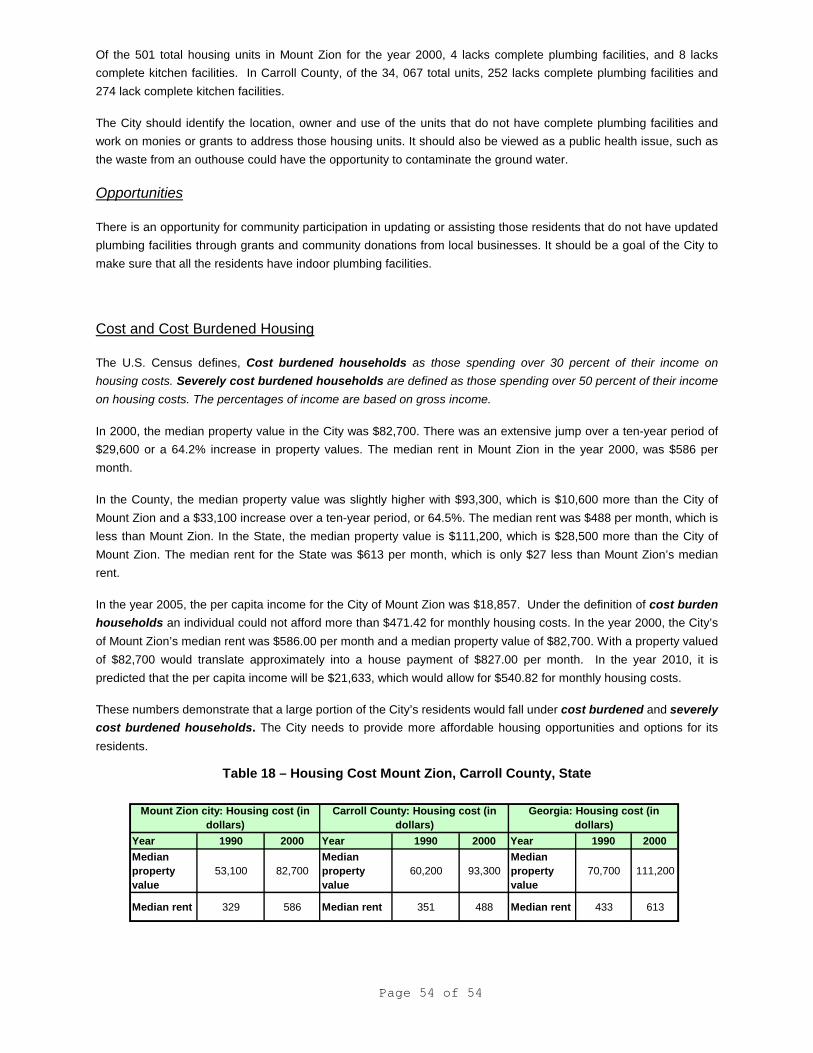
Page 54 of 54
Of the 501 total housing units in Mount Zion for the year 2000, 4 lacks complete plumbing facilities, and 8 lacks
complete kitchen facilities. In Carroll County, of the 34, 067 total units, 252 lacks complete plumbing facilities and
274 lack complete kitchen facilities.
The City should identify the location, owner and use of the units that do not have complete plumbing facilities and
work on monies or grants to address those housing units. It should also be viewed as a public health issue, such as
the waste from an outhouse could have the opportunity to contaminate the ground water.
Opportunities
There is an opportunity for community participation in updating or assisting those residents that do not have updated
plumbing facilities through grants and community donations from local businesses. It should be a goal of the City to
make sure that all the residents have indoor plumbing facilities.
Cost and Cost Burdened Housing
The U.S. Census defines, Cost burdened households as those spending over 30 percent of their income on
housing costs. Severely cost burdened households are defined as those spending over 50 percent of their income
on housing costs. The percentages of income are based on gross income.
In 2000, the median property value in the City was $82,700. There was an extensive jump over a ten-year period of
$29,600 or a 64.2% increase in property values. The median rent in Mount Zion in the year 2000, was $586 per
month.
In the County, the median property value was slightly higher with $93,300, which is $10,600 more than the City of
Mount Zion and a $33,100 increase over a ten-year period, or 64.5%. The median rent was $488 per month, which is
less than Mount Zion. In the State, the median property value is $111,200, which is $28,500 more than the City of
Mount Zion. The median rent for the State was $613 per month, which is only $27 less than Mount Zion’s median
rent.
In the year 2005, the per capita income for the City of Mount Zion was $18,857. Under the definition of cost burden
households an individual could not afford more than $471.42 for monthly housing costs. In the year 2000, the City’s
of Mount Zion’s median rent was $586.00 per month and a median property value of $82,700. With a property valued
of $82,700 would translate approximately into a house payment of $827.00 per month. In the year 2010, it is
predicted that the per capita income will be $21,633, which would allow for $540.82 for monthly housing costs.
These numbers demonstrate that a large portion of the City’s residents would fall under cost burdened and severely
cost burdened households. The City needs to provide more affordable housing opportunities and options for its
residents.
Table 18 – Housing Cost Mount Zion, Carroll County, State
Year 1990 2000 Year 1990 2000 Year 1990 2000
Median
property
value
53,100 82,700
Median
property
value
60,200 93,300
Median
property
value
70,700 111,200
Median rent 329 586 Median rent 351 488 Median rent 433 613
Carroll County: Housing cost (in
dollars)
Mount Zion city: Housing cost (in
dollars)
Georgia: Housing cost (in
dollars)
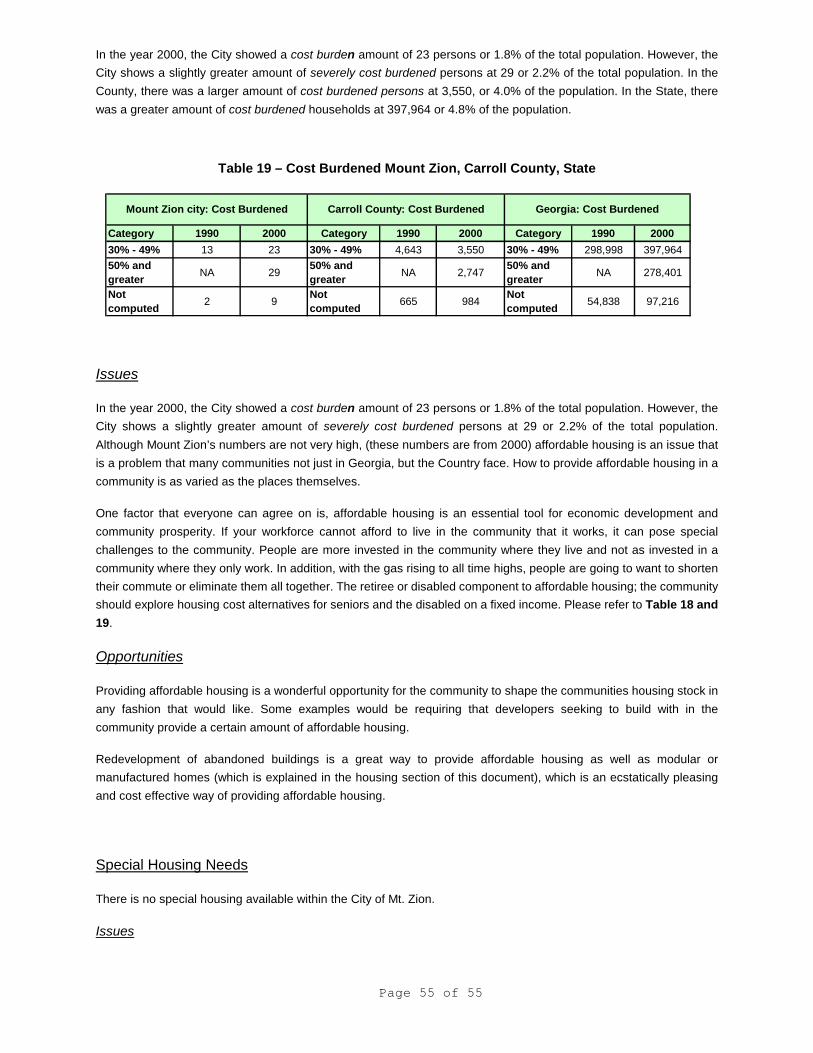
Page 55 of 55
In the year 2000, the City showed a cost burden amount of 23 persons or 1.8% of the total population. However, the
City shows a slightly greater amount of severely cost burdened persons at 29 or 2.2% of the total population. In the
County, there was a larger amount of cost burdened persons at 3,550, or 4.0% of the population. In the State, there
was a greater amount of cost burdened households at 397,964 or 4.8% of the population.
Table 19 – Cost Burdened Mount Zion, Carroll County, State
Issues
In the year 2000, the City showed a cost burden amount of 23 persons or 1.8% of the total population. However, the
City shows a slightly greater amount of severely cost burdened persons at 29 or 2.2% of the total population.
Although Mount Zion’s numbers are not very high, (these numbers are from 2000) affordable housing is an issue that
is a problem that many communities not just in Georgia, but the Country face. How to provide affordable housing in a
community is as varied as the places themselves.
One factor that everyone can agree on is, affordable housing is an essential tool for economic development and
community prosperity. If your workforce cannot afford to live in the community that it works, it can pose special
challenges to the community. People are more invested in the community where they live and not as invested in a
community where they only work. In addition, with the gas rising to all time highs, people are going to want to shorten
their commute or eliminate them all together. The retiree or disabled component to affordable housing; the community
should explore housing cost alternatives for seniors and the disabled on a fixed income. Please refer to Table 18 and
19.
Opportunities
Providing affordable housing is a wonderful opportunity for the community to shape the communities housing stock in
any fashion that would like. Some examples would be requiring that developers seeking to build with in the
community provide a certain amount of affordable housing.
Redevelopment of abandoned buildings is a great way to provide affordable housing as well as modular or
manufactured homes (which is explained in the housing section of this document), which is an ecstatically pleasing
and cost effective way of providing affordable housing.
Special Housing Needs
There is no special housing available within the City of Mt. Zion.
Issues
Category 1990 2000 Category 1990 2000 Category 1990 2000
30% - 49% 13 23 30% - 49% 4,643 3,550 30% - 49% 298,998 397,964
50% and
greaterNA 29
50% and
greaterNA 2,747
50% and
greaterNA 278,401
Not
computed2 9
Not
computed665 984
Not
computed54,838 97,216
Mount Zion city: Cost Burdened Carroll County: Cost Burdened Georgia: Cost Burdened
Page 56 of 56
The City does have an aging population. The City should evaluate their affordable special housing needs for seniors.
In addition, the City should encourage building assisted living facilities as well as nursing homes.
Opportunities
Providing special needs housing is another means of generating economic development for the City.
Job-Housing Balance
In the year 2005, the per capita income for the City of Mount Zion was $18,857. Under the definition of cost burden
households an individual could not afford more than $471.42 for monthly housing costs. In the year 2000, the City’s
of Mount Zion’s median rent was $586.00 per month and a median property value of $82,700. With a property valued
of $82,700 would translate approximately into a house payment of $827.00 per month. In the year 2010, it is
predicted that the per capita income will be $21,633, which would allow for $540.82 for monthly housing costs.
With a per captia income in the City of $18, 857 in 2005, rental housing is much more obtainable than home
ownership, but the rents are even high for that per capita income. The City needs to focus on more housing
alternatives other than the two largest categories, single family detached and trailer-mobile home. Multifamily rentals,
more attached single family and private ownership should be explored.
Issues
In the year 2005, the per capita income for the City of Mount Zion was $18,857. Under the definition of cost burden
households an individual could not afford more than $471.42 for monthly housing costs. In the year 2000, the City’s
of Mount Zion’s median rent was $586.00 per month and a median property value of $82,700. With a property valued
of $82,700 would translate approximately into a house payment of $827.00 per month. In the year 2010, it is
predicted that the per capita income will be $21,633, which would allow for $540.82 for monthly housing costs.
With a per captia income in the City of $18, 857 in 2005, rental housing is much more obtainable than home
ownership, but the rents are even high for that per capita income. The City should explore manufactured or modular
homes as an alternative to mobile homes and trailers, and as another form of rental housing.
Opportunities
Because the City has only a few housing types, this allows the City the opportunity to set design guidelines for the
zoning ordinance, or a stand-alone ordinance.
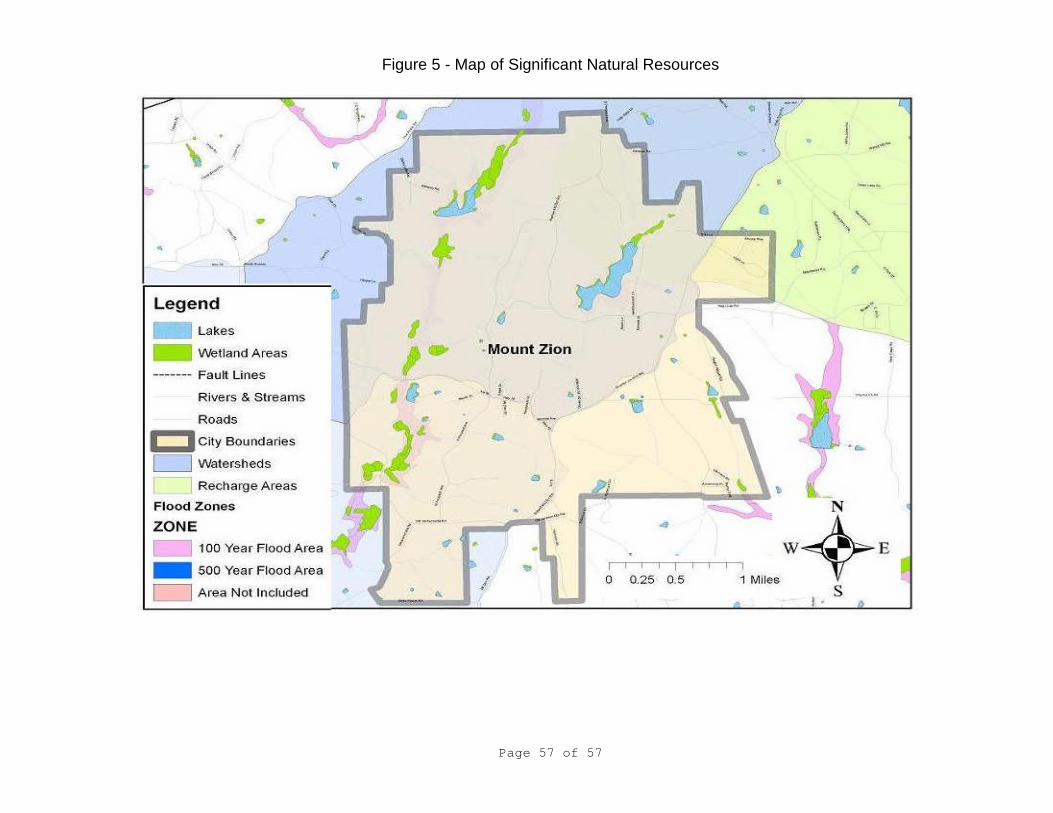
Page 57 of 57
Figure 5 - Map of Significant Natural Resources
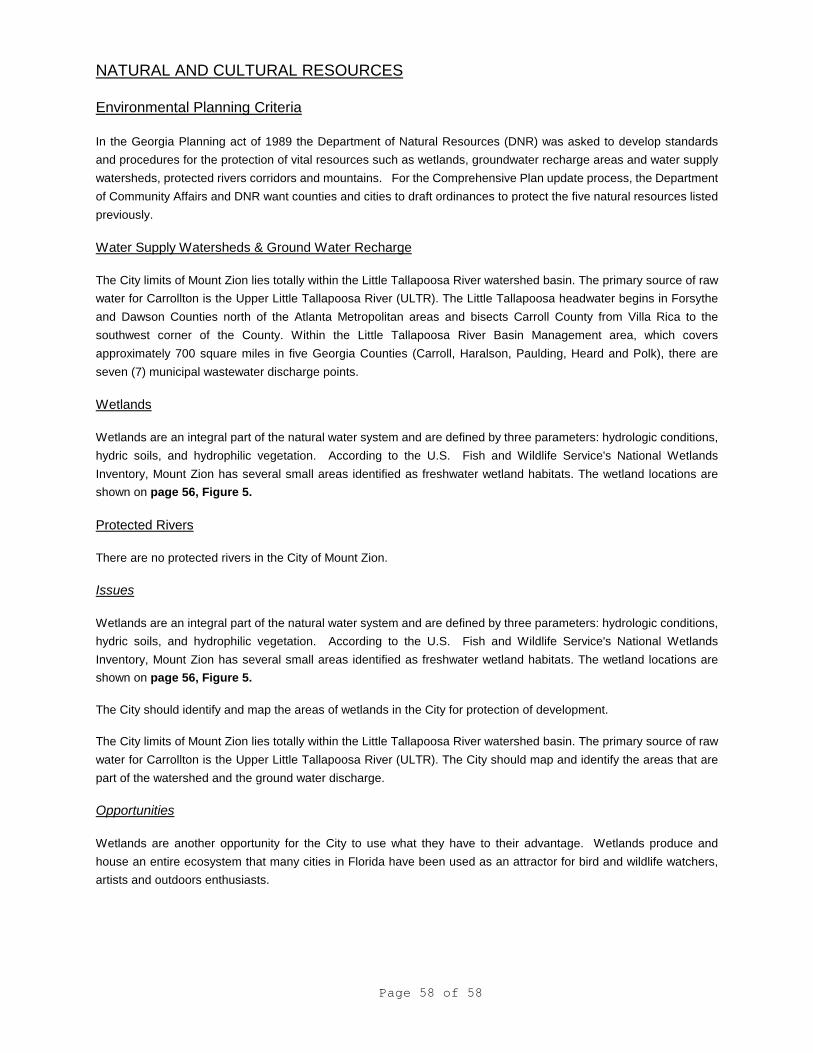
Page 58 of 58
NATURAL AND CULTURAL RESOURCES
Environmental Planning Criteria
In the Georgia Planning act of 1989 the Department of Natural Resources (DNR) was asked to develop standards
and procedures for the protection of vital resources such as wetlands, groundwater recharge areas and water supply
watersheds, protected rivers corridors and mountains. For the Comprehensive Plan update process, the Department
of Community Affairs and DNR want counties and cities to draft ordinances to protect the five natural resources listed
previously.
Water Supply Watersheds & Ground Water Recharge
The City limits of Mount Zion lies totally within the Little Tallapoosa River watershed basin. The primary source of raw
water for Carrollton is the Upper Little Tallapoosa River (ULTR). The Little Tallapoosa headwater begins in Forsythe
and Dawson Counties north of the Atlanta Metropolitan areas and bisects Carroll County from Villa Rica to the
southwest corner of the County. Within the Little Tallapoosa River Basin Management area, which covers
approximately 700 square miles in five Georgia Counties (Carroll, Haralson, Paulding, Heard and Polk), there are
seven (7) municipal wastewater discharge points.
Wetlands
Wetlands are an integral part of the natural water system and are defined by three parameters: hydrologic conditions,
hydric soils, and hydrophilic vegetation. According to the U.S. Fish and Wildlife Service's National Wetlands
Inventory, Mount Zion has several small areas identified as freshwater wetland habitats. The wetland locations are
shown on page 56, Figure 5.
Protected Rivers
There are no protected rivers in the City of Mount Zion.
Issues
Wetlands are an integral part of the natural water system and are defined by three parameters: hydrologic conditions,
hydric soils, and hydrophilic vegetation. According to the U.S. Fish and Wildlife Service's National Wetlands
Inventory, Mount Zion has several small areas identified as freshwater wetland habitats. The wetland locations are
shown on page 56, Figure 5.
The City should identify and map the areas of wetlands in the City for protection of development.
The City limits of Mount Zion lies totally within the Little Tallapoosa River watershed basin. The primary source of raw
water for Carrollton is the Upper Little Tallapoosa River (ULTR). The City should map and identify the areas that are
part of the watershed and the ground water discharge.
Opportunities
Wetlands are another opportunity for the City to use what they have to their advantage. Wetlands produce and
house an entire ecosystem that many cities in Florida have been used as an attractor for bird and wildlife watchers,
artists and outdoors enthusiasts.
Page 59 of 59
Other Environmentally Sensitive Areas
Public Water Supply
In the City of Mount Zion, drinking water is obtained from two equally sensitive sources: groundwater and surface
water. Both these resources respond to environmental stressors and require adequate protective measures to insure
their quality.
Approximately one-half of Mount Zion's population relies on groundwater supplies tapped by domestic wells for
drinking water; therefore, groundwater constitutes a critical natural resource in Mount Zion. According to Georgia
Geologic Survey Hydrologic Atlas 18, significant groundwater recharge areas of Georgia, the southern area of Mount
Zion has been designated as a groundwater recharge area. The remainder of Mount Zion's population currently
relies on public water supply obtained from surface sources. The City also has emergency taps to both the City of
Bowdon and Haralson County's water distribution systems.
Steep Slopes
The City of Mount Zion is located within the Central Uplands physiographic district, which is characterized by low
linear ridges 1300-1500 feet above sea level, separated by broad, open valleys.
Flood Plains
National Flood Insurance Program through its Flood Protection Ordinance, there are currently no individual flood
protection policies enforced in the City.
Issues
In the City of Mount Zion, drinking water is obtained from two equally sensitive sources: groundwater and surface
water. Both these resources respond to environmental stressors and require adequate protective measures to insure
their quality.
The City of Mount Zion is located within the Central Uplands physiographic district, which is characterized by low
linear ridges 1300-1500 feet above sea level, separated by broad, open valleys.
In the last update it was discussed that the Flood Protection Ordinance is administered on behalf of the City by the
County Codes Enforcement program, a review of the effectiveness of this program is needed to determine whether
any changes or further regulation is warranted.
Again septic tanks should be inspected to determine their effectiveness from contaminating groundwater.
Opportunities
None at this time
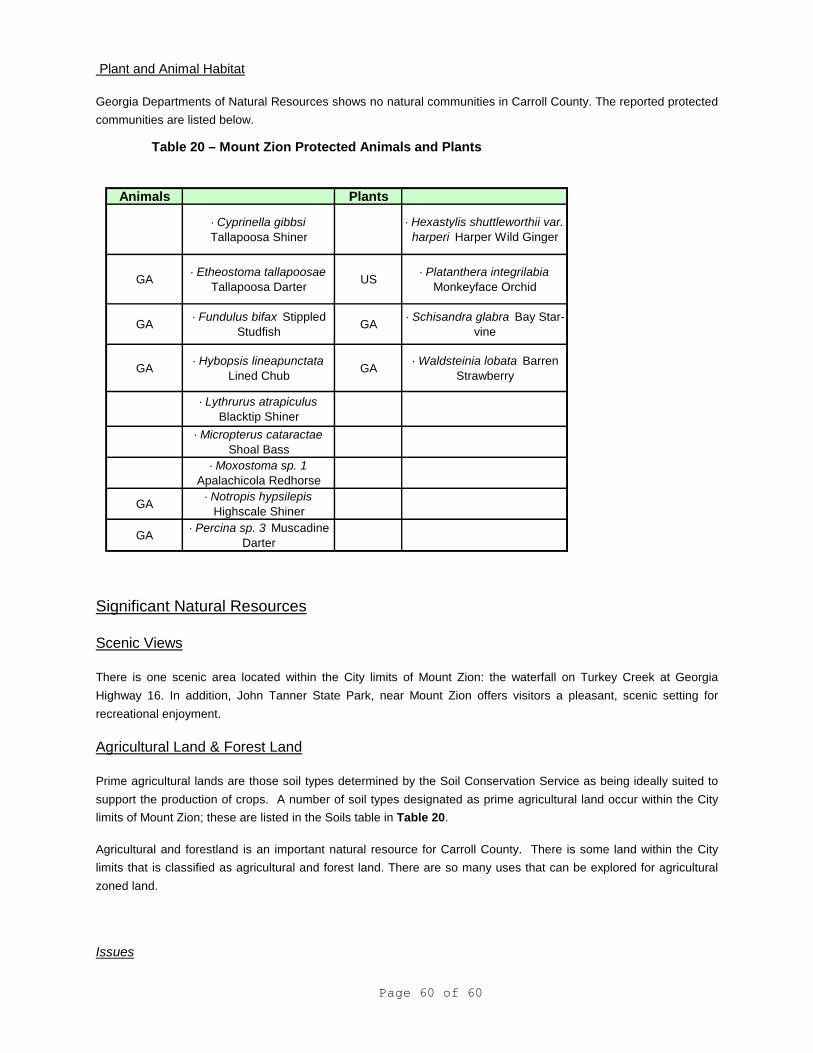
Page 60 of 60
Plant and Animal Habitat
Georgia Departments of Natural Resources shows no natural communities in Carroll County. The reported protected
communities are listed below.
Table 20 – Mount Zion Protected Animals and Plants
Significant Natural Resources
Scenic Views
There is one scenic area located within the City limits of Mount Zion: the waterfall on Turkey Creek at Georgia
Highway 16. In addition, John Tanner State Park, near Mount Zion offers visitors a pleasant, scenic setting for
recreational enjoyment.
Agricultural Land & Forest Land
Prime agricultural lands are those soil types determined by the Soil Conservation Service as being ideally suited to
support the production of crops. A number of soil types designated as prime agricultural land occur within the City
limits of Mount Zion; these are listed in the Soils table in Table 20.
Agricultural and forestland is an important natural resource for Carroll County. There is some land within the City
limits that is classified as agricultural and forest land. There are so many uses that can be explored for agricultural
zoned land.
Issues
Animals Plants
· Cyprinella gibbsi
Tallapoosa Shiner
· Hexastylis shuttleworthii var.
harperi Harper Wild Ginger
GA· Etheostoma tallapoosae
Tallapoosa DarterUS
· Platanthera integrilabia
Monkeyface Orchid
GA· Fundulus bifax Stippled
StudfishGA
· Schisandra glabra Bay Star-
vine
GA· Hybopsis lineapunctata
Lined ChubGA
· Waldsteinia lobata Barren
Strawberry
· Lythrurus atrapiculus
Blacktip Shiner
· Micropterus cataractae
Shoal Bass
· Moxostoma sp. 1
Apalachicola Redhorse
GA· Notropis hypsilepis
Highscale Shiner
GA· Percina sp. 3 Muscadine
Darter
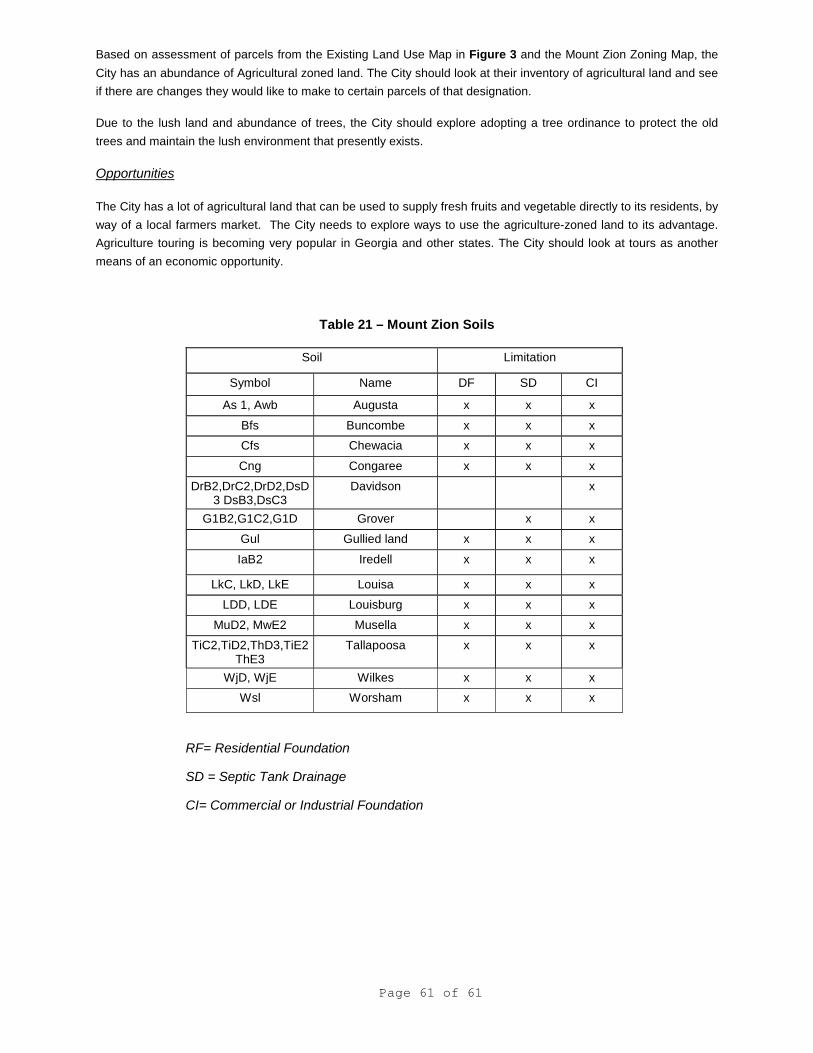
Page 61 of 61
Based on assessment of parcels from the Existing Land Use Map in Figure 3 and the Mount Zion Zoning Map, the
City has an abundance of Agricultural zoned land. The City should look at their inventory of agricultural land and see
if there are changes they would like to make to certain parcels of that designation.
Due to the lush land and abundance of trees, the City should explore adopting a tree ordinance to protect the old
trees and maintain the lush environment that presently exists.
Opportunities
The City has a lot of agricultural land that can be used to supply fresh fruits and vegetable directly to its residents, by
way of a local farmers market. The City needs to explore ways to use the agriculture-zoned land to its advantage.
Agriculture touring is becoming very popular in Georgia and other states. The City should look at tours as another
means of an economic opportunity.
Table 21 – Mount Zion Soils
RF= Residential Foundation
SD = Septic Tank Drainage
CI= Commercial or Industrial Foundation
Soil Limitation
Symbol Name DF SD CI
As 1, Awb Augusta x x x
Bfs Buncombe x x x
Cfs Chewacia x x x
Cng Congaree x x x
DrB2,DrC2,DrD2,DsD3 DsB3,DsC3
Davidson x
G1B2,G1C2,G1D Grover x x
Gul Gullied land x x x
IaB2 Iredell x x x
LkC, LkD, LkE Louisa x x x
LDD, LDE Louisburg x x x
MuD2, MwE2 Musella x x x
TiC2,TiD2,ThD3,TiE2ThE3
Tallapoosa x x x
WjD, WjE Wilkes x x x
Wsl Worsham x x x
Page 62 of 62
Soil Descriptions
Augusta - MLRA(s): 133A, 136, 137, 153A, Depth Class: Very deep Drainage Class: Somewhat poorly drained,
Permeability: Moderate Surface Runoff: Slow Parent Material: Loamy alluvial sediments Slope: 0 to 2 percent Mean
Annual Air Temperature (type location): 61 degrees F. Mean Annual Precipitation (type location): 51 inches
Buncombe - The Buncombe series consists of very deep, excessively drained sandy soils on nearly level to gently
sloping flood plains in the Piedmont and Coastal Plain. They formed in sandy alluvium washed from soils formed in
residuum from schist, gneiss, granite, phyllite, and other metamorphic and igneous rocks of the Piedmont. Slopes
range from 0 to 6 percent. Mean annual precipitation is 48 inches and mean annual temperature is 59 degrees F.
near the type location
Chewacia - MLRA(s): 136-Southern Piedmont, 133A-Southern Coastal Plain, 153A-Atlantic Coast Flatwoods,
Drainage Class (Agricultural): Somewhat poorly drained, Internal Free Water Occurrence: Very shallow to moderately
deep, common, Flooding Frequency and Duration: Frequent to rare for very brief to long periods Ponding, Frequency
and Duration: None, Index Surface Runoff: Negligible to low Permeability: Moderate, Landscape: Piedmont and
Coastal Plain river valleys, Landform: Flood plains Parent Material: Alluvium Slope: 0 to 2 percent, Elevation (type
location): Unknown Mean Annual Air Temperature (type location): 59 degrees F.
Mean Annual Precipitation (type location): 44 inches
Congaree - Series consists of deep, well to moderately well drained, moderately permeable loamy soils that formed in
fluvial sediments. Slopes range from 0 to 4 percent.
Davidson - The Davidson series consists of very deep, well-drained, moderately permeable soils that formed in
materials weathered from dark colored rocks high in ferromagnesian minerals. These soils are on gently sloping to
moderately steep uplands in the Piedmont. Slopes are commonly 2 to 15 percent but range up to 25 percent.
Grover - The Grover series consists of very deep, well drained soils on ridges and side slopes on piedmont uplands.
They formed in residuum that is affected by soil creep in the upper part on steep slopes, and is weathered from high-
grade metamorphic rocks high in mica such as biotite gneiss and schist. Mean annual temperature is 59 degrees F.,
and mean annual precipitation is 64 inches near the type location. Slope ranges from 2 to 45 percent.
Iredell - The Iredell series consists of moderately well drained, very slowly permeable soils. These soils formed in
material weathered from diabase, diorite, gabbro, and other rocks high in ferro-magnesium minerals. They are on
uplands throughout the Piedmont. Slope is dominantly less than 6 percent but ranges up to 15 percent.
Louisa - The Louisa series consists of shallow, somewhat excessively drained soils, which formed over mica gneiss
and schist bedrock. They occur on Piedmont uplands. Slopes are 6 to 80 percent. Near the type location the mean
annual temperature is about 61 degrees F., and the mean annual precipitation is about 51 inches.
Louisburg - The Louisburg Series consists of very deep, well-drained, rapidly permeable soils that formed in material
weathered from felsic igneous and metamorphic rock, primarily granite and granite gneiss. The Louisburg soils are on
summits and side slopes of the Piedmont uplands. Slope ranges from 6 to 45 percent. Near the type location, the
mean annual temperature is 60 degrees F, and the mean annual precipitation is 45 inches.
Musella - The Musella series consists of shallow, well drained, dark red soils on Piedmont uplands. These soils
formed in saprolite weathered from dark-colored rocks high in ferro-magnesium minerals. Slopes range from 2 to 80
percent. Near the type location the mean annual air temperature is 16 degrees F., and mean annual precipitation is
51 inches.
Tallapoosa - The Tallapoosa series consists of shallow, well-drained, moderately permeable soils that formed in
residuum weathered from mica schist. These soils are on narrow ridges and side slopes of the Piedmont Plateau.
Slopes range from 5 to 80 percent.
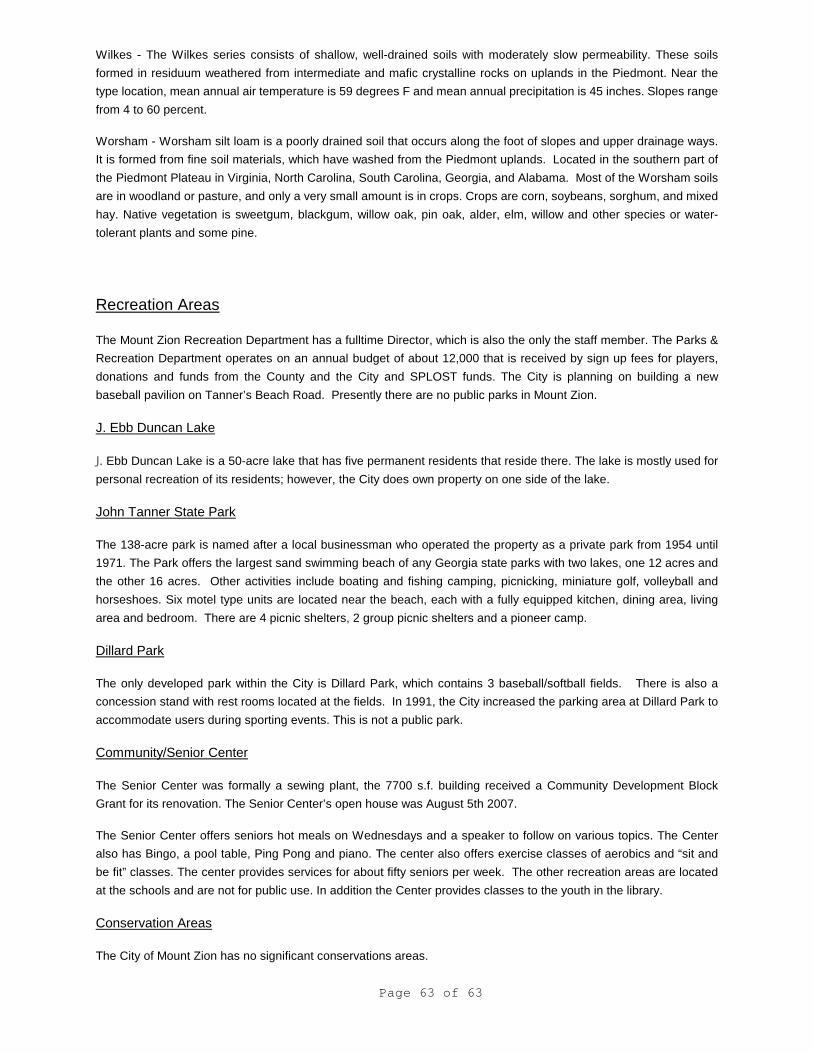
Page 63 of 63
Wilkes - The Wilkes series consists of shallow, well-drained soils with moderately slow permeability. These soils
formed in residuum weathered from intermediate and mafic crystalline rocks on uplands in the Piedmont. Near the
type location, mean annual air temperature is 59 degrees F and mean annual precipitation is 45 inches. Slopes range
from 4 to 60 percent.
Worsham - Worsham silt loam is a poorly drained soil that occurs along the foot of slopes and upper drainage ways.
It is formed from fine soil materials, which have washed from the Piedmont uplands. Located in the southern part of
the Piedmont Plateau in Virginia, North Carolina, South Carolina, Georgia, and Alabama. Most of the Worsham soils
are in woodland or pasture, and only a very small amount is in crops. Crops are corn, soybeans, sorghum, and mixed
hay. Native vegetation is sweetgum, blackgum, willow oak, pin oak, alder, elm, willow and other species or water-
tolerant plants and some pine.
Recreation Areas
The Mount Zion Recreation Department has a fulltime Director, which is also the only the staff member. The Parks &
Recreation Department operates on an annual budget of about 12,000 that is received by sign up fees for players,
donations and funds from the County and the City and SPLOST funds. The City is planning on building a new
baseball pavilion on Tanner’s Beach Road. Presently there are no public parks in Mount Zion.
J. Ebb Duncan Lake
J. Ebb Duncan Lake is a 50-acre lake that has five permanent residents that reside there. The lake is mostly used for
personal recreation of its residents; however, the City does own property on one side of the lake.
John Tanner State Park
The 138-acre park is named after a local businessman who operated the property as a private park from 1954 until
1971. The Park offers the largest sand swimming beach of any Georgia state parks with two lakes, one 12 acres and
the other 16 acres. Other activities include boating and fishing camping, picnicking, miniature golf, volleyball and
horseshoes. Six motel type units are located near the beach, each with a fully equipped kitchen, dining area, living
area and bedroom. There are 4 picnic shelters, 2 group picnic shelters and a pioneer camp.
Dillard Park
The only developed park within the City is Dillard Park, which contains 3 baseball/softball fields. There is also a
concession stand with rest rooms located at the fields. In 1991, the City increased the parking area at Dillard Park to
accommodate users during sporting events. This is not a public park.
Community/Senior Center
The Senior Center was formally a sewing plant, the 7700 s.f. building received a Community Development Block
Grant for its renovation. The Senior Center’s open house was August 5th 2007.
The Senior Center offers seniors hot meals on Wednesdays and a speaker to follow on various topics. The Center
also has Bingo, a pool table, Ping Pong and piano. The center also offers exercise classes of aerobics and “sit and
be fit” classes. The center provides services for about fifty seniors per week. The other recreation areas are located
at the schools and are not for public use. In addition the Center provides classes to the youth in the library.
Conservation Areas
The City of Mount Zion has no significant conservations areas.
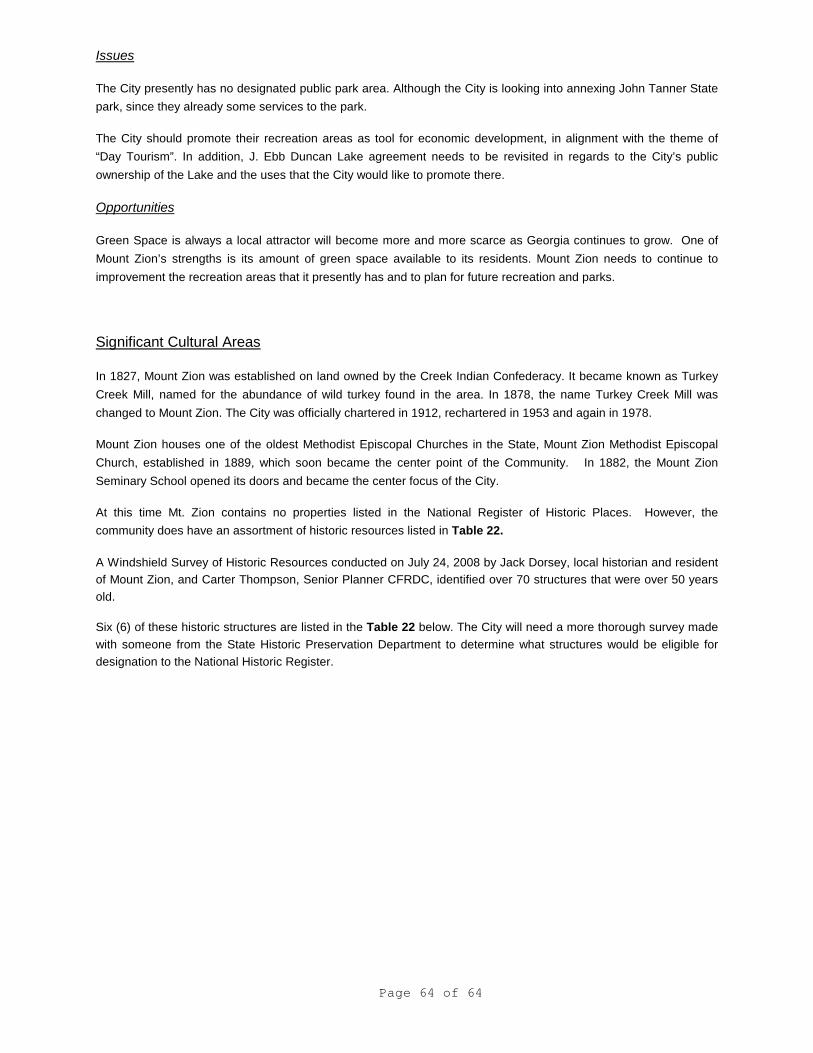
Page 64 of 64
Issues
The City presently has no designated public park area. Although the City is looking into annexing John Tanner State
park, since they already some services to the park.
The City should promote their recreation areas as tool for economic development, in alignment with the theme of
“Day Tourism”. In addition, J. Ebb Duncan Lake agreement needs to be revisited in regards to the City’s public
ownership of the Lake and the uses that the City would like to promote there.
Opportunities
Green Space is always a local attractor will become more and more scarce as Georgia continues to grow. One of
Mount Zion’s strengths is its amount of green space available to its residents. Mount Zion needs to continue to
improvement the recreation areas that it presently has and to plan for future recreation and parks.
Significant Cultural Areas
In 1827, Mount Zion was established on land owned by the Creek Indian Confederacy. It became known as Turkey
Creek Mill, named for the abundance of wild turkey found in the area. In 1878, the name Turkey Creek Mill was
changed to Mount Zion. The City was officially chartered in 1912, rechartered in 1953 and again in 1978.
Mount Zion houses one of the oldest Methodist Episcopal Churches in the State, Mount Zion Methodist Episcopal
Church, established in 1889, which soon became the center point of the Community. In 1882, the Mount Zion
Seminary School opened its doors and became the center focus of the City.
At this time Mt. Zion contains no properties listed in the National Register of Historic Places. However, the
community does have an assortment of historic resources listed in Table 22.
A Windshield Survey of Historic Resources conducted on July 24, 2008 by Jack Dorsey, local historian and resident
of Mount Zion, and Carter Thompson, Senior Planner CFRDC, identified over 70 structures that were over 50 years
old.
Six (6) of these historic structures are listed in the Table 22 below. The City will need a more thorough survey made
with someone from the State Historic Preservation Department to determine what structures would be eligible for
designation to the National Historic Register.
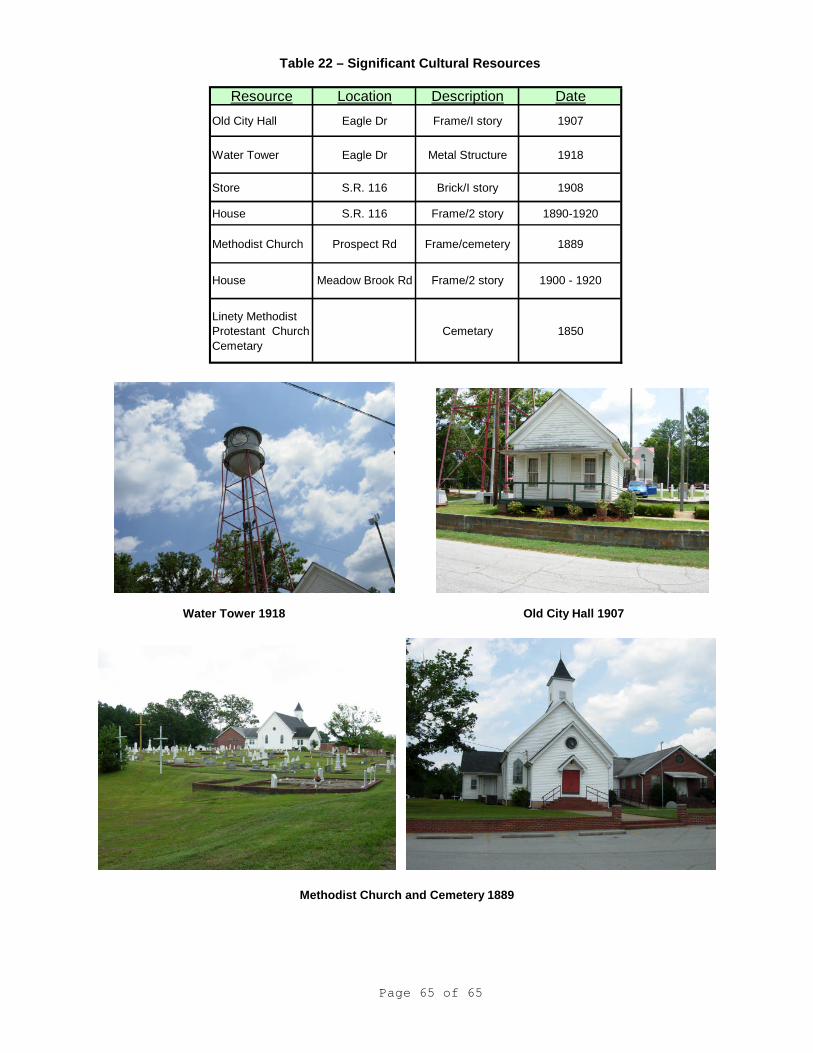
Page 65 of 65
Table 22 – Significant Cultural Resources
Water Tower 1918 Old City Hall 1907
Methodist Church and Cemetery 1889
Resource Location Description Date
Old City Hall Eagle Dr Frame/I story 1907
Water Tower Eagle Dr Metal Structure 1918
Store S.R. 116 Brick/I story 1908
House S.R. 116 Frame/2 story 1890-1920
Methodist Church Prospect Rd Frame/cemetery 1889
Linety Methodist
Protestant Church
Cemetary
Cemetary 1850
House Meadow Brook Rd Frame/2 story 1900 - 1920
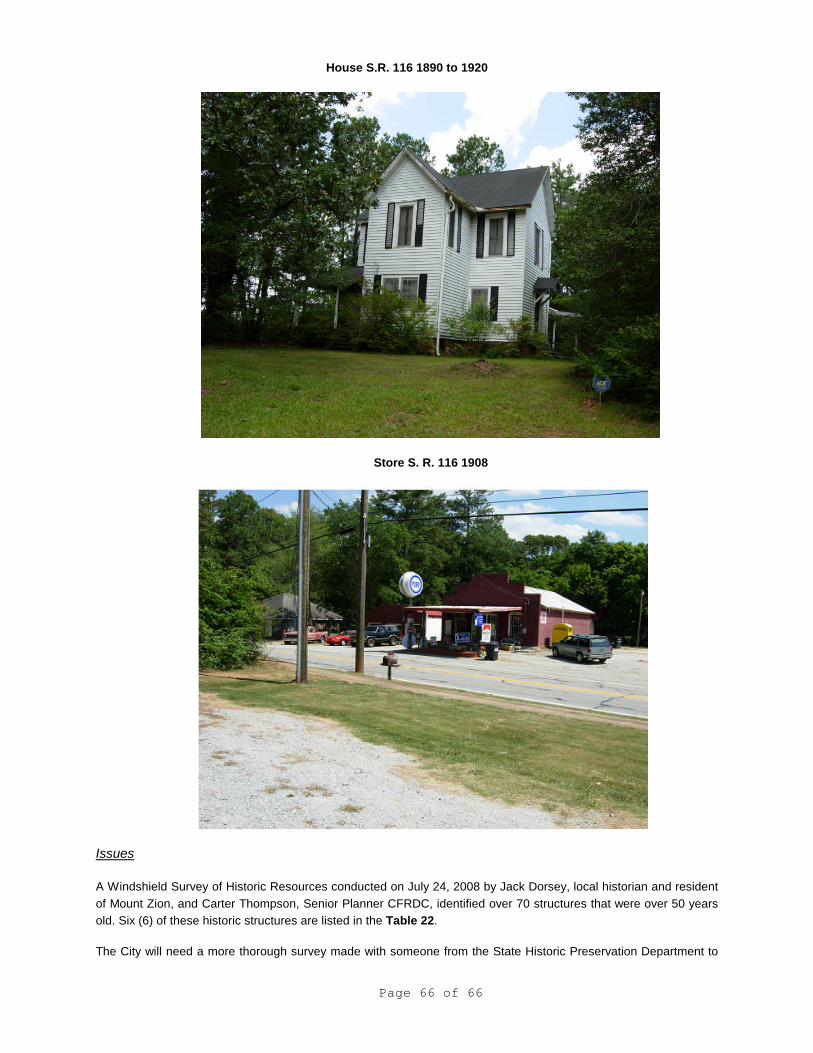
Page 66 of 66
House S.R. 116 1890 to 1920
Store S. R. 116 1908
Issues
A Windshield Survey of Historic Resources conducted on July 24, 2008 by Jack Dorsey, local historian and resident
of Mount Zion, and Carter Thompson, Senior Planner CFRDC, identified over 70 structures that were over 50 years
old. Six (6) of these historic structures are listed in the Table 22.
The City will need a more thorough survey made with someone from the State Historic Preservation Department to
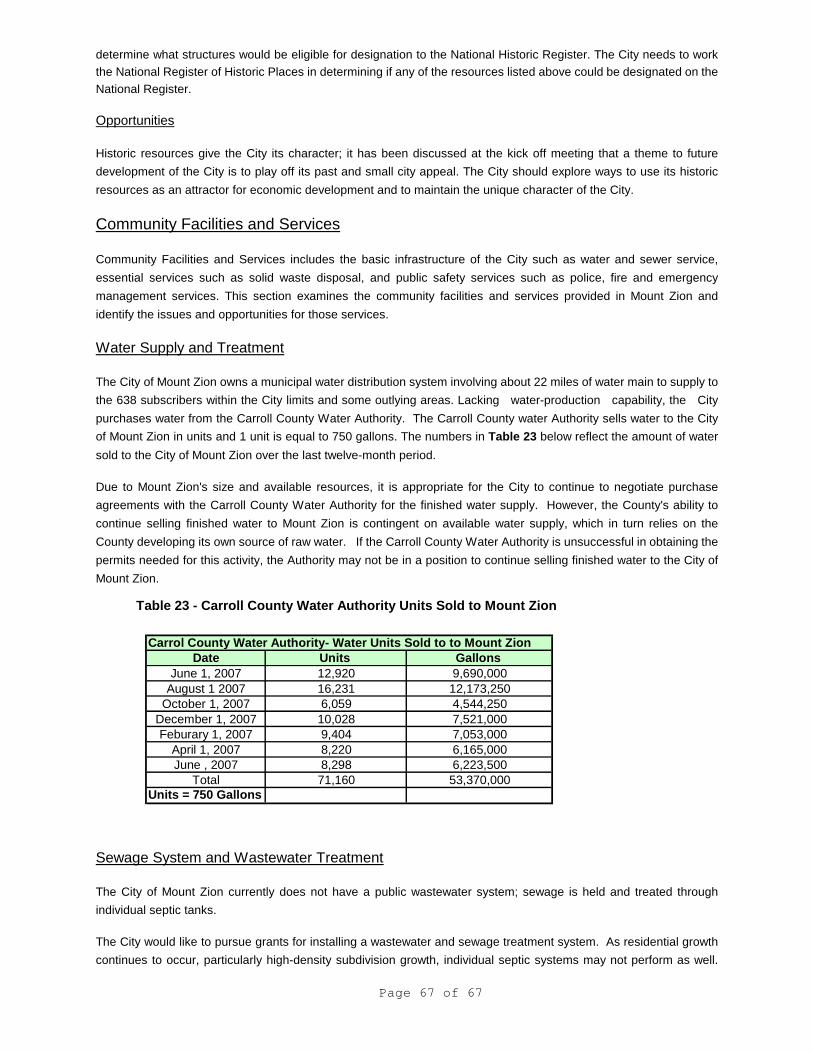
Page 67 of 67
determine what structures would be eligible for designation to the National Historic Register. The City needs to work
the National Register of Historic Places in determining if any of the resources listed above could be designated on the
National Register.
Opportunities
Historic resources give the City its character; it has been discussed at the kick off meeting that a theme to future
development of the City is to play off its past and small city appeal. The City should explore ways to use its historic
resources as an attractor for economic development and to maintain the unique character of the City.
Community Facilities and Services
Community Facilities and Services includes the basic infrastructure of the City such as water and sewer service,
essential services such as solid waste disposal, and public safety services such as police, fire and emergency
management services. This section examines the community facilities and services provided in Mount Zion and
identify the issues and opportunities for those services.
Water Supply and Treatment
The City of Mount Zion owns a municipal water distribution system involving about 22 miles of water main to supply to
the 638 subscribers within the City limits and some outlying areas. Lacking water-production capability, the City
purchases water from the Carroll County Water Authority. The Carroll County water Authority sells water to the City
of Mount Zion in units and 1 unit is equal to 750 gallons. The numbers in Table 23 below reflect the amount of water
sold to the City of Mount Zion over the last twelve-month period.
Due to Mount Zion's size and available resources, it is appropriate for the City to continue to negotiate purchase
agreements with the Carroll County Water Authority for the finished water supply. However, the County's ability to
continue selling finished water to Mount Zion is contingent on available water supply, which in turn relies on the
County developing its own source of raw water. If the Carroll County Water Authority is unsuccessful in obtaining the
permits needed for this activity, the Authority may not be in a position to continue selling finished water to the City of
Mount Zion.
Table 23 - Carroll County Water Authority Units Sold to Mount Zion
Sewage System and Wastewater Treatment
The City of Mount Zion currently does not have a public wastewater system; sewage is held and treated through
individual septic tanks.
The City would like to pursue grants for installing a wastewater and sewage treatment system. As residential growth
continues to occur, particularly high-density subdivision growth, individual septic systems may not perform as well.
Carrol County Water Authority- Water Units Sold to to Mount ZionDate
June 1, 2007August 1 2007
October 1, 2007December 1, 2007Feburary 1, 2007
April 1, 2007June , 2007
TotalUnits = 750 Gallons
9,4048,220
GallonsUnits
12,92016,231
8,298
9,690,00012,173,2504,544,2507,521,0007,053,0006,165,0006,223,500
6,05910,028
71,160 53,370,000
Page 68 of 68
The City should explore sewage a wastewater treatment facility within the City limits and look at methods that the City
can afford.
Septic Tanks
The City of Mount Zion sewage is currently held in septic tanks.
The southern part of the City is located within an identified potential significant groundwater recharge area, making
effective enforcement of septic system violations especially important. The City needs to address available
enforcement mechanisms to monitor septic tanks, to insure that there is no leakage into the groundwater or wells.
Issues
Due to an ongoing drought that Georgia is facing, it is recommended that the City should prepare for their water
needs separate of the County. The City should look at innovative ways to conserve water through policies and
building code enforcement and the public should be educated on water conservation as well.
The City should pursue grants and low interest loans for a sewage and wastewater treatment system.
The City should to do an inventory of septic systems and evaluate the efficiency of those systems; especially those
located on the southern portion of the City that houses the ground water recharge area.
Opportunities
If the City can get some financial assistance for improving their infrastructure as a whole, this will aid in the economic
development for the City.
Public Safety
Fire Protection
Carroll County Fire Rescue and Emergency Management Agency provides fire and related services for Mount Zion.
The department overall employs 111 career personnel and 105 volunteer personnel. The department operates 13
fulltime stations. Carroll County Fire Rescue and Emergency Management Agency responded to 7130 requests for
assistance during the 2007calendar year, which is a 10.47% increase over the 2006 responses.
The busiest engine companies for the Department’s match the busiest districts for the last several years. Our four
busiest engine companies are Engine 9 in Villa Rica, Engine 3 in Sandhill, Engine 2 in Temple and Engine 16 located
on Tumlin Lake Road. The combined totals for these three engine companies are 4267 responses, which represent
53.71% of the overall Engine response total of 7945 responses for 2007. There were 145 responses to the City of
Mount Zion in 2007 with an average response time of 2.04%.
The Insurance Services Office evaluates fire departments and fire suppression systems throughout the United States.
ISO evaluates three key areas: communications, the water system, and the fire department. The ISO rating for the
county affects what property owner’s pay for fire insurance, the lower the ISO rating, the less you pay for fire
insurance. Our new rating is a Class 5/9 in the unincorporated areas of the county and a Class 4/9 in all the cities
served by our department. This includes all of the cities in Carroll County except the City of Carrollton.
During the 2007 calendar year, the Emergency Management Division completed the work on the Western Area
Regional Radio System Homeland Security Grant. This grant provided $400,000.00 of Federal Funds for the Western
Area Regional Radio System. The grant focus was changed to allow the grant to be used for the hub of the system to
be located in Carroll County. This system is still under construction in 2008.
Page 69 of 69
Issues
The City presently has one fire station located within the City limits; perhaps pursuing another would be worth
exploring for the safety and job creation benefits.
Opportunities
If a new station were located in the City it would provide emergency and fire services closer to the City’s residents.
The station would also provide jobs for the City’s residents.
Police
The City of Mt. Zion Police Department is located in the City Hall Building just off State Route 16 in the center of the
City. The Department office within City Hall has recently become overcrowded and more floor space is needed. The
Chief would like to build a new jail, or rehab an existing building that could be renovated into a jail.
The Department employs three fulltime police officers and three part-time including the Police Chief and four reserve
officers. At least one officer is on duty or on call 24-hours a day, seven days a week. The Chief would like to add
more officers, so that two can work a 24-hour shift instead of just one. The Department operates six patrol cars. The
Carroll County Sheriff's Department and the Georgia State Patrol works closely with the City Police Department and
provides backup when needed. The Police Department answered 893, emergency phone calls in 2006 and 1288
emergency calls in 2007.
Prisoners are transported to the Carroll County Jail for detention. Carroll County's Enhanced 911 system provides a
quick response by the Mt. Zion Police Department to the citizens of Mt. Zion and the surrounding areas. The general
consensus of local citizens input suggested that the Police Department provides adequate protection.
The Police also enforce code violations in the City, these ordinances to be updated to address the issues that the City
is experiencing.
Issues
The Police Department is presently located within City Hall. The Police department needs a separate space from City
Hall to conduct daily operations. In addition, the department needs a holding cell for those arrested and waiting
transport to Carroll County jail.
The City has a problem with illegal drug use and selling. The Chief would like to explore ways to cut down on this
issue in the City.
Since the police department is taking care of code enforcement, the City should look at implementing a code
enforcement officer to the city payroll. In addition, the codes need to be updated to reflect the issues that the City is
having.
Opportunities
If the Police Department can expand, this may be another opportunity to create jobs and perhaps hire a new officer
that just takes care of code enforcement issues for the City.
Page 70 of 70
Emergency Medical Service
Mount contracts with West Georgia Ambulance Service, which is private carrier for ambulance service. It provides
pre-hospital emergency care and transportation to area hospitals. The service operates four ambulances; each
equipped with advanced life support systems, and is manned by 26 advanced emergency technicians. The service
also operates a first-response jeep for special cases, including area recreational activities.
Storm Water Management
The City does not provide any monitoring of storm water at this time.
Issues
The City presently does not provide any monitoring of storm water at this time.
The City should monitor their existing storm water ponds; because of the amount of groundwater they use for
drinking. A self-monitoring ordinance could be drafted for future development, which gives the responsibility of
monitoring to the homeowners associations or the developer, if the project is being developed in stages.
Opportunities
Monitoring storm water management gives the City and opportunity to ensures that chemicals or pollutants are not
getting into the ground water of their residents drinking water.
Solid Waste Management
The City of Mount Zion contracts with a local solid waste hauler, Avery Environmental for the municipal collection of
residential and commercial solid waste. Each resident is given a 50-gallon trash container and pick up is once per
week.
Disposal of this waste is generally at the Carroll County landfill, although the hauler is not obligated to do so. There is
currently no recycling effort. To address solid waste management issues, the City of Mount Zion has been
participating in the regional solid waste management planning process.
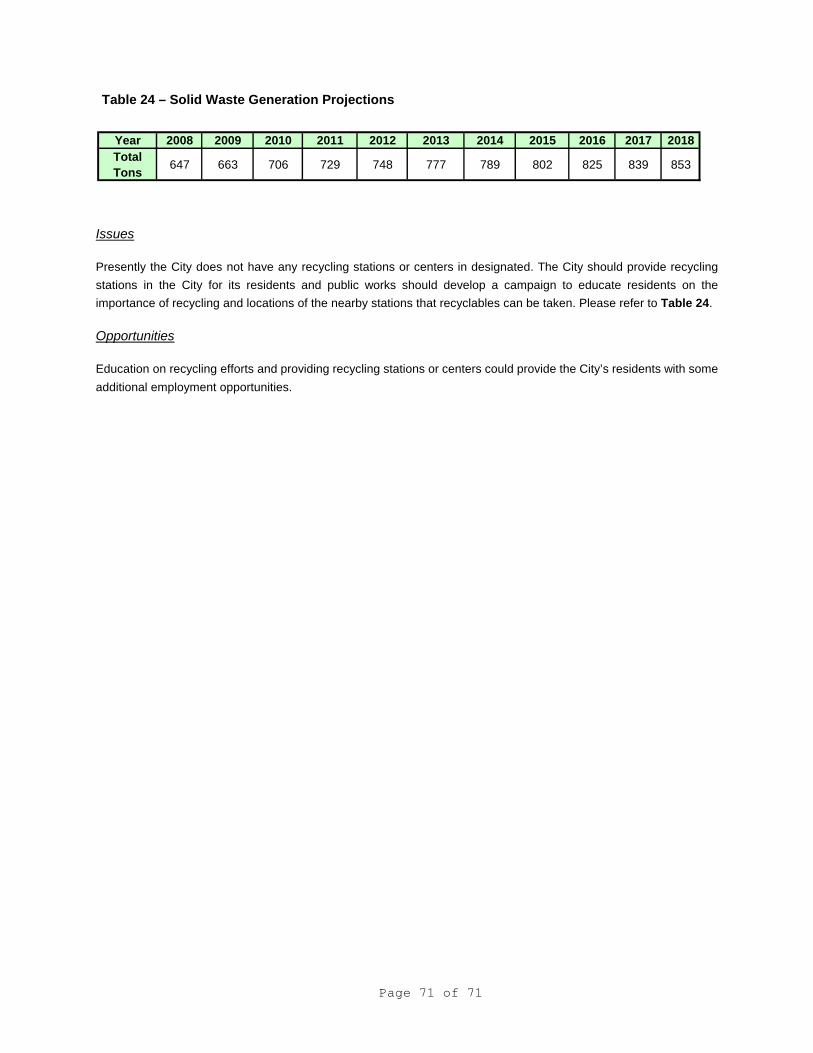
Page 71 of 71
Table 24 – Solid Waste Generation Projections
Issues
Presently the City does not have any recycling stations or centers in designated. The City should provide recycling
stations in the City for its residents and public works should develop a campaign to educate residents on the
importance of recycling and locations of the nearby stations that recyclables can be taken. Please refer to Table 24.
Opportunities
Education on recycling efforts and providing recycling stations or centers could provide the City’s residents with some
additional employment opportunities.
Year 2008 2009 2010 2011 2012 2013 2014 2015 2016 2017 2018
Total
Tons647 663 706 729 748 777 789 802 825 839 853
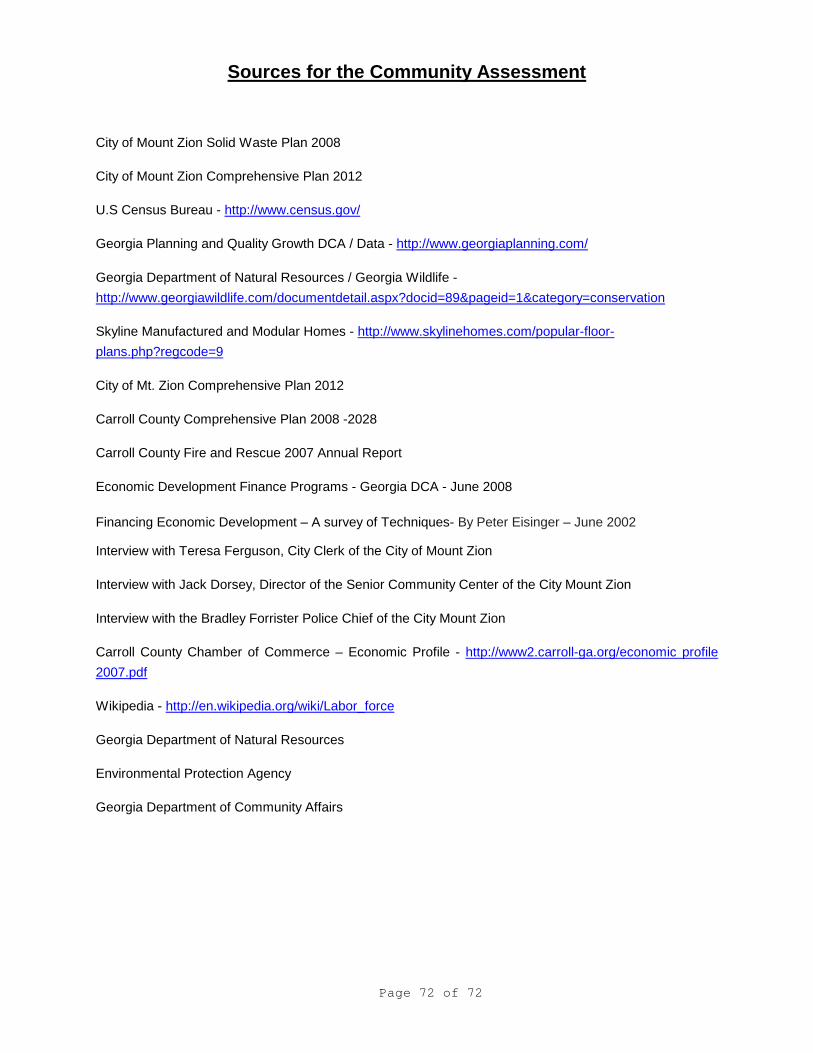
Page 72 of 72
Sources for the Community Assessment
City of Mount Zion Solid Waste Plan 2008
City of Mount Zion Comprehensive Plan 2012
U.S Census Bureau - http://www.census.gov/
Georgia Planning and Quality Growth DCA / Data - http://www.georgiaplanning.com/
Georgia Department of Natural Resources / Georgia Wildlife -
http://www.georgiawildlife.com/documentdetail.aspx?docid=89&pageid=1&category=conservation
Skyline Manufactured and Modular Homes - http://www.skylinehomes.com/popular-floor-
plans.php?regcode=9
City of Mt. Zion Comprehensive Plan 2012
Carroll County Comprehensive Plan 2008 -2028
Carroll County Fire and Rescue 2007 Annual Report
Economic Development Finance Programs - Georgia DCA - June 2008
Financing Economic Development – A survey of Techniques- By Peter Eisinger – June 2002
Interview with Teresa Ferguson, City Clerk of the City of Mount Zion
Interview with Jack Dorsey, Director of the Senior Community Center of the City Mount Zion
Interview with the Bradley Forrister Police Chief of the City Mount Zion
Carroll County Chamber of Commerce – Economic Profile - http://www2.carroll-ga.org/economic profile
2007.pdf
Wikipedia - http://en.wikipedia.org/wiki/Labor_force
Georgia Department of Natural Resources
Environmental Protection Agency
Georgia Department of Community Affairs
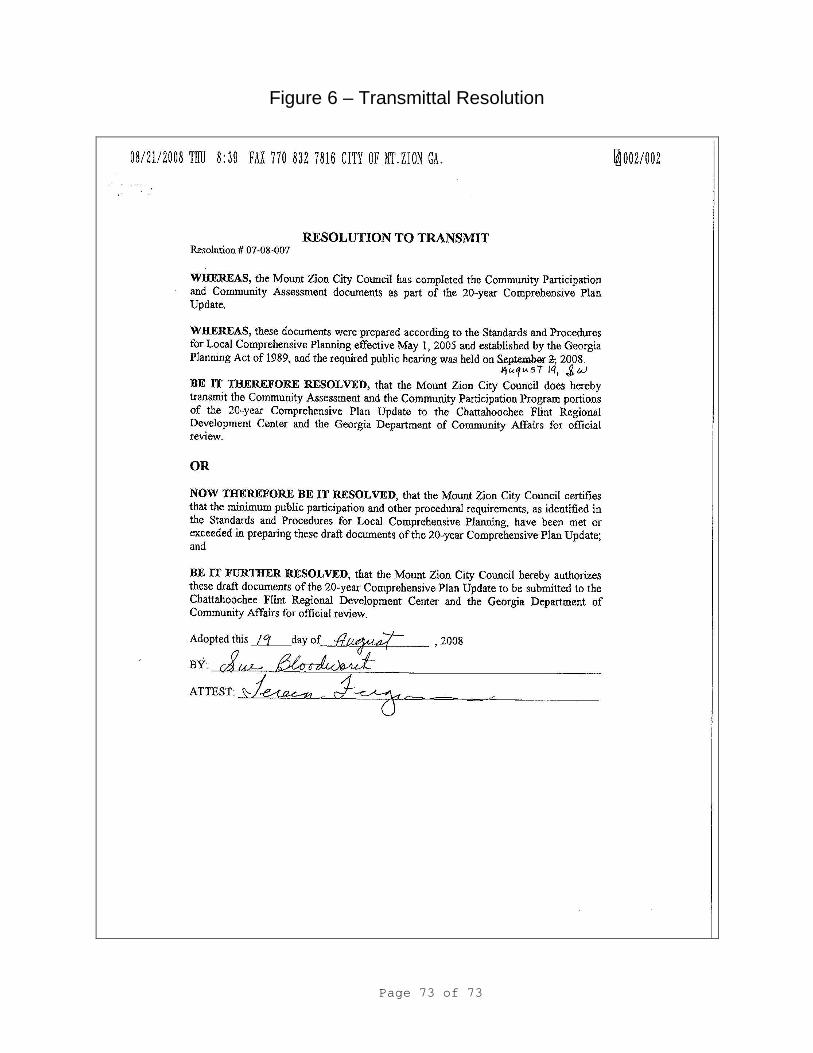
Page 73 of 73
Figure 6 – Transmittal Resolution
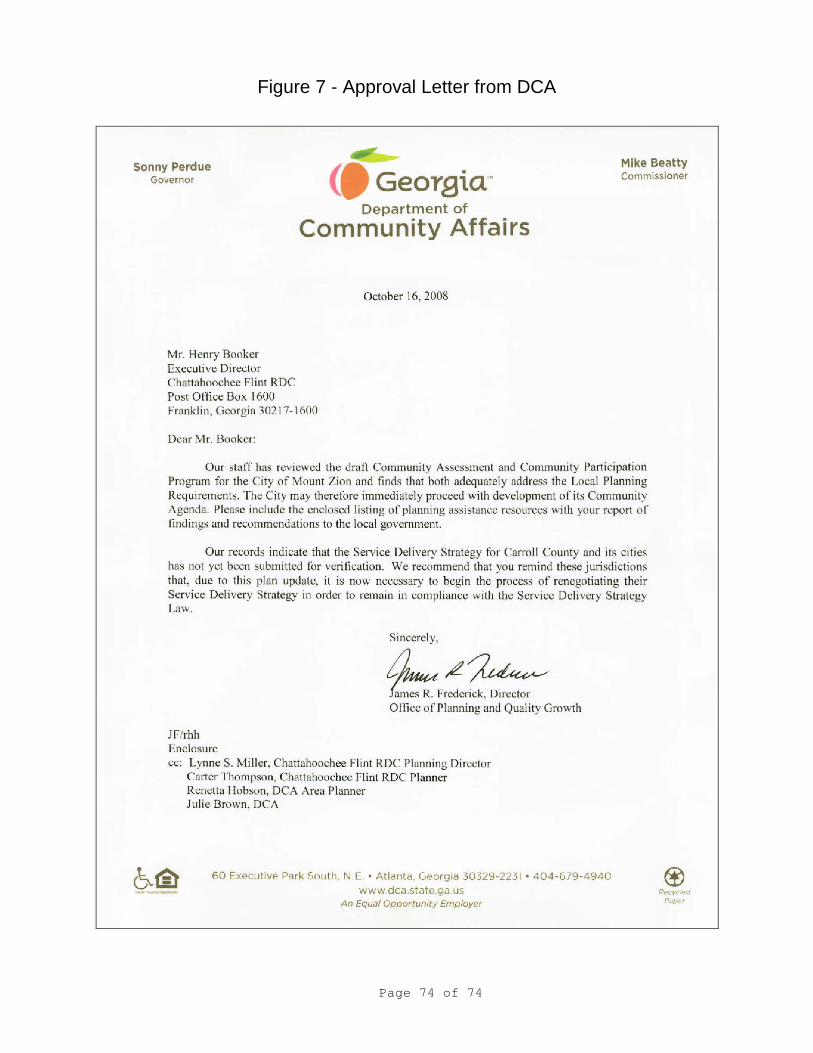
Page 74 of 74
Figure 7 - Approval Letter from DCA
Page 75 of 75
Figure 8 – Adoption Resolution