Embed Size (px)
Citation preview
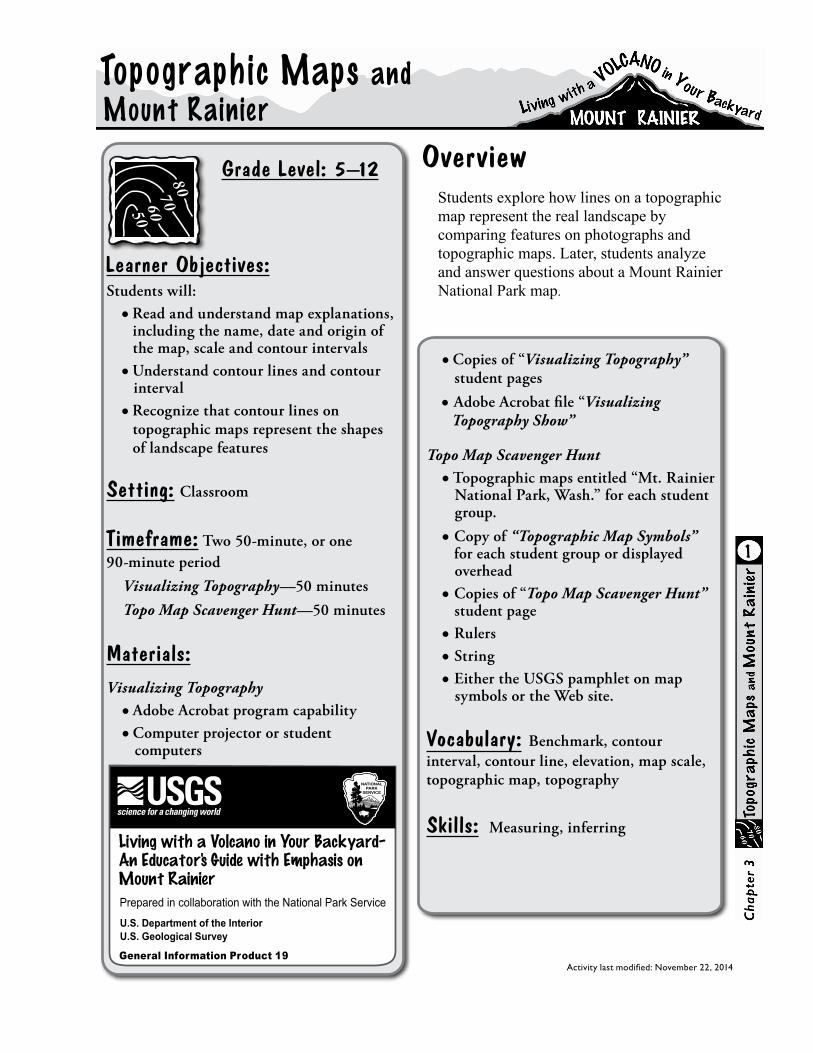
Learner Objectives:Students will: ● Read and understand map explanations, including the name, date and origin of the map, scale and contour intervals ● Understand contour lines and contour interval ● Recognize that contour lines on topographic maps represent the shapes of landscape features
Setting: Classroom
Timeframe: Two 50-minute, or one 90-minute period
Visualizing Topography—50 minutes
Topo Map Scavenger Hunt—50 minutes
Materials: Visualizing Topography
● Adobe Acrobat program capability● Computer projector or student computers
Grade Level: 5–12
Topographic Maps and
● Copies of “Visualizing Topography” student pages● Adobe Acrobat file “Visualizing Topography Show”
Topo Map Scavenger Hunt● Topographic maps entitled “Mt. Rainier National Park, Wash.” for each student group.● Copy of “Topographic Map Symbols” for each student group or displayed overhead● Copies of “Topo Map Scavenger Hunt” student page● Rulers● String● Either the USGS pamphlet on map symbols or the Web site.
Vocabulary: Benchmark, contour interval, contour line, elevation, map scale, topographic map, topography
Skills: Measuring, inferring
1
Mount Rainier
Overview
Students explore how lines on a topographic map represent the real landscape by comparing features on photographs and topographic maps. Later, students analyze and answer questions about a Mount Rainier National Park map.
Activity last modified: November 22, 2014
5060
7080
U.S. Department of the InteriorU.S. Geological Survey
General Information Product 19
Living with a Volcano in Your Backyard-An Educator's Guide with Emphasis onMount Rainier
Prepared in collaboration with the National Park Service
NATIONALPARK
SERVICE
Topographic Maps and Mount Rainier-continued . . .
Benchmarks:
See benchmarks in Introduction.
2
Topographic Maps and Mount Rainier-continued . . .
Teacher BackgroundMap scale
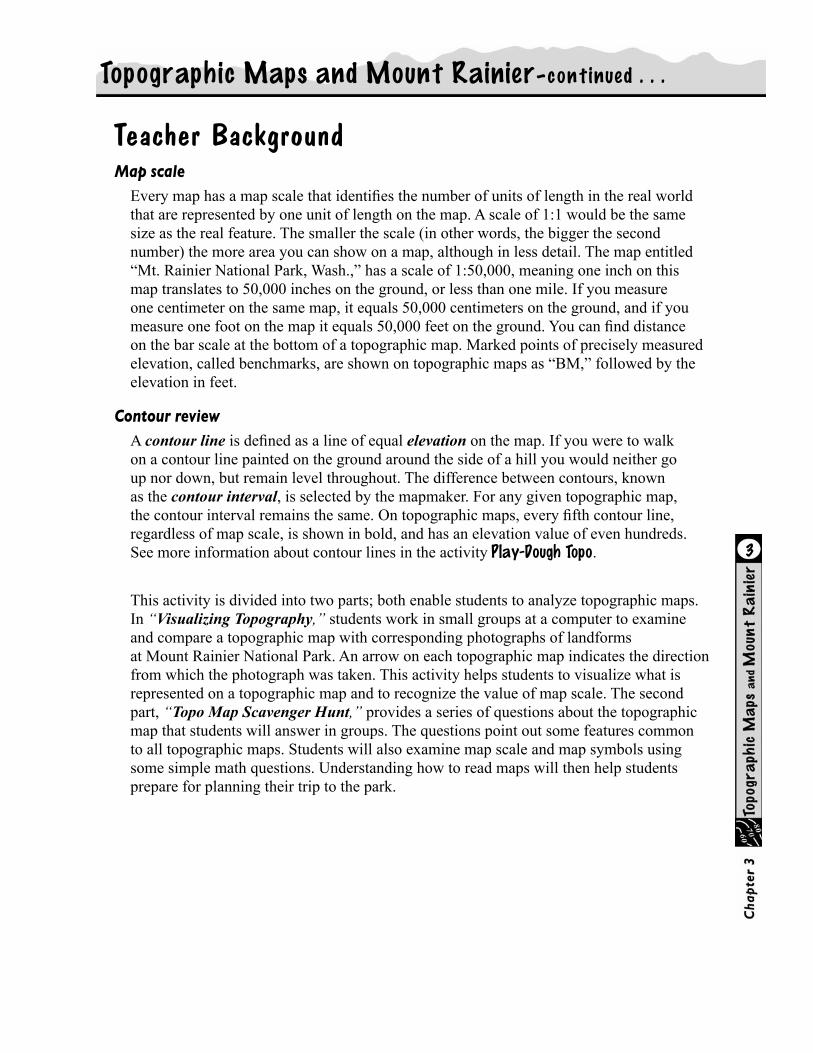
Every map has a map scale that identifies the number of units of length in the real world that are represented by one unit of length on the map. A scale of 1:1 would be the same size as the real feature. The smaller the scale (in other words, the bigger the second number) the more area you can show on a map, although in less detail. The map entitled “Mt. Rainier National Park, Wash.,” has a scale of 1:50,000, meaning one inch on this map translates to 50,000 inches on the ground, or less than one mile. If you measure one centimeter on the same map, it equals 50,000 centimeters on the ground, and if you measure one foot on the map it equals 50,000 feet on the ground. You can find distance on the bar scale at the bottom of a topographic map. Marked points of precisely measured elevation, called benchmarks, are shown on topographic maps as “BM,” followed by the elevation in feet.
Contour reviewA contour line is defined as a line of equal elevation on the map. If you were to walk on a contour line painted on the ground around the side of a hill you would neither go up nor down, but remain level throughout. The difference between contours, known as the contour interval, is selected by the mapmaker. For any given topographic map, the contour interval remains the same. On topographic maps, every fifth contour line, regardless of map scale, is shown in bold, and has an elevation value of even hundreds. See more information about contour lines in the activity Play-Dough Topo.
This activity is divided into two parts; both enable students to analyze topographic maps. In “Visualizing Topography,” students work in small groups at a computer to examine and compare a topographic map with corresponding photographs of landforms at Mount Rainier National Park. An arrow on each topographic map indicates the direction from which the photograph was taken. This activity helps students to visualize what is represented on a topographic map and to recognize the value of map scale. The second part, “Topo Map Scavenger Hunt,” provides a series of questions about the topographic map that students will answer in groups. The questions point out some features common to all topographic maps. Students will also examine map scale and map symbols using some simple math questions. Understanding how to read maps will then help students prepare for planning their trip to the park.
3
Topographic Maps and Mount Rainier-continued . . .
ProcedureVisualizing Topography
Students view “Visualizing Topography Show” at computers. They compare photographs of real landform features with map features. As an alternative, display “Visualizing Topography Show” for the entire class on a computer projection system.
1. Decide whether to conduct the activity as a class, with the display of “Visualizing Topography Show” on a computer projector, or whether you will divide class into small student groups and have them work at computers. In either case, distribute paper copies of the “Visualizing Topography” student page. Photos and maps should be viewed on a computer screen or classroom projection system.
2. Review topographic map concepts with students, such as how three dimensions are represented in two dimensions through the use of contour lines, and the definition of a contour interval.
3. Explain that each photograph from the topographic map corresponds to a real location on or near Mount Rainier. Each topographic map contains an arrow, which represents the photographer’s location and the tip pointing in the direction the photo was taken.
4. Students should look at both pictures and then answer the questions on the “Visualizing Topography” student page.
4
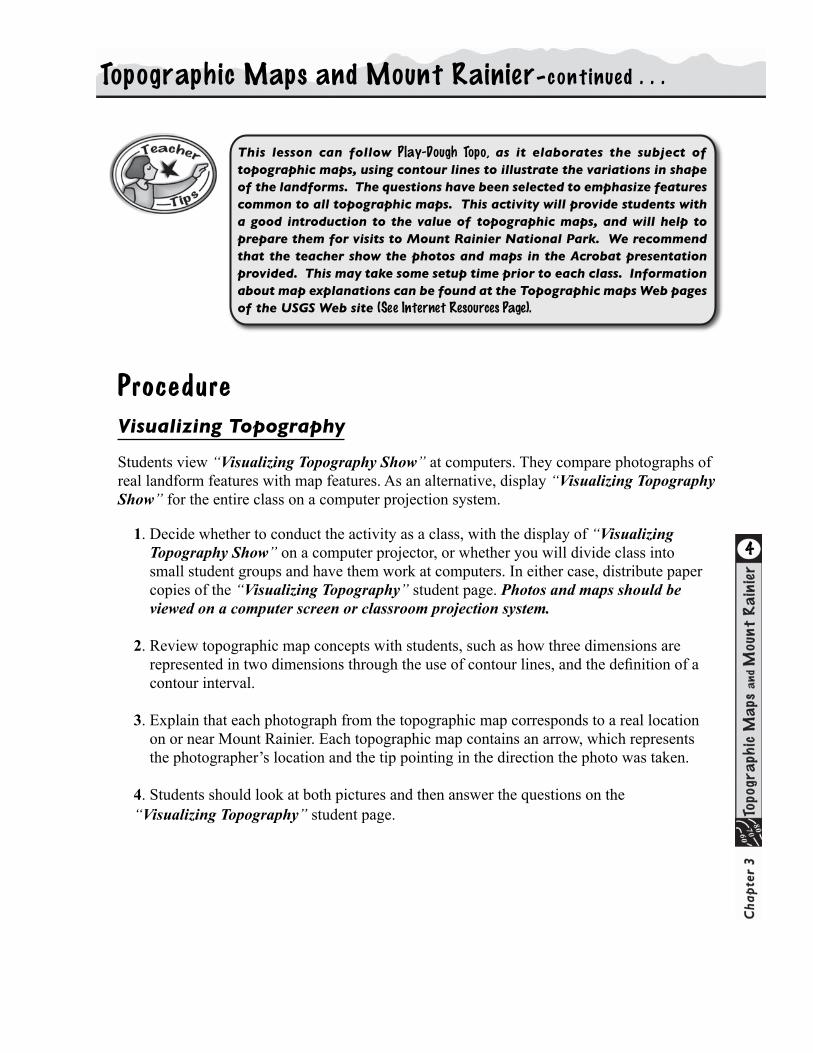
This lesson can follow Play-Dough Topo, as it elaborates the subject of topographic maps, using contour lines to illustrate the variations in shape of the landforms. The questions have been selected to emphasize features common to all topographic maps. This activity will provide students with a good introduction to the value of topographic maps, and will help to prepare them for visits to Mount Rainier National Park. We recommend that the teacher show the photos and maps in the Acrobat presentation provided. This may take some setup time prior to each class. Information about map explanations can be found at the Topographic maps Web pages of the USGS Web site (See Internet Resources Page).
Topographic Maps and Mount Rainier-continued . . .
Topo Map Scavenger Hunt
Introduce students to a topographic map of Mount Rainier with the use of a paper copy of the map entitled “Mt. Rainier National Park, Wash.” map and the student page “Topo Map Scavenger Hunt.”
1. Regroup students (if necessary) into groups of three or four and give each group a map, “Topographic Map Symbols” and student page entitled “Topo Map Scavenger Hunt.” Distribute string or ruler for use in comparing distances on the map and scale bar.
2. Each student group can work at its own pace, or the activity can be conducted as a true scavenger hunt where the first group with all the correct answers wins. The only problem with the latter scenario is that groups thinking ahead will subdivide the tasks, so everyone will not complete every task.
Hint: Your maps will last for years if you laminate and roll them instead of folding them.
Adaptations
◆ For “Topo Map Scavenger Hunt,” adjust number of questions assigned, based on student needs.
Extensions
◆ Conduct a Mount Rainier field trip. Instruct students to take photographs and find or mark their locations on the topographic map.
◆ Students find or are given topographic maps of other areas that show different kinds of landforms such as plains, broad river valleys, the topography of your community, and then answer questions assigned by the teacher.
◆ Instruct students to make a cross section or profile of a landscape feature from a topographic map.
Assessement Use questions on the “Topo Map Scavenger Hunt” student pages to assess students’ ability to apply the concept of contours to an actual map-reading activity. Look for their grasp of map purpose and of how contours represent real landforms. Note how students’ understanding of map reading has progressed from part 1 to part 2. Instruct students to make a cross section or profile or a landscape feature from a topographic map.
5
Topographic Maps and Mount Rainier-continued . . .
ReferencesNational Geographic Society, 2003, Trails Illustrated―Mount Rainier National Park, Washington: National Geographical Society, Washington D.C., scale 1:55,000 and 1:27,500, 26 x 38 in., two sides, one plate.
National Geographic, Topo! state series―Washington CD-ROMS: National Geographic Society, Washington D.C., set of 7 CD-ROMS, PC format only.
Northwest Interpretive Association, 1999, Mount Rainier National Park—centennial edition map: Northwest Interpretive Association, Seattle, Wash., scale 1:30,000, 56 x 40 in., one plate.
U.S. Geological Survey, 1971, Mt. Rainier National Park, Wash.,: U.S. Geological Survey, scale 1:50,000, one plate.
ResourcesMaps and publications can be obtained at park stores and via the Internet from the Northwest Interpretive Association, National Geographic, and the U.S. Geological Survey.
Photo CreditsAll slide show photographs by Mike Roylance, National Park Service.
6
Refer to Internet Resources Page for a list of resources available as a supplement to this activity.
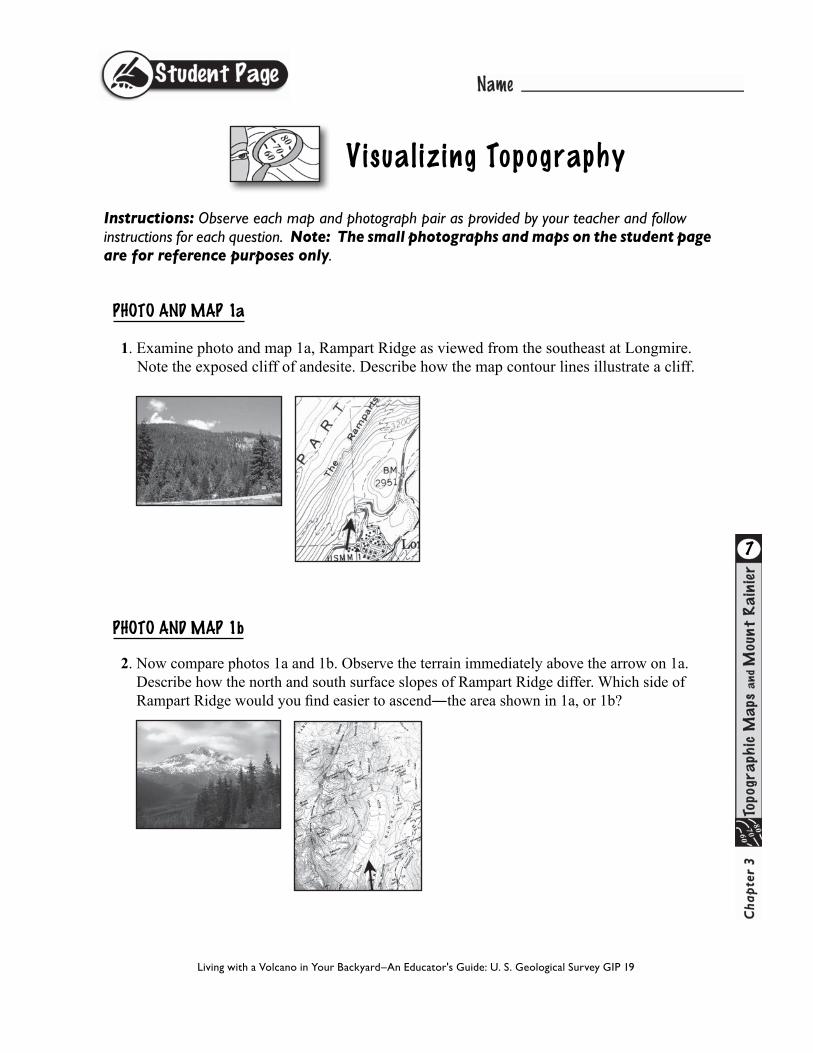
Instructions: Observe each map and photograph pair as provided by your teacher and follow instructions for each question. Note: The small photographs and maps on the student page are for reference purposes only.
PHOTO AND MAP 1a
1. Examine photo and map 1a, Rampart Ridge as viewed from the southeast at Longmire. Note the exposed cliff of andesite. Describe how the map contour lines illustrate a cliff.
PHOTO AND MAP 1b
2. Now compare photos 1a and 1b. Observe the terrain immediately above the arrow on 1a. Describe how the north and south surface slopes of Rampart Ridge differ. Which side of Rampart Ridge would you find easier to ascend―the area shown in 1a, or 1b?
Living with a Volcano in Your Backyard–An Educator's Guide: U. S. Geological Survey GIP 19
7
Visual iz ing Topography
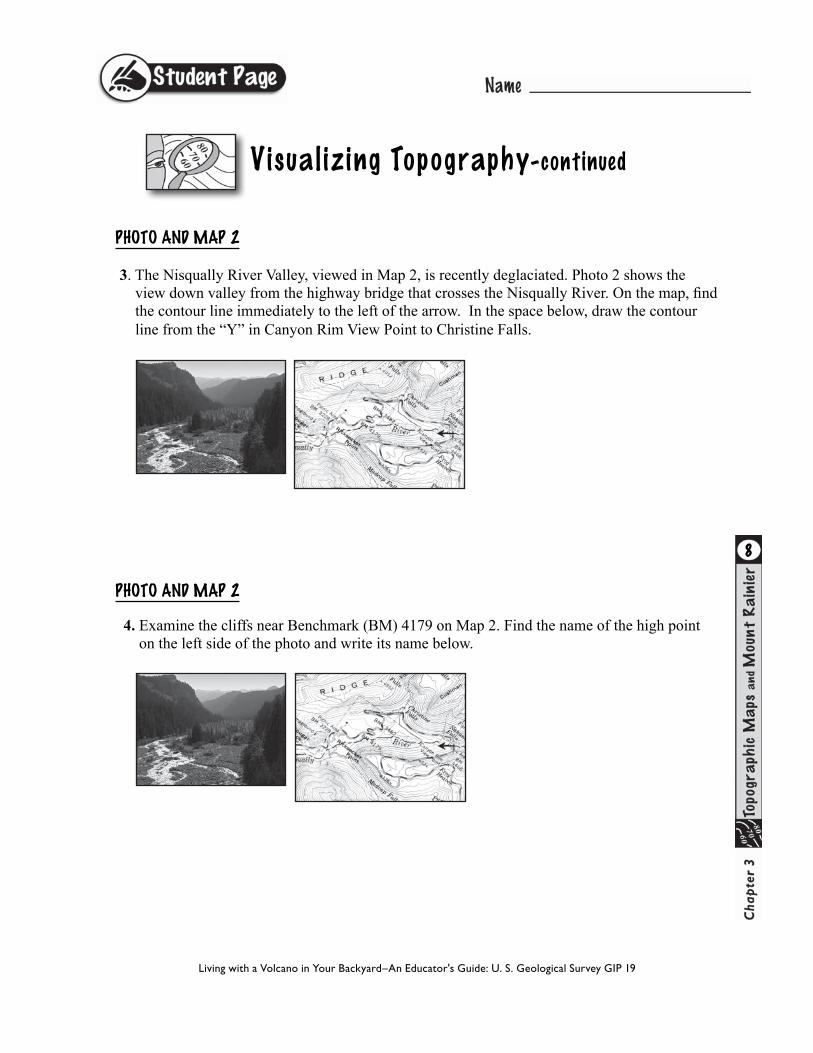
PHOTO AND MAP 2
3. The Nisqually River Valley, viewed in Map 2, is recently deglaciated. Photo 2 shows the view down valley from the highway bridge that crosses the Nisqually River. On the map, find the contour line immediately to the left of the arrow. In the space below, draw the contour line from the “Y” in Canyon Rim View Point to Christine Falls.
PHOTO AND MAP 2
4. Examine the cliffs near Benchmark (BM) 4179 on Map 2. Find the name of the high point on the left side of the photo and write its name below.
8
Living with a Volcano in Your Backyard–An Educator's Guide: U. S. Geological Survey GIP 19
Visual iz ing Topography-continued
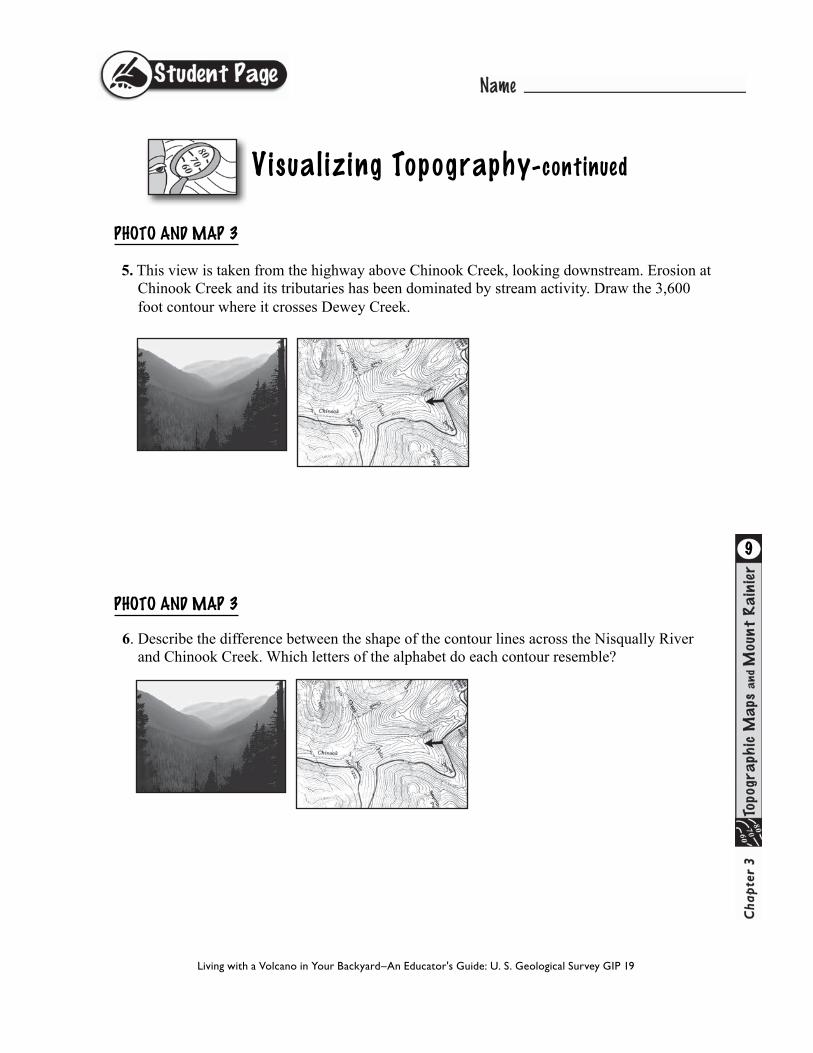
PHOTO AND MAP 3
5. This view is taken from the highway above Chinook Creek, looking downstream. Erosion at Chinook Creek and its tributaries has been dominated by stream activity. Draw the 3,600 foot contour where it crosses Dewey Creek.
PHOTO AND MAP 3
6. Describe the difference between the shape of the contour lines across the Nisqually River and Chinook Creek. Which letters of the alphabet do each contour resemble?
9
Living with a Volcano in Your Backyard–An Educator's Guide: U. S. Geological Survey GIP 19
Visual iz ing Topography-continued
Visual iz ing Topography-continued
PHOTO AND MAP 2 AND 3
7. Examine and compare Photos 2 and 3. Make some additional observations about the size and shape of the streambeds. How are the differences represented on the corresponding maps?
PHOTO AND MAP 4
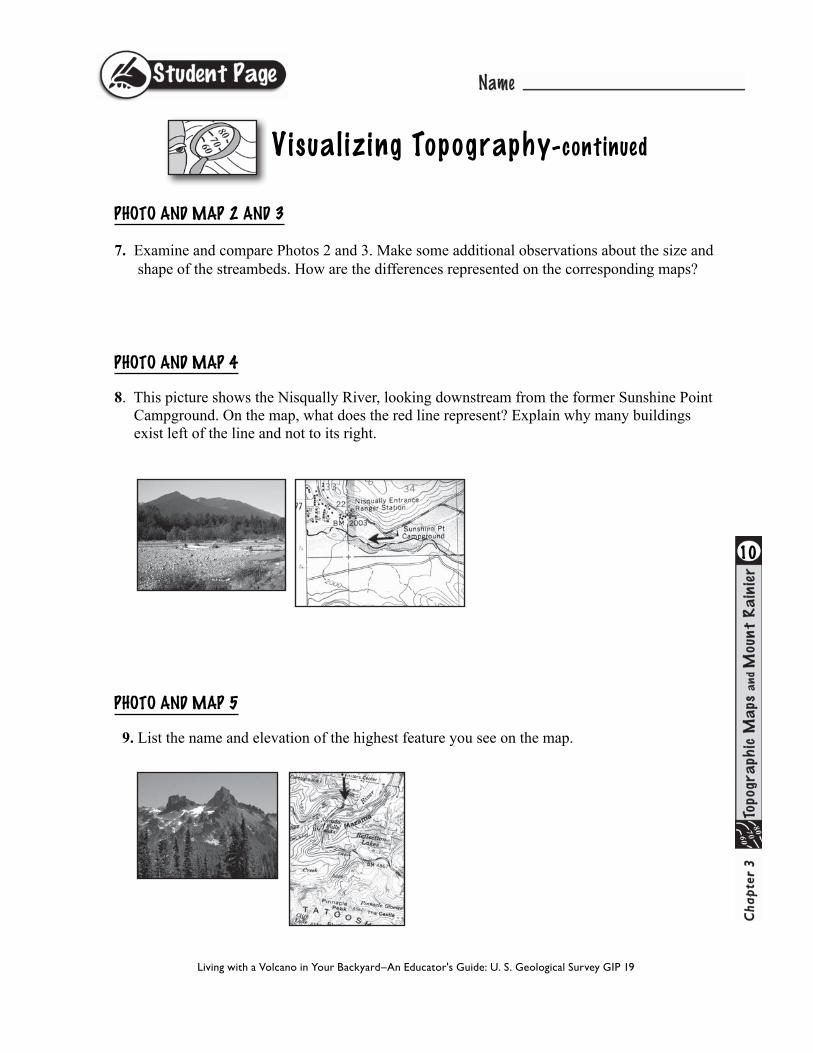
8. This picture shows the Nisqually River, looking downstream from the former Sunshine Point Campground. On the map, what does the red line represent? Explain why many buildings exist left of the line and not to its right.
PHOTO AND MAP 5
9. List the name and elevation of the highest feature you see on the map.
10
Living with a Volcano in Your Backyard–An Educator's Guide: U. S. Geological Survey GIP 19
Visual iz ing Topography-continued
PHOTO AND MAP 6
10. What hydrologic (water) feature exists between Pinnacle Peak and The Castle? Explain how Pinnacle Peak might have influenced formation of this feature.
PHOTO AND MAP 6
11. On the photo, examine the cliffs below Unicorn Peak. Describe what additional information the map provides that might help you climb Unicorn Peak easily and safely.
PHOTO AND MAP 7
12. Examine map 7 that shows Nisqually Glacier. Now examine photo 7. Name one difference between your perceptions of Nisqually Glacier when viewed on the photo and the map.
11
Living with a Volcano in Your Backyard–An Educator's Guide: U. S. Geological Survey GIP 19
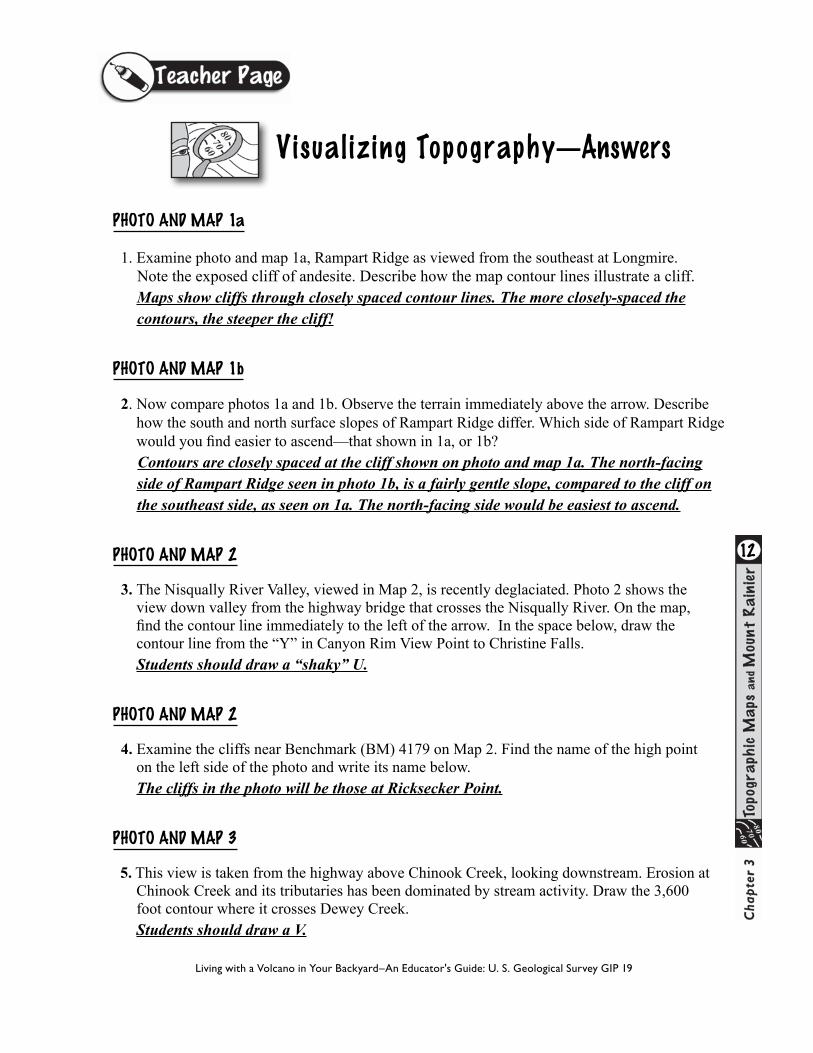
PHOTO AND MAP 1a
1. Examine photo and map 1a, Rampart Ridge as viewed from the southeast at Longmire. Note the exposed cliff of andesite. Describe how the map contour lines illustrate a cliff. Maps show cliffs through closely spaced contour lines. The more closely-spaced the contours, the steeper the cliff!
PHOTO AND MAP 1b
2. Now compare photos 1a and 1b. Observe the terrain immediately above the arrow. Describe how the south and north surface slopes of Rampart Ridge differ. Which side of Rampart Ridge would you find easier to ascend—that shown in 1a, or 1b? Contours are closely spaced at the cliff shown on photo and map 1a. The north-facing side of Rampart Ridge seen in photo 1b, is a fairly gentle slope, compared to the cliff on the southeast side, as seen on 1a. The north-facing side would be easiest to ascend.
PHOTO AND MAP 2
3. The Nisqually River Valley, viewed in Map 2, is recently deglaciated. Photo 2 shows the view down valley from the highway bridge that crosses the Nisqually River. On the map, find the contour line immediately to the left of the arrow. In the space below, draw the contour line from the “Y” in Canyon Rim View Point to Christine Falls. Students should draw a “shaky” U.
PHOTO AND MAP 2
4. Examine the cliffs near Benchmark (BM) 4179 on Map 2. Find the name of the high point on the left side of the photo and write its name below. The cliffs in the photo will be those at Ricksecker Point.
PHOTO AND MAP 3
5. This view is taken from the highway above Chinook Creek, looking downstream. Erosion at Chinook Creek and its tributaries has been dominated by stream activity. Draw the 3,600 foot contour where it crosses Dewey Creek. Students should draw a V.
Visual iz ing Topography—Answers
12
Living with a Volcano in Your Backyard–An Educator's Guide: U. S. Geological Survey GIP 19
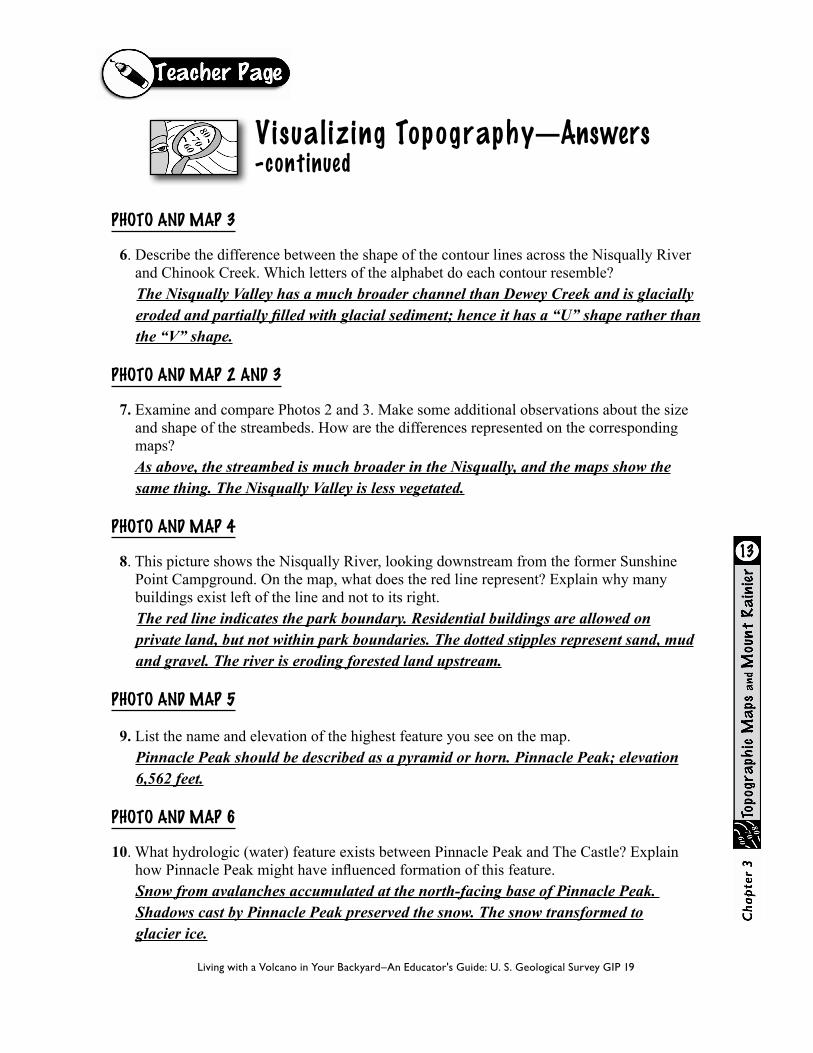
PHOTO AND MAP 3
6. Describe the difference between the shape of the contour lines across the Nisqually River and Chinook Creek. Which letters of the alphabet do each contour resemble? The Nisqually Valley has a much broader channel than Dewey Creek and is glacially eroded and partially filled with glacial sediment; hence it has a “U” shape rather than the “V” shape.
PHOTO AND MAP 2 AND 3
7. Examine and compare Photos 2 and 3. Make some additional observations about the size and shape of the streambeds. How are the differences represented on the corresponding maps? As above, the streambed is much broader in the Nisqually, and the maps show the same thing. The Nisqually Valley is less vegetated.
PHOTO AND MAP 4
8. This picture shows the Nisqually River, looking downstream from the former Sunshine Point Campground. On the map, what does the red line represent? Explain why many buildings exist left of the line and not to its right. The red line indicates the park boundary. Residential buildings are allowed on private land, but not within park boundaries. The dotted stipples represent sand, mud and gravel. The river is eroding forested land upstream.
PHOTO AND MAP 5
9. List the name and elevation of the highest feature you see on the map. Pinnacle Peak should be described as a pyramid or horn. Pinnacle Peak; elevation 6,562 feet.
PHOTO AND MAP 6
10. What hydrologic (water) feature exists between Pinnacle Peak and The Castle? Explain how Pinnacle Peak might have influenced formation of this feature. Snow from avalanches accumulated at the north-facing base of Pinnacle Peak. Shadows cast by Pinnacle Peak preserved the snow. The snow transformed to glacier ice.
13
Living with a Volcano in Your Backyard–An Educator's Guide: U. S. Geological Survey GIP 19
Visual iz ing Topography—Answers-continued
PHOTO AND MAP 6
11. On the photo, examine the cliffs below Unicorn Peak. Describe what additional information the map provides that might help you climb Unicorn Peak easily and safely. The cliffs in view on the north side are too steep to climb. Slopes on the south side are less steep.
PHOTO AND MAP 7
12. Examine Map 7 that shows Nisqually Glacier. Now examine Photo 7. Name one difference between your perceptions of Nisqually Glacier when viewed on the photo and the map. The area covered by Nisqually Glacier’s surface is difficult to ascertain in the photo because the glacier is in large part rock covered. The glacier is shown in blue and within dashed lines on map. The glacier’s debris cover is shown as stippled dots.
14
Living with a Volcano in Your Backyard–An Educator's Guide: U. S. Geological Survey GIP 19
Visual iz ing Topography—Answers-continued
Instructions: Using the map provided by your teacher, answer the questions below as completely as you can. If math is involved, be sure to show your work. Credit will not be given for just the answer!
1. Record the name, date and agency that made this map.
2. Record the map scale. Explain the meaning of map scale.
3. Record the contour interval of the map as noted in the map explanation.
4. The contour interval on a map can also be calculated by looking at the elevation numbers on the contour line. Do this by taking any two adjacent bold contour lines and finding the elevation numbers on each. Subtract the elevation numbers to find the difference and divide by the number of intervals (spaces) you would have to cross to go from one bold contour to the other (remember the last bold line that you will have to cross). Show your work.
5. Look at the edges of the map. You will notice that the contour lines end there. Does the landscape actually end at the edge of the map? Explain your answer.
6. Describe the appearance of map contour lines at a stream valley and a glacial valley.
Topo Map Scavenger Hunt
15
Living with a Volcano in Your Backyard–An Educator's Guide: U. S. Geological Survey GIP 19
7. Describe what the green represents on the map.
8. In the southern part of the map you will note about a dozen white angular shapes. Roads join these areas. Explain what these white angular areas represent.
9. How many kilometers (miles) would you drive from the Nisqually Entrance to Box Canyon? At the average park speed of 50 kilometers per hour (35 miles per hour), how long would it take you to travel this distance?
10. Explain why the glaciers are shown in blue. Do these contours remain the same from year to year? Explain your answer.
11. Explain the meaning of the term “BM 5,557” on the map.
12. Find the name of the highest mountain in the Tatoosh Range and record its elevation.
13. Describe how the mapmaker represents the boundary of Mount Rainier National Park.
14. What is the color of water features on the map?
Topo Map Scavenger Hunt-continued
16
Living with a Volcano in Your Backyard–An Educator's Guide: U. S. Geological Survey GIP 19
15. The map displays numbered red squares. How big is each square?
16. Which glacier has the greatest length? What is its length?
17. Measure the round trip distance and vertical elevation gain of your hike to Pinnacle Peak. Assuming that a steep climb such as this would take you an average of 45 minutes per 1.6 kilometer (1 mile), what would be the duration of your hike?
Topo Map Scavenger Hunt-continued
17
Living with a Volcano in Your Backyard–An Educator's Guide: U. S. Geological Survey GIP 19
1. Record the name, date, and agency that made the map. Mt. Rainier National Park, Wash.; 1971; U.S. Department of Interior, U.S. Geological Survey (USGS).
2. Record the map scale. Explain the meaning of map scale. (1:50,000); one inch (or centimeter, etc) on the map equals 50,000 inches (or centimeters) on the ground.
3. Record the contour interval of the map as noted in the map explanation. Students should draw a “shaky” U.
4. The contour interval on a map can also be calculated by looking at the elevation numbers on the contour line. Do this by taking any two adjacent bold contour lines and finding the elevation numbers on each. Subtract the elevation numbers to find the difference and divide by the number of intervals (spaces) you would have to cross to go from one bold contour to the other (remember the last bold line that you will have to cross). Show your work below. Example: 4000-3600 = 400 There are 5 intervals to cross, so 400/5 = 80
5. Look at the edges of the map. You will notice that the contour lines end there. Do they really just stop there? Why or why not? No, they continue at that elevation on features shown on the adjacent map.
6. Describe the appearance of map contour lines at a stream valley and a glacial valley. Contours in a stream valley are V-shaped at the valley bottom; contours in a glacial valley display a flattened U-shape.
7. Describe what the green represents on the map. Vegetation
8. In the southern part of the map you will note about a dozen white angular shapes. Roads join these areas. Explain what these white angular areas represent. These are areas that were clear cut at the time the map was made, therefore they do not have the normal vegetation pattern.
Topo Map Scavenger Hunt—Answers
18
Living with a Volcano in Your Backyard–An Educator's Guide: U. S. Geological Survey GIP 19
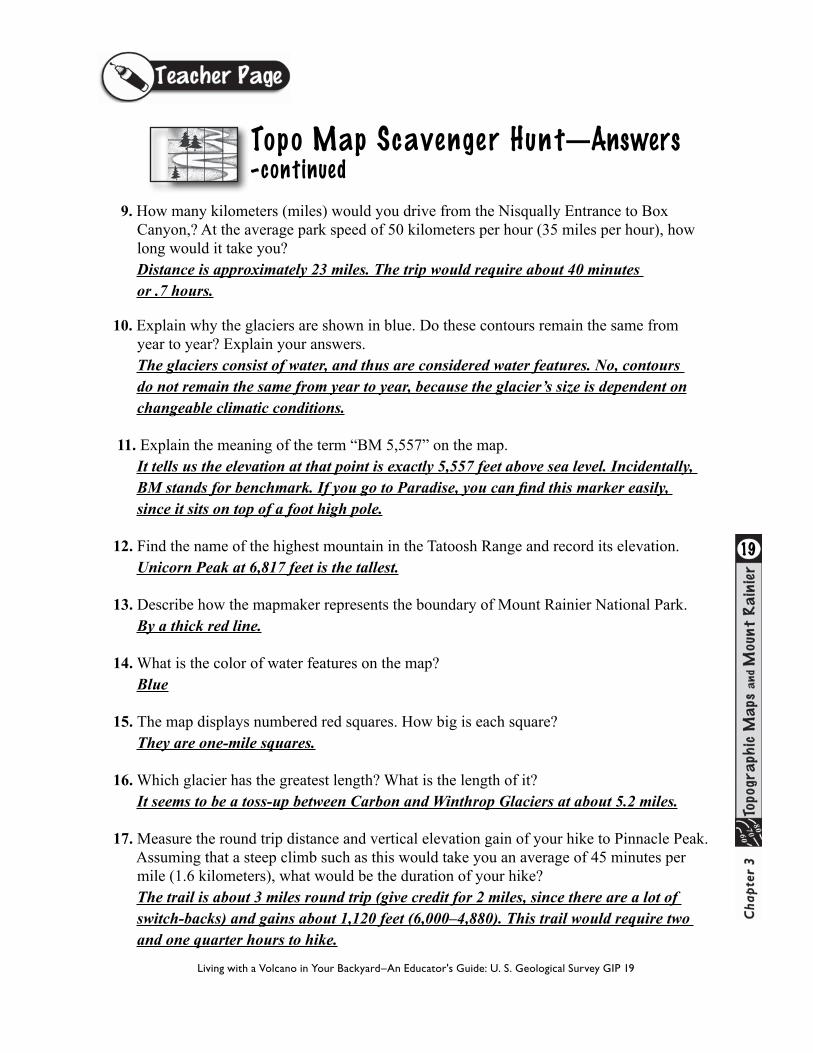
9. How many kilometers (miles) would you drive from the Nisqually Entrance to Box Canyon,? At the average park speed of 50 kilometers per hour (35 miles per hour), how long would it take you? Distance is approximately 23 miles. The trip would require about 40 minutes or .7 hours.
10. Explain why the glaciers are shown in blue. Do these contours remain the same from year to year? Explain your answers. The glaciers consist of water, and thus are considered water features. No, contours do not remain the same from year to year, because the glacier’s size is dependent on changeable climatic conditions.
11. Explain the meaning of the term “BM 5,557” on the map. It tells us the elevation at that point is exactly 5,557 feet above sea level. Incidentally, BM stands for benchmark. If you go to Paradise, you can find this marker easily, since it sits on top of a foot high pole.
12. Find the name of the highest mountain in the Tatoosh Range and record its elevation. Unicorn Peak at 6,817 feet is the tallest.
13. Describe how the mapmaker represents the boundary of Mount Rainier National Park. By a thick red line.
14. What is the color of water features on the map? Blue
15. The map displays numbered red squares. How big is each square? They are one-mile squares.
16. Which glacier has the greatest length? What is the length of it? It seems to be a toss-up between Carbon and Winthrop Glaciers at about 5.2 miles.
17. Measure the round trip distance and vertical elevation gain of your hike to Pinnacle Peak. Assuming that a steep climb such as this would take you an average of 45 minutes per mile (1.6 kilometers), what would be the duration of your hike? The trail is about 3 miles round trip (give credit for 2 miles, since there are a lot of switch-backs) and gains about 1,120 feet (6,000–4,880). This trail would require two and one quarter hours to hike.
19
Living with a Volcano in Your Backyard–An Educator's Guide: U. S. Geological Survey GIP 19
Topo Map Scavenger Hunt—Answers-continued
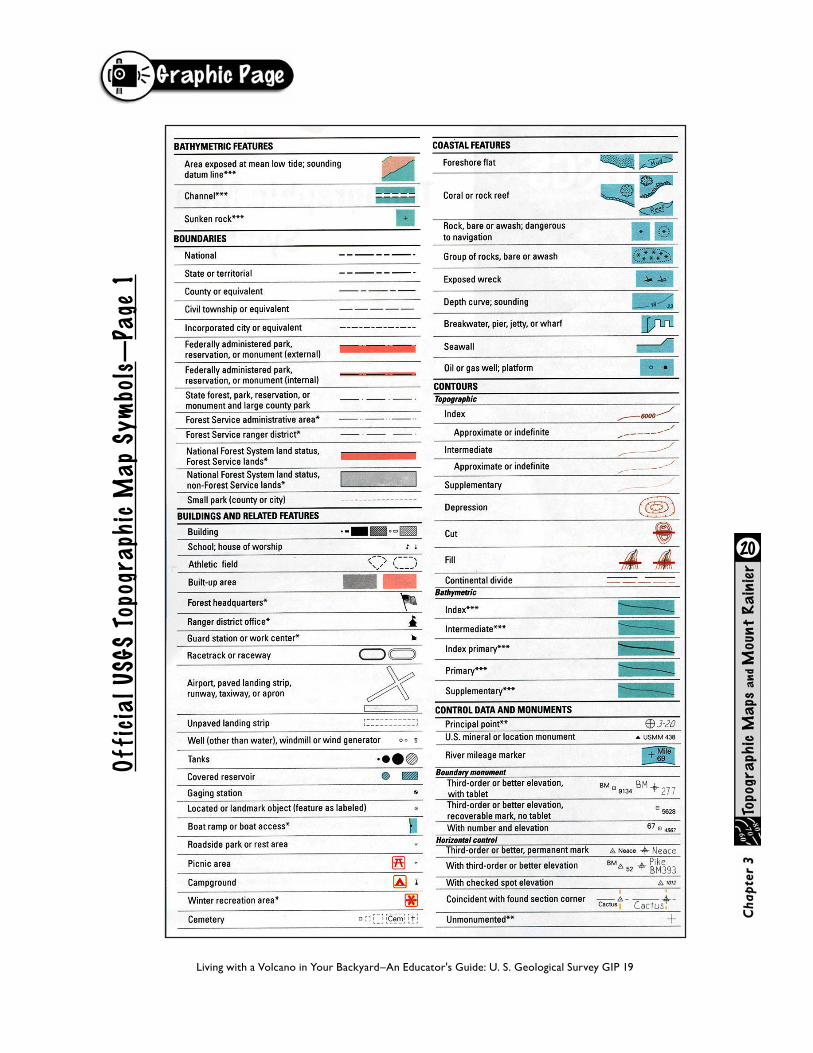
Off
icia
l U
SGS
Topo
gra
phic
Ma
p Sy
mbo
ls—
Page
1
20
Living with a Volcano in Your Backyard–An Educator's Guide: U. S. Geological Survey GIP 19
21
Living with a Volcano in Your Backyard–An Educator's Guide: U. S. Geological Survey GIP 19
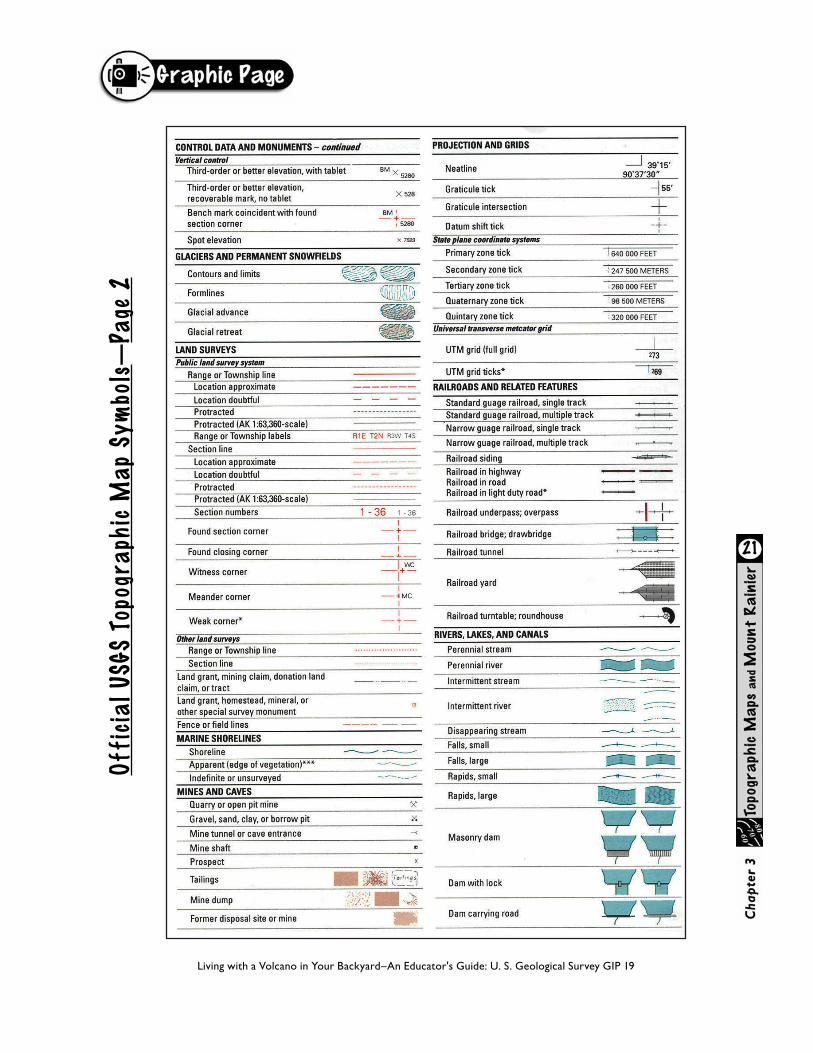
Off
icia
l U
SGS
Topo
gra
phic
Ma
p Sy
mbo
ls—
Page
2
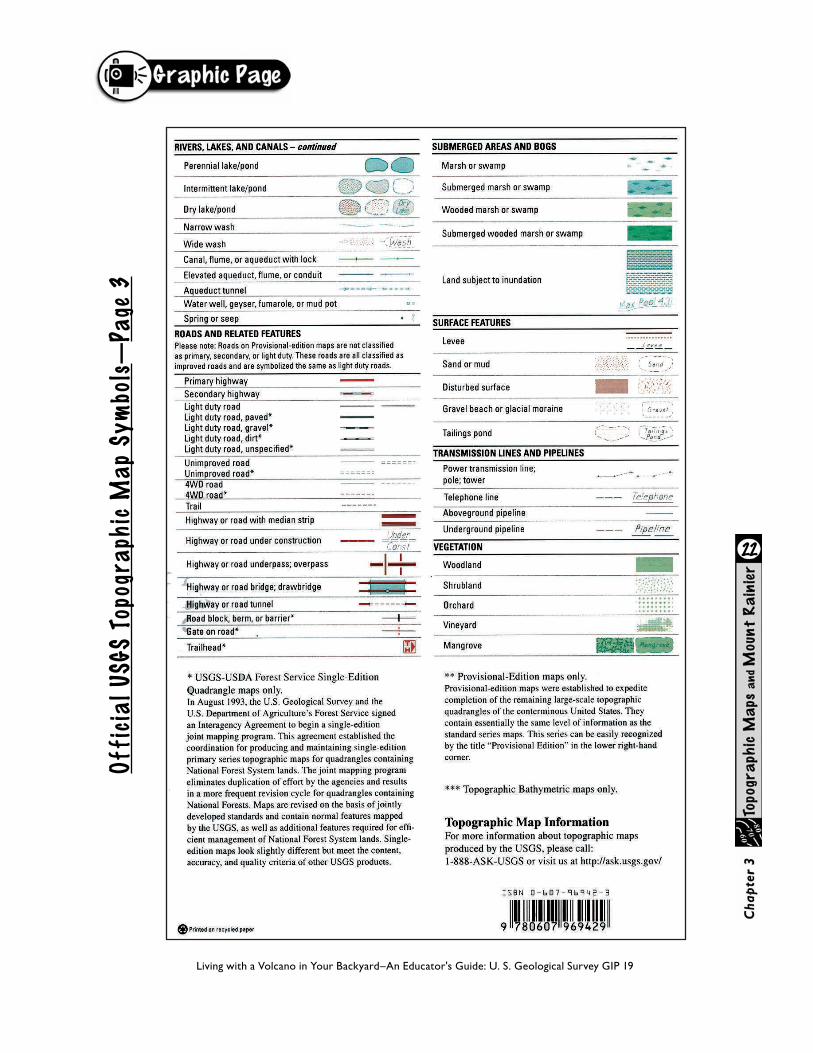
Off
icia
l U
SGS
Topo
gra
phic
Ma
p Sy
mbo
ls—
Page
3
22
Living with a Volcano in Your Backyard–An Educator's Guide: U. S. Geological Survey GIP 19


![Mount rainier[1]](https://img.pdfslide.us/doc/110x75/58efda9c1a28abf0748b46c3/mount-rainier1.jpg)