Embed Size (px)
Citation preview
AMEC Environment & Infrastructure, a division of AMEC Americas Limited Suite 600 - 4445 Lougheed Highway, Burnaby, BC Canada V5C 0E4 Tel +1 (604) 294-3811 Fax +1 (604) 294-4664 www.amec.com
MOUNT POLLEY MINE Tailings Storage Facility
2011 Construction
As-Built Report and Annual Review
Submitted to:
Mount Polley Mining Corporation, Likely, BC
Submitted by:
AMEC Environment & Infrastructure, a division of AMEC Americas Limited
Burnaby, BC
30 March 2012
VM00560A.A.1

IMPORTANT NOTICE This report was prepared exclusively for Mount Polley Mining Corporation by AMEC Environment & Infrastructure, a wholly owned subsidiary of AMEC Americas Limited. The quality of information, conclusions and estimates contained herein is consistent with the level of effort involved in AMEC services and based on: i) information available at the time of preparation, ii) data supplied by outside sources, and iii) the assumptions, conditions and qualifications set forth in this report. This report is intended to be used by Mount Polley Mining Corporation only, subject to the terms and conditions of its contract with AMEC. Any other use of, or reliance on, this report by any third party is at that party’s sole risk.
Mount Polley Mining Corporation Tailings Storage Facility 2011 Construction As-Built and Annual Review 30 March 2012
VM00560A.A.1 Page i \\bby-fs1\bby-ee-min\PROJECTS\VM00560A - Mt Polley 2012 Eng Services\Task 1 - Engineering Services (Office)\Task 1.1 - 2011 As-built Annual Review Report\VM00560 - 2011 As-built Annual review report_FINAL_30Mar2012.docx
TABLE OF CONTENTS Page
SUMMARY ................................................................................................................................. 1
1.0 INTRODUCTION ................................................................................................................ 5
2.0 OPERATION OF THE TAILINGS STORAGE FACILITY ................................................... 72.1 General ...................................................................................................................... 72.2 Tailings Discharge and Beach Management .............................................................. 72.3 Process Water Reclaim ............................................................................................. 82.4 Operations, Maintenance and Surveillance Manual ................................................... 82.5 Freeboard Requirements ........................................................................................... 82.6 Seepage Collection Ponds ......................................................................................... 82.7 Drain Flow Data ......................................................................................................... 8
3.0 2011 DAM DESIGN ......................................................................................................... 10
4.0 CONSTRUCTION MONITORING PROGRAM ................................................................. 114.1 AMEC Support Engineer .......................................................................................... 114.2 AMEC Senior Support ............................................................................................. 124.3 MPMC Field Inspector ............................................................................................. 124.4 QA/QC Testing ........................................................................................................ 124.5 Instrumentation Monitoring ...................................................................................... 13
5.0 2011 TSF STAGE 7 EMBANKMENT RAISE CONSTRUCTION OVERVIEW .................. 135.1 General .................................................................................................................... 135.2 Abutment Preparation .............................................................................................. 135.3 Fill Placement .......................................................................................................... 14
5.3.1 Zone U – Upstream Shell ............................................................................. 145.3.2 Zone S – Till Core ........................................................................................ 145.3.3 Zone F – NAG Filter Rock ............................................................................ 145.3.4 Zone T – Transition NAG Rock .................................................................... 155.3.5 Zone C – Downstream Shell NAG Rock ....................................................... 15
5.4 Survey Control ......................................................................................................... 155.5 Quality Control and Quality Assurance Testing ........................................................ 16
5.5.1 Zone S – Till Core ........................................................................................ 165.5.2 Zone F – NAG Filter Rock ............................................................................ 175.5.3 Zone T – Transition Zone ............................................................................. 175.5.4 Zone C – Downstream Shell NAG Rock ....................................................... 17
5.6 Conformance of 2011 Construction with Design Intent ............................................ 17
6.0 INSTRUMENTATION MONITORING ............................................................................... 176.1 General .................................................................................................................... 176.2 New Instrumentation ................................................................................................ 186.3 Piezometers ............................................................................................................. 186.4 Slope Inclinometers ................................................................................................. 18
7.0 WATER MANAGEMENT AND IMPOUNDMENT RAISING SCHEDULE ......................... 197.1 General .................................................................................................................... 197.2 Site Water Management .......................................................................................... 197.3 Mass Balance .......................................................................................................... 20

Mount Polley Mining Corporation Tailings Storage Facility 2011 Construction As-Built and Annual Review 30 March 2012
VM00560A.A.1 Page ii \\bby-fs1\bby-ee-min\PROJECTS\VM00560A - Mt Polley 2012 Eng Services\Task 1 - Engineering Services (Office)\Task 1.1 - 2011 As-built Annual Review Report\VM00560 - 2011 As-built Annual review report_FINAL_30Mar2012.docx
TABLE OF CONTENTS Page
7.4 Overview of Mass Balance Model ............................................................................ 207.5 Dam Raising Schedule ............................................................................................ 217.6 Mine Planning .......................................................................................................... 21
8.0 CONCLUSIONS AND RECOMMENDATIONS ................................................................ 24
9.0 REPORT CLOSURE ........................................................................................................ 25
REFERENCES ......................................................................................................................... 26
LIST OF TABLES
Table 1.1: CDA (2007) Consequence Classification Scheme ......................................... 2Table 1.2: Piezometer Summary .................................................................................... 3Table 1.3: Slope Inclinometer Summary ........................................................................ 3Table 4.1: Embankment Material Types and QA/QC Testing Requirements .................12Table 5.1: TSF Summary of Material Quantities and Laboratory testing ........................16
LIST OF FIGURES
Figure 1.1: Aerial View of Mine Site: 2011 ....................................................................... 6Figure 2.1: Tailings Discharge Plan ................................................................................. 7Figure 2.2: South and Perimeter Toe Drain Flow Readings – 2011 ................................. 9Figure 7.1: Water Transfer .............................................................................................19Figure 7.2: Site Water Management Schematic .............................................................22Figure 7.3: Impoundment Storage Elevation Curve ........................................................23
LIST OF DRAWINGS
2011AB.01 Stage 7 Tailings Embankment 2011 As-built General Site Plan 2011AB.02 Stage 7 Tailings Embankment 2011 As-built Plan View 2011AB.03 Tailings Storage Facility Construction: Notes and Specifications 2011AB.04 Stage 7 Main Embankment 2011 As-built Section A (20+60) 2011AB.05 Stage 7 Perimeter Embankment 2011 As-built Section D (39+90) 2011AB.06 Stage 7 South Embankment 2011 As-built Section F (7+20) 2011AB.07 Tailings Storage Facility Instrumentation Plan View 2011AB.08 South Embankment Instrumentation Sections F 7+20 & I 11+00 2011AB.09 Main Embankment Instrumentation Section E 17+60 2011AB.10 Main Embankment Instrumentation Section C 18+50 2011AB.11 Main Embankment Instrumentation Section A 20+00 2011AB.12 Main Embankment Instrumentation Section B 22+40 2011AB.13 Main Embankment Instrumentation Section K 24+60 2011AB.14 Perimeter Embankment Instrumentation Section J 32+80 2011AB.15 Perimeter Embankment Instrumentation Section H 36+00 2011AB.16 Perimeter Embankment Instrumentation Sections D 39+90 & G 44+70

Mount Polley Mining Corporation Tailings Storage Facility 2011 Construction As-Built and Annual Review 30 March 2012
VM00560A.A.1 Page iii \\bby-fs1\bby-ee-min\PROJECTS\VM00560A - Mt Polley 2012 Eng Services\Task 1 - Engineering Services (Office)\Task 1.1 - 2011 As-built Annual Review Report\VM00560 - 2011 As-built Annual review report_FINAL_30Mar2012.docx
TABLE OF CONTENTS Page
LIST OF APPENDICES
APPENDIX A MATERIAL TESTING RESULTS APPENDIX B INSTRUMENTATION PLOTS APPENDIX C 2011 CONSTRUCTION SEASON PHOTOS
Mount Polley Mining Corporation Tailings Storage Facility 2011 Construction As-Built and Annual Review 30 March 2012
VM00560A.A.1 VM00560 - 2011 As-built Annual review report_FINAL_30Mar2012.docx Page 1
SUMMARY
This report presents the annual review of the operation and performance of the Mount Polley Mine Corporation (MPMC) tailings storage facility (TSF) for 2011, together with the as-built report documenting the 2011 construction of the TSF embankment. This report has been prepared in accordance with the requirements of the British Columbia Ministry of Energy and Mines (MEM), including MEM’s updated guidelines for Annual Reports, issued 14 February 2003. The following points give a general summary of the 2011 TSF activities and key developments.
1) Classification of the dam(s) in terms of Consequence of Failure (ref. Canadian Dam Association, Dam Safety Guidelines [2007]).
A formal dam safety review was conducted in 2006 (AMEC 2006). This review assigned a “LOW” hazard classification based on 1999 Canadian Dam Association (CDA 1999) guidelines. CDA updated their Dam Safety Guidelines rating in 2007 (CDA 2007), and under the new classification the TSF is classified under “Significant” category (see Classification System Table 1.1).
2) Change in Engineer of Record for the TSF
The design and construction monitoring of the TSF embankments from mine start up to early 2011 had been completed under the direction of Knight Piésold Limited (KP). AMEC Environment & Infrastructure, a division AMEC Americas Limited (AMEC) assumed the role of Engineer of Record for the TSF embankment as of 28 January 2011.
3) Renumbering of embankment instrumentation
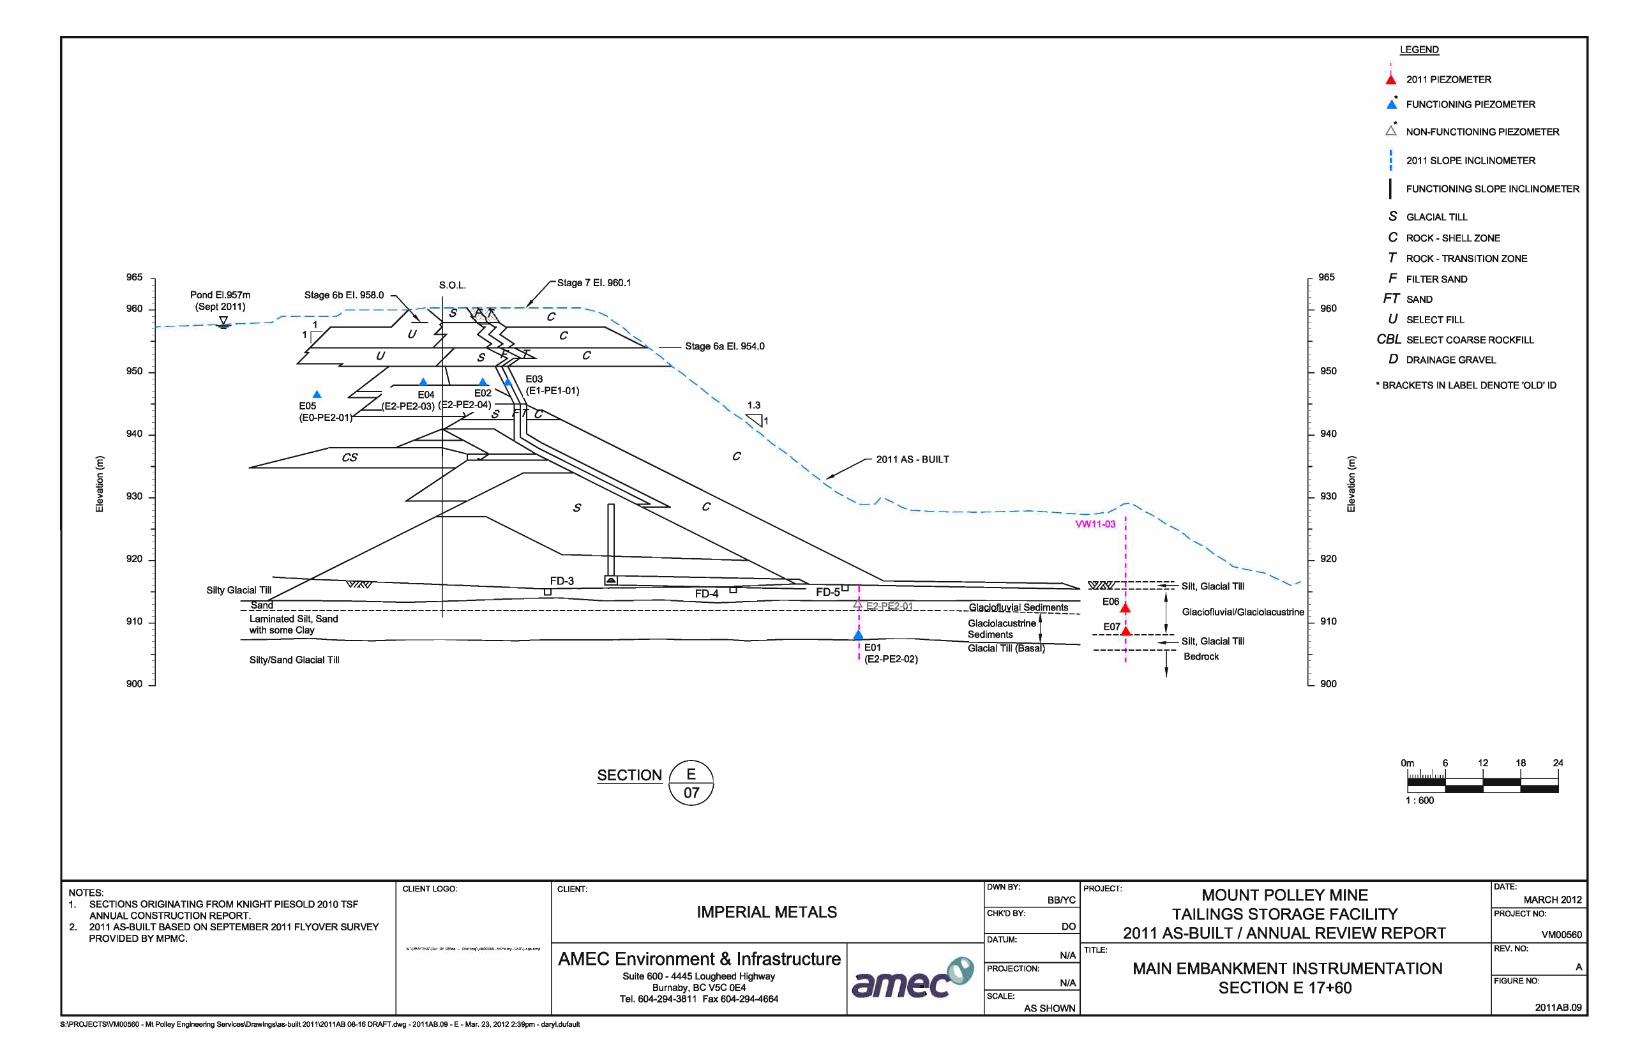
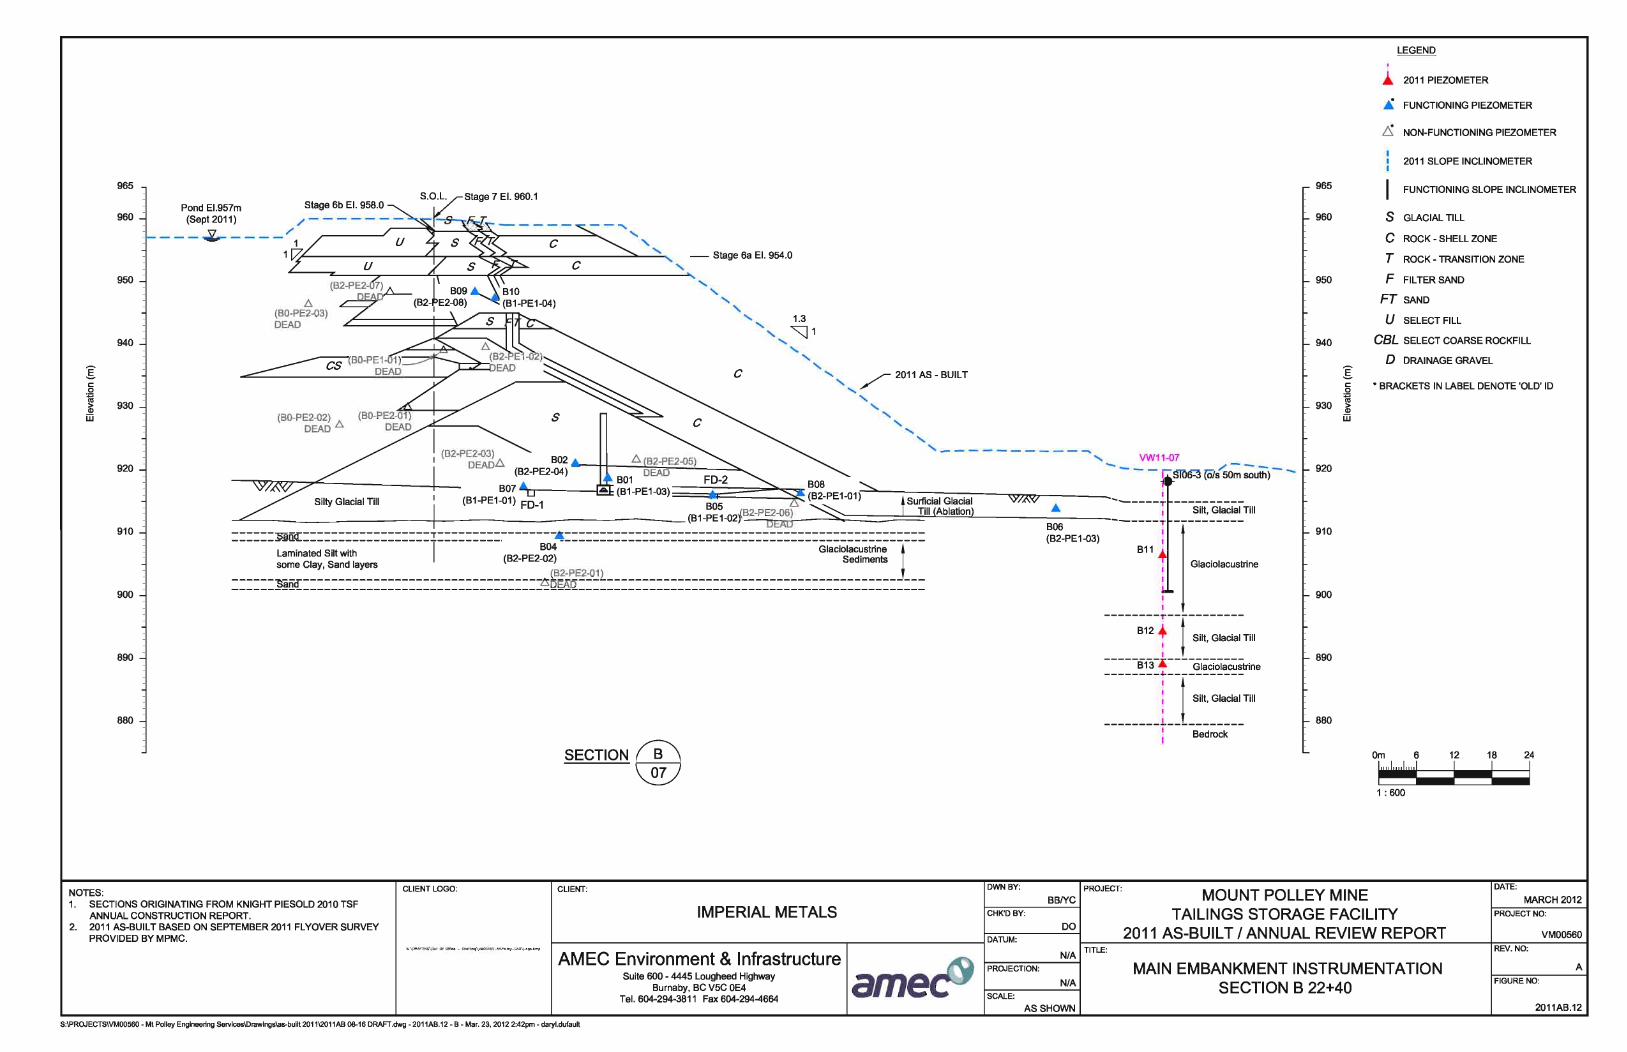
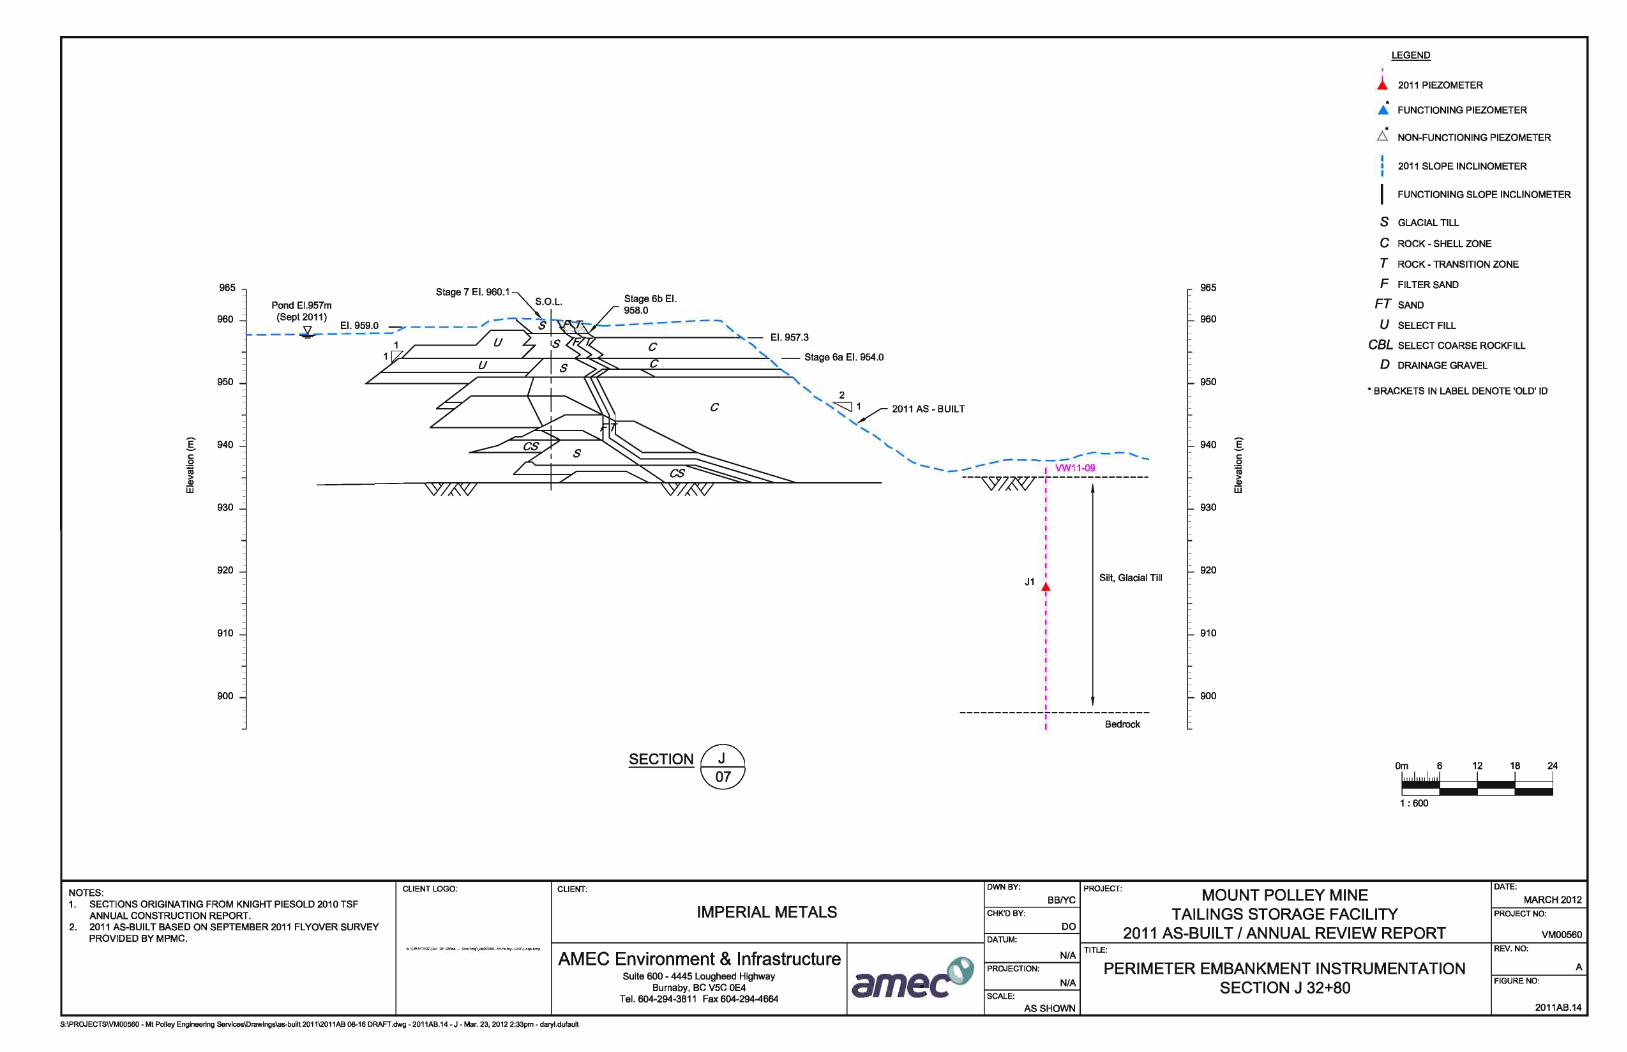
KP provided the historical raw instrumentation data collected from the impoundment instrumentation. The raw data was reprocessed, and working piezometers renamed to simplify data management. The revised naming convention for piezometers is presented on Drawings 2011AB.08 through 2011AB.16. The piezometric data is organized by planes and is presented in Appendix B.
4) Embankment instrumentation summary
In 2011, a site investigation and instrumentation installation program was conducted. During the program additional vibrating wire piezometers and slope inclinometers were installed, Table 1.2 summarizes previously and newly installed vibrating wire (VW) installations.

Mount Polley Mines Corporation Tailings Storage Facility 2011 Construction As-Built and Annual Review 30 March 2012
VM00560A.A.1 VM00560 - 2011 As-built Annual review report_FINAL_30Mar2012.docx Page 2
Table 1.1: CDA (2007) Consequence Classification Scheme
Dam Class Population
at Risk [note 1]
Incremental Losses Loss of Life
[Note 2] Environmental and Cultural Values Infrastructure and Economics
Low None 0 Minimal short-term loss No long-term loss
Low economic losses; area contains limited infrastructure or services
Significant Temporary only Unspecified
No significant loss or deterioration of fish or wildlife habitat Loss of marginal habitat only Restoration or compensation in kind highly possible
Losses to recreational facilities, seasonal workplaces, and infrequently used transportation routes
High Permanent 10 or fewer
Significant loss or deterioration of important fish or wildlife habitat Restoration or compensation in kind highly possible
High economic losses affecting infrastructure, public transportation, and commercial facilities
Very High Permanent 100 or fewer
Significant loss or deterioration of critical fish or wildlife habitat Restoration or compensation in kind possible but impractical
Very high economic losses affecting important infrastructure or services (e.g. highway, industrial facility, storage facilities for dangerous substances)
Extreme Permanent More than 100
Major loss of critical fish or wildlife habitat Restoration or compensation in kind impossible
Extreme losses affecting critical infrastructure or services (e.g. hospital, major industrial complex, major storage facilities for dangerous substances)
Note 1. Definitions for population at risk:
None – There is no identifiable population at risk, so there is no possibility of loss of life other than through unforeseeable misadventure. Temporary – People are only temporarily in the dam-breach inundation zone (e.g. seasonal cottage use, passing through on transportation routes, participating in recreational activities). Permanent – The population at risk is ordinarily located in the dam-breach inundation zone (e.g. as permanent residents); three consequence classes (high, very high, extreme) are proposed to allow for more detailed estimates of potential loss of life (to assist in decision-making if the appropriate analysis is carried out).
Note 2. Implications for loss of life: Unspecified – The appropriate level of safety required at a dam where people are temporarily at risk depends on the number of people, the exposure time, the nature of their activity, and other conditions. A higher class could be appropriate, depending on the requirements. However, the design flood requirement, for example, might not be higher if the temporary population is not likely to be present during the flood season.

Mount Polley Mines Corporation Tailings Storage Facility 2011 Construction As-Built and Annual Review 30 March 2012
VM00560A.A.1 VM00560 - 2011 As-built Annual review report_FINAL_30Mar2012.docx Page 3
Piezometer readings in 2011 indicated the following general trends for the TSF embankment:
• Pore pressures in foundation soils in and around the TSF embankment were noted as stable with minor fluctuations, except for D1 where upward trending piezometer readings are noted. Newly installed piezometers appear to have stabilized but insufficient data has been collected to show any trends since installation.
• Pore pressures in the till core are found to be stable, with a slightly increasing trend in response to the rising pond level.
• Pore pressures in filters and drains remained unchanged throughout the year.
• Pore pressures in the tailings and upstream fill experienced an upwards trend in response to the rising pond level. Piezometers installed at lower elevations within the tailings experienced lower response relative to the piezometers near the pond elevation, due to the under-drainage system.
Table 1.2: Piezometer Summary
Embankment Previously Installed 2011
Installed Total (Functional) (Functional) (Non-functional)
Main 40 26 15 55
Perimeter 10 9 5 15
South 8 2 3 11
Total 58 37 23 81
As part of the 2011 site investigation three (3) additional inclinometers were installed in the embankment for a total of seven (7) functioning slope inclinometers as shown in Table 1.3. Newly installed slope inclinometers were not initialized until January 24th, 2012. The last 2011 reading of site slope inclinometers was conducted on September 6th
Table 1.3: Slope Inclinometer Summary
. The inclinometer data collected in early 2012 has been included as part of this report, and is presented in Appendix B.
Embankment Previously Installed 2011
Installed Total (Functional) (Functional) (Non-functional)
Main 4 1 2 6
Perimeter 0 0 1 1
Total 4 1 3 7
5) Significant changes to dam stability and/or surface water control.
There were no significant changes to dam stability. Based on limit equilibrium stability analyses, the 2.1 m Stage 7 crest raise had a negligible impact on the factor of safety of the dams, with values still in excess of the minimum required 1.3 under static loading, short term construction conditions.

Mount Polley Mines Corporation Tailings Storage Facility 2011 Construction As-Built and Annual Review 30 March 2012
VM00560A.A.1 VM00560 - 2011 As-built Annual review report_FINAL_30Mar2012.docx Page 4
The runoff diversion ditch near Corner 4 at the southwest corner of the TSF was relocated approximately 30 m upslope to accommodate the 2011 extension of the embankment in that area. No other significant changes to surface water control were implemented in 2011.
6) For major tailings impoundments, as described in Part 10.5.2 of the Health, Safety and Reclamation Code for Mines in British Columbia, all operating dams shall have a current Operations, Maintenance and Surveillance (OMS) Manual. The annual report shall indicate the latest revision date of the OMS Manual.
The OMS manual was last updated by MPMC in March 2010, and requires an update in 2012.
7) Scheduled date for formal Dam Safety Review (ref. Canadian Dam Association, Dam Safety Guidelines).
A formal Dam Safety Review in planned to be conducted in 2016 or during detailed closure design, whichever is earliest.
8) Summary of 2011 construction.
AMEC was present on site for critical, non-routine aspects of foundation preparation and fill placement. During this period, AMEC verified that construction methods employed were consistent with design expectations, material specifications were adhered to, and monitoring and testing requirements were understood by MPMC personnel. AMEC’s time on site was also used to verify that daily technical/progress reports were being completed properly, QA/QC and reporting responsibilities were thoroughly understood by all parties, and lines of communication between the site and AMEC office-based support were clearly established and functional. Once AMEC was satisfied that the MPMC’s field inspectors were fully trained and prepared to undertake the construction monitoring and reporting role with remote support required by AMEC, AMEC reduced their monitoring presence to monthly visits, with monitoring of construction progress carried out via reports and photographs issued by MPMC. Actual timing of AMEC’s site visits varied somewhat to align with key construction activities such as foundation preparation and approval, and till core trench approval.
Stage 7 construction involved raising the crest of the embankment to a minimum elevation of 960.1 m. The 2011 construction began mid-spring with placement of upstream fill (Zone U), and was completed by mid-November with placement of NAG rock (Zone C). The majority of construction monitoring was conducted directly by MPMC field inspectors with submission of daily reports to AMEC during placement of critical materials: Till Core (Zone S) and Filter (Zone F). Zone S and Zone F placement was conducted by Peterson Contracting Ltd. Zone U, Transition (Zone T) and Zone C fills were placed by MPMC directly. The abutment preparations were also conducted by MPMC.
9) Overall performance of the Tailings Management Facility
Observations and data obtained over the course of 2011 indicate that the tailings management facility continues to perform in a satisfactory manner. The dam raising carried out in 2011 achieved conformance with design intent.
Mount Polley Mines Corporation Tailings Storage Facility 2011 Construction As-Built and Annual Review 30 March 2012
VM00560A.A.1 VM00560 - 2011 As-built Annual review report_FINAL_30Mar2012.docx Page 5
1.0 INTRODUCTION
The Mount Polley Mine is located in central British Columbia, approximately 60 km northeast of Williams Lake. The main access route is via Likely Road. The turnoff to the Mine is located approximately 1.5 km east of Morehead Lake with the Mine located another eleven km to the southeast, along the Bootjack Lake Forest Service Road. The Mount Polley mine commenced production in June 13, 1997. Ore is crushed and processed by selective flotation to produce a copper-gold concentrate. The mill throughput rate is approximately 20,000 tonnes per day (approx. 7.3 million tonnes per year). Mill tailings are discharged as slurry into the Tailings Storage Facility (TSF) located on the south area of the Mine property.
Tailings slurry is conveyed from the Concentrator to the TSF via a tailings discharge pipeline. The tailings are deposited into the impoundment through moveable or fixed spigots on the embankment crest. A floating reclaim pump recycles process water from the supernatant pond in the TSF for use in the mill processing circuit. Sediment ponds and seepage collection ponds are designed to intercept runoff from the surface and seepage from the embankment respectively. Drains, instrumentation and monitoring wells are constructed in and around the TSF to assist in monitoring the performance of the facility.
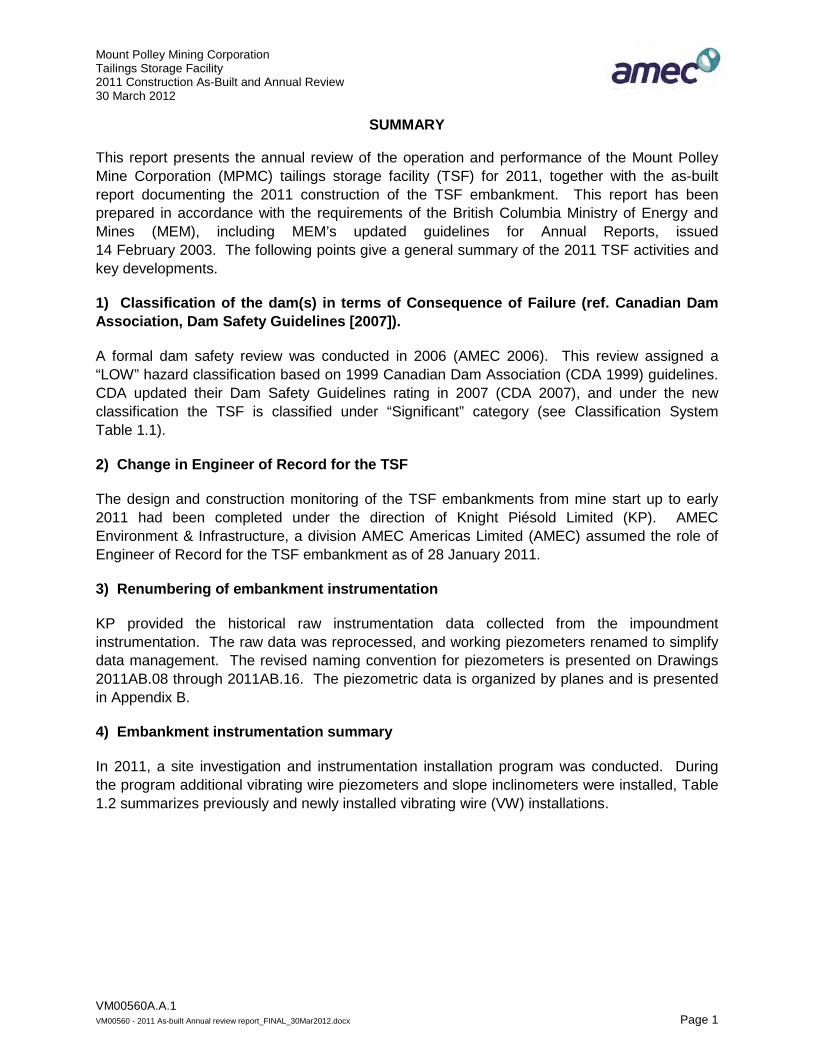
Drawing 2011AB.01 presents a plan of the as-built condition of the Mount Polley Mine site. Figure 1.1 shows an aerial view of the site from 2011.
MPMC milled approximately 28 M tonnes of ore between start-up in 1997 and October 2011. The mine entered into care and maintenance status for the period from October 2001 to February 2005, operations re-started in March 2005.
The starter dam for the TSF embankment was constructed in 1996 to a crest elevation of 927.0m. The starter dam was constructed out of a homogeneous compacted till fill. Discharge of the tailings into the impoundment commenced in the summer of 1997. The TSF embankment was raised in subsequent years as follows:
• To elevation 934.0 m in 1997. • To elevation 936.0 m in 1998. • To elevation 937.0 m in 1999. • To elevation 941.0 m in 2000. • To elevation 942.5 m in 2001. • To elevation 944.0 m in 2004. • To elevation 946.0 m in 2005.
• To elevation 949.0 m in 2006. • To elevation 950.9 m in 2007. • To elevation 951.9 m in 2008. • To elevation 953.9 m in 2009. • To elevation 958.0 m in 2010. • To elevation 960.1 m in 2011.
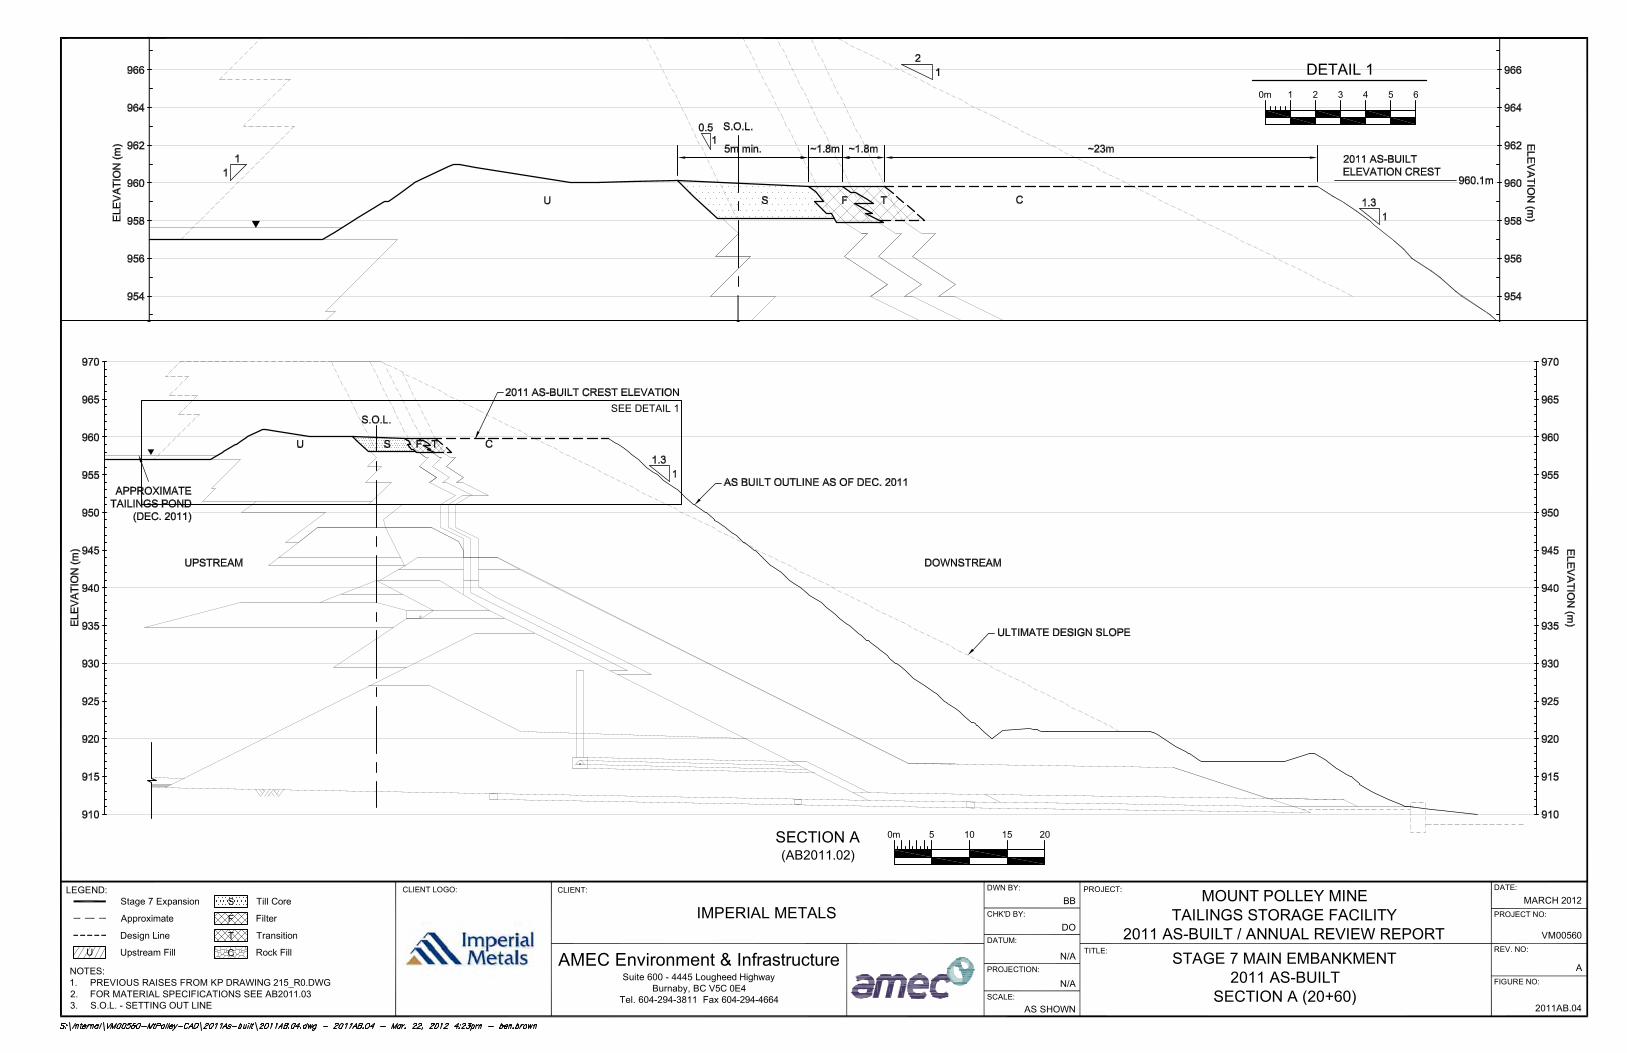
The TSF embankments are zoned earth and rockfill dams (see drawings 2011AB04 through 06). In 2011 MPMC crews and equipment were responsible for the placement of Zone U, Zone T, and Zone C. Placement of Zone S and Zone F was performed by Peterson Contracting Ltd. (Contractor).
This report documents the construction monitoring, construction methods, and the results of the quality control testing performed during the 2011 construction of the Mount Polley TSF 2.1 m crest raise to approximately El. 960.1 m. This report also represents the 2011 annual review of the MPMC TSF.

Mount Polley Mines Corporation Tailings Storage Facility 2011 Construction As-Built and Annual Review 30 March 2012
VM00560A.A.1 VM00560 - 2011 As-built Annual review report_FINAL_30Mar2012.docx Page 6
Figure 1.1: Aerial View of Mine Site: 2011
Mount Polley Mines Corporation Tailings Storage Facility 2011 Construction As-Built and Annual Review 30 March 2012
VM00560A.A.1 VM00560 - 2011 As-built Annual review report_FINAL_30Mar2012.docx Page 7
2.0 OPERATION OF THE TAILINGS STORAGE FACILITY
2.1 General The Mount Polley TSF is comprised of one overall embankment that is approximately 4.2km in length. The embankment is subdivided into three (3) sections; referred to as the Main Embankment, Perimeter Embankment and South Embankment. Heights vary along the embankment and are approximately 48 m, 30 m, and 20 m for the Main, Perimeter and South embankments respectively. As-built sections of the embankment are shown on Drawings 2011AB.04 through 2011AB.06.
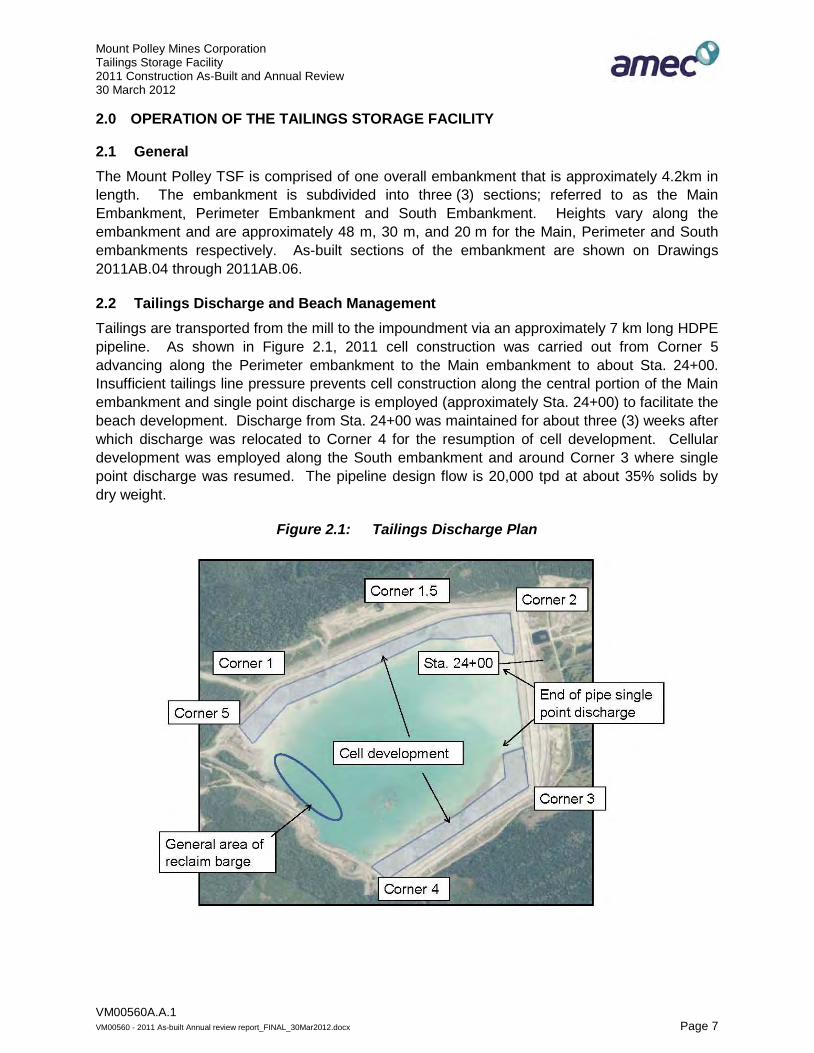
2.2 Tailings Discharge and Beach Management Tailings are transported from the mill to the impoundment via an approximately 7 km long HDPE pipeline. As shown in Figure 2.1, 2011 cell construction was carried out from Corner 5 advancing along the Perimeter embankment to the Main embankment to about Sta. 24+00. Insufficient tailings line pressure prevents cell construction along the central portion of the Main embankment and single point discharge is employed (approximately Sta. 24+00) to facilitate the beach development. Discharge from Sta. 24+00 was maintained for about three (3) weeks after which discharge was relocated to Corner 4 for the resumption of cell development. Cellular development was employed along the South embankment and around Corner 3 where single point discharge was resumed. The pipeline design flow is 20,000 tpd at about 35% solids by dry weight.
Figure 2.1: Tailings Discharge Plan
Mount Polley Mines Corporation Tailings Storage Facility 2011 Construction As-Built and Annual Review 30 March 2012
VM00560A.A.1 VM00560 - 2011 As-built Annual review report_FINAL_30Mar2012.docx Page 8
2.3 Process Water Reclaim The tailings pond supernatant is recycled to the mill for use as process water. It is transported via the reclaim pumping system, which consists of a barge, pipeline and booster pump station. The reclaim pipeline system returns water from the TSF to the mill for use in the mill process.
2.4 Operations, Maintenance and Surveillance Manual The Operations, Maintenance and Surveillance (OMS) Manual was updated in 2010. Due to the change in Engineer of Record, the addition of new instrumentation and an updated instrumentation surveillance and reporting plan the TSF management component of the OMS manual will be updated in 2012.
2.5 Freeboard Requirements The freeboard requirement for the TSF is 1.3 m to allow for storage of the 72-hour PMP event, plus an allowance for wave run-up above the resultant pond level.
2.6 Seepage Collection Ponds Seepage collection ponds are located downstream of each of the three embankments that create the TSF. The seepage collection ponds collect seepage from the embankments, embankment drain discharge and direct runoff from the embankment and reporting catchments. Records indicate that the ponds were excavated into low conductivity glacial till. The ponds were observed to be in good condition.
2.7 Drain Flow Data Flows from the upstream toe drain and foundation drains of the Main Embankment are measured at the sump located at the Main Embankment seepage collection pond. Upstream toe drains from the Perimeter and South Embankments discharge into ditches which carry the flow to their respective seepage collection ponds where it is measured at the end of pipe. Water from the upstream toe and foundation drains is recycled to the TSF.
Measurement of drain flows into the Main Embankment requires that the sediment control pond be pumped down to a low level to allow for safe entry into the sump. In 2011, Main Embankment drain readings were not measured and MPMC was out of compliance with the OMS requirements. MPMC is working to revise the monitoring system in an attempt to capture drain flow readings in compliance with the OMS requirements. Frequency of drain flows from the South and Perimeter embankments varied from monthly to bi-weekly as weather permitted. South and Perimeter Embankment drain reading for 2011 are presented in Figure 2.2. There is no note of any turbidity observed in the drain water which indicates that the filters associated with the drains are functioning as intended.

Mount Polley Mines Corporation Tailings Storage Facility 2011 Construction As-Built and Annual Review 30 March 2012
VM00560A.A.1 VM00560 - 2011 As-built Annual review report_FINAL_30Mar2012.docx Page 9
Figure 2.2: South and Perimeter Toe Drain Flow Readings – 2011

Mount Polley Mines Corporation Tailings Storage Facility 2011 Construction As-Built and Annual Review 30 March 2012
VM00560A.A.1 VM00560 - 2011 As-built Annual review report_FINAL_30Mar2012.docx Page 10
3.0 2011 DAM DESIGN
The drawings appended to this report include design and as-built sections of the TSF embankment current as of the end of 2011. The drawings, in plan view, show the locations of the readout stations for the instrumentation (piezometers, inclinometers), and in section view show the relative placement of the instruments within the embankment and its foundation.
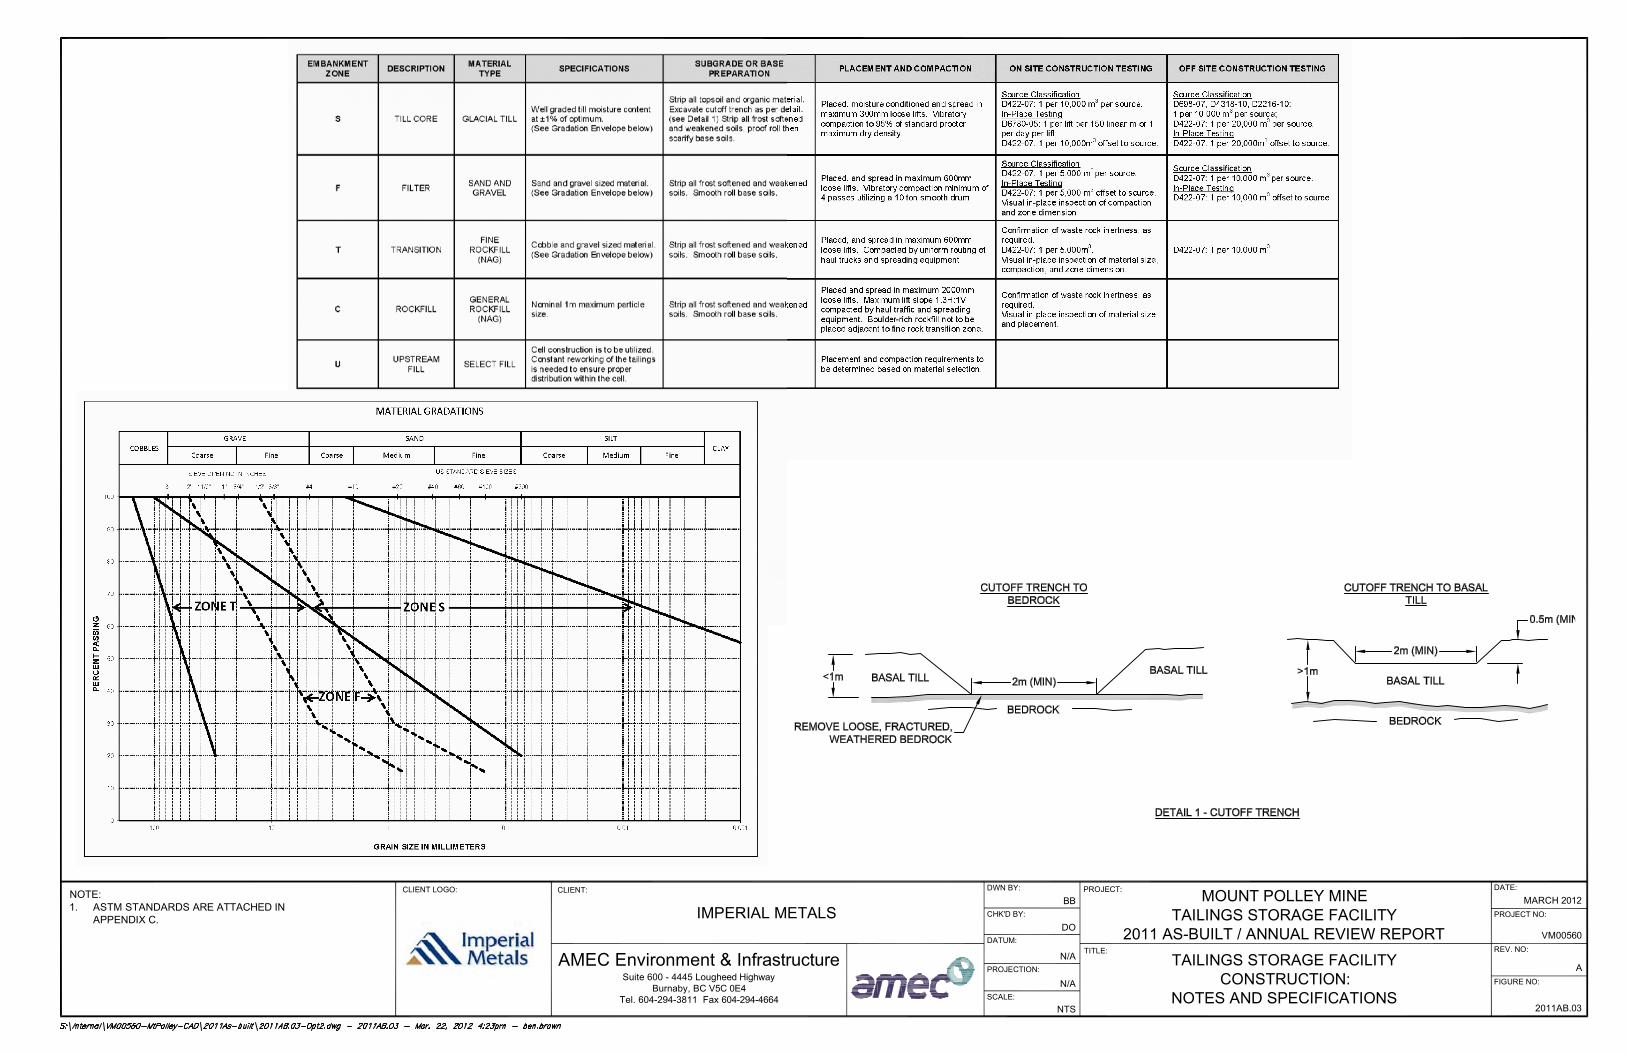
The 2011 Stage 7 TSF embankment raise design was to an elevation of 960.5 m. The design is presented on drawing 2011AB.03 and is as follows:
Upstream Fill (Zone U)
• Comprised of tailings or waste rock where tailings placement infeasible; • Cell construction is to be utilized wherever possible; • Reworking of the tailings is needed to ensure proper distribution within the cell; and • NAG/PAG rock fill can be utilized where the tailings placement is not possible.
Till Core (Zone S)
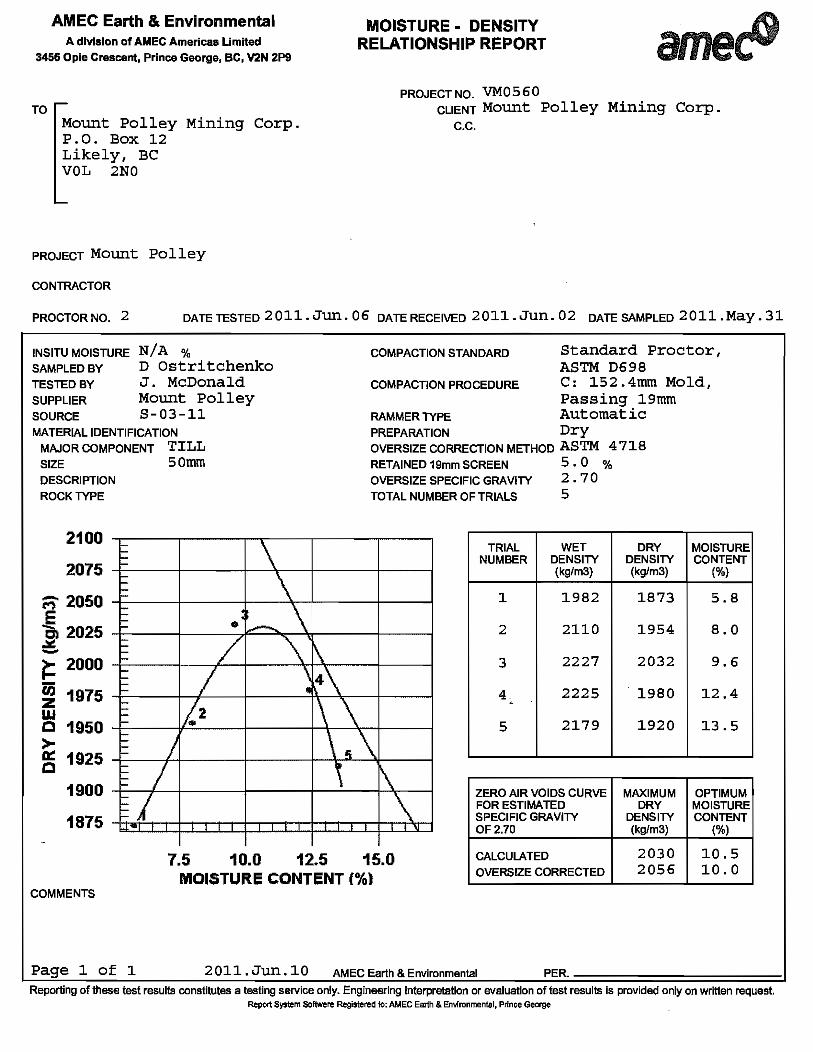
• Comprises compacted, low hydraulic conductivity till fill; • Material is to be well graded and as specified in 2011AB.03; • Minimum 5.0 m in width; • Continuous full width overlap between the previous stage 6 and stage 7; • Placed in maximum of 300 mm thick lifts; • Compaction of minimum of 95% of maximum density as determined by the Standard
Proctor compaction test (ASTM D 698); and • Periodic sampling from the borrow pit and dam surface to verify suitability of the
material.
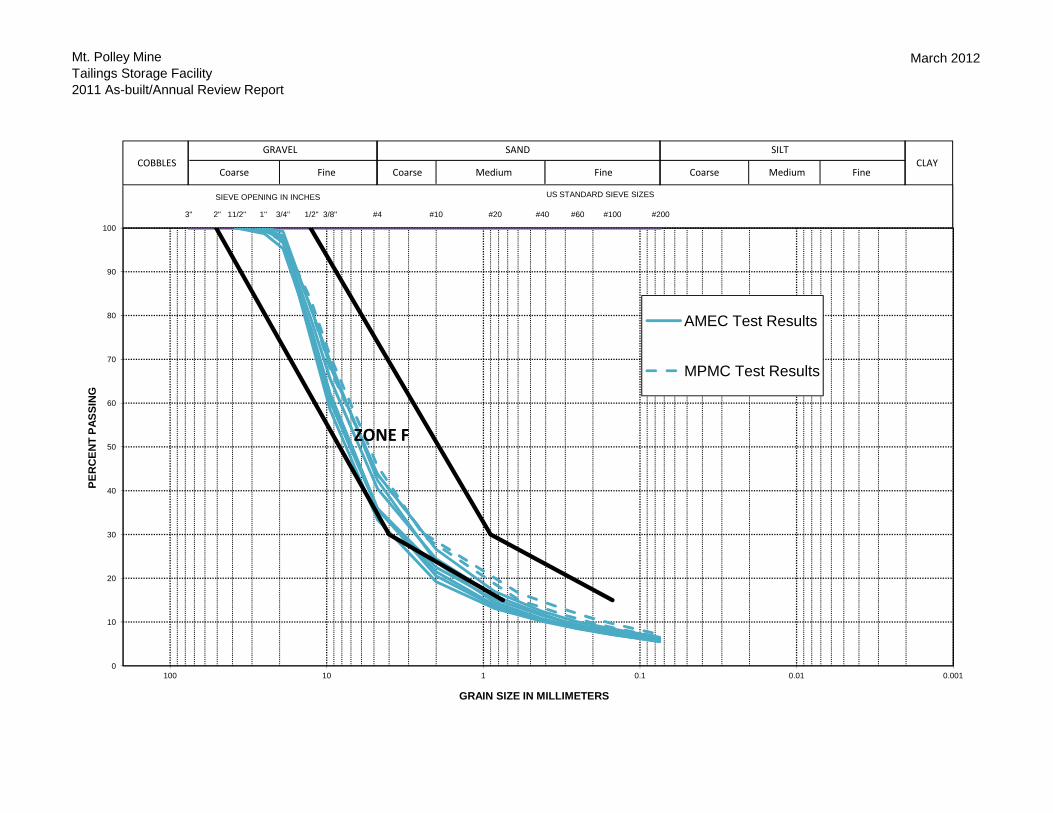
Filter (Zone F)
• Comprises well-graded sand and gravel • Material is to be free draining and as specified in 2011AB.03; • Minimum 1.8 m in width; • The transition between new and existing filter material is to be continuous with a
minimum of 1.0 m overlap; • Placed in maximum of 600 mm thick lifts; • Compacted by a 10 ton vibratory smooth drum; • Periodic samples are to be collected for laboratory testing.
Transition (Zone T)
• Comprises relatively fine waste rock • Material is to be free draining and as specified in 2011AB.03; • New material is to be placed in maximum of 600 mm thick lifts; • Minimum 1.8 m in width; • Compacted by uniform routing of haul trucks and spreading equipment.

Mount Polley Mines Corporation Tailings Storage Facility 2011 Construction As-Built and Annual Review 30 March 2012
VM00560A.A.1 VM00560 - 2011 As-built Annual review report_FINAL_30Mar2012.docx Page 11
Rock Fill (Zone C)
• Comprises run-of-mine waste rock • Nominal maximum particle size of 1m; • Pavement like surface between consecutive layers is to be scarified.
4.0 CONSTRUCTION MONITORING PROGRAM
Construction Monitoring during the 2011 construction season was mainly carried out by MPMC personnel. AMEC’s Support Engineer reviewed daily construction records and performed regular site visits to monitor the quality of construction and assess MPMC’s monitoring of the construction.
4.1 AMEC Support Engineer AMEC’s Support Engineer provided on-site supervision during the following periods:
• Pre-construction Meeting: May 31 to June 1 • Construction Kick-off: June 13 to June 16, June 20 to June 24, June 27 to June 28 • July Site Visit: July 25 to July 28 • August Site Visit: August 19 to August 25
While on site the responsibilities of AMEC’s Support Engineer were as follows:
• Monitor, train, and assist MPMC personnel with the requirements of construction monitoring;
• Monitor, sample, and requisition tests of the borrow areas, as required; • Monitor and perform QA testing of compacted till core soils, as required; • Review and approval of proposed borrow soils; • Review and approval of transition and filter material, processing methodology and
monitoring practices; • Monitor and approve the filter trench excavation and preparation; • Monitor and approve abutment preparation; • Address any concerns or out-of-compliance situations observed and recorded during
construction; • Carry out the quality control field and laboratory testing; • Direct the MPMC personnel to address the survey requirements, results, etc.; and • Meet as required with MPMC to review the construction program. While in the office the responsibilities of AMEC’s Support Engineer were as follows:
• Review daily construction reports submitted by MPMC personnel; • Review compaction results submitted by MPMC personnel; • Plot and review instrumentation readings submitted by MPMC personnel; • Address any concerns or out-of-compliance situations noted by MPMC personnel; and • Coordinate with MPMC personnel and AMEC’s Project Manager/Senior Engineer.

Mount Polley Mines Corporation Tailings Storage Facility 2011 Construction As-Built and Annual Review 30 March 2012
VM00560A.A.1 VM00560 - 2011 As-built Annual review report_FINAL_30Mar2012.docx Page 12
4.2 AMEC Senior Support AMEC’s Senior support Engineers visited site on the following dates:
• T. Martin: June 20/21 • D. Dufault: July 25/26
4.3 MPMC Field Inspector MPMC Field Inspectors were responsible for the following:
• Monitor and maintain a photographic record of ongoing construction activities; • Review borrow pit material to verify material consistency; • Delineate embankment zones with stakes (every 50 m); • Perform QC compaction testing of placed Zone S material (as per material placement
specifications); • Collect material samples for QC laboratory testing; • Conduct as-built surveys of various zones; • Prepare and submit daily construction reports; • Collect and submit instrumentation data; and • Report out-of-compliance situations to AMEC’s Support Engineer.
4.4 QA/QC Testing A summary of the testing requirements is given in Table 4.1.
Table 4.1: Embankment Material Types and QA/QC Testing Requirements Material Type Construction Testing Requirements
Zone S – Till Core D422-07: 1 per 10,000 m
Source Classification 3 per source.
D6780-05: 1 per lift per 150 linear m or 1 per day per lift; In-Place Testing
D422-07: 1 per 10,000m3
Zone F – Filter
offset to source.
D422-07: 1 per 5,000 mSource Classification
3 per source.
D422-07: 1 per 5,000 mIn-Place Testing
3
Visual in-place inspection of compaction and zone dimension. offset to source.
Zone T – Transition
Confirmation of waste rock inertness, as required. D422-07: 1 per 5,000m3
Visual in-place inspection of material size, compaction, and zone dimension. .
Zone C – Rockfill
Confirmation of waste rock inertness, as required. Visual in-place inspection of material size and placement.
Zone U – Upstream fill
Visual in-place inspection of material size and placement.
During the 2011 construction season, the testing frequencies as outlined above were generally maintained.
Mount Polley Mines Corporation Tailings Storage Facility 2011 Construction As-Built and Annual Review 30 March 2012
VM00560A.A.1 VM00560 - 2011 As-built Annual review report_FINAL_30Mar2012.docx Page 13
4.5 Instrumentation Monitoring During the 2011 construction period, MPMC personnel monitored the vibratory wire instrumentation along the embankments generally once every two weeks. Inclinometers were monitored generally every two weeks during the 2011 construction period; inclinometer readings were offset a week from the piezometer readings.
For the period after the 2011 construction period through the end of 2011, the recommended instrumentation surveillance schedule was not maintained. Compliant monitoring frequency was re-established in January 2012.
5.0 2011 TSF STAGE 7 EMBANKMENT RAISE CONSTRUCTION OVERVIEW
5.1 General Construction of the Stage 7 raise entailed a raise of approximately 2.1 m from approximate El. 958.0 m to El. 960.1 m. Till core construction period took place between June 13 and September 21, 2011. This section provides a brief summary of the 2011 construction activities for the TSF. Drawings AB2011.04 through AB2011.06 show the plan view and as built sections of the embankment in relation to the design. A selection of photographs showing various stages of the 2011 TSF construction are presented in Appendix C.
5.2 Abutment Preparation To accommodate the 2011 embankment raise, the south and perimeter abutments were extended. Abutment preparation was conducted as follows:
• Bulk removal of overburden (including previously placed waste rock fill) by MPMC personnel and equipment.
• Test pits were conducted to confirm that a minimum of 2 m of till was present beneath the embankment core. The test pits were located upstream and downstream of the core limits such that the existing soils found under the till core contact were not compromised. Bedrock was not encountered in any of the test pits.
• To accommodate a drainage trench detail implemented in past raises, aligned along the toe of the dam, a ditch approximately 1.0 m in depth and 2.0 m in width was excavated along the Perimeter and on the South Embankments downstream of the abutment core extensions. On the South Embankment it was noted that a corrugated drainage pipe was present. The pipe was extended and placed at the base of the trench. No drainage pipe was noted on the perimeter embankment. The trench was than backfilled with filter material (Zone F).
• Prior to placement of the drainage blanket the exposed native abutment material was proof-rolled with a 10 ton vibratory smooth drum compactor.
• The drainage blanket was placed to the full extents of the embankment shell. The blanket consisted of a 0.3 m thick lift of Zone F material overlain by a 0.3 m thickness of Zone T material.

Mount Polley Mines Corporation Tailings Storage Facility 2011 Construction As-Built and Annual Review 30 March 2012
VM00560A.A.1 VM00560 - 2011 As-built Annual review report_FINAL_30Mar2012.docx Page 14
5.3 Fill Placement 5.3.1 Zone U – Upstream Shell
The upstream shell was constructed of end of pipe spigotted tailings utilizing cells, reworked with a dozer, and shaped with the aid of en excavator; the majority of this work was carried out without AMEC supervision. Where the tailings could not be used for shell construction due to pipeline and pumping limitations, NAG waste rock was used, as shown on Figure 2.1. This occurred along the central portion of the Main Embankment between Corner 2 and Corner 3. The NAG was transported by haul truck and placed/shaped by excavators and dozers. Prior to 2011 Zone S placement, AMEC’s Support Engineer inspected the NAG waste rock to ensure that large boulders (diameter > 1 m) were not placed near the Zone U/Zone S interface.
5.3.2 Zone S – Till Core
The placement of Zone S material was performed by the Contractor and generally was executed as follows:
• Prior to placement of the first lift of till core for the 2011 raise the existing Zone S/abutments were prepared by proof-rolling with a 10 ton vibratory smooth drum roller. Areas that were noted to be soft or affected by the frost were removed and replaced with approved Zone S material.
• The top 0.1 m of the prepared surface was scarified with the aid of a dozer/grader, to promote good bonding between successive lifts.
• The surface was moisture conditioned as required to further promote proper bonding of successive till lifts.
• The till was placed in 0.3 m thick lifts via scrapers, and was spread with the aid of dozers, excavators, and graders.
• Compaction was achieved by scraper trafficking and a 10 ton smooth drum vibratory compactor.
• On average, for every two (2) to three (3) lifts placed, the downstream face of the till was trimmed and shaped by an excavator to maintain design lines. The extra width trimmed was required to ensure that the full design width of till was compacted.
5.3.3 Zone F – NAG Filter Rock
The material utilized for Zone F was crushed on site and stockpiled around the embankment for rehandling during placement within the dam. Haul trucks were used to stock pile and transport the material to the TSF embankment. Refer to Drawing 2011.02 for stock pile locations used during the 2011 construction.
Prior to placement of Zone F material, the previously placed filter material was exposed to ensure vertical continuity of the filter. This was carried out by excavator as part of the trimming process for the core. The filter material was placed on the embankment by the Contractor in
Mount Polley Mines Corporation Tailings Storage Facility 2011 Construction As-Built and Annual Review 30 March 2012
VM00560A.A.1 VM00560 - 2011 As-built Annual review report_FINAL_30Mar2012.docx Page 15
0.6 m lifts. The material was transported by dump trucks and spread/shaped with the aid of excavator, grader, and a loader.
The placed Zone F material was compacted in conjunction with Zone T material, by 10 ton smooth drum compactor and scraper trafficking.
5.3.4 Zone T – Transition NAG Rock
AMEC understands that historically the Zone T material was produced by manually sorting Zone C material with an excavator. Sorting of Zone C material required experienced operators; was time consuming; and required constant supervision. Initially, Zone T fill was manually sorted during the Stage 7 construction; however, during the initial placement of this material it was noted that the required gradation and consistency of the material was not being achieved. MPMC switched to a manufactured product with a nominal particle size of 75mm and a gradation and distribution that satisfied the required specifications.
Prior to placement of the Zone T material, the interface between the different lifts was exposed or/and scarified to remove any pavement like surfaces. Zone T material was hauled by MPMC and placed by MPMC in 0.6 m to 1.2 m thick lifts with the aid of a loader and grader. Additional material was also placed to provide access ramps utilized by scrapers. These ramps enabled scrapers to place additional till lifts. After the core and the filter material were constructed for the season, the previously placed transition ramp was reshaped to form the transition zone with the aid of an excavator. The compaction of the transition zone was achieved via routing of scrapers and haul trucks.
5.3.5 Zone C – Downstream Shell NAG Rock
Zone C material was placed by MPMC. Prior to placement, where pavement like surfaces had developed the surface was scarified with the aid of grader/dozer, to avoid continuous, low hydraulic conductivity zones within the rockfill shell, and thus promote downward drainage through the rockfill. The NAG rock was transported from active mining areas to the embankment via haul truck and placed and spread by dozers.
5.4 Survey Control Survey control requirements for the 2011 raise of the TSF included the following:
• Staking out the upstream and downstream of the Zone S; the stakes were generally Placed every 50m along the entire length of the embankment;
• Maintaining the downstream crest stationing during embankment construction; • Verifying that a 5m width was maintained during construction; • Establishing and verifying the Zone F/T transition line for placement of Zone T material; • Confirming that the minimum width of Zone F and Zone T were achieved by conducting
spot checks; • Survey pick-up of the locations of in-situ density tests; • Collecting and storing data as required for the as-built record; and • Providing location and elevation data as required by the AMEC Support Engineer.

Mount Polley Mines Corporation Tailings Storage Facility 2011 Construction As-Built and Annual Review 30 March 2012
VM00560A.A.1 VM00560 - 2011 As-built Annual review report_FINAL_30Mar2012.docx Page 16
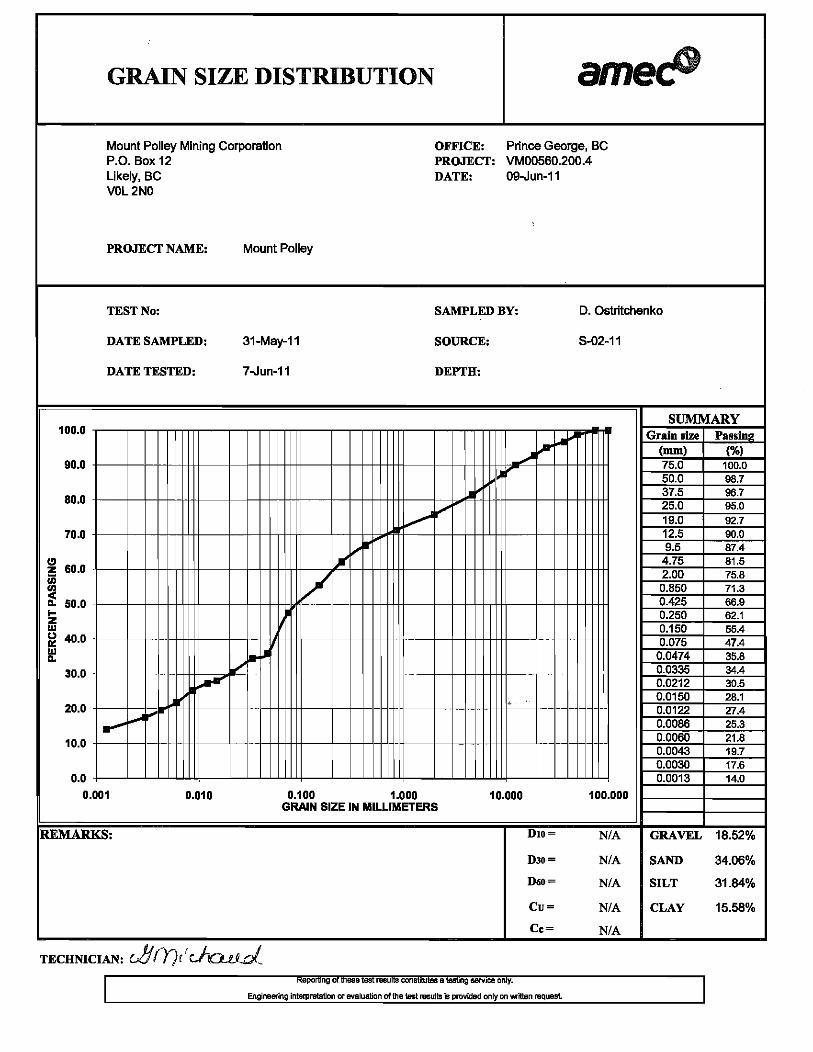
5.5 Quality Control and Quality Assurance Testing QA/QC testing of the fills used in the construction of the embankment involved on-site and off-site tests. On-site testing was restricted due to the limited availability of the on-site laboratory. The results of these tests are presented in Appendix A.
A summary of the quantities of each different material type and the number and types of tests performed on the fills is provided in Table 5.1.
Table 5.1: TSF Summary of Material Quantities and Laboratory testing
Material Type Source Of Material Volume Placed (m3
QA/QC Tests Performed )
Zone C – Downstream Shell NAG Rock Springer Pit (ROM)*
209,500
Visual
Zone T – Transition NAG Rock
Springer Pit (Road Crush product)
31 gradations (MPMC – from stockpile)
4 Gradations (AMEC – from stock piles)
Zone F – NAG Filter Rock Springer Pit (Filter Crush) 19,550
5 Gradations (MPMC As placed) 3 Gradations (AMEC – As placed) 5 Gradations (AMEC – from stock
piles)
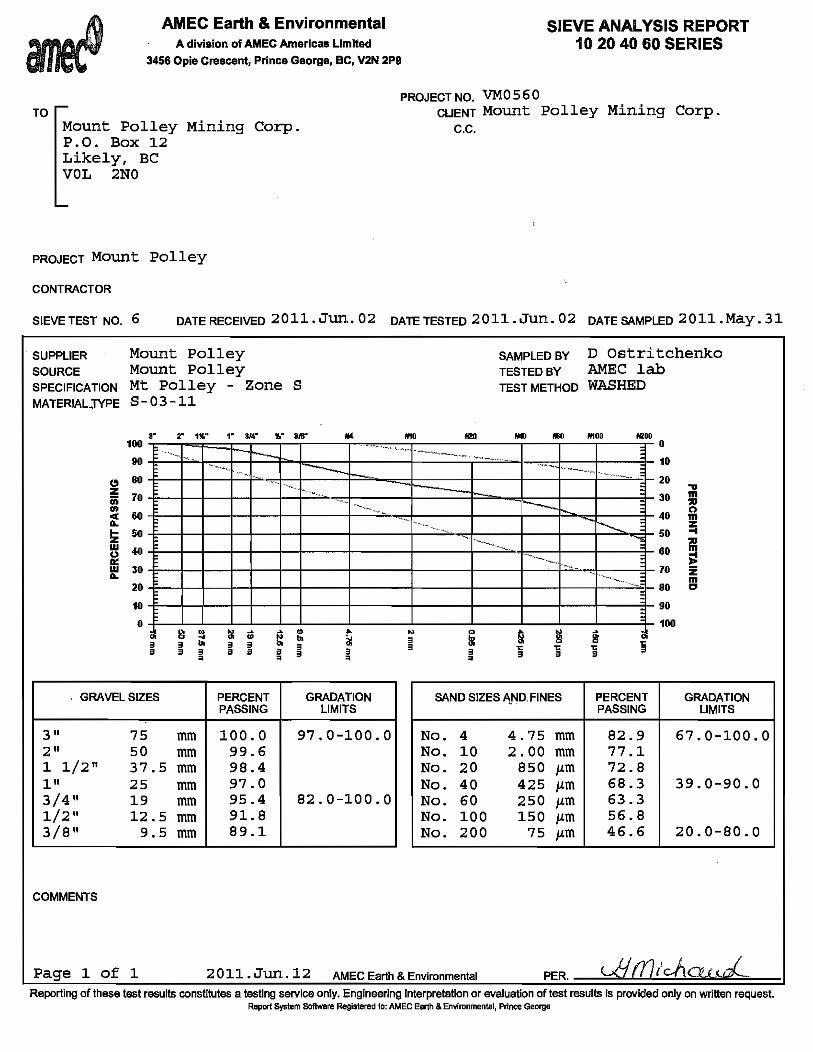
Zone S - Till Core Perimeter and Barge Borrow Pits 54,300
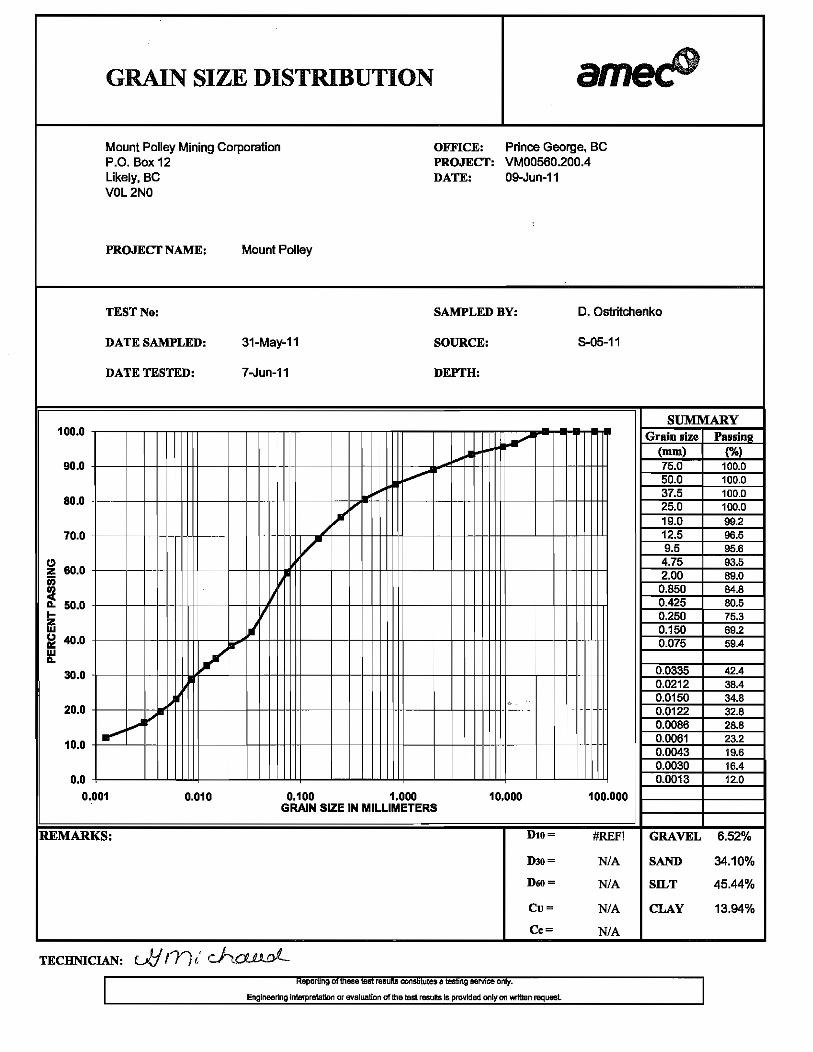
5 Proctor 9 Gradation
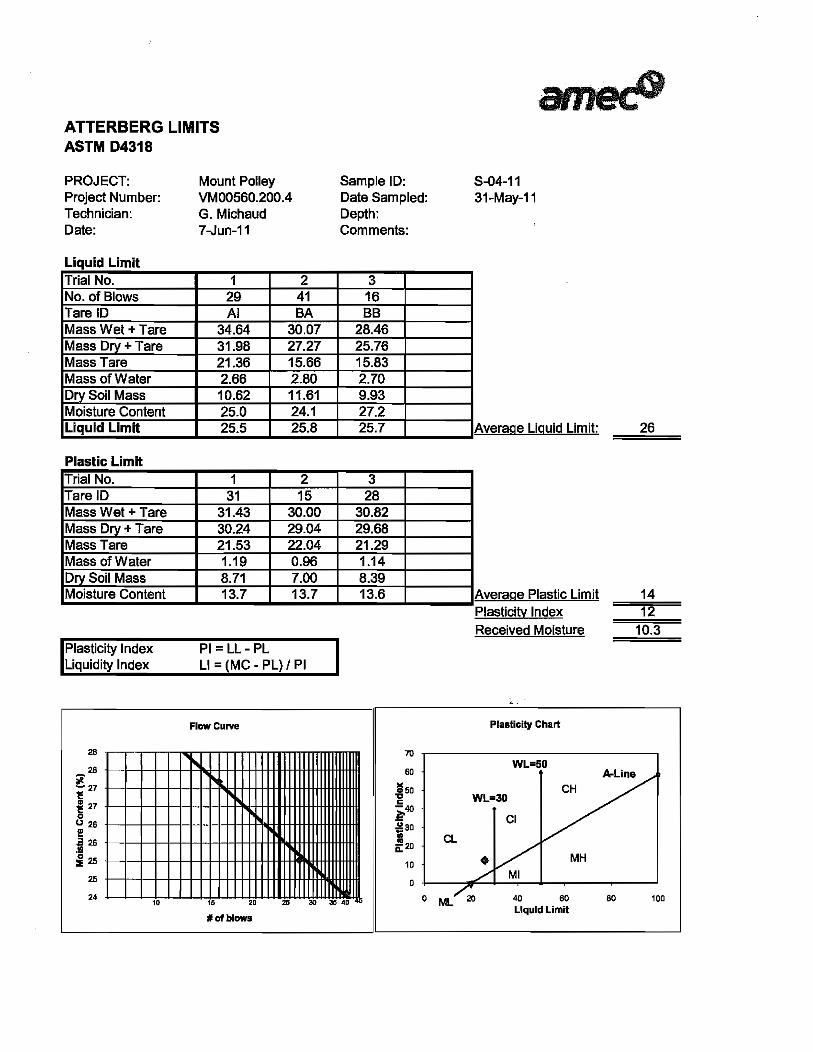
7 Atterberg limits 43 ND field density (AMEC)
235 MDI field density(MPMC) 9 Laboratory Moisture tests
Total Fill Volume Placed 283,350 *Run of mine material (no processing required) 5.5.1 Zone S – Till Core
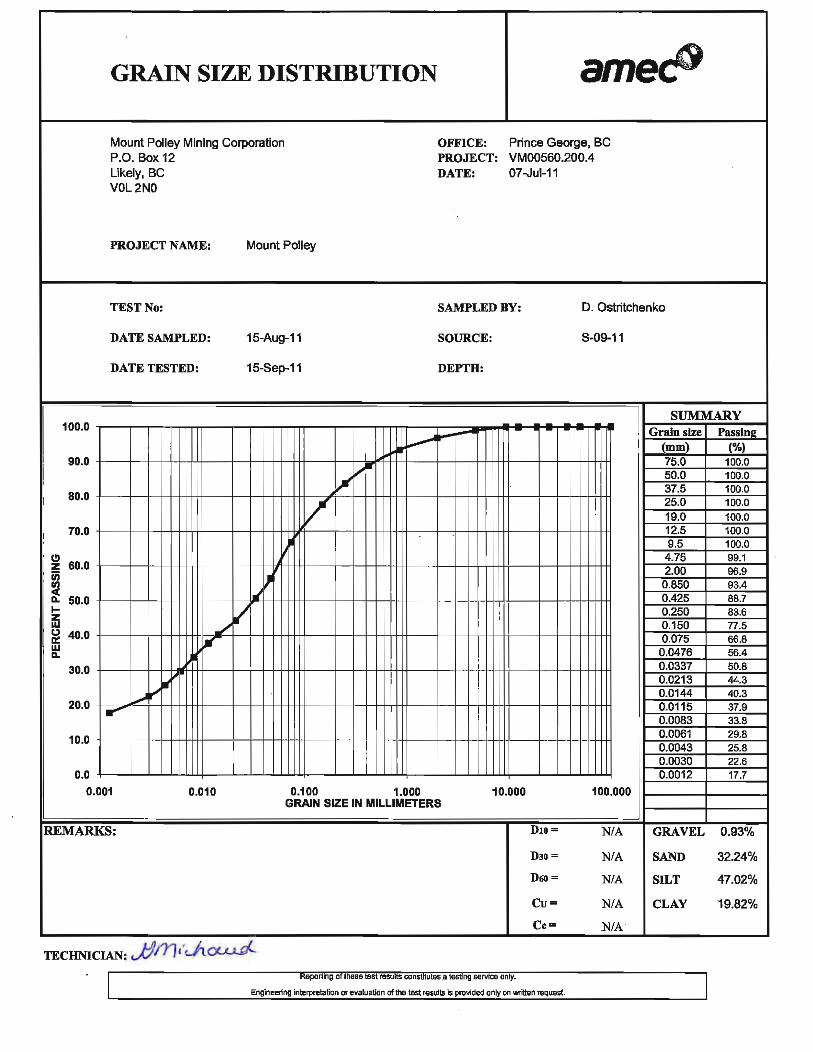
During the 2011 construction season, two (2) separate borrow pits were utilized, the barge and perimeter borrows. In 2011, the main borrow source used was the perimeter borrow. This borrow pit is located downstream of the Perimeter Embankment between Corner 1 and Corner 1.5. The material sourced from the barge borrow was placed near Corner 5, and was only used for the small section between Corner 1 and Corner 5 of the Perimeter Embankment. The locations of the borrow pits are shown on Drawing 2011AB.02. Till material from both borrows was fairly consistent and was classified as a low plastic Silt, sandy, some clay with some to trace gravel.
Prior to commencement of the 2011 construction season; the MDI testing unit was calibrated as per ASTM 6780-05. In addition, a proctor test was conducted to confirm the maximum density and optimal moisture content as per ASTM D2216-10 of the glacial till to be used for Zone S construction. The in-situ density and moisture content of the compacted fill were determined by performing MDI tests (ASTM D6780-05) by MPMC personnel. AMEC carried out additional QA testing with a nuclear densometer (ASTM D6938-10, ND). Where field test results indicated that the specified 95% Standard Proctor Maximum Dry Density (SPMDD) was not achieved, the
Mount Polley Mines Corporation Tailings Storage Facility 2011 Construction As-Built and Annual Review 30 March 2012
VM00560A.A.1 VM00560 - 2011 As-built Annual review report_FINAL_30Mar2012.docx Page 17
area was re-compacted until satisfactory test results were achieved. Samples of till were also collected and periodically sent to AMEC’s Prince George lab facility for geotechnical index testing. Additional detail regarding the QC/QA tests was presented in Table 5.1 with testing results presented in Appendix A.
The SPMDD value used in the field was chosen based on an average of the SPMDD lab results for the 2010 construction season and/or based on visual classification of the soil and/or based on the moisture content and/or the results of field scale test compactions and/or updated SPMDD results, whichever was most appropriate. New average SPMDD reference values were calculated and applied in the field as new proctor data became available. In general, the fills achieved 95% SPMDD even when a conservative SPMDD reference value was used, due to the compactive effort applied by construction traffic and compaction equipment. Each test result was recorded and entered into a spreadsheet. Plots of the test results were prepared and are presented in Appendix A. 5.5.2 Zone F – NAG Filter Rock
Filter Zone F was produced by running run-of-mine NAG waste rock through the mill crusher. The processed material was fairly consistent and was slightly coarse at the bottom end but was deemed acceptable. Samples of this material were collected and are presented in Appendix A.
5.5.3 Zone T – Transition Zone
As discussed in Section 5.3 the method of producing an acceptable transition zone material was adjusted in 2011. The new processed material consistently satisfied the required specification and was deemed acceptable. Samples of this material were tested and the results are presented in Appendix A.
5.5.4 Zone C – Downstream Shell NAG Rock
Downstream Shell Zone C rockfill was visually checked to ensure filter compatibility with the upstream adjacent Zone T material. Standard practice of placing excessively coarse material towards the downstream limit of the fill was adhered to and the Zone C material placed was deemed acceptable.
5.6 Conformance of 2011 Construction with Design Intent Based on AMEC’s observations of the construction, review of reports prepared by MPMC when AMEC was not on site, and the QA/QC records, the 2011 Stage 7 raise of the dams was carried out in conformance with design intent. 6.0 INSTRUMENTATION MONITORING
6.1 General The design and construction monitoring of the TSF embankments from mine start-up to early 2011 had been completed under the direction of KP. AMEC assumed the role of Engineer of Record for the TSF embankment as of 28 January 2011. KP provided the historical raw instrumentation data collected from the impoundment instrumentation. The raw data was

Mount Polley Mines Corporation Tailings Storage Facility 2011 Construction As-Built and Annual Review 30 March 2012
VM00560A.A.1 VM00560 - 2011 As-built Annual review report_FINAL_30Mar2012.docx Page 18
reprocessed, and working piezometers renamed to simplify data management. The revised naming convention for piezometers is presented on Drawings 2011AB.08 through 2011AB.16. The piezometric data organized by planes is presented in Appendix B
6.2 New Instrumentation In 2011, a site investigation program was conducted. During the site investigation additional vibrating wire piezometers and slope inclinometers were installed. Table 1.2 and Table 1.3 summarize the status of vibrating wire piezometers and inclinometers installed in the TSF.
6.3 Piezometers In 2011 the piezometers indicated the following general trends for the TSF embankment:
• Pore pressures in foundation soils in and around the TSF embankment were noted as stable with minor fluctuations, except for D1 were an upward trend is noted. Newly installed piezometers appear to have stabilized but insufficient data has been collected to show any trends at this point.
• Pore pressures in the till core are found to be stable, with a slightly increasing trend in response to the rising pond level.
• Pore pressures in filter and drains remained unchanged throughout the year.
• Pore pressures in the tailings and upstream fill experienced an upwards trend in response to the rising pond level. Piezometers installed at a lower elevation within the upstream tailings experienced lower response relative to the piezometers near the pond elevation, likely the result of proximity to the upstream under-drainage system.
6.4 Slope Inclinometers In general, in 2011, the inclinometers indicated the following trends for the TSF embankment:
• SI11-02 showed an approximately 5 mm displacement over the course of the entire year. About half of that movement was observed sometime after or near completion of construction. Regular readings were not conducted during construction. The observed displacement is well within tolerable limits.
• SI06-02 and SI06-03 also displayed slight displacements. Since initialization of these slope inclinometers (in 2006), cumulative lateral displacement of roughly 5 mm has been observed, with no well-defined discrete movement zone. These movements are well within tolerable limits.
• No notable displacement has been noted on SI06-01, SI11-01, and SI11-02.
• SI11-04 has to date indicated displacement suggestive of compression rather than lateral displacement. Such a pattern of displacement sometimes occurs as a result of the installation process. This slope inclinometer should be reinitialized when the compression displacement stabilizes.

Mount Polley Mines Corporation Tailings Storage Facility 2011 Construction As-Built and Annual Review 30 March 2012
VM00560A.A.1 VM00560 - 2011 As-built Annual review report_FINAL_30Mar2012.docx Page 19
7.0 WATER MANAGEMENT AND IMPOUNDMENT RAISING SCHEDULE
7.1 General MPMC maintains the water/mass balance model which is updated monthly with actual tonnages (milled/mined), precipitation data and surveyed pond water elevations to maintain the accuracy of the model and pond level projections. The Mount Polley balance has not been reviewed by AMEC. This section therefore provides a general overview of the water balance and site water management as provided by MPMC.
It is AMEC’s understanding that currently the total inflow from precipitation and surface runoff exceeds losses from evaporation and storage of water within the voids of deposited tailings. Thus, MPMC mine site is operating under a net annual water surplus condition, with the accumulating surplus being stored in the TSF and the Caribou Pit. MPMC transfers water as needed between the TSF and the Cariboo Pit, with the volumes transferred, as provided by MPMC, shown in Figure 7.1.
Figure 7.1: Water Transfer
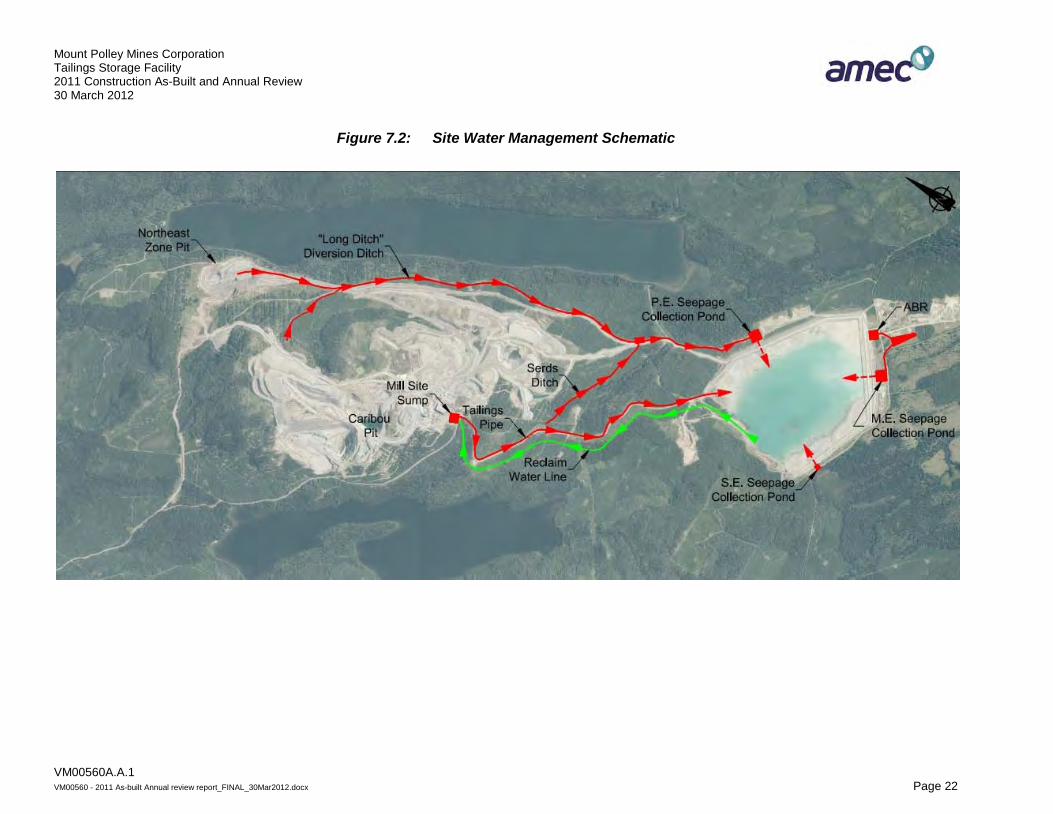
7.2 Site Water Management Site water management is illustrated on Figure 7.2 and is described below:
• Northeast Zone Pit water is pumped into the “Long Ditch”. The Long Ditch also intercepts surface runoff along with flows via a buried pipeline from “Joe’s Creek” that collects water from dump runoff at the northern end of the site. The Southeast Rock Dump Site (SERDS) Ditch feeds into a pond (along with the open-flow Long Ditch). This water is conveyed via a buried pipe until just past the Bootjack Creek Bridge crossing (not identified on the map) where it then flows back into an open ditch and into the Perimeter Embankment Seepage Collection Pond. This water is collected and pumped into the TSF.
0
50
100
150
200
250
300
Nov
-07
Dec
-07
Jan-
08
Feb-
08
Mar
-08
Apr
-08
May
-08
Jun-
08
Jul-0
8 A
ug-0
8 Se
p-08
O
ct-0
8 N
ov-0
8 D
ec-0
8 Ja
n-09
Fe
b-09
M
ar-0
9 A
pr-0
9 M
ay-0
9 Ju
n-09
Ju
l-09
Aug
-09
Sep-
09
Oct
-09
Nov
-09
Dec
-09
Jan-
10
Feb-
10
Mar
-10
Apr
-10
May
-10
Jun-
10
Jul-1
0 A
ug-1
0 Se
p-10
O
ct-1
0 N
ov-1
0 D
ec-1
0 Ja
n-11
Fe
b-11
M
ar-1
1 A
pr-1
1 M
ay-1
1 Ju
n-11
Ju
l-11
Aug
-11
Sep-
11
Oct
-11
Nov
-11
Dec
-11
Vol
ume
( 100
0 m
3 )
Date From SEZ Sump To Caribou Pit From TSF to Caribou Pit From Caribou Pit to TSF
Mount Polley Mines Corporation Tailings Storage Facility 2011 Construction As-Built and Annual Review 30 March 2012
VM00560A.A.1 VM00560 - 2011 As-built Annual review report_FINAL_30Mar2012.docx Page 20
• The Anaerobic Biological Reactor (ABR) receives toe drain flow, and discharges out to a
pond and to the Main Seepage Pond, from where it is pumped back into the TSF.
• The Mill Site Sump is bled into the tailings line and thus directed to the TSF.
• The reclaim water line runs adjacent to the tailings line, and transfers water from the reclaim barge in the TSF to the booster station (not labelled) and to the mill.
• Flows from the TSF toe drains and upstream under-drains report to the seepage collection ponds before being pumped back into the TSF.
7.3 Mass Balance Survey and pond soundings of the impoundment area were last updated by MPMC personnel in August 2011. The updated survey data was used to create a revised storage elevation curve for the tailings impoundment, which was incorporated into the mass balance model. The updated mass balance model was then used to predict average tailings and pond level/volume within the TSF. In turn, that level plus the PMF event determines the required dam crest elevations and the dam raising schedule. A new bathymetric survey will be carried out when the pond becomes ice free in 2012.
The mass balance model is updated on a regular basis with actual tonnages (milled/mined) and surveyed pond water elevations to calibrate the model and increase the accuracy of pond level projections.
7.4 Overview of Mass Balance Model The mass balance model projections are based on a number of parameters and assumptions, including those listed below:
• Projected tailings elevations in the TSF are on the basis of the tailings tonnages projected by the design mine plan and assumed in-situ dry density.
• Projected pond water levels do not take into account the water transferred between the TSF and the Cariboo Pit.
The TSF is required to have sufficient live storage capacity for containment of runoff from the entire contributing catchment area during a 24-hour PMP event. In addition, the TSF design also incorporates an allowance for wave run-up. Therefore, the normal and maximum operating pond levels are as follows:
• Normal Operating Level – Water level at least 1.3 meters below the embankment crest; and
• Maximum Operating Level – Water level is 1 meter below the embankment crest, which allows for the storage of the runoff from the design 24 hr duration PMP event above the normal Operating Level.
Mount Polley Mines Corporation Tailings Storage Facility 2011 Construction As-Built and Annual Review 30 March 2012
VM00560A.A.1 VM00560 - 2011 As-built Annual review report_FINAL_30Mar2012.docx Page 21
7.5 Dam Raising Schedule MPMC is managing the site water balance, and only the corresponding projected pond elevations and respective dam filling schedule have been reviewed by the design engineer. The following section was provided by MPMC. The water balance projects that the current dam crest elevation of 960.1 m is sufficient until the end May 2012. To remain compliant and satisfy the 1.3 m freeboard requirement, a 0.3 m lift over the entire length of the embankment will be required in early spring 2012 accordingly. MPMC holds the option of transferring excess pond water into the mined out Cariboo Pit if required to satisfy freeboard requirements until the full 2012 embankment raise is realized.
The 2012 Stage 8 Embankment raise (3.4 m) to crest El. 963.5 m is targeted for completion by the end of September 2012. The impoundment filling curve with predicted and actual pond levels and embankment elevations through the 2012 season is presented in Figure 7.3.
7.6 Mine Planning The 2016 Mine Plan remains unchanged and forms the basis for future dam raises.
Mount Polley Mines Corporation Tailings Storage Facility 2011 Construction As-Built and Annual Review 30 March 2012
VM00560A.A.1 VM00560 - 2011 As-built Annual review report_FINAL_30Mar2012.docx Page 22
Figure 7.2: Site Water Management Schematic

Mount Polley Mines Corporation Tailings Storage Facility 2011 Construction As-Built and Annual Review 30 March 2012
VM00560A.A.1 VM00560 - 2011 As-built Annual review report_FINAL_30Mar2012.docx Page 23
Figure 7.3: Impoundment Storage Elevation Curve
946
947
948
949
950
951
952
953
954
955
956
957
958
959
960
961
962
963
964
31-J
an-0
7
30-J
ul-0
7
26-J
an-0
8
24-J
ul-0
8
20-J
an-0
9
19-J
ul-0
9
15-J
an-1
0
14-J
ul-1
0
10-J
an-1
1
9-Ju
l-11
5-Ja
n-12
3-Ju
l-12
30-D
ec-1
2
28-J
un-1
3
Elev
atio
n (m
)
Date
Pond Elevation (actual)
Pond Level (predicted)
Embankment Crest
Projected Pond Elevation
Mount Polley Mines Corporation Tailings Storage Facility 2011 Construction As-Built and Annual Review 30 March 2012
VM00560A.A.1 VM00560 - 2011 As-built Annual review report_FINAL_30Mar2012.docx Page 24
8.0 CONCLUSIONS AND RECOMMENDATIONS
Conclusions drawn on the basis of this annual review and as-built report are as follows:
1. The TSF embankment was raised to a minimum crest elevation (till core) of 960.5 m in 2011.
2. The 2011 raise of the TSF embankment was carried out in conformance with design intent.
3. Monitoring of the TSF embankment via instrumentation and visual inspections indicated the following:
a. Surveys of inclinometers within the downstream shell of the dam indicate that movements are minor and well within tolerable limits.
b. Foundation pore pressures have been stable.
c. Pore pressures in the till fill of the dam have increased slightly due to the pore pressure increase of the tailings.
d. The TSF embankment is performing in accordance with its design intent.
Recommendations made on the basis of this annual review and as-built report are as follows:
1. A comprehensive review and update of the site water balance should be undertaken.
2. Toe drain flows need to be measured and recorded per requirements described in the OMS manual.
3. The OMS manual for the TSF is due for an update in 2012.
Mount Polley Mines Corporation Tailings Storage Facility 2011 Construction As-Built and Annual Review 30 March 2012
VM00560A.A.1 VM00560 - 2011 As-built Annual review report_FINAL_30Mar2012.docx Page 25
9.0 REPORT CLOSURE
This report has been prepared for the exclusive use of Mount Polley Mine Corporation for specific application to the area within this report. Any use which a third party makes of this report, or any reliance on or decisions made based on it, are the responsibility of such third parties. AMEC accepts no responsibility for damages, if any, suffered by any third party as a result of decisions made or actions based on this report. It has been prepared in accordance with generally accepted geotechnical and tailings dam engineering practices. No other warranty, expressed or implied, is made.
Respectfully submitted,
AMEC Environment & Infrastructure, a division of AMEC Americas Limited
Reviewed by:
Dmitri Ostritchenko, EIT Geotechnical Engineer
Steve Rice, P.Eng. Principal Engineer
Original paper copies signed and sealed by Daryl Dufault P.Eng.
Daryl Dufault, P.Eng. Project Manager
Todd E. Martin, P.Eng., P.Geo. Principal Engineer

Mount Polley Mines Corporation Tailings Storage Facility 2011 Construction As-Built and Annual Review 30 March 2012
VM00560A.A.1 VM00560 - 2011 As-built Annual review report_FINAL_30Mar2012.docx Page 26
REFERENCES
AMEC (2006). “Dam Safety Review Mt. Polley Mine - Tailings Storage Facility”, December.
AMEC (2011). “Construction Manual 2011”, 20 April.
AMEC (2011). “Tailings Storage Facility Instrumentation Review and Recommendations”, 14 June.
CDA (Canadian Dam Association), 2007. Dam Safety Guidelines.
KP (2005). “Mount Polley Mine – Design of the Tailings Storage Facility to Ultimate Elevation”, 18 June.
KP (2007). “Mount Polley Mine – Stage 6 Design of the Tailings Storage Facility”, 18 June.
KP (2011). “Mount Polley Mine – Tailings Storage Facility Report on Stage 6B Construction”, 25 January.
KP (2011). “Mount Polley Mine – Tailings Storage Facility Report on 2010 Annual Inspection”, 25 January.
Leps, T.M., 1970. Review of Shearing Strength of Rockfill. ASCE Journal of the Soil Mech. and Found. Eng. Div., SM4. July 1970. pp. 1159-1170.

DRAWINGS

0m 300 600 900 1200
UTM Zone 10
PROJECTION:
NAD83
DATUM:
MOUNT POLLEY MINETAILINGS STORAGE FACILITY
2011 AS!BUILT / ANNUAL REVIEW REPORTTITLE:
PROJECT:CLIENT LOGO:
FIGURE NO:
IMPERIAL METALSNOTE:1. BASE DRAWING FROM KNIGHT
PIÈSOLD LTD., '100_r0.dwg' AND'dam!clip.dwg'.
REV. NO:
2011AB.01
PROJECT NO:
VM00560
A
CLIENT: DWN BY:
CHK'D BY:
MARCH 2012
DATE:
SCALE:
DO
AS SHOWN
BB
STAGE 7 TAILINGS EMBANKMENT2011 AS!BUILT
GENERAL SITE PLAN
Suite 600 ! 4445 Lougheed HighwayBurnaby, BC V5C 0E4
Tel. 604!294!3811 Fax 604!294!4664
AMEC Environment & Infrastructure

0m 100 200 300 400
UTM Zone 10
PROJECTION:
NAD83
DATUM:
MOUNT POLLEY MINE
TAILINGS STORAGE FACILITY
2011 AS BUILT / ANNUAL REVIEW REPORTTITLE:
PROJECT:CLIENT LOGO:
FIGURE NO:
IMPERIAL METALS
NOTES:
1. BASE DRAWING FROM KP DRAWINGS 102_R0.dwg' AND
'dam clip.dwg'.
2. FOR MATERIAL SPECIFICATIONS SEE AB2011.03
3. S.O.L. SETTING OUT LINE
REV. NO:
2011AB.02
PROJECT NO:
VM00560
A
CLIENT: DWN BY:
CHK'D BY:
MARCH 2012
DATE:
SCALE:
DO
AS SHOWN
BB
STAGE 7 TAILINGS EMBANKMENT
2011 AS BUILT
PLAN VIEW
Suite 600 4445 Lougheed Highway
Burnaby, BC V5C 0E4
Tel. 604 294 3811 Fax 604 294 4664
AMEC Environment & Infrastructure
LEGEND:
Upstream Fill Transition
Till Core Rock Fill
Filter
U
S
F
T
C
N/A
PROJECTION:
N/A
DATUM:
MOUNT POLLEY MINE
TAILINGS STORAGE FACILITY
2011 AS�BUILT / ANNUAL REVIEW REPORTTITLE:
PROJECT:CLIENT LOGO:
FIGURE NO:
IMPERIAL METALS
NOTE:
1. ASTM STANDARDS ARE ATTACHED IN
APPENDIX C.
REV. NO:
2011AB.03
PROJECT NO:
VM00560
A
CLIENT: DWN BY:
CHK'D BY:
MARCH 2012
DATE:
SCALE:
DO
NTS
BB
TAILINGS STORAGE FACILITY
CONSTRUCTION:
NOTES AND SPECIFICATIONS
Suite 600 � 4445 Lougheed Highway
Burnaby, BC V5C 0E4
Tel. 604�294�3811 Fax 604�294�4664
AMEC Environment & Infrastructure
0m 1 32 4 5 6
100m 5 2015SECTION A(AB2011.02)
DETAIL 1
SEE DETAIL 1
N/A
PROJECTION:
N/A
DATUM:
MOUNT POLLEY MINE
TAILINGS STORAGE FACILITY
2011 AS"BUILT / ANNUAL REVIEW REPORTTITLE:
PROJECT:CLIENT LOGO:
FIGURE NO:
IMPERIAL METALS
NOTES:
1. PREVIOUS RAISES FROM KP DRAWING 215_R0.DWG
2. FOR MATERIAL SPECIFICATIONS SEE AB2011.03
3. S.O.L. " SETTING OUT LINE
REV. NO:
2011AB.04
PROJECT NO:
VM00560
A
CLIENT: DWN BY:
CHK'D BY:
MARCH 2012
DATE:
SCALE:
DO
AS SHOWN
BB
STAGE 7 MAIN EMBANKMENT
2011 AS"BUILT
SECTION A (20+60)
Suite 600 " 4445 Lougheed Highway
Burnaby, BC V5C 0E4
Tel. 604"294"3811 Fax 604"294"4664
AMEC Environment & Infrastructure
LEGEND:
Stage 7 Expansion Till Core
Approximate Filter
Design Line Transition
Upstream Fill Rock FillU
S
F
T
C

0m 1 32 4 5 6
100m 5 2015SECTION D(AB2011.02)
DETAIL 1
SEE DETAIL 1
N/A
PROJECTION:
N/A
DATUM:
MOUNT POLLEY MINE
TAILINGS STORAGE FACILITY
2011 AS"BUILT / ANNUAL REVIEW REPORTTITLE:
PROJECT:CLIENT LOGO:
FIGURE NO:
IMPERIAL METALS
NOTES:
1. PREVIOUS RAISES FROM KP DRAWING 225_R0.DWG
2. FOR MATERIAL SPECIFICATIONS SEE AB2011.03
3. S.O.L. " SETTING OUT LINE
REV. NO:
2011AB.05
PROJECT NO:
VM00560
A
CLIENT: DWN BY:
CHK'D BY:
MARCH 2012
DATE:
SCALE:
DO
AS SHOWN
BB
STAGE 7 PERIMETER EMBANKMENT
2011 AS"BUILT
SECTION D (39+90)
Suite 600 " 4445 Lougheed Highway
Burnaby, BC V5C 0E4
Tel. 604"294"3811 Fax 604"294"4664
AMEC Environment & Infrastructure
LEGEND:
Stage 7 Expansion Till Core
Approximate Filter
Design Line Transition
Upstream Fill Rock Fill
S
F
T
C

SEE DETAIL 1
SECTION F(SEE AB2011.02)
DETAIL 1
0m 2 4 86
0m 3 6 9 12
N/A
PROJECTION:
N/A
DATUM:
MOUNT POLLEY MINE
TAILINGS STORAGE FACILITY
2011 AS#BUILT / ANNUAL REVIEW REPORTTITLE:
PROJECT:CLIENT LOGO:
FIGURE NO:
IMPERIAL METALS
NOTE:
1. PREVIOUS RAISES BASED FROM KP DRAWING 235_r0.dwg
2. FOR MATERIAL SPECIFICATIONS SEE AB2011.03
3. S.O.L. # SETTING OUT LINE
REV. NO:
2011AB.06
PROJECT NO:
VM00560
A
CLIENT: DWN BY:
CHK'D BY:
MARCH 2012
DATE:
SCALE:
DO
AS SHOWN
BB
STAGE 7 SOUTH EMBANKMENT
2011 AS#BUILT
SECTION F (7+20)
Suite 600 # 4445 Lougheed Highway
Burnaby, BC V5C 0E4
Tel. 604#294#3811 Fax 604#294#4664
AMEC Environment & Infrastructure
LEGEND:
Stage 7 Expansion Till Core
Approximate Filter
Design Line Transition
Upstream Fill Rock FillU
S
F
T
C

0m 100 200 300 400
UTM Zone 10
PROJECTION:
NAD83
DATUM:
MOUNT POLLEY MINE
TAILINGS STORAGE FACILITY
2011 AS BUILT / ANNUAL REVIEW REPORTTITLE:
PROJECT:CLIENT LOGO:
FIGURE NO:
IMPERIAL METALS
NOTES:
1. BASE DATA FROM KP DRAWINGS 102_R0.dwg', 'dam clip.dwg' AND
2011 AIRBORNE SURVEY PROVIDED BY MPMC.
2. S.O.L. SETTING OUT LINE
REV. NO:
2011AB.07
PROJECT NO:
VM00560
A
CLIENT: DWN BY:
CHK'D BY:
MARCH 2012
DATE:
SCALE:
DO
AS SHOWN
BB
TAILINGS STORAGE FACILITY
INSTRUMENTATION
PLAN VIEW
Suite 600 4445 Lougheed Highway
Burnaby, BC V5C 0E4
Tel. 604 294 3811 Fax 604 294 4664
AMEC Environment & Infrastructure
LEGEND:
Slope Inclinometer Location
Vibrating Wire Location


APPENDIX A
MATERIAL TESTING RESULTS

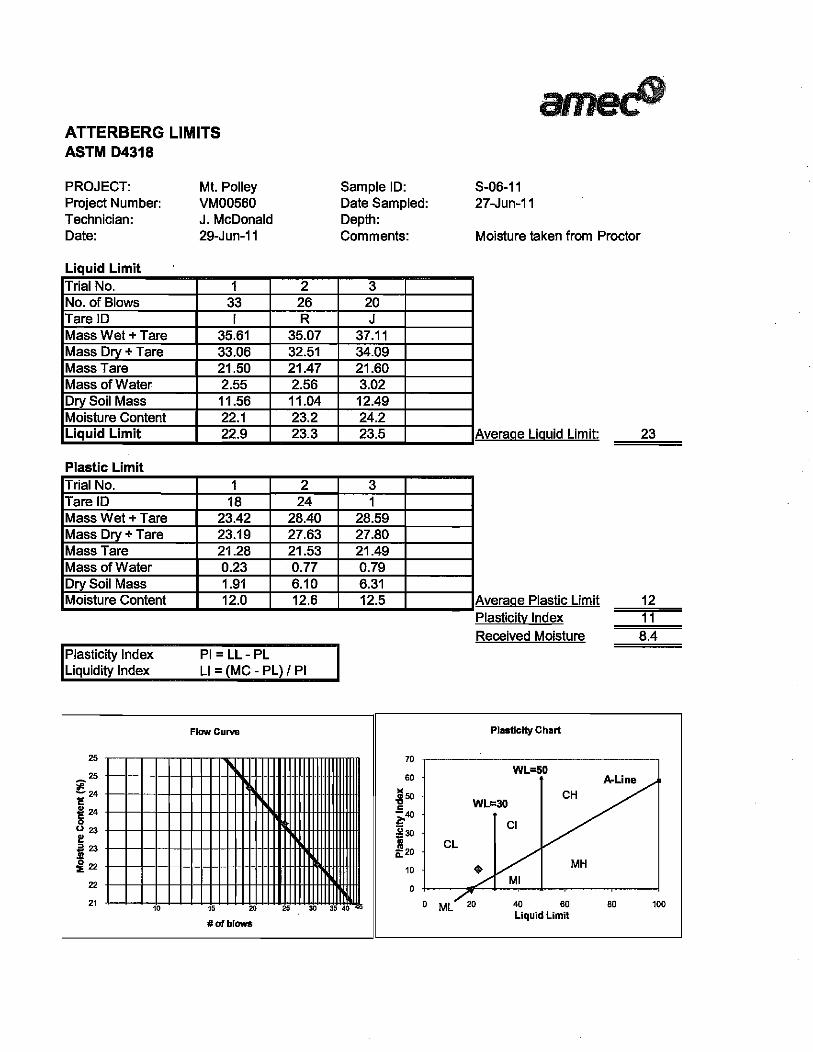
ZONE S – Till Core Testing Results

Mt. Polley MineTailings Storage Facility2011 As-built/Annual Review Report
March 2012
3" 2" 1"11/2" 3/4" 1/2" 3/8" #4 #10 #20 #40 #60 #100 #200
50
60
70
80
90
100
RC
EN
T P
AS
SIN
G
US STANDARD SIEVE SIZESSIEVE OPENING IN INCHES
GRAVEL
Coarse Coarse CoarseCOBBLES
SAND SILTCLAY
Fine Fine FineMedium Medium
ZONE S
0
10
20
30
40
0.0010.010.1110100
PE
GRAIN SIZE IN MILLIMETERS
Perimeter Borrow
Barge Borrow

Mout Polley MineTailings Storage Facility2011 As-built/Annual Review Report
March 2012
30
40
50
60
70
Pla
stic
ity
Ind
ex (
%)
A - Line
CH
MHCI
Mt. Polley Till Plasticity Chart
0
10
20
0 10 20 30 40 50 60 70 80 90 100
P
Liquid Limit (%)
OH
OL
MLCL - ML
CL
ML

0
5
10
15
20
25
30
35
40
45
95 96 97 98 99 100 101 102 103 104 >104
Number of Tests
Compaction (%)
Zone S % Compaction Distibution
MDI (234) ND (43)
120
140
Zone S Moisture Content Distribution
0
20
40
60
80
100
120
>9 9‐10 10‐11 11‐12 >12
Number of Tests
Moisture (%)
MDI (234) ND (43)

1
2
3
4
5
6
7
8
9
10
11
12
13
14
15
16
17
18
19
20
21
22
23
24
25
26
27
28
29
30
31
32
33
34
35
36
37
38
39
40
41
42
43
44
A B C D E F G H I J K L M
Test # Date Tested Stn Offset S/F Elevation Northing Easting Max Density Wet Density Dry Density Moisture Density % Pass
ND 1 21-Jun-11 15.10 3 958.20 - - 2062 2255 2029 11.1 98% YES
ND 2 21-Jun-11 15.10 2 958.20 - - 2062 2298 2069 11.0 100% YES
ND 3 21-Jun-11 14.27 4 958.20 - - 2062 2276 2069 10.0 100% YES
ND 4 21-Jun-11 13.25 1 958.20 - - 2062 2333 2113 10.4 102% YES
ND 5 21-Jun-11 11.75 3 958.20 - - 2062 2331 2145 8.6 104% YES
ND 6 21-Jun-11 10.25 4 958.20 - - 2062 2323 2126 9.3 103% YES
ND 7 21-Jun-11 8.75 1 958.20 - - 2062 2281 2061 10.7 100% YES
ND 8 21-Jun-11 7.25 4.5 958.20 - - 2062 2358 2149 9.7 104% YES
ND 9 21-Jun-11 5.75 3 958.20 - - 2062 2284 2054 11.2 100% YES
ND 10 21-Jun-11 5.25 1 958.20 - - 2062 2205 1986 10.9 96% YES
ND 11 22-Jun-11 15.00 1 958.36 5818262 595179 2062 2274 2053 10.8 100% YES
ND 12 22-Jun-11 13.50 4 958.38 5818320 595045 2062 2214 1990 11.2 97% YES
ND 13 22-Jun-11 12.00 3 958.45 5818375 594902 2062 2258 2053 10 100% YES
ND 14 22-Jun-11 10.50 1.5 958.40 5818426 594768 2062 2320 2100 10.5 102% YES
ND 15 22-Jun-11 9.00 4 958.41 5818485 594624 2062 2190 1968 11.3 95% YES
ND 16 23-Jun-11 9.00 1 958.41 5818485 594624 2062 2276 2051 11 99% YES
ND 17 23-Jun-11 7.50 2.5 958.34 5818536 594489 2062 2292 2051 11.7 99% YES
ND 18 23-Jun-11 6.50 4 958.36 5818575 594394 2062 2305 2062 11.7 100% YES
ND 19 26-Jun-11 15.20 1 958.58 5818258 595195 2062 2294 2066 11 100% YES
ND 20 26-Jun-11 13.70 3 958.62 5818314 595058 2062 2319 2113 9.7 102% YES
ND 21 26-Jun-11 12.30 4.5 958.55 5818365 594932 2062 2179 1958 11.6 95% YES
ND 22 27-Jun-11 10.80 2.5 958.43 5818420 594787 2062 2322 2120 9.5 103% YES
ND 23 27-Jun-11 9.30 0.5 958.43 5818473 594644 2062 2294 2091 9.7 101% YES
ND 24 27-Jun-11 7.80 4.5 958.42 5818529 594513 2062 2294 2080 10.3 101% YES
ND 25 27-Jun-11 6.35 3 958.54 5818581 594373 2062 2314 2094 10.5 102% YES
ND 26 27-Jun-11 5.50 1 958.48 5818609 594298 2062 2287 2083 9.8 101% YES
ND 27 27-Jun-11 26.90 5 958.14 5818915 596140 2062 2307 2072 11.3 100% YES
ND 28 27-Jun-11 25.50 3.5 958.20 5818830 596030 2062 2302 2110 9.1 102% YES
ND 29 27-Jun-11 24.00 3 958.23 5818739 595909 2062 2252 2037 10.6 99% YES
ND 30 27-Jun-11 22.50 1 958.32 5818649 595791 2062 2308 2081 10.9 101% YES
ND 31 27-Jun-11 21.45 4.5 958.21 5818585 595702 2062 2244 2012 11.5 98% YES
ND 32 25-Jul-11 36.00 3.5 958.68 5819542 595604 2062 2318 2107 10 102% YES
ND 33 25-Jul-11 12.05 2.5 958.69 5818373 594908 2062 2289 2103 8.8 102% YES
ND 34 19-Aug-11 19.60 4 959.40 5818479 595562 2062 2297 2087 10 101% YES
ND 35 19-Aug-11 18.30 1 959.32 5818399 595460 2062 2302 2093 10 101% YES
ND 36 19-Aug-11 17.00 3 959.41 5818322 595353 2062 2297 2085 10.1 101% YES
ND 37 19-Aug-11 15.70 0.5 959.34 5818245 595245 2062 2267 2045 10.8 99% YES
ND 38 21-Aug-11 20.00 2.5 595.80 5818562 595992 2062 2217 1964 12.8 95% YES
ND 39 23-Aug-11 30.00 0.5 959.20 5819105 596106 2062 2297 2059 11.5 100% YES
ND 40 23-Aug-11 4.90 2 960.00 - - 2062 2276 1993 10.4 97% YES
ND 41 24-Aug-11 48.20 -10 960.00 5820031 594562 2062 2265 2019 12.1 98% YES
ND 42 24-Aug-11 48.20 -15 960.00 5820038 544569 2062 2349 2049 14.6 99% YES
ND 43 24-Aug-11 48.20 3 960.00 - - 2062 2313 2047 12.9 99% YES

Mt. Polley on‐site till moisture tests
Sample # Date Pan Tare (g)Total Weight of
Sample Wet (g)
Weight of >19mm
(g)
Wet Sample + Tare
(Min 700g)
Dry Sample + Tare
(g)
Total Weight of
Sample Dry (g)
Oversize
(%)Moisture (%)
1 25‐Jul‐11 174.14 2209.50 119.20 862.95 802.65 2016.08 5.9% 9.6%
2 27‐Jul‐11 183.35 1586.72 29.45 831.73 767.58 1429.73 2.1% 11.0%
3 27‐Jul‐11 178.04 3339.6 102.27 910.9 840.76 3019.98 3.4% 10.6%
4 30‐Jul‐11 164.31 2481.12 127.59 705.37 637.1 2168.06 5.9% 14.4%
5 30‐Jul‐11 171.73 1896.19 167.23 860.09 787.5 1696.23 9.9% 11.8%
6 02‐Aug‐11 178.08 2393.06 138.62 865 780.11 2097.32 6.6% 14.1%
7 12‐Aug‐11 178.06 2189.74 82.6 759.42 702.7 1976.10 4.2% 10.8%
8 13‐Aug‐11 182.59 1518.14 77.37 782.34 726.2 1376.03 5.6% 10.3%
9 14‐Aug‐11 174.31 2622.02 185.94 786.65 723.88 2353.24 7.9% 11.4%


ZONE F – Filter Testing Results
Mt. Polley MineTailings Storage Facility2011 As-built/Annual Review Report
March 2012
3" 2" 1"11/2" 3/4" 1/2" 3/8" #4 #10 #20 #40 #60 #100 #200
50
60
70
80
90
100
RC
EN
T P
AS
SIN
G
AMEC Test Results
MPMC Test Results
US STANDARD SIEVE SIZESSIEVE OPENING IN INCHES
GRAVEL
Coarse Coarse CoarseCOBBLES
SAND SILTCLAY
Fine Fine FineMedium Medium
ZONE F
0
10
20
30
40
0.0010.010.1110100
PE
GRAIN SIZE IN MILLIMETERS


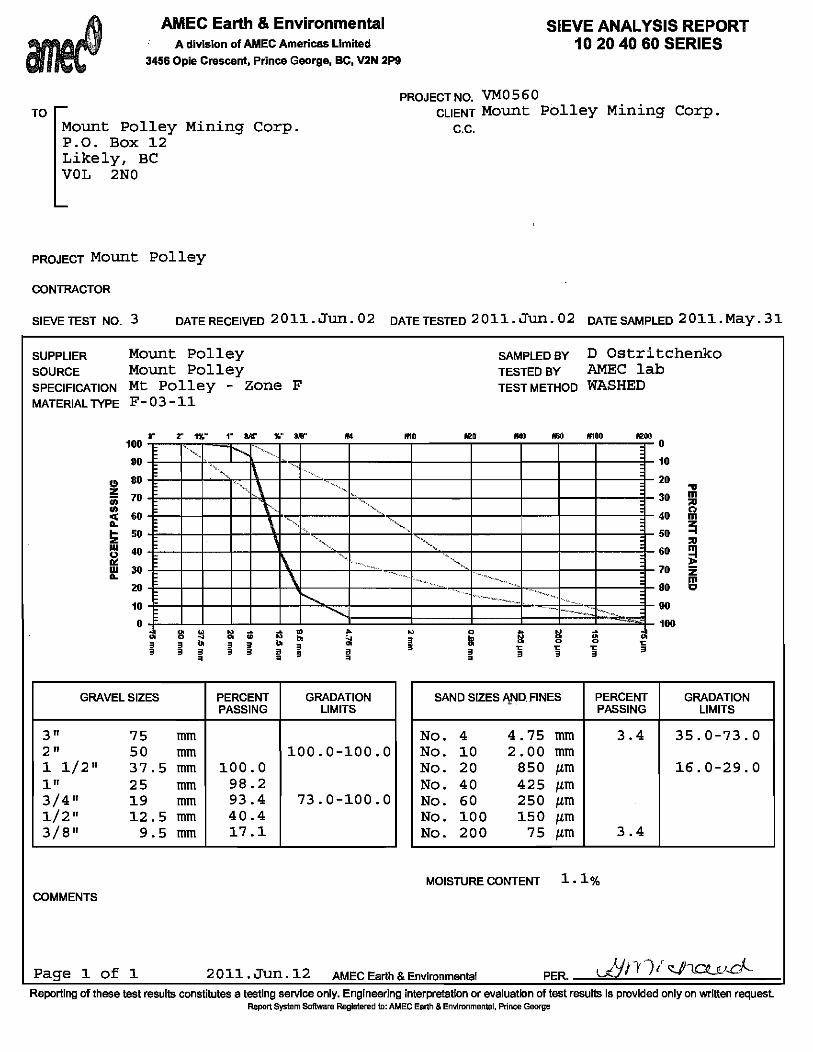


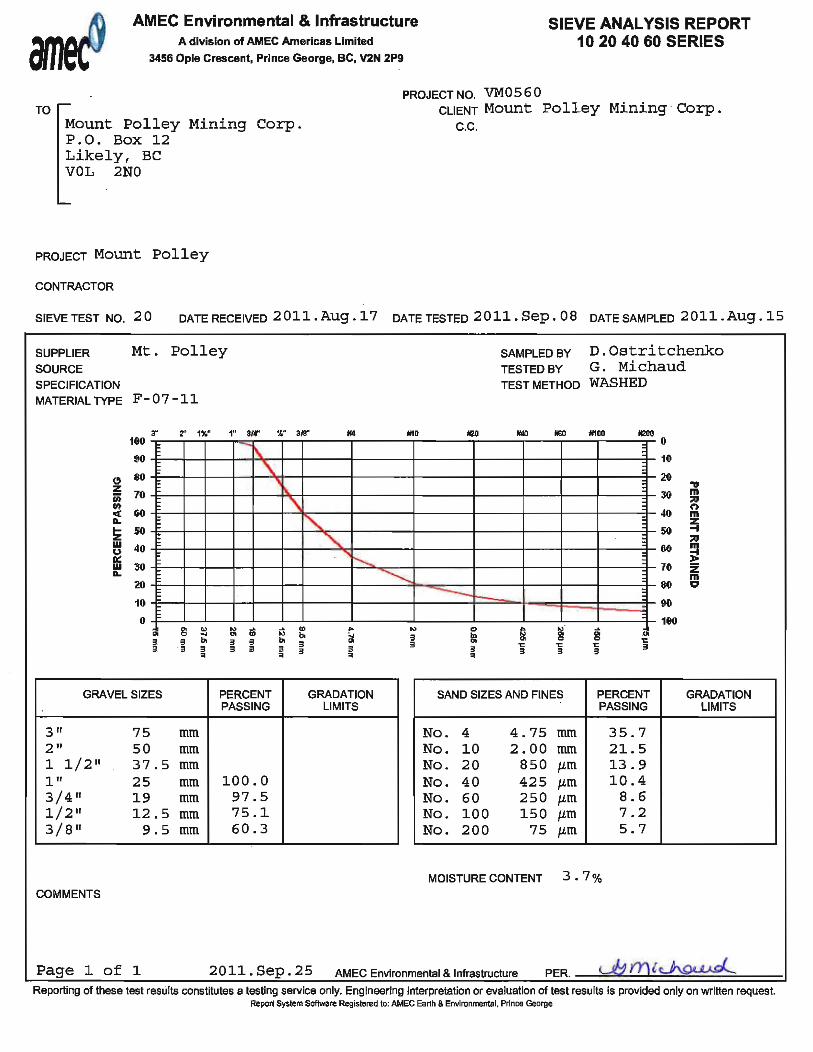


ZONE T – Transition Testing Results
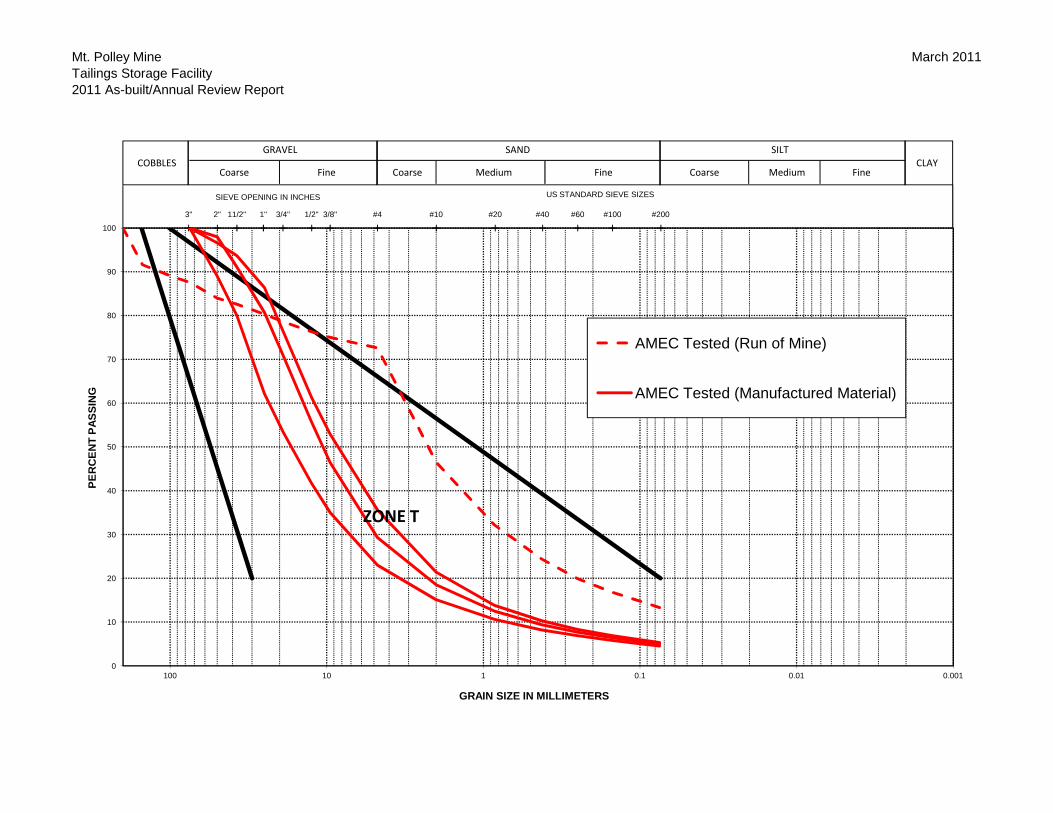
Mt. Polley MineTailings Storage Facility2011 As-built/Annual Review Report
March 2011
3" 2" 1"11/2" 3/4" 1/2" 3/8" #4 #10 #20 #40 #60 #100 #200
50
60
70
80
90
100
RC
EN
T P
AS
SIN
G
AMEC Tested (Run of Mine)
AMEC Tested (Manufactured Material)
US STANDARD SIEVE SIZESSIEVE OPENING IN INCHES
GRAVEL
Coarse Coarse CoarseCOBBLES
SAND SILTCLAY
Fine Fine FineMedium Medium
0
10
20
30
40
0.0010.010.1110100
PE
GRAIN SIZE IN MILLIMETERS
ZONE T


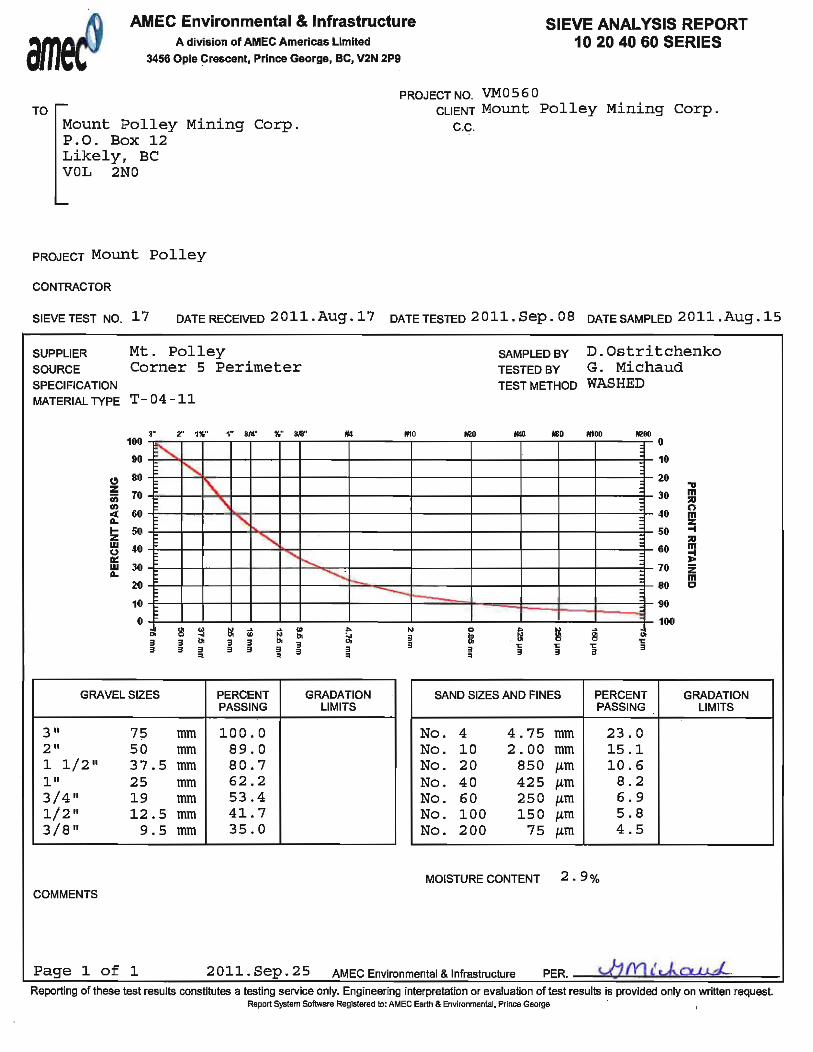

APPENDIX B
INSTRUMENTATION PLOTS

Inclinometer Plots
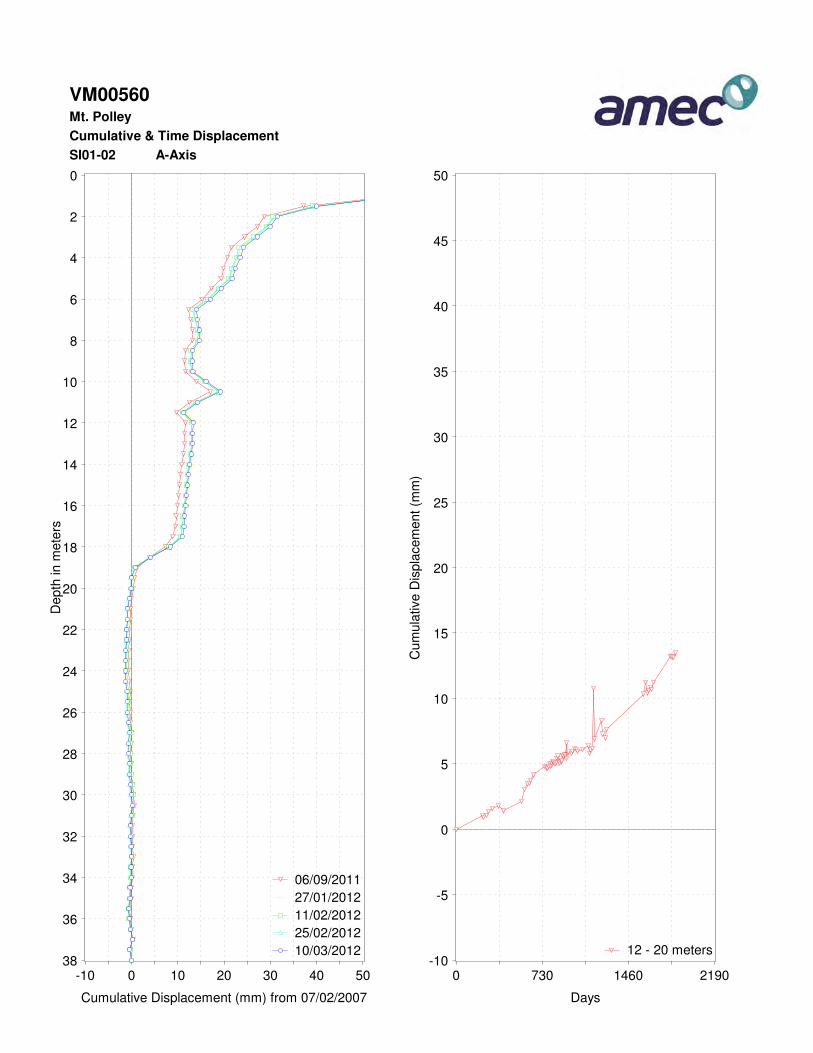
VM00560Mt. Polley
Cumulative & Time Displacement
SI01-02 A-Axis
0
2
4
6
8
10
12
14
16
18
20
22
24
26
28
30
32
34
36
38
Depth
in m
ete
rs
-10 0 10 20 30 40 50
Cumulative Displacement (mm) from 07/02/2007
06/09/2011
27/01/2012
11/02/2012
25/02/2012
10/03/2012
0 730 1460 2190
Days
-10
-5
0
5
10
15
20
25
30
35
40
45
50
Cum
ula
tive D
ispla
cem
ent
(mm
)
12 - 20 meters
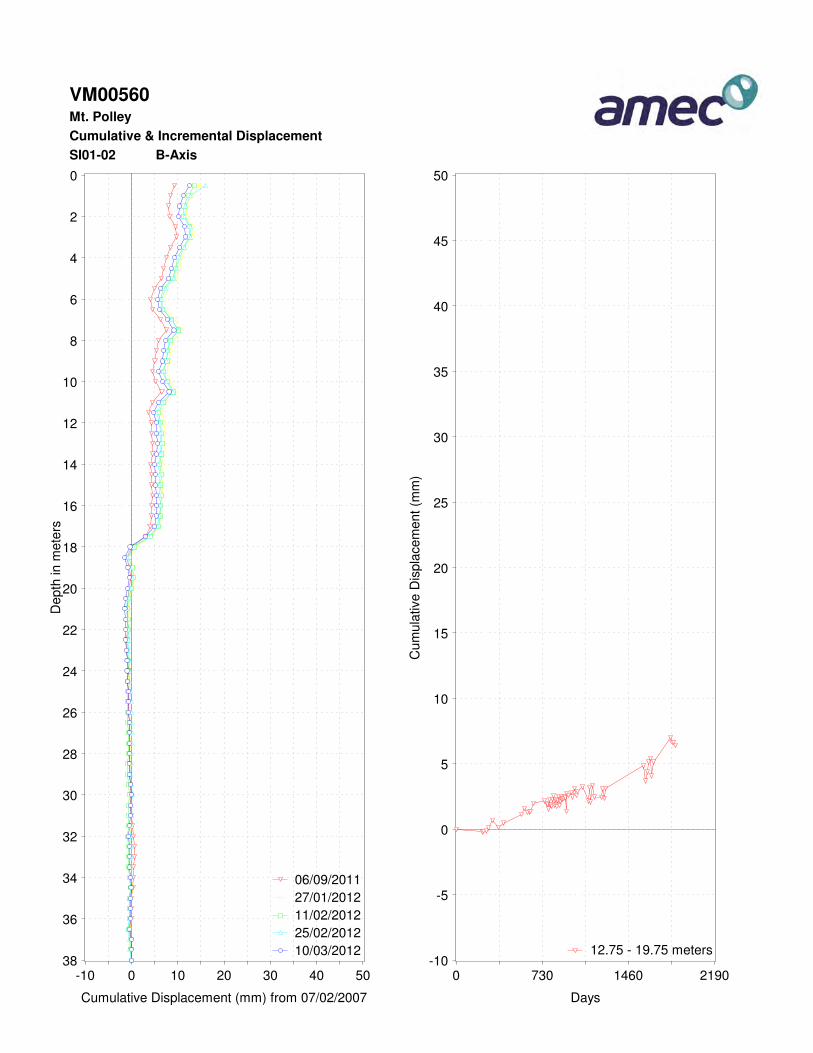
VM00560Mt. Polley
Cumulative & Incremental Displacement
SI01-02 B-Axis
0
2
4
6
8
10
12
14
16
18
20
22
24
26
28
30
32
34
36
38
Depth
in m
ete
rs
-10 0 10 20 30 40 50
Cumulative Displacement (mm) from 07/02/2007
06/09/2011
27/01/2012
11/02/2012
25/02/2012
10/03/2012
0 730 1460 2190
Days
-10
-5
0
5
10
15
20
25
30
35
40
45
50
Cum
ula
tive D
ispla
cem
ent
(mm
)
12.75 - 19.75 meters
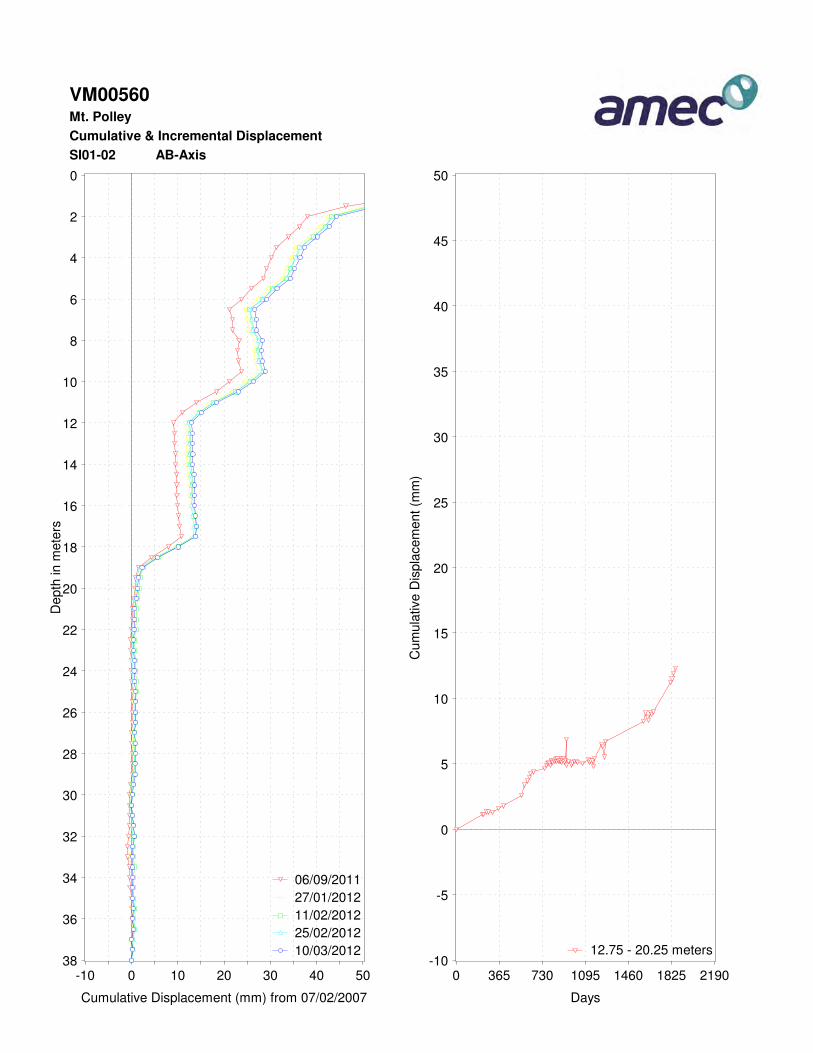
VM00560Mt. Polley
Cumulative & Incremental Displacement
SI01-02 AB-Axis
0
2
4
6
8
10
12
14
16
18
20
22
24
26
28
30
32
34
36
38
Depth
in m
ete
rs
-10 0 10 20 30 40 50
Cumulative Displacement (mm) from 07/02/2007
06/09/2011
27/01/2012
11/02/2012
25/02/2012
10/03/2012
0 365 730 1095 1460 1825 2190
Days
-10
-5
0
5
10
15
20
25
30
35
40
45
50
Cum
ula
tive D
ispla
cem
ent
(mm
)
12.75 - 20.25 meters

VM00560Mt. Polley
Cumulative & Time Displacement
SI06-01 A-Axis
0
5
10
15
20
25
30
35
40
45
Depth
in m
ete
rs
-10 0 10 20 30 40 50
Cumulative Displacement (mm) from 01/02/2007
17/06/2011
01/07/2011
15/07/2011
31/07/2011
13/08/2011
0 730 1460 2190
Days
-10
-5
0
5
10
15
20
25
30
35
40
45
50
Cum
ula
tive D
ispla
cem
ent
(mm
)
0.5 - 43.5 meters

VM00560Mt. Polley
Cumulative & Time Displacement
SI06-01 B-Axis
0
5
10
15
20
25
30
35
40
45
Depth
in m
ete
rs
-10 0 10 20 30 40 50
Cumulative Displacement (mm) from 01/02/2007
17/06/2011
01/07/2011
15/07/2011
31/07/2011
13/08/2011
0 730 1460 2190
Days
-10
-5
0
5
10
15
20
25
30
35
40
45
50
Cum
ula
tive D
ispla
cem
ent
(mm
)
0.5 - 43.5 meters

VM00560Mt. Polley
Cumulative & Time Displacement
SI06-01 AB-Axis
0
5
10
15
20
25
30
35
40
45
Depth
in m
ete
rs
-10 0 10 20 30 40 50
Cumulative Displacement (mm) from 01/02/2007
17/06/2011
01/07/2011
15/07/2011
31/07/2011
13/08/2011
0 730 1460 2190
Days
-10
-5
0
5
10
15
20
25
30
35
40
45
50
Cum
ula
tive D
ispla
cem
ent
(mm
)
0.5 - 43.5 meters
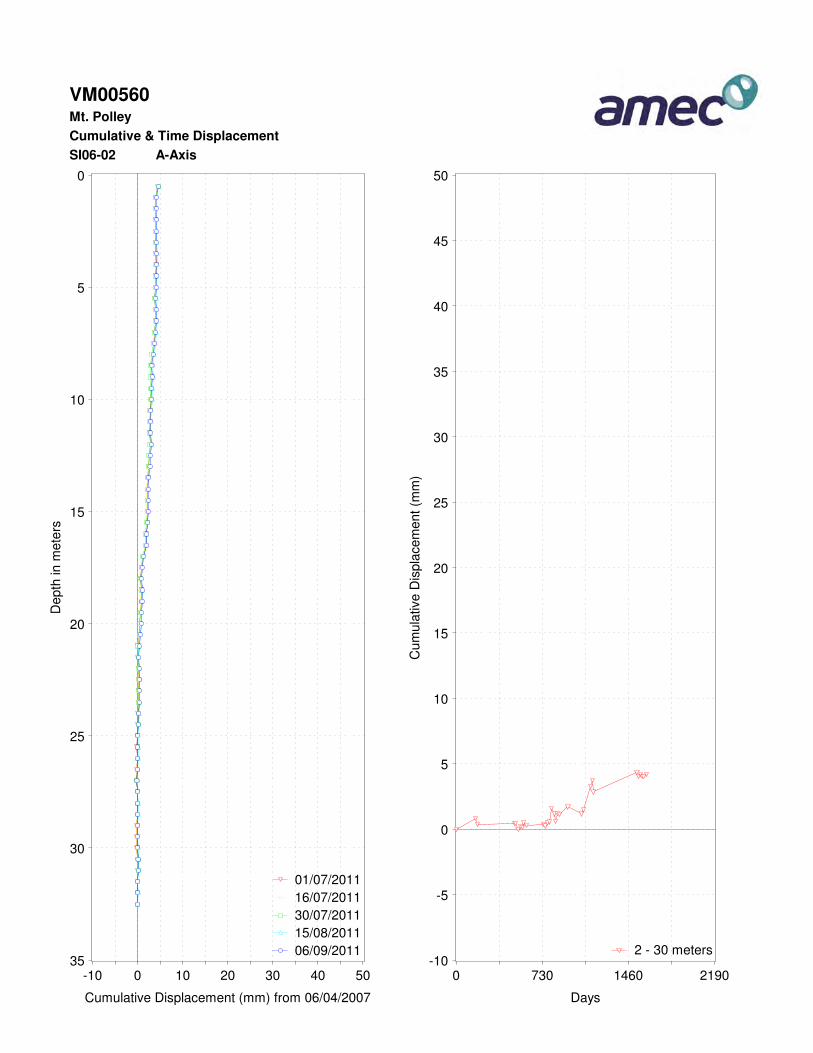
VM00560Mt. Polley
Cumulative & Time Displacement
SI06-02 A-Axis
0
5
10
15
20
25
30
35
Depth
in m
ete
rs
-10 0 10 20 30 40 50
Cumulative Displacement (mm) from 06/04/2007
01/07/2011
16/07/2011
30/07/2011
15/08/2011
06/09/2011
0 730 1460 2190
Days
-10
-5
0
5
10
15
20
25
30
35
40
45
50
Cum
ula
tive D
ispla
cem
ent
(mm
)
2 - 30 meters

VM00560Mt. Polley
Cumulative & Time Displacement
SI06-02 B-Axis
0
5
10
15
20
25
30
35
Depth
in m
ete
rs
-10 0 10 20 30 40 50
Cumulative Displacement (mm) from 06/04/2007
01/07/2011
16/07/2011
30/07/2011
15/08/2011
06/09/2011
0 730 1460 2190
Days
-10
-5
0
5
10
15
20
25
30
35
40
45
50
Cum
ula
tive D
ispla
cem
ent
(mm
)
0.5 - 30 meters

VM00560Mt. Polley
Cumulative & Time Displacement
SI06-02 AB-Axis
0
5
10
15
20
25
30
35
Depth
in m
ete
rs
-10 0 10 20 30 40 50
Cumulative Displacement (mm) from 06/04/2007
01/07/2011
16/07/2011
30/07/2011
15/08/2011
06/09/2011
0 730 1460 2190
Days
-10
-5
0
5
10
15
20
25
30
35
40
45
50
Cum
ula
tive D
ispla
cem
ent
(mm
)
0.5 - 30 meters

VM00560Mt. Polley
Cumulative & Time Displacement
SI06-03 A-Axis
0
5
10
15
20
25
30
35
40
45
Depth
in m
ete
rs
-10 0 10 20 30 40 50
Cumulative Displacement (mm) from 05/08/2006
15/01/2012
24/01/2012
11/02/2012
26/02/2012
11/03/2012
0 730 1460 2190
Days
-10
-5
0
5
10
15
20
25
30
35
40
45
50
Cum
ula
tive D
ispla
cem
ent
(mm
)
4 - 40 meters

VM00560Mt. Polley
Cumulative & Time Displacement
SI06-03 B-Axis
0
5
10
15
20
25
30
35
40
45
Depth
in m
ete
rs
-10 0 10 20 30 40 50
Cumulative Displacement (mm) from 05/08/2006
15/01/2012
24/01/2012
11/02/2012
26/02/2012
11/03/2012
0 730 1460 2190
Days
-10
-5
0
5
10
15
20
25
30
35
40
45
50
Cum
ula
tive D
ispla
cem
ent
(mm
)
4 - 40 meters

VM00560Mt. Polley
Cumulative & Time Displacement
SI06-03 AB-Axis
0
5
10
15
20
25
30
35
40
45
Depth
in m
ete
rs
-10 0 10 20 30 40 50
Cumulative Displacement (mm) from 05/08/2006
15/01/2012
24/01/2012
11/02/2012
26/02/2012
11/03/2012
0 730 1460 2190
Days
-10
-5
0
5
10
15
20
25
30
35
40
45
50
Cum
ula
tive D
ispla
cem
ent
(mm
)
4 - 40 meters
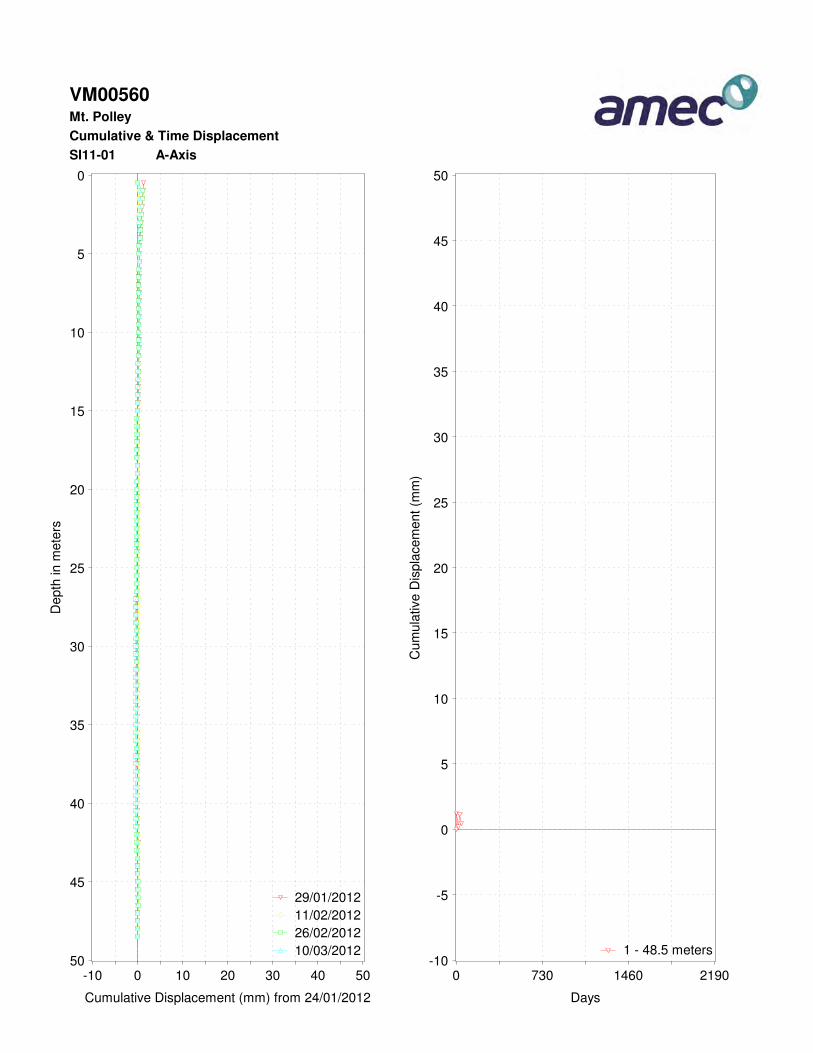
VM00560Mt. Polley
Cumulative & Time Displacement
SI11-01 A-Axis
0
5
10
15
20
25
30
35
40
45
50
Depth
in m
ete
rs
-10 0 10 20 30 40 50
Cumulative Displacement (mm) from 24/01/2012
29/01/2012
11/02/2012
26/02/2012
10/03/2012
0 730 1460 2190
Days
-10
-5
0
5
10
15
20
25
30
35
40
45
50
Cum
ula
tive D
ispla
cem
ent
(mm
)
1 - 48.5 meters
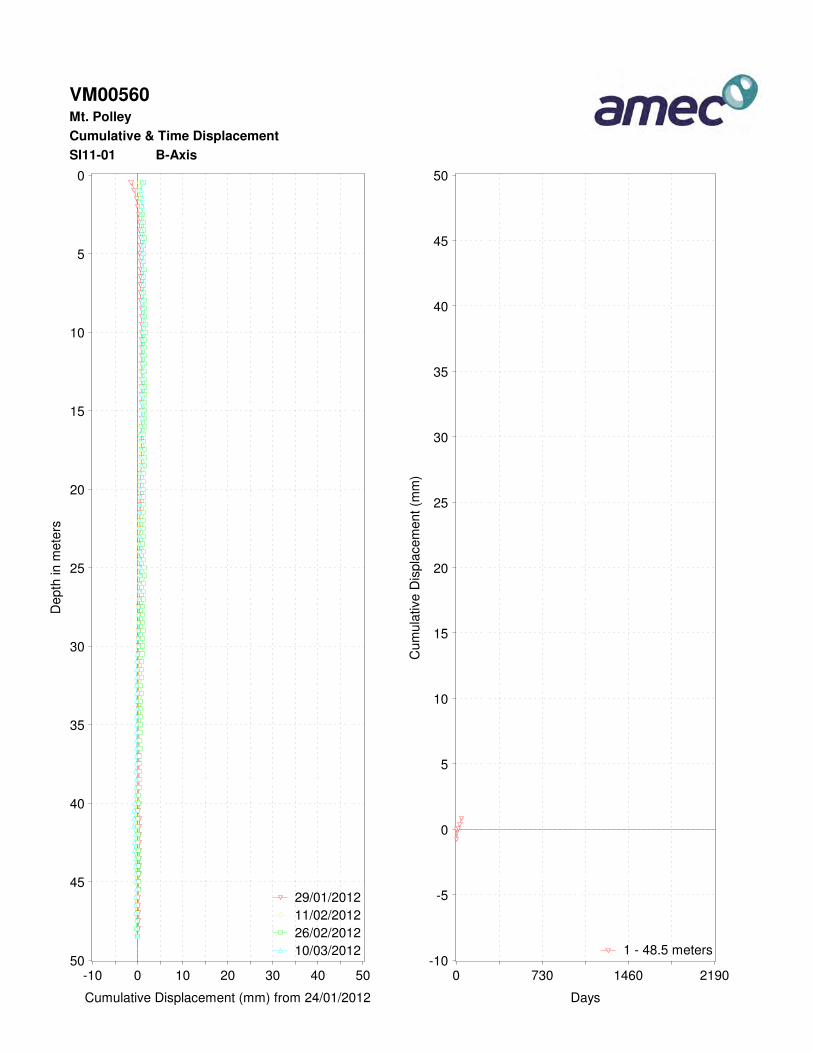
VM00560Mt. Polley
Cumulative & Time Displacement
SI11-01 B-Axis
0
5
10
15
20
25
30
35
40
45
50
Depth
in m
ete
rs
-10 0 10 20 30 40 50
Cumulative Displacement (mm) from 24/01/2012
29/01/2012
11/02/2012
26/02/2012
10/03/2012
0 730 1460 2190
Days
-10
-5
0
5
10
15
20
25
30
35
40
45
50
Cum
ula
tive D
ispla
cem
ent
(mm
)
1 - 48.5 meters

VM00560Mt. Polley
Cumulative & Time Displacement
SI11-01 AB-Axis
0
5
10
15
20
25
30
35
40
45
50
Depth
in m
ete
rs
-10 0 10 20 30 40 50
Cumulative Displacement (mm) from 24/01/2012
29/01/2012
11/02/2012
26/02/2012
10/03/2012
0 730 1460 2190
Days
-10
-5
0
5
10
15
20
25
30
35
40
45
50
Cum
ula
tive D
ispla
cem
ent
(mm
)
1 - 48.5 meters
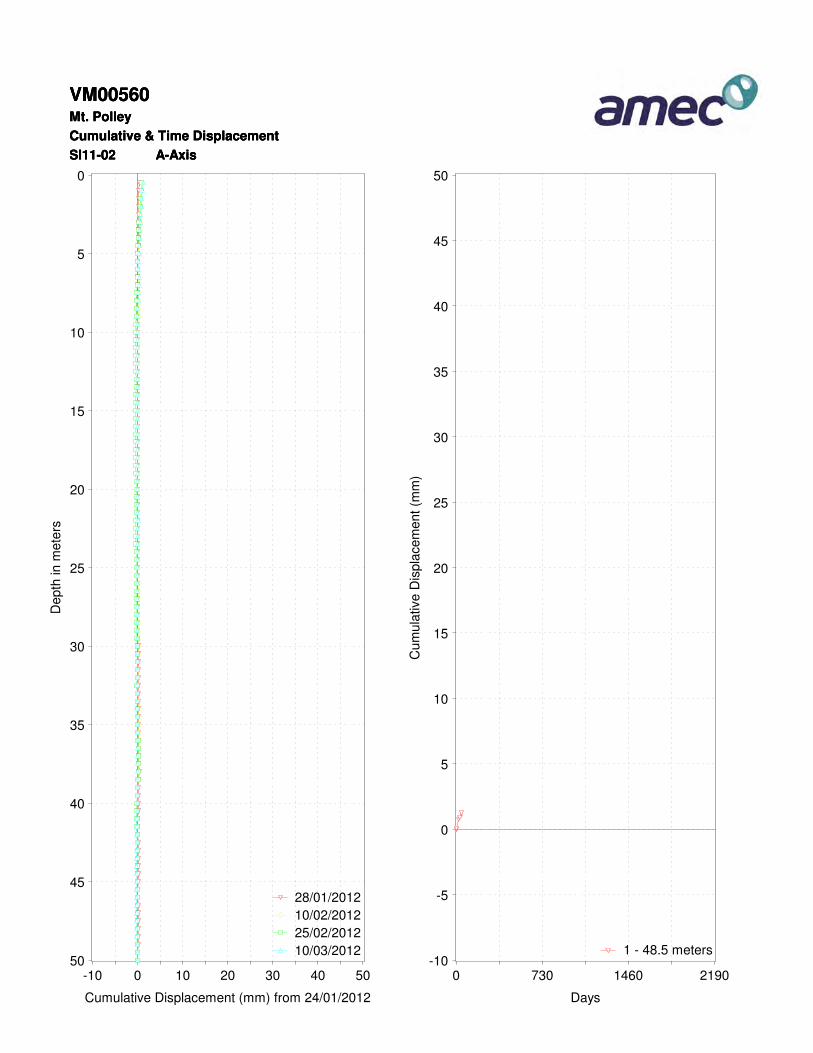
VM00560Mt. Polley
Cumulative & Time Displacement
SI11-02 A-Axis
VM00560Mt. Polley
Cumulative & Time Displacement
SI11-02 A-Axis
VM00560Mt. Polley
Cumulative & Time Displacement
SI11-02 A-Axis
0
5
10
15
20
25
30
35
40
45
50
Depth
in m
ete
rs
-10 0 10 20 30 40 50
Cumulative Displacement (mm) from 24/01/2012
28/01/2012
10/02/2012
25/02/2012
10/03/2012
0 730 1460 2190
Days
-10
-5
0
5
10
15
20
25
30
35
40
45
50
Cum
ula
tive D
ispla
cem
ent
(mm
)
1 - 48.5 meters
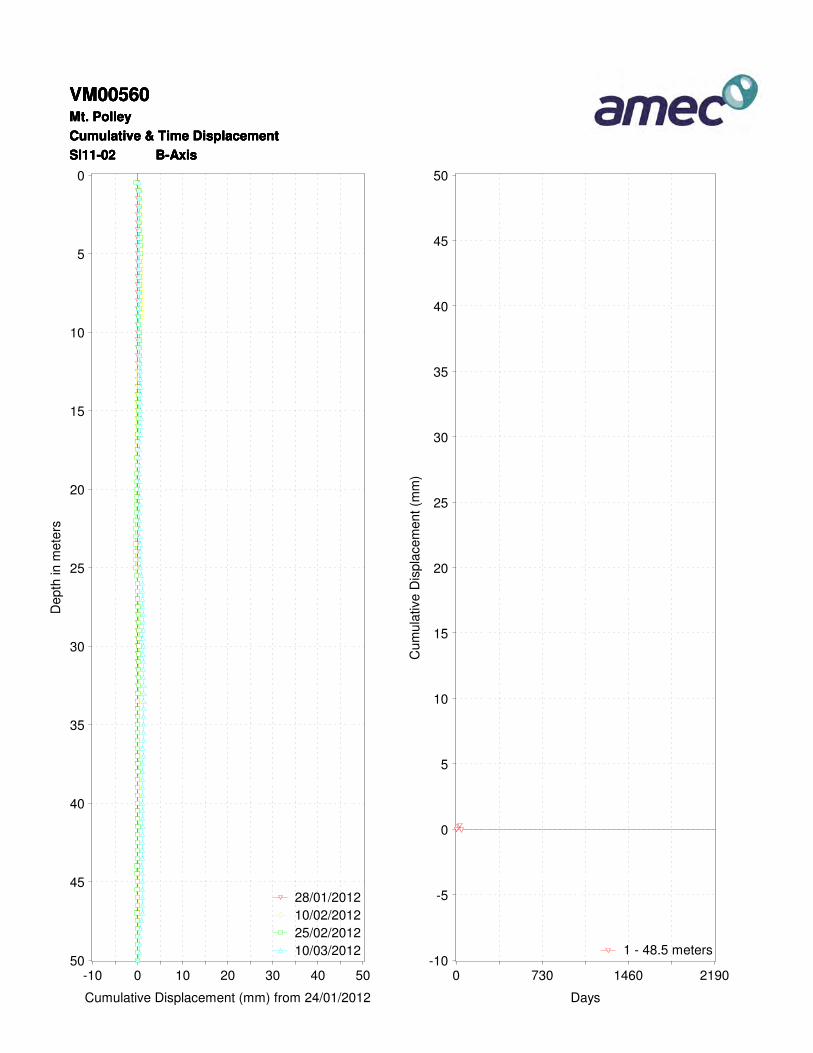
VM00560Mt. Polley
Cumulative & Time Displacement
SI11-02 B-Axis
VM00560Mt. Polley
Cumulative & Time Displacement
SI11-02 B-Axis
VM00560Mt. Polley
Cumulative & Time Displacement
SI11-02 B-Axis
VM00560Mt. Polley
Cumulative & Time Displacement
SI11-02 B-Axis
0
5
10
15
20
25
30
35
40
45
50
Depth
in m
ete
rs
-10 0 10 20 30 40 50
Cumulative Displacement (mm) from 24/01/2012
28/01/2012
10/02/2012
25/02/2012
10/03/2012
0 730 1460 2190
Days
-10
-5
0
5
10
15
20
25
30
35
40
45
50
Cum
ula
tive D
ispla
cem
ent
(mm
)
1 - 48.5 meters
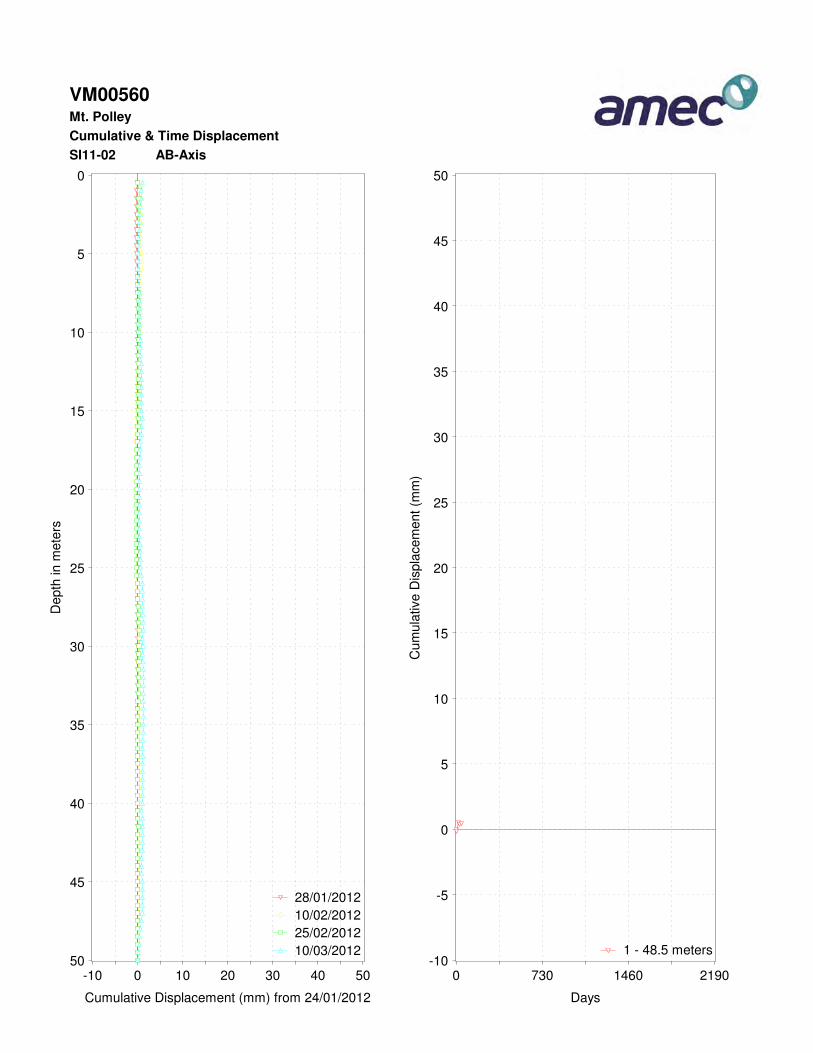
VM00560Mt. Polley
Cumulative & Time Displacement
SI11-02 AB-Axis
0
5
10
15
20
25
30
35
40
45
50
Depth
in m
ete
rs
-10 0 10 20 30 40 50
Cumulative Displacement (mm) from 24/01/2012
28/01/2012
10/02/2012
25/02/2012
10/03/2012
0 730 1460 2190
Days
-10
-5
0
5
10
15
20
25
30
35
40
45
50
Cum
ula
tive D
ispla
cem
ent
(mm
)
1 - 48.5 meters
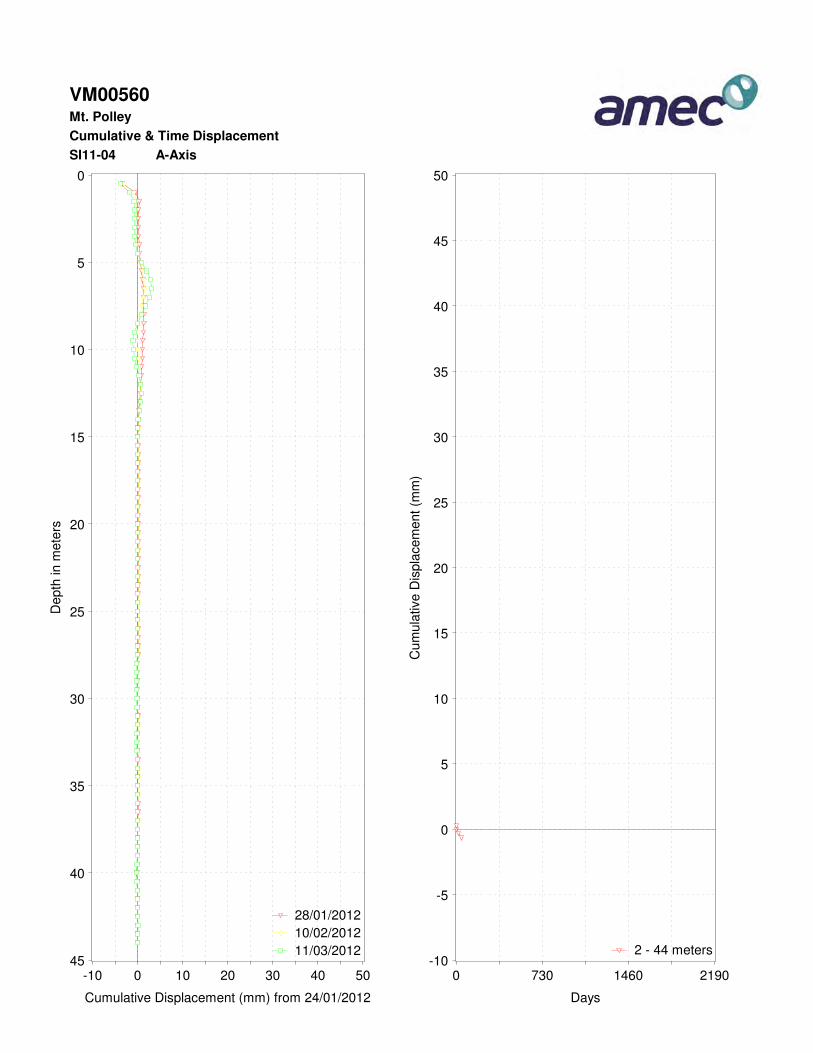
VM00560Mt. Polley
Cumulative & Time Displacement
SI11-04 A-Axis
0
5
10
15
20
25
30
35
40
45
Depth
in m
ete
rs
-10 0 10 20 30 40 50
Cumulative Displacement (mm) from 24/01/2012
28/01/2012
10/02/2012
11/03/2012
0 730 1460 2190
Days
-10
-5
0
5
10
15
20
25
30
35
40
45
50
Cum
ula
tive D
ispla
cem
ent
(mm
)
2 - 44 meters

VM00560Mt. Polley
Cumulative & Time Displacement
SI11-04 B-Axis
0
5
10
15
20
25
30
35
40
45
Depth
in m
ete
rs
-10 0 10 20 30 40 50
Cumulative Displacement (mm) from 24/01/2012
28/01/2012
10/02/2012
11/03/2012
0 730 1460 2190
Days
-10
-5
0
5
10
15
20
25
30
35
40
45
50
Cum
ula
tive D
ispla
cem
ent
(mm
)
2 - 44 meters

VM00560Mt. Polley
Cumulative & Time Displacement
SI11-04 AB-Axis
0
5
10
15
20
25
30
35
40
45
Depth
in m
ete
rs
-10 0 10 20 30 40 50
Cumulative Displacement (mm) from 24/01/2012
28/01/2012
10/02/2012
11/03/2012
0 730 1460 2190
Days
-10
-5
0
5
10
15
20
25
30
35
40
45
50
Cum
ula
tive D
ispla
cem
ent
(mm
)
2 - 44 meters

Vibrating Wire Piezometer Plots
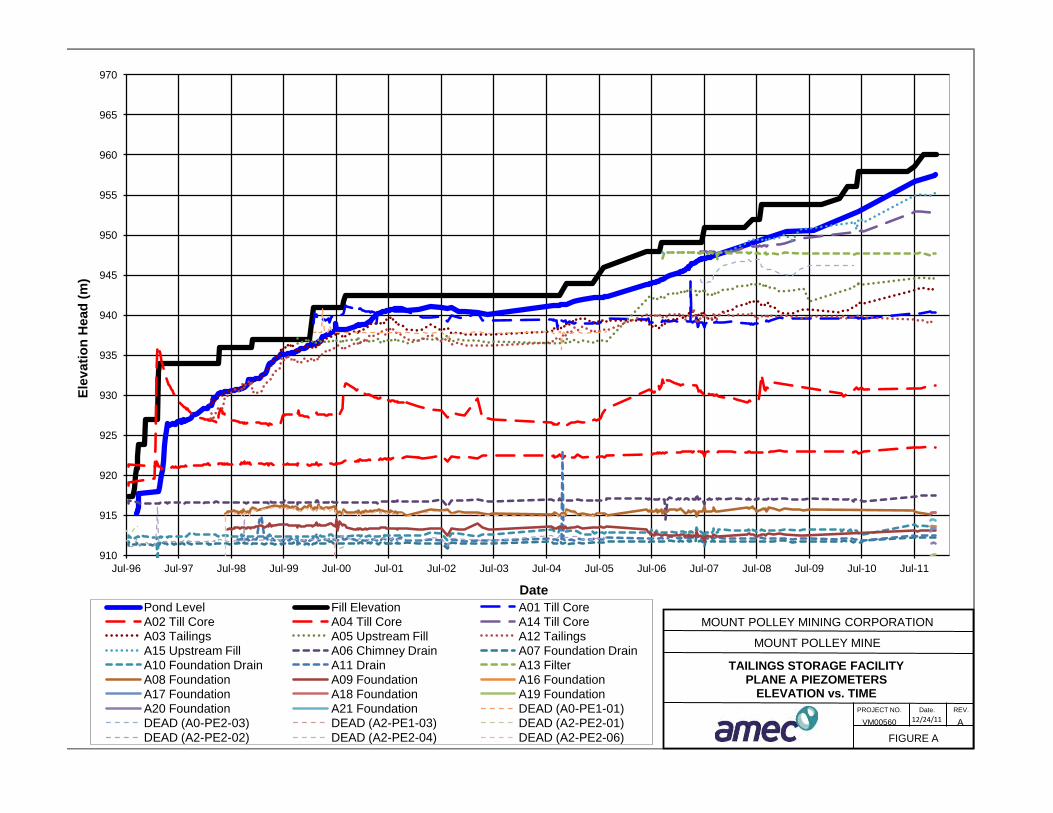
910
915
920
925
930
935
940
945
950
955
960
965
970
Jul-96 Jul-97 Jul-98 Jul-99 Jul-00 Jul-01 Jul-02 Jul-03 Jul-04 Jul-05 Jul-06 Jul-07 Jul-08 Jul-09 Jul-10 Jul-11
Elev
atio
n H
ead
(m)
Date Pond Level Fill Elevation A01 Till Core
A02 Till Core A04 Till Core A14 Till Core
A03 Tailings A05 Upstream Fill A12 Tailings
A15 Upstream Fill A06 Chimney Drain A07 Foundation Drain
A10 Foundation Drain A11 Drain A13 Filter
A08 Foundation A09 Foundation A16 Foundation
A17 Foundation A18 Foundation A19 Foundation
A20 Foundation A21 Foundation DEAD (A0-PE1-01)
DEAD (A0-PE2-03) DEAD (A2-PE1-03) DEAD (A2-PE2-01)
DEAD (A2-PE2-02) DEAD (A2-PE2-04) DEAD (A2-PE2-06)
MOUNT POLLEY MINING CORPORATION
MOUNT POLLEY MINE
TAILINGS STORAGE FACILITY PLANE A PIEZOMETERS
ELEVATION vs. TIME
FIGURE A
PROJECT NO. Date. REV.
VM00560 12/24/11 A
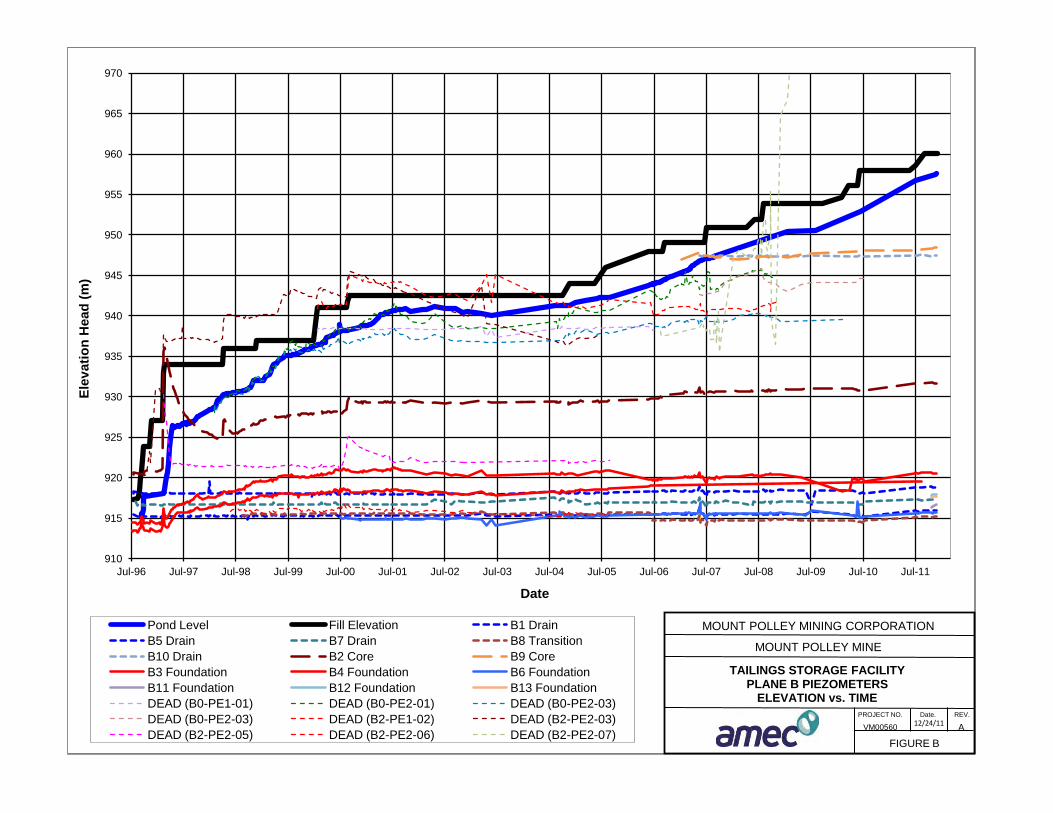
910
915
920
925
930
935
940
945
950
955
960
965
970
Jul-96 Jul-97 Jul-98 Jul-99 Jul-00 Jul-01 Jul-02 Jul-03 Jul-04 Jul-05 Jul-06 Jul-07 Jul-08 Jul-09 Jul-10 Jul-11
Elev
atio
n H
ead
(m)
Date
Pond Level Fill Elevation B1 Drain
B5 Drain B7 Drain B8 Transition
B10 Drain B2 Core B9 Core
B3 Foundation B4 Foundation B6 Foundation
B11 Foundation B12 Foundation B13 Foundation
DEAD (B0-PE1-01) DEAD (B0-PE2-01) DEAD (B0-PE2-03)
DEAD (B0-PE2-03) DEAD (B2-PE1-02) DEAD (B2-PE2-03)
DEAD (B2-PE2-05) DEAD (B2-PE2-06) DEAD (B2-PE2-07)
MOUNT POLLEY MINING CORPORATION
MOUNT POLLEY MINE
TAILINGS STORAGE FACILITY PLANE B PIEZOMETERS
ELEVATION vs. TIME
FIGURE B
PROJECT NO. Date. REV.
VM00560 12/24/11
A

905
910
915
920
925
930
935
940
945
950
955
960
965
970
Jul-96 Jul-97 Jul-98 Jul-99 Jul-00 Jul-01 Jul-02 Jul-03 Jul-04 Jul-05 Jul-06 Jul-07 Jul-08 Jul-09 Jul-10 Jul-11
Elev
atio
n H
ead
(m)
Date
Pond Level Fill Elevation C1 Till Fill
C2 Till Fill C3 Till Fill C10 Till Fill
C4 Drain C9 Upstream Fill C5 Foundation
C6 Foundation C7 Foundation C8 Foundation
C11 Foundation C12 Foundation DEAD (C0-PE1-01)
DEAD (C0-PE2-01) DEAD (C0-PE2-02) DEAD (C0-PE2-03)
DEAD (C1-PE1-01) DEAD (C1-PE1-02) DEAD (C2-PE1-03)
DEAD (C2-PE2-01) DEAD (C2-PE2-07)
MOUNT POLLEY MINING CORPORATION
MOUNT POLLEY MINE
TAILINGS STORAGE FACILITY PLANE C PIEZOMETERS
ELEVATION vs. TIME
FIGURE C
PROJECT NO. Date. REV.
VM00560 12/24/11 A

910
915
920
925
930
935
940
945
950
955
960
965
970
Jul-96 Jul-97 Jul-98 Jul-99 Jul-00 Jul-01 Jul-02 Jul-03 Jul-04 Jul-05 Jul-06 Jul-07 Jul-08 Jul-09 Jul-10 Jul-11
Elev
atio
n H
ead
(m)
Date
Pond Level Fill Elevation D2 Drain
D3 Filter D4 Till Fill D5 Tailings
D1 Foundation D6 Foundation D7 Foundation
DEAD (D1-PE1-03) DEAD (D2-PE1-01) DEAD (D2-PE2-01)
DEAD (D2-PE2-03)
MOUNT POLLEY MINING CORPORATION
MOUNT POLLEY MINE
TAILINGS STORAGE FACILITY PLANE D PIEZOMETERS
ELEVATION vs. TIME
FIGURE D
PROJECT NO. Date. REV.
VM00560 12/24/11 A
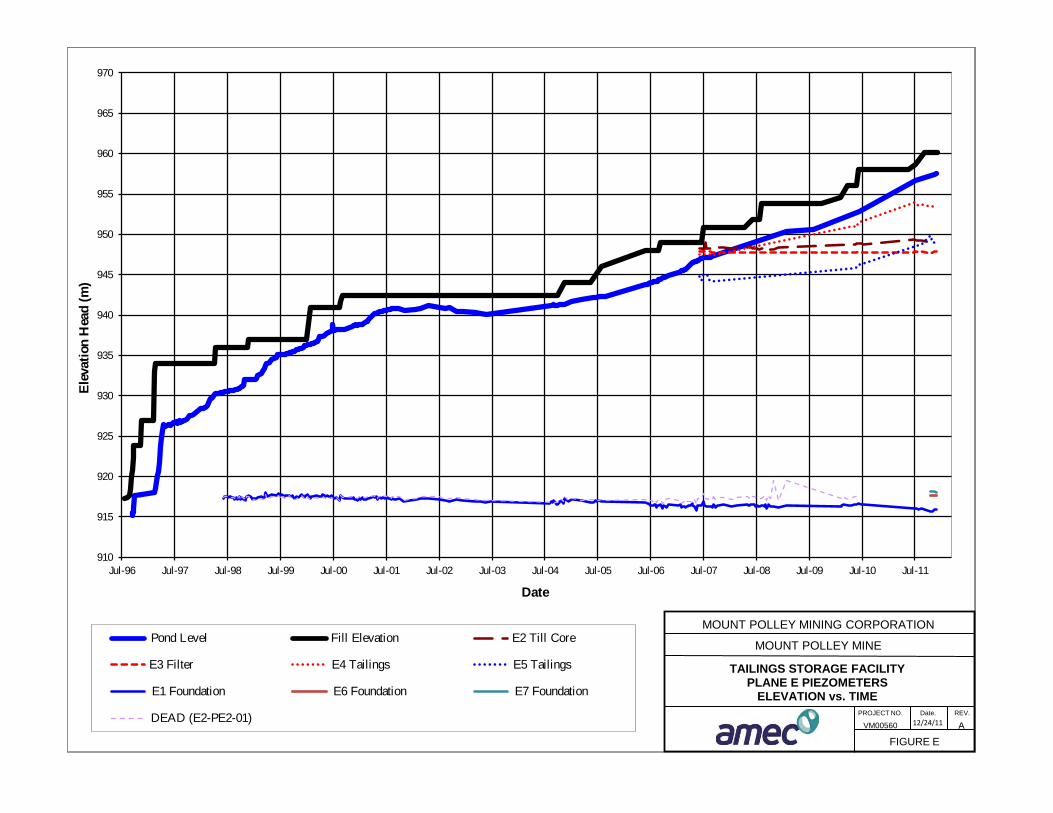
910
915
920
925
930
935
940
945
950
955
960
965
970
Jul-96 Jul-97 Jul-98 Jul-99 Jul-00 Jul-01 Jul-02 Jul-03 Jul-04 Jul-05 Jul-06 Jul-07 Jul-08 Jul-09 Jul-10 Jul-11
Elev
atio
n H
ead
(m)
Date
Pond Level Fill Elevation E2 Till Core
E3 Filter E4 Tailings E5 Tailings
E1 Foundation E6 Foundation E7 Foundation
DEAD (E2-PE2-01)
MOUNT POLLEY MINING CORPORATION
MOUNT POLLEY MINE
TAILINGS STORAGE FACILITY PLANE E PIEZOMETERS
ELEVATION vs. TIME
FIGURE E
PROJECT NO. Date. REV.
VM00560 12/24/11 A

910
915
920
925
930
935
940
945
950
955
960
965
970
Jul-96 Jul-97 Jul-98 Jul-99 Jul-00 Jul-01 Jul-02 Jul-03 Jul-04 Jul-05 Jul-06 Jul-07 Jul-08 Jul-09 Jul-10 Jul-11
Elev
atio
n H
ead
(m)
Date
Pond Level Fill Elevation F1 Tailings
F2 Till Core F3 Till Core F4 Filter
F5 Foundation DEAD (F2-PE2-01)
MOUNT POLLEY MINING CORPORATION
MOUNT POLLEY MINE
TAILINGS STORAGE FACILITY PLANE F PIEZOMETERS
ELEVATION vs. TIME
FIGURE F
PROJECT NO. Date. REV.
VM00560 12/24/11 A

910
915
920
925
930
935
940
945
950
955
960
965
970
Jul-96 Jul-97 Jul-98 Jul-99 Jul-00 Jul-01 Jul-02 Jul-03 Jul-04 Jul-05 Jul-06 Jul-07 Jul-08 Jul-09 Jul-10 Jul-11
Elev
atio
n H
ead
(m)
Date
Pond Level Fill Elevation G1 Upstream Fill
G3 Tailings G2 Till Core G4 Foundation
G5 Foundation DEAD (G1-PE1-01)
MOUNT POLLEY MINING CORPORATION
MOUNT POLLEY MINE
TAILINGS STORAGE FACILITY PLANE G PIEZOMETERS
ELEVATION vs. TIME
FIGURE G
PROJECT NO. Date. REV.
VM00560 12/24/11 A

910
915
920
925
930
935
940
945
950
955
960
965
970
Jul-96 Jul-97 Jul-98 Jul-99 Jul-00 Jul-01 Jul-02 Jul-03 Jul-04 Jul-05 Jul-06 Jul-07 Jul-08 Jul-09 Jul-10 Jul-11
Elev
atio
n H
ead
(m)
Date
Pond Level Fill Elevation H1 Tailings
H2 Till Core DEAD (H2-PE2-02)
MOUNT POLLEY MINING CORPORATION
MOUNT POLLEY MINE
TAILINGS STORAGE FACILITY PLANE H PIEZOMETERS
ELEVATION vs. TIME
FIGURE H
PROJECT NO. Date. REV.
VM00560 12/24/11 A

910
915
920
925
930
935
940
945
950
955
960
965
970
Jul-96 Jul-97 Jul-98 Jul-99 Jul-00 Jul-01 Jul-02 Jul-03 Jul-04 Jul-05 Jul-06 Jul-07 Jul-08 Jul-09 Jul-10 Jul-11
Elev
atio
n H
ead
(m)
Date
Pond Level Fill Elevation I1 Till Core
I3 Filter I4 Tailings I2 Foundation
I5 Foundation I6 Foundation DEAD (I2-PE2-01)
MOUNT POLLEY MINING CORPORATION
MOUNT POLLEY MINE
TAILINGS STORAGE FACILITY PLANE I PIEZOMETERS
ELEVATION vs. TIME
FIGURE I
PROJECT NO. Date. REV.
VM00560 12/24/11 A
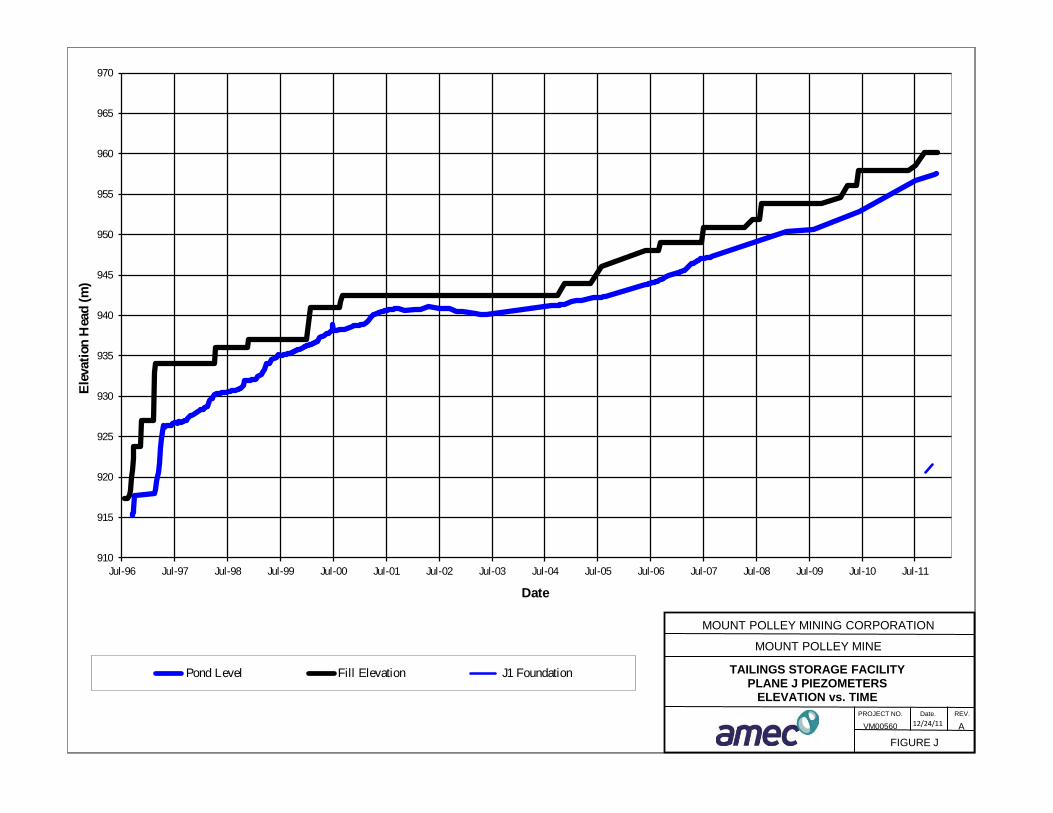
910
915
920
925
930
935
940
945
950
955
960
965
970
Jul-96 Jul-97 Jul-98 Jul-99 Jul-00 Jul-01 Jul-02 Jul-03 Jul-04 Jul-05 Jul-06 Jul-07 Jul-08 Jul-09 Jul-10 Jul-11
Elev
atio
n H
ead
(m)
Date
Pond Level Fill Elevation J1 Foundation
MOUNT POLLEY MINING CORPORATION
MOUNT POLLEY MINE
TAILINGS STORAGE FACILITY PLANE J PIEZOMETERS
ELEVATION vs. TIME
FIGURE J
PROJECT NO. Date. REV.
VM00560 12/24/11 A

910
915
920
925
930
935
940
945
950
955
960
965
970
Jul-96 Jul-97 Jul-98 Jul-99 Jul-00 Jul-01 Jul-02 Jul-03 Jul-04 Jul-05 Jul-06 Jul-07 Jul-08 Jul-09 Jul-10 Jul-11
Elev
atio
n H
ead
(m)
Date
Pond Level Fill Elevation K1 Foundation K2 Foundation
MOUNT POLLEY MINING CORPORATION
MOUNT POLLEY MINE
TAILINGS STORAGE FACILITY PLANE K PIEZOMETERS
ELEVATION vs. TIME
FIGURE K
PROJECT NO. Date. REV.
VM00560 12/24/11 A

APPENDIX C
2011 CONSTRUCTION SEASON PHOTOS
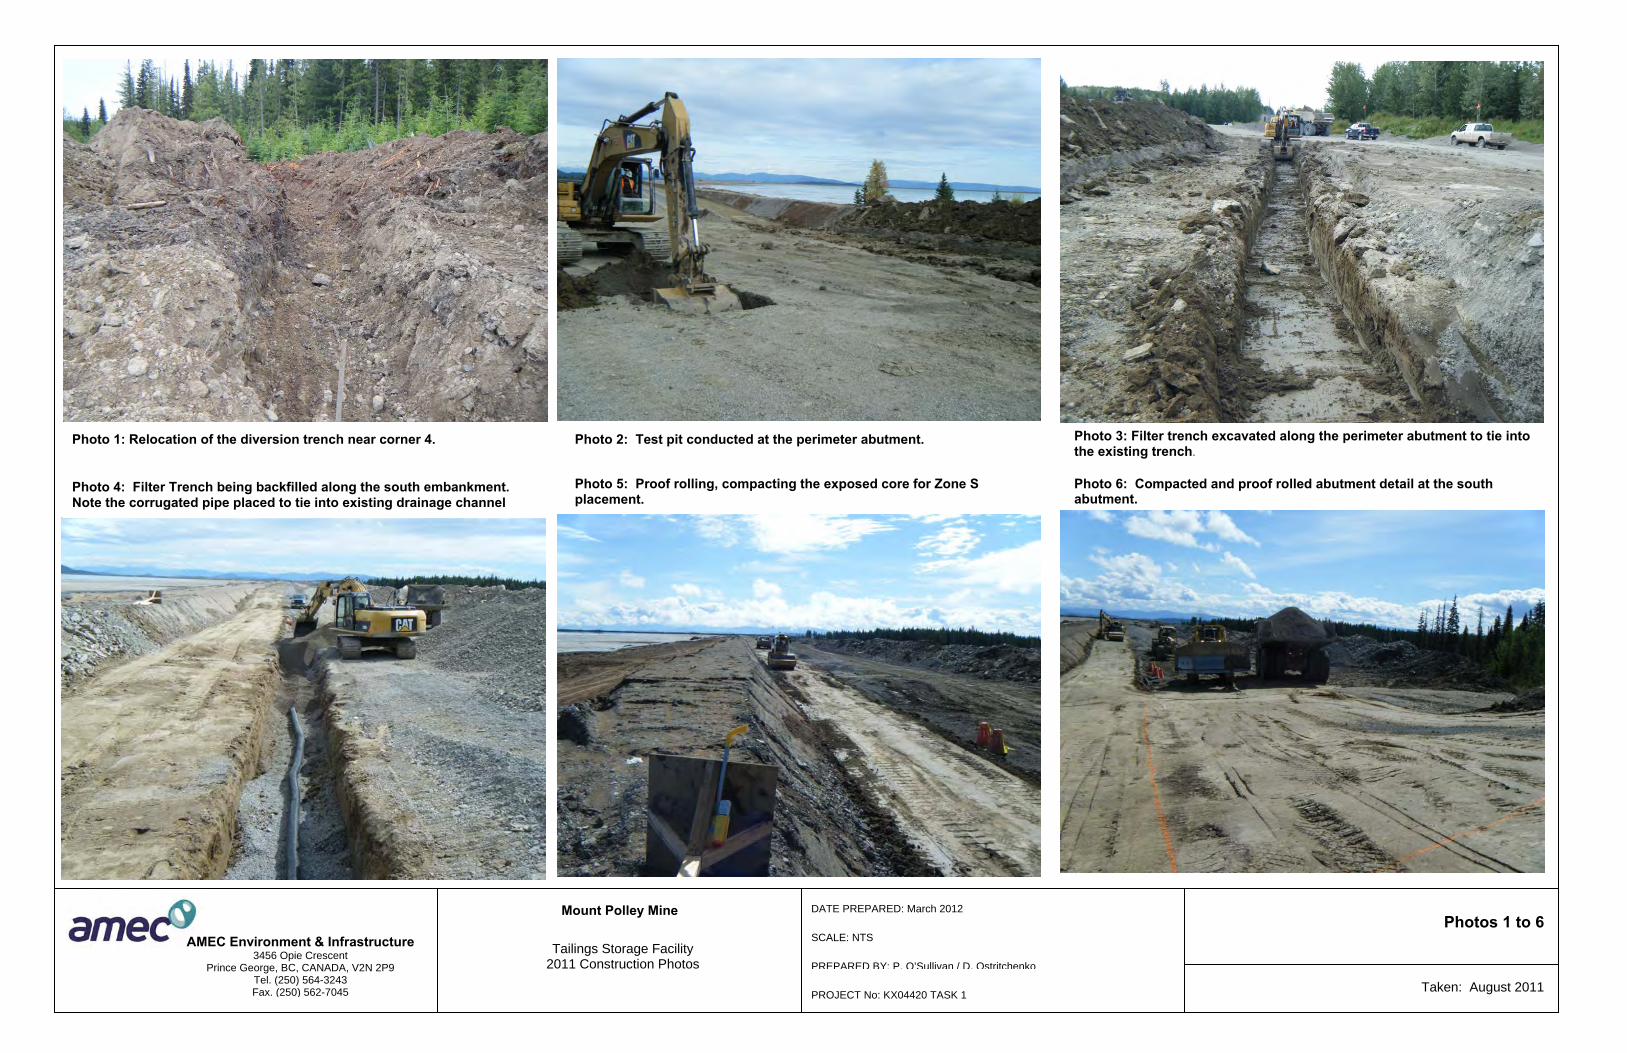
Photos 1 to 6
PROJECT No: KX04420 TASK 1
PREPARED BY: P. O’Sullivan / D. Ostritchenko
SCALE: NTS
DATE PREPARED: March 2012 Mount Polley Mine
Tailings Storage Facility 2011 Construction Photos
Taken: August 2011
Photo 1: Relocation of the diversion trench near corner 4.
Photo 4: Filter Trench being backfilled along the south embankment. Note the corrugated pipe placed to tie into existing drainage channel
Photo 2: Test pit conducted at the perimeter abutment.
Photo 5: Proof rolling, compacting the exposed core for Zone S placement.
Photo 3: Filter trench excavated along the perimeter abutment to tie into the existing trench.
Photo 6: Compacted and proof rolled abutment detail at the south abutment.
AMEC Environment & Infrastructure 3456 Opie Crescent
Prince George, BC, CANADA, V2N 2P9 Tel. (250) 564-3243 Fax. (250) 562-7045

Photos 7 to 11
PROJECT No: KX04420 TASK 1
PREPARED BY: P. O’Sullivan / D. Ostritchenko
SCALE: NTS
DATE PREPARED: March 2012 Mount Polley Mine
Tailings Storage Facility 2011 Construction Photos
Taken: August 2011
Photo 7: Placement of drainage blanket at the south embankment
Photo 10: Survey stakes delineating drainage blanket placement area at the perimeter abutment.
Photo 8: Placement of Zone T material over the drainage blanket at the south abutment. Photo 11: Placement of drainage blanket at the perimeter abutment.
Photo 9: Removing previously placed material at the perimeter embankment to expose competent native till.
AMEC Environment & Infrastructure 3456 Opie Crescent
Prince George, BC, CANADA, V2N 2P9 Tel. (250) 564-3243 Fax. (250) 562-7045
Photo 12: Zone U comprised of NAG rockfill along the Main Embankment.

Photos 13 to 18
PROJECT No: VM00560A
PREPARED BY: P. O’Sullivan / D. Ostritchenko
SCALE: NTS
DATE PREPARED: March 2012 Mount Polley Mine
Tailings Storage Facility 2011 Construction Photos
Taken: July to August 2011
Photo 13: Looking northwest along the perimeter embankment (Zones U, S, F, T and C from left to right).
Photo 16: Surficial sampling of perimeter borrow pit.
Photo 14: Looking southeast along the perimeter embankment at the base of Zone U.
Photo 17: Overview of the secondary barge borrow pit, prior to sampling and removal of overburden.
Photo 15: Perimeter seepage pond discharge into the TSF.
Photo 18: Test pits perform at the barge borrow pit.
AMEC Environment & Infrastructure 3456 Opie Crescent
Prince George, BC, CANADA, V2N 2P9 Tel. (250) 564-3243 Fax. (250) 562-7045

Photos 19 to 24
PROJECT No: VM00560A
SCALE: NTS
DATE PREPARED: March 2012 Mount Polley Mine
Tailings Storage Facility 2011 Construction Photos
Taken: July to August 2011
Photo 19: Looking west along the south embankment during scarification of previously placed Zone S material.
Photo 22: Compaction of Zone S along the perimeter embankment with a 10 ton smooth drum vibratory compactor.
Photo 20: Placement of Zone S on the south embankment.
Photo 23: Shaping downstream toe of Zone S along the main embankment, and exposing previously places Zone F.
Photo 21: Spreading Zone S material along the perimeter embankment.
Photo 24: Removing trimmed Zone S material.
AMEC Environment & Infrastructure 3456 Opie Crescent
Prince George, BC, CANADA, V2N 2P9 Tel. (250) 564-3243 Fax. (250) 562-7045
PREPARED BY: P. O’Sullivan / D. Ostritchenko

Photos 25 to 30
PROJECT No: VM00560A
SCALE: NTS
DATE PREPARED: March 2012 Mount Polley Mine
Tailings Storage Facility 2011 Construction Photos
Taken: July to August 2011
Photo 25: Loading of Zone S material at the perimeter borrow pit.
Photo 28: Embankment fill zones.
Photo 26: Placement of Zone F material along the south embankment.
Photo 29: Poorly sorted Zone T material, with areas identified to be removed (south embankment).
Photo 27: Shaping of Zone F material along the south embankment.
Photo 30: Approved Zone T material (South Embankment). Note the freshly removed unacceptable fill – see Photo 29).
AMEC Environment & Infrastructure 3456 Opie Crescent
Prince George, BC, CANADA, V2N 2P9 Tel. (250) 564-3243 Fax. (250) 562-7045
PREPARED BY: P. O’Sullivan / D. Ostritchenko
Zone T
Zone F
Zone S
Zone U
Zone C

Photos 31 to 36
PROJECT No: VM00560A
SCALE: NTS
DATE PREPARED: March 2012 Mount Polley Mine
Tailings Storage Facility 2011 Construction Photos
Taken: July to August 2011
Photo 31: Crushed Zone T material stock pile. This material was utilized for the majority of Zone T placement for the 2011 construction.
Photo 34: Surveying of compaction test location.
Photo 32: Haul trucks transporting Zone T and Zone C.
Photo 35: Compaction testing of Zone S, utilizing the MDI device.
Photo 33: Zone C placement along the south embankment.
Photo 36: Slope Inclinometer reading in progress.
AMEC Environment & Infrastructure 3456 Opie Crescent
Prince George, BC, CANADA, V2N 2P9 Tel. (250) 564-3243 Fax. (250) 562-7045
PREPARED BY: P. O’Sullivan / D. Ostritchenko