Embed Size (px)
Citation preview
Appendix L-1:
Traffic Impact Analysis MOU
LA\2627627.1
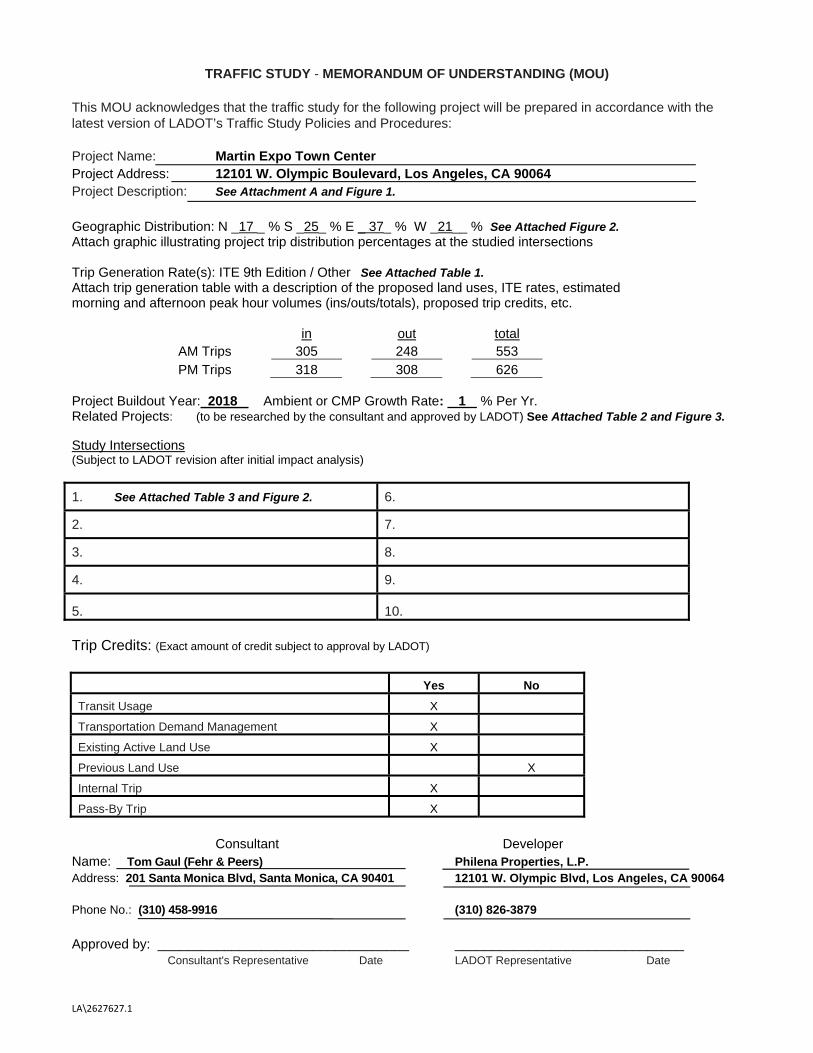
TRAFFIC STUDY - MEMORANDUM OF UNDERSTANDING (MOU)
This MOU acknowledges that the traffic study for the following project will be prepared in accordance with the latest version of LADOT’s Traffic Study Policies and Procedures:
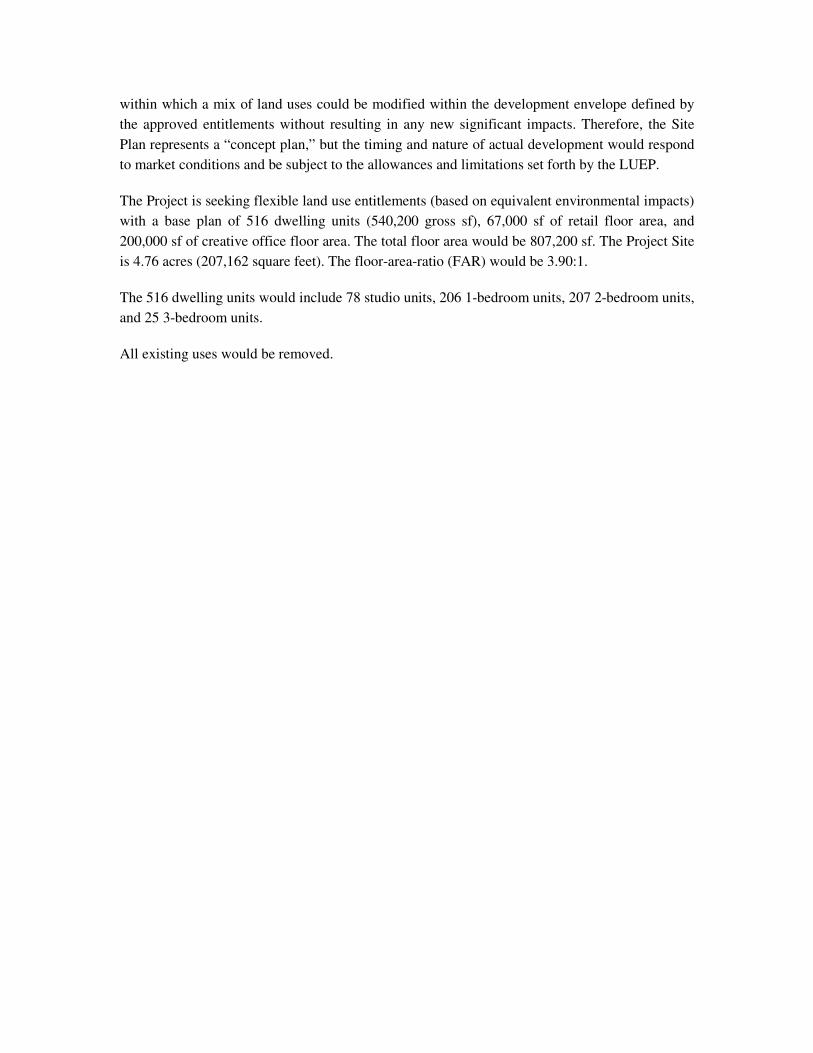
Project Name: Martin Expo Town Center Project Address: 12101 W. Olympic Boulevard, Los Angeles, CA 90064 Project Description: See Attachment A and Figure 1.
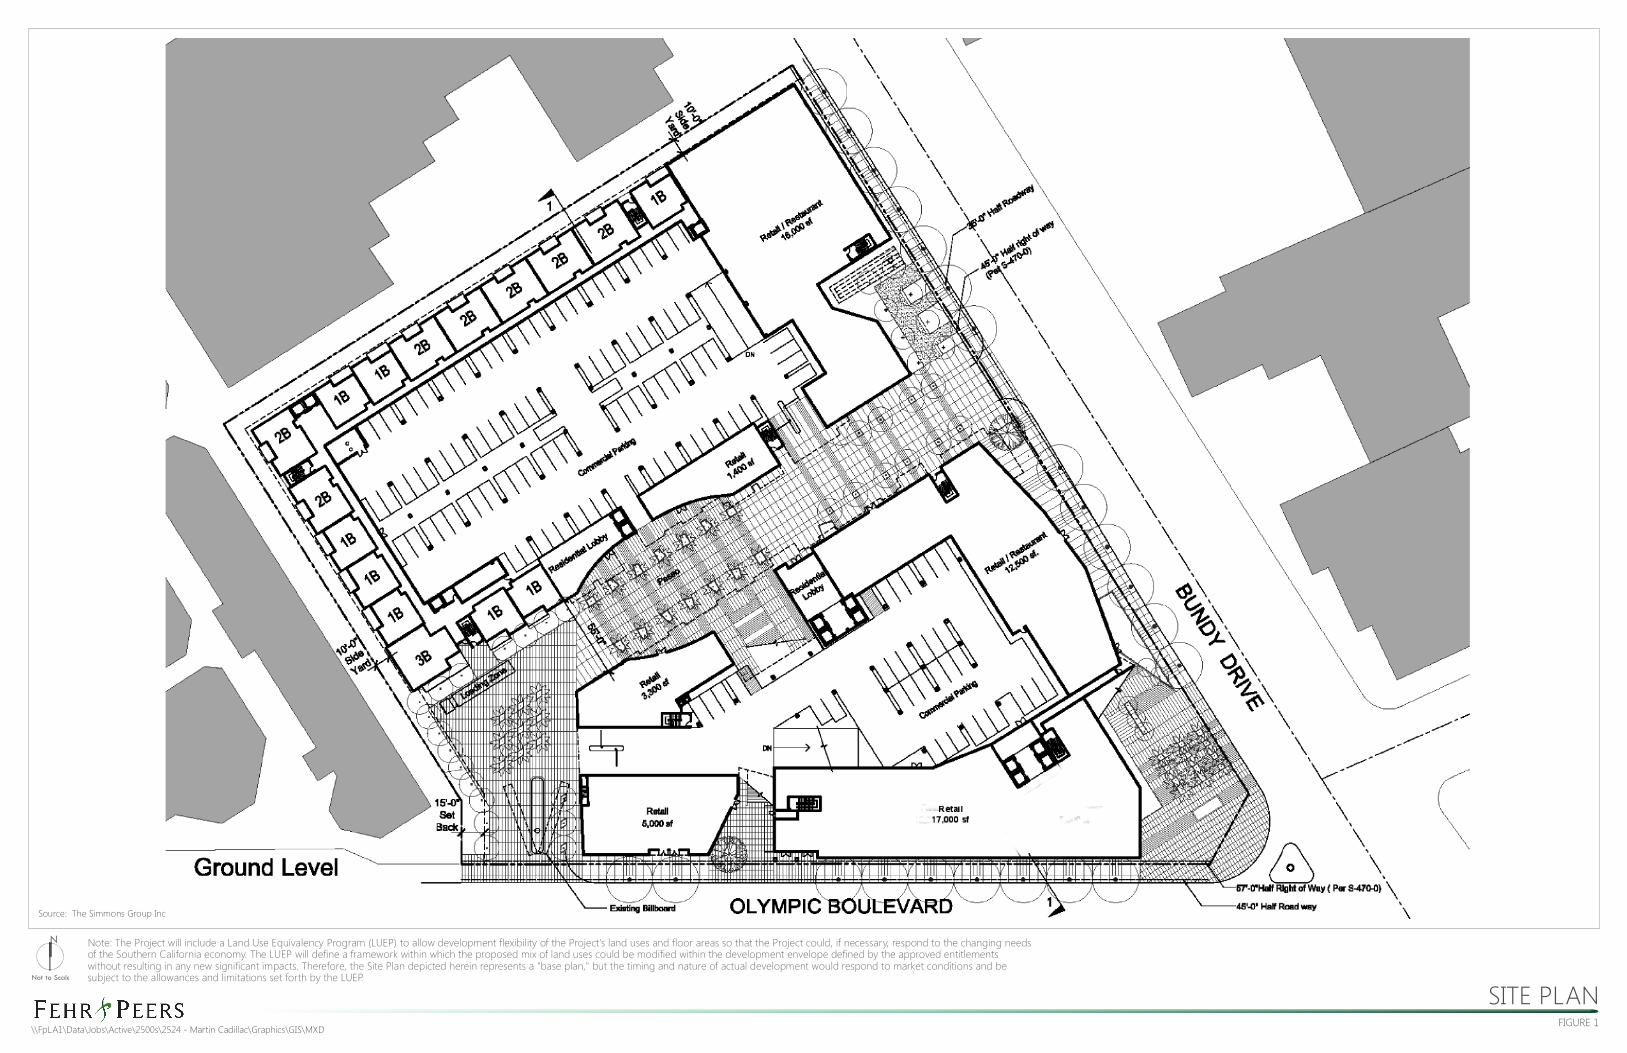
Geographic Distribution: N _17 _ % S _25_ % E _ 37_ % W _21__ % See Attached Figure 2. Attach graphic illustrating project trip distribution percentages at the studied intersections
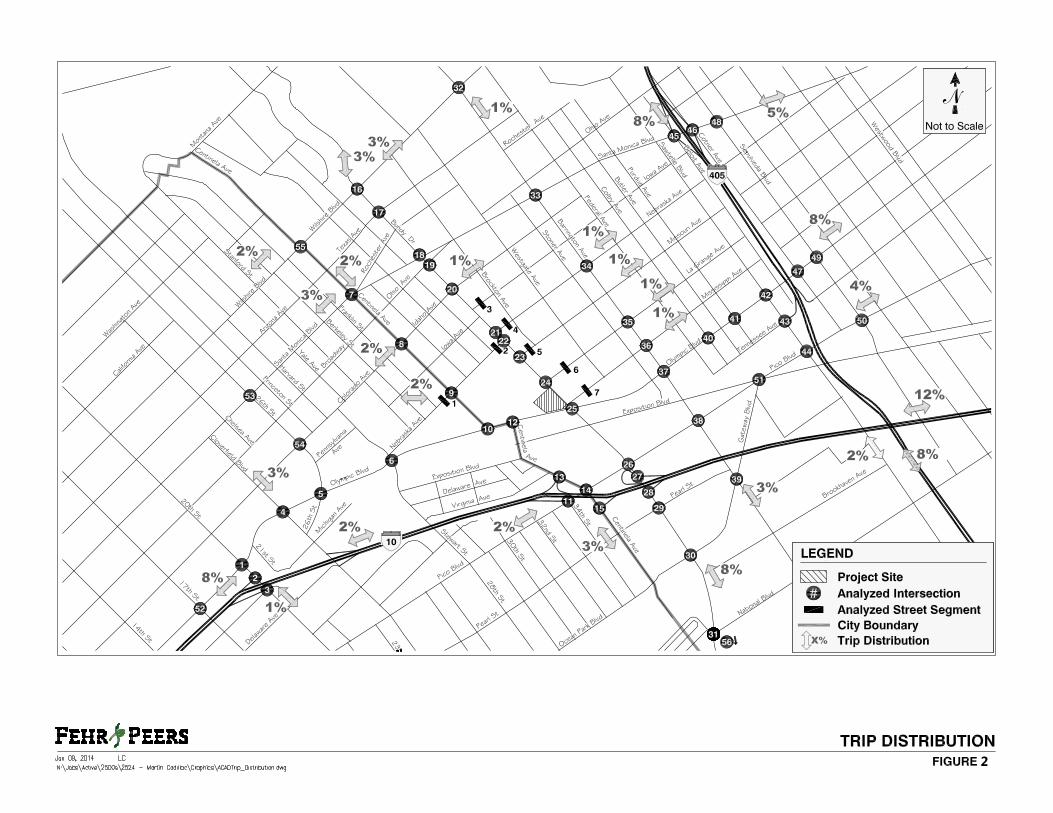
Trip Generation Rate(s): ITE 9th Edition / Other See Attached Table 1. Attach trip generation table with a description of the proposed land uses, ITE rates, estimated morning and afternoon peak hour volumes (ins/outs/totals), proposed trip credits, etc.
in out total AM Trips 305 248 553PM Trips 318 308 626
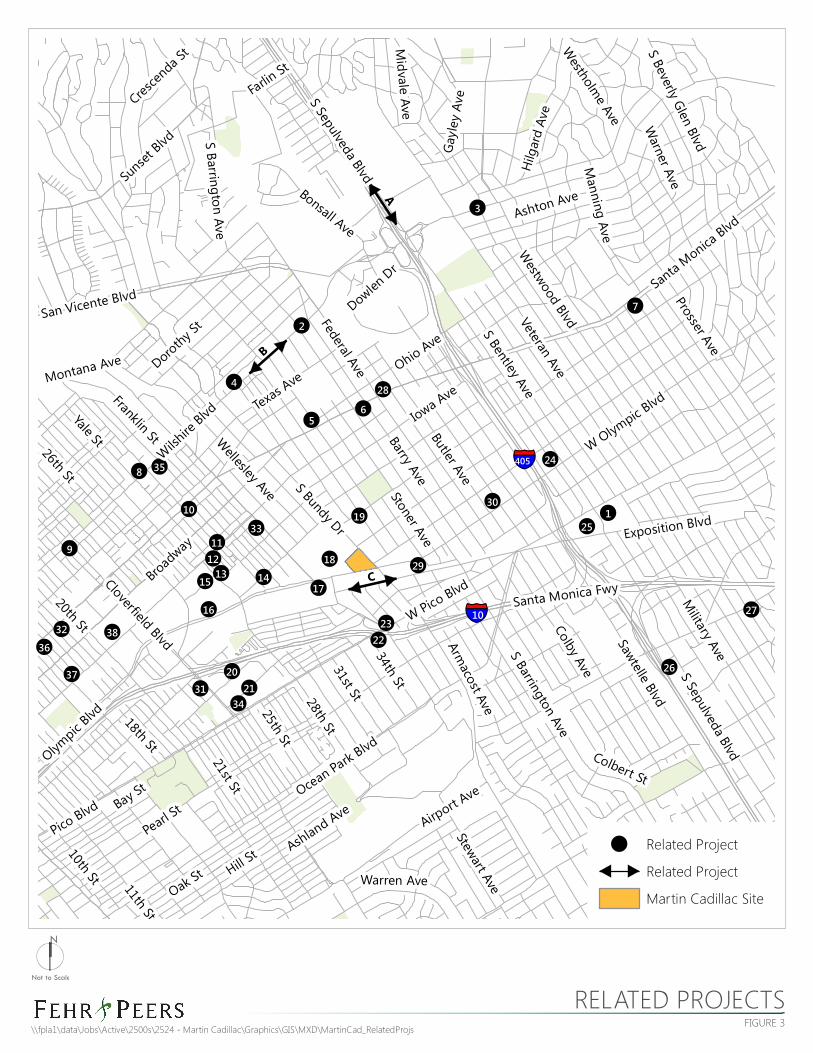
Project Buildout Year: 2018 Ambient or CMP Growth Rate: 1 % Per Yr. Related Projects: (to be researched by the consultant and approved by LADOT) See Attached Table 2 and Figure 3.
Study Intersections (Subject to LADOT revision after initial impact analysis)
1. See Attached Table 3 and Figure 2. 6.
2. 7.
3. 8.
4. 9.
5. 10.
Trip Credits: (Exact amount of credit subject to approval by LADOT)
Yes No
Transit Usage X
Transportation Demand Management X
Existing Active Land Use X
Previous Land Use X
Internal Trip X
Pass-By Trip X
Consultant Developer Name: Tom Gaul (Fehr & Peers) Philena Properties, L.P. Address: 201 Santa Monica Blvd, Santa Monica, CA 90401 12101 W. Olympic Blvd, Los Angeles, CA 90064
Phone No.: (310) 458-9916 (310) 826-3879
Approved by: __________________________________ _______________________________ Consultant's Representative Date LADOT Representative Date
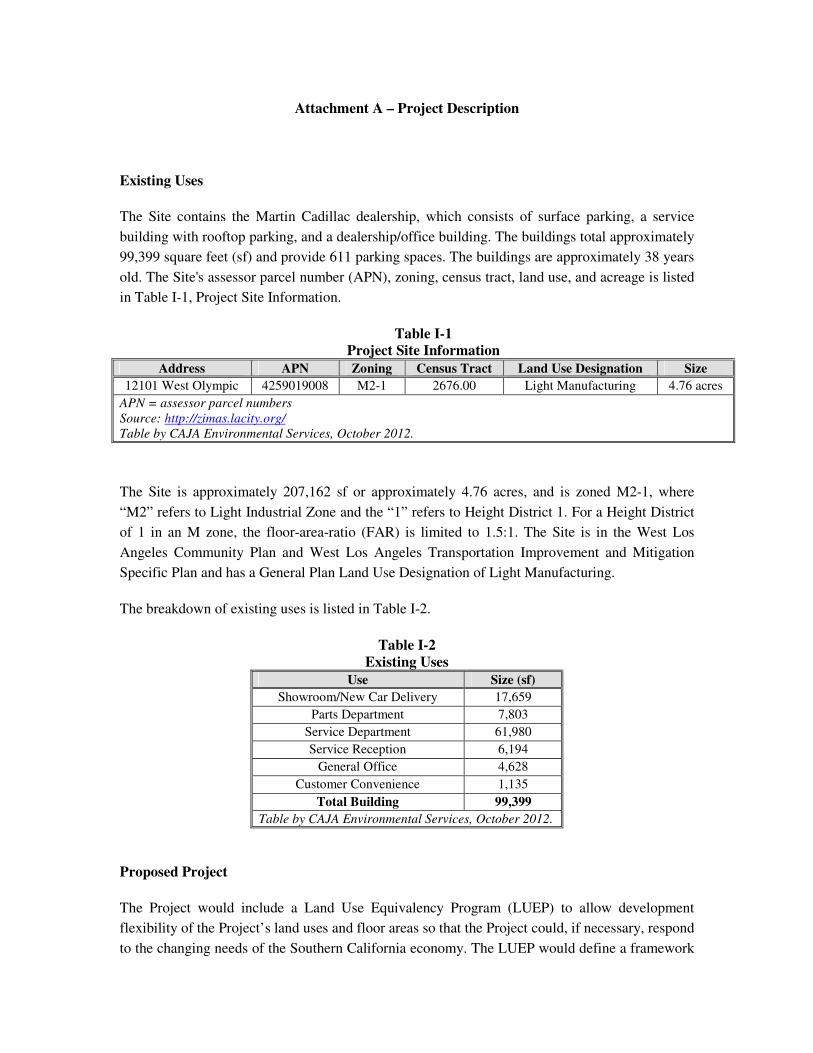
Attachment A – Project Description
Existing Uses
The Site contains the Martin Cadillac dealership, which consists of surface parking, a service
building with rooftop parking, and a dealership/office building. The buildings total approximately
99,399 square feet (sf) and provide 611 parking spaces. The buildings are approximately 38 years
old. The Site's assessor parcel number (APN), zoning, census tract, land use, and acreage is listed
in Table I-1, Project Site Information.
Table I-1
Project Site Information
Address APN Zoning Census Tract Land Use Designation Size
12101 West Olympic 4259019008 M2-1 2676.00 Light Manufacturing 4.76 acres
APN = assessor parcel numbers
Source: http://zimas.lacity.org/
Table by CAJA Environmental Services, October 2012.
The Site is approximately 207,162 sf or approximately 4.76 acres, and is zoned M2-1, where
“M2” refers to Light Industrial Zone and the “1” refers to Height District 1. For a Height District
of 1 in an M zone, the floor-area-ratio (FAR) is limited to 1.5:1. The Site is in the West Los
Angeles Community Plan and West Los Angeles Transportation Improvement and Mitigation
Specific Plan and has a General Plan Land Use Designation of Light Manufacturing.
The breakdown of existing uses is listed in Table I-2.
Table I-2
Existing Uses
Use Size (sf)
Showroom/New Car Delivery 17,659
Parts Department 7,803
Service Department 61,980
Service Reception 6,194
General Office 4,628
Customer Convenience 1,135
Total Building 99,399
Table by CAJA Environmental Services, October 2012.
Proposed Project
The Project would include a Land Use Equivalency Program (LUEP) to allow development
flexibility of the Project’s land uses and floor areas so that the Project could, if necessary, respond
to the changing needs of the Southern California economy. The LUEP would define a framework
within which a mix of land uses could be modified within the development envelope defined by
the approved entitlements without resulting in any new significant impacts. Therefore, the Site
Plan represents a “concept plan,” but the timing and nature of actual development would respond
to market conditions and be subject to the allowances and limitations set forth by the LUEP.
The Project is seeking flexible land use entitlements (based on equivalent environmental impacts)
with a base plan of 516 dwelling units (540,200 gross sf), 67,000 sf of retail floor area, and
200,000 sf of creative office floor area. The total floor area would be 807,200 sf. The Project Site
is 4.76 acres (207,162 square feet). The floor-area-ratio (FAR) would be 3.90:1.
The 516 dwelling units would include 78 studio units, 206 1-bedroom units, 207 2-bedroom units,
and 25 3-bedroom units.
All existing uses would be removed.
SITE PLANFIGURE 1
\\FpLA1\Data\Jobs\Active\2500s\2524 - Martin Cadillac\Graphics\GIS\MXD
Not to Scale
NNNNNNN
Source: The Simmons Group Inc
Note: The Project will include a Land Use Equivalency Program (LUEP) to allow development flexibility of the Project's land uses and floor areas so that the Project could, if necessary, respond to the changing needs of the Southern California economy. The LUEP will define a framework within which the proposed mix of land uses could be modified within the development envelope defined by the approved entitlements without resulting in any new significant impacts. Therefore, the Site Plan depicted herein represents a "base plan," but the timing and nature of actual development would respond to market conditions and be subject to the allowances and limitations set forth by the LUEP.
2
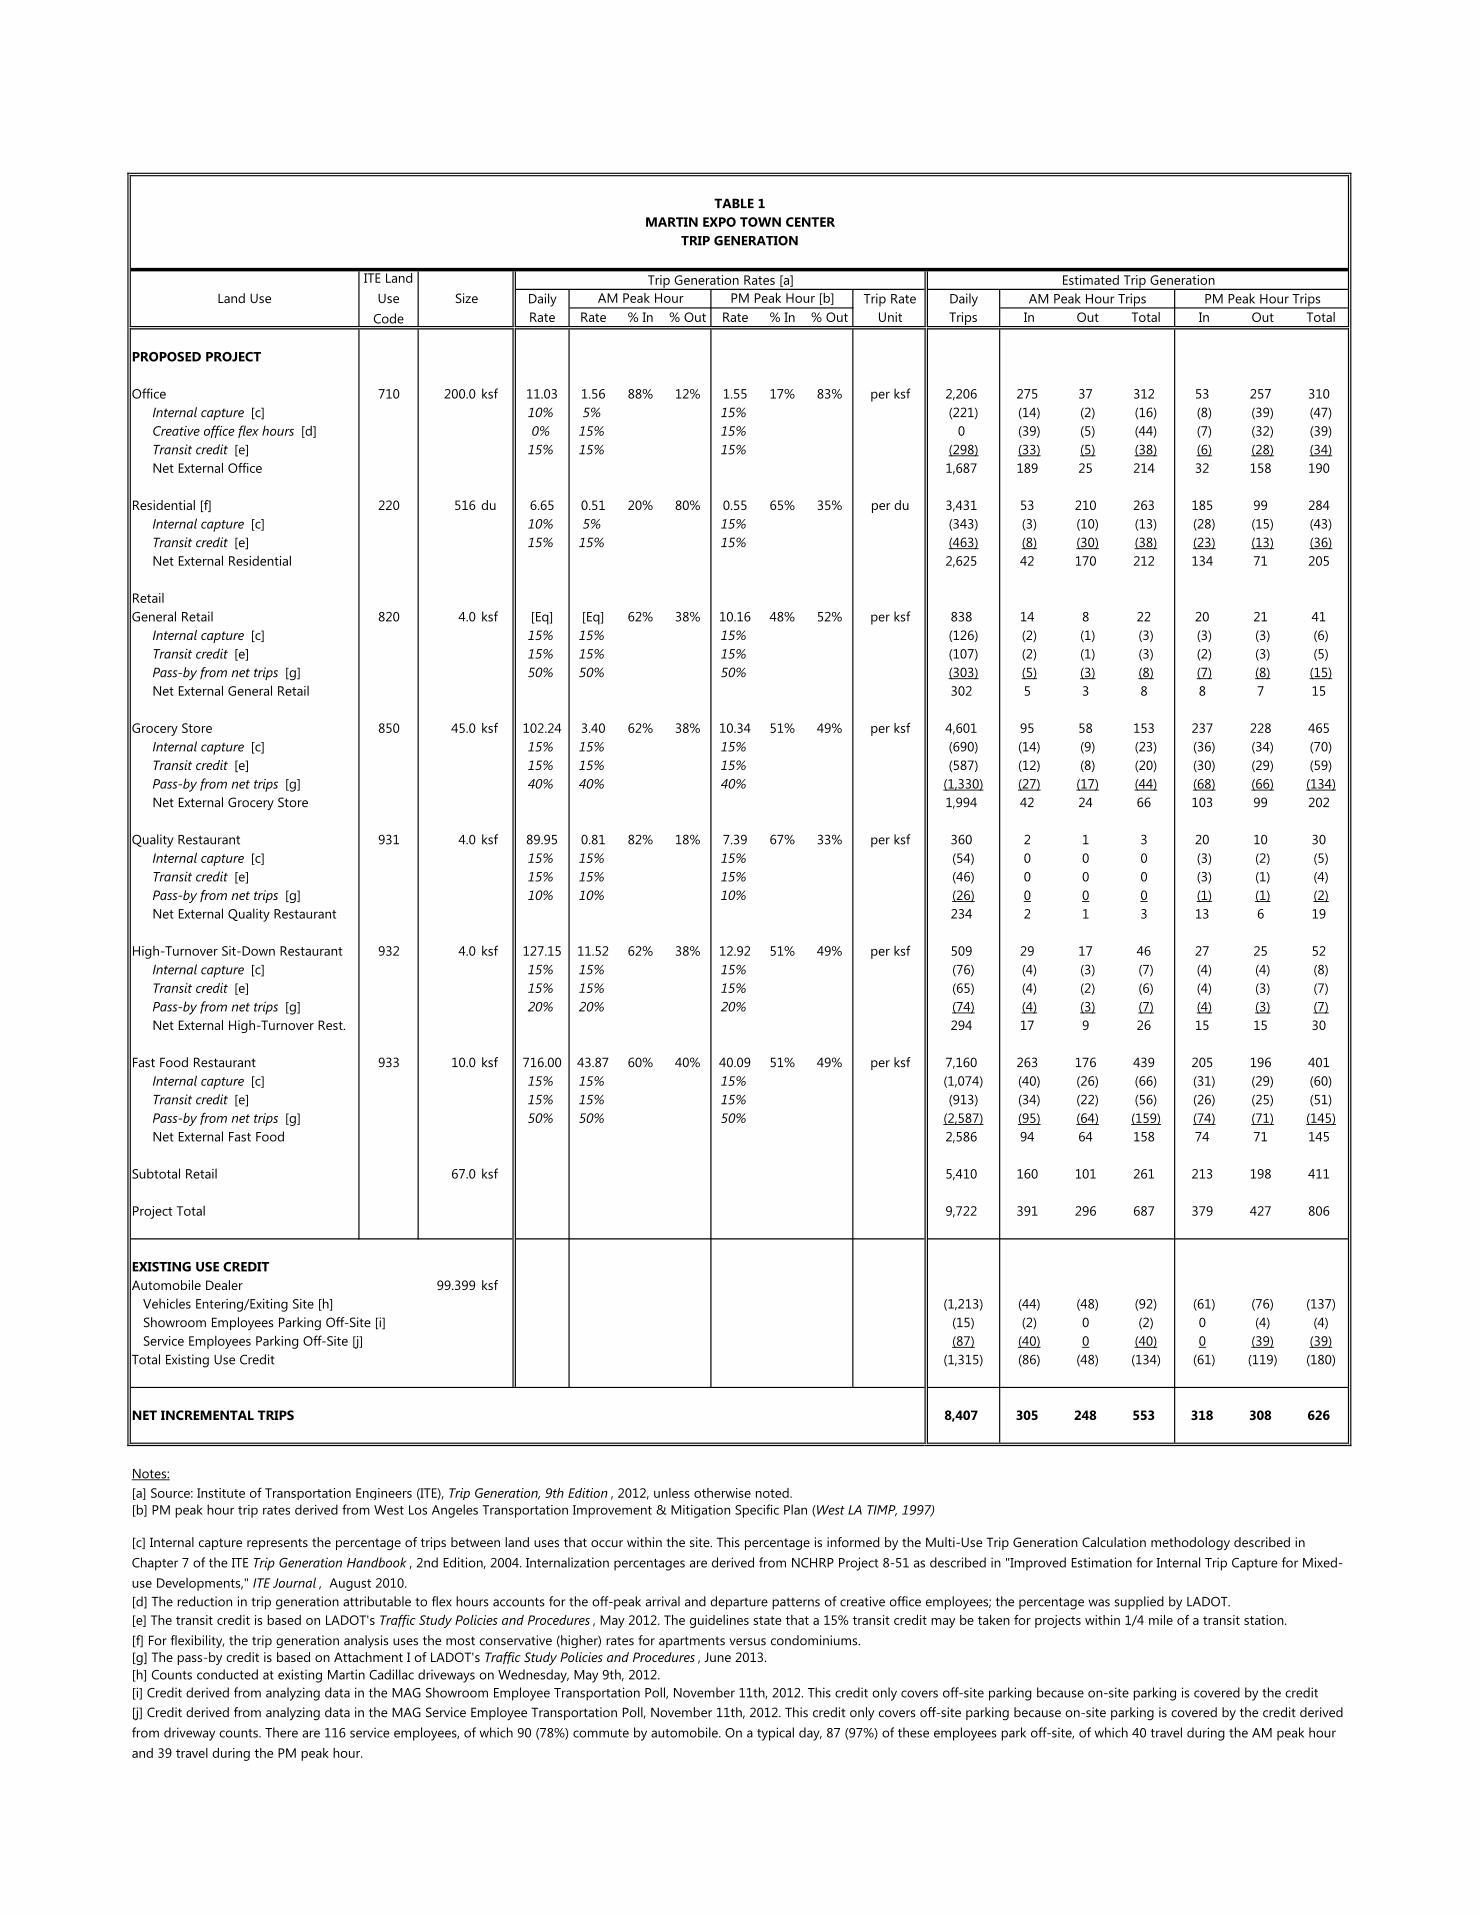
TABLE 1MARTIN EXPO TOWN CENTER
TRIP GENERATION
Trip Generation Rates [a] Estimated Trip Generation Daily Trip Rate Daily AM Peak Hour Trips PM Peak Hour TripsRate Rate % In % Out Rate % In % Out Unit Trips In Out Total In Out Total
PROPOSED PROJECT
Office 710 200.0 ksf 11.03 1.56 88% 12% 1.55 17% 83% per ksf 2,206 275 37 312 53 257 310Internal capture [c] 10% 5% 15% (221) (14) (2) (16) (8) (39) (47)Creative office flex hours [d] 0% 15% 15% 0 (39) (5) (44) (7) (32) (39)Transit credit [e] 15% 15% 15% (298) (33) (5) (38) (6) (28) (34)Net External Office 1,687 189 25 214 32 158 190
Residential [f] 220 516 du 6.65 0.51 20% 80% 0.55 65% 35% per du 3,431 53 210 263 185 99 284Internal capture [c] 10% 5% 15% (343) (3) (10) (13) (28) (15) (43)Transit credit [e] 15% 15% 15% (463) (8) (30) (38) (23) (13) (36)Net External Residential 2,625 42 170 212 134 71 205
Retail General Retail 820 4.0 ksf [Eq] [Eq] 62% 38% 10.16 48% 52% per ksf 838 14 8 22 20 21 41
Internal capture [c] 15% 15% 15% (126) (2) (1) (3) (3) (3) (6)Transit credit [e] 15% 15% 15% (107) (2) (1) (3) (2) (3) (5)Pass-by from net trips [g] 50% 50% 50% (303) (5) (3) (8) (7) (8) (15)Net External General Retail 302 5 3 8 8 7 15
Grocery Store 850 45.0 ksf 102.24 3.40 62% 38% 10.34 51% 49% per ksf 4,601 95 58 153 237 228 465Internal capture [c] 15% 15% 15% (690) (14) (9) (23) (36) (34) (70)Transit credit [e] 15% 15% 15% (587) (12) (8) (20) (30) (29) (59)Pass-by from net trips [g] 40% 40% 40% (1,330) (27) (17) (44) (68) (66) (134)Net External Grocery Store 1,994 42 24 66 103 99 202
Quality Restaurant 931 4.0 ksf 89.95 0.81 82% 18% 7.39 67% 33% per ksf 360 2 1 3 20 10 30Internal capture [c] 15% 15% 15% (54) 0 0 0 (3) (2) (5)Transit credit [e] 15% 15% 15% (46) 0 0 0 (3) (1) (4)Pass-by from net trips [g] 10% 10% 10% (26) 0 0 0 (1) (1) (2)Net External Quality Restaurant 234 2 1 3 13 6 19
High-Turnover Sit-Down Restaurant 932 4.0 ksf 127.15 11.52 62% 38% 12.92 51% 49% per ksf 509 29 17 46 27 25 52Internal capture [c] 15% 15% 15% (76) (4) (3) (7) (4) (4) (8)Transit credit [e] 15% 15% 15% (65) (4) (2) (6) (4) (3) (7)Pass-by from net trips [g] 20% 20% 20% (74) (4) (3) (7) (4) (3) (7)Net External High-Turnover Rest. 294 17 9 26 15 15 30
Fast Food Restaurant 933 10.0 ksf 716.00 43.87 60% 40% 40.09 51% 49% per ksf 7,160 263 176 439 205 196 401Internal capture [c] 15% 15% 15% (1,074) (40) (26) (66) (31) (29) (60)Transit credit [e] 15% 15% 15% (913) (34) (22) (56) (26) (25) (51)Pass-by from net trips [g] 50% 50% 50% (2,587) (95) (64) (159) (74) (71) (145)Net External Fast Food 2,586 94 64 158 74 71 145
Subtotal Retail 67.0 ksf 5,410 160 101 261 213 198 411
Project Total 9,722 391 296 687 379 427 806
EXISTING USE CREDITAutomobile Dealer 99.399 ksf
Vehicles Entering/Exiting Site [h] (1,213) (44) (48) (92) (61) (76) (137)Showroom Employees Parking Off-Site [i] (15) (2) 0 (2) 0 (4) (4)Service Employees Parking Off-Site [j] (87) (40) 0 (40) 0 (39) (39)
Total Existing Use Credit (1,315) (86) (48) (134) (61) (119) (180)
NET INCREMENTAL TRIPS 8,407 305 248 553 318 308 626
Notes:[a] Source: Institute of Transportation Engineers (ITE), Trip Generation, 9th Edition , 2012, unless otherwise noted.
[h] Counts conducted at existing Martin Cadillac driveways on Wednesday, May 9th, 2012.
[c] Internal capture represents the percentage of trips between land uses that occur within the site. This percentage is informed by the Multi-Use Trip Generation Calculation methodology described in Chapter 7 of the ITE Trip Generation Handbook , 2nd Edition, 2004. Internalization percentages are derived from NCHRP Project 8-51 as described in "Improved Estimation for Internal Trip Capture for Mixed-use Developments," ITE Journal , August 2010.[d] The reduction in trip generation attributable to flex hours accounts for the off-peak arrival and departure patterns of creative office employees; the percentage was supplied by LADOT.[e] The transit credit is based on LADOT's Traffic Study Policies and Procedures , May 2012. The guidelines state that a 15% transit credit may be taken for projects within 1/4 mile of a transit station.[f] For flexibility, the trip generation analysis uses the most conservative (higher) rates for apartments versus condominiums.[g] The pass-by credit is based on Attachment I of LADOT's Traffic Study Policies and Procedures , June 2013.
[i] Credit derived from analyzing data in the MAG Showroom Employee Transportation Poll, November 11th, 2012. This credit only covers off-site parking because on-site parking is covered by the credit [j] Credit derived from analyzing data in the MAG Service Employee Transportation Poll, November 11th, 2012. This credit only covers off-site parking because on-site parking is covered by the credit derived from driveway counts. There are 116 service employees, of which 90 (78%) commute by automobile. On a typical day, 87 (97%) of these employees park off-site, of which 40 travel during the AM peak hour and 39 travel during the PM peak hour.
[b] PM peak hour trip rates derived from West Los Angeles Transportation Improvement & Mitigation Specific Plan (West LA TIMP, 1997)
Land UseITE Land
Use Code
Size AM Peak Hour PM Peak Hour [b]
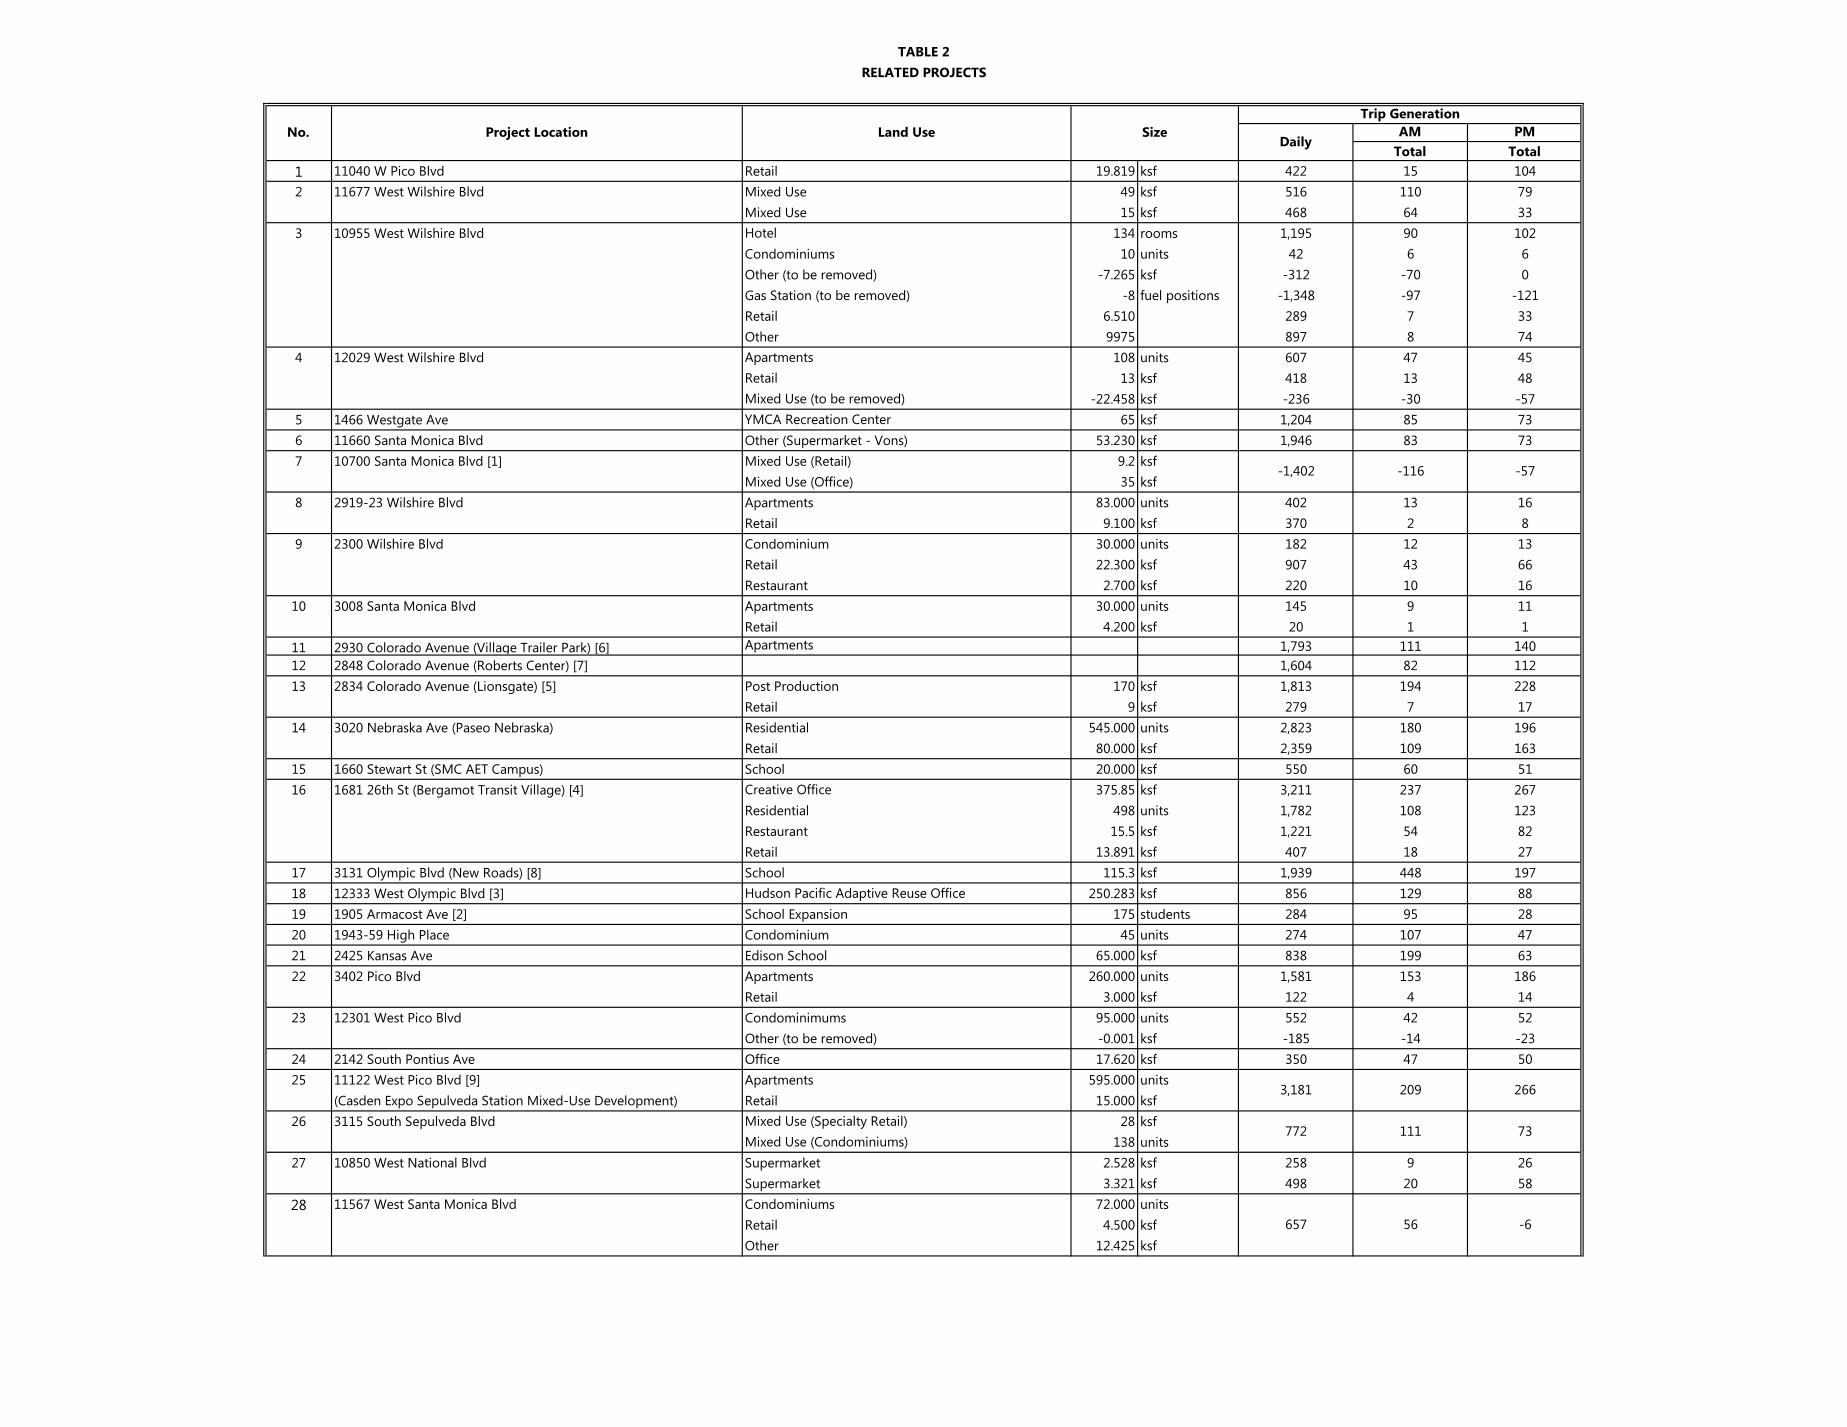
Total Total1 11040 W Pico Blvd Retail 19.819 ksf 422 15 104
Mixed Use 49 ksf 516 110 79Mixed Use 15 ksf 468 64 33
10955 West Wilshire Blvd Hotel 134 rooms 1,195 90 102Condominiums 10 units 42 6 6Other (to be removed) -7.265 ksf -312 -70 0Gas Station (to be removed) -8 fuel positions -1,348 -97 -121Retail 6.510 289 7 33Other 9975 897 8 74
12029 West Wilshire Blvd Apartments 108 units 607 47 45Retail 13 ksf 418 13 48Mixed Use (to be removed) -22.458 ksf -236 -30 -57
5 1466 Westgate Ave YMCA Recreation Center 65 ksf 1,204 85 736 11660 Santa Monica Blvd Other (Supermarket - Vons) 53.230 ksf 1,946 83 73
10700 Santa Monica Blvd [1] Mixed Use (Retail) 9.2 ksfMixed Use (Office) 35 ksf
2919-23 Wilshire Blvd Apartments 83.000 units 402 13 16Retail 9.100 ksf 370 2 8
2300 Wilshire Blvd Condominium 30.000 units 182 12 13Retail 22.300 ksf 907 43 66Restaurant 2.700 ksf 220 10 16
3008 Santa Monica Blvd Apartments 30.000 units 145 9 11Retail 4.200 ksf 20 1 1
11 2930 Colorado Avenue (Village Trailer Park) [6] Apartments 1,793 111 14012 2848 Colorado Avenue (Roberts Center) [7] 1,604 82 112
2834 Colorado Avenue (Lionsgate) [5] Post Production 170 ksf 1,813 194 228Retail 9 ksf 279 7 17
3020 Nebraska Ave (Paseo Nebraska) Residential 545.000 units 2,823 180 196Retail 80.000 ksf 2,359 109 163
15 1660 Stewart St (SMC AET Campus) School 20.000 ksf 550 60 511681 26th St (Bergamot Transit Village) [4] Creative Office 375.85 ksf 3,211 237 267
Residential 498 units 1,782 108 123Restaurant 15.5 ksf 1,221 54 82Retail 13.891 ksf 407 18 27
17 3131 Olympic Blvd (New Roads) [8] School 115.3 ksf 1,939 448 19718 12333 West Olympic Blvd [3] Hudson Pacific Adaptive Reuse Office 250.283 ksf 856 129 8819 1905 Armacost Ave [2] School Expansion 175 students 284 95 2820 1943-59 High Place Condominium 45 units 274 107 4721 2425 Kansas Ave Edison School 65.000 ksf 838 199 63
3402 Pico Blvd Apartments 260.000 units 1,581 153 186Retail 3.000 ksf 122 4 14
12301 West Pico Blvd Condominimums 95.000 units 552 42 52Other (to be removed) -0.001 ksf -185 -14 -23
24 2142 South Pontius Ave Office 17.620 ksf 350 47 5011122 West Pico Blvd [9] Apartments 595.000 units(Casden Expo Sepulveda Station Mixed-Use Development) Retail 15.000 ksf3115 South Sepulveda Blvd Mixed Use (Specialty Retail) 28 ksf
Mixed Use (Condominiums) 138 units10850 West National Blvd Supermarket 2.528 ksf 258 9 26
Supermarket 3.321 ksf 498 20 5811567 West Santa Monica Blvd Condominiums 72.000 units
Retail 4.500 ksfOther 12.425 ksf
3,181 209 266
-6
73
27
26772 111
657 56
22
23
25
28
-57
8
9
10
-1,402 -1167
16
2 11677 West Wilshire Blvd
3
4
13
14
DailyAM PM
TABLE 2RELATED PROJECTS
No. Project Location Land Use SizeTrip Generation
Total TotalDaily
AM PM
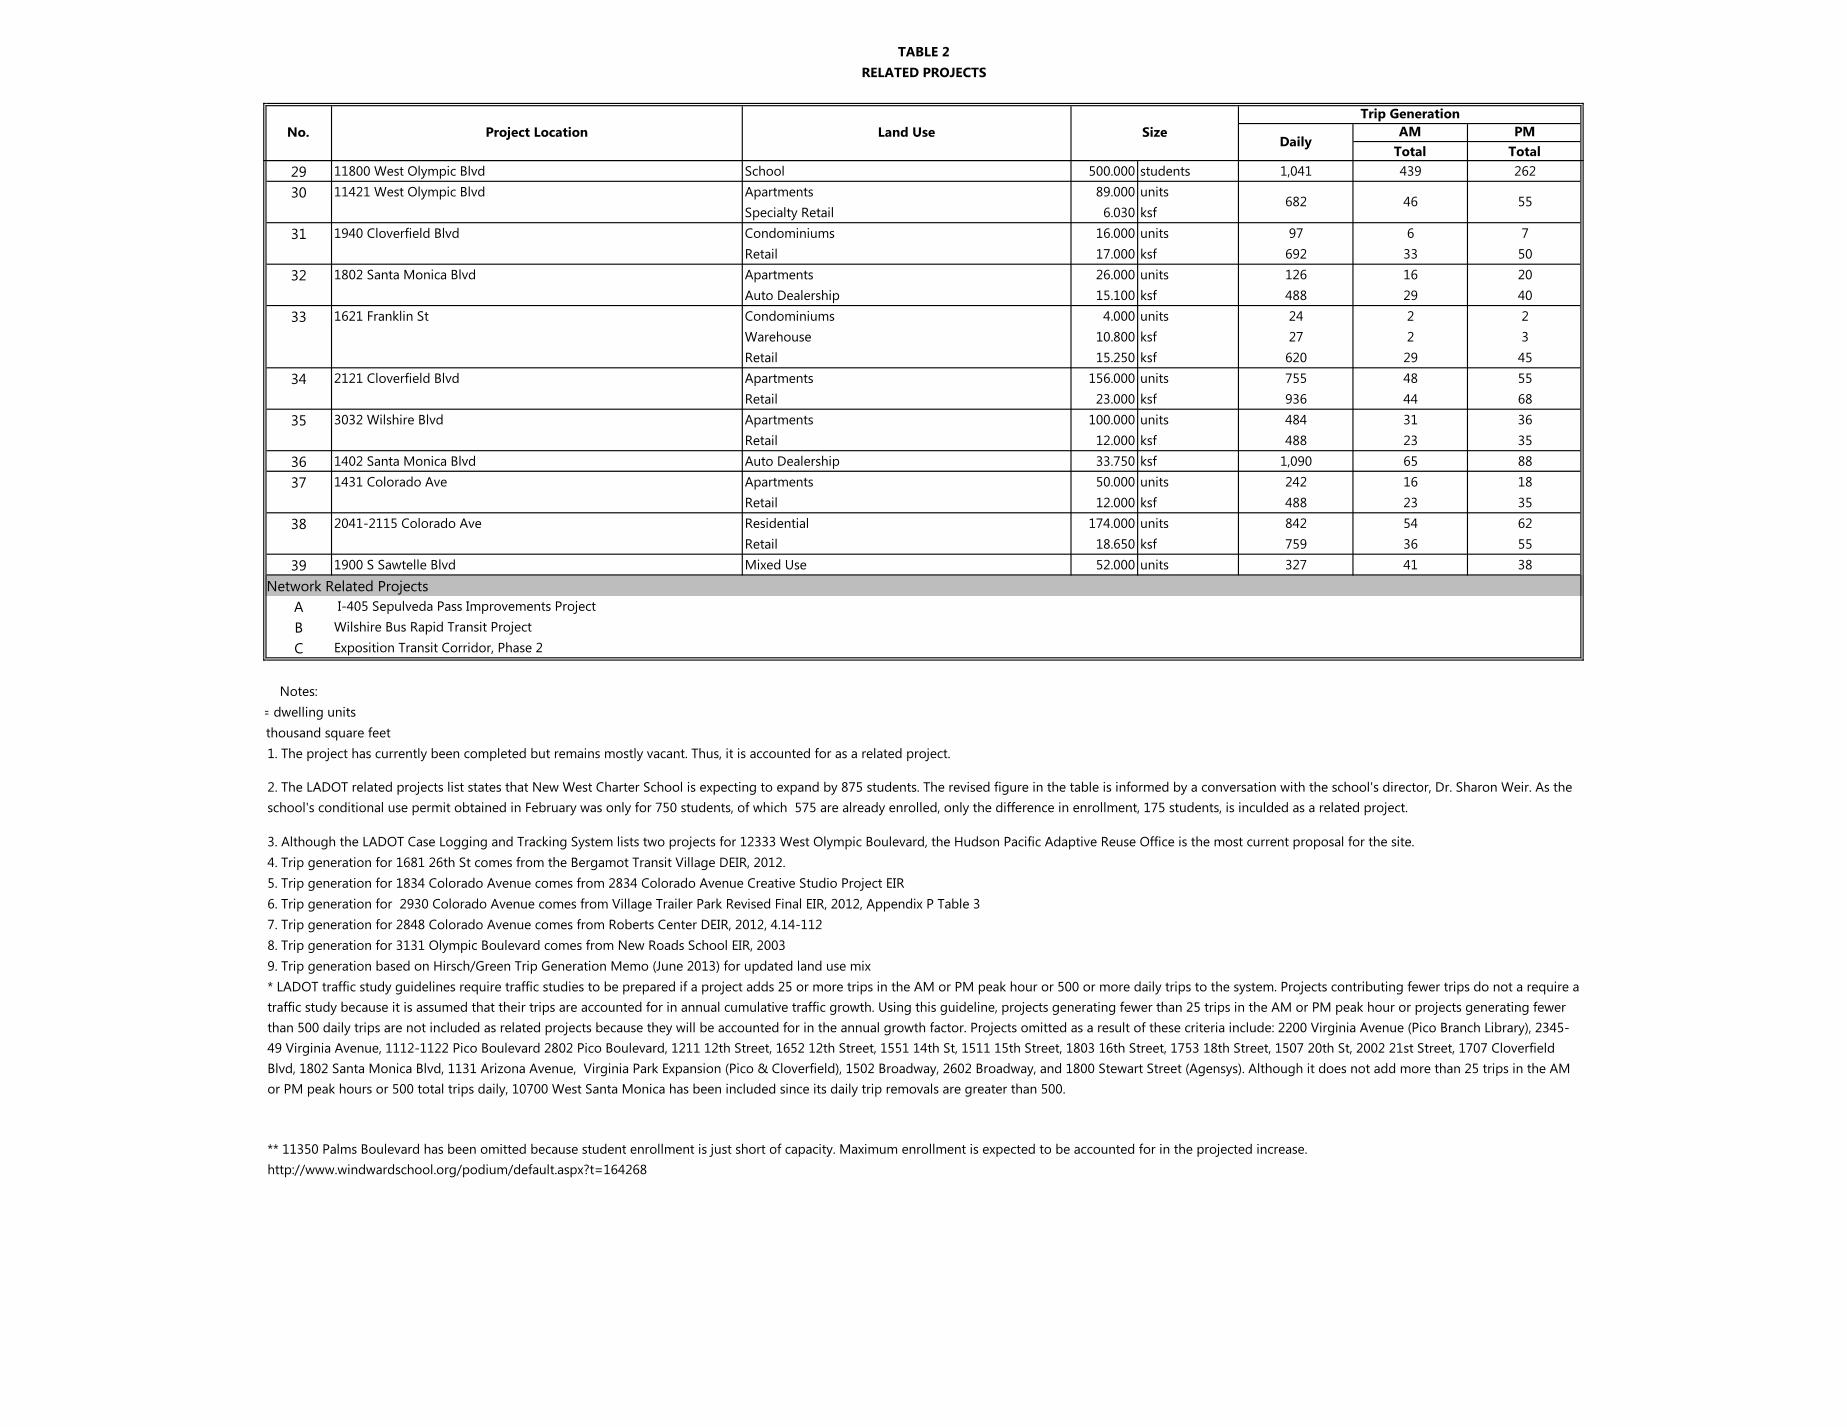
TABLE 2RELATED PROJECTS
No. Project Location Land Use SizeTrip Generation
29 11800 West Olympic Blvd School 500.000 students 1,041 439 262
30 11421 West Olympic Blvd Apartments 89.000 unitsSpecialty Retail 6.030 ksf
31 1940 Cloverfield Blvd Condominiums 16.000 units 97 6 7Retail 17.000 ksf 692 33 50
32 1802 Santa Monica Blvd Apartments 26.000 units 126 16 20Auto Dealership 15.100 ksf 488 29 40
33 1621 Franklin St Condominiums 4.000 units 24 2 2Warehouse 10.800 ksf 27 2 3Retail 15.250 ksf 620 29 45
34 2121 Cloverfield Blvd Apartments 156.000 units 755 48 55Retail 23.000 ksf 936 44 68
35 3032 Wilshire Blvd Apartments 100.000 units 484 31 36Retail 12.000 ksf 488 23 35
36 1402 Santa Monica Blvd Auto Dealership 33.750 ksf 1,090 65 88
37 1431 Colorado Ave Apartments 50.000 units 242 16 18Retail 12.000 ksf 488 23 35
38 2041-2115 Colorado Ave Residential 174.000 units 842 54 62Retail 18.650 ksf 759 36 55
39 1900 S Sawtelle Blvd Mixed Use 52.000 units 327 41 38
Network Related ProjectsA I-405 Sepulveda Pass Improvements Project
B Wilshire Bus Rapid Transit Project
C Exposition Transit Corridor, Phase 2
Notes: = dwelling units
thousand square feet
6. Trip generation for 2930 Colorado Avenue comes from Village Trailer Park Revised Final EIR, 2012, Appendix P Table 37. Trip generation for 2848 Colorado Avenue comes from Roberts Center DEIR, 2012, 4.14-112 8. Trip generation for 3131 Olympic Boulevard comes from New Roads School EIR, 20039. Trip generation based on Hirsch/Green Trip Generation Memo (June 2013) for updated land use mix
4. Trip generation for 1681 26th St comes from the Bergamot Transit Village DEIR, 2012.5. Trip generation for 1834 Colorado Avenue comes from 2834 Colorado Avenue Creative Studio Project EIR
1. The project has currently been completed but remains mostly vacant. Thus, it is accounted for as a related project.
2. The LADOT related projects list states that New West Charter School is expecting to expand by 875 students. The revised figure in the table is informed by a conversation with the school's director, Dr. Sharon Weir. As the school's conditional use permit obtained in February was only for 750 students, of which 575 are already enrolled, only the difference in enrollment, 175 students, is inculded as a related project.
3. Although the LADOT Case Logging and Tracking System lists two projects for 12333 West Olympic Boulevard, the Hudson Pacific Adaptive Reuse Office is the most current proposal for the site.
* LADOT traffic study guidelines require traffic studies to be prepared if a project adds 25 or more trips in the AM or PM peak hour or 500 or more daily trips to the system. Projects contributing fewer trips do not a require a traffic study because it is assumed that their trips are accounted for in annual cumulative traffic growth. Using this guideline, projects generating fewer than 25 trips in the AM or PM peak hour or projects generating fewer than 500 daily trips are not included as related projects because they will be accounted for in the annual growth factor. Projects omitted as a result of these criteria include: 2200 Virginia Avenue (Pico Branch Library), 2345-49 Virginia Avenue, 1112-1122 Pico Boulevard 2802 Pico Boulevard, 1211 12th Street, 1652 12th Street, 1551 14th St, 1511 15th Street, 1803 16th Street, 1753 18th Street, 1507 20th St, 2002 21st Street, 1707 Cloverfield Blvd, 1802 Santa Monica Blvd, 1131 Arizona Avenue, Virginia Park Expansion (Pico & Cloverfield), 1502 Broadway, 2602 Broadway, and 1800 Stewart Street (Agensys). Although it does not add more than 25 trips in the AM or PM peak hours or 500 total trips daily, 10700 West Santa Monica has been included since its daily trip removals are greater than 500.
** 11350 Palms Boulevard has been omitted because student enrollment is just short of capacity. Maximum enrollment is expected to be accounted for in the projected increase. http://www.windwardschool.org/podium/default.aspx?t=164268
682 46 55
!
!
!
!
!
!
!
!
!
!
!
!
!
!
!
!!
!!
!!
!
!
!
!
!
!
!
!
!
!
!
!
!
!
!
!
!
§̈¦405
§̈¦10
San Vicente Blvd
14th St
S Sepulveda Blvd
Pearl St
20th St
Blvd
Santa Monica Fwy
26th St
Wilshire
Blvd
Broad
way
Ohio Ave
Veteran Ave
S Sepulveda Blvd
S Bundy Dr
W Pico Blvd
Hill St
Barry Ave
S Barrington Ave
11th St
Pico Blvd
Ocean Park BlvdOlym
pic Blvd
Oak St
Yale St
3rdSt
W Olympic B
lvd
Sunset
Blvd
18th St
Military Ave
21st St
Exposition Blvd
Federal Ave
GrandView
Blvd
Santa
Monica Blvd
Sawtelle Blvd
Westwood Blvd
Butler Ave
S Beverly Glen Blvd
Iowa Ave
Prosser Ave
Manning Ave
25th St
Texas Ave
S Bentley Ave
28th St
Moore
St
Gay
ley
Ave
Montana Ave
Stoner Ave
Colby AveAshton Ave
10th St
Armacost Ave
Franklin St
Warner Ave
Westholm
e Ave
Wellesley Ave
Ashland AveAirport A
ve
Bonsall Ave
Hilg
ard
Ave
Dorothy St
Midvale Ave
31st St
Cloverfield Blvd
Lake St
34th St
Marine St
Stewart AveWarren Ave
Dowlen D
r
Colbert St
Farlin St
Cresce
nda St
Bay St
S Barrington Ave
h St
8
9
4
5
1
6
3
7
2
38
37
36
34
33
32
31
29
30
28
16
22
10
15 1417
2120
1211
1318
27
19
23
25
26
2435
C
B
A
RELATED PROJECTSFIGURE 3
\\fpla1\data\Jobs\Active\2500s\2524 - Martin Cadillac\Graphics\GIS\MXD\MartinCad_RelatedProjs
Not to Scale
NNNNNNN
! Related Project
Related Project
Martin Cadillac Site
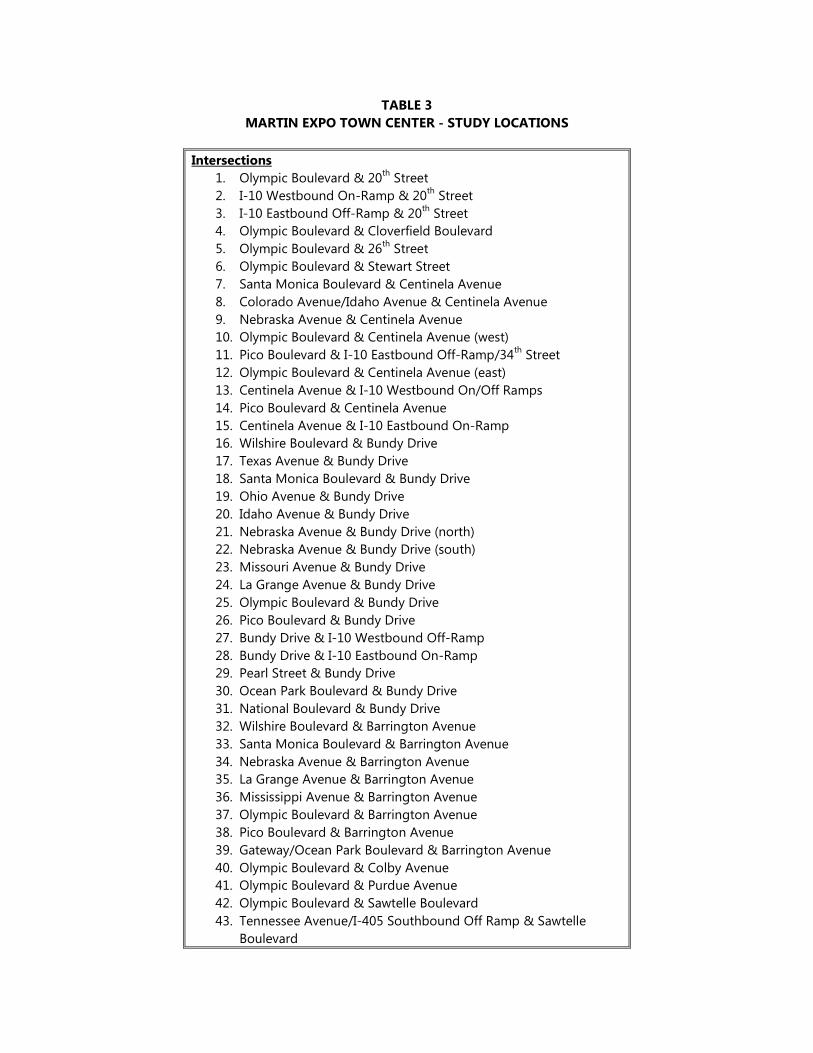
TABLE 3 MARTIN EXPO TOWN CENTER - STUDY LOCATIONS
Intersections
1. Olympic Boulevard & 20th Street 2. I-10 Westbound On-Ramp & 20th Street 3. I-10 Eastbound Off-Ramp & 20th Street 4. Olympic Boulevard & Cloverfield Boulevard 5. Olympic Boulevard & 26th Street 6. Olympic Boulevard & Stewart Street 7. Santa Monica Boulevard & Centinela Avenue 8. Colorado Avenue/Idaho Avenue & Centinela Avenue 9. Nebraska Avenue & Centinela Avenue 10. Olympic Boulevard & Centinela Avenue (west) 11. Pico Boulevard & I-10 Eastbound Off-Ramp/34th Street 12. Olympic Boulevard & Centinela Avenue (east) 13. Centinela Avenue & I-10 Westbound On/Off Ramps 14. Pico Boulevard & Centinela Avenue 15. Centinela Avenue & I-10 Eastbound On-Ramp 16. Wilshire Boulevard & Bundy Drive 17. Texas Avenue & Bundy Drive 18. Santa Monica Boulevard & Bundy Drive 19. Ohio Avenue & Bundy Drive 20. Idaho Avenue & Bundy Drive 21. Nebraska Avenue & Bundy Drive (north) 22. Nebraska Avenue & Bundy Drive (south) 23. Missouri Avenue & Bundy Drive 24. La Grange Avenue & Bundy Drive 25. Olympic Boulevard & Bundy Drive 26. Pico Boulevard & Bundy Drive 27. Bundy Drive & I-10 Westbound Off-Ramp 28. Bundy Drive & I-10 Eastbound On-Ramp 29. Pearl Street & Bundy Drive 30. Ocean Park Boulevard & Bundy Drive 31. National Boulevard & Bundy Drive 32. Wilshire Boulevard & Barrington Avenue 33. Santa Monica Boulevard & Barrington Avenue 34. Nebraska Avenue & Barrington Avenue 35. La Grange Avenue & Barrington Avenue 36. Mississippi Avenue & Barrington Avenue 37. Olympic Boulevard & Barrington Avenue 38. Pico Boulevard & Barrington Avenue 39. Gateway/Ocean Park Boulevard & Barrington Avenue 40. Olympic Boulevard & Colby Avenue 41. Olympic Boulevard & Purdue Avenue 42. Olympic Boulevard & Sawtelle Boulevard 43. Tennessee Avenue/I-405 Southbound Off Ramp & Sawtelle
Boulevard
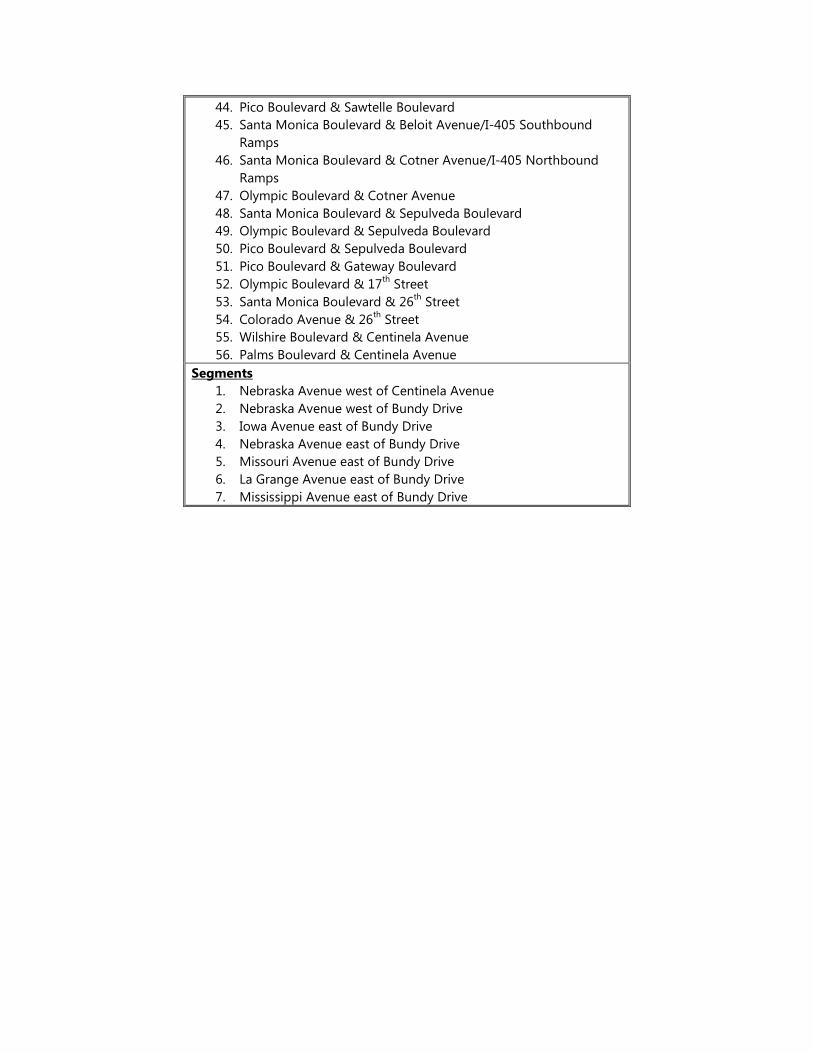
44. Pico Boulevard & Sawtelle Boulevard 45. Santa Monica Boulevard & Beloit Avenue/I-405 Southbound
Ramps 46. Santa Monica Boulevard & Cotner Avenue/I-405 Northbound
Ramps 47. Olympic Boulevard & Cotner Avenue 48. Santa Monica Boulevard & Sepulveda Boulevard 49. Olympic Boulevard & Sepulveda Boulevard 50. Pico Boulevard & Sepulveda Boulevard 51. Pico Boulevard & Gateway Boulevard 52. Olympic Boulevard & 17th Street 53. Santa Monica Boulevard & 26th Street 54. Colorado Avenue & 26th Street 55. Wilshire Boulevard & Centinela Avenue 56. Palms Boulevard & Centinela Avenue
Segments 1. Nebraska Avenue west of Centinela Avenue 2. Nebraska Avenue west of Bundy Drive 3. Iowa Avenue east of Bundy Drive 4. Nebraska Avenue east of Bundy Drive 5. Missouri Avenue east of Bundy Drive 6. La Grange Avenue east of Bundy Drive 7. Mississippi Avenue east of Bundy Drive