Embed Size (px)
Citation preview

Motor Vehicle Demand in the United StatesPresentation to the GM Board of Directors
Weyman and Morris Consulting

Agenda
US Motor Vehicle Demand and GM position – Abdulmohsen Alkhulayfi
SWOT and Research Methodology – Brett Weyman
Prediction Model Development – Abhinav Veeraraghavan
Total Vehicle Demand Forecast – Abhinav Veeraraghavan
Implications and Recommendations to the Board – Lorenzo Ruiz Pricing
Production
Inventory
Technology – Ta’Chelle Morris
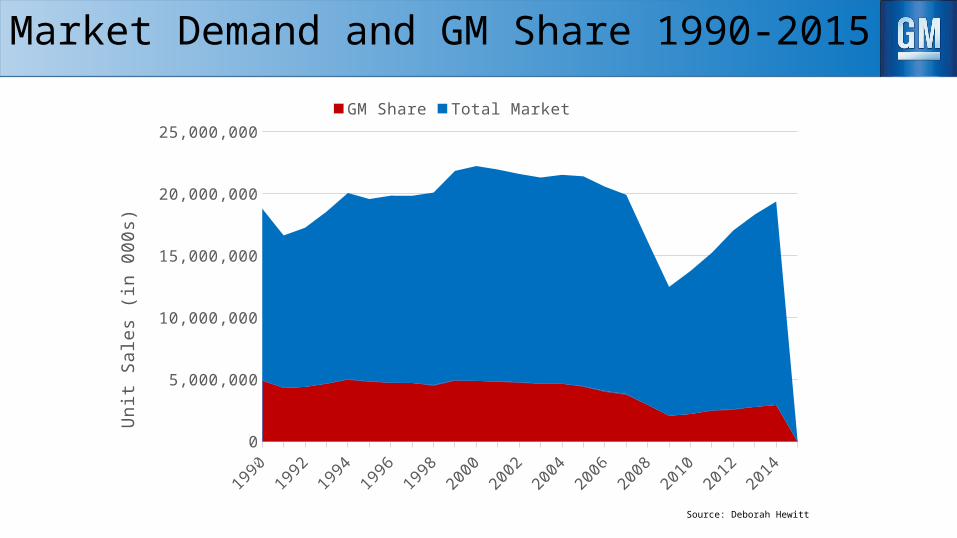
Market Demand and GM Share 1990-2015
19901992
19941996
19982000
20022004
20062008
20102012
20140
5,000,000
10,000,000
15,000,000
20,000,000
25,000,000
GM Share Total MarketU
nit S
ales
(in
000s
)
Source: Deborah Hewitt
35.6% 17.9%
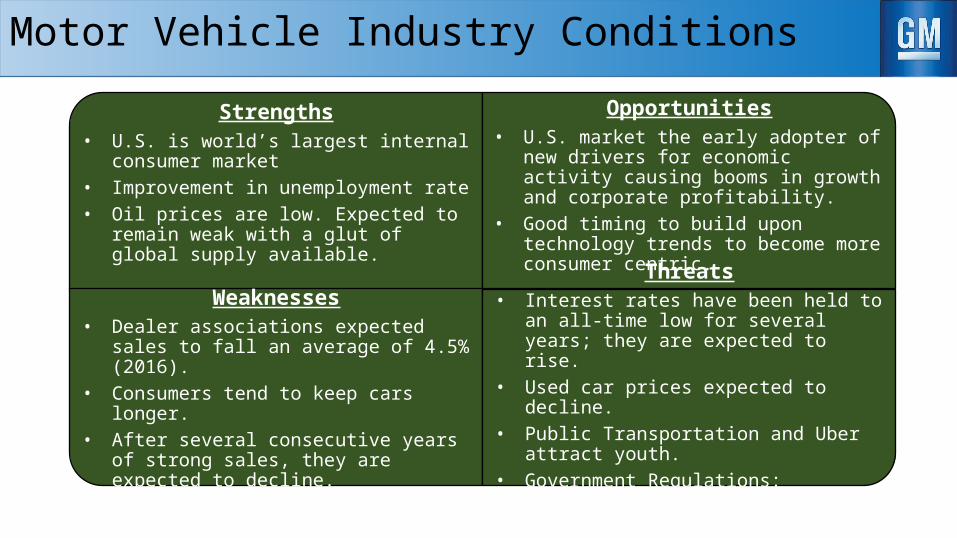
Motor Vehicle Industry Conditions
Strengths• U.S. is world’s largest internal consumer market• Improvement in unemployment rate• Oil prices are low. Expected to remain weak
with a glut of global supply available.
Opportunities• U.S. market the early adopter of new drivers for
economic activity causing booms in growth and corporate profitability.
• Good timing to build upon technology trends to become more consumer centric.
Weaknesses• Dealer associations expected sales to fall an
average of 4.5% (2016).• Consumers tend to keep cars longer.• After several consecutive years of strong sales,
they are expected to decline.
Threats• Interest rates have been held to an all-time low
for several years; they are expected to rise. • Used car prices expected to decline.• Public Transportation and Uber attract youth.• Government Regulations: Efficiency / Safety.
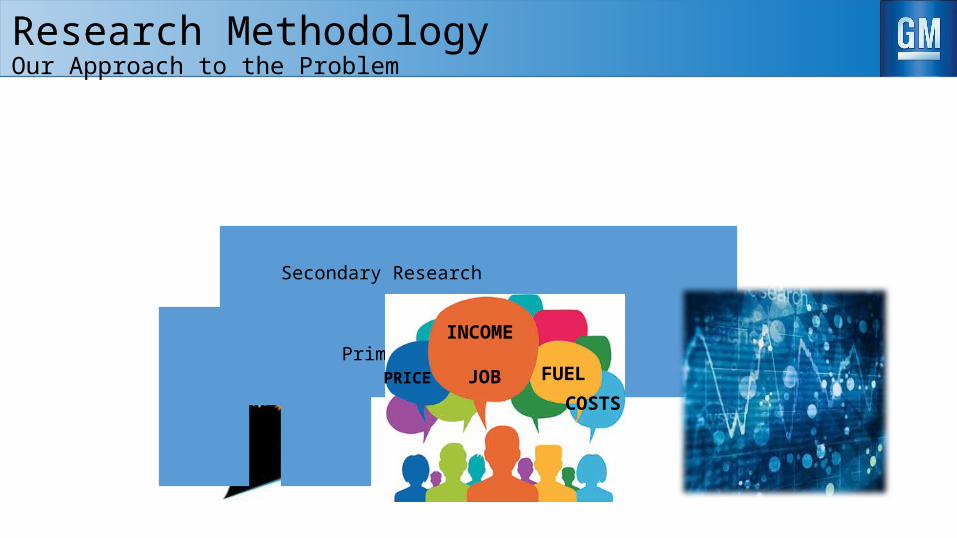
Research Methodology Our Approach to the Problem
Design Thinking Primary Research
Secondary Research
INCOME
JOB FUELPRICECOSTS
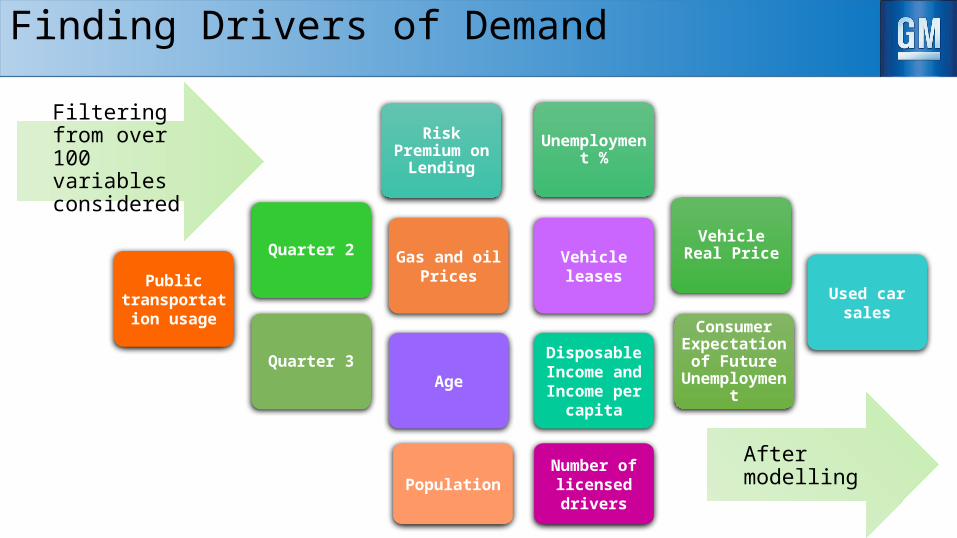
Finding Drivers of Demand
Quarter 3
Quarter 2
Risk Premium on Lending
Unemployment %
Vehicle Real Price
Consumer Expectation of
Future Unemployment
Gas and oil Prices Vehicle leases
Age
Disposable Income and Income per
capita
Number of licensed driversPopulation
Public transportation
usageUsed car sales
Filtering from over 100 variables considered
After modelling
Vehicle Demand
Quarter 2
Quarter 3
Risk Premium on Lending
Unemployment %
Vehicle Real Price
Expectation of Future
Unemployment
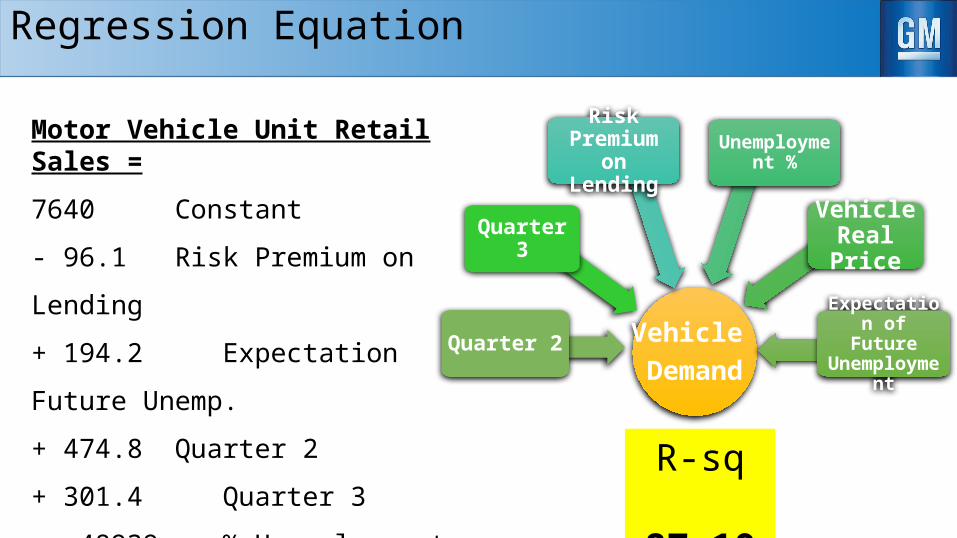
Regression Equation
Motor Vehicle Unit Retail Sales =
7640 Constant
- 96.1 Risk Premium on Lending
+ 194.2 Expectation Future Unemp.
+ 474.8 Quarter 2
+ 301.4 Quarter 3
- 48939 % Unemployment
- 0.02856 Real price R-sq 87.10%
1990 1991 1993 1995 1997 1998 2000 2002 2004 2005 2007 2009 2011 2012 20142,000
2,500
3,000
3,500
4,000
4,500
5,000
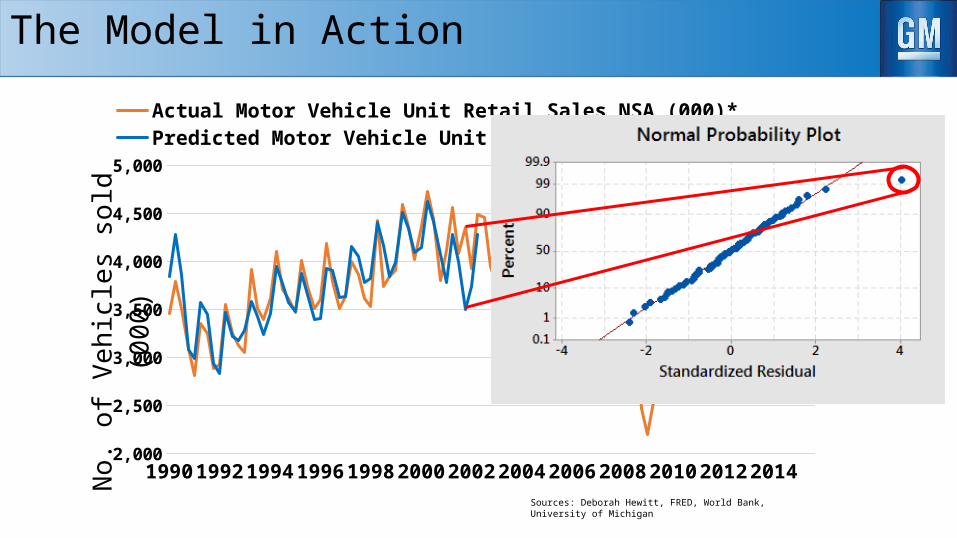
Actual Motor Vehicle Unit Retail Sales NSA (000)*Predicted Motor Vehicle Unit Retail Sales NSA (000)*
No. o
f Veh
icles
sol
d (0
00)
The Model in Action
Sources: Deborah Hewitt, FRED, World Bank, University of Michigan
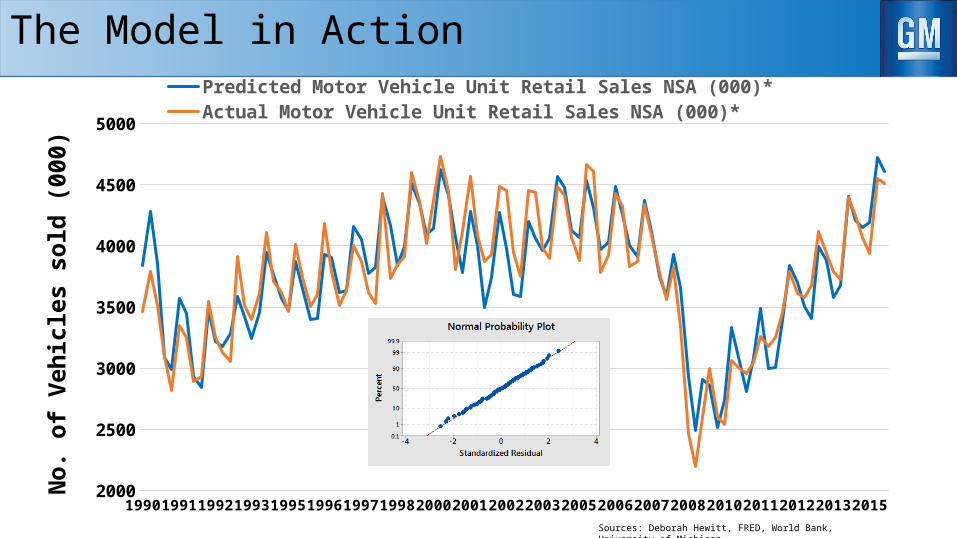
1990 1991 1992 1993 1995 1996 1997 1998 2000 2001 2002 2003 2005 2006 2007 2008 2010 2011 2012 2013 20152000
2500
3000
3500
4000
4500
5000
Predicted Motor Vehicle Unit Retail Sales NSA (000)*Actual Motor Vehicle Unit Retail Sales NSA (000)*
No.
of V
ehic
les s
old
(000
)The Model in Action
Sources: Deborah Hewitt, FRED, World Bank, University of Michigan
Q1 2015
Q2 2015
Q3 2015
Q4 2015
Q1 2016
Q2 2016
Q3 2016
Q4 2016
Q1 2017
3500
4000
4500
5000
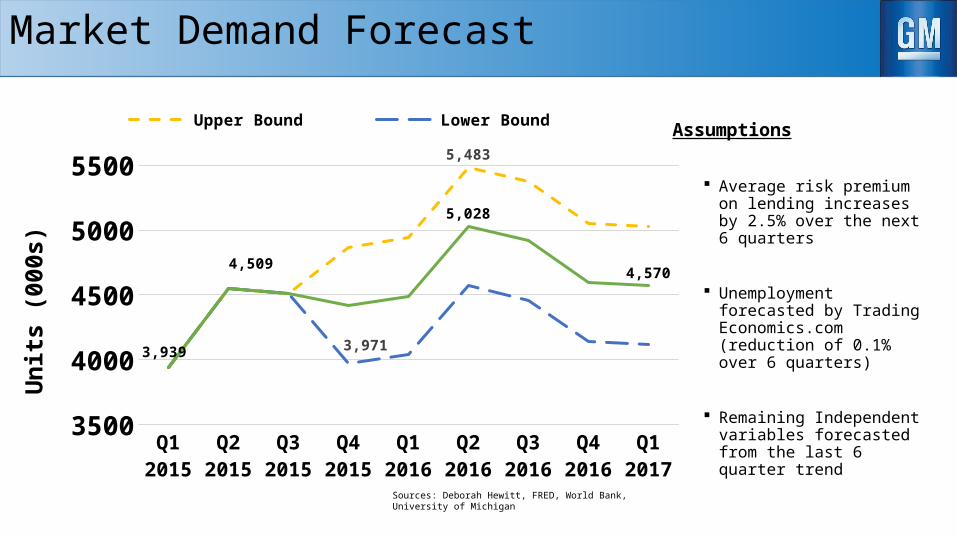
5500 5,483
3,9713,939
4,509
5,028
4,570
Upper Bound Lower BoundForecasted Demand
Uni
ts (0
00s)
Market Demand Forecast
Assumptions
Average risk premium on lending increases by 2.5% over the next 6 quarters
Unemployment forecasted by Trading Economics.com (reduction of 0.1% over 6 quarters)
Remaining Independent variables forecasted from the last 6 quarter trend
Sources: Deborah Hewitt, FRED, World Bank, University of Michigan
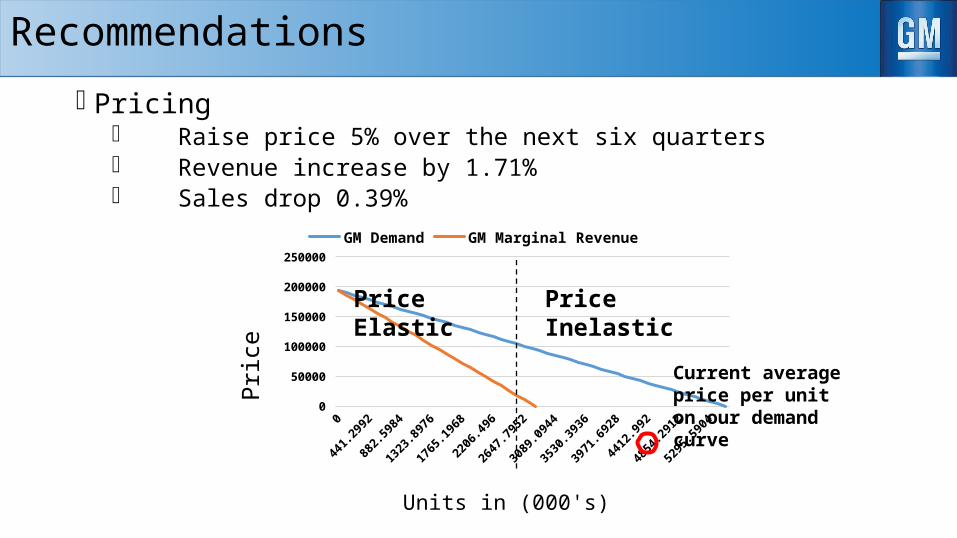
Pricing Raise price 5% over the next six quarters Revenue increase by 1.71% Sales drop 0.39%
Recommendations
0
330.9744
661.9488
992.9232
1323.8976
1654.872
1985.8464
2316.8208
2647.7952
2978.7696
3309.744
3640.7184
3971.6928
4302.6672
4633.6416
4964.616
5295.59040
50000
100000
150000
200000
250000
GM Demand GM Marginal Revenue
Units in (000's)
Pric
e
Current average price per unit on our demand curve
Price InelasticPrice Elastic
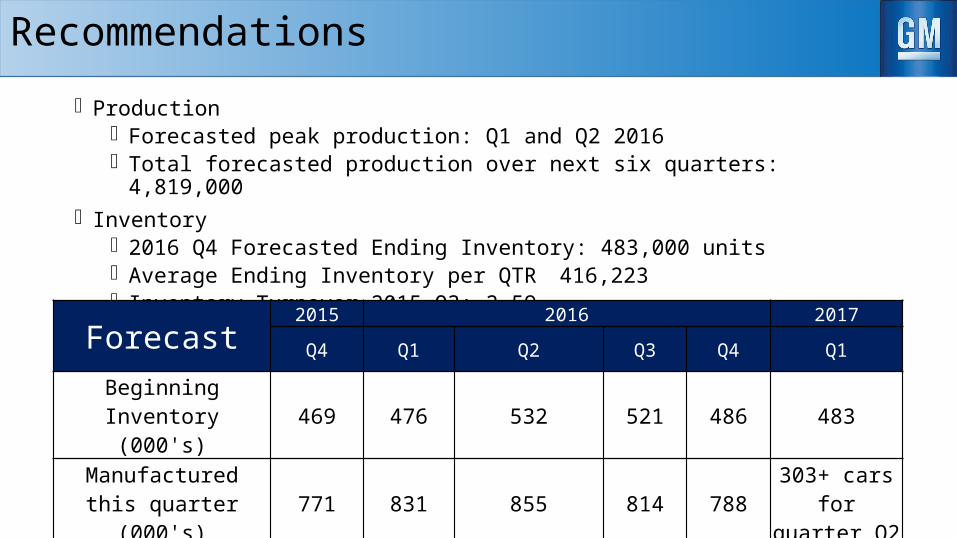
Recommendations
Production Forecasted peak production: Q1 and Q2 2016 Total forecasted production over next six quarters: 4,819,000
Inventory 2016 Q4 Forecasted Ending Inventory: 483,000 units Average Ending Inventory per QTR 416,223 Inventory Turnover 2015 Q3: 2.59
Forecast 2015 2016 2017Q4 Q1 Q2 Q3 Q4 Q1
Beginning Inventory (000's) 469 476 532 521 486 483
Manufactured this quarter (000's) 771 831 855 814 788 303+ cars for
quarter Q2Automobiles Sold in this
quarter (000's) 764 775 867 848 792 786
Ending Inventory (000's) 476 532 521 486 483
Technology
Urban Legend:
“If GM had kept up with the technology like the computer industry we would be driving $25 cars that
got 1,000 miles to the gallon.”-Bill Gates
GM Response:Who would want a car that crashes two times a day?
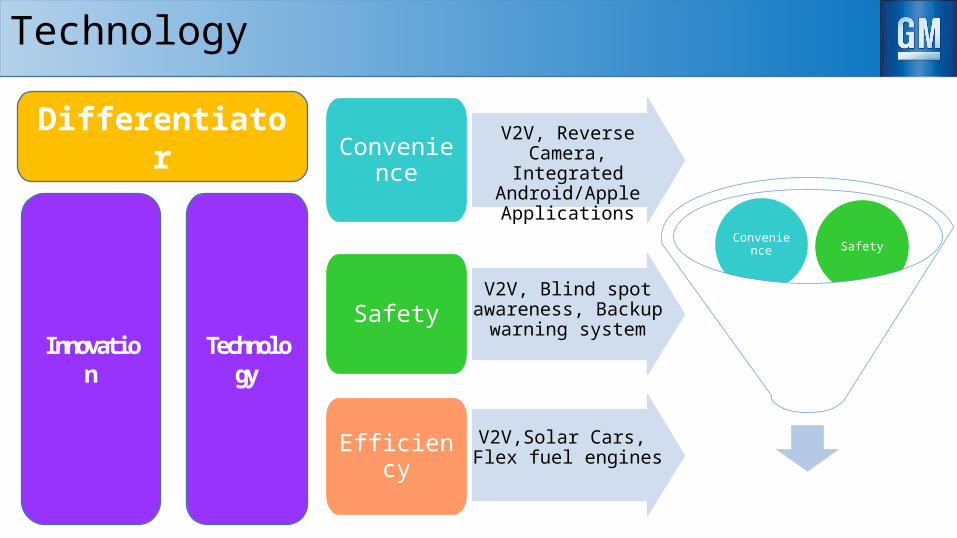
Innovation
Differentiator
Technology
V2V, Reverse Camera, Integrated
Android/Apple Applications
Convenience
V2V, Blind spot awareness, Backup
warning systemSafety
EfficiencyV2V,Solar Cars, Flex fuel
engines
Efficiency
Convenience Safety
Technology
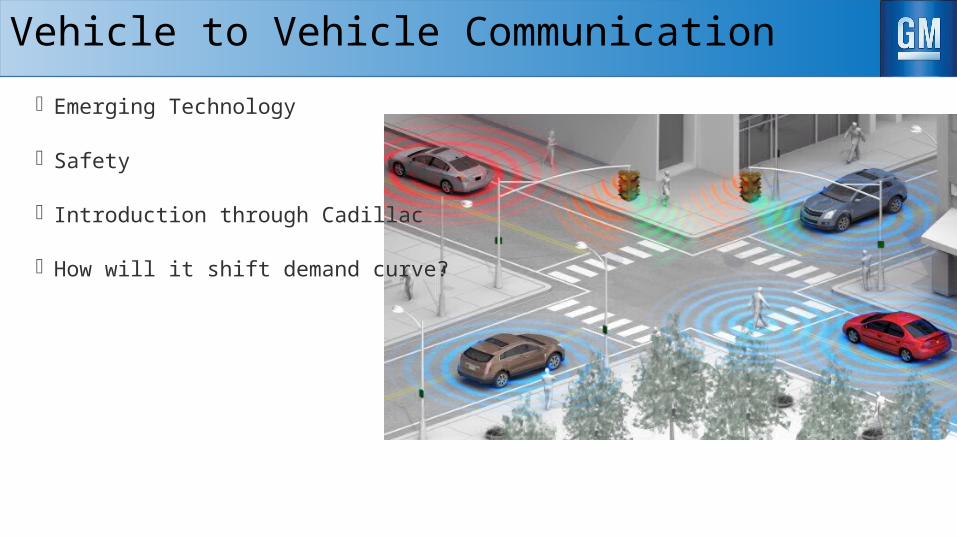
Vehicle to Vehicle Communication
Emerging Technology
Safety
Introduction through Cadillac
How will it shift demand curve?
• 32% of consumers say that safety plays the key role in their vehicle choice.
• We want the consumer to buy “YOUR” vehicle not “A” vehicle.
• OnStar Success
• All major car recalls have been based on safety standards
• Capitalize on advantage
• Minimal Cost
Why Vehicle to Vehicle Communication ?
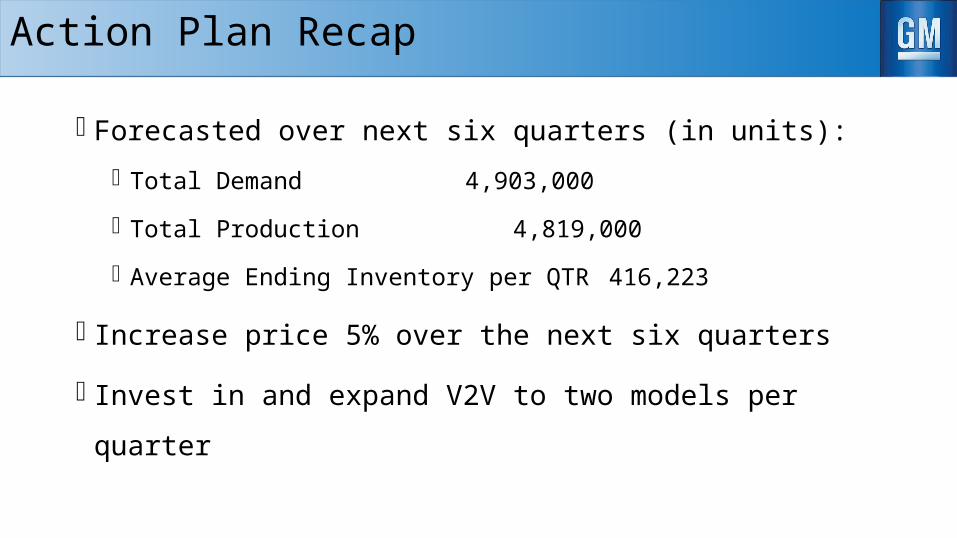
Action Plan Recap
Forecasted over next six quarters (in units):
Total Demand 4,903,000
Total Production 4,819,000
Average Ending Inventory per QTR 416,223
Increase price 5% over the next six quarters
Invest in and expand V2V to two models per quarter

Questions
Back Up Slides
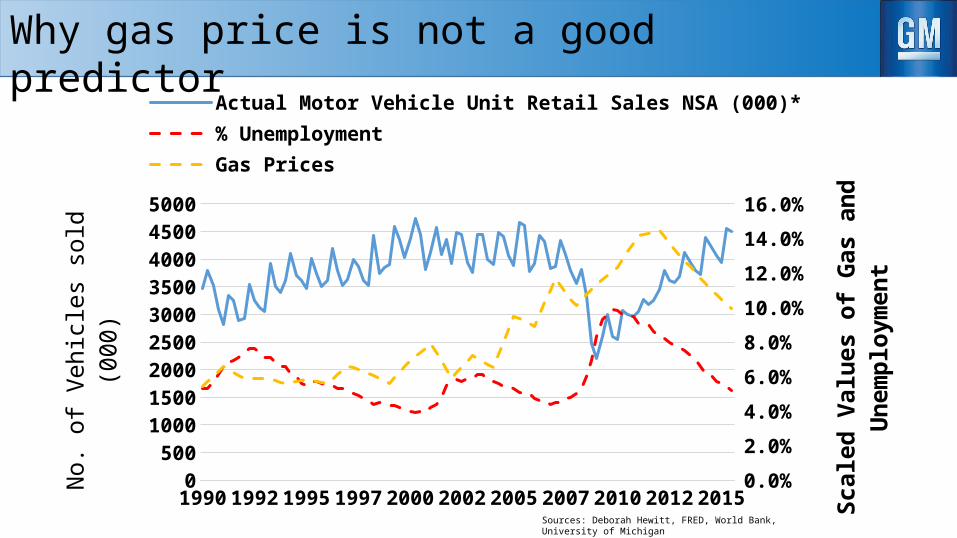
1990199119931995199719982000200220042005200720092011201220140
500100015002000250030003500400045005000
0.0%
2.0%
4.0%
6.0%
8.0%
10.0%
12.0%
14.0%
16.0%
Actual Motor Vehicle Unit Retail Sales NSA (000)*% UnemploymentGas Prices
No. o
f Veh
icle
s sol
d (0
00)
Scal
ed V
alue
s of G
as a
nd U
n-em
ploy
men
t
Why gas price is not a good predictor
Sources: Deborah Hewitt, FRED, World Bank, University of Michigan
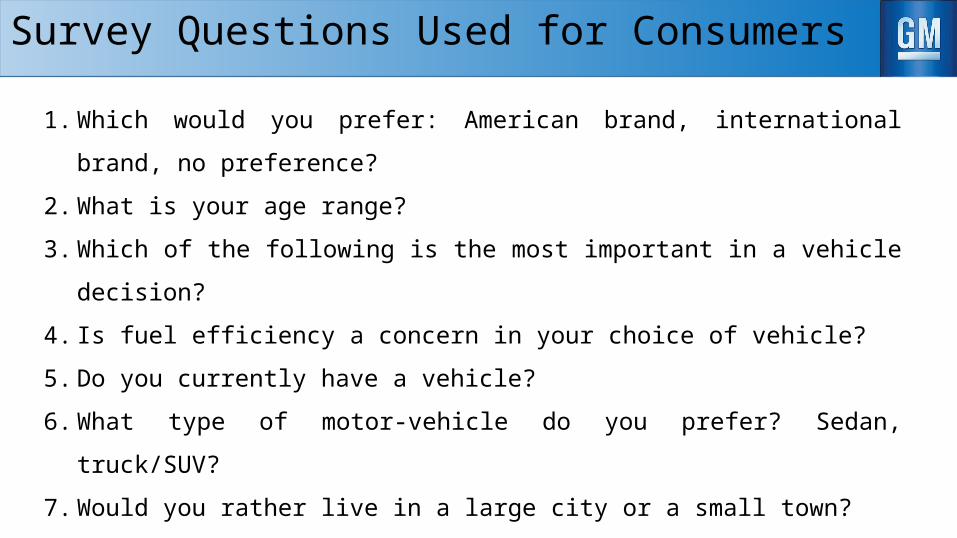
Survey Questions Used for Consumers
1. Which would you prefer: American brand, international brand, no preference?
2. What is your age range?
3. Which of the following is the most important in a vehicle decision?
4. Is fuel efficiency a concern in your choice of vehicle?
5. Do you currently have a vehicle?
6. What type of motor-vehicle do you prefer? Sedan, truck/SUV?
7. Would you rather live in a large city or a small town?
8. How much do you use public transportation?
9. How much are you willing to pay for a vehicle?
10. How long do you expect to keep your vehicle for?
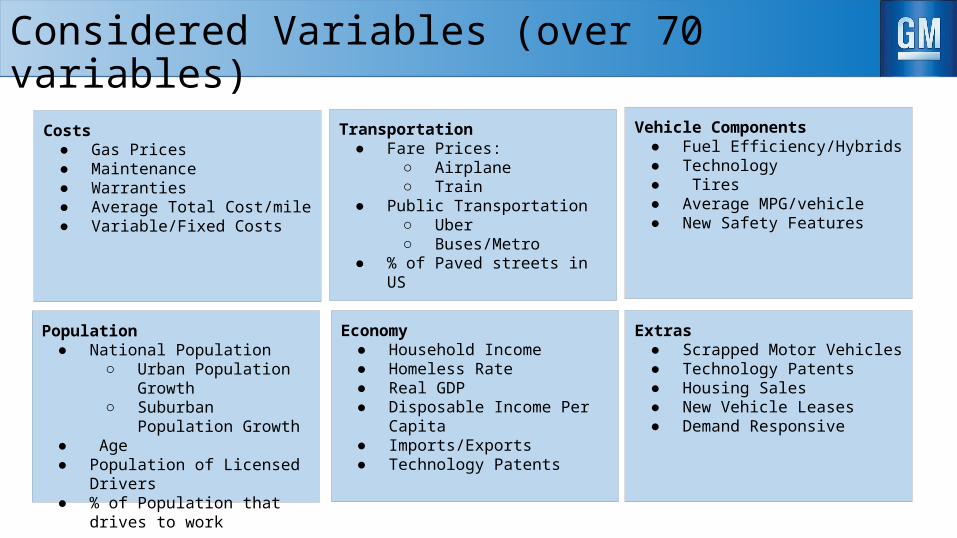
Considered Variables (over 70 variables)
Transportation● Fare Prices:
○ Airplane ○ Train
● Public Transportation○ Uber○ Buses/Metro
● % of Paved streets in US
Costs● Gas Prices ● Maintenance● Warranties ● Average Total Cost/mile ● Variable/Fixed Costs
Population● National Population
○ Urban Population Growth○ Suburban Population
Growth ● Age ● Population of Licensed Drivers ● % of Population that drives to
work
Economy ● Household Income ● Homeless Rate ● Real GDP ● Disposable Income Per Capita ● Imports/Exports ● Technology Patents
Vehicle Components● Fuel Efficiency/Hybrids● Technology ● Tires ● Average MPG/vehicle ● New Safety Features
Extras ● Scrapped Motor Vehicles ● Technology Patents ● Housing Sales ● New Vehicle Leases ● Demand Responsive
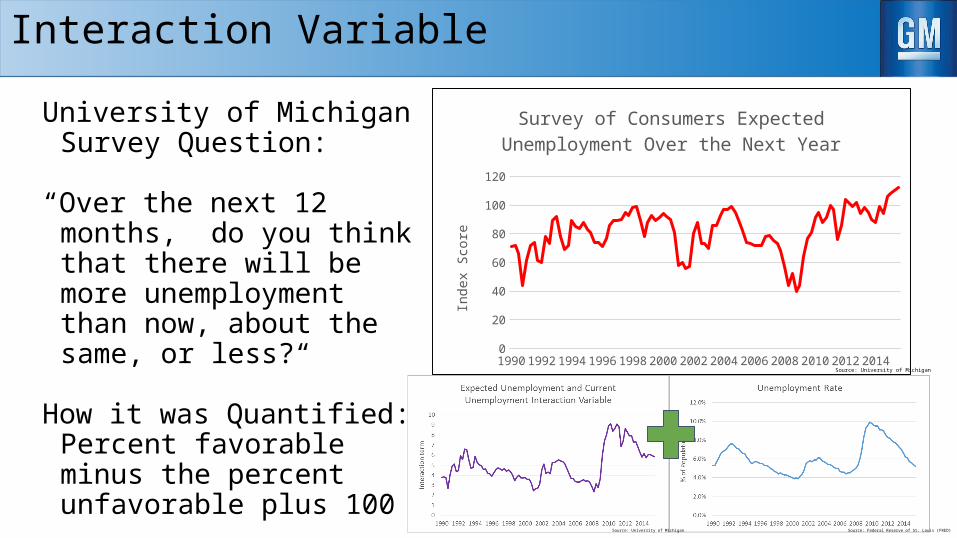
Interaction Variable
University of Michigan Survey Question:
“Over the next 12 months, do you think that there will be more unemployment than now, about the same, or less?“
How it was Quantified:Percent favorable minus the percent unfavorable plus 100
1990 1992 1994 1996 1998 2000 2002 2004 2006 2008 2010 2012 20140
20
40
60
80
100
120
Survey of Consumers Expected Unemployment Over the Next Year
Inde
x Sc
ore
Source: University of Michigan
Source: University of Michigan
Source: Federal Reserve of St. Louis (FRED)
0
0.5
1
1.5
2
2.5
3
3.5
4
4.5
5
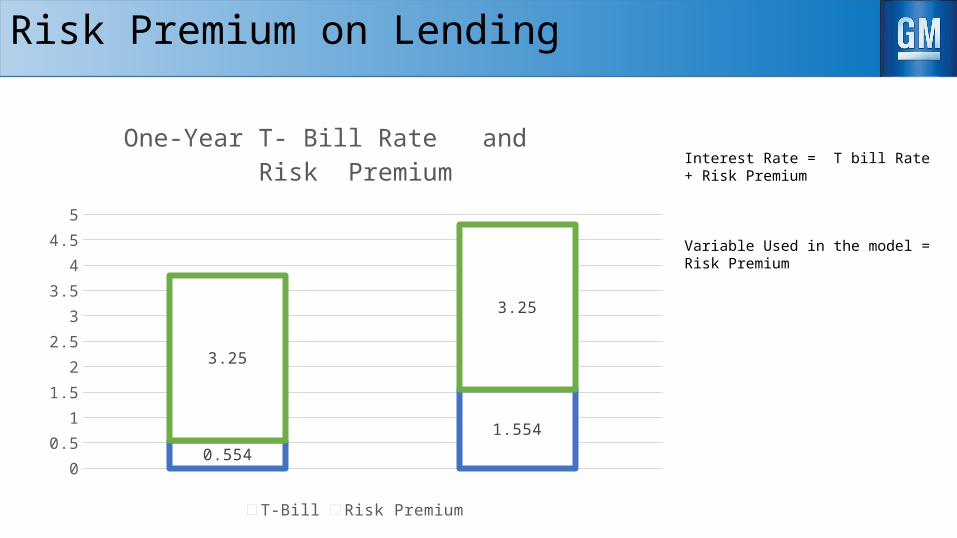
0.554
1.554
3.25
3.25
One-Year T- Bill Rate and Risk Premium
T-Bill Risk Premium
Interest Rate = T bill Rate + Risk Premium
Variable Used in the model =Risk Premium
Risk Premium on Lending
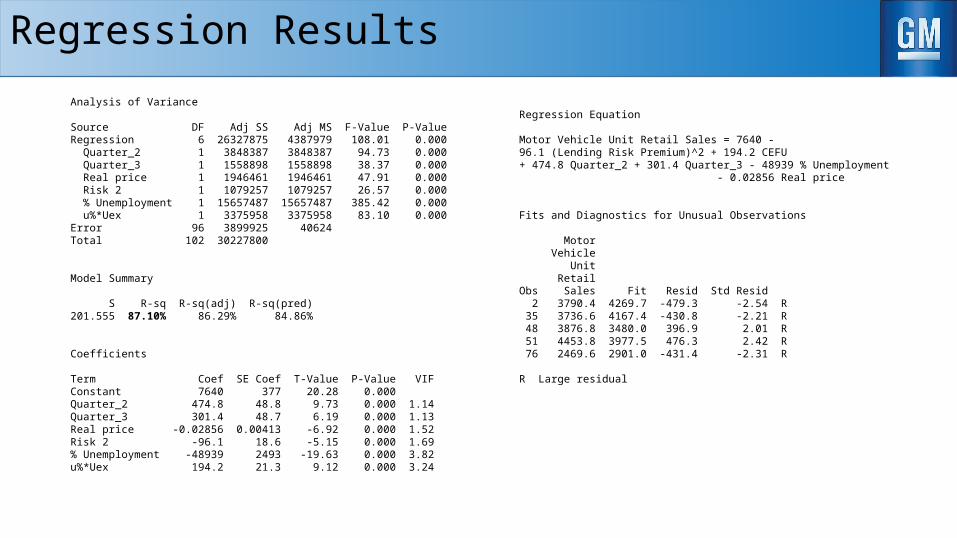
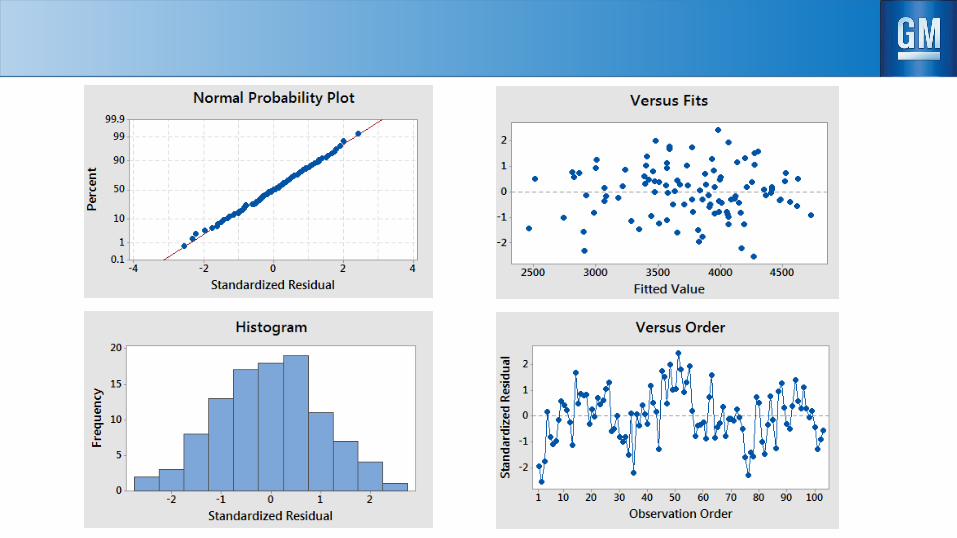
Analysis of Variance
Source DF Adj SS Adj MS F-Value P-ValueRegression 6 26327875 4387979 108.01 0.000 Quarter_2 1 3848387 3848387 94.73 0.000 Quarter_3 1 1558898 1558898 38.37 0.000 Real price 1 1946461 1946461 47.91 0.000 Risk 2 1 1079257 1079257 26.57 0.000 % Unemployment 1 15657487 15657487 385.42 0.000 u%*Uex 1 3375958 3375958 83.10 0.000Error 96 3899925 40624Total 102 30227800
Model Summary
S R-sq R-sq(adj) R-sq(pred)201.555 87.10% 86.29% 84.86%
Coefficients
Term Coef SE Coef T-Value P-Value VIFConstant 7640 377 20.28 0.000Quarter_2 474.8 48.8 9.73 0.000 1.14Quarter_3 301.4 48.7 6.19 0.000 1.13Real price -0.02856 0.00413 -6.92 0.000 1.52Risk 2 -96.1 18.6 -5.15 0.000 1.69% Unemployment -48939 2493 -19.63 0.000 3.82u%*Uex 194.2 21.3 9.12 0.000 3.24
Regression Equation
Motor Vehicle Unit Retail Sales = 7640 -96.1 (Lending Risk Premium)^2 + 194.2 CEFU + 474.8 Quarter_2 + 301.4 Quarter_3 - 48939 % Unemployment - 0.02856 Real price
Fits and Diagnostics for Unusual Observations
Motor Vehicle Unit RetailObs Sales Fit Resid Std Resid 2 3790.4 4269.7 -479.3 -2.54 R 35 3736.6 4167.4 -430.8 -2.21 R 48 3876.8 3480.0 396.9 2.01 R 51 4453.8 3977.5 476.3 2.42 R 76 2469.6 2901.0 -431.4 -2.31 R
R Large residual
Regression Results