Embed Size (px)
Citation preview

MOTORCYCLE CRASHES INTO ROADSIDE BARRIERS
STAGE 4: Protecting motorcyclists in collisions with roadside barriers
TARS Research Report
Funders: NZ Accident Compensation Corporation
with support from Main Roads Western Australia
Mike Bambach and Raphael Grzebieta
Transport and Road Safety (TARS) Research | School of Aviation | UNSW
December 2014
TRANSPORT AND ROAD SAFETY
(TARS) RESEARCH

Protecting motorcyclists in collisions with roadside barriers
i
IRMRC
TARS Research Report
Table of Contents
List of Tables ........................................................................................................................................ iii
List of Figures ...................................................................................................................................... iii
Acknowledgements ............................................................................................................................. vi
Disclaimer ............................................................................................................................................ vi
Copyright ............................................................................................................................................. vi
Executive Summary ............................................................................................................................ vii
1. Introduction ................................................................................................................................... 11
2. Method ........................................................................................................................................... 16
2.1 New Zealand motorcyclist-barrier crash study, 2001-2013 .................................................... 16
2.1.1 Non-fatal motorcyclist-barrier collisions .......................................................................... 16
2.1.2 Fatal motorcyclist-barrier collisions .................................................................................. 17
2.1.3 Motorcyclist collisions with all types of fixed objects ...................................................... 17
2.1.4 Comparison with passenger vehicle-barrier collisions ..................................................... 18
2.2 Development of motorcyclist-barrier computer simulation models....................................... 18
2.2.1 Total Human Model for Safety (THUMS) .......................................................................... 18
2.2.2 THUMS-barrier thorax-leading collision model ................................................................ 19
2.2.3 THUMS-barrier head-leading collision model ................................................................... 23
2.3 Protecting motorcyclists in collisions with steel W-beam barriers ......................................... 26
2.3.1 Rub-rail systems ................................................................................................................ 26
2.3.2 Post protectors .................................................................................................................. 27
2.3.3 Concrete barriers .............................................................................................................. 28
2.3.4 Steel W-beam barriers without blockouts (Nu-Guard) .................................................... 28
2.3.5 Parametric study ............................................................................................................... 29
2.4 Case study: Rimutaka Hill, Wellington ..................................................................................... 32
2.5 AS/NZ Standard and Roadside Design Guides ......................................................................... 32
3. Results ............................................................................................................................................ 34
3.1 New Zealand motorcyclist-barrier crash study, 2001-2013 .................................................... 34
3.1.1 Non-fatal motorcyclist-barrier collisions .......................................................................... 34
3.1.2 Fatal motorcyclist-barrier collisions .................................................................................. 34
3.1.3 Motorcyclist collisions with all types of fixed objects ...................................................... 42
3.1.4 Comparison with passenger vehicle-barrier collisions ..................................................... 44
3.2 Development of motorcyclist-barrier computer simulation models....................................... 44

Protecting motorcyclists in collisions with roadside barriers
ii
IRMRC
TARS Research Report
3.2.1 THUMS-barrier thorax-leading collision model ................................................................ 44
3.2.2 THUMS-barrier head-leading collision model ................................................................... 49
3.3 Protecting motorcyclists in collisions with steel W-beam barriers ......................................... 49
3.3.1 Rub-rail systems ................................................................................................................ 51
3.3.2 Post protectors .................................................................................................................. 55
3.3.3 Concrete barriers .............................................................................................................. 56
3.3.4 Steel W-beam barriers without blockouts (Nu-Guard) .................................................... 58
3.3.5 Parametric study ............................................................................................................... 61
3.4 Case study: Rimutaka Hill, Wellington ..................................................................................... 68
3.4.1 Motorcyclist-barrier collisions .......................................................................................... 68
3.4.2 Potential rub-rail locations ............................................................................................... 68
3.4.3 Cost-benefit analysis ......................................................................................................... 68
3.5 AS/NZ standards and roadside design guides .......................................................................... 72
3.5.1 Regulatory issues .............................................................................................................. 72
3.5.2 Motorcyclist-barrier crash testing .................................................................................... 72
3.5.3 Revised AS/NZ 3845.1: 2014 Road Safety Barrier Systems and Devices Standard .......... 76
3.5.4 Recommendations for the Australian Roadside Design Guide ......................................... 76
4. Limitations ...................................................................................................................................... 77
5. Conclusions .................................................................................................................................... 80
5.1 New Zealand motorcyclist-barrier crash study, 2001-2013 .................................................... 80
5.2 Development of motorcyclist-barrier computer simulation models....................................... 81
5.3 Protecting motorcyclists in collisions with steel W-beam barriers ......................................... 81
5.4 Case study: Rimutaka Hill, Wellington ..................................................................................... 82
5.5 AS/NZ 3845.1: 2014 Standard and roadside design guides ..................................................... 82
6. References ...................................................................................................................................... 83
7. Appendix A – European rub-rail systems ....................................................................................... 87
8. Appendix B – Validations of THUMS .............................................................................................. 88
9. Appendix C – Engineering drawings for public domain steel rub-rail systems ............................. 89
10. Appendix D – Full results of the parametric studies .................................................................... 90
11. Appendix E – Sample results for ATD-barrier collisions ............................................................... 95

Protecting motorcyclists in collisions with roadside barriers
iii
IRMRC
TARS Research Report
List of Tables
Table 1: Mechanical properties of the glass/epoxy lamina thin exterior shell of the helmet .......... 24
Table 2: Summary of injury measures and IARVs used with THUMS ................................................ 24
Table 3: Generalised injury levels of moderate, serious and critical injuries .................................... 30
Table 4: Parametric study matrix of 132 simulations ........................................................................ 31
Table 5: Relative severity of motorcyclist collisions with roadside barriers and other types of fixed objects .................................................................................................................................. 43
Table 6: Descriptive, univariable and multivariable logistic regression results for motorcyclist-fixed object collisions.................................................................................................................... 43
Table 7: Comparison of motorcyclist-barrier and passenger vehicle-barrier casualty collision frequencies .......................................................................................................................... 44
Table 8: Motorcyclist-barrier collision crash cases in the thorax-leading orientation and FE results for THUMS subjected to the initial conditions for each crash case. ................................... 45
Table 9: Key to Table 10 ..................................................................................................................... 62
Table 10: Thorax-leading collisions results (key in Table 9) .............................................................. 62
Table 11: Key to Tables 12 to 15 ........................................................................................................ 66
Table 12: Head-leading collisions with posts and post protectors (key in Table 11) ........................ 67
Table 13: Head-leading collisions with rub-rails (key in Table 11) .................................................... 67
Table 14: Head-leading collisions with concrete barriers (key in Table 11) ...................................... 67
Table 15: Head-leading collisions with Nu-Guard (key in Table 11) .................................................. 67
Table 16: Mean injury costs of motorcyclist-barrier collisions in NSW, Australia [50] ..................... 69
Table 17: Injury severity limits for ATD crash tests into rub-rail systems and simulation results .... 73
Table 18: Injury severity measures for the steel public domain systems with ATDs ........................ 73
List of Figures
Figure 1: Examples of; a) steel rub-rail system, b) padded post protector and c) continuous concrete barrier d) wheel prints on concrete barrier showing evidence of vehicle launching ........................................................................................................................... 14
Figure 2: Total Human Model for Safety (THUMS) [29] ................................................................... 19
Figure 3: Thorax-leading impact scenarios considered in the THUMS-barrier FE models for a collision angle of 15° to the longitudinal axis; a) lateral-post, b) frontal-post, c) frontal-beam orientations (top views) .......................................................................................... 20
Figure 4: Positioning of the THUMS model with respect to the posts, for a collision angle of 15° to the longitudinal axis [31] ................................................................................................... 21

Protecting motorcyclists in collisions with roadside barriers
iv
IRMRC
TARS Research Report
Figure 5: Locations for the measurement of thoracic compression and diameter; a) lateral-post, b) frontal-post, c) frontal-beam orientations. Black dots indicate the position and solid lines indicate the line along which the displacement and diameter were measured. ............. 22
Figure 6: FE model of a motorcycle helmet from scanned geometry .............................................. 23
Figure 7: Helmeted THUMS impacting a W-beam barrier post head-leading ................................. 23
Figure 8: Example of strains in the brain resulting from a severe head impact .............................. 25
Figure 9: Examples of cervical vertebral strains resulting from spine bending (dark regions indicate high plastic strains) ............................................................................................................ 25
Figure 10: Rub-rail designs for W-beam barrier with solid blockout; a) steel pipe, b) steel profiled, c) steel CSP PD, d) steel Ingal PD and e) fabric/steel flat .................................................. 27
Figure 11: C-section post with padded post protector ...................................................................... 28
Figure 12: Concrete barriers F-shape and Jersey ............................................................................... 28
Figure 13: a) Nu-Guard barrier with steel CSP DP, b) Nu-Guard trapezoidal post ............................ 29
Figure 14: Varying impact angles for a) thorax-leading collisions, b) head-leading collisions .......... 30
Figure 15: Measurement of rib deflections (D) ................................................................................. 30
Figure 16: Barrier collisions with ATDs; a) Hydrid III frontal-post, b) EuroSid2 lateral-post, c) Hydrid III head-leading post-centred and mid-span oriented ...................................................... 33
Figure 17: Rider characteristics; a) rider gender, b) rider age, c) rider position, d) rider speeding, e) rider alcohol presence, f) type of two-wheeler (n = 166) ................................................. 35
Figure 18: Barrier type (n = 132) ........................................................................................................ 36
Figure 19: Roadway characteristics; a) roadway speed zone, b) junction type, c) horizontal alignment, d) roadway type (n = 166) (SH = State Highway) ............................................ 36
Figure 20: Other characteristics; a) weather conditions, b) lighting conditions (n = 166) ................ 37
Figure 21: Injury outcome (n = 166) .................................................................................................. 37
Figure 22: Locations of non-fatal motorcyclist-barrier crashes (n = 166) ......................................... 38
Figure 23: Locations of non-fatal motorcyclist-barrier crashes near; a) Wellington, b) Auckland ... 39
Figure 24: Rider characteristics; a) rider age, b) contributing factors, c) impact posture ................ 40
Figure 25: Roadside barrier characteristics; a) barrier type, b) object the barrier is protecting ...... 40
Figure 26: Roadway characteristics; a) roadway type, b) roadway speed zone, c) horizontal alignment ........................................................................................................................... 41
Figure 27: Other characteristics; a) weather, b) day of the week ..................................................... 41
Figure 28: Proportion of motorcyclists that sustained serious (AIS3+) injuries in each of the body regions ............................................................................................................................... 42
Figure 29: Crash mechanics for the lateral-post orientation at; a) 0ms, b) 25ms, c) 50ms, 75ms (maximum thoracic compression at 25ms) ....................................................................... 46
Figure 30: Frontal-beam orientation at maximum thoracic compression ........................................ 46

Protecting motorcyclists in collisions with roadside barriers
v
IRMRC
TARS Research Report
Figure 31: Maximum compression of the thoracic bony structures and internal organs; a) lateral-post, b) frontal-post, c) frontal-beam orientations ........................................................... 47
Figure 32: Comparison of the FE model results (normalised thoracic compression from THUMS and thoracic MAIS from the motorcyclist autopsy) with PMHS experiments (Equations 2 and 3) ............................................................................................................ 48
Figure 33: Full range responses for THUMS for a collision angle of 15° to the longitudinal axis (solid lines are logarithmic trendlines), compared with AIS severity levels (Equation 2) .......... 48
Figure 34: Helmet damage from head-leading collisions with posts, a) real-world, b) FE model..... 49
Figure 35: Post impacts with 15° impact at 20km/h .......................................................................... 50
Figure 36: Steel CSP PD with 15° impact at 60km/h .......................................................................... 51
Figure 37: Steel CSP PD with 30° impact at 60km/h .......................................................................... 52
Figure 38: Steel CSP PD with 45° impact at 60km/h .......................................................................... 53
Figure 39: Fabric with high stiffness connectors and with 15° impact at 60km/h ............................ 54
Figure 40: Post protectors with 15° impact at 20km/h ..................................................................... 55
Figure 41: Example deformations in the post protectors; a) high stiffness, b) low stiffness ............ 55
Figure 42: Concrete Jersey barrier with 15° impact at 60km/h ......................................................... 56
Figure 43: Ride-up onto the Jersey barrier; a) thorax-leading, b) head-leading ............................... 57
Figure 44: Steel CSP PD with Nu-Guard and with 15° impact at 60km/h .......................................... 58
Figure 45: Steel CSP PD with Nu-Guard and with 30° impact at 60km/h .......................................... 59
Figure 46: Comparison of cervical spine bending in head-leading collisions with different barriers 60
Figure 47: Summary of thorax-leading impacts with rub-rails and with 15° impact; a) all rub-rails, b) fabric rub-rails, c) flat steel rub-rails, d) profiled steel rub-rails ....................................... 63
Figure 48: Thorax-leading impacts with steel CSP PD and with 15° to 45° impacts .......................... 64
Figure 49: Thorax-leading impacts with concrete barriers; a) F-shape and Jersey barriers with 15° impact, b) Jersey barriers with 15° to 45° impacts ........................................................... 64
Figure 50: Map of Rimutaka Hill motorcycle collisions with steel W-beam barriers, 2001 - 2013 ... 70
Figure 51: Map of Rimutaka Hill potential rub-rail locations ............................................................ 71
Figure 52: Steel CSP PD with Hybrid III and with 30° impact at 60km/h ........................................... 74
Figure 53: Comparison of ATD and THUMS kinematics ..................................................................... 75

Protecting motorcyclists in collisions with roadside barriers
vi
IRMRC
TARS Research Report
Acknowledgements
The bulk of the research presented in this report was funded by the New Zealand Accident Compensation Corporation (NZ ACC) with a supporting contribution from Main Roads Western Australia (MRWA). The report is a continuation of a major TARS/IRMRC study investigating ‘Motorcycle Crashes Into Roadside Barriers’. The support and assistance of Anna Long and the Motorcycle Safety Advisory Council for providing the bulk of the funds, with the additional contribution from David Moses from MRWA, to assist in completing the last phases of the major research program that began some seven years ago in early 2008, is greatly appreciated.
The research presented in this report builds on the previous research investigating Motorcycle Crashes Into Roadside Barriers. Hence, the Authors wish to acknowledge the then NSW Centre for Road Safety, Road and Transport Authority (RTA), New Zealand Transport Agency, Western Australia Road Safety Council and Main Roads Western Australia, NSW Motor Accident Authority (MAA), the Australian Automobile Association (AAA), and the NRMA-ACT Road Safety Trust who contributed in one form or another to the research reported over the past seven years, and which underpins in some form the research presented in this report.
The authors wish to thank the New Zealand Coroner’s Court, Ministry of Justice, for access to the Coronial files, particularly Rani Kandiah, and the New Zealand Transport Agency for access to the Crash Analysis System, particularly Brendan Worthington.
Disclaimer
The analyses, conclusions and/or opinions presented in this report are based on information noted and made available to the Authors at the time of its writing. Further review and analyses may be required should additional information become available, which may affect the analyses, conclusions and/or opinions expressed in this report.
While the project as a whole, has been widely researched and developed on the basis of material researched and collected over the past seven years, with much input from many sources in New Zealand, Australia and worldwide, the research methods, conclusions and recommendations in this specific report (and previous completed reports which underpin this report), are the responsibility of the Authors. Any views expressed in this report, are not necessarily those of the funding agencies acknowledged here, or others who have assisted with the overall Project and any previous reports. The research conclusions are those of the authors alone.
This report (any associated reports referred to) and the results presented are made in good faith and are for information only. It is the responsibility of the user to ensure the appropriate application of these results if any, for their own requirements. While the Authors have made every effort to ensure that the information in this report was correct at the time of publication, the Authors do not assume and hereby disclaim any liability to any party for any loss, damage, or disruption caused by errors or omissions, whether such errors or omissions result from oversight, or any other cause.
Copyright
This publication may be redistributed freely in its entirety and in its original form without the copyright owner’s consent. Use of material contained in this publication in any other published works must be appropriately referenced, and, if necessary, permission sought from the authors.

Protecting motorcyclists in collisions with roadside barriers
vii
IRMRC
TARS Research Report
Executive Summary
This report presents the results of Stage 4 of the Motorcycle Crashes into Roadside Barriers research program. Stage 1 determined the human, vehicle and environmental crash characteristics and causal factors associated with fatal motorcycle-barrier collisions in Australia and New Zealand between 2001 and 2006. Stage 2 investigated the crash mechanics and biomechanical injury causation in these crashes. Stage 3 involved a survivability analysis of motorcyclists colliding with roadside barriers, and other types of fixed roadside objects. The main objective of Stage 4 is to consider engineering design modifications to road barriers that are effective in reducing injuries to riders and pillions involved in roadside barrier crashes but will not reduce current crash safety characteristics for occupants of vehicles in cars, trucks and busses.
While motorcyclist collisions with roadside barriers are relatively rare events in Australia and New Zealand, they can result in serious and fatal injuries. For example, fatalities constitute around 4% to 6% of all motorcycle fatalities and typically around 0.01% of all road fatalities. To date the design of roadside barriers has been based on passenger vehicle occupant safety which is understandable as these constitute the greater number of roadside and median crash fatalities and serious injury casualties. However, the injury potential of such devices to motorcyclists has not been considered at all in their development until recently. Improving roadside barrier design for motorcycling safety will assist in reducing motorcycling trauma on Australian and New Zealand roadways in black spot areas where motorcyclists regularly ride and have crashes. Previous studies (Stages 1 to 3) have established an understanding of the nature of motorcyclist-barrier collisions. The focus of this present Stage 4 study is twofold. Firstly, to provide an understanding of how motorcyclists can be better protected in collisions with W-beam barriers and what the limitations are when concrete barriers are used. Secondly, to provide background information why the revision of the Australian/ New Zealand AS/NZ 3845.1: 2014 Road Safety Barrier Systems and Devices Standard now includes a motorcycle into barrier crash test requirement based on the European (EN1317 Part 8) for testing road a safety barrier systems in New Zealand and Australia that is claimed to be crashworthy (protective) for a motorcyclist impacting the barrier.
In this study, statistical analyses of motorcyclist collisions with fixed hazards indicate that posts and poles are significantly more hazardous to motorcyclists than roadside barriers regardless of barrier type or whether the barrier has been tested for motorcycle impact crashworthiness. This analysis supports the use of barriers in front of such fixed objects to improve the safety of the roadside for motorcyclists. However, this New Zealand crash study again indicates (and supports previous studies from this program, e.g. Stage 3, and European and US studies) that barriers are substantially more hazardous to motorcyclists than passenger vehicle occupants in the case of barriers not designed for motorcycle crashworthiness, where 50% of motorcyclist-barrier casualty collisions resulted in serious or fatal injury, while only 13% for vehicle occupants. This demonstrates the substantial opportunity to improve roadside barrier design for motorcyclists, particularly in areas where motorcyclists regularly crash into road safety barriers.
Several methods for protecting motorcyclists in collisions with road safety barriers are assessed. Since 77% of casualties and 61% of fatalities of all motorcyclists into barriers resulted from collisions with steel W-beam barriers, the methods address these barriers in particular, and include; installing rub-rails, post paddings or installing continuous concrete barrier instead of a W-beam barrier (a common proposal argued by motorcycle lobby groups). Wire-rope barriers (WRB) have not been assessed in this report, mainly because of limited funds and their infrequency of

Protecting motorcyclists in collisions with roadside barriers
viii
IRMRC
TARS Research Report
involvement in injury casualty crashes. Of the entire number of motorcyclist into barrier crashes, wire-rope barrier impacts constitute around 4% of casualty crashes and 17% of fatalities, which in turn is 0.6% of all motorcycle fatalities and 0.04% of all motorcycle casualty crashes and around 0.06% and 0.002% of all of New Zealand’s road fatalities and casualties respectively, i.e. they are very rare crash events. WRBs will be considered in a later project pending further funding.
Continuous barriers (rub-rails and concrete barriers) are shown to provide substantially lower injury potential than W-beam barriers, since the motorcyclist is redirected along/away from the barrier and does not impact the barrier posts. The most effective method for protecting around half of the motorcyclists who potentially can impact a W-beam barrier is to install rub-rails. A steel W-beam barrier with rub-rails is shown to provide lower injury potential to motorcyclists than concrete barriers (when the motorcyclist slides into the barrier which is around half of the motorcycle into barrier crashes). Such a system is shown to prevent serious motorcyclist injuries for most practical collision orientations and speeds. Post paddings are shown to be marginally effective since a post impact is not prevented, and are only effective at very low impact speeds.
The implementation of rub-rails to W-beam barriers in a popular motorcycling area with a high density of motorcyclist-barrier collisions is demonstrated with a case study of a black spot area for motorcyclists (Rimutaka Hill, Wellington, identified from the crash study). A cost-benefit analysis indicates that rub-rail installations are likely to be cost effective in such black spot areas.
Some regulatory issues are identified that may have been restricting the implementation of rub-rail systems, at a much greater scale than presently appears to be occurring in Australia, and to significantly improve motorcycling safety in such crashes in New Zealand. While several states in Australia have installed many kilometres of rub-rails in motorcycle into barrier impact black spot areas, these represent a small fraction of the road network where such systems could be potentially installed, and none has been installed in New Zealand. This present Stage 4 study provides the engineering evidence that rub-rail systems provide substantial reductions in injury potential for motorcyclists in the case of a motorcyclist sliding impact into typical W-beam barriers installed in New Zealand and Australia. This study also provides further supporting evidence for the motorcycle into barrier sliding EN 1317 based test protocol in the 2014 revision of AS/NZ 3845.1: 2014 about to be released, and of its appropriateness in terms of a manufacturer providing evidence that their barrier is crashworthy for motorcyclists for the sliding crash scenario. The study also highlights that impact into a concrete barrier at speeds of 80 km/h or higher at a typical impact angle (around 15 degrees), and at higher impact angles (30 and 45 degrees) at lower speeds of 60 km/h or possibly less, can result in serious or fatal injury. Care is also needed in recommending concrete barriers be installed in place of W-beam barriers as this may worsen outcomes for other road users, e.g. car occupants. The simulations in this report provides evidence that further support the lowering of speed limits for motorcyclists to at least 80 km/h on arterial roads and highways where concrete barriers have been installed.
Some further recommendations are made with regards to additional analyses, crash testing and design guidance that could be implemented in future revisions of the presently revised Australian and New Zealand road safety barrier standard (AS/NZS 3845.1: 2014 Road Safety Barrier Systems and Devices) and any roadside design guides. The recommendations are consistent with those made in the revised AS/NZS 3845.1: 2014 Standard, i.e. consider the development of a motorcyclist impacting the barrier in a seated upright position. These might assist road authorities and motorcycle safety stakeholders making decisions regarding the design and installation of roadside barriers that are most effective for motorcycling safety in areas where motorcyclists are

Protecting motorcyclists in collisions with roadside barriers
ix
IRMRC
TARS Research Report
at greatest risk of a motorcycle into barrier impact, and what future work still needs to be carried out in regards to further improving their safety.
Key results include:
a total of 20 fatal and 166 non-fatal motorcyclist into barrier casualty collisions occurred in New Zealand during the study period of 2001 – 2013;
a total of 474 motorcyclists were killed and 12,532 were injured in New Zealand during the study period of 2001 – 2013;
around 4.2% of motorcycle fatalities and around 1.3% of those motorcyclists injured involved a barrier impact. This constitutes around 0.4% of all road fatalities and around 0.1% of all road injuries during the study period of 2001 – 2013;
of all 186 motorcyclist into barrier casualties, 39% sustained serious injuries and 11% sustained fatal injuries;
during the same period there were 1,640 passenger vehicle-barrier casualty collisions, of which only 11% sustained serious injuries and 1.4% sustained fatal injuries;
while motorcyclists comprise only 3% of the vehicle fleet, nearly as many motorcyclists (20) were killed in roadside barrier collisions as passenger vehicle occupants (23);
78% of non-fatal and 61% of fatal motorcyclist-barrier casualty collisions were with steel W-beam barriers – i.e. 77% of all 186 casualties;
these collisions typically involved male riders, on State Highway 100km/h speed zone roadways, on curves, in daytime and fine conditions;
the sliding and upright crash postures were equally represented in fatal collisions. Only sliding crash postures into W-beam and barriers were considered in this report, i.e. a little less than around half of the potentially injurious events for motorcyclists impacting a roadside barrier;
risky riding behaviours such as alcohol or drug use and/or excessive speed were evident in 33% of non-fatal and 50% of fatal motorcycle into barrier impact crashes;
serious thoracic injury was sustained by all fatally injured motorcyclists, and serious head and abdominal injuries also occurred frequently;
statistical analyses indicated that collisions with posts and poles were significantly more likely to result in serious or fatal injuries than barriers, which supports the use of barriers in front of such fixed objects to improve the safety of the roadside for motorcyclists;
computer simulations using the THUMS human body model were developed for motorcyclists sliding into barriers in the thorax-leading and head-leading sliding orientations, and shown to provide realistic representations of these collision types;
models of various techniques for protecting motorcyclists in sliding collisions into W-beam barriers were developed, including installing rub-rail systems, post protectors
models for motorcyclists collisions sliding into a continuous concrete barrier were also developed;
a wide variety of impact angles and speeds between 15° and 45° and 20km/h and 100km/h were simulated in a parametric study, as were a wide variety of rub-rail system properties;

Protecting motorcyclists in collisions with roadside barriers
x
IRMRC
TARS Research Report
all rub-rails prevented serious thoracic injury for all angles and speeds considered;
all rub-rails except those with low stiffness connectors prevented serious head-neck injury at 15° impact angles, however at high impact angles and speeds serious/critical injuries were predicted;
since 15° is the average impact angle in motorcyclist-barrier collisions, rub-rails are predicted to prevent serious injuries (head, neck and chest) at the average collision angle at all impact speeds up to 100km/h for half of the W-beam barrier impacts;
concrete barriers prevented serious injuries at 15° impact angles for speeds up to 80 km/h, however at higher speeds at 15 degrees and higher impact angles at around 60 km/h the potential for serious injury was much higher than for rub-rails. Care is also needed in recommending barriers be installed in place of W-beam barriers as this may worsen outcomes for other road users, e.g. car occupants;
steel W-beam barriers without blockouts (such as Nu-Guard) were predicted to provide similar performance to those with blockouts, when protected with rub-rails;
if rub-rails were installed on all W-beam barriers it would potentially only address around 2% of all motorcycle fatalities and less than 0.5 % of all seriously injured motorcyclists who crash. However, targeting black spot areas with retro-fitting rub-rails to existing W-beam barriers, where motorcyclists are over-represented in traffic and crashes (e.g. mountainous and coastline tourist roads), appears to be cost-effective. Similarly, any new installations of W-beam in such black spot areas would also be cost-effective.

Protecting motorcyclists in collisions with roadside barriers
11
TARS Research Report
IRMRC
1. Introduction
This report presents the results of Stage 4 of the Motorcycle Crashes into Roadside Barriers research program. The main objective of Stage 4 is to consider engineering design modifications to road barriers that are effective in reducing injuries to riders and pillions involved in roadside barrier crashes but will not reduce current crash safety characteristics for occupants of vehicles in cars, trucks and busses.
The Motorcycle Crashes into Roadside Barriers research program began in early 2008 as a result of concerns by motorcycle organisations in New Zealand, Australia and overseas, regarding the use of wire rope barriers. The program spans around seven years of research work investigating this road safety issue. Roadside barriers are typically concrete, guardrail and wire-rope. The research program was intended to inform such public debate and policy, and propose scientifically validated solutions, in regards to the safety or otherwise of motorcycle riders and pillions impacting all forms of roadside barriers and not just wire-rope barriers. The program not only investigated the engineering and crashworthiness or otherwise of motorcycle involved barrier impacts but also the human factors issues leading up to and precipitating the crash.
Pooled funding for the program was provided by the then NSW Centre for Road Safety, Road and Transport Authority (RTA), New Zealand Transport Agency, Western Australia Road Safety Council and Main Roads Western Australia, NSW Motor Accident Authority (MAA), the Australian Automobile Association (AAA), and more recently by the NRMA-ACT Road Safety Trust via their research grant scheme. The bulk of the funding for this Stage 4 Report is provided by the New Zealand Accident Compensation Corporation (ACC) with additional funding support from MRWA. All previous funders contributed in one form or another to the research reported over these past seven years, and underpins in some form the research presented in this specific report.
In summary, the Motorcycle Crashes into Roadside Barriers research program was tasked to provide the following outcomes:
a. A statistical overview of motorcycle rider/pillion passenger involvement in roadside and median barrier crashes employing NCIS data and fatality case files;
b. The causal human factors (speed, alcohol, fatigue, inexperience, bad cornering technique, etc.) that lead to motorcycle/rider/pillion impacts into crash barriers and road side hazards;
c. A categorisation of typical crash scenarios that provides impact angle, speed, motorcycle and rider kinematics;
d. Reconstruction of a selected number of representative categorised cases;
e. The causal biomechanical mechanisms related to each barrier system that lead to the serious or fatal injury of the rider/pillion;
f. Rider/pillion survivability impact analysis for each barrier system, i.e. determination of the survivability envelops for different impact scenarios for varying rider configuration, speed and angle of impact and barrier type;
g. Proposed engineering design modifications to road barriers that are effective in reducing injuries to riders and pillions involved in roadside barrier crashes but will not reduce current crash safety characteristics for occupants of vehicles in cars, trucks and busses. The effectiveness of the modifications will be proven using current computer simulation and crash test technology.

Protecting motorcyclists in collisions with roadside barriers
12
TARS Research Report
IRMRC
Stage 1 determined the human, vehicle and environmental crash characteristics and causal factors associated with fatal motorcycle-barrier collisions in Australia and New Zealand between 2001 and 2006 (parts ‘a’ and ‘b’ above). Stage 2 investigated the crash mechanics and biomechanical injury causation in these crashes (parts ‘c’ to ‘e’ above). Stage 3 was a survivability analysis of motorcyclists colliding with roadside barriers, and other types of fixed roadside objects (part ‘f’ above).
This Stage 4 report (part ‘g’ above) focusses on computer simulations of motorcyclist protection devices for W-beam and barriers in order to better understand their injury mitigation potential, and updating the New Zealand related crash database including non-fatal motorcyclist-barrier and roadside object crash cases and providing information on crash characteristics for the last 12.5 years. The research presented in this report and funded by the ACC with support from MRWA, further builds on the previous research investigating Motorcycle Crashes Into Roadside Barriers. The reason why W-beam barriers were the focus of this Stage 4 study is that the frequency of injuries and fatalities observed are highest for these barriers. Analysis of Wire-rope barriers will be considered at a later stage and if and when further funding becomes available.
While motorcyclist collisions with roadside barriers are relatively rare events in Australia and New Zealand, they can result in serious and fatal injuries. For example, fatalities constitute around 4% to 6% of all motorcycle fatalities and typically around 0.01% of all road fatalities. However, there is virtually no published data on motorcyclist barrier impacts where no injury occurs with only property damage or no property damage. Anecdotally such impacts have been noted. So it is difficult to assess how injurious barriers are relative to impact exposure. Nevertheless, it is possible to compare the severity of such crashes relative to other vehicle type impacts into barriers and other roadside object impacts.
Motorcyclists are not protected by a vehicle structure and consequently have significantly higher injury and fatality rates than vehicle occupants. Australian motorcyclists are 37 times more likely to be seriously injured than car occupants per distance travelled [1], and New Zealand motorcyclists are 55 times more likely to be seriously injured or killed than car occupants per time spent travelling [2]. The provision of a safe roadside for all road users, including motorcyclists, is an objective of all road authorities, and is the basis of the Safe System approach recently adopted in Australia [3, 4] and New Zealand [5]. However, with the exceptions mentioned in this report, the design of roadside safety barriers has essentially been based on passenger vehicle occupant safety, and thus does not reflect the injury potential to motorcyclists.
It is recognised that road crashes are the major cause of societal suffering, preventable death and injury and a major cost burden of the order of tens of billions of dollars on health systems and society in general. Governments have recognised this societal burden and, as a result, have adopted a safe system approach in their action plans to reduce deaths and injuries on roads. The Safe System approach is based on human injury tolerance to impact forces. The Safe System approach acknowledges that humans make errors, but that the road traffic system should be designed to compensate for that error such that the road user will survive the consequences of mistakes made [4 to 6].
As mentioned in earlier reports, Australian and New Zealand motorcycling organisations have raised concerns regarding the safety of roadside barriers for motorcyclists, particularly wire-rope barriers. The above mentioned Stages 1 to 3 studies by the authors identified 78 fatal motorcyclist-barrier collisions in Australia and New Zealand between 2001 and 2006. Extensive information on motorcyclist-barrier collisions was established [7-15], including:

Protecting motorcyclists in collisions with roadside barriers
13
TARS Research Report
IRMRC
crash characteristics (Stage 1) – gender, age, location, time, road/weather conditions, barrier types, alcohol/drug/speeding involvement, licence/registration status, etc.;
crash mechanics (Stage 2) – crash postures, motorcycle types, motorcyclist kinematics, impact trajectory and speed, etc.;
injury mechanisms (Stage 3) – injury typology, post impacts, associations of injuries with crash postures, motorcycle types and speeds, etc.
Important findings included: barrier posts were frequently the cause of serious injuries; the thorax and head body regions had the highest incidence of serious injury (81% and 44% of motorcyclists, respectively); and motorcyclists impacted barriers in the sliding (separated from the motorcycle) and upright (seated on the motorcycle) postures in approximately equal numbers.
Having previously established an understanding of the nature of motorcyclist-barrier collisions, the focus of the present study is on how to protect motorcyclists in sliding collisions, which addresses half of the fatalities and serious motorcyclist into barrier crashes. In particular, several technologies are now commercially available to address this issue, however there remain many uncertainties regarding their effectiveness, their injury mitigation potential and how to assess and regulate the products. Techniques to reduce the injury potential of typical post-and-rail roadside barriers include; modifying the barrier with a rub-rail system (Figure 1a) and modifying the posts with post protectors (Figure 1b). Motorcyclists have also proposed installing or replacing existing barriers with a continuous barrier that do not contain posts, such as a concrete barrier (Figure 1c). The purpose of these approaches is to either reduce the severity of an impact with the barrier post, or to eliminate a post impact altogether, i.e. essentially prevent snagging of the motorcyclist and allow them to slide along the barrier instead of being abruptly decelerated. However, it needs to be noted that concrete barriers can be detrimental for occupants in other vehicles such as cars and SUV/4WD type vehicles because of the rigidity of such barriers as has been demonstrated and discussed elsewhere [16]. Figure 1d shows evidence of a vehicle that has impacted, effectively climbed the concrete barrier (round tire marks) and launched becoming airborne. Vehicle rollover crashes regularly occur on highways as a result of such concrete barrier impacts because of their profile and the manner in which they redirect the vehicle, placing vehicle occupants at serious risk of injury or death.
In Europe, several different rub-rail systems have been developed and approved to the European crash tests standard (EN1317) [17] and installed on post-and-rail barriers over the last two decades (Appendix A). These barrier systems have been certified to EN1317 Part 8 [18] within that standard which is focused on Motorcyclist into barrier tests and is presently an optional additional test for European road authorities. AS/NZS 3845.1: 2014 (Part 1) revision [19] has similarly followed suit and included this motorcycle test procedure for certifying barriers sold as providing protection for motorcyclists, albeit the procedure also specifies thorax accelerations, chest compression and viscous criterion be measured and provided. The adoption of this test has been largely based on the European research outcomes and the research outcomes from this joint Australian/New Zealand Motorcycle Crashes into Roadside Barriers research program.
It needs to be noted that the current Australian and New Zealand AS/NZS 3845: 1999 Road Safety Barrier Systems [20] certifies barriers according to the USA standard NCHRP report 350 [21], which has no provision for motorcycle impacts. The revised Australian/New Zealand Standard AS/NZS 3845.1: 2014 Road Safety Barrier Systems and Devices [19] is about to be released. Part 1 will cover crash testing of longitudinal roadside barriers. This revised Standard will base its testing procedures on MASH [22] although it will now also make reference to NCHRP 350 [21] as well as

Protecting motorcyclists in collisions with roadside barriers
14
TARS Research Report
IRMRC
reference to relevant CEN Standards [17]. The main issue applicable to the context of this report is that the several different rub-rail systems shown and referred to in Appendix A may not have necessarily been certified to MASH [22].
a b c
d
Figure 1: Examples of; a) steel rub-rail system, b) padded post protector and c) continuous concrete barrier d) wheel prints on concrete barrier showing evidence of vehicle launching
For each crash test level the barrier is certified to, the road safety barrier system is tested using a minimum of two vehicle types, a light vehicle and a heavy vehicle. The logic behind this requirement is by testing with a light vehicle and a heavy vehicle within each test level, the system will work for vehicles with masses between these two. Crash testing to EN 1317 [17] may be acceptable to some Road Authorities. In addition to differences in test vehicle weights, impact speeds and impact angles, the vehicles themselves are different from those tested under NCHRP 350 or MASH [21, 22]. As the vehicles are different, systems tested to EN 1317 may not give similar performance if tested with the MASH or NCHRP 350 vehicles. Hence, care needs to be taken in regards to claiming the barriers presented in Appendix A are suitable for Australian conditions.
Although the test criteria under EN1317 [17] procedures is based on analysis of real world impacts in Europe, it needs to be recognised that on most Australian and New Zealand road networks there exists a different range of vehicle types with different masses and different centres of gravities, travelling at speeds different from the test speeds that can impact systems at varying angles. The devices developed to date are light weight in nature and of low strength; therefore, it is likely that the light vehicle impact (820 to 1100 kg) will be the critical test vehicle rather than the heavier vehicle. However tests with the heavier vehicle are also required. A rub rail may facilitate launching of the vehicle, and hence care needs to be taken in regards to specifying European

Protecting motorcyclists in collisions with roadside barriers
15
TARS Research Report
IRMRC
certified systems for Australian and New Zealand conditions. It is important that installation of rub rails (or barriers) does not reduce current crash safety characteristics for occupants of vehicles in cars, trucks and busses.
In Australia, W-beams with rub rail devices have only recently gained acceptance. However, many kilometres of these devices have been installed in New South Wales, Victoria, Queensland and South Australia [23]. Such products are perceived to have generally performed well, and are generally regarded to provide protection to motorcyclists in collisions with barriers by limiting/eliminating post impacts. However, relatively little is understood or published regarding precisely how motorcyclists interact with them, how different rub rail designs affect this interaction and how to quantify the safety benefit afforded by such devices. Additionally, until recently, clear guidance for regulators has been lacking in Australia, New Zealand and internationally regarding motorcyclist interaction in crashes involving such rub-rails and other barrier systems.
In Europe, the motorcyclist-barrier crash test specification referred to in the AS/NZ 3845.1: 2014 revision [19] was developed which specifies crash tests of an anthropomorphic test device (ATD) sliding into the motorcyclist protection device [18]. Several deficiencies were identified, however, including the lack of thoracic injury measures and an upright crash test procedure [24]. As mentioned above, the current AS/NZ 3845: 1999 Road Safety Barrier Systems Standard [20] does not prescribe motorcyclist-barrier crash tests at all although the revision soon to be released will, and the Australian Roadside Design Guide [25] provides little specific advice regarding barrier protective devices for motorcyclists and their implementation.
This lack of detailed understanding of the performance of barrier protective devices for motorcyclists, and previous lack of regulatory guidance, has possibly limited installations of these products in Australia and New Zealand until more recently. Well-designed motorcyclist protection devices that do not reduce the current crash safety characteristics for occupants of other vehicles
have the potential to substantially improve motorcycling safety, particularly on popular motorcycling routes. The aims of the present project are to perform computer simulations of motorcyclist protection devices for barriers in order to better understand their injury mitigation potential, and provide additional advice to the AS/NZ Barrier Standards Committee CE33 and also to those responsible for writing Roadside Design Guides, with regards to their implementation, testing and regulation.
The aims of this Stage 4 project were comprised of the following four research tasks:
1. Perform a New Zealand motorcyclist-barrier collision crash study;
2. Develop motorcyclist-barrier collision computer simulation models;
3. Investigate injury mitigation strategies with computer simulations;
4. Provide design guidance for the AS/NZ Barrier Standard Committee CE33 and any potential developers of Roadside Design Guides.
Protecting motorcyclists in collisions with roadside barriers
16
TARS Research Report
IRMRC
2. Method
2.1 New Zealand motorcyclist-barrier crash study, 2001-2013
The previous Australian/New Zealand study [7-14] collected fatal motorcyclist-barrier crash cases during the years 2001-2006. In the present Stage 4 study, fatal cases that occurred in New Zealand since 2006 were collected, updating the crash database and providing information on crash characteristics for the last 12.5 years. Non-fatal motorcyclist-barrier crash cases in New Zealand were also collected to provide additional insights into the crash characteristics in the New Zealand setting.
2.1.1 Non-fatal motorcyclist-barrier collisions
Non-fatal motorcyclist-barrier collisions were identified using the New Zealand Transport Agency (NZTA) Crash Analysis System (CAS). The CAS is an integrated computer system that provides tools to collect, map, query, and report on road crash and related data. The crash data collection is based on all injury and fatal crashes reported to the Police.
Crash reports include:
where the crash occurred;
when and how it happened;
who was involved;
the type of vehicle drivers or passengers who were travelling in at the time of the crash;
the people involved who were not in vehicles;
information about the crash environment;
a crash diagram.
The NZTA then codes this information according to the type of crash movement involved (e.g. overtaking or right-angle intersection collision) and the factors contributing to the crash (e.g. driving too fast for the conditions or failing to stop at a Stop sign).
CAS was queried for the period 1st January 2001 to 30th June 2013 according to the following criterion:
the crash was identified as a single-vehicle crash;
the road user was identified as a motorcycle or moped rider or pillion;
the object struck was identified as a barrier and only one object was identified;
the injury severity was identified as minor or serious (fatal cases were excluded).
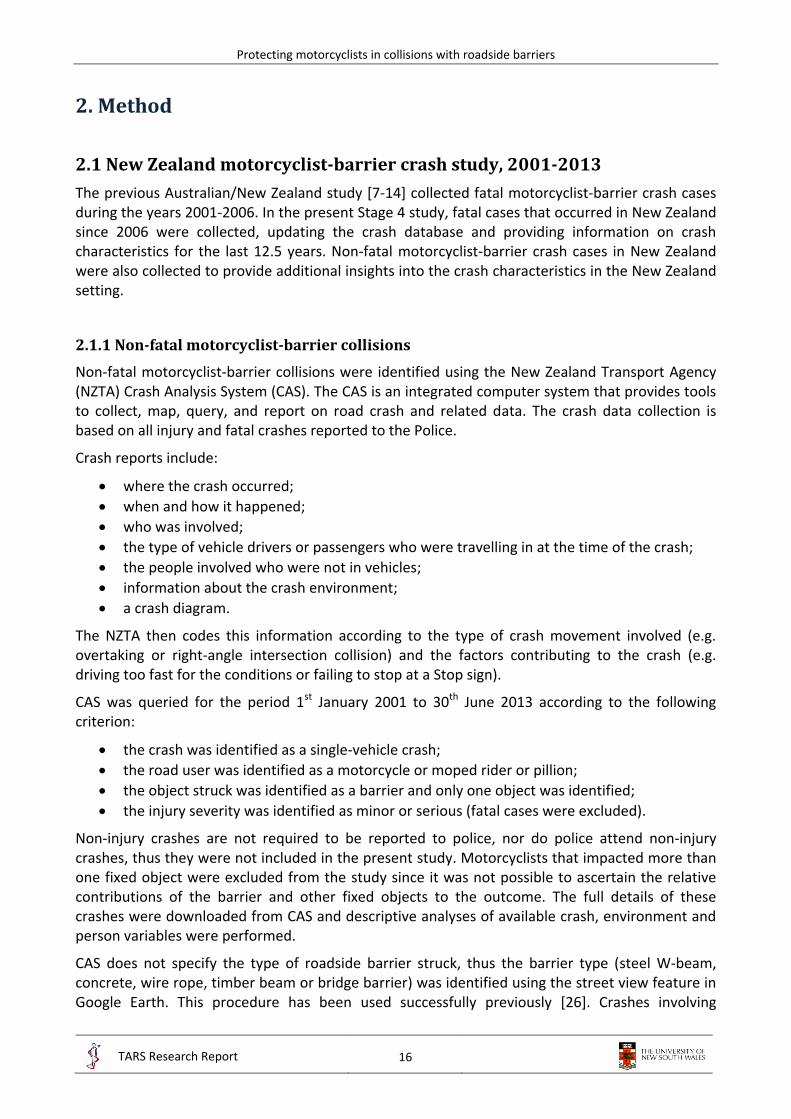
Non-injury crashes are not required to be reported to police, nor do police attend non-injury crashes, thus they were not included in the present study. Motorcyclists that impacted more than one fixed object were excluded from the study since it was not possible to ascertain the relative contributions of the barrier and other fixed objects to the outcome. The full details of these crashes were downloaded from CAS and descriptive analyses of available crash, environment and person variables were performed.
CAS does not specify the type of roadside barrier struck, thus the barrier type (steel W-beam, concrete, wire rope, timber beam or bridge barrier) was identified using the street view feature in Google Earth. This procedure has been used successfully previously [26]. Crashes involving

Protecting motorcyclists in collisions with roadside barriers
17
TARS Research Report
IRMRC
roadside barriers were located using the latitude and longitude co-ordinates of the crash provided in the crash record. Where no barrier was present, two different types of barriers were present or no street view was available, the barrier type was recorded as ‘unknown’. The majority of street view images accessed were taken in late 2013, thus it is possible that the roadside environment changed between the date the crash occurred and the date the street image was taken.
2.1.2 Fatal motorcyclist-barrier collisions
CAS fatal cases were queried for the period 1st January 2001 to 30th June 2013 according to the following criterion:
the road user was identified as a motorcycle or moped rider or pillion;
the object struck was identified as a barrier.
Approval was obtained from NZTA for full access to CAS fatal cases, including the names of the deceased persons. A request was sent to the New Zealand Coroner’s Court to access all identified fatal motorcyclist-barrier collisions. The case files were used to confirm the collision with a roadside barrier and determine the single-vehicle crash cases. The Coronial cases typically contained the Coroners finding, police report, autopsy, vehicle inspection report and toxicology report.
Injuries were coded according to the Abbreviated Injury Scale (AIS) [27] from the autopsy reports, and only serious (AIS3+) injuries were coded. The police reports were reviewed in order to establish the characteristics and contributing causal factors associated with the fatal crashes. The characteristics of the crash included the motorcyclist demographics (age, gender), crash mode (number of vehicles, barrier type, and collision type) and crash environment (day of the week, collision location, light condition, road condition, and weather). The reports from the crash investigation team, on-scene police officers and witnesses, combined with the maps and photos of the crash scenes, were used to establish the crash characteristics and identify the contributing causal factors that led to the crash and injuries.
2.1.3 Motorcyclist collisions with all types of fixed objects
A further query was performed in order to collect all motorcyclist-fixed object collisions, in order to compare the characteristics and injury severities of roadside barriers with other types of fixed objects and hazards, particularly those that roadside barriers are intended to protect road users from. CAS was queried for the period 1st January 2001 to 30th June 2013 according to the following criterion:
the crash was identified as a single-vehicle crash;
the road user was identified as a motorcycle or moped rider or pillion;
an object struck was identified and only one object was identified;
the injury severity was identified as minor, serious or fatal.
The full details of these crashes were downloaded from CAS and descriptive and statistical analyses of available crash, environment and person variables were performed. The injury severity was identified as KSI (killed or seriously injured) where the injury severity was identified as serious or fatal. The crude (unadjusted) rate of KSI was calculated as the number of individuals that were identified as KSI, divided by the total number of individuals.

Protecting motorcyclists in collisions with roadside barriers
18
TARS Research Report
IRMRC
Standard multiple variable logistic regression modelling was conducted to determine the adjusted risk of KSI for each type of fixed object. All available human, vehicle and environmental characteristics of the crashes that might be associated with the outcome of injury were considered as variables in the logistic regression models. These included: collision counterpart as a polytomous variable with five levels (barrier/ embankment/ infrastructure (e.g. house, building, bridge)/ post or pole/ tree); and dichotomous variables of age (≥ or < mean age), speed limit (≥ or < 100km/h), metropolitan (or rural), intersection (or not), curve (or not), sealed road (or not), dry road (or not), daytime (or not), male (or female), operator (or pillion) and if the collision was alcohol related (or not) or speeding-related (or not). Reference cell coding was used for the fixed object variable, where the reference group was a barrier. Age was additionally assessed using different threshold values determined from the method of maximum likelihood. The variable designating the crash as speeding-related does not imply that the crash speed was accurately reconstructed by investigators. Rather, based on the evidence at the scene, the police formed the opinion that a contributing cause of the motorcycle crash was excessive speed for the conditions. Similarly, the variable designating the crash as alcohol-related does not necessarily imply that the operator had an illegal blood alcohol level, rather that some alcohol had been consumed prior to the crash.
Dichotomous outcome logistic regression models were developed for the outcome of KSI. Parameter estimates were determined from the method of maximum likelihood, and odds ratios and 95% confidence intervals were determined from the estimates and standard errors. The statistical significance of estimates was assessed at the 0.05 level. The method of purposeful selection was used in order to select the variables for the multiple variable logistic regression model [28].
2.1.4 Comparison with passenger vehicle-barrier collisions
In order to make comparisons between the incidence of motorcyclist-barrier collisions and passenger vehicle-barrier collisions, a CAS search was performed to identify single-vehicle passenger vehicle collisions with roadside barriers. CAS was queried for the period 1st January 2001 to 30th June 2013 according to the following criterion:
the crash was identified as a single-vehicle crash;
the vehicle was identified as a car, van, ute, SUV or four wheel drive;
the object struck was identified as a barrier and only one object was identified;
the injury severity was identified as minor, serious or fatal.
2.2 Development of motorcyclist-barrier computer simulation models
2.2.1 Total Human Model for Safety (THUMS)
The Total Human Model for Safety (THUMS) average size male human body model was used for the simulations in this study, developed by Toyota Motor Corporation [29]. The THUMS model simulates human body kinematics and injury responses in crashes. High-resolution CT scans were used to digitize the interior of the body and to generate precise geometrical data for the bones, organs, tissues, ligaments, muscles, skin etc. The FE mesh consists of nearly 2,000,000 elements representing the components of the human body. The THUMS model is shown in Figure 2, using

Protecting motorcyclists in collisions with roadside barriers
19
TARS Research Report
IRMRC
the commercial dynamic finite element (FE) package LSDYNA [30]. The performance of the THUMS human body model has been compared with tests on post mortem human subjects (PHMS) under various impact configurations, in order to validate that the response of THUMS is within acceptable biomechanical limits. Some example validation curves are shown in Appendix B. The validation was carried out and funded through NRMA-ACT Road Safety Trust Grants Program (Grant # P12-10) [31].
The THUMS model was used to simulate motorcyclists sliding into roadside barriers. In such collisions it could be expected that the motorcyclist undergoes sliding and/or tumbling after separating from the motorcycle, such that the impact orientation with the barrier could be quite random in nature. For the purposes of simulating the collision, two idealised impact scenarios were considered, where the motorcyclist undergoes a direct impact with the chest or with the head. These orientations are hereafter termed ‘thorax-leading’ and ‘head-leading’, respectively. These orientations are considered ‘worst-case’ scenarios for thoracic and head-neck injury potential, and their development and validation are described in the following sections.
Figure 2: Total Human Model for Safety (THUMS) [29]
2.2.2 THUMS-barrier thorax-leading collision model
The 78 fatal motorcyclist-barrier collisions identified in the previous study (that occurred in Australia and New Zealand during the period 2001 to 2006 [7-14]), and the cases identified from the present study of New Zealand fatalities up to 2013, were collated to maximise the number of cases available for this analysis. Cases were identified that involved a motorcyclist colliding with a steel W-beam barrier in the sliding posture, and for which a full reconstruction of the crash scene was available, including the approach angle, sliding distance, pre-crash speed and final resting position of the motorcyclist.

Protecting motorcyclists in collisions with roadside barriers
20
TARS Research Report
IRMRC
Cases were disaggregated into probable post impacts or beam impacts. Post impacts were assumed when either: a witness saw the motorcyclist impact a post; the motorcyclist was found lying in contact with a post; the motorcyclist was found immediately adjacent to a post. Beam impacts were assumed when the motorcyclist was redirected along or away from the barrier impact point and was found lying in the roadway. Cases with serious thoracic injury were assumed to have impacted the post or beam in the thorax-leading orientation. Two thorax-leading impact scenarios were considered for post impacts; following sliding/tumbling along the roadway surface the motorcyclist was assumed to impact the post with the thorax laterally or frontally, as shown in Figures 3a and 3b, respectively. Post impact cases where the thoracic injuries occurred predominantly unilaterally were assumed to have resulted from impact with a post in the lateral orientation, and those occurring bilaterally were assumed in the frontal orientation. One thorax-leading impact scenario was considered for beam impacts, where the motorcyclist was assumed to impact the W-beam in the upright seated position, as shown in Figure 3c. Several witness statements identified this posture, where the motorcyclist leans substantially into the corner then the motorcycle slides out from under the motorcyclist, who maintains an upright posture whilst sliding. These three impact scenarios (Figure 3) are hereafter termed; lateral-post, frontal-post and frontal-beam orientations.
Figure 3: Thorax-leading impact scenarios considered in the THUMS-barrier FE models for a collision angle of 15° to the longitudinal axis; a) lateral-post, b) frontal-post, c) frontal-beam
orientations (top views)
The impact speed with the post or beam was determined from the pre-crash speed and the measured distance the motorcyclist slid on the roadway. Several authors have determined drag coefficients for humans sliding on roadways, with values ranging from 0.37 to 0.75 [32-35]. A mean value of 0.6 was used in the present analysis, and standard equations for velocity changes occurring from sliding distances were employed.
15° 15°
15°
C-section steel post
wooden block-out
W-section steel beam
15°
collision velocity
a) b) c)

Protecting motorcyclists in collisions with roadside barriers
21
TARS Research Report
IRMRC
The steel W-beam barrier FE model developed by the National Crash Analysis Centre (NCAC) at George Washington University in the United States was used to simulate the barrier. The barrier model consists of steel posts set into the ground, wooden blockouts and steel W-beams (Figure 3). The FE mesh consists of around 125,000 elements and is used extensively for vehicle-barrier collision modelling. In Australia, W-beam posts are typically 150mm deep steel C-sections. The steel post in the FE model was a 150mm deep I-section, thus the posts were modified to C-section posts. The photos from the crash scenes were used to determine whether each motorcyclist struck the open or closed face of the C-section posts, and these were modelled accordingly. There was one case included from New Zealand where the motorcyclist struck a timber post, and this case was modelled as striking the closed face of a C-section post.
The impact position of the thorax on the post was assumed to be the same in all cases, and was determined by sliding the THUMS model into the barrier at an angle of 15° (the average angle for all cases in [14]), such that the head did not contact the preceding post (Figure 4). The impact into the beam was assumed to occur at the beam connection to the blockout and post, with the THUMS model in an upright seated position facing forward and at an impact angle of 15° (Figure 3c). The direct thoracic impacts with the post, and those with the beam at its strongest point, constitute ‘worst case’ or upper bound representations of the presumed collision conditions.
Figure 4: Positioning of the THUMS model with respect to the posts, for a collision angle of 15° to the longitudinal axis [31]
The involvement of the arms of THUMS was treated varyingly. For the lateral-post and frontal-beam orientations the arms were retained and were involved in the impact (particularly for the lateral-post orientation). For the frontal-post orientation the arm adjacent to the ground could have been assumed to lie between the ground and the torso, or not. In reality the motorcyclist would have already been sliding/tumbling on the ground prior to the impact, thus it was assumed that the torso was in contact with the ground in this orientation. In order to simulate this condition, THUMS was placed with the torso adjacent to the ground and the contact conditions for the arm were set to null, such that the arm mesh moved freely through the ground mesh. This could also be simulated by placing the arm behind or in front of the torso, or deleting the arm (and adding equivalent mass).
15°

Protecting motorcyclists in collisions with roadside barriers
22
TARS Research Report
IRMRC
The numerical models of the motorcyclist-barrier collisions were validated against the field-observed collisions. For each crash case, the initial crash conditions were input into the model (frontal-post/lateral-post/frontal-beam orientation, impact speed and angle). In post mortem human subject (PMHS) studies of thoracic impacts from impactor devices [36-38], the incidence and severity of thoracic injuries were found to be closely associated with the normalised thoracic compression (C), being the thoracic deflection (D) divided by the thoracic diameter (Equation 1). The thoracic diameter (b) is the width of the thorax measured along the direction of the applied impact load. Linear trendlines that relate the PMHS frontal and lateral normalised thoracic compression to the AIS severity of the injuries were also developed and are given by Equations 2 and 3 [37, 38]. The values of frontal and lateral normalised thoracic compression corresponding to the AIS severity of serious (AIS3), are 0.347 and 0.383 according to these equations, and were recommended as injury assessment reference values (IARVs) for such loading conditions.
C = D/b (1)
AIS = -3.78 + 19.56C (2)
AIS = -3.73 + 17.59C (3)
The maximum normalised thoracic compression was extracted from the simulations. According to the impact conditions shown in Figure 3, the maximum deflections were recorded at the positions shown in Figure 5. For the lateral-post orientation (a in Figure 5), maximum deflection occurred on the 5th rib laterally. For the frontal-post orientation (b in Figure 5), maximum deflection occurred on the 3rd rib, adjacent to the sternum. For the frontal-beam orientation (c in Figure 5), maximum deflection occurred at the base of the sternum. The thoracic diameter was measured in the direction of impact as shown in Figure 5.
Figure 5: Locations for the measurement of thoracic compression and diameter; a) lateral-post, b) frontal-post, c) frontal-beam orientations. Black dots indicate the position and solid lines
indicate the line along which the displacement and diameter were measured.
The validation methodology may be summarised as follows:
1. assume the FE model collision conditions represent those of the field-observed crash case;
2. extract the maximum normalised thoracic compression from the FE model (CFE);
3. from PMHS results, predict the AIS injury severity resulting from the compression value CFE;
Front view Top view Side view
a b
c
b,c
Protecting motorcyclists in collisions with roadside barriers
23
TARS Research Report
IRMRC
4. compare the predicted AIS injury severity with that from the field-observed case (autopsy).
In order to compare the relative severity of the three impact orientations, the THUMS model in all three orientations were assessed over a full range of impact speeds, by incrementally increasing the impact speed from 10km/h. A constant collision angle of 15° was used for this analysis.
2.2.3 THUMS-barrier head-leading collision model
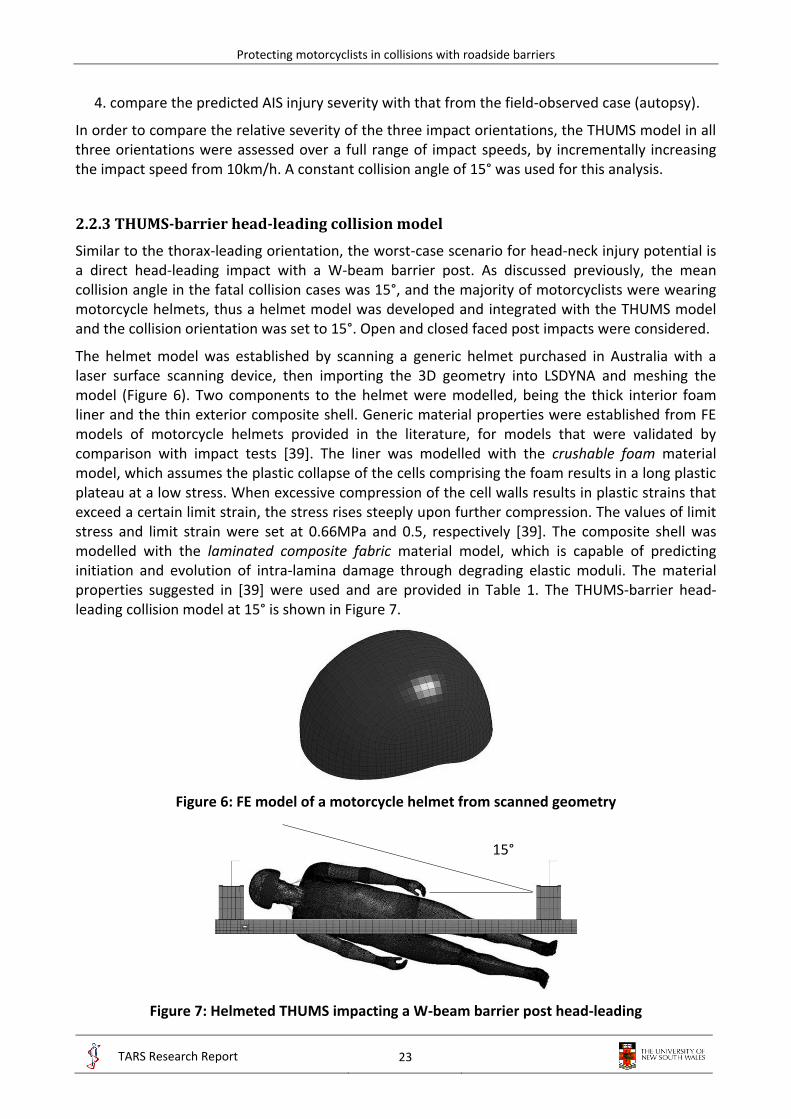
Similar to the thorax-leading orientation, the worst-case scenario for head-neck injury potential is a direct head-leading impact with a W-beam barrier post. As discussed previously, the mean collision angle in the fatal collision cases was 15°, and the majority of motorcyclists were wearing motorcycle helmets, thus a helmet model was developed and integrated with the THUMS model and the collision orientation was set to 15°. Open and closed faced post impacts were considered.
The helmet model was established by scanning a generic helmet purchased in Australia with a laser surface scanning device, then importing the 3D geometry into LSDYNA and meshing the model (Figure 6). Two components to the helmet were modelled, being the thick interior foam liner and the thin exterior composite shell. Generic material properties were established from FE models of motorcycle helmets provided in the literature, for models that were validated by comparison with impact tests [39]. The liner was modelled with the crushable foam material model, which assumes the plastic collapse of the cells comprising the foam results in a long plastic plateau at a low stress. When excessive compression of the cell walls results in plastic strains that exceed a certain limit strain, the stress rises steeply upon further compression. The values of limit stress and limit strain were set at 0.66MPa and 0.5, respectively [39]. The composite shell was modelled with the laminated composite fabric material model, which is capable of predicting initiation and evolution of intra-lamina damage through degrading elastic moduli. The material properties suggested in [39] were used and are provided in Table 1. The THUMS-barrier head-leading collision model at 15° is shown in Figure 7.
Figure 6: FE model of a motorcycle helmet from scanned geometry
Figure 7: Helmeted THUMS impacting a W-beam barrier post head-leading
15°

Protecting motorcyclists in collisions with roadside barriers
24
TARS Research Report
IRMRC
Table 1: Mechanical properties of the glass/epoxy lamina thin exterior shell of the helmet
Property Value Property Value
Density (kg/m3) 1984 Compressive strength longitudinal (MPa) 800 Elastic modulus longitudinal (GPa) 46 Ultimate compressive strain longitudinal 0.018 Elastic modulus transverse (GPa) 16 Tensile strength transverse (MPa) 40 Shear modulus longitudinal/transverse (GPa) 5.8 Ultimate tensile strain transverse 0.025 Poisson ratio longitudinal/transverse 0.28 Compressive strength transverse (MPa) 145 Tensile strength longitudinal (MPa) 1280 Ultimate compressive strain transverse 0.012 Ultimate tensile strain longitudinal 0.028 Shear strength (MPa) 73 Ultimate shear strain 0.040
Various injury measures and IARVs have been published in the literature for the head and the spine [40-46]. Values considered appropriate for assessing the outputs of THUMS are tabulated in Table 2. Also included in Table 2 are the values for the thorax (Equations 1 – 3), such that the table contains all the injury measures and IARVs used with THUMS in the present study.
Table 2: Summary of injury measures and IARVs used with THUMS
Region Injury measure IARV Interpretation of IARV Reference
Thorax frontal Normalised chest compression 0.347 Rib fractures and/or organ injury - AIS3 [36, 37] Thorax lateral Normalised chest compression 0.383 Rib fractures and/or organ injury - AIS3 [38] Skull Plastic strain in cortical bone 0.03 Fracture – AIS2+ [42-45] Spine Plastic strain in cortical bone 0.03 Vertebral fracture - AIS2+ [42-45] Brain CSDM10 18.2% Mild traumatic brain injury (MTBI) – AIS2 [46] Brain CSDM15 42.5% Diffuse axonal injury (DAI) - AIS4+ [40-42] Brain CSDM30 5% Severe brain injury (SBI) – AIS5+ [46]
For the assessment of brain injury, several different levels of injury severity were considered, using the Cumulative Strain Damage Measure (CSDM). The CSDM represents the volume of the brain that exceeds a certain level of strain (maximum principle strain). Mild traumatic brain injury (MTBI), i.e. concussion, has been estimated to occur at a threshold of 18.2% of the brain exceeding a strain of 10% [46]. This level is termed CSDM10. Diffuse Axonal Injury (DAI) has been estimated to occur at a threshold of 42.5% of the brain exceeding a strain of 15% [40-42], termed CSDM15. Severe traumatic brain injury has been estimated to occur with strains exceeding 30% [46] (CSDM30), however the volume of the brain exceeding this threshold has not been established. For the purposes of the present study, a volume of 5% was taken as the value for the CSDM30. An example of how brain injury was assessed is shown in Figure 8, where a severe head impact resulted in brain strains inferred to represent severe brain injury, where 83% of the brain exceeded 15% strain, while 19% exceeded 30% strain (particularly around the base of the brain and the exterior regions adjacent to the skull). An example of severe neck bending is shown in Figure 9, where areas of high plastic strain are identified by dark shading.
In order to validate the THUMS-barrier head-leading collision model, crash cases in which the motorcyclist slid into the barrier post head-leading were required. Such impacts were assumed to have occurred when both of the following conditions were met:
1. the motorcyclist collided with the barrier in the sliding posture;
2. the motorcyclist sustained both head and spine injury.

Protecting motorcyclists in collisions with roadside barriers
25
TARS Research Report
IRMRC
Figure 8: Example of strains in the brain resulting from a severe head impact
Figure 9: Examples of cervical vertebral strains resulting from spine bending (dark regions indicate high plastic strains)
Clearly it is not possible from the evidence at the scene to conclusively discern if the motorcyclist slid into the post head-leading, however if the motorcyclist had and was fatally injured it is likely that the impact occurred at a substantial velocity, in which case it is likely the motorcyclist would sustain both head and spine injury. The above two conditions could be determined conclusively from the evidence at the scene and from the autopsy, thus providing confidence in these two conditions being met. However, the fact that these two conditions imply the motorcyclist slid into the post head-leading is an assumption that has obvious limitations. These two conditions are a ‘best guess’ at identifying motorcyclists that slid into a post head-leading.
Unfortunately there were only six cases that met these two criteria. Analysis of these also indicated that four cases involved only spine injury in the thoracic spine region, and further involved other thoracic injuries, indicating the possibility that the motorcyclist injured his head during the crash then impacted the post with his chest injuring both the thorax and the thoracic spine. These thoracic spine injuries were all cord contusions/lacerations, further supporting the premise of direct impact to the thoracic spinal column laterally. Thus a further condition for identifying cases where the motorcyclist slid into a post head-leading was established:
3. the motorcyclist sustained the spine injury in the cervical spine in the absence of thoracic injury.
Black 19% CDSM30
Dark grey 83% CDSM15

Protecting motorcyclists in collisions with roadside barriers
26
TARS Research Report
IRMRC
These three conditions identified only two cases where the motorcyclist potentially slid into a barrier post head-leading. In both cases the motorcyclist sustained injuries at the atlanto-occipital junction, a typical cervical spinal injury occurring with severe superior-inferior compression-type head impact. In one case the damage to the helmet positively identified a head-leading collision with the barrier post. However, two cases was not considered sufficient for a validation study of the THUMS model in the present application of head-leading post collisions, thus was not explicitly validated in the present study. Nonetheless, the THUMS model has been generally validated previously [47, 48], and shown to represent the response of the human spine and head within acceptable limits (Appendix B).
2.3 Protecting motorcyclists in collisions with steel W-beam barriers
As will be detailed in the results sections, the majority (77%) of New Zealand fatal and non-fatal motorcyclist casualty collisions with barriers occurred with steel W-beam barriers, and a similar result was also found in Australia (84%) [7-14, 26]. Therefore the focus of improving motorcycling safety in barrier collisions was directed towards protecting motorcyclists in collisions with steel W-beam barriers. As discussed previously, a major injury mechanism results from motorcyclists sliding into the W-beam barrier posts. Several techniques for reducing the severity of this injury mechanism, or eliminating it altogether, were identified and considered in this study. These include: installing rub-rail systems; protecting the posts with paddings; or installing a continuous barrier that does not contain exposed posts (e.g. the option of installing a concrete barrier instead of a W-beam barrier1).
2.3.1 Rub-rail systems
Rub-rail systems are connected to existing W-beam barriers below the beam level. They effectively close-off the open space between the steel beam and the ground, such that a sliding motorcyclist cannot impact with the barrier posts. Several different systems have been developed and are commercially available in Australia and New Zealand. For the purposes of the present study, models of several generic systems were developed in order to evaluate the injury potential for a wide variety of rub-rail system properties.
Rub-rail systems consist of two principle components; the rails and their connections to the W-beam barrier. The rails may be manufactured from several different materials, including steel, polymers and fabrics. Solid rails (steel or polymer) may also be shaped into different profiles. Connections to the W-beam barrier may be made with one connector to the blockout (e.g. Figure 10a to d) or two connections (at the blockout and the base of the rail, e.g. Figure 10e). The connectors are typically folded steel plates whose stiffness varies according to the plate dimensions (particularly the plate thickness). A literature study of several commercially available systems indicated a variety of profiled steel shapes and connectors, and a product consisting of fabric (Appendix A).
Similar to traditional roadside barriers, commercially available systems are either proprietary or Public Domain (PD). PD systems are those where upon installation the local road authority is considered to be the IP owner, rather than the supplier. Due to intellectual property ownership, the exact geometric and material properties of proprietary rub-rail systems are typically not fully
1 Note that installing concrete barriers may have adverse crashworthiness effects on other road users (Figure 1d) [16].

Protecting motorcyclists in collisions with roadside barriers
27
TARS Research Report
IRMRC
disclosed. Conversely, full details of PD systems are publicly available. For the purposes of the present study, exact geometric and material properties were required in order to perform the numerical simulations. In order to generally represent proprietary systems, a variety of geometric rail and connector properties were established, including flat steel and fabric profiles with either low or high connection stiffness (Figure 10e), and generic steel profiles such as pipes (Figure 10a) and a W-shape (Figure 10b). Two PD systems commercially available in Australia and New Zealand were identified, hereafter termed CSP PD (CSP Pacific, the New Zealand division of ACP – Australian Construction Products) and Ingal PD (Ingal Civil Australia and New Zealand). Many kilometres of these products have been installed in New South Wales, Victoria, Queensland and South Australia. The models of these products are shown in Figures 10c and 10d, and the engineering drawings are provided in Appendix C. For all rub-rail systems, two standard bays of 1.905m post spacing were simulated, and symmetry conditions were imposed at the bay ends to reflect the continuity of the rails there (Figure 10).
a b c d e
Figure 10: Rub-rail designs for W-beam barrier with solid blockout; a) steel pipe, b) steel profiled, c) steel CSP PD, d) steel Ingal PD and e) fabric/steel flat
2.3.2 Post protectors
In an attempt to reduce the injury potential of barrier posts in the event of a motorcyclist impact, several different post protectors are commercially available. Post protectors have also been used for some wire rope and W-beam barrier systems albeit only those protectors used for W-beam barriers were modelled and reported in this Stage 4 project. Post protectors typically consist of padded foam enclosing the barrier post. Generic padded post systems were simulated by

Protecting motorcyclists in collisions with roadside barriers
28
TARS Research Report
IRMRC
enclosing the C-section posts with solid foam elements as shown in Figure 11. The foam material was modelled with the crushable foam material model, and two different foam stiffness values were assessed (low and high stiffness).
Figure 11: C-section post with padded post protector
2.3.3 Concrete barriers
Similar to rub-rail systems, a motorcyclist impact into a continuous barrier system such as a concrete barrier has been proposed by motorcycle organisations as a better outcome compared to other barrier systems in terms of snagging and resulting injury1. Two types of concrete barriers are approved for installation on New Zealand roads [49], the F-shaped concrete barrier and the Jersey barrier (Figure 12). Both of these barrier systems were simulated, based on the exact dimensions (which are publicly available).
Figure 12: Concrete barriers F-shape and Jersey
2.3.4 Steel W-beam barriers without blockouts (Nu-Guard)
Current rub-rail systems are designed and tested in applications where the barrier system consists of a blockout, which provides an offset between the post and front face of the W-beam and rub-rail (Figure 10). However, in New Zealand a new barrier system has been extensively installed where no such blockout is used. This barrier product is approved for use in New Zealand [49] and is a proprietary system called Nu-Guard. Since all rub-rail systems considered in this study undergo substantial deformation of the connector, where the rub-rail deflects laterally towards the post, it is likely that barriers without blockouts will result in a stiffer rub-rail response, since lateral deformation of the connectors are reduced. In order to assess these types of barriers, the Nu-Guard barrier was simulated from the exact dimensions (which are publicly available), and the CSP PD rub-rail system was simulated with this barrier type (Figure 13), where the face of the rub-rail is 75mm from the face of the barrier post.
F-shape concrete barrier
Jersey concrete barrier

Protecting motorcyclists in collisions with roadside barriers
29
TARS Research Report
IRMRC
a b
Figure 13: a) Nu-Guard barrier with steel CSP DP, b) Nu-Guard trapezoidal post
2.3.5 Parametric study
A parametric study was performed in order to assess the various rub-rails, post protectors and barrier systems outlined above, under a variety of impact angles and speeds. The base impact angle considered was 15°, since this was the average angle determined from the crash reconstructions in the motorcyclist-barrier collision study in [14]. Impact angles of 30° and 45° were then assessed for selected barrier systems. It will be shown in the results section that the frontal-beam orientation, whereby the motorcyclist is considered to be in the seated position (Figure 3c), was a substantially less severe orientation than the lateral-post and frontal-post orientations. The latter orientations were very similar in their severity, thus the lateral orientation was selected for the parametric study, simply due to the fact that this orientation was easier to model (since the motorcyclist is lying flat on the ground). The most severe orientation was when the thorax was aligned with the post. However, due to the setup used this was slightly modified to be aligned with the leading edge of the blockout rather than the post centroid, and the centre of the sternum was aligned with this point. The orientations assessed in the parametric study are presented in Figure 14. Since the thoracic impact was more generally distributed when the impact occurred against a rub-rail (compared with a post), the deflections of all 10 major ribs (Figure 15) were considered for the thoracic injury criterion (Equation 1), and the maximum value was established.
Speeds of 20km/h, 40km/h, 60km/h, 80km/h and 100km/h were assessed. For the post and protected post impacts, higher speeds resulted in very severe responses in the THUMS model, thus impact speeds of 20km/h and 40km/h were assessed. In all cases the thorax, head and spine injury measures were assessed according to the IARV’s identified in Table 2. For ease of interpretation and comparison these were further generalised into the three categories of; moderate, serious and critical injuries, according to Table 3. As impact speeds were incrementally increased, in cases where a critical injury outcome resulted at a certain speed, higher speeds were then not further considered. The parametric study matrix of 132 simulations is summarised in Table 4. A computing cluster of 64 nodes was used for all simulations.
As mentioned earlier, it should be noted that steel wire-rope barrier systems were not modelled in this study. Since the post spacing on wire-rope barriers is typically greater than the post spacing

Protecting motorcyclists in collisions with roadside barriers
30
TARS Research Report
IRMRC
a
b
Figure 14: Varying impact angles for a) thorax-leading collisions, b) head-leading collisions
Figure 15: Measurement of rib deflections (D)
Table 3: Generalised injury levels of moderate, serious and critical injuries
Moderate injury Serious injury Critical injury
Thorax lateral C < 0.383 C = 0.383 – 0.496 C > 0.496 Spine Vertebral damage 1 or 2 vertebral fractures 3+ vertebral fractures Brain MTBI (CSDM10 > 18.2%) DAI (CSDM15 > 42.5%) SBI (CSDM30 > 5%)
C = normalised chest compression (Equation 1); vertebral damage is plastic strain > 0; vertebral fracture is plastic strain > 0.03 MTBI = mild traumatic brain injury; DAI = diffuse axonal injury; SBI = severe brain injury
15°, 30°, 45°
15°, 30°, 45°
D1 D2
D3
D4
D5
D6
D7
D8
D9
D10

Protecting motorcyclists in collisions with roadside barriers
31
TARS Research Report
IRMRC
Table 4: Parametric study matrix of 132 simulations
Barrier/Rub-rail type Impact angle Orientation 20 km/h 40 km/h 60 km/h 80 km/h 100 km/h
Open C – section post 15° Thorax-leading X X
Head-leading X X
Closed post 15° Thorax-leading X X
Head-leading X X
Post padding – high stiffness 15° Thorax-leading X X
Head-leading X X
Post padding – low stiffness 15° Thorax-leading X X
Head-leading X X
Concrete – F shape 15° Thorax-leading X X X X
Head-leading X X X X
Concrete – Jersey 15° Thorax-leading X X X X
Head-leading X X X X
Concrete – Jersey 30° Thorax-leading X X X X
Head-leading X X X X
Concrete - Jersey 45° Thorax-leading X X X X
Head-leading X X X X
Fabric – high stiffness 15° Thorax-leading X X X X
Head-leading X X X X
Fabric – low stiffness 15° Thorax-leading X X X X
Head-leading X X X X
Steel – CSP PD 15° Thorax-leading X X X X
Head-leading X X X X
Steel – Ingal PD 15° Thorax-leading X X X X
Head-leading X X X X
Steel pipe 15° Thorax-leading X X X X
Head-leading X X X X
Steel flat – high stiffness 15° Thorax-leading X X X X
Head-leading X X X X
Steel flat – low stiffness 15° Thorax-leading X X X X
Head-leading X X X X
Steel profiled 15° Thorax-leading X X X X
Head-leading X X X X
Steel – CSP PD 30° Thorax-leading X X X X
Head-leading X X X X
Steel – CSP PD 45° Thorax-leading X X X X
Head-leading X X X X
Steel – CSP PD with Nu-Guard 15° Thorax-leading X
Head-leading X
Steel – CSP PD with Nu-Guard 30° Thorax-leading X
Head-leading X
on steel W-beam barriers, wire-rope barriers provide a lesser potential for motorcyclists to impact the posts. Currently there are no rub-rail systems available that may be installed on wire-rope barriers to prevent post impacts. Additionally, wire-rope barriers cannot be installed on curves with radii less than 150m, which precludes their use on the curved and hilly roadways typically associated with popular motorcycling routes and high densities of motorcyclist-barrier collisions [7-14]. Because of this, the relatively low number of wire-rope barrier impacts compared to W-beam barrier impacts and finite project funds available, wire-rope barriers were not modelled and thus considered in terms of design modifications.

Protecting motorcyclists in collisions with roadside barriers
32
TARS Research Report
IRMRC
2.4 Case study: Rimutaka Hill, Wellington
A case study was performed to demonstrate the application of a rub-rail system in the New Zealand context. The results of the crash study were used to identify the roadway section with the highest density of motorcyclist-barrier crashes in New Zealand. As will be outlined in the Results section, this was Rimutaka Hill, Wellington, a 14.6 km roadway section of State Highway 2 from the Pakuratahi River road bridge to the Abbots Creek twin road bridges near Featherston. The winding roadway traverses the Rimutaka Ranges and is popular with motorcyclists. Detailed topographic maps and Google street view images were used to identify curves with steel W-beam barriers suitable for installing rub-rails.
An approximate costing methodology was used to provide an indicative cost-benefit analysis of such an installation. In a recent study by the authors, costs of motorcyclist-barrier collisions were established by linking personal injury insurance claims with police-reported road crash records, using personal identifying information [50]. Record linkage was required since insurance claims records do not provide the level of crash information required to identify collisions with barriers. Since personal identifying information was not available in the present New Zealand study of non-fatal collisions, record linkage was not possible, thus these Australian data were used to estimate motorcyclist-barrier collision costs in New Zealand. The costs of commercial rub-rail systems were sourced from the suppliers, and installation costs were sourced from the Department of Planning Transport and Infrastructure, South Australia, the authority that installed rub-rails in South Australia [23].
2.5 AS/NZ Standard and Roadside Design Guides
The results of the simulations of the various technologies to protect motorcyclists in collisions with barriers will be used to provide general observations regarding the performance and installation of such devices. The results presented in this Stage 4 report will provide information for any future revision of the Australian Roadside Design Guide (ARDG) [25], as well as provide advice to road authorities regarding their use, depending on their performance in regards to other vehicle impact tests specified in the MASH compliance tests. New Zealand does not have a specific document that is equivalent to the ARDG. However, the results presented may also provide advice to New Zealand road authorities. Currently the ARDG indicates that products are available to protect motorcyclists in barrier collisions. However, no advice is provided regarding how to quantify the level of protection afforded for motorcyclists, how this differs between different products and designs, nor how to evaluate their installation with cost-benefit procedures (or similar methods). The ARDG states in Section 6.5 Road Safety Barriers for Vulnerable Road Users, 6.5.1 Motorcyclists:
“Motorcyclist-friendly road safety barrier systems: A number of methods designed to improve existing road safety barriers to better protect motorcyclists have been developed (Koch & Schueler 1987, Sala & Astori 1998). The methods generally involve use of a proprietary product that may provide:
additional rails or attenuation cushions on the lower section or other components of the barrier system so that motorcycle riders do not impact hazardous features including the posts;
posts that are less hazardous to motorcyclists by virtue of their lower strength and shape;
a specifically designed covering of energy absorbing material for existing posts;
devices to remove sharp edges (e.g. post caps).

Protecting motorcyclists in collisions with roadside barriers
33
TARS Research Report
IRMRC
The use of enhancements to barriers is a matter for the particular jurisdiction and may be conditional on crash testing and the proposed devices not creating other problems (e.g. related to debris or drainage). The use of barriers and devices to improve motorcyclist safety may be considered by jurisdictions, particularly on popular motorcycling routes and areas considered to be high-risk (e.g. on the outside of curves).” However, it should be pointed out that the reference is European in origin, based on publications that are now over a decade old, and thus may not necessarily reflect current New Zealand or Australian conditions, and thus needs to be considered in the light of the discussions earlier concerning effects on other vehicle types.
The current AS/NZS Barrier Standard (AS/NZS 3845: 1999) [20] does not prescribe crash tests to assess the protection level of barriers to motorcyclists although the revision AS/NZS 3845.1: 2014 [19] about to be release will require the EN 1317 Part 8 [18] test procedure for barriers that claim they provide protection for motorcyclists who impact them. In order to provide further advice to the CE33 Australian Standards Committee concerning the AS/NZS 3845.1: 2014 [19] revision regarding motorcycle crash testing, several ATD test arrangements were simulated to assess their applicability for use in physical crash test protocols. This was achieved by replacing THUMS with numerical models of ATDs in the barrier collision models developed in the previous analyses. The Hybrid III frontal impact ATD was considered for the cases where the thoracic impact was predominantly in the frontal orientation (Figure 16a). The EuroSid2 side impact ATD was considered for the case where the thoracic impact was predominantly in the lateral orientation (Figure 16b). The Hybrid III ATD was then setup according to the head-leading crash test protocols prescribed in EN 1317-8 [18], where the ATD is oriented to strike the barrier aligned with the post or the mid-span of the rail with an impact angle of 30° (Figure 16c).
a b
c
Figure 16: Barrier collisions with ATDs; a) Hydrid III frontal-post, b) EuroSid2 lateral-post, c) Hydrid III head-leading post-centred and mid-span oriented
15°
15°
30°
Post-centred impact
Mid-span impact
30°
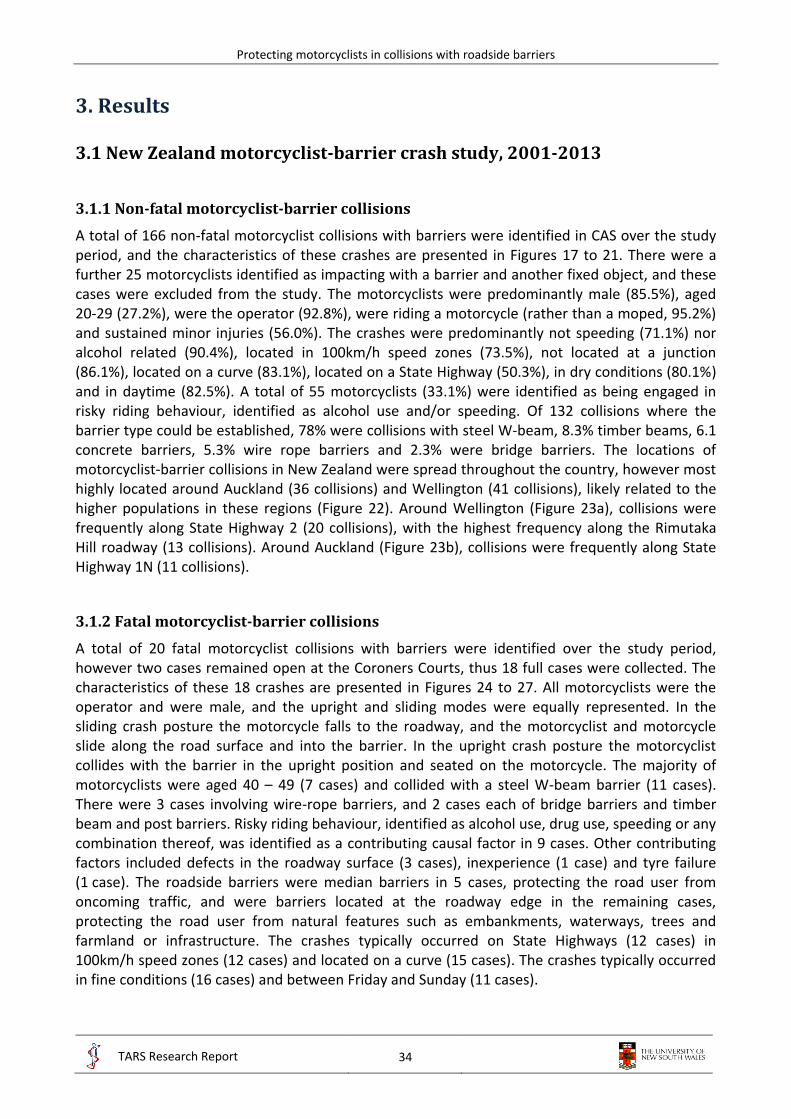
Protecting motorcyclists in collisions with roadside barriers
34
TARS Research Report
IRMRC
3. Results
3.1 New Zealand motorcyclist-barrier crash study, 2001-2013
3.1.1 Non-fatal motorcyclist-barrier collisions
A total of 166 non-fatal motorcyclist collisions with barriers were identified in CAS over the study period, and the characteristics of these crashes are presented in Figures 17 to 21. There were a further 25 motorcyclists identified as impacting with a barrier and another fixed object, and these cases were excluded from the study. The motorcyclists were predominantly male (85.5%), aged 20-29 (27.2%), were the operator (92.8%), were riding a motorcycle (rather than a moped, 95.2%) and sustained minor injuries (56.0%). The crashes were predominantly not speeding (71.1%) nor alcohol related (90.4%), located in 100km/h speed zones (73.5%), not located at a junction (86.1%), located on a curve (83.1%), located on a State Highway (50.3%), in dry conditions (80.1%) and in daytime (82.5%). A total of 55 motorcyclists (33.1%) were identified as being engaged in risky riding behaviour, identified as alcohol use and/or speeding. Of 132 collisions where the barrier type could be established, 78% were collisions with steel W-beam, 8.3% timber beams, 6.1 concrete barriers, 5.3% wire rope barriers and 2.3% were bridge barriers. The locations of motorcyclist-barrier collisions in New Zealand were spread throughout the country, however most highly located around Auckland (36 collisions) and Wellington (41 collisions), likely related to the higher populations in these regions (Figure 22). Around Wellington (Figure 23a), collisions were frequently along State Highway 2 (20 collisions), with the highest frequency along the Rimutaka Hill roadway (13 collisions). Around Auckland (Figure 23b), collisions were frequently along State Highway 1N (11 collisions).
3.1.2 Fatal motorcyclist-barrier collisions
A total of 20 fatal motorcyclist collisions with barriers were identified over the study period, however two cases remained open at the Coroners Courts, thus 18 full cases were collected. The characteristics of these 18 crashes are presented in Figures 24 to 27. All motorcyclists were the operator and were male, and the upright and sliding modes were equally represented. In the sliding crash posture the motorcycle falls to the roadway, and the motorcyclist and motorcycle slide along the road surface and into the barrier. In the upright crash posture the motorcyclist collides with the barrier in the upright position and seated on the motorcycle. The majority of motorcyclists were aged 40 – 49 (7 cases) and collided with a steel W-beam barrier (11 cases). There were 3 cases involving wire-rope barriers, and 2 cases each of bridge barriers and timber beam and post barriers. Risky riding behaviour, identified as alcohol use, drug use, speeding or any combination thereof, was identified as a contributing causal factor in 9 cases. Other contributing factors included defects in the roadway surface (3 cases), inexperience (1 case) and tyre failure (1 case). The roadside barriers were median barriers in 5 cases, protecting the road user from oncoming traffic, and were barriers located at the roadway edge in the remaining cases, protecting the road user from natural features such as embankments, waterways, trees and farmland or infrastructure. The crashes typically occurred on State Highways (12 cases) in 100km/h speed zones (12 cases) and located on a curve (15 cases). The crashes typically occurred in fine conditions (16 cases) and between Friday and Sunday (11 cases).

Protecting motorcyclists in collisions with roadside barriers
35
TARS Research Report
IRMRC
a b
c d
e f
Figure 17: Rider characteristics; a) rider gender, b) rider age, c) rider position, d) rider speeding, e) rider alcohol presence, f) type of two-wheeler (n = 166)
14.5
85.5
0
10
20
30
40
50
60
70
80
90
Female Male
Pro
po
rtio
n (
%)
11.6
27.2
16.2
20.8
16.8
7.5
0
10
20
30
Pro
po
rtio
n (
%)
92.8
7.2
0
10
20
30
40
50
60
70
80
90
100
Rider Pillion
Pro
po
rtio
n (
%)
71.1
28.9
0
10
20
30
40
50
60
70
80
Not speeding Speeding
Pro
po
rtio
n (
%)
9.6
90.4
0
10
20
30
40
50
60
70
80
90
100
Alcohol Not alcohol
Pro
po
rtio
n (
%)
4.8
95.2
0
10
20
30
40
50
60
70
80
90
100
Moped Motorcycle
Pro
po
rtio
n (
%)

Protecting motorcyclists in collisions with roadside barriers
36
TARS Research Report
IRMRC
Figure 18: Barrier type (n = 132)
a b
c d
Figure 19: Roadway characteristics; a) roadway speed zone, b) junction type, c) horizontal alignment, d) roadway type (n = 166) (SH = State Highway)
78.0
8.3 6.1 5.3 2.30
10
20
30
40
50
60
70
80
90
Steel W-beam
Timberbeam
Concrete Wirerope
Bridgebarrier
Pro
po
rtio
n (
%)
11.5
2.4
12.7
73.5
0
10
20
30
40
50
60
70
80
Pro
po
rtio
n (
%)
1.29.0
86.1
3.6
0
10
20
30
40
50
60
70
80
90
100
Pro
po
rtio
n (
%)
18.1
39.8
25.3
16.9
0
10
20
30
40
50
Pro
po
rtio
n (
%)
6.8 7.411.7
50.3
19.6
4.3
0
10
20
30
40
50
60
Pro
po
rtio
n (
%)

Protecting motorcyclists in collisions with roadside barriers
37
TARS Research Report
IRMRC
Figure 20: Other characteristics; a) weather conditions, b) lighting conditions (n = 166)
Figure 21: Injury outcome (n = 166)
80.1
19.7
0
10
20
30
40
50
60
70
80
90
Dry Wet
Pro
po
rtio
n (
%)
17.5
82.5
0
10
20
30
40
50
60
70
80
90
Dark Light
Pro
po
rtio
n (
%)
56.0
44.0
0
10
20
30
40
50
60
Minor Serious
Pro
po
rtio
n (
%)

Protecting motorcyclists in collisions with roadside barriers
38
TARS Research Report
IRMRC
Figure 22: Locations of non-fatal motorcyclist-barrier crashes (n = 166)

Protecting motorcyclists in collisions with roadside barriers
39
TARS Research Report
IRMRC
a
b
Figure 23: Locations of non-fatal motorcyclist-barrier crashes near; a) Wellington, b) Auckland

Protecting motorcyclists in collisions with roadside barriers
40
TARS Research Report
IRMRC
a b
c
Figure 24: Rider characteristics; a) rider age, b) contributing factors, c) impact posture
a b
Figure 25: Roadside barrier characteristics; a) barrier type, b) object the barrier is protecting
0
1
2
3
4
5
6
7
8
20-29 30-39 40-49 50-59 60+
Fata
litie
s
0
1
2
3
4
5
Fata
litie
s
0
1
2
3
4
5
6
7
8
9
10
Sliding Upright
Fata
litie
s
0123456789
101112
Steel W-beam
Wirerope
Bridgebarrier
Timberbeam
Fata
litie
s
0
1
2
3
4
5
6
Fata
litie
s

Protecting motorcyclists in collisions with roadside barriers
41
TARS Research Report
IRMRC
a b
c
Figure 26: Roadway characteristics; a) roadway type, b) roadway speed zone, c) horizontal alignment
a b
Figure 27: Other characteristics; a) weather, b) day of the week
0123456789
10111213
StateHighway
Arterialroad
Motorway
Fata
litie
s
0123456789
10111213
100km/h 80km/h 70km/h 50km/h
Fata
litie
s
0
1
2
3
4
5
6
7
8
9
Left bend Right bend Straight
Fata
litie
s
0
2
4
6
8
10
12
14
16
18
Fine Raining
Fata
litie
s
0
1
2
3
4
5
6
Fata
litie
s

Protecting motorcyclists in collisions with roadside barriers
42
TARS Research Report
IRMRC
The results of the injury analysis of serious (AIS3+) injuries sustained by the motorcyclists involved in fatal collisions, determined from the autopsy reports, are presented in Figure 28. Every motorcyclist sustained at least one serious thoracic injury, while serious head (57%), serious abdomen (43%) and serious spine (36%) injuries were also frequently sustained.
Figure 28: Proportion of motorcyclists that sustained serious (AIS3+) injuries in each of the body regions
3.1.3 Motorcyclist collisions with all types of fixed objects
A total of 1,107 fatal and non-fatal motorcyclist collisions with the fixed objects considered were identified in CAS during the study period. The crude (unadjusted) rate of KSI for each of the fixed objects is tabulated in Table 5, where embankments (0.49) and trees (0.50) had very similar rates of KSI to barriers (0.49), while posts and poles had a higher value (0.61). The value for infrastructure objects (0.40) was lower than that for barriers. When adjusting for potential confounding from other variables using multivariable logistic regression the results were quite similar, where relative to barriers (1.0), the odds of KSI for embankments (1.017) and trees (1.083) were very similar to barriers, while the odds for posts and poles were significantly higher (1.754) and the odds for infrastructure was lower (0.773). The full statistical results are tabulated in Table 6, where it should be noted that the results for embankments and trees were not statistically significant, i.e. the odds of sustaining KSI from collisions with embankments or trees were not statistically significantly different to the odds from barriers.
Head 57%
Spine 36% Thorax
100%
Abdomen 43%
Lower ext. 21%
Pelvis 21%

Protecting motorcyclists in collisions with roadside barriers
43
TARS Research Report
IRMRC
Table 5: Relative severity of motorcyclist collisions with roadside barriers and other types of fixed objects
Fixed object Crude
(rate of KSI) Adjusted with logistic regression
(odds ratio compared with barriers for outcome of KSI)
Barrier 0.49 1 Embankment 0.49 1.017 Infrastructure 0.40 0.773 Post/pole 0.61 1.754 Tree 0.50 1.083
KSI = killed or seriously injured
The full results for motorcyclist-fixed object collisions in Table 6 indicate that motorcyclists predominantly collided with embankments (49.2%), were aged less than 65 years (97.4%), were the operator (91.1%) and were male (85.6%). The collisions typically occurred in 100km/h speed zones or above (67.4%), not at intersection locations (79.6%), were located in rural regions (80.1%), on curves (77.6%), on sealed roadways (95.3%), on dry roadways (83.8%), in the daytime (74.6%), and did not involve alcohol (78.9%) nor speeding (69.1%).
Table 6: Descriptive, univariable and multivariable logistic regression results for motorcyclist-fixed object collisions
KSI = killed or seriously injured, OR = odds ratio, CLL / CLU = lower/upper 95% confidence interval
Total motorcyclist casualties
Motorcyclists with KSI
Univariable logistic regression Outcome = KSI
Multivariable logistic regression Outcome = KSI
n % n % OR CLL CLU p OR CLL CLU p
Collision counterpart - barrier 184 16.5 91 16.4 1 1 embankment 548 49.2 270 48.7 1.075 0.766 1.510 0.675 1.017 0.718 1.442 0.924 infrastructure 145 13.0 58 10.5 0.738 0.473 1.151 0.180 0.773 0.480 1.247 0.292 post/pole 155 13.9 94 17.0 1.706 1.102 2.641 0.017 1.754 1.108 2.777 0.016 tree 82 7.4 41 7.4 1.107 0.656 1.869 0.703 1.083 0.632 1.855 0.773
Speed limit - <100 km/h 361 32.6 164 30.0 1 1 ≥100 km/h 746 67.4 383 70.0 1.267 0.985 1.631 0.065 1.445 1.074 1.945 0.015
Age < 65 years 1078 97.4 530 96.9 1 -- ≥ 65 years 29 2.6 17 3.1 1.465 0.693 3.096 0.318 --
Alcohol related – no 873 78.9 412 75.3 1 1 yes 234 21.1 135 24.7 1.526 1.140 2.042 0.005 1.572 1.149 2.149 0.005
Pillion 98 8.9 30 5.5 1 1 operator 1009 91.1 517 94.5 2.381 1.523 3.723 <0.001 2.367 1.500 3.737 <0.001
Female 159 14.4 62 11.3 1 -- male 948 85.6 485 88.7 1.639 1.163 2.310 0.005 --
Intersection location – no 881 79.6 443 81.0 1 -- yes 226 20.4 104 19.0 0.843 0.629 1.130 0.253 --
Rural location 887 80.1 437 79.9 1 -- metropolitan location 220 19.9 110 20.1 1.030 0.766 1.383 0.845 --
Curve location – no 248 22.4 118 21.6 1 -- yes 859 77.6 429 78.4 1.099 0.828 1.458 0.513 --
Non-sealed roadway 52 4.7 30 5.5 1 -- sealed roadway 1055 95.3 517 94.5 0.705 0.401 1.238 0.223 --
Wet roadway 179 16.2 77 14.1 1 -- dry roadway 928 83.8 470 85.9 1.359 0.984 1.877 0.062 --
Daytime – no 281 25.4 143 26.1 1 -- yes 826 74.6 404 73.9 0.924 0.705 1.211 0.566 --
Speeding related – no 765 69.1 349 63.8 1 1 yes 342 30.9 198 36.2 1.639 1.267 2.120 0.002 1.575 1.208 2.053 <0.001

Protecting motorcyclists in collisions with roadside barriers
44
TARS Research Report
IRMRC
Other factors that statistically significantly influenced the outcome of sustaining KSI in the collision, besides the type of object collided with, included (odds ratio, 95% confidence interval, p value): speed zones of 100km/h or more (1.445, 1.074-1.945, 0.015); alcohol use (1.572, 1.149-2.149, 0.005); operators (2.367, 1.500-3.737, <0.001); and speeding (1.575, 1.208-2.053, <0.001).
3.1.4 Comparison with passenger vehicle-barrier collisions
A total of 1,640 passenger vehicle occupants in single-vehicle collisions with roadside barriers were identified in CAS during the study period. The distribution of injury severities is tabulated and compared with those of motorcyclists in Table 7. It is clear that the higher the injury severity considered, the closer are the number of motorcyclists and passenger vehicle casualties. It is a concern that while motorcyclists constitute only 3% of the vehicle fleet, nearly as many motorcyclists as passenger vehicle occupants were killed as a result of collisions with barriers. This results from the fact that barriers are very effective in preventing serious injuries for passenger vehicle occupants, for which they are specifically designed and crash tested, where 1.4% and 11.3% of casualties sustained fatal or serious injuries, respectively. Conversely, barriers provide substantial injury potential for motorcyclists, where 10.8% and 39.2% of casualties sustained fatal or serious injuries, respectively.
Table 7: Comparison of motorcyclist-barrier and passenger vehicle-barrier casualty collision frequencies
Minor injury Serious injury Fatality Total casualties n % n % n % n
Passenger vehicle casualties 1431 87.3 186 11.3 23 1.4 1640 Motorcyclist casualties 93 50.0 73 39.2 20 10.8 186
3.2 Development of motorcyclist-barrier computer simulation models
3.2.1 THUMS-barrier thorax-leading collision model
A total of 13 cases were identified from the fatal motorcyclist-barrier collision crash cases in the sliding posture, where the motorcyclist was likely to have collided with the post or beam of the W-beam barrier in the thorax-leading orientation. These cases are summarised in Table 8. The assumed impact orientation is tabulated in Table 8, where three cases were assumed to have occurred in the lateral-post orientation, six in the frontal-post orientation and four in the frontal-beam orientation. The calculated impact speeds varied between 25.9km/h and 92.9km/h, and the impact angles varied between 5° and 32°. The maximum AIS severity levels (MAIS) of the thoracic injuries were generally quite severe, ranging from MAIS3 to MAIS6 with five cases of critical injury (MAIS≥5), which is to be expected considering the high impact speeds and the fact that the crashes were fatal.

Protecting motorcyclists in collisions with roadside barriers
45
TARS Research Report
IRMRC
Table 8: Motorcyclist-barrier collision crash cases in the thorax-leading orientation and FE results for THUMS subjected to the initial conditions for each crash case.
L = left, R = right, fx = fracture;
a calculated from the pre-crash speed estimate and measured sliding distance; All motorcyclists were male
Cas
e
Ass
um
ed
imp
act
ori
en
tati
on
Sid
e
of
po
st
stru
ck
Tho
raci
c in
juri
es
de
term
ine
d f
rom
au
top
sy
Age
M
AIS
th
ora
x
Imp
act
spe
ed
a
(km
/h)
Imp
act
angl
e
to
lon
gitu
din
al
(de
gre
es)
FE
- T
HU
MS
Tho
raci
c d
efl
ect
ion
/ th
ora
cic
dia
me
ter
1
Fro
nta
l-p
ost
O
pen
L
rib
s #
1-4
fx,
R r
ib #
2 f
x, r
up
ture
d p
eri
card
ial m
emb
ran
e, p
erf
ora
ted
R h
ear
t ve
ntr
icle
, L lu
ng
colla
pse
, R lu
ng
oed
em
a, R
lun
g co
ntu
sio
ns,
L h
aem
oth
ora
x 3
2
6
75
.1
21
0
.56
2
2
Fro
nta
l-p
ost
O
pen
M
ult
iple
bila
tera
l rib
fx
wit
h f
lail
ches
t, t
ran
sect
ed
ste
rnu
m, m
ult
iple
hea
rt la
cera
tio
ns
wit
h r
up
ture
, bila
tera
l h
aem
oth
ora
x 5
3
5
63
.0
16
0
.53
9
3
Fro
nta
l-p
ost
O
pen
B
ilate
ral l
un
g co
llap
se, b
ilate
ral h
aem
op
neu
mo
tho
race
s, p
ost
eri
or
sub
par
ieta
l ple
ura
l hae
mo
rrh
ages
, tra
nsv
erse
fx
at
T1-T
2 w
ith
par
tial
co
rd t
ran
sect
ion
3
3
4
25
.9
19
0
.42
3
4
Fro
nta
l-p
ost
C
lose
d
Ten
sio
n p
neu
mo
tho
rax,
mu
ltip
le b
ilate
ral r
ib f
x
40
5
7
6.2
1
6
0.5
71
5
Fro
nta
l-p
ost
O
pen
B
ilate
ral c
olla
pse
d lu
ngs
, L r
ibs
#1
-12
fx
(an
tero
late
ral)
, R r
ibs
#1
-6 f
x (a
nte
rio
r), f
lail
ches
t, s
tern
um
fx,
bila
tera
l h
aem
oth
ora
ces,
per
icar
diu
m a
nd
he
art
lace
rati
on
s, a
ort
a tr
anse
ctio
n
43
6
6
2.5
1
6
0.5
34
6
Fro
nta
l-p
ost
C
lose
d
R r
ibs
#3
-5 f
x, L
rib
s #3
-5 f
x, s
tern
um
fx,
bila
tera
l hae
mo
tho
race
s, R
ven
tric
le a
nd
L a
triu
m r
up
ture
s, T
3 f
x w
ith
co
rd t
ran
sect
ion
2
2
6
71
.6
5
0.5
45
7
Late
ral-
po
st
Clo
sed
L
lun
g co
ntu
sio
ns
and
lace
rati
on
s, L
hae
mo
tho
rax,
L r
ibs
#3-8
fx
(par
aste
rnal
), R
rib
s #
5-8
fx
(lat
eral
)
30
3
2
8.9
1
8
0.3
93
8
Late
ral-
po
st
Clo
sed
L
flai
l ch
est
wit
h r
ibs
#5-1
1 f
x (p
ost
ero
late
ral)
, L lu
ng
con
tusi
on
s an
d la
cera
tio
ns,
L lu
ng
colla
pse
d, L
h
aem
op
neu
mo
tho
rax,
dia
ph
ragm
lace
rati
on
s 2
1
4
38
.9
28
0
.52
7
9
Late
ral-
po
st
Op
en
L ri
bs
#2
-6 f
x (p
aras
tern
al)
3
9
3
30
.0
32
0
.41
7
10
Fr
on
tal-
bea
m
--
R h
aem
oth
ora
x, R
rib
s #4
-6 f
x (a
nte
rio
r), T
3 f
x-d
islo
cati
on
48
3
9
2.9
1
0
0.3
79
11
Fr
on
tal-
bea
m
--
R lu
ng
lace
rati
on
s an
d c
on
tusi
on
, R h
aem
oth
ora
x, R
rib
s #2
-4 f
x (a
nte
rio
r), R
rib
s #3
-11
fx
(po
ster
ola
tera
l),
lace
rate
d d
iap
hra
gm
31
3
6
2.5
1
3
0.3
70
12
Fr
on
tal-
bea
m
--
Bila
tera
l hae
mo
tho
race
s, R
5 u
pp
er r
ibs
fx, T
6 a
nd
T7
tra
nsv
erse
fx
4
8
3
65
.7
9
0.2
69
13
Fr
on
tal-
bea
m
--
R r
ibs
#1
-12
fx
(po
ster
ior)
, R h
aem
oth
ora
x, R
lun
g la
cera
tio
n a
nd
co
ntu
sio
n
7
0
4
68
.3
11
0
.35
5

Protecting motorcyclists in collisions with roadside barriers
46
TARS Research Report
IRMRC
The crash mechanics of the lateral-post orientation numerical models are presented in Figure 29. This work was funded and completed previously under a separate research project also reported elsewhere. The frontal-post orientation results (Figure 30) were similar to those in the lateral-post orientation, where the majority of the motorcyclist kinetic energy is expended upon impact with the rigid post, and the motorcyclist body wraps around the post. Conversely, a limited amount of the motorcyclist kinetic energy is expended during the frontal-beam collision, since while the lateral velocity (perpendicular to the barrier) reduces to zero, this component is a relatively small proportion of the total velocity as a result of the shallow impact angle. The longitudinal velocity is reduced by only a small amount and the motorcyclist is redirected along and/or away from the barrier. The example frontal beam orientation response of THUMS at maximum thoracic compression in Figure 30, shows at which time the longitudinal velocity has decreased by only 6% of the initial value. Conversely, in the frontal-post and lateral-post orientations the velocity of the torso reduces to zero in both the longitudinal and lateral directions upon attaining maximum thoracic compression.
a b c d
Figure 29: Crash mechanics for the lateral-post orientation at; a) 0ms, b) 25ms, c) 50ms, 75ms (maximum thoracic compression at 25ms)
Figure 30: Frontal-beam orientation at maximum thoracic compression

Protecting motorcyclists in collisions with roadside barriers
47
TARS Research Report
IRMRC
Example responses of the thoracic bony structures and internal organs at maximum thoracic compression are presented in Figure 31. Significant compression of the thorax results as the leading side stops against the post (Figure 31a,b) or beam (Figure 31c), and the inertia of the torso compresses the ribs and internal organs. The lateral-post impact is somewhat dampened by the presence of the upper arm (not shown in Figure 31a). Negligible deflection of the post occurred in the post impact models, while small deflections of the beam occurred in the beam impact model. The maximum lateral deflection of the beam in all cases analysed was 4.2mm.
a b c
Figure 31: Maximum compression of the thoracic bony structures and internal organs; a) lateral-post, b) frontal-post, c) frontal-beam orientations
The biomechanical responses of the THUMS motorcyclist-barrier collision models are quantitatively validated against the field-observed crash cases using the maximum normalised thoracic deflection. The FE normalised thoracic deflection results are tabulated in Table 8, and plotted in Figure 32 against the MAIS of the field-observed thoracic injuries. That is, for each collision case the normalised deflection is determined from the THUMS FE model, and the thoracic injury severity is determined from the motorcyclist autopsy. These collision case results are then compared with the PMHS experimental results, where the maximum normalised thoracic deflection and corresponding thoracic injury severity were reported. In Figure 32 the linear trendlines for the PMHS frontal and lateral thoracic impact are plotted rather than the individual PMHS test results (Equations 2 and 3, [36-38]).
The THUMS collision model is considered validated if; for a known (field-observed) injury outcome, the THUMS model of the impact conditions that produced that outcome predicts the expected value of normalised thoracic deflection. The expected value of normalised deflection is the value associated with that thoracic injury severity level in the PMHS experiments. The comparisons in Figure 32 indicate that the numerical model is in general agreement with the PMHS results, however the normalised deflection values are typically over-predicted by the FE model for the post impact cases (or conversely, for a given FE deflection the injury severity is under-predicted).
The results for the THUMS model in all three orientations under incrementally increasing impact speed are presented in Figure 33. The injury levels predicted according to Equation 2 are also included in the figure. These results indicate that post impacts provide substantially higher
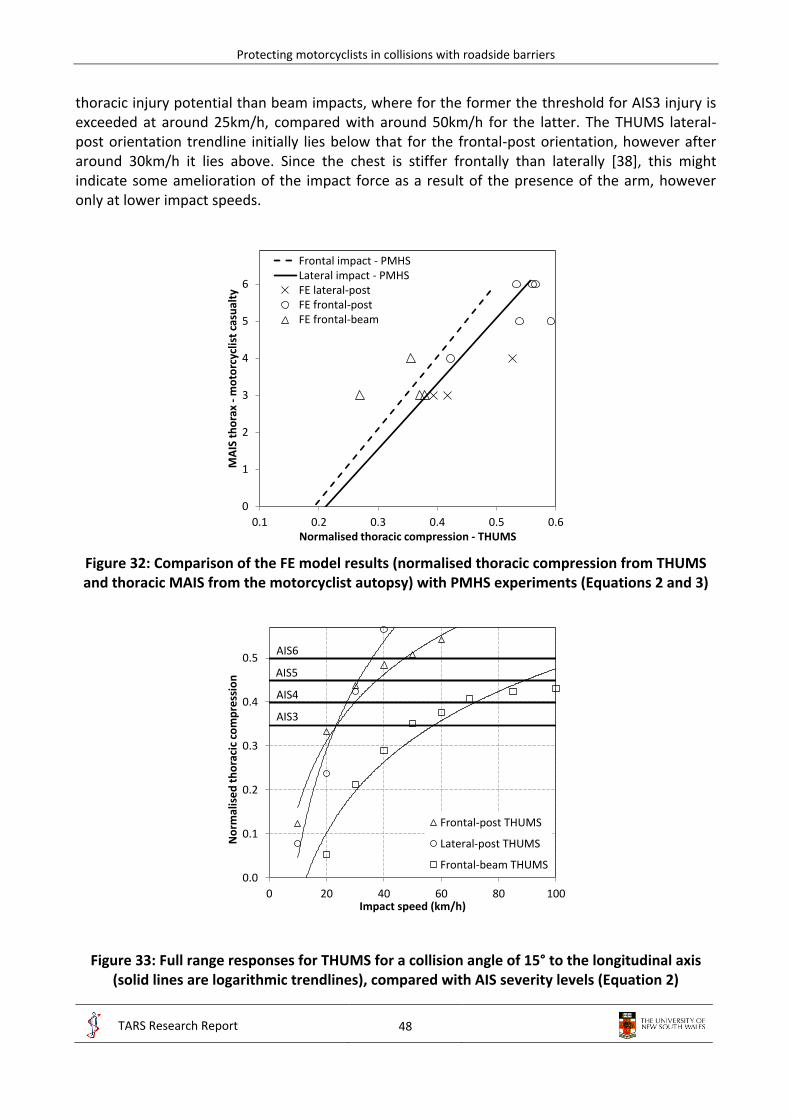
Protecting motorcyclists in collisions with roadside barriers
48
TARS Research Report
IRMRC
thoracic injury potential than beam impacts, where for the former the threshold for AIS3 injury is exceeded at around 25km/h, compared with around 50km/h for the latter. The THUMS lateral-post orientation trendline initially lies below that for the frontal-post orientation, however after around 30km/h it lies above. Since the chest is stiffer frontally than laterally [38], this might indicate some amelioration of the impact force as a result of the presence of the arm, however only at lower impact speeds.
Figure 32: Comparison of the FE model results (normalised thoracic compression from THUMS and thoracic MAIS from the motorcyclist autopsy) with PMHS experiments (Equations 2 and 3)
Figure 33: Full range responses for THUMS for a collision angle of 15° to the longitudinal axis (solid lines are logarithmic trendlines), compared with AIS severity levels (Equation 2)
0
1
2
3
4
5
6
0.1 0.2 0.3 0.4 0.5 0.6
MA
IS t
ho
rax
-m
oto
rcyc
list
casu
alty
Normalised thoracic compression - THUMS
Frontal impact - PMHSLateral impact - PMHSFE lateral-postFE frontal-postFE frontal-beam
0.0
0.1
0.2
0.3
0.4
0.5
0 20 40 60 80 100
No
rmal
ise
d t
ho
raci
c co
mp
ress
ion
Impact speed (km/h)
Frontal-post THUMS
Lateral-post THUMS
Frontal-beam THUMS
AIS3
AIS4
AIS5
AIS6
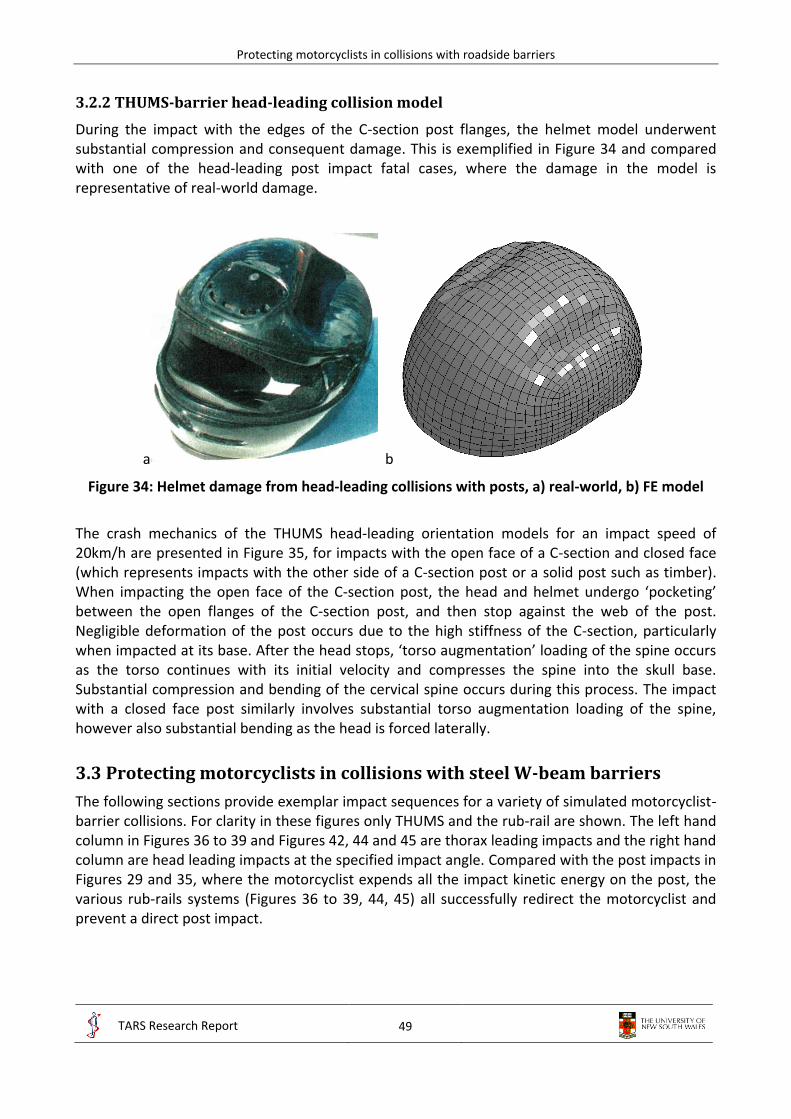
Protecting motorcyclists in collisions with roadside barriers
49
TARS Research Report
IRMRC
3.2.2 THUMS-barrier head-leading collision model
During the impact with the edges of the C-section post flanges, the helmet model underwent substantial compression and consequent damage. This is exemplified in Figure 34 and compared with one of the head-leading post impact fatal cases, where the damage in the model is representative of real-world damage.
a b
Figure 34: Helmet damage from head-leading collisions with posts, a) real-world, b) FE model
The crash mechanics of the THUMS head-leading orientation models for an impact speed of 20km/h are presented in Figure 35, for impacts with the open face of a C-section and closed face (which represents impacts with the other side of a C-section post or a solid post such as timber). When impacting the open face of the C-section post, the head and helmet undergo ‘pocketing’ between the open flanges of the C-section post, and then stop against the web of the post. Negligible deformation of the post occurs due to the high stiffness of the C-section, particularly when impacted at its base. After the head stops, ‘torso augmentation’ loading of the spine occurs as the torso continues with its initial velocity and compresses the spine into the skull base. Substantial compression and bending of the cervical spine occurs during this process. The impact with a closed face post similarly involves substantial torso augmentation loading of the spine, however also substantial bending as the head is forced laterally.
3.3 Protecting motorcyclists in collisions with steel W-beam barriers
The following sections provide exemplar impact sequences for a variety of simulated motorcyclist-barrier collisions. For clarity in these figures only THUMS and the rub-rail are shown. The left hand column in Figures 36 to 39 and Figures 42, 44 and 45 are thorax leading impacts and the right hand column are head leading impacts at the specified impact angle. Compared with the post impacts in Figures 29 and 35, where the motorcyclist expends all the impact kinetic energy on the post, the various rub-rails systems (Figures 36 to 39, 44, 45) all successfully redirect the motorcyclist and prevent a direct post impact.

Protecting motorcyclists in collisions with roadside barriers
50
TARS Research Report
IRMRC
Open faced post: 15° impact @ 20km/h Closed face post: 15° impact @ 20km/h
10 ms
10 ms
20 ms
20 ms
30 ms
30 ms
40 ms
40 ms
50 ms
50 ms
Figure 35: Post impacts with 15° impact at 20km/h

Protecting motorcyclists in collisions with roadside barriers
51
TARS Research Report
IRMRC
3.3.1 Rub-rail systems
Steel – CSP PD: 15° impact @ 60km/h Steel – CSP PD: 15° impact @ 60km/h
25 ms
25 ms
50 ms
50 ms
75 ms
75 ms
100 ms
100 ms
125 ms
125 ms
150 ms
150 ms
175 ms
175 ms
200 ms
200 ms
Figure 36: Steel CSP PD with 15° impact at 60km/h

Protecting motorcyclists in collisions with roadside barriers
52
TARS Research Report
IRMRC
Steel – CSP PD: 30° impact @ 60km/h Steel – CSP PD: 30° impact @ 60km/h
20 ms
20 ms
40 ms
40 ms
60 ms
60 ms
80 ms
80 ms
100 ms
100 ms
Figure 37: Steel CSP PD with 30° impact at 60km/h
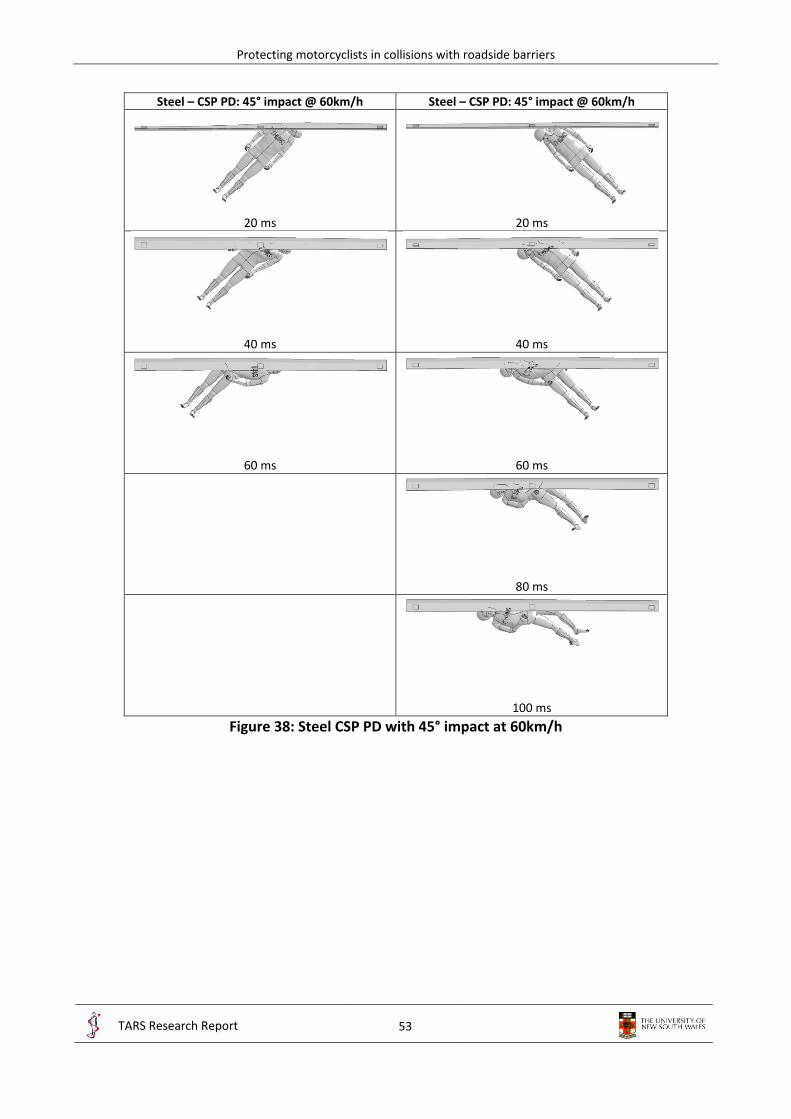
Protecting motorcyclists in collisions with roadside barriers
53
TARS Research Report
IRMRC
Steel – CSP PD: 45° impact @ 60km/h Steel – CSP PD: 45° impact @ 60km/h
20 ms
20 ms
40 ms
40 ms
60 ms
60 ms
80 ms
100 ms
Figure 38: Steel CSP PD with 45° impact at 60km/h

Protecting motorcyclists in collisions with roadside barriers
54
TARS Research Report
IRMRC
Fabric – high stiffness: 15° impact @ 60km/h Fabric – high stiffness: 15° impact @ 60km/h
25 ms
25 ms
50 ms
50 ms
75 ms
75 ms
100 ms
100 ms
125 ms
125 ms
150 ms
150 ms
175 ms
175 ms
200 ms
200 ms
Figure 39: Fabric with high stiffness connectors and with 15° impact at 60km/h

Protecting motorcyclists in collisions with roadside barriers
55
TARS Research Report
IRMRC
3.3.2 Post protectors
Padded post – high stiffness: 15° impact @ 20km/h Padded post – low stiffness: 15° impact @ 20km/h
20 ms
20 ms
40 ms
40 ms
60 ms
60 ms
80 ms
80 ms
Figure 40: Post protectors with 15° impact at 20km/h Exemplar deformations of the paddings are demonstrated in Figure 41.
a b Figure 41: Example deformations in the post protectors; a) high stiffness, b) low stiffness

Protecting motorcyclists in collisions with roadside barriers
56
TARS Research Report
IRMRC
3.3.3 Concrete barriers
Concrete - Jersey: 15° impact @ 60km/h Concrete - Jersey: 15° impact @ 60km/h
25 ms
25 ms
50 ms
50 ms
75 ms
75 ms
100 ms
100 ms
125 ms
125 ms
150 ms
150 ms
175 ms
175 ms
Figure 42: Concrete Jersey barrier with 15° impact at 60km/h
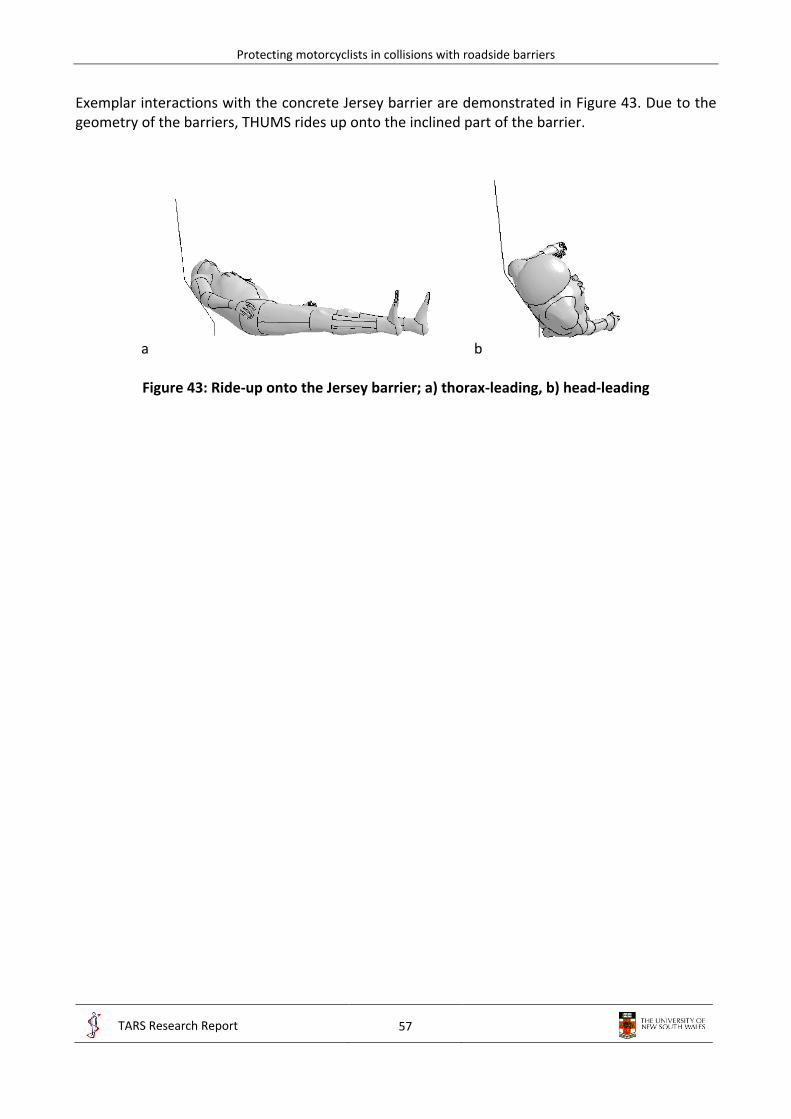
Protecting motorcyclists in collisions with roadside barriers
57
TARS Research Report
IRMRC
Exemplar interactions with the concrete Jersey barrier are demonstrated in Figure 43. Due to the geometry of the barriers, THUMS rides up onto the inclined part of the barrier.
a b
Figure 43: Ride-up onto the Jersey barrier; a) thorax-leading, b) head-leading

Protecting motorcyclists in collisions with roadside barriers
58
TARS Research Report
IRMRC
3.3.4 Steel W-beam barriers without blockouts (Nu-Guard)
Steel – CSP PD with Nu-Guard: 15° impact @ 60km/h Steel – CSP PD with Nu-Guard: 15° impact @ 60km/h
25 ms
25 ms
50 ms
50 ms
75 ms
75 ms
100 ms
100 ms
125 ms
125 ms
150 ms
150 ms
175 ms
175 ms
200 ms
200 ms
Figure 44: Steel CSP PD with Nu-Guard and with 15° impact at 60km/h

Protecting motorcyclists in collisions with roadside barriers
59
TARS Research Report
IRMRC
Steel – CSP PD with Nu-Guard: 30° impact @ 60km/h Steel – CSP PD with Nu-Guard: 30° impact @ 60km/h
20 ms
20 ms
40 ms
40 ms
60 ms
60 ms
80 ms
80 ms
100 ms
100 ms
Figure 45: Steel CSP PD with Nu-Guard and with 30° impact at 60km/h Exemplar deformations of the cervical spine for various different barriers and rub-rails are demonstrated in Figure 46.

Protecting motorcyclists in collisions with roadside barriers
60
TARS Research Report
IRMRC
Front view Side view
Non- deformed
Closed post 15°
20km/h
Open post 15°
20km/h
Concrete Jersey
15° 60km/h
Steel – CSP PD 15°
60km/h
Concrete Jersey
45° 60km/h
Steel – CSP PD 45°
60km/h
Figure 46: Comparison of cervical spine bending in head-leading collisions with different barriers

Protecting motorcyclists in collisions with roadside barriers
61
TARS Research Report
IRMRC
3.3.5 Parametric study
The results of the parametric studies of all barriers, rub-rails, impact angles and speeds are presented in Table 10 and Figures 47 to 49 for thorax-leading impacts, and Tables 12 to 15 for head-leading impacts. Full results are tabulated in Appendix D.
The impact with the barrier posts indicated that the majority of the collision kinetic energy was expended upon the post (Figure 29). This led to critical thoracic injury at low impact speeds (Figure 33). Conversely, impacts with the rub-rails indicated that they were very effective in eliminating post impacts by redirecting the motorcyclist, thereby dissipating the kinetic energy of the collision in sliding friction. The results for the thorax-leading impacts with rub-rails and with 15° impact are summarised in Figure 47. In Figure 47a all rub-rails are compared with post impacts. While impacts with the post resulted in critical thoracic injury at impact speeds of approximately 40km/h, both critical and serious thoracic injuries were prevented even at the highest impact speeds of 100km/h for all rub-rail systems considered. However, there were differences between different rub-rail systems. For the generic flat profiles (fabric and steel, Figures 47b and c), rub-rails with lower connection stiffness provided lower thoracic injury potential. The profiled steel rub-rails generally provided similar thoracic injury potential (Figure 47d), while the steel pipe rub-rail provided the least (due to the particular shape and the way in which THUMS interacted with it). The two public domain rub-rails (CSP PD and Ingal PD) provided very similar thoracic injury potential. The profiled steel rub-rails generally provided thoracic injury potential between those of the low and high stiffness flat profiles.
The results for the higher impact angle collisions are summarised in Figure 48, for the profiled steel CSP PD rub-rail. As expected, the higher impact angles provide higher thoracic injury potential, since the component of the impact velocity perpendicular to the barrier is higher. Importantly, for all impact angles and speeds the predicted thoracic injury severity is less than serious.
The thorax-leading impacts with steel rub-rails and the Nu-Guard barrier without blockouts are compared with those for the barriers with blockouts in Table 10. The impact sequences (Figures 44 and 45) indicate that due to the absence of the blockout and the consequently much lower clearance between the rub-rail and the posts (75mm), the rub-rails contact with the post for all impacts considered. While this resulted in a more rigid response after post contact, there remained sufficient flexibility in the system that the thoracic injury potential was only marginally larger compared with barriers with blockouts.
The thorax-leading impacts at 15° impact angle are compared for barrier posts and concrete barriers in Figure 49a. Similar to the rub-rails, the thoracic injury potential is substantially less than that for posts, and even at the highest speeds, both critical and serious thoracic injuries were prevented. However, for head leading impacts for both concrete barriers serious and critical head and spine injuries occurred at 100 km/h at a 15° impact angle. The two different concrete barrier types (F-shape and Jersey) provided very similar thoracic and head injury potential. Unlike rub-rails, however, the thoracic injury potential increased substantially with impact angle for the concrete Jersey barrier (Figure 49b). At the higher impact speeds considered, impacts at 30° were predicted to result in serious thoracic injury, while at 45° they were predicted to result in critical thoracic injury. This results from the purely rigid behaviour of the concrete barriers, compared with the more flexible rub-rails.
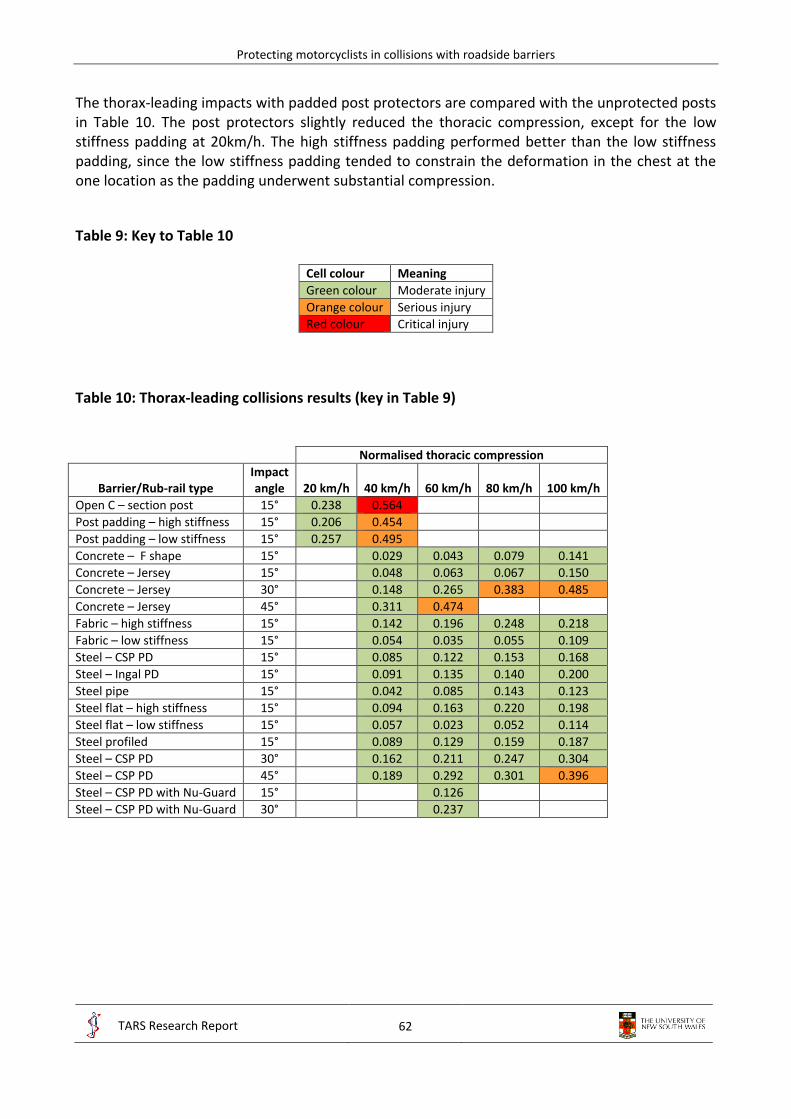
Protecting motorcyclists in collisions with roadside barriers
62
TARS Research Report
IRMRC
The thorax-leading impacts with padded post protectors are compared with the unprotected posts in Table 10. The post protectors slightly reduced the thoracic compression, except for the low stiffness padding at 20km/h. The high stiffness padding performed better than the low stiffness padding, since the low stiffness padding tended to constrain the deformation in the chest at the one location as the padding underwent substantial compression.
Table 9: Key to Table 10
Cell colour Meaning
Green colour Moderate injury
Orange colour Serious injury
Red colour Critical injury
Table 10: Thorax-leading collisions results (key in Table 9)
Normalised thoracic compression
Barrier/Rub-rail type Impact angle 20 km/h 40 km/h 60 km/h 80 km/h 100 km/h
Open C – section post 15° 0.238 0.564
Post padding – high stiffness 15° 0.206 0.454
Post padding – low stiffness 15° 0.257 0.495
Concrete – F shape 15° 0.029 0.043 0.079 0.141
Concrete – Jersey 15° 0.048 0.063 0.067 0.150
Concrete – Jersey 30° 0.148 0.265 0.383 0.485
Concrete – Jersey 45° 0.311 0.474
Fabric – high stiffness 15° 0.142 0.196 0.248 0.218
Fabric – low stiffness 15° 0.054 0.035 0.055 0.109
Steel – CSP PD 15° 0.085 0.122 0.153 0.168
Steel – Ingal PD 15° 0.091 0.135 0.140 0.200
Steel pipe 15° 0.042 0.085 0.143 0.123
Steel flat – high stiffness 15° 0.094 0.163 0.220 0.198
Steel flat – low stiffness 15° 0.057 0.023 0.052 0.114
Steel profiled 15° 0.089 0.129 0.159 0.187
Steel – CSP PD 30° 0.162 0.211 0.247 0.304
Steel – CSP PD 45° 0.189 0.292 0.301 0.396
Steel – CSP PD with Nu-Guard 15° 0.126
Steel – CSP PD with Nu-Guard 30° 0.237

Protecting motorcyclists in collisions with roadside barriers
63
TARS Research Report
IRMRC
a b
c d
Figure 47: Summary of thorax-leading impacts with rub-rails and with 15° impact; a) all rub-rails,
b) fabric rub-rails, c) flat steel rub-rails, d) profiled steel rub-rails

Protecting motorcyclists in collisions with roadside barriers
64
TARS Research Report
IRMRC
Figure 48: Thorax-leading impacts with steel CSP PD and with 15° to 45° impacts
a b
Figure 49: Thorax-leading impacts with concrete barriers; a) F-shape and Jersey barriers with 15° impact, b) Jersey barriers with 15° to 45° impacts
The results for the injury measures for the cervical spine and brain in the head-leading collisions are summarised in Tables 12 to 15. Injury measures for the skull are not reported, since in very few cases was damage predicted to the skull, and in those cases the strains never reached fracture levels (0.03). This is due to the highly effective properties of the helmet in dampening and distributing the initial head impact. However, while the helmet was effective in minimising strains in the skull, the brain was subjected to substantial strains as a result of head accelerations during the impact. In interpreting these results it should be noted that a non-zero value of plastic strain indicates that the elastic stress limit of the material has been exceeded. The elastic stress limit is the stress which may be reached in a purely elastic manner, such that the material may be loaded and unloaded to this point infinitely. Exceeding this limit indicates that non-recoverable deformation (damage) has begun. Thus a plastic strain value in bone greater than zero but less

Protecting motorcyclists in collisions with roadside barriers
65
TARS Research Report
IRMRC
than the IARV of 0.03 indicates that damage has occurred, however not to the extent that might indicate fracture. As noted in the key to the results tables (Table 11), such damage is indicated as ‘0 fx’ (vertebral damage, but no fractures).
Similar to the thorax-leading results, head-leading collisions with the barrier posts resulted in the majority of the collision energy being expended upon the post (Figure 35). This led to critical brain/spine injury at low impact speeds (Table 12).
Conversely, impacts with the rub-rails indicated that they were very effective in eliminating post impacts by redirecting the motorcyclist, thereby dissipating the kinetic energy of the collision in sliding friction. The results for the head-leading impacts with rub-rails and with 15° impact are summarised in Table 13. For all collisions with steel rub-rails except those with low stiffness connectors, the results indicated that critical and serious brain/spine injuries were prevented even at the highest impact speeds of 100km/h. For collisions with fabric rub-rails and low stiffness connectors, serious/critical brain/spine injuries were not prevented, since large lateral deformations of the rub-rails led to contact with the barrier post and a sudden change to a more rigid response of the rub-rail.
Collisions with the concrete barriers indicated substantially lower injury potential than with the barrier posts, however serious/critical injuries occurred at higher impact speeds (100 km/h) and higher impact angles at lower impact speeds (30° and 45°). These results indicate that flexible rub-rail systems provide lower brain/spine injury potential than more rigid systems like concrete, however if the rub-rail is too flexible, interaction with the barrier post can result in the system becoming more rigid, increasing the injury potential (particularly at higher impact speeds).
The results for the higher impact angle head-leading collisions are summarised in Table 13, for the profiled steel CSP PD rub-rail. As expected, the higher impact angles provide higher brain/spine injury potential, since the component of the impact velocity perpendicular to the barrier is higher. Serious brain/spine injury resulted at 80km/h for 30° impacts, while serious and critical injury were predicted for 45° impacts at 60km/h and 80km/h, respectively. This is contrary to the thorax-leading results, where serious injuries were not predicted for all impact angles and speeds. This indicates that the head-leading orientation has generally higher injury potential than the thorax-leading orientation, particularly at high impact angles and speeds.
Similar to the thorax-leading results, the injury potential increased substantially with impact angle for the concrete Jersey barrier (Table 14). While serious/critical brain/spine injury was not predicted for impact speeds less than 100km/h at 15°, serious injuries were predicted at 40km/h and critical injury at 60km/h for higher impact angles. The injury potential was substantially greater than that for the steel rub-rails at these higher impact angles. This results from the purely rigid behaviour of concrete barriers, compared with the more flexible rub-rails.
Also similar to the thorax-leading results, the injury potential of the steel rub-rails with the Nu-Guard barrier in the head-leading orientation was only marginally greater than that for barriers with blockouts, and substantially less than the fully rigid concrete barriers (Table 15). These results indicate that while the lateral clearance is reduced and consequently the rub-rail becomes less flexible without the blockout, the system maintains sufficient flexibility to perform similar to systems with a blockout, and provides substantially less injury potential than rigid barriers (particularly at higher impact angles and speeds).

Protecting motorcyclists in collisions with roadside barriers
66
TARS Research Report
IRMRC
The head-leading impacts with padded post protectors are compared with the unprotected posts in Table 12. The post protectors slightly reduced the head-neck injury potential at 20km/h. However, the injury potential was higher at 40km/h where the extra impact energy led to substantial padding compression, which tended to constrain the head-neck deformation. This result has been noted in PMHS tests with paddings [51-54].
It is noted that the head-leading impacts into unprotected posts results match reasonably well with PMHS tests. For example, the tests in [51-54] dropped inverted PMHS head-first onto a rigid surface from heights of 1m and 1.5m, resulting in impact velocities of 4.4m/s (15.9km/h) and 5.4m/s (19.4km/h), respectively. In the tests at 19.4km/h the PMHS frequently sustained cervical vertebral spinal fractures, while in the present results the head-leading post impacts at 20km/h predicted 2 or 3 cervical vertebral fractures (Table 12).
Table 11: Key to Tables 12 to 15
Table entry Meaning
No colour No damage/injury
Green colour Moderate injury
Orange colour Serious injury
Red colour Critical injury
spine Cervical spine C1-C7
fx No. of vertebral fractures
0 fx Vertebral damage, but no fractures
MTBI Mild traumatic brain injury
DAI Diffuse axonal injury
SBI Severe brain injury
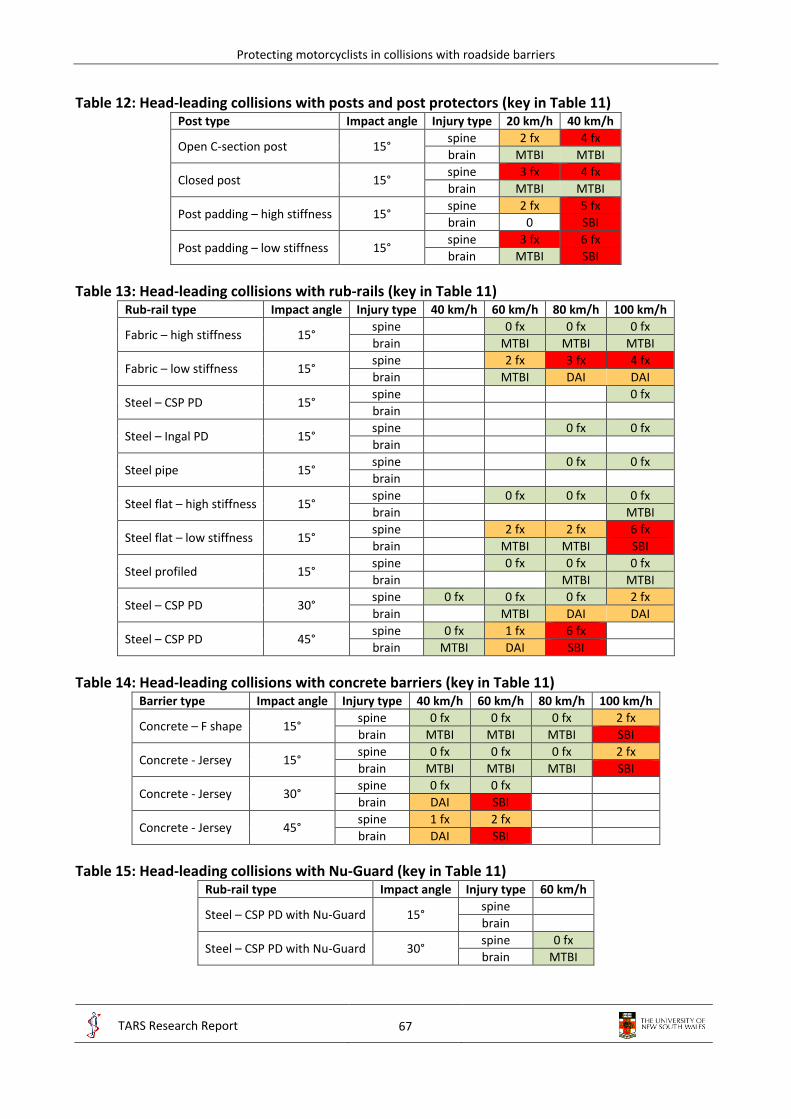
Protecting motorcyclists in collisions with roadside barriers
67
TARS Research Report
IRMRC
Table 12: Head-leading collisions with posts and post protectors (key in Table 11) Post type Impact angle Injury type 20 km/h 40 km/h
Open C-section post 15° spine 2 fx 4 fx
brain MTBI MTBI
Closed post 15° spine 3 fx 4 fx
brain MTBI MTBI
Post padding – high stiffness 15° spine 2 fx 5 fx
brain 0 SBI
Post padding – low stiffness 15° spine 3 fx 6 fx
brain MTBI SBI
Table 13: Head-leading collisions with rub-rails (key in Table 11) Rub-rail type Impact angle Injury type 40 km/h 60 km/h 80 km/h 100 km/h
Fabric – high stiffness 15° spine 0 fx 0 fx 0 fx
brain MTBI MTBI MTBI
Fabric – low stiffness 15° spine 2 fx 3 fx 4 fx
brain MTBI DAI DAI
Steel – CSP PD 15° spine 0 fx
brain
Steel – Ingal PD 15° spine 0 fx 0 fx
brain
Steel pipe 15° spine 0 fx 0 fx
brain
Steel flat – high stiffness 15° spine 0 fx 0 fx 0 fx
brain MTBI
Steel flat – low stiffness 15° spine 2 fx 2 fx 6 fx
brain MTBI MTBI SBI
Steel profiled 15° spine 0 fx 0 fx 0 fx
brain MTBI MTBI
Steel – CSP PD 30° spine 0 fx 0 fx 0 fx 2 fx
brain MTBI DAI DAI
Steel – CSP PD 45° spine 0 fx 1 fx 6 fx
brain MTBI DAI SBI
Table 14: Head-leading collisions with concrete barriers (key in Table 11) Barrier type Impact angle Injury type 40 km/h 60 km/h 80 km/h 100 km/h
Concrete – F shape 15° spine 0 fx 0 fx 0 fx 2 fx
brain MTBI MTBI MTBI SBI
Concrete - Jersey 15° spine 0 fx 0 fx 0 fx 2 fx
brain MTBI MTBI MTBI SBI
Concrete - Jersey 30° spine 0 fx 0 fx
brain DAI SBI
Concrete - Jersey 45° spine 1 fx 2 fx
brain DAI SBI
Table 15: Head-leading collisions with Nu-Guard (key in Table 11) Rub-rail type Impact angle Injury type 60 km/h
Steel – CSP PD with Nu-Guard 15° spine
brain
Steel – CSP PD with Nu-Guard 30° spine 0 fx
brain MTBI

Protecting motorcyclists in collisions with roadside barriers
68
TARS Research Report
IRMRC
3.4 Case study: Rimutaka Hill, Wellington
3.4.1 Motorcyclist-barrier collisions
There were 13 non-fatal motorcyclist-barrier casualty collisions on the Rimutaka Hill roadway section during the 12.5 year study period, and all involved impacts with steel W-beam barriers. These average to approximately one motorcyclist-barrier casualty collision per kilometre for the study period considered. Alternatively, approximately one motorcyclist-barrier casualty collision per annum for the roadway section considered. Of these, 5 collisions resulted in serious injury and 8 involved minor injury. These collisions are identified on a map of the roadway in Figure 50.
3.4.2 Potential rub-rail locations
Potential rub-rail locations were established by inspection of topographic maps and with Google Street view. All street view images were from October 2013. Locations were identified where steel W-beam barriers were present on the outside of curves. A total of 15 potential barrier sections were identified where rub-rails might be installed, as shown in Figure 51. Snapshots of the entry to each site from the Google Street views are also shown in Figure 51. These potential sites total approximately 4250m in length, in sections that extend between 100m and 1200m in length.
3.4.3 Cost-benefit analysis
In order to perform an approximate cost-benefit analysis, the crash costs derived from the linked personal injury insurance claims and police-reported road crash records in NSW, Australia, are summarised in Table 16 [50]. Since CAS identifies only two injury severity levels (minor and serious), these data were averaged into two categories as shown in Table 16.
Several assumptions must be made to approximate the cost savings afforded by injury reductions resulting from the installation of rub-rails. First, not all barrier collisions would involve the motorcyclist sliding into the barrier (separated from the motorcycle), where some collisions would have been in the upright posture (seated on the motorcycle). Rub-rails might not provide substantial injury reductions for upright collisions. Based on the study of Australian and New Zealand fatal motorcyclist-barrier collisions [7-14] and Figure 24c, it may be assumed that approximately one half of collisions will be in the sliding posture. Second, the reduction in injury severity for sliding collisions must be estimated. Based on Figures 47a and 48 and Table 13, it may be assumed that collisions with rub-rail systems will not generally result in serious injuries, which was found in the parametric study for most practical impact angles and speeds. It may therefore be assumed that serious injury crashes that occurred on unprotected W-beam barriers would not have been serious had a rub-rail been present (i.e. minor injuries). It is not clear from the parametric study whether this would also be true for minor injuries, thus it is not assumed that minor injuries in a W-beam collision would be reduced to no injury with a rub-rail.
With these assumptions, a cost-benefit analysis was performed assuming a life cycle of 25 years for the steel rub-rail. Based on the 13 crashes between 2001 – 2013 (12.5 year period), it is assumed that 26 motorcyclist-barrier casualty collisions would occur over 25 years, including 10 serious injury and 16 minor injury crashes. Assuming only one half of these is in the sliding position, the cost of sliding barrier crashes with unprotected W-beam barriers would be

Protecting motorcyclists in collisions with roadside barriers
69
TARS Research Report
IRMRC
$1,525,500 (Equation 4), while that for barriers with rub-rails would be $500,000 (Equation 5). This represents a cost saving of $1,005,500.
The cost of installing the rub-rails is estimated to be $50 per metre. This includes a product cost of $35 – 40 per metre (provided by the supplier), and an installation cost of $10 – 15 per metre [23]. Maintenance costs would include the replacement of lengths of rub-rails impacted by motorcyclists and vehicles. Assuming (arbitrarily) 5 impacts per year requiring 3 bays replacement each, the additional length for maintenance is assumed to be 750m. The total cost for the installation is therefore $250,000 (Equation 6).
Injury costs unprotected = 0.5 x [(16 x 40,000) + (10 x 241,100)] = $1,525,500 (4)
Injury costs with rub-rails = 0.5 x [(16 x 40,000) + (10 x 40,000)] = $500,000 (5)
Cost of rub-rail and maintenance = (4250 + 750) x 50 = $250,000 (6)
Cost-benefit ratio = (1,525,500 – 500,000) / 250,000 = 4.02 (7)
The cost-benefit ratio is approximately 4 (Equation 7). In general terms the cost of installing and maintaining the rub-rails was around one quarter million dollars, while injury savings of around one million dollars would be afforded by reducing 5 serious injury crashes to minor injury crashes. Clearly this is an approximate analysis due to many uncertainties. However, it seems reasonable to assume that rub-rail systems are cost effective on this particular motorcycling route with the highest density of motorcyclist-barrier collisions in New Zealand. Careful consideration of crash densities would be required to extrapolate these results to other roadway locations.
Table 16: Mean injury costs of motorcyclist-barrier collisions in NSW, Australia [50]
MAIS No. of motorcyclists Mean injury cost ($) Mean injury cost ($)
1 5 6,700 Minor 40,000
2 11 55,100 → 3 17 218,900
Serious 241,100 5 1 619,400
MAIS = maximum AIS injury severity Minor and serious similar to CAS terminology

Protecting motorcyclists in collisions with roadside barriers
70
TARS Research Report
IRMRC
Figure 50: Map of Rimutaka Hill motorcycle collisions with steel W-beam barriers, 2001 - 2013
2 c
rash
es
2 c
rash
es
1 c
rash
1 c
rash
1
cra
sh
1 c
rash
1 c
rash
1
cra
sh
1 c
rash
1 c
rash
1 c
rash

Protecting motorcyclists in collisions with roadside barriers
71
TARS Research Report
IRMRC
Figure 51: Map of Rimutaka Hill potential rub-rail locations
10
0m
10
0m
60
0m
50
0m
30
0m
12
00
m
15
0m
15
0m
15
0m
20
0m
15
0m
15
0m
10
0m
15
0m
25
0m
1
1
2
2
3
3
4
4
5
5
6
6
7
7
8
8
9
10
10
9
11
11
12
12
13
13
14
14
15
15

Protecting motorcyclists in collisions with roadside barriers
72
TARS Research Report
IRMRC
3.5 AS/NZ standards and roadside design guides
3.5.1 Regulatory issues
There are several regulatory issues relevant to the installation of rub-rail systems that need to be considered. In Australia and New Zealand, roadside barriers need to pass the vehicle testing requirements of the AS/NZS Barrier Standard (AS/NZS 3845) (either current or the revision [19, 20]) in order to be accepted for installation on public roadways. The European commercial rub-rail systems installed on steel W-beam barriers have been tested with passenger vehicles albeit to European [17, 18] test protocols and shown to provide satisfactory performance (Appendix A). These tests and experiences in Europe have provided some engineering evidence that rub-rail systems are suitable for installation with steel W-beam barriers in Europe. Several road authorities in Australia have deemed this engineering evidence sufficient to install some rub-rail systems (New South Wales, Victoria, Queensland and South Australia [23]).
It should be noted that the European tests were performed on steel W-beam systems and with European vehicles to EN 1317 test protocols [17]. However, the barriers were not exactly the same as the public domain G4 W-beam barrier typically used in Australia (including the post type and blockout), thus these tests cannot be used to provide compliance with the revised AS/NZS 3845.1: 2014 Road Safety Barrier Systems and Devices Standard [19] based on MASH test protocols. Tests of several types of rub-rail systems with G4 W-beam, with both passenger vehicles and ATDs, are currently ongoing at the Centre for Road Safety, Transport for NSW, albeit for sedan vehicles. It is not clear whether the G4 W-beam with the rub rails have also been tested for both the small and large vehicles such as SUV/ 4WD according to MASH [22] test protocols. The tests will provide some information concerning the G4 W-beam with a rub-rail attached that will be useful to regulators.
In New Zealand, the public domain W-beam barrier has timber posts and blockouts, while the proprietary Nu-Guard W-beam barrier system consists of trapezoidal steel posts and no blockout. Since these barriers are slightly different to those in Europe and Australia, previous tests of European and Australian barriers with rub-rails impacted by passenger vehicles may not necessarily provide compliance with the revised AS/NZS 3845.1: 2014 Road Safety Barrier Systems and Devices Standard [19]. These tests may need to be performed on New Zealand products in order to provide explicit compliance with the revised Standard. However, as in Australia, ultimately the responsibility lies with the road authorities, and the previous crash tests of very similar systems with passenger vehicles in accordance with EN 1317 [17] might be considered sufficient engineering evidence by the authorities that rub-rails do not provide detrimental performance for other vehicles, thereby allowing the installation of some product.
3.5.2 Motorcyclist-barrier crash testing
The following issues were identified when considering the results of the simulations of barrier collisions with ATDs;
the lateral orientation would require the use of a different ATDs to the head-leading test;
the frontal orientation would be very difficult to maintain since the ATD is on its side;
either of the above thorax-leading orientations would require an additional crash test.

Protecting motorcyclists in collisions with roadside barriers
73
TARS Research Report
IRMRC
If the thorax-leading orientation were to be tested, this would then require three sliding crash tests; 1) post-centred head-leading impact, 2) mid-span head-leading impact, and 3) thorax-leading impact. Due to the high cost of crash testing, these requirements were considered over-prescriptive and too cost-demanding. Comparison of the head- and thorax-leading results previously indicated that the head-leading orientation is the more severe orientation, since it leads to higher injury measures, particularly at impact angles greater than 15°. Therefore the two head-leading orientations prescribed in the current EN 1317-8 [18] are appropriate as recommended in the revised AS/NZ 3845.1: 2014 Road Safety Barrier Systems and Devices Standard [19].
As discussed in [24], the high incidence of thoracic injuries noted in both the Australian study [14] and the present New Zealand study (Figure 28) indicate the importance of adopting thoracic injury measures in these tests and were recommended during the revision of AS/NZS 3845:1999 [20]. As discussed in [24], it was recommended that appropriate thoracic injury measures used with the Hybrid III ATD of 60g acceleration and 63mm chest deformation (as defined in the frontal crash tests of FMVSS 208) be adopted. The limits that were recommended for the revision of AS/NZ 3845: 1999 Road Safety Barrier Systems Standard [20] for the two head-leading crash tests, and all limits used to assess the barriers in this study are summarised in Table 17.
The results of the Hybrid III ATD simulations according to the EN 1317-8 [18] specification are presented in Table 18 for the two steel PD rub-rails, and exemplar impact sequences are shown in Figure 52. According to the head and neck limits in EN 1317-8, and the thoracic injury limits above, these rub-rail systems would be expected to pass the crash tests. However, the revised AS/NZ 3845.1: 2014 Standard [19], has specified that in addition to the Head Injury Criterion (HIC) requirement in either of these procedures, an additional requirement that thorax compression criterion (ThCC) should not exceed 50 mm, the viscous criterion (V*C) for the thorax should not exceed 1.0 m/s and chest decelerations should not exceed 80 g over 3 ms. Using this criteria for the thorax the results listed in Table 18 the rub-rail system would still be expected to pass.
Table 17: Injury severity limits for ATD crash tests into rub-rail systems and simulation results Severity
level HIC36 Fx Fz
tension Fz
compression Mx
lateral My
extension My
flexion Thoracic
acceleration Thoracic
compression N N N Nm Nm Nm g mm
I 650 1.9 2.7 3.2 134 42 190 60 63 II 1000 3.1 3.3 4.0 134 57 190 60 63
Table 18: Injury severity measures for the steel public domain systems with ATDs
Rub-rail HIC36 Fx Fz
tension Fz
compression Mx
lateral My
extension My
flexion Thoracic
acceleration Thoracic
compression N N N Nm Nm Nm g mm
CSP @ post 468 0.3 1.8 4.0 90.3 30.0 49.7 40.7 17.9 CSP @ mid-span 409 0.4 1.3 3.9 89.1 36.3 40.2 41.2 17.7
Ingal @ post 514 0.3 2.2 4.0 98.3 35.2 56.8 41.1 21.9 Ingal @ mid-span 425 0.3 1.5 3.9 78.4 41.5 44.8 35.8 27.3
It is noted that the rub-rails passed the head and neck limits for severity level I, except for the axial neck compression which was right at the limit for level 2. The injury levels were very similar for

Protecting motorcyclists in collisions with roadside barriers
74
TARS Research Report
IRMRC
both of the public domain rub-rails considered. Comparison of the ATD simulations with the THUMS simulations indicates that the crash kinematics were very similar between the two (Figure 53). A sample of the raw data for the ATD injury metrics are shown in Appendix E.
Steel – CSP PD with Hybrid III: 30° impact @ 60km/h Post-centred impact
Steel – CSP PD with Hybrid III: 30° impact @ 60km/h Mid-span impact
30 ms
30 ms
40 ms
40 ms
60 ms
60 ms
80 ms
80 ms
100 ms
100 ms
Figure 52: Steel CSP PD with Hybrid III and with 30° impact at 60km/h
For upright seated tests, a testing procedure has been developed and described previously [55]. Currently there are no commercial devices for protecting motorcyclists when they slide along the top of a barrier, thus this crash test orientation was not assessed in the present study. However, in the case that such a product becomes available, it is recommended that it be tested in accordance with the procedures outlined in [55]. The revised AS/NZ 3845.1: 2014 Road Safety Barrier Systems and Devices Standard notes that: “In the future, testing requirements may be developed that establish the risk for riders who make contact with the top of the barrier while still being upright on
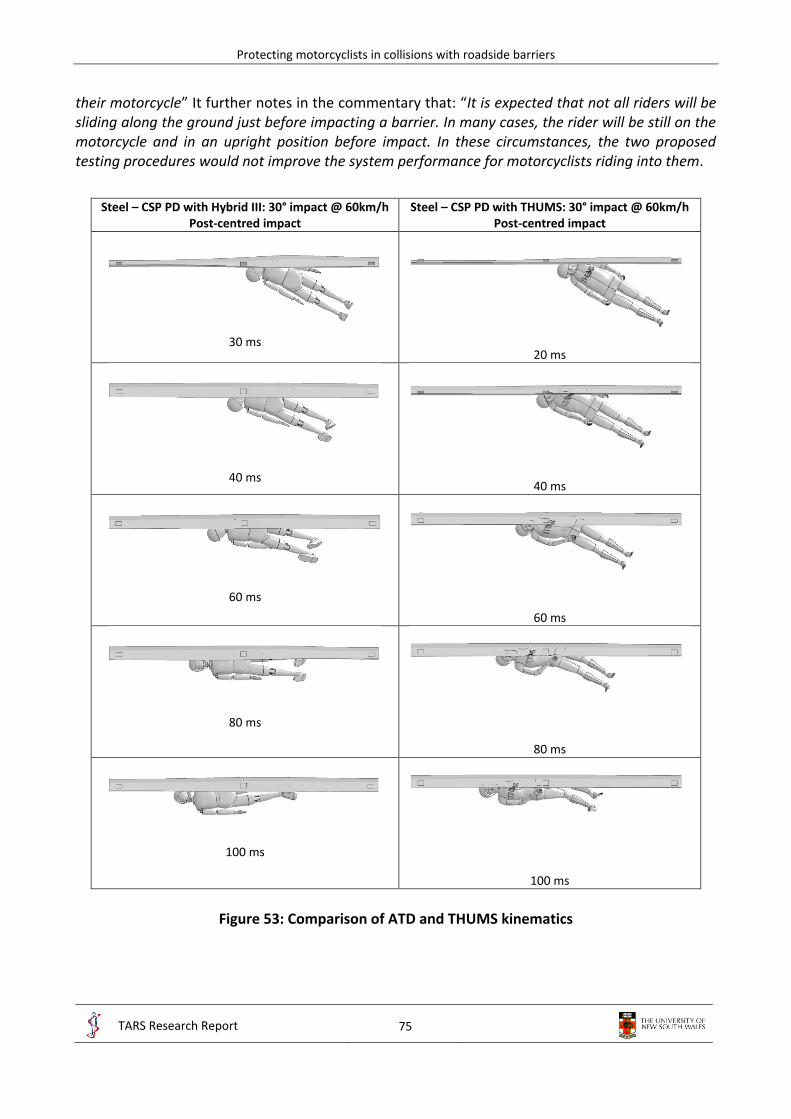
Protecting motorcyclists in collisions with roadside barriers
75
TARS Research Report
IRMRC
their motorcycle” It further notes in the commentary that: “It is expected that not all riders will be sliding along the ground just before impacting a barrier. In many cases, the rider will be still on the motorcycle and in an upright position before impact. In these circumstances, the two proposed testing procedures would not improve the system performance for motorcyclists riding into them.
Steel – CSP PD with Hybrid III: 30° impact @ 60km/h
Post-centred impact Steel – CSP PD with THUMS: 30° impact @ 60km/h
Post-centred impact
30 ms
20 ms
40 ms
40 ms
60 ms
60 ms
80 ms
80 ms
100 ms
100 ms
Figure 53: Comparison of ATD and THUMS kinematics

Protecting motorcyclists in collisions with roadside barriers
76
TARS Research Report
IRMRC
There is discussion on the applicability of the proposed testing to Australian conditions, particularly as approximately half of riders are sliding on the ground into the barrier and half impact the barrier upright. Of those that hit the barrier upright, half slide along the top of the barrier. Research of relevant Australian Coronial files has also revealed that the majority of riders died from thorax injuries. The Crash Test Dummy in the European motorcycle into barrier impact standard also only required to measure the Head Injury Criterion and Neck injury Criterion of the dummy sliding into the barrier. It was decided to use an international testing procedure to be able to more quickly develop and promote the use of hardware that offers more protection for motorcyclists”. The standard refers to publications [14] and [24].
3.5.3 Revised AS/NZ 3845.1: 2014 Road Safety Barrier Systems and Devices Standard
The following observations are made regarding assessing the performance of roadside barriers for motorcycling safety:
1. The testing procedures, head-neck injury severity measures, and the injury criteria thresholds outlined in EN 1317-8 [18] that are now specified in the AS/NZ 3845.1: 2014 revision [19], that require head-leading crash tests using the adapted Hybrid III ATD sliding into the barrier, will most likely provide suitable protection for motorcyclist impacting barriers that pass this specification in New Zealand and Australia. This revised Standard will soon be released.
2. The thoracic injury severity measures requiring thorax compression criterion (ThCC) to not exceeding 50 mm, the thorax viscous criterion (V*C) to not exceed 1.0 m/s and chest decelerations to not exceed 80 g over 3 ms, will likely provide suitable protection for motorcyclist impacting barriers that pass this specification in New Zealand and Australia
3. The additional upright seated test, according to the procedures outlined in [55] and discussed in the AS/NZ 3845.1: 2014 revision [19], needs to be investigated in similar manner as detailed in this Stage 4 report, and then considered for adoption into a future update of the revised Standard by the Australian/New Zealand CE 33 Road Safety Barriers Systems and Devices Standard Committee.
3.5.4 Recommendations for the Australian Roadside Design Guide
The following text is recommended for informative purposes in Section 6.5.1:
Motorcyclist-friendly road safety barrier systems: Several different rub-rail designs have been crash tested with ATDs and simulated with computer models of the human body. These designs have been assessed with steel W-beam barriers, however the posts and blockouts have varied. Since the posts of such barriers undergo negligible deformation when impacted by a motorcyclist, all accepted W-beam barrier systems are likely to provide nearly rigid resistance to motorcyclist sliding impact, therefore particular rub-rail systems are expected to perform similarly on all accepted W-beam barriers. Crash tests with ATDs have indicated that several different rub-rail designs are unlikely to cause serious injury to motorcyclists when impacted at 30° and 60km/h. Computer simulations with human body models have indicated that a wide variety of rub-rail designs are unlikely to cause serious injury to motorcyclists when impacted at 15° to 30° and up to 100km/h. These studies provide the engineering evidence for the substantial injury reduction

Protecting motorcyclists in collisions with roadside barriers
77
TARS Research Report
IRMRC
potential of rub-rail systems in motorcycle black spot areas. However, additional crash tests might provide further evidence for particular rub-rail systems and W-beam barrier types. This recommendation is made on the condition that the rub-rail W-beam combination also satisfies the US MASH test protocols so that occupants in other vehicle types are also protected. Retrofitting rub-rails to existing W-beam barriers should not be at the expense of reducing the crashworthiness of the system for other road users, e.g. car, truck and bus occupants.
Approximate cost-benefit procedures for rub-rail installations may be carried out as outlined in [this report]. The number of serious injury motorcyclist-barrier collisions for a roadway section should be estimated from crash records. The benefit of the installation may be estimated by assuming serious injury collisions costing $240,000 per crash, are reduced to minor injury collisions costing $40,000 per crash. The cost may be estimated from the length of the installation (with an additional allowance for maintenance), where an indicative cost for steel rub-rails is $50/m.
Currently, other types of barriers and motorcyclist protection systems such as post padding have been shown to provide less protection to motorcyclists than W-beam fitted with rub-rails. Concrete barriers eliminate post impacts and redirect the motorcyclist, however they are substantially more rigid than W-beam barriers with rub-rails, thus provide higher injury potential (particularly at high impact angles and speeds). Where concrete barriers have been installed instead of flexible barrier systems because of insufficient working width, the speed of motorcyclists should be limited to 80 km/h.
Currently, wire-rope barriers consist of discrete posts and thus expose motorcyclists to potentially injurious post impacts albeit the frequency of such impacts is very small compared to W-beam barriers. However, wire-rope barriers have been found to provide superior crashworthiness performance for vehicle into barrier (car, truck and busses) crashes, which represent the vast majority of road crashes, compared to any other barrier system. Road trauma (including motorcycle crashes) has dropped significantly on New Zealand and Australian roads as a result of their installation. Moreover, motorcyclist collisions with roadside barriers are relatively rare events in Australia and New Zealand. Typically motorcyclist barrier fatalities constitute around 4% to 6% of all motorcycle fatalities and typically around 0.01% of all road fatalities. Wire-rope barrier impacts are even rarer events and constitute around 4% of motorcycle barrier casualty crashes (compared to 77% for W-beam impacts) and 17% of fatalities (compared to 61% for W-beam impacts), which in turn is 0.6% of all motorcycle fatalities and 0.04% of all motorcycle casualty crashes and around 0.06% and 0.002% in terms of all of New Zealand’s road fatalities and casualties respectively. Injuries to motorcyclist involved in wire rope barrier crashes result from impacts into the barrier’s posts. Post paddings provide a measure of protection during post impacts, however only at very low speeds (below 40km/h). Further work exploring injury countermeasures for motorcycle into wire rope barrier impacts is presently on-going.
4. Limitations
The comparisons in Figure 32 indicated that in most cases the THUMS model predicted compression values that exceeded those one would expect in the human body at the level of thoracic injury sustained by the motorcyclist, based on the relationship between compression and injury derived from PMHS experiments. There are several reasons why such discrepancies may occur:

Protecting motorcyclists in collisions with roadside barriers
78
TARS Research Report
IRMRC
1. idealisation of the impact condition;
2. uncertainties in establishing the initial impact parameters;
3. physiological differences between the PMHS and the motorcyclists;
4. differences in the impact surfaces between the PMHS and the motorcyclists;
5. the absence of rib fractures in the FE model.
These issues are discussed further in the following paragraphs, and should be considered as limitations to the numerical modelling approach used in this study.
It is likely that in the motorcycle crashes the motorcyclist underwent substantial tumbling in addition to sliding along the surface of the roadway prior to impact with the barrier, thus the motorcyclist may not have impacted the barrier post in either the idealised orientation or position (i.e. position of the thorax relative to the post). Indeed the fact that the motorcyclist directly impacted the post was inferred from the on-scene police investigation reports, and was not known for certain (except in one case where there was a witness to the crash). The direct thorax impact assumed in the numerical model may over-represent the severity of the impact, which may have led to an over-prediction of the thoracic compression. Additionally, the post impact orientation (lateral or frontal) was assumed from the uni/bilaterality of the injuries, however lateral impacts to the thorax can result in bilateral injuries [38].
Similarly, there is substantial uncertainty in the initial impact conditions, where the pre-crash speed was a police-reconstructed estimate and the coefficient of sliding friction used was a mean value from a wide range of values reported in the literature. However, the impact angle and sliding distance were relatively well established from careful measurements of the markings on the roadway by on-scene police. The pre-crash speed may have been over-predicted by police and/or the sliding friction value may have under-predicted the real friction of the roadway, which may have led to an over-prediction of the severity of the impact and consequently the thoracic compression.
A further limitation of the study is that there were substantial physiological differences between the PMHS and the motorcyclists. The PMHS ages ranged from 19 to 81 years with a mean of 59 years, and 79% were male. The motorcyclist ages ranged from 21 to 70 years with a mean of 39 years, and all were male. It is possible that the THUMS average size male model predicted a relatively accurate magnitude of thoracic compression, and that the motorcyclists did indeed undergo such a compression. However, for physiological reasons such compression magnitudes did not result in as severe injuries in the motorcyclists as those that occurred in PMHS. It is well known that thoracic injury severity, particularly that resulting from rib fractures and concomitant organ injuries, is closely associated with age [42]. For example at a normalised frontal thoracic deflection of around 0.3, the probability of sustaining more than 6 rib fractures is around 10% for a 30 year old while around 40% for a 70 year old. It should also be noted that the THUMS model did not replicate rib fractures, thus at large rib deflections it may become unrealistically stiff. Additionally, the impact surfaces were different between the motorcyclists and the PMHS, where the former consisted of a steel post or W-beam, while the latter was a comparatively large flat surface area of diameter 150mm. For the lateral-post orientation, the upper arm directly contacted the leading edge of the post which distributed the impact load to the thorax.
The limitations of the head-leading THUMS models should be noted, including the fact that sufficient real-world cases for validating the models could not be established, and that the injury

Protecting motorcyclists in collisions with roadside barriers
79
TARS Research Report
IRMRC
measures are not well defined. While the plastic strain to fracture of bone and the CSDM measure of strain in the brain have been suggested and used by some authors in the literature [40-46], these IARVs should be considered approximate measures and should be interpreted as indicating a potential for injury only. The application of the plastic strain to fracture of the bones in the skull and vertebrae has not been sufficiently validated in the literature. While this limits the applicability of the models to accurately identify skull, vertebrae and brain injuries, the injury measures themselves are considered reliable and are useful for the comparative studies in this project.
The limitations of the barrier models should also be noted, and in particular these models have not be validated against tests. The models with THUMS have not been validated since no test data are available for PMHS impacting such barriers. The models with ATDs have not been validated since no test data are available for the barriers modelled in this study. The W-beam barriers underwent negligible lateral deformation when impacted with either the THUMS or ATD models, due to the low mass of a human compared with that of a vehicle (for which the barriers are designed to deflect laterally). Video footage of ATD tests into steel W-beam barriers has shown small lateral deformations of the barrier, however not as a result of post bending. These small deflections are a result of lateral compression of the soil in which the posts are embedded, i.e. local shear deformation of the soil. The computer simulations did not model this shear deformation, and consequently the W-beam barrier posts performed in a slightly more rigid manner than actual posts would be expected to perform. Since it has been shown in this study that flexibility in the barrier system generally reduces injury potential, it may be assumed that the nearly fully rigid barrier post models are a worst case for injury potential.
Similarly, the crash orientations considered in the present study should be considered worst case impact scenarios for injury potential. Impact orientations assumed direct impact with the thorax or head to assess thorax and head-neck injury, respectively, and such an impact would provide the maximum injury potential compared with the more random impact locations that would be expected in the field. Similarly, the location of the impact at the barrier post location may be considered a worst case impact, since this is the most rigid part of the barrier thus likely to provide the maximum injury potential. Notwithstanding the limitations associated with simulating the human body and barriers, it may be concluded that the simulations in the present study are reasonable representations of such collisions in the field. It is likely that the inferences drawn with regard to injury potential are conservative (i.e. over-estimate the injury potential), since the impact orientations and barrier responses are likely to be worst case scenarios of those that occur in the field.
It should also be noted that the helmet model used in this study has not been explicitly validated. While validated helmet material properties were used from [39], the present helmet geometry was developed from an Australian helmet thus could not be compared to the tests in [39], and the Australian helmet modelled was not tested for validation purposes.
Finally it needs to be pointed out that the statistical study did not include any crashes where no injury and property damage only or no damage crashes occurred with any barrier type, i.e. any exposure data was not available in order to assess statistically the relative harm of one barrier type compared to another.

Protecting motorcyclists in collisions with roadside barriers
80
TARS Research Report
IRMRC
5. Conclusions
5.1 New Zealand motorcyclist-barrier crash study, 2001-2013
The analyses of crash data indicated that in the 12.5 year study period, a total of 20 fatal and 166 non-fatal motorcyclist-barrier casualty collisions occurred. On average, this represents around 13 non-fatal and between 1 and 2 fatal crashes per year. Over the same period, the average annual numbers of non-fatal and fatal motorcycle crashes in all crash modes were 1,051 and 39, thus roadside barrier motorcycling trauma represents only a few percent of the total motorcycle trauma burden and only fractions of a percent of the total road safety trauma burden in New Zealand. Nevertheless, barriers present a serious injury risk to motorcyclists, indicating a need to improve roadside barrier design for motorcyclists. This was particularly apparent when considering barrier fatalities, where nearly as many motorcyclists (20) as passenger vehicle occupants (23) were killed in single-vehicle barrier collisions during the study period, despite the fact that motorcyclists represent only 3% of the vehicle fleet. One half of motorcyclist-barrier collision casualties sustained serious or fatal injuries, compared with only 13% for passenger vehicle occupants. This results from the fact that barriers are very effective in preventing serious injuries for passenger vehicle occupants, for which they are specifically designed and crash tested, while motorcyclist safety has not been considered in the design of almost all barrier systems (excluding recently developed rub-rail W-beam systems).
The non-fatal and fatal motorcyclist-barrier collision crash data indicate that these types of collisions typically occur amongst male riders on State Highway 100km/h speed zone roadways, on curves, in the daytime in fine conditions and predominantly in mountainous or coastline motorcycle black spot areas. The majority of collisions occurred with steel W-beam barriers, including 78% of non-fatal collisions and 61% of fatal collisions (77% of all casualty collisions). The fatal cases indicated that the sliding and upright modes were evenly represented and that serious thoracic injuries were sustained most frequently, followed by serious head injuries. Risky riding behaviours such as alcohol or drug use and excessive speed were identified in 33% of non-fatal crashes, however were more pronounced in the fatal crashes where 50% of collisions were identified as involving one or more of these behaviours. These results are in accordance with those reported previously for 78 fatal motorcyclist-barrier collisions in Australia and New Zealand between 2001 and 2006 in the Stage 1 to 3 reports [7-14]. Since the majority of these previous cases were Australian, comparison with the present New Zealand results indicates that the motorcyclist-barrier collision characteristics in Australia and New Zealand are closely aligned.
The statistical analyses of motorcycle collisions with various types of fixed hazards indicated that posts and poles are significantly more hazardous to motorcyclists than barriers, and are more likely to result in the motorcyclist sustaining serious or fatal injuries. These results support the use of roadside barriers in front of such objects, for example utility poles and roadway signs and support poles, in order to improve the safety of the roadside for motorcyclists. Higher speed zones, alcohol use and excessive speed were all significantly more likely to result in serious or fatal injuries. This indicates that efforts to reduce risky riding behaviours amongst motorcyclists should continue and will return much greater gains in terms of reducing motorcycle trauma compared to any modifications to existing barrier systems. Nevertheless, there appears to be a reasonable cost benefit return in terms of retrofitting run-rails in motorcycle black spot areas.

Protecting motorcyclists in collisions with roadside barriers
81
TARS Research Report
IRMRC
5.2 Development of motorcyclist-barrier computer simulation models
The biomechanical results of the THUMS impact with the W-beam barrier post in the thorax-leading orientations were generally in agreement with the field-observed collisions, where the majority of the motorcyclist kinetic energy was dissipated during the impact and the motorcyclist resting position was against or adjacent to the post.
The crash mechanics of the THUMS impact with the W-beam barrier post in the head-leading orientation was consistent with tests of inverted PMHS dropped onto rigid surfaces, where the head stops against the surface and torso augmentation results in the spine being compressed into the base of the skull. While specific crash cases were not available to validate these models, the biomechanical results using various injury measures were consistent with inverted PMHS tests, where at impact speeds of around 20km/h there is substantial potential for cervical spine injury, particularly in the upper cervical vertebrae (C1 to C3). At these speeds the potential for skull fracture and brain injury was not as pronounced, which is also consistent with PMHS tests. Additionally, the THUMS head was protected by a helmet, which likely reduced the potential for skull and brain injury. The damage to the helmet was consistent with damage noted in a real-world head-leading collision into a barrier post.
Notwithstanding the rather substantial uncertainties associated with human body modelling of motorcyclist crashes, the numerical models of motorcyclist collisions with roadside barriers may be considered reasonable representations of an average size male motorcyclist subjected to such impacts.
5.3 Protecting motorcyclists in collisions with steel W-beam barriers
A wide variety of rub-rail designs were assessed with parametric studies of thorax- and head-leading sliding orientations, impact angles and speeds. These simulations predict that rub-rails installed on W-beam barriers will not result in serious thoracic injuries to motorcyclists, for all impact angles and speeds considered. This was also true for head and neck injuries at lower impact angles (15°) and all speeds, provided the connections to the barrier provided adequate stiffness. Serious and critical injuries were predicted at higher impact angles, which indicated that the head-leading orientation generally provided a higher injury potential than the thorax-leading orientation. In all cases the rub-rails provided substantially lower injury potential than unprotected W-beam barrier collisions, where the motorcyclist impacts the barrier posts. In such situations critical injuries were predicted at impact speeds as low as 20km/h.
Other continuous barriers, i.e. concrete barriers, were predicted to provide substantially lower injury potential than W-beam barrier posts. However, flexible rub-rail systems provided reduced injury potential then the fully rigid concrete barriers. These results indicate that continuous barrier systems (rub-rails and concrete barriers) are much safer for motorcyclists than W-beam post-and-rail systems, since they do not contain exposed posts, and consequently the motorcyclists’ kinetic impact energy is redirected rather than expended on a post. This was especially evident at higher impact angles and speeds. The lateral flexibility of rub-rail systems reduces the impact severity while successfully redirecting the motorcyclist.
Wire-rope post barrier systems were not modelled albeit it is expected that the exposed posts would similarly be injurious for motorcyclists as has been evidenced in real world data. However, care needs to be taken in regards to recommending other barrier types (concrete and W-beam) in

Protecting motorcyclists in collisions with roadside barriers
82
TARS Research Report
IRMRC
place of wire-rope barriers because wire-rope barriers have been found to be highly effective (with 70% to 90% drop in all casualties) wherever they have been installed, including for motorcyclists, and when compared to other barrier types.
Padded post protectors were predicted to provide limited protection for motorcyclists, since the paddings do not redirect the motorcyclist and the impact energy is expended on the post. These results indicate that flexible rub-rail systems attached to steel W-beam barriers provide the best protection for motorcyclists in sliding collisions with roadside barriers.
5.4 Case study: Rimutaka Hill, Wellington
Rimutaka Hill near Wellington was identified as the roadway section with the highest density of motorcyclist-barrier collisions in New Zealand. This 14.6km roadway section had an average of one casualty collision per annum over the study period. Topographic maps and street view images were used to identify corners that would be appropriate for protecting the W-beam barriers with steel rub-rails, and a total length of 4.25km of rub-rail was estimated to be required to protect the 14.6km roadway section, at a cost of approximately $212,000. Based on approximations of crash costs, a cost-benefit analysis indicated that such a rub-rail installation would likely be cost effective on this particular motorcycling route. Careful consideration of crash densities would be required to extrapolate these results to other roadway locations.
5.5 AS/NZ 3845.1: 2014 Standard and roadside design guides
The evidence in this Stage 4 report supports the amendments made in the revised Australian/New Zealand Barrier Standard (AS/NZS 3845.1: 2014 Road Safety Barriers Systems and Devices [19]) with regards to requiring crash testing of devices intended to improve motorcyclist into barrier safety. Crash tests using a Hybrid III ATD sliding prone in the head-leading orientation, in accordance with the European specification EN 1317-8 [18], is the most appropriate configuration in terms of assessing the barrier’s motorcycle crashworthiness for the sliding related injury mechanism. Since the thorax-leading orientation was generally less injurious than the head-leading orientation, a specific thorax-leading test would be redundant and is thus not supported. However, due to the substantial frequency of thorax injuries in real world crash data, the thoracic injury measures recommended in the revised AS/NZS 3845.1: 2014 [19], is supported. An upright test where the motorcyclist collides with the barrier while seated on the motorcycle is recommended.
Informative advice for the Australian Roadside Design Guide has been proposed. This advice is intended to inform road designers of the potential of rub-rail and other systems intended to protect motorcyclists and other road users in barrier collisions. Advice pertaining to the costing of such measures for motorcycle run-rail installation is additionally provided.
In conclusion, the present study provides the engineering evidence for the substantial protective effect of rub-rail systems for motorcyclists in collisions with roadside barriers. Rub-rails installed on steel W-beam barriers improve the safety of the roadside for motorcyclists, and can provide cost effective solutions in areas with a high density of motorcyclist-barrier collisions. Several observations have been made that support the recent revision of the Australian/New Zealand AS 3845.1: 2014 Road Safety Barrier Systems and Devices Standard and design advice available to road authorities regarding motorcyclist impact testing of barriers, in order to justify the installation of rub-rail systems in Australia and New Zealand.

Protecting motorcyclists in collisions with roadside barriers
83
TARS Research Report
IRMRC
6. References
1. DITRDLG (2008). Fatal and serious road crashes involving motorcyclists. Research and Analysis Report, Road Safety Monograph 20. Department of Infrastructure, Transport, Regional Development and Local Government, Australia.
2. NZ Transport Agency (2010). Safer journeys for motorcycling on New Zealand roads.
3. ATC (2011). Australian Transport Council National Road Safety Strategy 2011-2020. http://www.atcouncil.gov.au/documents/files/NRSS_2011_2020_15Aug11.pdf
4. Mooren, L., Grzebieta, R., Job, S., 2011 Safe System – Comparisons of this Approach in Australia, Australasian College of Road Safety Conference – Safe System: Making it happen, Melbourne.
5. NZ Ministry of Transport (2010). Safer Journeys: New Zealand’s Road Safety Strategy 2010 – 2020.
6. OECD, 2008. Towards Zero: Ambitious road safety targets and the safe system approach, International Transport Forum, ISBN 978-92-821-0195-7.
7. Grzebieta R.H., Jama H., McIntosh A., Friswell R., Favand J., Attard M., Smith R. (2009). Overview of Motorcycle Crash Fatalities Involving Road Safety Barriers, Journal of the Australasian College of Road Safety, November, Vol. 20 No. 4, pp. 42 – 52.
8. Jama, H.H., Grzebieta, R.H., Friswell, R., McIntosh, A.S. (2010). Characteristics of fatal motorcycle crashes into roadside safety barriers in Australia and New Zealand. Accident Analysis & Prevention, 43 (3), 652–660.
9. Grzebieta R.H., Jama H.H., Bambach M.R., Friswell R. and Favand J. (2010). Motorcycle crashes into roadside barriers. Stage 1 – crash characteristics and causal factors. TARS Research Report, UNSW. (http://www.tars.unsw.edu.au/publications )
10. Bambach M.R, Grzebieta R. and McIntosh A.S. (2010). Motorcycle crashes into roadside barriers. Stage 2 – crash mechanics and injury causation. TARS Research Report, UNSW. (http://www.tars.unsw.edu.au/publications )
11. Bambach M.R, Grzebieta R., Olivier J. and McIntosh A.S. (2010). Motorcycle crashes into roadside barriers. Stage 3 – survivability analysis. TARS Research Report, UNSW. (http://www.tars.unsw.edu.au/publications )
12. Bambach, M.R., Grzebieta, R.H. and McIntosh, A.S. (2010). Crash characteristics of motorcyclists impacting road side barriers. Australasian Road Safety Research, Policing and Education Conference, Canberra, Australian Capital Territory.
13. Grzebieta, R.H., Bambach, M.R., McIntosh, A.S., Friswell, R. and Jama, H.H. (2011). Fatal motorcycle into road safety barrier crashes. Australasian Road Safety Research, Policing and Education Conference, Perth, Australia.
14. Bambach M.R, Grzebieta R. and McIntosh A.S. (2012). Injury typology in fatal motorcycle collisions with roadside barriers in Australia and New Zealand. Accident Analysis & Prevention, 49:253-260.
15. Bambach M.R, Grzebieta R., Olivier J. and McIntosh A.S. (2011). Fatality risk for motorcyclists in fixed object collisions. Journal of Transportation Safety and Security, 3:1-14

Protecting motorcyclists in collisions with roadside barriers
84
TARS Research Report
IRMRC
16. Grzebieta R.H., Zou R., Jiang T., and Carey A., Roadside Hazard and Barrier Crashworthiness Issues Confronting Vehicle and Barrier Manufactures and Government Regulators, Proc. 19th International Technical Conference on the Enhanced Safety of Vehicles, Washington, USA, June 2005.
17. EN1317 Road Restraint Systems (Parts 1 to 8), CEN European Committee for Standardisation (CEN), Brussels.
18. EN1317-8 Part 8, Motorcycle road restraint systems which reduce the impact severity of motorcyclist collisions with safety barriers, CEN European Committee for Standardisation (CEN), Brussels.
19. Standards Australia (2014). AS/NZS 3845.1: 2014 Road Safety Barrier Systems and Devices, Part 1, (in print revision of AS/NZS 3845: 1999), Sydney, Australia.
20. Standards Australia (1999). AS/NZS 3845: 1999 Road Safety Barrier Systems , Sydney, Australia.
21. The National Cooperative Highway Research Program (NCHRP) Report 350, ‘Recommended Procedures for the Safety Performance Evaluation of Highway Features’ (NCHRP 350), Ross, Sicking, Zimmer and Michie, Washington DC, 1993.
22. American Association of State Highway and Transportation Officials (AASHTO) Manual for Assessing Safety Hardware (MASH), Washington DC, 2009.
23. Anderson, C., Dua, A. & Sapkota, J. (2012). Motorcycle safety barrier trials in South Australia: Case study – Adelaide Hills. Australasian College of Road Safety Conference, Sydney 2012.
24. Grzebieta, R.H., Bambach, M.R. and McIntosh, A.S. (2013). Motorcycle impacts into roadside barriers: Is the European crash test standard comprehensive enough?. Transportation Research Record, 2377:84-91.
25. Austroads, 2010. Guide to Road Design Part 6: Roadside Design, Safety and Barriers, Austroads Ltd, Sydney, Australia.
26. Bambach M.R., Mitchell R. and Grzebieta R. (2013). The protective effect of roadside barriers for motorcyclists. Traffic Injury Prevention, 14(7):756–765.
27. AAAM (2005). Abbreviated Injury Scale (AIS). Association for the Advancement of Automotive Medicine, 2005.
28. Bursac, Z, Gauss, CH, Williams, DK and Hosmer, DW. (2008). Purposeful selection of variables in logistic regression. Source Code for Biology and Medicine 3:17.
29. Tomoyuki M., Junji H., Development of a Finite Element Model of the Total Human Model for Safety (THUMS) and Application to Car-Pedestrian Impacts. In Proceeding of the International Technical Conference on the Enhanced Safety of Vehicles (ESV), Paper Number 13- 494, Ontario, Canada, May 31- June 4, 1998.
30. Hallquist, J.O., LS-DYNA - Keyword User's Manual (revision: 3374). Livermore Software Technology Corporation (LSTC), Livermore, CA, 2013.
31. Bambach M and Grzebieta R.H., 2013. Reducing Motorcycle Trauma In The A.C.T., TARS Research Report, NRMA-ACT Road Safety Trust,
http://www.roadsafetytrust.org.au/c/rtt?a=da&did=1004593

Protecting motorcyclists in collisions with roadside barriers
85
TARS Research Report
IRMRC
32. Fricke, L.B. (1990). Traffic Accident Reconstruction, Northwestern University Traffic Institute, Traffic Accident Reconstruction, Volume 2.
33. Obenski, K.S., Hill, P.F., Shapiro, E.S., Debes, J.C. (2007). Motorcycle accident reconstruction and litigation, Fourth Edition. Lawyers and Judges Publishing Co. USA.
34. Searle, J.A., Searle, A. (1983). The Trajectories of Pedestrians, Motorcycles, Motorcyclists, etc., Following a Road Accident, SAE Paper No.831622.
35. Wood, D.P. (1991). Application of Pedestrian Impact Model to Determination of Impact Speed, SAE Paper 910814.
36. Kroell, C., Schneider, D. and Nahum, A. (1971). Impact Tolerance and Response of the Human Thorax. Proc. 15th Stapp Car Crash Conf., pp. 84-134, SAE Technical Paper 710851.
37. Kroell, C., Schneider, D. and Nahum, A. (1974). Impact Tolerance and Response of the Human Thorax II. Proc. 18th Stapp Car Crash Conf., pp. 383-457, SAE Technical Paper 741187.
38. Viano D.C., Lau I.V., Asbury C., King A.I. and Begman P. (1989). Biomechanics of the human chest, abdomen and pelvis in lateral impact. Accident Analysis and Prevention, 21(6):553-574.
39. Ghajari, M., Galvanetto, U., Iannucci, L., Willinger, R. (2011). Influence of the body on the response of the helmeted head during impact. International Journal of Crashworthiness 16 (3), 285–295.
40. Takhounts, E. G. (2003). On the Development of the SIMon Finite Element Head Model. Stapp Car Crash Journal 47, SAE2003-22-0008.
41. Takhounts, E.G., Hasija, V., Ridella, S.A., Rowson, S., Duma, S.M. (2011). Kinematics of Rotational Brain Injury Criterion (BRIC). 22nd ESV, 11-0263.
42. Watanabe R., Katsuhara T., Miyazaki H., Kitagawa Y., Yasuki T. (2012). Research of the Relationship of Pedestrian Injury to Collision Speed, Car-type, Impact Location and Pedestrian Sizes using Human FE model (THUMS Version 4). Stapp Car Crash Journal, Vol. 56 (October 2012), pp. 269-321.
43. Burstein, H., Reilly, T. (1976). Aging of Bone Tissue: Mechanical properties. The Journal of Bone and Surgery, 58(A): 82-86.
44. Kemper, A., McNally, C., Kennedy, E., Manoogian, S., Rath, A., Ng, T., Stitzel, S., Smith, E., Duma, S., Matsuoka, F. (2005). Material Properties of Human Rib Cortical Bone from Dynamic Tension Coupon Testing. Stapp Car Crash Journal 49: 199-230.
45. Mccalden, W., Mcgeough, A. (1993). Age-related changes in the tensile properties of cortical bone. The Journal of Bone and Joint Surgery, 75(A): 1193-1205.
46. Kimpara H. and Iwamoto M. (2012). Mild Traumatic Brain Injury Predictors Based on Angular Accelerations During Impacts. Annals of Biomedical Engineering, 40(1):114–126.
47. Iwamoto M, Kisanuki Y, Watanabe I, Furusu K, Miki K, Hasegawa J. (2002). Development of a Finite Element Model of the Total Human Model for Safety (THUMS) and Application to Injury Reconstruction. Proc. International Conference on the Biomechanics of Impacts, pp. 31–42.
Protecting motorcyclists in collisions with roadside barriers
86
TARS Research Report
IRMRC
48. Ghajari M, Peldschus S, Galvanetto U and Iannucci L. (2011). Evaluation of the effective mass of the body for helmet impacts. Int J Crashworthiness, 16(6):621-631.
49. NZTA M23A (2012). Specification for Road Safety Barrier Systems: Appendix A – Approved Road Safety Barrier Systems. NZTA (New Zealand Transport Agency).
50. Bambach, M.R., Mitchell R., Williamson A., Grzebieta R. (2013). Linkage rates and identification of factors associated with the probability of record linkage with MAA and LTCSA. Transport and Road Safety Research (TARS), Research Report, University of NSW.
51. Nusholtz, G.S., Melvin, J.W., Huelke, D.F., Alem, N.M., Blank, J.G. (1981). Response of the Cervical Spine to Superior-Inferior Head Impact. Proceedings of the 25th Stapp Car Crash Conference, paper 811005.
52. Nusholtz, G.S., Huelke, D.F., Lux, P., Alem, N.M., Montalvo, F. (1983). Cervical Spine Injury Mechanism. Proceedings of the 27th Stapp Car Crash Conference, paper 831616.
53. Nusholtz, G.S., Kaiker P.S. (1986). Kinematics of the human cadaver spine in response to superior-inferior loading of the head. University of Michigan, Transportation Research Institute, Biosciences division, UMTRI-86-31.
54. Yoganandan, N. A., Sances, A., Maiman, D.J., Myklebust, J.B., Pech, P., Larson, J. (1986). Experimental spinal injuries with vertical impact. Spine 1986; 11: 855-860.
55. Berg, F. A., P. Rucker, M. Gartner, J. Konig, R. Grzebieta, and R. Zou. (2005). Motorcycle Impacts into Roadside Barriers—Real-world Accident Studies, Crash Tests and Simulations Carried Out in Germany and Australia. Proc., 19th International Conference on the ESV, Washington, D.C.

Protecting motorcyclists in collisions with roadside barriers
87
TARS Research Report
IRMRC
7. Appendix A – European rub-rail systems
European rub-rail systems and their level of crash testing:
Product Manufacturer Australian/NZ supplier MPS Tested with ATDs Tested with vehicles
to EN1317
Acebal Acebal (Spain) Ingal Civil
Australia and New Zealand
SCCM AS-SM6.A AS-SM6.B
Yes Yes
HIASA HIASA (Spain) ACP (Australia)
CSP (New Zealand) SPM-IS4 Yes Yes
BASYC Cegasa (Spain) LB International Fabric MPS Yes Yes

Protecting motorcyclists in collisions with roadside barriers
88
TARS Research Report
IRMRC
8. Appendix B – Validations of THUMS
The following figures show comparisons of THUMS responses with PMHS testing for; a) thoracic frontal force [31], b) thoracic lateral force [31), c) head lateral force, d) inferior-superior neck force
c
d
0
1
2
3
4
5
0 10 20 30 40 50 60 70 80 90 100 110
Imp
act
forc
e (
kN)
Total thoracic deflection (mm)
THUMS
TEST corridor
a
0
1
2
3
4
5
0 20 40 60 80 100 120 140
Imp
act
forc
e (
kN)
Total thoracic deflection (mm)
THUMS
TEST corridor
b

Protecting motorcyclists in collisions with roadside barriers
89
TARS Research Report
IRMRC
9. Appendix C – Engineering drawings for public domain steel rub-rail systems
Steel CSP Public Domain (PD) rub-rail fixed to steel W-beam barrier:
Steel Ingal Public Domain (PD) rub-rail fixed to steel W-beam barrier:

Protecting motorcyclists in collisions with roadside barriers
90
TARS Research Report
IRMRC
10. Appendix D – Full results of the parametric studies
Concrete – F shape at 15° Concrete – Jersey at 15° Injury measure 40 km/h 60 km/h 80 km/h 100 km/h 40 km/h 60 km/h 80 km/h 100 km/h
C1 max. plastic strain 0.0021 0.0161 0.0126 0.0500 0.0021 0.0162 0.0125 0.0508 C2 max. plastic strain 0.0003 0.0062 0.0139 0.0355 0.0022 0.0061 0.0139 0.0351 C3 max. plastic strain 0.0006 0.0030 0.0096 0.0218 0.0003 0.0030 0.0096 0.0216 C4 max. plastic strain 0.0002 0.0020 0.0053 0.0131 0.0006 0.0020 0.0052 0.0132 C5 max. plastic strain 0.0002 0.0022 0.0067 0.0198 0.0002 0.0022 0.0067 0.0203 C6 max. plastic strain 0.0000 0.0016 0.0056 0.0178 0.0000 0.0016 0.0056 0.0185 C7 max. plastic strain 0.0000 0.0001 0.0016 0.0066 0.0000 0.0001 0.0016 0.0078 Cerebrum – CSDM10 (%) 51.5 79.2 93.1 99.5 51.5 79.2 93.0 99.4 Cerebellum – CSDM10 (%) 1.1 0.0 17.0 65.6 1.1 0.0 16.8 65.6 Stem – CSDM10 (%) 20.1 0.0 43.4 64.8 20.1 0.0 43.1 64.8 Cerebrum – CSDM15 (%) 5.5 25.5 50.8 81.9 5.5 25.5 50.5 81.7 Cerebellum – CSDM15 (%) 0.0 0.8 2.0 12.1 0.0 0.8 2.0 12.1 Stem – CSDM15 (%) 11.5 19.4 22.7 25.7 11.5 19.1 22.4 25.7 Cerebrum – CSDM30 (%) 0.0 0.2 0.8 5.9 0.0 0.2 0.8 5.9 Cerebellum – CSDM30 (%) 0.0 0.0 0.0 0.0 0.0 0.0 0.0 0.0 Stem – CSDM30 (%) 1.3 7.6 11.2 12.5 1.3 7.2 10.5 12.2
Max. plastic strain 0.0021 0.0161 0.0139 0.0500 0.0022 0.0162 0.0139 0.0508 Brain – CSDM10 (%) 41.3 62.6 77.6 92.3 41.3 62.6 77.5 92.3 Brain – CSDM15 (%) 4.6 20.7 40.9 67.5 4.6 20.7 40.7 67.3 Brain – CSDM30 (%) 0.0 0.3 0.9 4.9 0.0 0.3 0.8 4.9
Fabric – high stiffness at 15° Fabric – low stiffness at 15° Injury measure 40 km/h 60 km/h 80 km/h 100 km/h 40 km/h 60 km/h 80 km/h 100 km/h
C1 max. plastic strain 0.0000 0.0067 0.0019 0.0032 0.0000 0.0158 0.0353 0.0431 C2 max. plastic strain 0.0000 0.0009 0.0020 0.0032 0.0000 0.0478 0.0976 0.0943 C3 max. plastic strain 0.0000 0.0000 0.0022 0.0047 0.0000 0.0039 0.0114 0.0111 C4 max. plastic strain 0.0000 0.0009 0.0033 0.0072 0.0000 0.0853 0.1463 0.1454 C5 max. plastic strain 0.0000 0.0002 0.0021 0.0049 0.0000 0.0198 0.0525 0.0351 C6 max. plastic strain 0.0000 0.0020 0.0031 0.0059 0.0000 0.0157 0.0277 0.0229 C7 max. plastic strain 0.0000 0.0007 0.0000 0.0011 0.0000 0.0034 0.0065 0.0078 Cerebrum – CSDM10 (%) 0.1 51.6 62.0 94.2 0.0 74.2 94.9 89.3 Cerebellum – CSDM10 (%) 0.0 0.0 0.6 4.6 0.0 1.4 6.5 31.5 Stem – CSDM10 (%) 9.2 0.0 16.4 16.8 0.0 30.3 45.1 49.0 Cerebrum – CSDM15 (%) 0.0 8.7 9.9 50.8 0.0 23.1 69.7 40.4 Cerebellum – CSDM15 (%) 0.0 0.0 0.0 0.1 0.0 0.1 0.2 5.2 Stem – CSDM15 (%) 0.0 7.9 3.0 4.3 0.0 10.9 14.8 17.8 Cerebrum – CSDM30 (%) 0.0 0.0 0.0 1.0 0.0 0.4 5.6 1.8 Cerebellum – CSDM30 (%) 0.0 0.0 0.0 0.0 0.0 0.0 0.0 0.0 Stem – CSDM30 (%) 0.0 0.0 0.0 0.0 0.0 1.6 1.3 0.0
Max. plastic strain 0.0000 0.0067 0.0033 0.0072 0.0000 0.0853 0.1463 0.1454 Brain – CSDM10 (%) 0.3 40.8 49.4 75.6 0.0 59.4 77.1 77.5 Brain – CSDM15 (%) 0.0 7.1 7.9 40.2 0.0 18.5 55.4 33.3 Brain – CSDM30 (%) 0.0 0.0 0.0 0.8 0.0 0.3 4.5 1.4

Protecting motorcyclists in collisions with roadside barriers
91
TARS Research Report
IRMRC
Steel – CSP PD at 15° Steel – Ingal PD at 15° Injury measure 40 km/h 60 km/h 80 km/h 100 km/h 40 km/h 60 km/h 80 km/h 100 km/h
C1 max. plastic strain 0.0000 0.0000 0.0000 0.0000 0.0000 0.0000 0.0000 0.0000 C2 max. plastic strain 0.0000 0.0000 0.0000 0.0006 0.0000 0.0000 0.0000 0.0011 C3 max. plastic strain 0.0000 0.0000 0.0000 0.0001 0.0000 0.0000 0.0000 0.0002 C4 max. plastic strain 0.0000 0.0000 0.0000 0.0005 0.0000 0.0000 0.0001 0.0007 C5 max. plastic strain 0.0000 0.0000 0.0000 0.0008 0.0000 0.0000 0.0002 0.0011 C6 max. plastic strain 0.0000 0.0000 0.0000 0.0016 0.0000 0.0000 0.0006 0.0020 C7 max. plastic strain 0.0000 0.0000 0.0000 0.0000 0.0000 0.0000 0.0000 0.0002 Cerebrum – CSDM10 (%) 0.1 0.3 1.4 7.0 0.1 0.3 0.8 3.5 Cerebellum – CSDM10 (%) 0.0 0.0 0.0 0.0 0.0 0.0 0.0 0.0 Stem – CSDM10 (%) 1.6 10.2 13.8 13.8 1.3 12.8 13.8 13.8 Cerebrum – CSDM15 (%) 0.0 0.0 0.0 0.1 0.0 0.0 0.0 0.0 Cerebellum – CSDM15 (%) 0.0 0.0 0.0 0.0 0.0 0.0 0.0 0.0 Stem – CSDM15 (%) 0.0 1.0 2.6 2.6 0.0 1.3 2.3 2.0 Cerebrum – CSDM30 (%) 0.0 0.0 0.0 0.0 0.0 0.0 0.0 0.0 Cerebellum – CSDM30 (%) 0.0 0.0 0.0 0.0 0.0 0.0 0.0 0.0 Stem – CSDM30 (%) 0.0 0.0 0.0 0.0 0.0 0.0 0.0 0.0
Max. plastic strain 0.0000 0.0000 0.0000 0.0016 0.0000 0.0000 0.0006 0.0020 Brain – CSDM10 (%) 0.1 0.4 1.4 5.8 0.1 0.5 0.9 3.0 Brain – CSDM15 (%) 0.0 0.0 0.1 0.2 0.0 0.0 0.1 0.1 Brain – CSDM30 (%) 0.0 0.0 0.0 0.0 0.0 0.0 0.0 0.0
Steel pipe at 15° Steel profiled at 15° Injury measure 40 km/h 60 km/h 80 km/h 100 km/h 40 km/h 60 km/h 80 km/h 100 km/h
C1 max. plastic strain 0.0000 0.0006 0.0006 0.0012 0.0000 0.0011 0.0032 0.0187 C2 max. plastic strain 0.0000 0.0000 0.0002 0.0008 0.0000 0.0000 0.0010 0.0020 C3 max. plastic strain 0.0000 0.0000 0.0000 0.0000 0.0000 0.0000 0.0004 0.0018 C4 max. plastic strain 0.0000 0.0000 0.0000 0.0005 0.0000 0.0000 0.0006 0.0015 C5 max. plastic strain 0.0000 0.0000 0.0003 0.0016 0.0000 0.0000 0.0008 0.0023 C6 max. plastic strain 0.0000 0.0000 0.0008 0.0022 0.0000 0.0000 0.0009 0.0041 C7 max. plastic strain 0.0000 0.0000 0.0000 0.0016 0.0000 0.0000 0.0000 0.0006 Cerebrum – CSDM10 (%) 5.8 31.7 57.3 75.7 0.0 2.7 46.1 76.6 Cerebellum – CSDM10 (%) 0.0 0.3 1.4 6.7 0.0 0.0 0.0 0.4 Stem – CSDM10 (%) 5.6 13.8 20.4 26.0 1.6 10.5 15.8 19.4 Cerebrum – CSDM15 (%) 0.1 1.1 6.8 21.7 0.0 0.1 7.0 30.1 Cerebellum – CSDM15 (%) 0.0 0.0 0.1 0.3 0.0 0.0 0.0 0.0 Stem – CSDM15 (%) 0.3 3.9 11.8 14.5 0.0 4.9 8.2 9.9 Cerebrum – CSDM30 (%) 0.0 0.0 0.0 0.1 0.0 0.0 0.0 0.1 Cerebellum – CSDM30 (%) 0.0 0.0 0.0 0.0 0.0 0.0 0.0 0.0 Stem – CSDM30 (%) 0.0 0.0 0.0 1.6 0.0 0.0 0.0 0.0
Max. plastic strain 0.0000 0.0006 0.0008 0.0022 0.0000 0.0011 0.0032 0.0187 Brain – CSDM10 (%) 4.7 25.4 45.9 61.6 0.0 2.3 36.7 61.0 Brain – CSDM15 (%) 0.1 0.9 5.6 17.5 0.0 0.1 5.7 24.0 Brain – CSDM30 (%) 0.0 0.0 0.0 0.1 0.0 0.0 0.0 0.1

Protecting motorcyclists in collisions with roadside barriers
92
TARS Research Report
IRMRC
Steel flat – high stiffness at 15° Steel flat – low stiffness at 15° Injury measure 40 km/h 60 km/h 80 km/h 100 km/h 40 km/h 60 km/h 80 km/h 100 km/h
C1 max. plastic strain 0.0000 0.0001 0.0016 0.0069 0.0000 0.0088 0.0078 0.1831 C2 max. plastic strain 0.0000 0.0001 0.0017 0.0054 0.0000 0.0311 0.0179 0.2156 C3 max. plastic strain 0.0000 0.0000 0.0013 0.0036 0.0000 0.0033 0.0016 0.0583 C4 max. plastic strain 0.0000 0.0003 0.0020 0.0051 0.0000 0.0555 0.0547 0.3499 C5 max. plastic strain 0.0000 0.0002 0.0013 0.0031 0.0000 0.0096 0.0053 0.1192 C6 max. plastic strain 0.0000 0.0001 0.0028 0.0051 0.0000 0.0129 0.0089 0.1187 C7 max. plastic strain 0.0000 0.0000 0.0010 0.0020 0.0000 0.0015 0.0010 0.0667 Cerebrum – CSDM10 (%) 0.0 1.3 8.3 41.4 0.0 59.9 71.6 100.0 Cerebellum – CSDM10 (%) 0.0 0.0 0.0 1.1 0.0 1.0 1.5 51.5 Stem – CSDM10 (%) 2.6 13.2 15.8 19.4 0.0 12.5 19.7 84.9 Cerebrum – CSDM15 (%) 0.0 0.0 1.1 5.6 0.0 14.7 23.8 99.0 Cerebellum – CSDM15 (%) 0.0 0.0 0.0 0.0 0.0 0.1 0.1 23.9 Stem – CSDM15 (%) 0.0 2.6 4.6 4.3 0.0 5.6 4.3 56.9 Cerebrum – CSDM30 (%) 0.0 0.0 0.0 0.0 0.0 0.1 1.1 58.5 Cerebellum – CSDM30 (%) 0.0 0.0 0.0 0.0 0.0 0.0 0.0 1.6 Stem – CSDM30 (%) 0.0 0.0 0.0 0.0 0.0 0.0 0.0 9.2
Max. plastic strain 0.0000 0.0003 0.0028 0.0069 0.0000 0.0555 0.0547 0.3499 Brain – CSDM10 (%) 0.1 1.3 6.9 33.2 0.0 47.8 57.2 90.4 Brain – CSDM15 (%) 0.0 0.1 1.0 4.5 0.0 11.8 18.9 83.8 Brain – CSDM30 (%) 0.0 0.0 0.0 0.0 0.0 0.1 0.9 46.7
Steel – CSP PD at 30° Steel – CSP PD at 45° Injury measure 40 km/h 60 km/h 80 km/h 100 km/h 40 km/h 60 km/h 80 km/h 100 km/h
C1 max. plastic strain 0.0003 0.0054 0.0058 0.0000 0.0032 0.0057 0.0071 0.0000 C2 max. plastic strain 0.0018 0.0056 0.0080 0.0000 0.0128 0.0297 0.0584 0.0000 C3 max. plastic strain 0.0009 0.0023 0.0055 0.0000 0.0056 0.0201 0.0366 0.0000 C4 max. plastic strain 0.0010 0.0032 0.0114 0.0000 0.0070 0.0281 0.0406 0.0000 C5 max. plastic strain 0.0024 0.0044 0.0108 0.0000 0.0156 0.0243 0.0356 0.0000 C6 max. plastic strain 0.0084 0.0148 0.0261 0.0000 0.0290 0.0336 0.0374 0.0000 C7 max. plastic strain 0.0022 0.0050 0.0089 0.0000 0.0103 0.0192 0.0392 0.0000 Cerebrum – CSDM10 (%) 18.4 82.9 99.3 0.0 66.6 99.0 98.8 0.0 Cerebellum – CSDM10 (%) 0.1 1.2 6.3 0.0 0.3 35.9 75.2 0.0 Stem – CSDM10 (%) 16.8 26.6 41.8 0.0 17.4 64.1 78.6 0.0 Cerebrum – CSDM15 (%) 0.6 18.3 86.1 0.0 11.5 81.9 84.4 0.0 Cerebellum – CSDM15 (%) 0.0 0.0 0.2 0.0 0.0 3.8 27.1 0.0 Stem – CSDM15 (%) 9.5 11.2 9.5 0.0 9.9 28.3 47.7 0.0 Cerebrum – CSDM30 (%) 0.0 0.1 4.6 0.0 0.0 4.7 12.8 0.0 Cerebellum – CSDM30 (%) 0.0 0.0 0.0 0.0 0.0 0.0 0.1 0.0 Stem – CSDM30 (%) 0.0 0.0 0.0 0.0 0.0 0.0 0.0 0.0
Max. plastic strain 0.0084 0.0148 0.0261 0.0000 0.0290 0.0336 0.0584 0.0000 Brain – CSDM10 (%) 14.9 66.3 80.4 0.0 53.0 86.3 93.9 0.0 Brain – CSDM15 (%) 0.7 14.6 68.2 0.0 9.3 65.9 72.7 0.0 Brain – CSDM30 (%) 0.0 0.1 3.6 0.0 0.0 3.7 10.1 0.0

Protecting motorcyclists in collisions with roadside barriers
93
TARS Research Report
IRMRC
Concrete - Jersey at 30° Concrete - Jersey at 45° Injury measure 40 km/h 60 km/h 80 km/h 100 km/h 40 km/h 60 km/h 80 km/h 100 km/h
C1 max. plastic strain 0.0095 0.0214 0.0000 0.0000 0.0603 0.0845 0.0000 0.0000 C2 max. plastic strain 0.0058 0.0217 0.0000 0.0000 0.0167 0.0301 0.0000 0.0000 C3 max. plastic strain 0.0013 0.0120 0.0000 0.0000 0.0110 0.0249 0.0000 0.0000 C4 max. plastic strain 0.0008 0.0069 0.0000 0.0000 0.0038 0.0066 0.0000 0.0000 C5 max. plastic strain 0.0021 0.0136 0.0000 0.0000 0.0041 0.0025 0.0000 0.0000 C6 max. plastic strain 0.0015 0.0079 0.0000 0.0000 0.0027 0.0039 0.0000 0.0000 C7 max. plastic strain 0.0002 0.0024 0.0000 0.0000 0.0025 0.0110 0.0000 0.0000 Cerebrum – CSDM10 (%) 98.0 99.8 0.0 0.0 99.2 99.9 0.0 0.0 Cerebellum – CSDM10 (%) 6.5 75.6 0.0 0.0 21.3 82.8 0.0 0.0 Stem – CSDM10 (%) 34.9 72.7 0.0 0.0 66.1 83.9 0.0 0.0 Cerebrum – CSDM15 (%) 67.9 92.6 0.0 0.0 86.6 96.8 0.0 0.0 Cerebellum – CSDM15 (%) 0.5 18.2 0.0 0.0 3.2 30.5 0.0 0.0 Stem – CSDM15 (%) 20.7 36.8 0.0 0.0 30.6 53.3 0.0 0.0 Cerebrum – CSDM30 (%) 1.3 17.7 0.0 0.0 10.7 24.1 0.0 0.0 Cerebellum – CSDM30 (%) 0.0 0.1 0.0 0.0 0.0 0.4 0.0 0.0 Stem – CSDM30 (%) 6.9 10.2 0.0 0.0 13.2 12.2 0.0 0.0
Max. plastic strain 0.0095 0.0217 0.0000 0.0000 0.0603 0.0845 0.0000 0.0000 Brain – CSDM10 (%) 79.3 94.7 0.0 0.0 83.7 96.3 0.0 0.0 Brain – CSDM15 (%) 54.1 77.3 0.0 0.0 69.6 83.3 0.0 0.0 Brain – CSDM30 (%) 1.2 14.2 0.0 0.0 8.7 19.3 0.0 0.0
Open post at 15° Closed post at 15° Nu-Guard at 15° Nu-Guard at 30° Injury measure 20 km/h 40 km/h 20 km/h 40 km/h 60 km/h 60 km/h
C1 max. plastic strain 0.0451 0.0609 0.0117 0.0060 0.0000 0.0045 C2 max. plastic strain 0.0643 0.0725 0.0547 0.1022 0.0000 0.0095 C3 max. plastic strain 0.0515 0.0349 0.0158 0.0236 0.0000 0.0054 C4 max. plastic strain 0.0355 0.0562 0.0151 0.0053 0.0000 0.0057 C5 max. plastic strain 0.0228 0.0128 0.0432 0.0068 0.0000 0.0096 C6 max. plastic strain 0.0078 0.0086 0.0326 0.0378 0.0000 0.0189 C7 max. plastic strain 0.0042 0.0054 0.0256 0.0154 0.0000 0.0082 Cerebrum – CSDM10 (%) 59.4 86.4 35.0 33.0 1.0 70.8 Cerebellum – CSDM10 (%) 5.4 55.5 2.3 17.3 0.0 3.3 Stem – CSDM10 (%) 46.1 66.4 26.6 46.7 13.2 26.3 Cerebrum – CSDM15 (%) 7.1 40.7 5.0 5.0 0.0 15.1 Cerebellum – CSDM15 (%) 1.1 7.3 0.0 1.8 0.0 0.0 Stem – CSDM15 (%) 25.0 31.3 23.0 22.7 2.0 8.6 Cerebrum – CSDM30 (%) 0.0 2.5 0.0 0.0 0.0 0.1 Cerebellum – CSDM30 (%) 0.0 0.0 0.0 0.0 0.0 0.0 Stem – CSDM30 (%) 13.5 8.6 7.6 5.6 0.0 0.0
Max. plastic strain 0.0643 0.0725 0.0547 0.1022 0.0000 0.0189 Brain – CSDM10 (%) 48.9 80.1 28.6 30.3 1.1 57.0 Brain – CSDM15 (%) 6.3 34.2 4.4 4.7 0.0 12.1 Brain – CSDM30 (%) 0.3 2.2 0.2 0.1 0.0 0.1
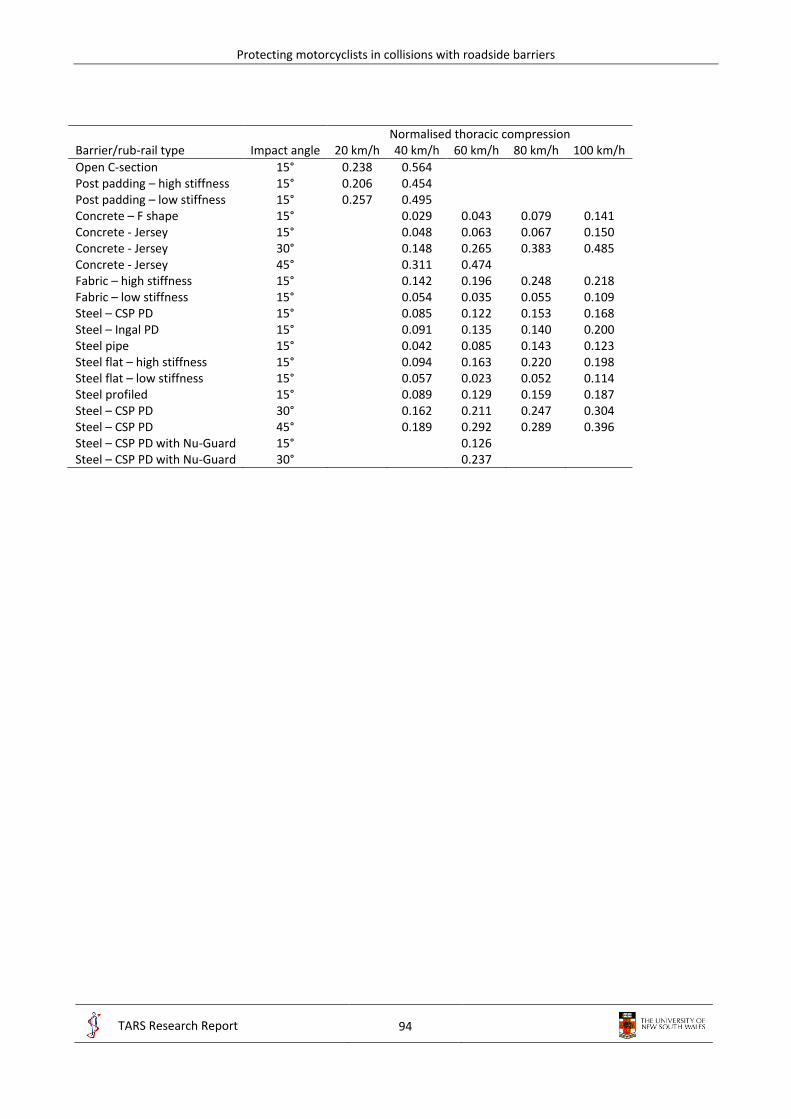
Protecting motorcyclists in collisions with roadside barriers
94
TARS Research Report
IRMRC
Normalised thoracic compression Barrier/rub-rail type Impact angle 20 km/h 40 km/h 60 km/h 80 km/h 100 km/h
Open C-section 15° 0.238 0.564 Post padding – high stiffness 15° 0.206 0.454 Post padding – low stiffness 15° 0.257 0.495 Concrete – F shape 15° 0.029 0.043 0.079 0.141 Concrete - Jersey 15° 0.048 0.063 0.067 0.150 Concrete - Jersey 30° 0.148 0.265 0.383 0.485 Concrete - Jersey 45° 0.311 0.474 Fabric – high stiffness 15° 0.142 0.196 0.248 0.218 Fabric – low stiffness 15° 0.054 0.035 0.055 0.109 Steel – CSP PD 15° 0.085 0.122 0.153 0.168 Steel – Ingal PD 15° 0.091 0.135 0.140 0.200 Steel pipe 15° 0.042 0.085 0.143 0.123 Steel flat – high stiffness 15° 0.094 0.163 0.220 0.198 Steel flat – low stiffness 15° 0.057 0.023 0.052 0.114 Steel profiled 15° 0.089 0.129 0.159 0.187 Steel – CSP PD 30° 0.162 0.211 0.247 0.304 Steel – CSP PD 45° 0.189 0.292 0.289 0.396 Steel – CSP PD with Nu-Guard 15° 0.126 Steel – CSP PD with Nu-Guard 30° 0.237

Protecting motorcyclists in collisions with roadside barriers
95
TARS Research Report
IRMRC
11. Appendix E – Sample results for ATD-barrier collisions
ATD injury metrics results for head-leading post-centred collision with steel CSP PD rub-rail:


![arXiv:1907.12647v1 [cs.CV] 15 Jul 2019 · (e.g., concrete barriers, metal crash barriers, rumble strips) play an important role in preventing or mitigating vehicle crashes. Accurate](https://img.pdfslide.us/doc/110x75/5f5a06f8adc2aa22602be5fe/arxiv190712647v1-cscv-15-jul-2019-eg-concrete-barriers-metal-crash-barriers.jpg)