Embed Size (px)
Citation preview
Motorcycle – ATV Braking Data Analysis
Progress Report
Mark D. Osborne
And
Russ G. Alger
Keweenaw Research Center Houghton, MI 49931
February 2014
i
TABLE OF CONTENTS Page
1.0 INTRODUCTION ......................................................................................................... 1
2.0 MOTORCYCLE BRAKING ......................................................................................... 1
2.1 Motorcycle Braking Testing ....................................................................................... 1
2.1.1 Test Vehicles ....................................................................................................... 1
2.1.2 Test Terrains ....................................................................................................... 2
2.1.3 Test Riders .......................................................................................................... 2
2.1.4 Data Acquisition ................................................................................................. 3
2.2 Braking Data Analysis ............................................................................................... 3
2.2.1 Motorcycle Braking on Flat Gravel .................................................................... 3
2.2.2 Motorcycle Braking on 10% Gravel Grade ........................................................ 5
2.2.3 Motorcycle Braking on 16.6% Gravel Grade ..................................................... 7
2.2.4 Motorcycle Braking on Flat Sandy Loam ........................................................... 9
2.2.5 Motorcycle Braking on 10.7% Sandy Loam Grade .......................................... 11
2.2.6 Motorcycle Braking on Flat Loose Sand .......................................................... 12
2.3 Motorcycle Braking Test Summary .......................................................................... 15
REFERENCES ....................................................................................................................... 16

ii
LIST OF FIGURES Page
Figure 1 Plot showing braking data for both rider and vehicle types on flat gravel. ................ 4
Figure 2 Plot of braking distances for the motorcycle and the utility ATV on flat gravel. ...... 5
Figure 3 Photograph of motorcycle braking on a 10% gravel grade. ....................................... 6
Figure 4 Plot of motorcycle and utility ATV braking data for both rider types on 10% gravel. ........................................................................................................................................... 6
Figure 5 Plot of braking distances for the motorcycle and utility ATV on 10% gravel. .......... 7
Figure 6 Plot of motorcycle and utility ATV braking data for both rider types on 16.6% gravel. ................................................................................................................................ 8
Figure 7 Plot of braking distances for the motorcycle and utility ATV on 16.6% gravel. ....... 8
Figure 8 Photograph of the motorcycle braking on flat sandy loam. ........................................ 9
Figure 9 Plot of motorcycle and utility ATV braking data for both rider types - flat sandy loam. ................................................................................................................................ 10
Figure 10 Plot of braking distances for the motorcycle and utility ATV - flat sandy loam. .. 10
Figure 11 Plot of motorcycle and utility ATV braking data for both rider types on 10.7% sandy loam. ...................................................................................................................... 11
Figure 12 Plot of braking distances for the motorcycle and utility ATV - 10.7% sandy loam. ......................................................................................................................................... 12
Figure 13 Photograph of motorcycle braking in flat loose sand. ............................................ 13
Figure 14 Plot of motorcycle and utility ATV braking data for both rider types - flat loose sand. ................................................................................................................................. 14
Figure 15 Plot of braking distances for the motorcycle and utility ATV on loose sand......... 14
Figure 16 Plot of all motorcycle and utility ATV curve fits for all surfaces and grades tested. ......................................................................................................................................... 15
iii
LIST OF TABLES Page
Table 1 Motorcycle Braking Distances From Curve Fit Equations………………………….15
1
1.0 INTRODUCTION
The U.S. Forest Service San Dimas Technology and Development Center (SDTDC) was interested in conducting a study to develop signage guidelines for motorized trails with the end result being a table showing advance placement distances for warning signs based on speed and other relevant factors. The purpose of the study was to determine appropriate sign size, height, reflective sign material and how far away the sign should be placed from a hazard or event to warn and instruct the rider to take an appropriate action under various climatic and environmental conditions. This was accomplished by determining stopping distances for OHVs under various physical conditions of the trail including different soils and conditions along with recognition of and reaction time to signs.
One of the major purposes of this trail signage effort was to collect braking distance information for different types of Off-Highway Vehicles (OHVs) on a variety of trail surfaces. The literature search revealed no published braking test data for All-Terrain Vehicles (ATVs) and motorcycles, and very little published braking data for snowmobiles. Most braking distance testing has been done with cars and light or heavy trucks. The goal of the studies in the literature was to develop a consistent methodology for conducting the braking tests for cars and light trucks, for the purpose of comparing braking distances of different types of vehicles on a consistent surface while minimizing other variables.
The braking tests for the sign study have an entirely different reason and goal than the braking tests described in most published braking test reports. The goal is to determine the average range of braking distances on various trail surfaces for different types of OHVs. This not only involves ATVs (and utility terrain vehicles - UTVs), motorcycles and snowmobiles, but also the range of riding abilities from novice to experienced, and a variety of trail surfaces including a packed sandy loam, gravel and loose sand. Variables such as the experience level of the rider, the rate of brake application and the surface condition cannot be minimized, as was done for on-road vehicle tests described in most reports on braking. The motorcycle and ATV braking data presented here was collected to be used with the sign recognition and reaction distances to develop guidelines for the placement of warning signs along U.S. Forest Service trails.
The focus of this report is to present the motorcycle braking distances that were measured and recorded for the overall sign recognition project. In order to present the data on a comparative basis, the motorcycle was tested at the same time as a utility type ATV.
2.0 MOTORCYCLE BRAKING
2.1 Motorcycle Braking Testing
2.1.1 Test Vehicles
The selection of the test vehicles for the braking distance study was based on time available, cost, differences in motorcycles and ATVs, and rider habits. It was determined that a general type of off-road motorcycle and a utility type ATV would be used for the braking tests. One of the most common types of ATVs on the market is the utility type which serves the purpose of general trail use and work use such as pulling trailers or hauling cargo on the racks. The
2
motorcycle was an enduro type of off-road motorcycle. The following vehicles were used for the braking study:
1) Utility ATV – 2008 Honda Rincon 2) Motorcycle – 2010 KTM EXC 530
The motorcycle was tested against the utility ATV since the other sport ATV and UTV were tested against the same utility ATV. This allowed for a general comparison between the motorcycle, the sport ATV and the UTV. Note that it was important to test at least two vehicles at the same time in order to obtain a fair comparison as surface conditions can vary significantly from day to day.
2.1.2 Test Terrains
The types of trails available throughout the United States vary considerably. It would be impossible to test for all types of trail terrains and conditions unless an extraordinary amount of time and funding was available. Therefore, the number of different terrain types was limited to the following three which were felt to be most common and representative of most trails that would be used by the motorcycle:
1) Gravel – a road gravel such as 22a, which consists of a mixture of one inch or smaller rock, clay and sand, with a layer of three inches or more over a hard packed native soil. Gravel may be compacted but the top one inch is normally loose. Gravel is the baseline terrain for this study.
2) Sandy loam – a hard packed sand mix, sometimes found with a loose surface layer. 3) Loose sand – a soft and deep sand that has a weak shear strength on the upper 6 to 12
inches.
All trails are not flat so it was determined to test in conditions where the riders may have more difficulty in stopping. Three grade ranges were tested for braking distances; they were all flat or downhill. The following grade ranges were used:
1) 0 to 8% grade – generally a flat surface. 2) 8 to 15% grade – a mid-level downhill grade. 3) 15 to 25% grade – a steep downhill grade.
Earlier testing with the two types of ATVs indicated that testing on the loose sand on a grade was not much different than on a flat and therefore testing the motorcycle on the loose sand grades would not be of much benefit.
2.1.3 Test Riders
Both novice and experienced riders were used for all braking tests in an effort to cover the range of potential riders. Novice riders are those that have rarely driven a motorcycle or ATV, if at all. The novice can generally ride and handle the motorcycle or ATV to some degree but may not be comfortable in certain situations. An experienced rider is one that has driven several different motorcycle’s or ATV’s in a variety of situations and at a range of speeds such that he or she feels comfortable at near the top speed possible for a given trail condition. The experienced rider also knows how to control the vehicle in these situations, based on experience, and therefore brakes using that experience. A prudent rider may be either novice or experienced but rides on the public trails at their personal limits of handling capability, similar to a defensive driver on the road.
3
Test speeds were selected to be 15, 30 and 45 mph, if attainable, and the drivers attempted 6 or more braking stops for each terrain, vehicle, and speed.
2.1.4 Data Acquisition
Each vehicle was instrumented to monitor longitudinal and lateral acceleration using accelerometers, throttle position using the throttle position sensor on the vehicle, brake activation by measuring brake pressure, and speed using a GPS. Special brake lines were ordered for each vehicle to accommodate the pressure transducers. These were installed and the brakes bled prior to testing and then replaced with the originals after testing was completed. The utility ATV had a box (cooler) that contained the NI CompactDAQ data acquisition hardware and laptop for data acquisition. The motorcycle had a smaller GPS system and smaller data acquisition system for recording the data. Data for the motorcycle had to be recorded for a number of runs and then downloaded whereas the data for the utility ATV was saved to a laptop that was carried in the box on the back of the utility ATV. The data acquisition program was written in LABVIEW and the data was later processed using MATLAB. Final data analysis was done using Microsoft EXCEL.
2.2 Braking Data Analysis
The following sections contain the analysis of the braking data. The motorcycle was compared to the utility ATV and the novice rider was compared to the experienced rider. The data points were plotted and then curve fit for comparison to show general average trends using a parabolic curve fit. The spread of the data points show the ranges that can be expected between vehicle and rider types.
The braking data may also be examined using the curve fit equations to determine the average coefficient of friction. This was done using the following equation found in the literature [1]:
Where: D = Braking Distance (ft) Vo= Original velocity at which brakes were applied (ft/sec) g = acceleration due to gravity (32.2 ft/sec2) µ = Coefficient of friction grade = grade of surface in percent/100 (subtract grade for downhill slopes)
2.2.1 Motorcycle Braking on Flat Gravel
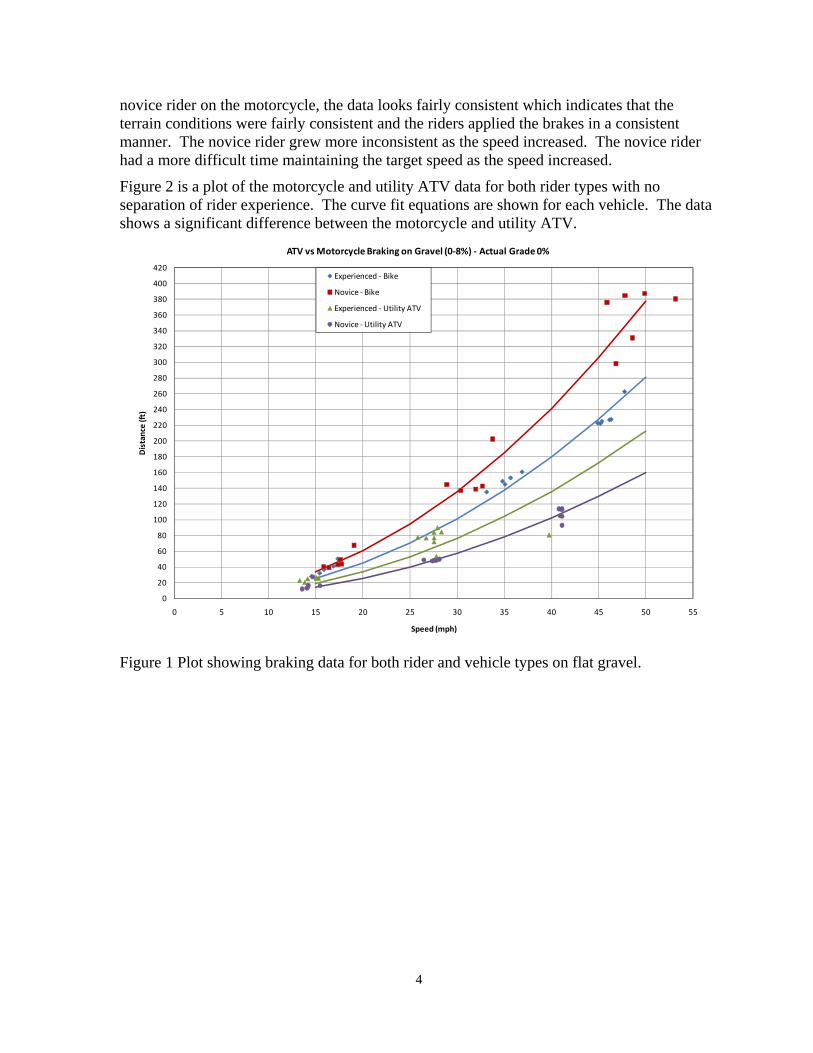
Braking data was collected for the motorcycle and utility ATV on a flat gravel trail. Both novice and experienced riders tested both the motorcycle and the utility ATV. The data for flat gravel is shown in Figure 1. The data was curve fit using a parabolic equation for each vehicle and level of rider experience. Figure 1 shows a separate curve for each of the four combinations; experienced rider on the motorcycle, novice rider on the motorcycle, experienced rider on the utility ATV and novice rider on the utility ATV. Note that the novice rider had shorter braking distances as compared to the experienced rider for the utility ATV but for the motorcycle the novice had longer braking distances. Other than for the
)(2
2
gradeg
VD o
4
novice rider on the motorcycle, the data looks fairly consistent which indicates that the terrain conditions were fairly consistent and the riders applied the brakes in a consistent manner. The novice rider grew more inconsistent as the speed increased. The novice rider had a more difficult time maintaining the target speed as the speed increased.
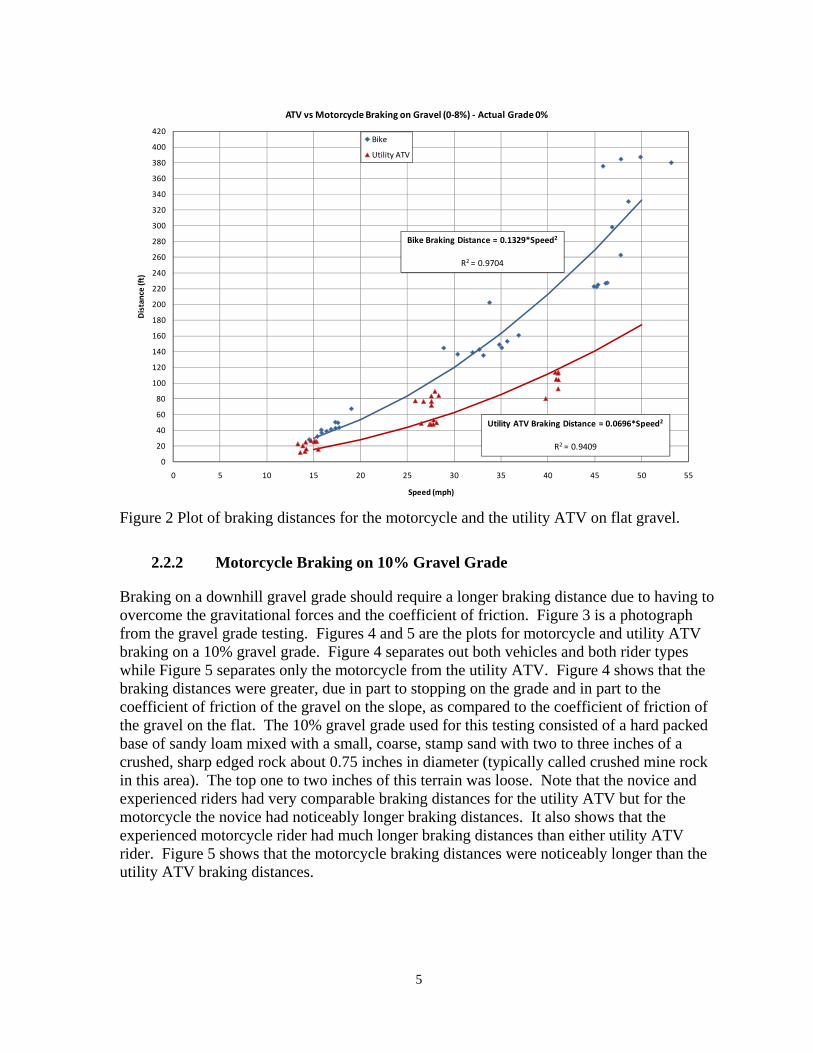
Figure 2 is a plot of the motorcycle and utility ATV data for both rider types with no separation of rider experience. The curve fit equations are shown for each vehicle. The data shows a significant difference between the motorcycle and utility ATV.
Figure 1 Plot showing braking data for both rider and vehicle types on flat gravel.
0
20
40
60
80
100
120
140
160
180
200
220
240
260
280
300
320
340
360
380
400
420
0 5 10 15 20 25 30 35 40 45 50 55
Distance (ft)
Speed (mph)
ATV vs Motorcycle Braking on Gravel (0‐8%) ‐ Actual Grade 0%
Experienced ‐ Bike
Novice ‐ Bike
Experienced ‐ Utility ATV
Novice ‐Utility ATV
5
Figure 2 Plot of braking distances for the motorcycle and the utility ATV on flat gravel.
2.2.2 Motorcycle Braking on 10% Gravel Grade
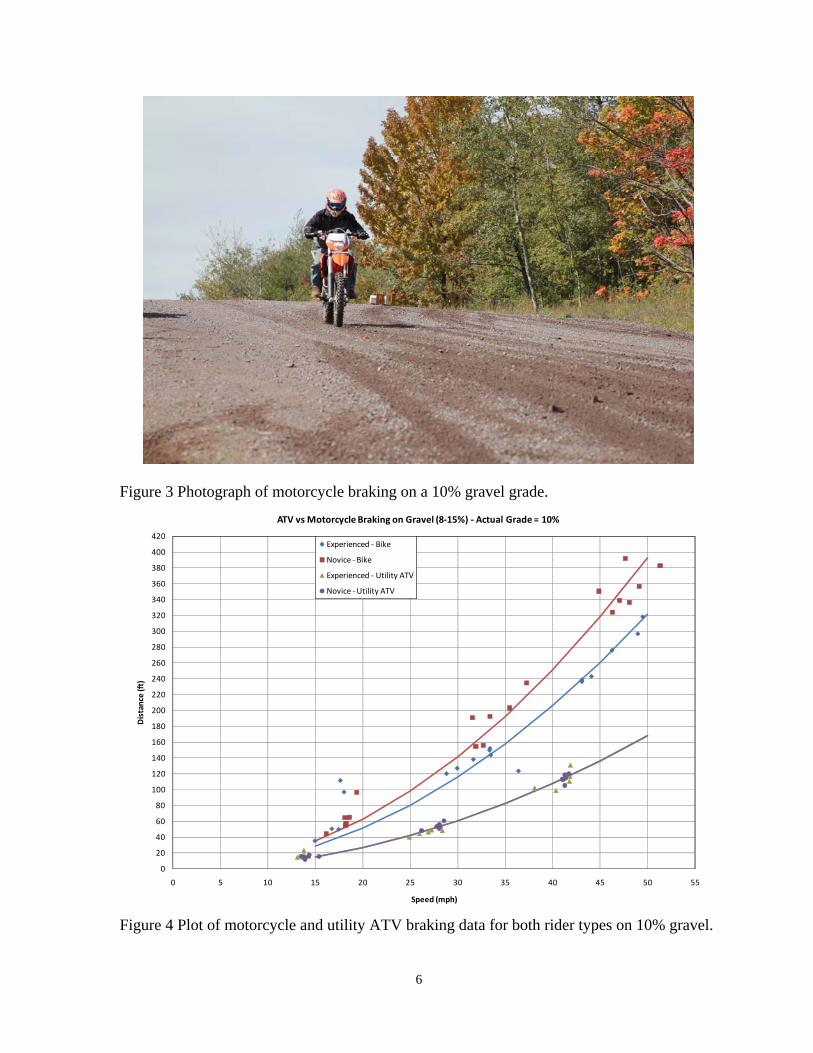
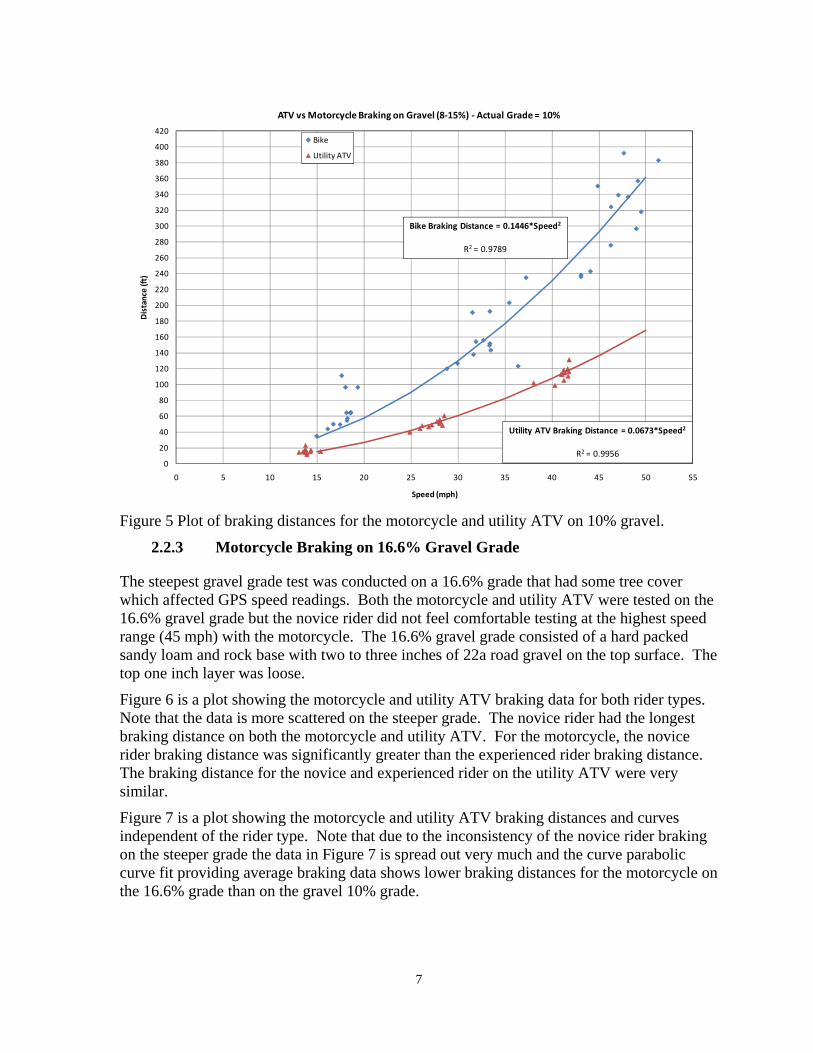
Braking on a downhill gravel grade should require a longer braking distance due to having to overcome the gravitational forces and the coefficient of friction. Figure 3 is a photograph from the gravel grade testing. Figures 4 and 5 are the plots for motorcycle and utility ATV braking on a 10% gravel grade. Figure 4 separates out both vehicles and both rider types while Figure 5 separates only the motorcycle from the utility ATV. Figure 4 shows that the braking distances were greater, due in part to stopping on the grade and in part to the coefficient of friction of the gravel on the slope, as compared to the coefficient of friction of the gravel on the flat. The 10% gravel grade used for this testing consisted of a hard packed base of sandy loam mixed with a small, coarse, stamp sand with two to three inches of a crushed, sharp edged rock about 0.75 inches in diameter (typically called crushed mine rock in this area). The top one to two inches of this terrain was loose. Note that the novice and experienced riders had very comparable braking distances for the utility ATV but for the motorcycle the novice had noticeably longer braking distances. It also shows that the experienced motorcycle rider had much longer braking distances than either utility ATV rider. Figure 5 shows that the motorcycle braking distances were noticeably longer than the utility ATV braking distances.
0
20
40
60
80
100
120
140
160
180
200
220
240
260
280
300
320
340
360
380
400
420
0 5 10 15 20 25 30 35 40 45 50 55
Distance (ft)
Speed (mph)
ATV vs Motorcycle Braking on Gravel (0‐8%) ‐ Actual Grade 0%
Bike
Utility ATV
Bike Braking Distance = 0.1329*Speed2
R2 = 0.9704
Utility ATV Braking Distance = 0.0696*Speed2
R2 = 0.9409
6
Figure 3 Photograph of motorcycle braking on a 10% gravel grade.
Figure 4 Plot of motorcycle and utility ATV braking data for both rider types on 10% gravel.
0
20
40
60
80
100
120
140
160
180
200
220
240
260
280
300
320
340
360
380
400
420
0 5 10 15 20 25 30 35 40 45 50 55
Distance (ft)
Speed (mph)
ATV vs Motorcycle Braking on Gravel (8‐15%) ‐ Actual Grade = 10%
Experienced ‐ Bike
Novice ‐Bike
Experienced ‐ Utility ATV
Novice ‐Utility ATV
7
Figure 5 Plot of braking distances for the motorcycle and utility ATV on 10% gravel.
2.2.3 Motorcycle Braking on 16.6% Gravel Grade
The steepest gravel grade test was conducted on a 16.6% grade that had some tree cover which affected GPS speed readings. Both the motorcycle and utility ATV were tested on the 16.6% gravel grade but the novice rider did not feel comfortable testing at the highest speed range (45 mph) with the motorcycle. The 16.6% gravel grade consisted of a hard packed sandy loam and rock base with two to three inches of 22a road gravel on the top surface. The top one inch layer was loose.
Figure 6 is a plot showing the motorcycle and utility ATV braking data for both rider types. Note that the data is more scattered on the steeper grade. The novice rider had the longest braking distance on both the motorcycle and utility ATV. For the motorcycle, the novice rider braking distance was significantly greater than the experienced rider braking distance. The braking distance for the novice and experienced rider on the utility ATV were very similar.
Figure 7 is a plot showing the motorcycle and utility ATV braking distances and curves independent of the rider type. Note that due to the inconsistency of the novice rider braking on the steeper grade the data in Figure 7 is spread out very much and the curve parabolic curve fit providing average braking data shows lower braking distances for the motorcycle on the 16.6% grade than on the gravel 10% grade.
0
20
40
60
80
100
120
140
160
180
200
220
240
260
280
300
320
340
360
380
400
420
0 5 10 15 20 25 30 35 40 45 50 55
Distance (ft)
Speed (mph)
ATV vs Motorcycle Braking on Gravel (8‐15%) ‐ Actual Grade = 10%
Bike
Utility ATV
Bike Braking Distance = 0.1446*Speed2
R2 = 0.9789
Utility ATV Braking Distance = 0.0673*Speed2
R2 = 0.9956

8
Figure 6 Plot of motorcycle and utility ATV braking data for both rider types on 16.6% gravel.
Figure 7 Plot of braking distances for the motorcycle and utility ATV on 16.6% gravel.
0
20
40
60
80
100
120
140
160
180
200
220
240
260
280
300
320
340
360
380
400
420
0 5 10 15 20 25 30 35 40 45 50 55
Distance (ft)
Speed (mph)
ATV vs Motorcycle Braking on Gravel (15‐25%) ‐ Actual Grade = 16.6%
Experienced ‐ Bike
Novice ‐ Bike
Experienced ‐ Utility ATV
Novice ‐Utility ATV
0
20
40
60
80
100
120
140
160
180
200
220
240
260
280
300
320
340
360
380
400
420
0 5 10 15 20 25 30 35 40 45 50 55
Distance (ft)
Speed (mph)
ATV vs Motorcycle Braking on Gravel (15‐25%) ‐ Actual Grade = 16.6%
Bike
Utility ATV
Utility ATV Braking Distance = 0.0780*Speed2
R2 = 0.9625
Bike Braking Distance = 0.1157*Speed2
R2 = 0.8946
9
In summary, the data shows that the gravel braking data is fairly consistent and that braking distance depends a lot on coefficient of friction and, for the motorcycle, rider experience. It is also obvious that the steeper the grade the braking distance is more variable. In general, motorcycle braking distances are noticeably longer than utility type ATVs.
2.2.4 Motorcycle Braking on Flat Sandy Loam
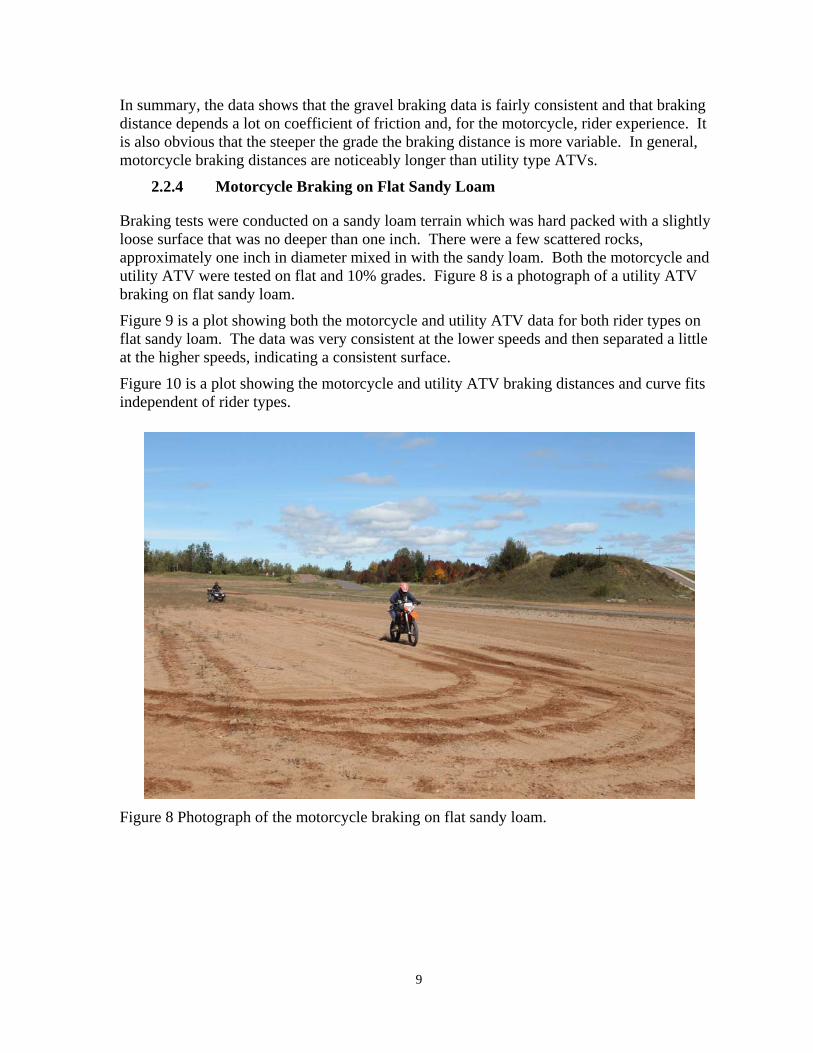
Braking tests were conducted on a sandy loam terrain which was hard packed with a slightly loose surface that was no deeper than one inch. There were a few scattered rocks, approximately one inch in diameter mixed in with the sandy loam. Both the motorcycle and utility ATV were tested on flat and 10% grades. Figure 8 is a photograph of a utility ATV braking on flat sandy loam.
Figure 9 is a plot showing both the motorcycle and utility ATV data for both rider types on flat sandy loam. The data was very consistent at the lower speeds and then separated a little at the higher speeds, indicating a consistent surface.
Figure 10 is a plot showing the motorcycle and utility ATV braking distances and curve fits independent of rider types.
Figure 8 Photograph of the motorcycle braking on flat sandy loam.

10
Figure 9 Plot of motorcycle and utility ATV braking data for both rider types - flat sandy loam.
Figure 10 Plot of braking distances for the motorcycle and utility ATV - flat sandy loam.
0
20
40
60
80
100
120
140
160
180
200
220
240
260
280
300
320
340
360
380
400
420
0 5 10 15 20 25 30 35 40 45 50 55
Distance (ft)
Speed (mph)
ATV vs Motorcycle Braking on Sandy Loam (0‐8%) ‐ Actual Grade = 0%
Experienced ‐ Bike
Novice ‐ Bike
Experienced ‐ Utility ATV
Novice ‐Utility ATV
0
20
40
60
80
100
120
140
160
180
200
220
240
260
280
300
320
340
360
380
400
420
0 5 10 15 20 25 30 35 40 45 50 55
Distance (ft)
Speed (mph)
ATV vs Motorcycle Braking on Sandy Loam (0‐8%) ‐ Actual Grade = 0%
Experienced ‐ Bike
Experienced ‐ Utility ATV
Bike Braking Distance = 0.0980*Speed2
R2 = 0.9868
Utility ATV Braking Distance = 0.0547*Speed2
R2 = 0.9830
11
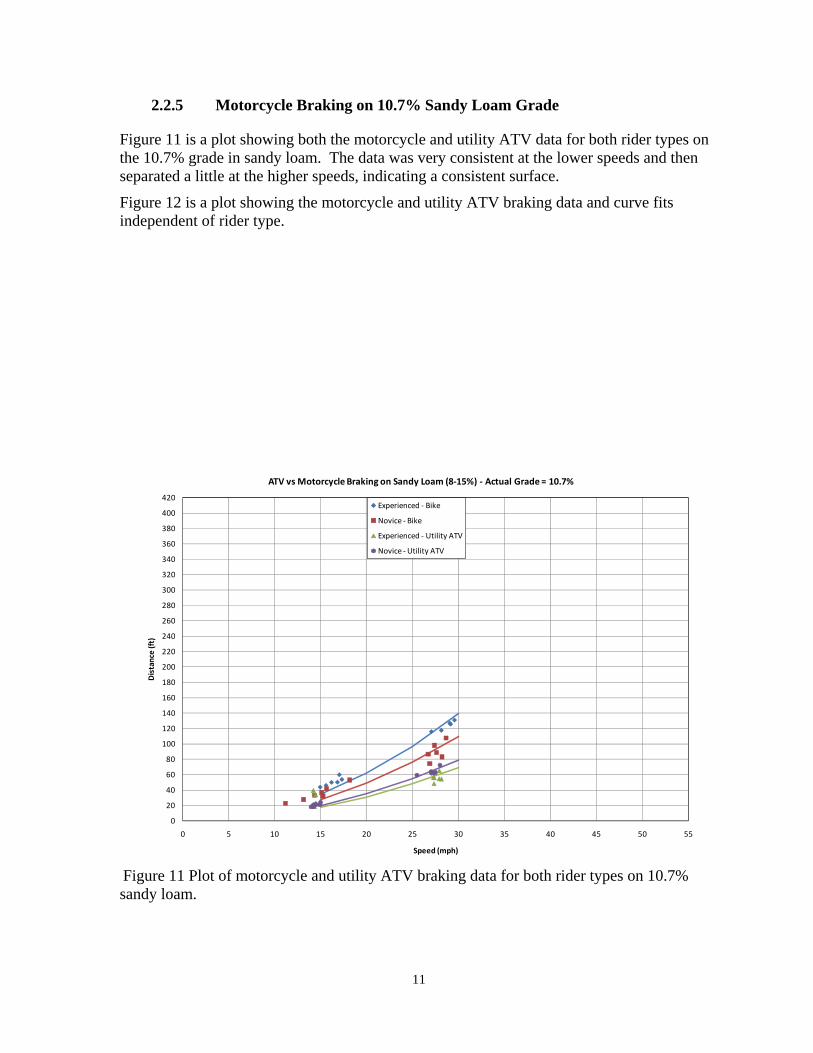
2.2.5 Motorcycle Braking on 10.7% Sandy Loam Grade
Figure 11 is a plot showing both the motorcycle and utility ATV data for both rider types on the 10.7% grade in sandy loam. The data was very consistent at the lower speeds and then separated a little at the higher speeds, indicating a consistent surface.
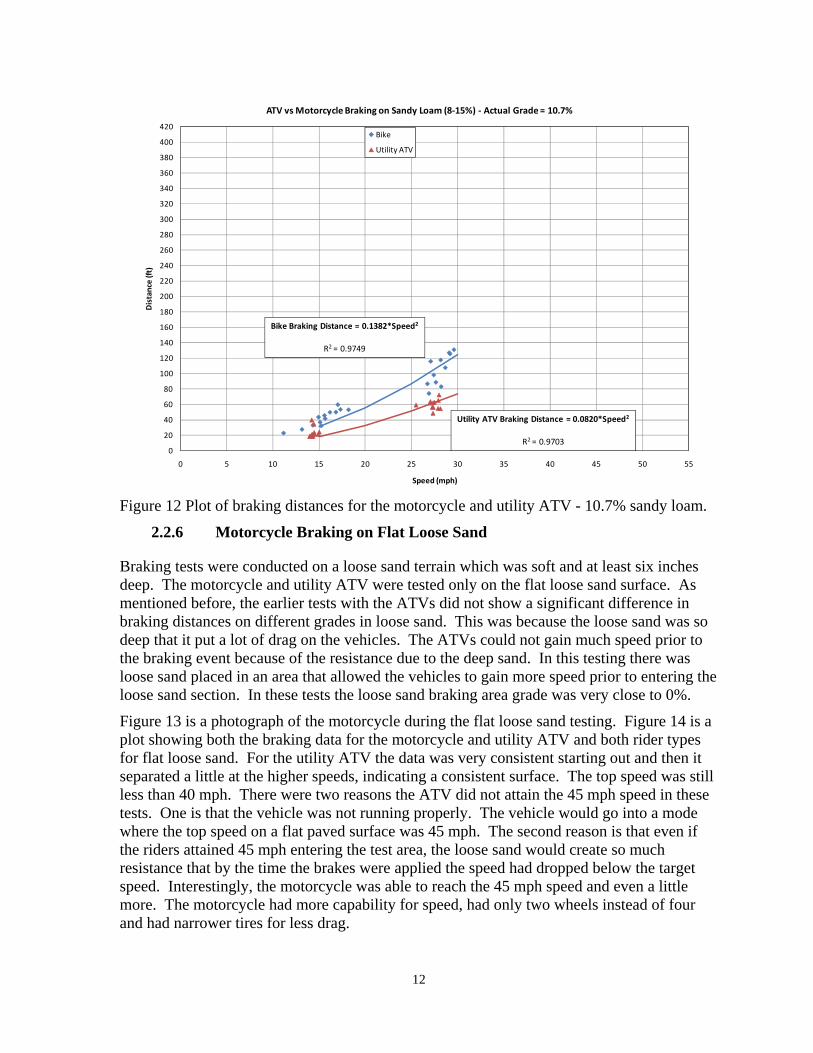
Figure 12 is a plot showing the motorcycle and utility ATV braking data and curve fits independent of rider type.
Figure 11 Plot of motorcycle and utility ATV braking data for both rider types on 10.7% sandy loam.
0
20
40
60
80
100
120
140
160
180
200
220
240
260
280
300
320
340
360
380
400
420
0 5 10 15 20 25 30 35 40 45 50 55
Distance (ft)
Speed (mph)
ATV vs Motorcycle Braking on Sandy Loam (8‐15%) ‐ Actual Grade = 10.7%
Experienced ‐ Bike
Novice ‐ Bike
Experienced ‐ Utility ATV
Novice ‐Utility ATV
12
Figure 12 Plot of braking distances for the motorcycle and utility ATV - 10.7% sandy loam.
2.2.6 Motorcycle Braking on Flat Loose Sand
Braking tests were conducted on a loose sand terrain which was soft and at least six inches deep. The motorcycle and utility ATV were tested only on the flat loose sand surface. As mentioned before, the earlier tests with the ATVs did not show a significant difference in braking distances on different grades in loose sand. This was because the loose sand was so deep that it put a lot of drag on the vehicles. The ATVs could not gain much speed prior to the braking event because of the resistance due to the deep sand. In this testing there was loose sand placed in an area that allowed the vehicles to gain more speed prior to entering the loose sand section. In these tests the loose sand braking area grade was very close to 0%.
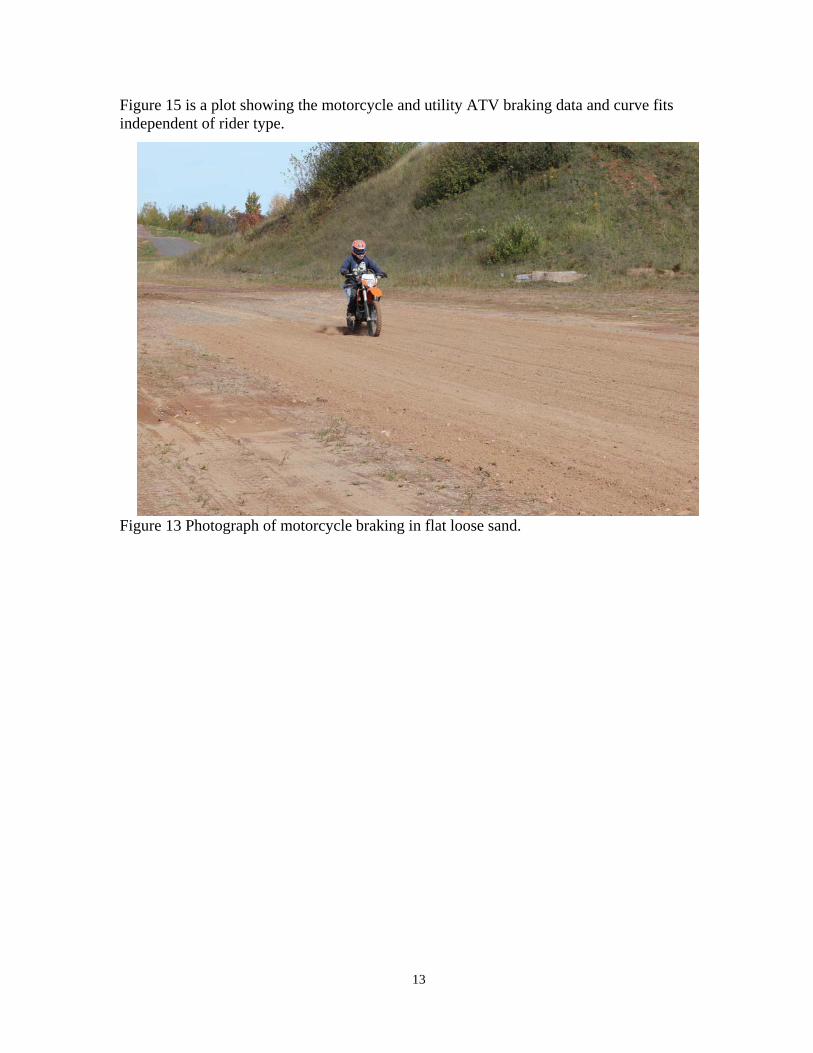
Figure 13 is a photograph of the motorcycle during the flat loose sand testing. Figure 14 is a plot showing both the braking data for the motorcycle and utility ATV and both rider types for flat loose sand. For the utility ATV the data was very consistent starting out and then it separated a little at the higher speeds, indicating a consistent surface. The top speed was still less than 40 mph. There were two reasons the ATV did not attain the 45 mph speed in these tests. One is that the vehicle was not running properly. The vehicle would go into a mode where the top speed on a flat paved surface was 45 mph. The second reason is that even if the riders attained 45 mph entering the test area, the loose sand would create so much resistance that by the time the brakes were applied the speed had dropped below the target speed. Interestingly, the motorcycle was able to reach the 45 mph speed and even a little more. The motorcycle had more capability for speed, had only two wheels instead of four and had narrower tires for less drag.
0
20
40
60
80
100
120
140
160
180
200
220
240
260
280
300
320
340
360
380
400
420
0 5 10 15 20 25 30 35 40 45 50 55
Distance (ft)
Speed (mph)
ATV vs Motorcycle Braking on Sandy Loam (8‐15%) ‐ Actual Grade = 10.7%
Bike
Utility ATV
Bike Braking Distance = 0.1382*Speed2
R2 = 0.9749
Utility ATV Braking Distance = 0.0820*Speed2
R2 = 0.9703
13
Figure 15 is a plot showing the motorcycle and utility ATV braking data and curve fits independent of rider type.
Figure 13 Photograph of motorcycle braking in flat loose sand.

14
Figure 14 Plot of motorcycle and utility ATV braking data for both rider types - flat loose sand.
Figure 15 Plot of braking distances for the motorcycle and utility ATV on loose sand.
0
20
40
60
80
100
120
140
160
180
200
220
240
260
280
300
320
340
360
380
400
420
0 5 10 15 20 25 30 35 40 45 50 55
Distance (ft)
Speed (mph)
ATV vs Motorcycle Braking on Sand (0‐8%) ‐ Actual Grade = 0%
Experienced ‐ Bike
Novice ‐ Bike
Experienced ‐ Utility ATV
Novice ‐Utility ATV
0
20
40
60
80
100
120
140
160
180
200
220
240
260
280
300
320
340
360
380
400
420
0 5 10 15 20 25 30 35 40 45 50 55
Distance (ft)
Speed (mph)
ATV vs Motorcycle Braking on Sand (0‐8%) ‐ Actual Grade = 0%
Bike
Utility ATV
Bike Braking Distance = 0.0819*Speed2
R2 = 0.9554
Utility ATV Braking Distance = 0.0512*Speed2
R2 = 0.9699
15
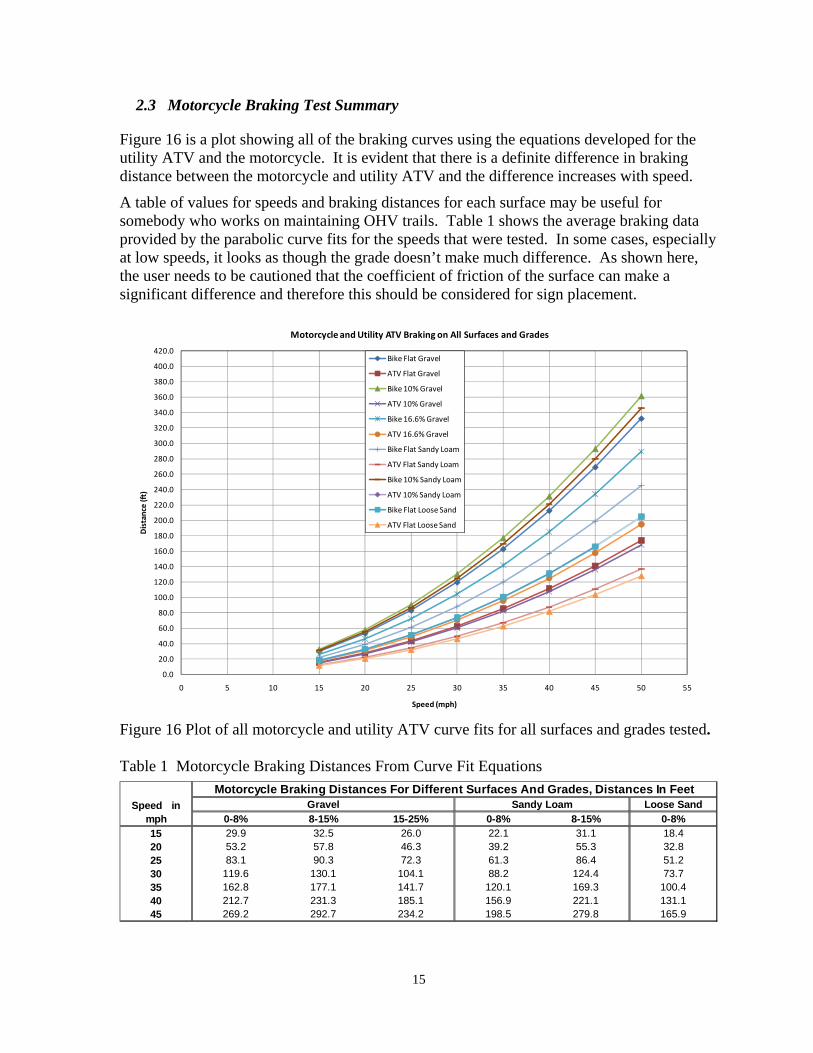
2.3 Motorcycle Braking Test Summary
Figure 16 is a plot showing all of the braking curves using the equations developed for the utility ATV and the motorcycle. It is evident that there is a definite difference in braking distance between the motorcycle and utility ATV and the difference increases with speed.
A table of values for speeds and braking distances for each surface may be useful for somebody who works on maintaining OHV trails. Table 1 shows the average braking data provided by the parabolic curve fits for the speeds that were tested. In some cases, especially at low speeds, it looks as though the grade doesn’t make much difference. As shown here, the user needs to be cautioned that the coefficient of friction of the surface can make a significant difference and therefore this should be considered for sign placement.
Figure 16 Plot of all motorcycle and utility ATV curve fits for all surfaces and grades tested. Table 1 Motorcycle Braking Distances From Curve Fit Equations
0.0
20.0
40.0
60.0
80.0
100.0
120.0
140.0
160.0
180.0
200.0
220.0
240.0
260.0
280.0
300.0
320.0
340.0
360.0
380.0
400.0
420.0
0 5 10 15 20 25 30 35 40 45 50 55
Distance (ft)
Speed (mph)
Motorcycle and Utility ATV Braking on All Surfaces and Grades
Bike Flat Gravel
ATV Flat Gravel
Bike 10% Gravel
ATV 10% Gravel
Bike 16.6% Gravel
ATV 16.6% Gravel
Bike Flat Sandy Loam
ATV Flat Sandy Loam
Bike 10% Sandy Loam
ATV 10% Sandy Loam
Bike Flat Loose Sand
ATV Flat Loose Sand
Loose Sand
0-8% 8-15% 15-25% 0-8% 8-15% 0-8%
15 29.9 32.5 26.0 22.1 31.1 18.420 53.2 57.8 46.3 39.2 55.3 32.825 83.1 90.3 72.3 61.3 86.4 51.230 119.6 130.1 104.1 88.2 124.4 73.735 162.8 177.1 141.7 120.1 169.3 100.440 212.7 231.3 185.1 156.9 221.1 131.145 269.2 292.7 234.2 198.5 279.8 165.9
Speed in mph
Gravel Sandy Loam
Motorcycle Braking Distances For Different Surfaces And Grades, Distances In Feet
16
REFERENCES
[1] Fundamentals of Physics, David Halliday and Robert Resnick, Revised Printing, 1974, John Wiley & Sons, Inc., page 82.