Embed Size (px)
Citation preview
ABN 93 610 406 210Address Level 1, 33 George Street Launceston 7250, Tasmania Telephone (03) 6336 4800Toll Free 1800 006 224Facsimile (03) 6336 4848Email [email protected] www.maib.tas.gov.au
MOTOR ACCIDENTS INSURANCE BOARD
MOTOR ACCIDENTS INSURANCE BOARD ANNUAL REPORT
MOTOR ACCIDENTS INSURANCE BOARD
ANNUAL REPORT2014-15

VISION STATEMENTTo be highly regarded nationally in the provision of competitively priced, quality, service driven personal injury motor accident insurance.
MISSION STATEMENTTo provide a commercially viable, cost competitive, high quality, personal injury insurance scheme which offers fair and equitable compensation for people injured in a motor accident.
VALUESIn seeking to achieve the vision and mission, the values of the MAIB are:
• accountability and responsibility;
• integrity;
• unity of purpose;
• professionalism and dignity; and
• innovation.
Dedicated Service
Current MAIB Staff and Directors by tenure.

1
The Motor Accidents Insurance Board is a Tasmanian Government Business Enterprise which operates a compulsory third party insurance scheme.
The scheme provides medical and income benefits on a no fault basis to people injured as a result of a motor accident while enabling access to common law.
OVERVIEW 2
CHAIRMAN’S2014-15REVIEW 3
CHIEFEXECUTIVEOFFICER’SREPORT 4
STATEMENTOFCOMPLIANCE 5
CORPORATEGOVERNANCE 6
BOARDOFDIRECTORS 8
STATEMENTOFCORPORATEINTENT 10
CLAIMSMANAGEMENT 12
40YEARSOFTHEMAIB 14
INJURYPREVENTIONANDMANAGEMENTFOUNDATION 16
COMMUNITYSERVICE 17
HUMANRESOURCES 18
FINANCIALSTATEMENTS 19
APPENDIX 72
Contents

2 MOTOR ACCIDENTS INSURANCE BOARD ANNUAL REPORT 2014-15
Overview
PURPOSE
Established in 1974 under the Motor Accidents (Liabilities and Compensation) Act 1973 (the Act), the Motor Accidents Insurance Board (MAIB) is a Tasmanian Government Business Enterprise (GBE).
The purpose of the MAIB is to administer the funding and payment of Tasmania’s compulsory third party (CTP) motor accident insurance scheme. The scheme provides medical and income benefits on a no fault basis to people injured as a result of a motor accident while enabling access to common law.
All States and Territories within Australia have CTP schemes which are funded through the application of compulsory premiums on all registered motor vehicles.
PRIMARY FUNCTIONS
Provision of Compensation
The core claims activities of the MAIB are:
• assessment and payment of scheduled benefits in accordance with the requirements of the Act and the Motor Accidents (Liabilities and Compensation) Regulations 2010; and
• resolution of common law damages claims pursuant to the indemnity provisions of the Act.
Financial Management
The MAIB strives to maintain a balance between premium and investment income, the cost of claims (including a prudential margin) and the requirement to achieve a sustainable commercial rate of return that maximises value for the State.
Injury and Accident Prevention
The MAIB’s ongoing commitment to assist in reducing the number and severity of motor accidents in Tasmania is evidenced by significant contributions of time and funds, to the Road Safety Advisory Council and the Injury Prevention and Management Foundation.
COMPENSATION
The following types of compensation are available to eligible drivers, passengers, motorcyclists and other road users:
No Fault Benefits
No fault benefits are paid on accepted claims, irrespective of who caused the motor accident and may include the payment of:
• reasonable medical and hospital costs including the services of doctors and health professionals;
• rehabilitation expenses;
• long term care for the seriously injured;
• disability allowance (for people in paid employment who are unable to work); and
• in the case of fatal injuries, funeral expenses and dependency benefits (where applicable).
Common Law Damages
Where personal injury is caused by a motorist’s negligence, common law damages are payable to the full extent allowed in Tasmania.
Management Team
Chief Executive Officer: Paul Kingston Chief Operating Officer: Christopher HillChief Financial Officer: Derek Thurm Manager – Claims and Rehabilitation: Lisa HarrisICT Manager: Jo-Anne WilsonExecutive Officer (Acting): Sara DaltonFinancial Accountant: Angie Edwards
GOVERNANCE STRUCTURE AS AT 30 JUNE 2015
Shareholding Ministers
Portfolio Minister:The Hon. M.T. (Rene) Hidding MP
Treasurer:The Hon. Peter Gutwein MP
The Board of Directors
Chairman: Don Challen AM
Directors:Kim Barker
Michael Dontschuk Danny McCarthyDavid St. John

3
Chairman’s 2014-15 Review
The MAIB enjoyed yet another successful year with noteworthy outcomes across the whole business. A strong investment return coupled with under budget claim costs resulted in a good operating result and very strong dividends to the Shareholder, the Tasmanian Government. 2014-15 was a year of change for the MAIB, with Peter Roche retiring as CEO after 19 years in the role, Paul Kingston joining us as our new CEO and with the Board reduced from eight to five Directors.
FINANCIAL RESULT
Following a record result the previous year, the operating result before tax was a profit of $137.2 million. A strong investment performance provided net investment revenue of $122.9 million, a return of 8.4% which was in line with the median return for similar balanced funds. International equity markets along with property and infrastructure were the main contributors to the solid performance.
While net claim costs of $100.3 million were under budget, the favourable revaluations of claim reserves were partially offset by the higher than expected claim costs resulting from prevailing economic assumptions used in the valuation of claim liabilities. The Impact on Profit chart illustrates the volatility of investment returns and the discount rate.
DIVIDEND TO GOVERNMENT
The MAIB has recommended a dividend of $47.7 million to Government in respect of this year’s operations. This is based on 60% of the average of after tax profits and losses over this year and the previous four years.
CAPITAL POSITION
Based on the MAIB’s consulting actuary’s recommendations, the Board maintained a target funding ratio range of 120% - 145% which reflects the volatility of financial results and the desire to maintain a funding ratio of at least 100%. After providing a one-off Special Dividend of $100 million to the Government, the scheme’s funding ratio was 127.8% at 30 June 2015.
INVESTMENT PORTFOLIO
The strategic asset allocation of 65% to growth assets and 35% to defensive assets was maintained following the annual review. The mix of assets aims to balance the long term nature of the MAIB’s claim liabilities and sound returns on equity for the Government.
GOVERNANCE
Consistent with the Government’s objective to reduce the size of boards, the MAIB Board has been progressively reduced over the past year from eight Directors (including the CEO as Managing Director) to five Directors (the current CEO is not a member of the Board). This reduction was achieved by not replacing the positions occupied by Caroline Rockefeller on her retirement in May 2014 and Mark Scanlon on his retirement in May 2015. The Board is not satisfied with the gender balance that is the outcome of this process of reducing the size of the Board. Improving gender balance, while maintaining an appropriate skill mix, is a priority for future appointments.
ACKNOWLEDGEMENTS
In conclusion, I wish to thank all my fellow Directors for their strong support and contribution throughout the year. I particularly wish to acknowledge the significant contributions of Mark Scanlon who retired in May 2015 after serving eight years on the Board, including five years as Audit Committee Chair. Our long serving CEO, Peter Roche retired in February 2015. Peter made an outstanding contribution to the MAIB over the past 19 years as well as to road safety in Tasmania. We were delighted to welcome Paul Kingston who joined us as our CEO in February 2015.
I also acknowledge the management team for leading the organisation in such a positive manner and all staff for their business focus, diligence and customer service.
Don Challen AM
Chairman
18%
16%
14%
12%
10%
Rat
e%
8%
6%
4%
2%
0%2009-10 2010-11
Impact on Profit - 2009-10 to 2014-15
20011-12Year
2012-13 2013-14 2014-15
Adopted long term returnActual Investment return %Weighted Average discount rate %Weighted average Inflation rate %

4 MOTOR ACCIDENTS INSURANCE BOARD ANNUAL REPORT 2014-15
The 40th year of operation for the MAIB produced another positive outcome, with a continuation of affordable premiums, reducing claim costs and ongoing commitment to promoting and supporting road safety throughout Tasmania.
CLAIM PORTFOLIO
The MAIB processed in excess of 60,000 benefit payments on behalf of injured people during the year. With no fault benefits underpinning the scheme, the MAIB is able to deliver benefits in a timely manner with a strong customer service focus. Every two years an independent client satisfaction survey is undertaken, with the overall client satisfaction score of the past four client surveys averaging 85%.
PREMIUMS
Despite a maximum increase of 2.4% allowable under the Economic Regulator (MAIB Premiums) Order 2013, following an actuarial review of the MAIB’s premium requirements, it was identified that premiums were sufficient and, except for minor relativity adjustments, premium rates were maintained at the same level as applied in the previous year. This continued a long period of no overall increases in premiums, which included a 7.4% reduction in 2013. The general trend of declining claim frequency has been a major contributor to maintaining premiums at current levels.
CLAIM FREQUENCY
New claims lodged with the MAIB decreased by 2.6% compared to the previous year. Vehicle numbers increased by 2.2% resulting in a moderate decrease in claim frequency (number of claims per 1,000 registered vehicles). The claim frequency chart demonstrates a downward trend over the past ten years.
While claim frequency 20 years ago was more than twice what it is today, the relatively low number means that further reductions are becoming more difficult to achieve. Despite this, there has been an overall small downward trend in recent years.
ROAD SAFETY FUNDING
Since 1996, the MAIB has provided significant financial support to road safety in Tasmania, most recently funding the education and enforcement strategy of the Road Safety Advisory Council. During the year, the University of South Australia undertook an evaluation of this MAIB funded strategy, recommending a continuation of funding. The MAIB subsequently committed $3.6 million per annum (indexed) for a further three years from 1 January 2015. This continues the MAIB’s ongoing commitment to support road safety throughout the State.
CONCLUSION
I wish to acknowledge my thanks to the Board and the Executive team for their support and commitment during this period of change for the organisation.
I also thank all MAIB employees for their hard work, commitment to customer service and provision of high quality outcomes for our stakeholders as well as the broader Tasmanian community.
Paul KingstonChief Executive Officer
Chief Executive Officer’s Report
0
1
2
3
4
5
6
7
8
9
Claim Frequency
Financial Year
Num
ber
of C
laim
s pe
r 1,
000
Reg
iste
red
Vehi
cles
2005-06 2006-07
Claim Frequency Trend Claim Frequency
2007-08 2008-09 2009-10 2010-11 2011-12 2012-13 2013-14 2014-15

5
The Hon. Peter Gutwein MP, Treasurer and the Hon. M.T. (Rene) Hidding MP, Minister for Infrastructure
In accordance with section 55 of the Government Business Enterprises Act 1995, we hereby submit for your information and presentation to Parliament the report of the Motor Accidents Insurance Board for the year ended 30 June 2015. The report has been prepared in accordance with the provisions of the Government Business Enterprises Act 1995.
Signed in accordance with a resolution of the Directors:
Dated: 17 September 2015
D W Challen AM
Chairman
D J McCarthyDirector
Statement of Compliance

6 MOTOR ACCIDENTS INSURANCE BOARD ANNUAL REPORT 2014-15
Corporate Governance
LEGISLATIVE AUTHORITY
The MAIB was established pursuant to the Act and is constituted as a GBE under section 6 of the Government Business Enterprises Act 1995 (GBE Act).
CORPORATE PLAN AND MINISTERIAL CHARTER
In accordance with the GBE Act, the MAIB has a Corporate Plan and a Ministerial Charter. The Corporate Plan provides a clear strategic direction for the organisation for the next four years, including estimated financial data.
CODE OF CONDUCT
As part of its commitment to service, conduct and disclosure, the MAIB has adopted codes of conduct and disclosure procedures to guide Directors and staff in carrying out their duties and responsibilities. The codes of conduct are reviewed annually and reflect the MAIB’s values. The codes of conduct are available to the public on the MAIB website.
RISK MANAGEMENT
The MAIB has in place a risk management framework including a Risk Management Policy, Risk Management Plan, Business Continuity Plan and a Disaster Recovery Plan.
Risk identification and management is conducted on a continual basis. A formal review of the risk profiles of all strategic areas and a compliance review of the Risk Management Plan and risk mitigators are conducted annually by senior management. Formal reporting of the risk management framework and internal risk mitigators is made to the Board through the Audit Committee.
PRICING POLICIES
The Tasmanian Economic Regulator (Regulator) provides independent pricing oversight for MAIB premiums. In 2013-14 following the Regulator’s recommendations, the maximum premium for each vehicle classification was set by the Tasmanian Government for a period of four years commencing 1 December 2013. Premiums for all vehicle classifications were reduced for the first year. No overall increases were applied for the year commencing 1 December 2014, although some classes of registration had relativity adjustments applied, in accordance with the Regulator’s recommendations.
PUBLIC INTEREST DISCLOSURES ACT 2002
The MAIB is committed to the aims and objectives of the Public Interest Disclosures Act 2002 (PID Act). It does not tolerate improper conduct by its employees or officers, or the taking of detrimental action against those who come forward to disclose such conduct.
Value is placed upon transparency and accountability in administrative and management practices and support is given to the making of disclosures that reveal the type of conduct to which the PID Act is directed. All reasonable steps are taken to protect people who make such a disclosure, from any detrimental action in reprisal for making the disclosure, and to protect their welfare. Natural justice is afforded to all parties involved in any investigation of a disclosure.
The MAIB is not aware of any improper conduct by any of its employees or officers and has not been the subject of any disclosures during 2014-15.
CEO PERFORMANCE REVIEW
A formal review of the CEO’s performance is conducted annually by Directors and covers the requirements under section 20B of the GBE Act. The review is based on specific criteria, including the MAIB’s business performance, achievement of strategic objectives, service delivery, leadership and risk management.
BOARD OF DIRECTORS
The composition of the Board of Directors (Board) is governed by section 11 of the GBE Act. The Chairman and Directors are appointed by the Governor on the recommendation of the Portfolio Minister and Treasurer (Shareholding Ministers).
The Board is responsible for the corporate governance and strategic direction of the MAIB, ensuring that its business and affairs are conducted and managed in accordance with sound commercial practice and are consistent with the goals specified in the Corporate Plan. The Board is responsible to the Shareholding Ministers for the operation and performance of the MAIB.

7
The four sub-committees established to assist the Board fulfil its corporate governance and oversight responsibilities are:
Audit Committee (Constituted in accordance with section 16 of the GBE Act)
The Committee meets on a regular basis and is structured to assist the MAIB in fulfilling its corporate governance and oversight responsibilities in relation to financial reports and financial reporting processes, internal control structures, risk management systems (financial and non-financial) and internal and external audit processes.
Claims Committee
The Claims Committee meets regularly and considers all settlement decisions on larger common law claims, approving damages between $300,000 and $750,000. The Board as a whole approves damages above $750,000.
Injury Prevention and Management Foundation (IPMF) Committee
The IPMF Committee assesses all project applications for IPMF funding that are received by the MAIB and provides recommendations to the Board as to which applications should be funded.
Nomination Committee
The Board acts as the Nomination Committee and is responsible for:
• considering the required skills and/or appointment of Directors;
• reviewing succession plans; and
• conducting the annual Board performance evaluation process.
BOARD PROCESSES
The MAIB has external and internal processes in place for performance assessments of the Board as a whole, its committees, individual Directors and the Chairman.
External Board assessments are undertaken every three years; the next assessment is to occur in 2015-16.
For annual internal evaluations, the Chairman and Directors provide confidential feedback and evaluations on each of the other members of the Board. Outcomes are delivered to Directors by the Chairman or nominated members of the Board. Internal Director evaluations were undertaken in 2014-15.
The Board gives consideration to the knowledge, expertise and skills required for any upcoming Director positions, whilst taking account of the current skill set of the Board.
The Board has a policy for induction, education and training to ensure that all Directors understand the MAIB’s corporate direction. Directors are required to participate in ongoing education and training.
If required, a Director may seek independent professional advice, at the MAIB’s expense, providing the issue has been raised with the Chairman or discussed at a Board meeting.
DISCLOSURE OF INTERESTS
Section 28 of the GBE Act provides a mechanism for the disclosure of interests of the Directors. The relevant interests of the Directors are disclosed at the monthly Board meetings.

8 MOTOR ACCIDENTS INSURANCE BOARD ANNUAL REPORT 2014-15
Board of Directors
Back (from left): Kim Barker, Danny McCarthy, Mike Dontschuk Front (from left): David St. John, Don Challen (Chairman), Mark Scanlon
DON CHALLEN AM BEc (Hons), MEc, FCA, FCPA, FAICD, FIPAA
Chairman (Independent)Appointed: 7 December 2010Member: Audit Committee IPMF Committee
Don Challen is an economist specialising in public finance. He is Chairman of the Tasmanian Public Finance Corporation, a Director of Tasmanian Networks Pty Ltd and Tasmanian Symphony Orchestra Holdings Ltd and a Trustee Director of the Retirement Benefits Fund. He is Independent Chair of the Audit and Risk Management Committee of the Independent Broad-Based Anti-Corruption Commission of Victoria.
Don was formerly Secretary of the Department of Treasury and Finance in Tasmania.
KIM BARKER BA, DipEd, MAICD
Director (Independent)Appointed: 15 September 2003Chairperson: Claims CommitteeMember: IPMF Committee
Kim Barker has a background in injury management as a rehabilitation consultant, counsellor and mediator.
Kim serves on a number of statutory tribunals and boards, including the Guardianship and Administration Board, the Parole Board, the Social Security Appeals Tribunal and the Tasmanian Board of the Medical Board of Australia. She is also a Director of the Relationships Australia (Tasmania) Board.

9
MICHAEL DONTSCHUK BSc (Hons), FFTP, MAICD
Director (Independent)Director: 1 May 2013Member: Claims Committee
Michael Dontschuk has over 30 years’ experience in investment, finance, treasury and financial risk management.
He is currently Group Treasurer with Grange Resources Limited and oversees all of their commercial activities as well as treasury. He has previously been Group Treasurer of ANZ Bank, Managing Director and CEO of Treasury Corporation Victoria, President and Director of the Finance and Treasury Association of Australia and worked in corporate debt advisory and investment banking.
Michael is also a Director of Australia Ratings.
DANNY MCCARTHY BEc (Hons), FCA
Director (Independent)Appointed: 1 February 2010Chairperson: Audit Committee (Appointed: 21 May 2015)
Danny McCarthy has been a partner at the Hobart based Chartered Accounting firm Wise Lord & Ferguson since 1989. Danny specialises in audit, having key expertise in the finance industry, business risk assessment and financial markets. He is currently the partner responsible for the audit of MyState Limited.
Danny is also a Board member of Tasracing Pty Ltd.
DAVID ST. JOHN BAgrSc, Grad Dip in App Fin & Invest, MBA, SF FIN, FAICD
Director (Independent)Appointed: 16 May 2011Member: Audit Committee
David St. John has spent the majority of his 30 year career in the financial services sector having held directorships and senior executive positions in superannuation, asset consulting and insurance companies.
He is currently an Expert Adviser, Investments & Superannuation at PricewaterhouseCoopers and is Investment Counsel to the Trustee at Legalsuper Pty Ltd.
MARK SCANLON BBus, MBA, FCPA, FAICD
Director (Independent)Appointed: 5 November 2007Term Expired: 25 May 2015Chairperson: Audit Committee (to 21 May 2015)
Mark Scanlon has over 30 years experience in the finance sector having held directorships and senior executive positions in banks, funds management companies, building societies, friendly societies and finance companies.
Mark was also Chairman of the Credit Ombudsman Service Limited, was a member of the Governing Council, Tasmanian Health Organisation – North (THO-N), Chairman of the THO-N Audit and Risk Committee and Independent Chairman of the Launceston City Council Audit Committee.
PETER ROCHE was an Executive Director until 4 February 2015.

10 MOTOR ACCIDENTS INSURANCE BOARD ANNUAL REPORT 2014-15
Statement of Corporate Intent

11
INTRODUCTION
This Statement of Corporate Intent (SCI) is a high level summary of the Corporate Plan and includes a performance agreement between the Board of the MAIB and the Shareholding Ministers.
The performance agreement details the key financial and non-financial targets for the MAIB for 2015-16, as agreed between the Board and the Shareholding Ministers through the Corporate Planning process. It also details estimates for the following three years.
The SCI has been prepared in accordance with the GBE Act.
STRATEGIC DIRECTION
The core business of the MAIB is to provide compulsory third party (CTP) personal injury motor accident insurance and deliver appropriate compensation to people injured in motor accidents. The MAIB is a specialised insurer offering one type of insurance.
The two main drivers of the business performance forecast are investment income and claims expense. The MAIB relies on professional advisors to provide best estimates for these inputs. Financial markets impact on investment revenue and economic events impact heavily on claims expense. It is therefore not possible to predict annual profits with certainty. Additionally, the business performance could be significantly affected should the dividend payable under the dividend policy be increased above 50%. The following strategic directions have been identified for the planning period:
1. Financial Management
To ensure that a balance exists between premium income, the cost of claims (including a prudential margin) and the requirement to achieve a sustainable commercial rate of return that maximises value for the State Government.
2. Accident Prevention and Injury Management
To reduce the number and severity of motor accidents in Tasmania, through contributions to appropriate road safety and injury management programs.
3. Claims and Rehabilitation
To have in place best practice solutions to meet the challenges in providing no fault insurance (with common law overlay).
4. Service to Claimants
To continually improve service to claimants.
5. Business Systems
To continually improve the efficiency, reliability and accuracy of business systems so as to increase business productivity, enhance customer service and support decision making.
6. Human Resources
To provide an efficient and well-motivated workforce capable of delivering quality service to all clients in accordance with the MAIB’s Vision, Mission and Values Statements.
Target2015-16
Estimates
2016-17 2017-18 2018-19
Financial Returns to Government
Dividends paid ($M) 47.2 46.2 45.6 35.3
Tax equivalents paid ($M) 22.9 11.1 1.8 1.5
Total 70.1 57.3 47.4 36.8
Financial TargetsFinancial result after tax ($M) 43.9 43.2 44.8 42.3
Funding ratio (%) 125.0 128.1 128.3 128.0
Return on equity (%) 8.0 10.0 10.4 9.8
Return on assets (%) 3.0 3.5 3.5 3.1
Real return on investments (%) 3.0 3.0 3.0 3.0
Premium increase (%) 3.0 4.0 4.0 4.0
Capital expenditure ($ ‘000) 460 460 490 460
Non-Financial TargetsClaim rate per 1,000 vehicles 6 6 6 6
Number of outstanding claims 2,500 2,500 2,500 2,500
Client satisfaction (%) 75 75 75 75
Staff satisfaction (%) 70 70 70 70
Premium affordability of AWOTE (%) 27.5 27.5 27.5 27.5
Operating costs against peers (%) <100 <100 <100 <100
PERFORMANCE AGREEMENT

12 MOTOR ACCIDENTS INSURANCE BOARD ANNUAL REPORT 2014-15
Claims Management
HIGHLIGHTS
2,847 new claims received.
$41.1 million in no fault statutory benefits paid.
245 common law claims settled.
41 settlement conferences attended by Claims Officers.
64% of referred Vocational Rehabilitation claimants returned to work.
BUSINESS PERFORMANCE
The number of new claims decreased by 2.6% in 2014-15, despite a 2.2% increase in insured vehicle numbers.
Younger drivers continued to be disproportionately represented in claims and are still three times as likely to be injured as drivers in their forties and fifties. While the longer term trend for younger drivers has shown significant improvement, the past three years have shown slight increases. Older drivers (those sixty and above) have shown an upward trend in injury rates over the past five years.
Total claim payments for 2014-15 were noticeably higher than previous years, reflecting a significant increase in the number of common law claims settled as well as the settlement of a large number of higher value common law claims. Together these accounted for an increase in common law payments of over $7 million. Future Care and scheduled benefits payments remained similar to 2013-14 levels.
Future Care payments made to catastrophically injured claimants under the MAIB’s no fault lifetime care scheme, have plateaued over the past five years due to reduced claim frequency, cost control initiatives such as the Support Needs Assessment program and some claimants exiting the scheme.
0
00
0.00
0.01
0.02
0.03
0.04
0.05
0.06
0.07
0.08
1993
-94
1994
-95
1995
-96
1996
-97
1997
-98
1998
-99
1999
-00
2000
-01
2001
-02
2002
-03
2003
-04
2004
-05
2005
-06
2006
-07
2007
-08
2008
-09
2009
-10
2010
-11
2011
-12
2012
-13
2013
-14
2014
-15
123456789
101112131415
10
20
30
40
50
60
70
80
90
100
0
400
800
1,200
1,600
2,000
2,400
2,800
3,200
3,600
4,000
Under 20 20-30 31-40 41-50 51-60 61-70 Over 70 2010-11 2011-12 2012-13 2013-14 2014-15
2010-11 2011-12
Hospital 23%
Neck 27%
Head 10%
Arm 16%
Trunk 19%
Fatalities 1% Leg 10%
Other 17%
Rehabilitation & Counselling 5%
Disability & Housekeeping Allowance 13%
Funeral & Death Benefits 4%
Medical/Allied Health/Attendant Care 56%
Damages 80%
Legal Fees 13%
Assessing & Investigations 2%Medical Reports &
Disbursements 6%
2012-13 2013-14 2014-15
2010-11 2011-12 2012-13 2013-14 2014-15
2
4
6
8
10
12
14
Cla
ims
per
1,00
0 lic
ence
s
Age Group
Financial Year
Pai
d $M
Pai
d $M
Financial Year
Financial Year
Financial Year
Rat
e pe
r 1,
000
Vehi
cles
Num
ber
Driver Claims Per 1,000 Licences 2014-15
Claim Payments Future Care Payments
Scheduled Benefits Payments 2014-15
Injuries 2014-15
Common Law Payments 2014-15
Fatalities per 1,000 Vehicles
Claims Received
Main Colours
Additional Colours

13
No fault scheduled benefits payments were dominated by hospital, medical and attendant care payments (together accounting for nearly 80% of all payments).
The payment mix for common law claims remained largely unchanged from the previous year. Notably, 80% of all common law payments were paid out as damages to claimants and only 13% was spent on legal expenses.
In 2014-15 there was a change in the mix of injuries suffered in motor accidents, with neck injuries down 5% (to 27%) and trunk and arm injuries each increasing by 3%. Neck injuries, commonly referred to as whiplash, have historically been the most significant type of injury suffered and while remaining the highest type in 2014-15, they did not dominate the injury mix.
The MAIB continued to achieve above target results from its vocational rehabilitation program, with 64% of claimants requiring assistance returned to work or redeployed. For those returning to their former employment, there was a 68% success rate.
TREATMENT PLANS AND REPORTING
During 2014-15 the MAIB, in conjunction with the allied health professional peak bodies, introduced contemporary reporting and updated the respective treatment plans to include:
• therapy goals and outcome measures;
• self management strategies to maximise recovery; and
• anticipated discharge dates from hands-on treatment.
The enhanced treatment plans are underpinned by the biopsychosocial model of injury management with an increased emphasis on evidence based practice.
0
00
0.00
0.01
0.02
0.03
0.04
0.05
0.06
0.07
0.08
1993
-94
1994
-95
1995
-96
1996
-97
1997
-98
1998
-99
1999
-00
2000
-01
2001
-02
2002
-03
2003
-04
2004
-05
2005
-06
2006
-07
2007
-08
2008
-09
2009
-10
2010
-11
2011
-12
2012
-13
2013
-14
2014
-15
123456789
101112131415
10
20
30
40
50
60
70
80
90
100
0
400
800
1,200
1,600
2,000
2,400
2,800
3,200
3,600
4,000
Under 20 20-30 31-40 41-50 51-60 61-70 Over 70 2010-11 2011-12 2012-13 2013-14 2014-15
2010-11 2011-12
Hospital 23%
Neck 27%
Head 10%
Arm 16%
Trunk 19%
Fatalities 1% Leg 10%
Other 17%
Rehabilitation & Counselling 5%
Disability & Housekeeping Allowance 13%
Funeral & Death Benefits 4%
Medical/Allied Health/Attendant Care 56%
Damages 80%
Legal Fees 13%
Assessing & Investigations 2%Medical Reports &
Disbursements 6%
2012-13 2013-14 2014-15
2010-11 2011-12 2012-13 2013-14 2014-15
2
4
6
8
10
12
14
Cla
ims
per
1,00
0 lic
ence
s
Age Group
Financial Year
Pai
d $M
Pai
d $M
Financial Year
Financial Year
Financial Year
Rat
e pe
r 1,
000
Vehi
cles
Num
ber
Driver Claims Per 1,000 Licences 2014-15
Claim Payments Future Care Payments
Scheduled Benefits Payments 2014-15
Injuries 2014-15
Common Law Payments 2014-15
Fatalities per 1,000 Vehicles
Claims Received
Main Colours
Additional Colours

14 MOTOR ACCIDENTS INSURANCE BOARD ANNUAL REPORT 2014-15
40 Years of the MAIB
1970s• The Motor Accidents Insurance Board (MAIB) was
established in June 1974 to administer a No Fault Compulsory Third Party Scheme.
• The Scheme commenced operating on 1 December 1974 under the Motor Accidents (Liabilities and Compensation) Act 1973 (the Act). The MAIB’s office was based in St John Street, Launceston.
• The Act replaced the previous privately underwritten compulsory third party system which had in its latter years been universally condemned for a multitude of deficiencies.
• Frederick Mitchell was appointed inaugural Chairman of the Board of Directors.
• Noel McCreary was appointed General Manager.
1980s• The Motor Accidents (Liabilities and Compensation)
Regulations 1980 (the Regulations) came into effect on 1 July 1980, with the Act and Regulations evolving during the 1980s and benefits and limitations defined in the Regulations from 1985.
• William Zeeman was appointed Chairman of the Board of Directors in 1983.
• Gordon Humphreys was appointed Chairman of the Board of Directors in 1984.
• Lawrie Caelli was appointed General Manager upon Noel McCreary’s retirement in 1986. Lawrie had joined the MAIB at its inception in 1974 and became Assistant General Manager in 1976.
• The Road Safety Strategy Committee (including MAIB representation) was formed in January 1987 in response to a need for a more coordinated and cost effective approach to road safety in Tasmania.

15
©re
thin
k en
viro
nmen
tal p
rint 5
0055
ANNUAL REPORT 2014-15MOTOR ACCIDENTS INSURANCE BOARD
MOTOR ACCIDENTS INSURANCE BOARD ANNUAL REPORT
ABN 93 610 406 210
Address Level 1, 33 George Street Launceston 7250, Tasmania Telephone (03) 6336 4800Toll Free 1800 006 224Facsimile (03) 6336 4848Email [email protected] www.maib.tas.gov.au
MOTOR ACCIDENTS INSURANCE BOARDProudly Promoting Road Safety in Tasmania
MOTOR ACCIDENTS INSURANCE BOARD
ANNUAL REPORT
You never know what’s around the corner...
2000s• The MAIB’s third residential group home,
“Lomandra”, was opened in Ulverstone in 2008.
• In 2009 the MAIB funded the first wire rope flexible safety barrier installation on Tasmanian roads (located between Bagdad and Dysart).
• Don Challen was appointed Chairman of the Board of Directors in 2010 upon the retirement of Gordon Humphreys. Gordon retired as Chairman after 26 years (and 29 years on the Board).
• In 2010, the RSTF was absorbed into a revamped Road Safety Advisory Council with the MAIB maintaining its representation.
• Paul Kingston was appointed Chief Executive Officer following the retirement of Peter Roche on 4 February 2015, the 19th anniversary of Peter’s commencement with the MAIB.
1990s• The Future Care Scheme was introduced in August
1991 to provide lifetime support for claimants who sustain significant and permanent disabilities.
• The MAIB purchased and relocated its operations to 33 George Street, Launceston in 1992.
• The MAIB purchased, renovated and opened its first long term care house “Alhambra” at Otago Bay in 1993 (no longer operational).
• The Injury Prevention and Management Foundation was established in 1994.
• The MAIB’s first purpose built residential group home “Cay-Lea” was opened near Hobart in 1995. The second group home, “Neena”, was opened in Launceston in 1996. These facilities were designed to accommodate and support claimants who sustained a catastrophic injury resulting in permanent disability.
• On 1 July 1995, the MAIB changed from a statutory authority to a Government Business Enterprise under the GBE Act 1995.
• Peter Roche commenced as Chief Executive Officer in 1996 following the retirement of Lawrie Caelli.
• The Road Safety Task Force (RSTF) was established in 1996, with MAIB represented on the RSTF. The focus of the RSTF was education and enforcement to bring about a change of culture in Tasmanian motorists.
• A new purpose built claims management system “MACS” (Motor Accidents Claims System) was implemented in 1999.
2010 - 2011 ANNUAL REPORT

16 MOTOR ACCIDENTS INSURANCE BOARD ANNUAL REPORT 2014-15
The MAIB’s Injury Prevention and Management Foundation (IPMF) was established to fund research and education and to service development programs that are directed towards the prevention and improved management of injuries resulting from motor accidents. The IPMF is funded by the MAIB setting aside up to 1% of gross annual premiums.
Project applications are assessed by the IPMF Committee against a number of criteria, which include the likelihood of success, the benefits to people injured in motor accidents and sustainability.
Through the funding of projects, the MAIB aims to achieve:
• a reduction in the frequency and severity of injuries from motor accidents;
• improved access to quality medical, rehabilitation and long term care services;
• new developments/techniques in injury management; and
• minimisation of the costs of the CTP insurance scheme to the Tasmanian community.
The total funding committed through the IPMF during 2014-15 (including the Charities Committee) was $732,000.
IPMF PROJECTS FUNDED IN 2014-15
The IPMF projects funded in 2014-15 were:
• University of Tasmania School of Medicine - Wilderness Skills Weekend (training for UTAS medical and paramedic students);
• Critical Incident Stress Management Committee - Road Trauma Critical Incident Stress Management Support Program (for emergency service personnel);
• Kingborough Council - Lower Travel Speeds (use of an individual speed trailer placed in targeted areas);
• Yolla District High School - All Terrain Vehicle Training and Driver Education (for Year 10 students);
• Elizabeth College - Safety Matters (driver safety, similar to learner driver mentor programs);
• Rotary International District 9830 Inc - The Rotary Youth Driver Awareness Program (RYDA);
• Department of State Growth - Raising awareness of the impact of medical conditions on the ability and capacity to drive safely;
• Geeveston Community Centre Inc – Jumpstart (volunteer learner driver mentor program for socially disadvantaged youth);
• Australian Physiotherapy Association - Forum and Workshop on Neck Pain and Whiplash;
• Jordan River Learning Federation - ATV Training – Youth on the Land; and
• Kentish Council – Traffic and Bike Education Program (for primary school students).
CHARITIES COMMITTEE
The MAIB supports a number of charitable organisations on an annual basis through the IPMF Charities Committee. Each organisation is responsible for utilising the allocated funding to best meet the needs of the organisation and its clientele, as well as being accountable to the MAIB through formal reporting and meetings.
Recipients of funding during 2014-15 were:
• Brain Injury Association of Tasmania;
• Headway North West Tasmania Inc.;
• Headway Rebuilding Lives;
• Paraplegic and Quadriplegic Association of Tasmania Inc.;
• Road Trauma Support Team (Tasmania) Inc.; and
• Tasmanian Acquired Brain Injury Services Inc.
Injury Prevention and Management Foundation

17
Community Service
ROAD SAFETY ADVISORY COUNCIL (RSAC)
The RSAC comprises a wide range of organisations involved in road safety throughout Tasmania. The RSAC aims to advise, influence and support Government policy on road safety for the betterment of all Tasmanians.
The MAIB funds an enforcement and public education strategy, which is governed by a sub-committee of the RSAC. The strategy brings together the Department of State Growth, Tasmania Police and the MAIB. Since the inception of the RSAC, the number of serious injury claims received by the MAIB has decreased consistently relative to the number of vehicles registered in Tasmania. Legislation introduced over this period has also had a positive impact on reducing the number of serious injuries.
The RSAC has grown in profile and research conducted has concluded that the RSAC is perceived by the Tasmanian community as the premier and authoritative independent face of road safety.
MOTORCYCLE ROAD SKILLS COURSE
The MAIB continues to provide subsidised refresher training for Tasmanian motorcyclists to improve their riding skills and decrease the likelihood of involvement in motor accidents. The Motorcycle Road Skills Course is designed for licensed riders wanting to improve their skills for safer motorcycle riding and is suitable for riders who are inexperienced or have low confidence levels, as well as those returning to motorcycle riding after a prolonged absence.
The course is available to eligible motorcyclists at a maximum cost of $50 per participant.
TASMANIAN COMMUNITY ACHIEVEMENT AWARDS
The MAIB continued its sponsorship of the Disability Achievement Award category of the Tasmanian Community Achievement Awards.
The 2014 MAIB Disability Achievement Award was awarded to Duncan Meerding of North Hobart. Duncan was diagnosed as legally blind at the age of 18. Now 27, Duncan is a successful furniture maker and lighting designer with his own business. He regularly showcases his work at shows, exhibitions and competitions. The inspiration for his work comes from the natural environment with a focus on utilising discarded timber.
One of Duncan’s most popular designs is a range of Cracked Log Light products and like many of his designs, it is representative of how he interprets things. Duncan has successfully established his designs in the national retail and specification market and has won many awards.
METRO NIGHTRIDER
For the sixth consecutive year, the MAIB partnered with Metro by providing sponsorship for the promotion and provision of the “Nightrider” late night bus service for New Year’s Eve across Hobart, Launceston and Burnie.
SUPPORT FOR COMMUNITY GROUPS
During 2014-15, $13,650 in financial support was provided to a number of community groups, including:
• Tasmanian Motorcycle Council;
• Northern Motorcycle Riders Association;
• Self Help Friendship Ball; and
• Diabetes Australia.

18 MOTOR ACCIDENTS INSURANCE BOARD ANNUAL REPORT 2014-15
Human Resources
The MAIB strives to maintain an efficient, well motivated and competent workforce which is capable of delivering a quality service in accordance with the MAIB’s Vision and Mission Statements and Values.
ENTERPRISE AGREEMENT
The wages and conditions for MAIB staff are provided for under the MAIB and FSU Enterprise Agreement 2013 (Agreement). The Agreement was approved by the Fair Work Commission on 28 October 2013. The Agreement includes retention initiatives, flexible family and annual leave entitlements and health and wellbeing incentives.
STAFF ETHICS
The MAIB has a Staff Code of Conduct (Code), to which all employees must adhere. The Code is reviewed on an annual basis and updated accordingly. All employees must sign an agreement stating that they have read the Code and will abide by it and advise their manager immediately of any known conflicts of interest that may arise.
WORKPLACE EQUITY
The MAIB is committed to equal opportunity and equity principles. It has an Equal Employment Opportunity (EEO) Policy and two Workplace Contact Officers are appointed to assist staff as required. The MAIB is an EEO employer and ensures compliance with all relevant legislation.
TRAINING AND DEVELOPMENT
The MAIB is committed to the professional development of all staff members through programs that focus on specific skills and general development. The MAIB has taken the opportunity to utilise the skills and expertise of a number of stakeholders, primarily legal professionals, to provide training on issues related to the MAIB’s core business.
HEALTH, SAFETY AND WELFARE
The MAIB has a Health and Safety Committee which ensures that every effort is made to identify risks and address any issues promptly.
An Employee Assistance Program is available to all staff, offering counselling services for both work and personal issues.
WORKFORCE
The MAIB has an average workforce of 35 FTEs, which includes 17 part time staff (who are predominantly working parents).
EMPLOYEE SUPPORT FOR CHARITIES
The MAIB and its staff supported a variety of charities throughout the year.
• Red Cross Meals on Wheels - MAIB staff continue to support Red Cross by undertaking fortnightly Meals on Wheels deliveries on a rostered basis;
• Casual Clothes Day donations - Casual clothes day occurs once a month to raise funds for charities nominated by staff members. Charities supported included Launceston Benevolent Society, Big Ears Animal Sanctuary, Rural Help @ Hand and Launceston Women’s Shelter;
• Women’s 5km Walk/Run - The MAIB provided sponsorship for staff members to participate in the Women’s 5km walk/run held in Launceston. The annual event raises funds for breast cancer research;
• Samaritan’s Purse Operation Christmas Child – MAIB employees have continued to participate in this unique project which provides gift filled “shoe boxes” to needy children in over 100 countries; and
• Pollie Pedal - The MAIB again sponsored staff members to participate in Pollie Pedal 2015, a cycling event which raises awareness and funds for Diabetes Tasmania. This was the 10th anniversary of the event, with riders visiting Cambridge, New Norfolk, Mount Wellington and the Huon Valley during the three day ride.
19
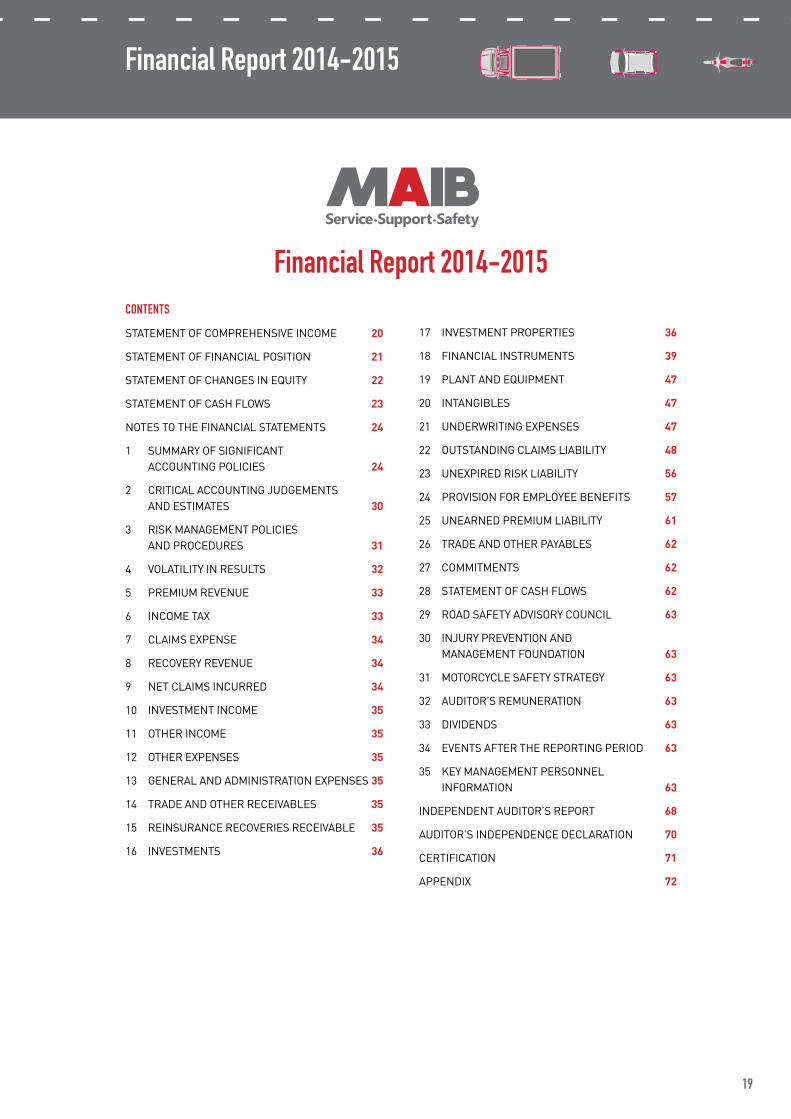
CONTENTS
STATEMENTOFCOMPREHENSIVEINCOME 20
STATEMENTOFFINANCIALPOSITION 21
STATEMENTOFCHANGESINEQUITY 22
STATEMENTOFCASHFLOWS 23
NOTESTOTHEFINANCIALSTATEMENTS 24
1 SUMMARYOFSIGNIFICANTACCOUNTINGPOLICIES 24
2 CRITICALACCOUNTINGJUDGEMENTSANDESTIMATES 30
3 RISKMANAGEMENTPOLICIESANDPROCEDURES 31
4 VOLATILITYINRESULTS 32
5 PREMIUMREVENUE 33
6 INCOMETAX 33
7 CLAIMSEXPENSE 34
8 RECOVERYREVENUE 34
9 NETCLAIMSINCURRED 34
10 INVESTMENTINCOME 35
11 OTHERINCOME 35
12 OTHEREXPENSES 35
13 GENERALANDADMINISTRATIONEXPENSES35
14 TRADEANDOTHERRECEIVABLES 35
15 REINSURANCERECOVERIESRECEIVABLE 35
16 INVESTMENTS 36
17 INVESTMENTPROPERTIES 36
18 FINANCIALINSTRUMENTS 39
19 PLANTANDEQUIPMENT 47
20 INTANGIBLES 47
21 UNDERWRITINGEXPENSES 47
22 OUTSTANDINGCLAIMSLIABILITY 48
23 UNEXPIREDRISKLIABILITY 56
24 PROVISIONFOREMPLOYEEBENEFITS 57
25 UNEARNEDPREMIUMLIABILITY 61
26 TRADEANDOTHERPAYABLES 62
27 COMMITMENTS 62
28 STATEMENTOFCASHFLOWS 62
29 ROADSAFETYADVISORYCOUNCIL 63
30 INJURYPREVENTIONANDMANAGEMENTFOUNDATION 63
31 MOTORCYCLESAFETYSTRATEGY 63
32 AUDITOR’SREMUNERATION 63
33 DIVIDENDS 63
34 EVENTSAFTERTHEREPORTINGPERIOD 63
35 KEYMANAGEMENTPERSONNELINFORMATION 63
INDEPENDENTAUDITOR’SREPORT 68
AUDITOR’SINDEPENDENCEDECLARATION 70
CERTIFICATION 71
APPENDIX 72
Financial Report 2014-2015
Financial Report 2014-2015

20 MOTOR ACCIDENTS INSURANCE BOARD ANNUAL REPORT 2014-15
Statement of Comprehensive IncomeFor the year ended 30 June 2015
Note 2015 $’000
2014$’000
Continuing operations
Premiumrevenue 5 134,465 139,539
Outwardsreinsuranceexpense (5,840) (6,025)
128,625 133,514
Claimsexpense 7 (104,342) (124,602)
Recoveryrevenue 8 3,696 4,767
Unexpiredriskexpense 23 (912) (912)
Underwritingexpenses 21 (2,798) (2,631)
Underwriting result 24,269 10,136
Investmentincome 10 124,922 172,627
Investmentexpenses 10 (2,034) (1,633)
Otherincome 11 491 587
Otherexpenses 12 (401) (446)
Generalandadministrationexpenses 13 (5,926) (5,783)
RoadSafetyAdvisoryCouncil 29 (3,541) (3,480)
InjuryPreventionandManagementFoundation 30 (585) (55)
MotorcycleSafetyStrategy 31 (2) (11)
Profit/(loss) before tax 137,193 171,942
Tax(expense)/benefit 6 (37,328) (46,444)
Profit/(loss) from continuing operations 99,865 125,498
Other comprehensive income
Items that will not be reclassified to profit or loss
Definedbenefitplanactuarialgains/(losses) 24 637 (450)
Tax(expense)/benefitonothercomprehensiveincome 6 (191) 135
Other comprehensive income net of tax 446 (315)
Total comprehensive result 100,311 125,183
The above statement should be read in conjunction with the accompanying notes.

21
Statement of Financial PositionAs at 30 June 2015
Note 2015 $’000
2014$’000
Assets
Cashandcashequivalents 18 267,962 286,658
Tradeandotherreceivables 14 1,789 1,357
Investments 16 1,194,206 1,217,826
Prepaidtax 6 1,789 -
Reinsurancerecoveriesreceivable 15 24,418 22,336
Plantandequipment 19 440 572
Investmentproperties 17 14,630 14,605
Intangibles 20 262 339
Total assets 1,505,496 1,543,693
Liabilities
Tradeandotherpayables 26 2,101 2,056
Provisionfortax 6 - 39,209
Netdeferredtaxliability 6 17,707 471
Unearnedpremiumliability 25 58,584 56,274
Unexpiredriskliability 23 2,403 1,486
Outstandingclaimsliability 22 975,464 952,683
Provisionforemployeebenefits 24 5,208 5,687
Otherfinancialinstruments 18 3,908 1,447
Total liabilities 1,065,375 1,059,313
Net assets 440,121 484,380
Equity
Retainedearningsattributabletoequityholders 440,121 484,380
Total equity 440,121 484,380
The above statement should be read in conjunction with the accompanying notes.

22 MOTOR ACCIDENTS INSURANCE BOARD ANNUAL REPORT 2014-15
Statement of Changes in EquityFor the year ended 30 June 2015
2015 $’000
2014$’000
Retainedearningsattributabletoequityholdersatbeginningofyear 484,380 382,416
Profit/(loss)fromcontinuingoperations 99,865 125,498
Othercomprehensiveincomenetofincometax 446 (315)
Total comprehensive result 100,311 125,183
Dividendspaid (144,570) (23,219)
Retained earnings attributable to equity holders at end of year 440,121 484,380
The above statement should be read in conjunction with the accompanying notes.

23
Statement of Cash FlowsFor the year ended 30 June 2015
Note 2015 Inflows (Outflows)
$’000
2014Inflows(Outflows)
$’000
Cash flows from operating activities
Premiumsreceived 150,043 150,155
Reinsuranceandotherrecoveriesreceived 1,660 8,939
Dividendsreceived 39,957 29,805
Interestreceived 13,946 10,837
Rentreceived 539 611
Otherinvestmentrevenuereceived 1,261 1,744
Claimspaid (87,049) (79,050)
Reinsurancepaid (6,246) (6,283)
Otherclaimpayments (355) (362)
Underwritingexpensespaid (3,072) (2,967)
Generalandadministrationexpensespaid (5,687) (5,491)
Otherexpenses (256) (244)
Investmentexpensespaid (2,097) (1,606)
RoadSafetyAdvisoryCouncil (3,896) (3,828)
MotorcycleSafetyStrategy (2) (11)
InjuryPreventionandManagementFoundation (729) (752)
Taxequivalentpaid (61,281) (9,874)
Goodsandservicestaxpaid (6,464) (7,067)
Net cash from operating activities 28 30,272 84,556
Cash flows used in investing activities
Purchaseofinvestments (217,533) (1,574,313)
Saleofinvestments 313,385 1,661,534
Purchaseofinvestmentproperty (71) -
Purchaseofplantandequipment (229) (229)
Purchaseofintangibles (25) (17)
Saleofplantandequipment 75 20
Net cash flows used in investing activities 95,602 86,995
Cash flows used in financing activities
Dividendspaid (144,570) (23,219)
Net cash flows used in financing activities (144,570) (23,219)
Net increase/(decrease) in cash and cash equivalents held (18,696) 148,332
Cashandcashequivalentsatthebeginningofthefinancialyear 286,658 138,326
Cash and cash equivalents at the end of the financial year 18 267,962 286,658
The above statement should be read in conjunction with the accompanying notes.

24 MOTOR ACCIDENTS INSURANCE BOARD ANNUAL REPORT 2014-15
Notes to the Financial StatementsFor the year ended 30 June 2015
TheMotorAccidentsInsuranceBoard(MAIB)wasestablishedandisgovernedbytheMotor Accidents (Liabilities and Compensation) Act 1973.The
MAIBisafor-profitTasmanianGovernmentBusinessEnterprise,thepurposeofwhichistoadministerthefundingandpaymentofcompulsory
thirdpartymotoraccidentcompensationtoeligiblepeoplewhohavebeeninjuredinamotoraccident.
TheMAIBisdomiciledinAustraliaanditsprincipalplaceofbusinessisLevel1,33GeorgeStreet,Launceston,Tasmania7250.
1 Summary of significant accounting policies
(a) Statement of compliance
ThefinancialstatementsaregeneralpurposefinancialstatementspreparedinaccordancewithAustralianAccountingStandardsand
Interpretations,theGovernment Business Enterprises Act 1995,andtheTreasurer’sInstructionsandGuidelines.
ThefinancialstatementsalsocomplywithInternationalFinancialReportingStandards(IFRS)asissuedbytheInternationalAccounting
StandardsBoard(IASB).
ThefinancialstatementscovertheMAIBfortheyearended30June2015andwerecertifiedandauthorisedforissuebytheBoardof
Directorson12August2015.
(b) Basis of preparation
Thefinancialstatementshavebeenpreparedonthebasisofhistoricalcostsand,exceptwherestated,donottakeintoaccountcurrent
valuationsofassets.Costisbasedonthefairvaluesoftheconsiderationgiveninexchangeforassets.Thefinancialstatementsare
presentedinAustraliandollars.
IntheapplicationofAustralianAccountingStandards,managementisrequiredtomakejudgements,estimatesandassumptionsabout
carryingvaluesofassetsandliabilitiesthatarenotreadilyapparentfromothersources.Theestimatesandassociatedassumptionsare
basedonhistoricalexperienceandvariousotherfactorsthatarebelievedtobereasonableunderthecircumstance,theresultsofwhich
formthebasisofmakingthejudgements.Actualresultsmaydifferfromtheseestimates.
Theestimatesandunderlyingassumptionsarereviewedonanongoingbasis.Revisionstoaccountingestimatesarerecognisedinthe
periodinwhichtheestimatesarerevisediftherevisionaffectsonlythatperiod,orintheperiodoftherevisionandfutureperiodsifthe
revisionaffectsbothcurrentandfutureperiods.
JudgementsmadebymanagementintheapplicationofAustralianAccountingStandardsthathavesignificanteffectsonthefinancial
statementsandestimateswithasignificantriskofmaterialadjustmentsaredisclosedinnote2.
Thestatementoffinancialpositionispresentedonaliquiditybasis,asprovidedforinAASB101PresentationofFinancialStatements
wherebyallassetsandliabilitiesarepresentedinorderofliquidity.ItisdeemedbytheBoardofDirectorsthatthismethodofdisclosure
providesinformationthatismorerelevantandreliablethanthetraditionalcurrent/non-currentclassifications.Unlessotherwise
disclosed,anassetorliabilityisexpectedtoberecoveredeitherwhollywithin12monthsorwhollysubsequenttothisperiod.
Australian Accounting Standards issued but not yet effective
Certainnewaccountingstandardsandinterpretationshavebeenpublishedthatarenotmandatoryforthereportingperiodended30
June2015.TheMAIBhasnotadoptedthefollowingstandardsearlywhenpreparingthe2014-15financialstatementsandwillapplythem
fortheannualreportingperiodsbeginningonoraftertheeffectivedatessetoutbelow.MAIBhasreviewedthependingstandardsand
considerthefollowingstandardsmayapply.StandardsthatarenotconsideredrelevanttotheMAIBhavenotbeenincluded.
(i) AASB 9 Financial Instruments, AASB 2009-11 Amendments to Australian Accounting Standards arising from AASB 9, AASB 2010-7
Amendments to Australian Accounting Standards arising from AASB 9, AASB 2012-6 Amendments to Australian Accounting Standards
– Mandatory Effective Date of AASB 9 and Transition Disclosures and AASB 2013-9 Amendments to Australian Accounting Standards –
Conceptual Framework, Materiality and Financial Instruments (effective from 1 January 2018)
AASB9FinancialInstrumentsaddressestheclassification,measurementandde-recognitionoffinancialassetsandfinancial
liabilities.Thestandardisnotapplicableuntil1January2018butisavailableforearlyadoption.Initialreviewhasindicatedthatthere
isnotexpectedtobeasignificantimpactontheMAIB’sfinancialstatementsfromadoptingthestandards.

25
Notes to the Financial StatementsFor the year ended 30 June 2015
1 Summary of significant accounting policies continued
(ii) AASB 15 Revenue from Contracts with Customers
AASB15establishesprinciplesforreportingusefulinformationaboutthenature,amount,timinganduncertaintyofrevenueand
cashflowsarisingfromanentity’scontractswithcustomers.Thisstandardisnotapplicableuntil1January2017butisavailable
forearlyadoption.Uponreviewingtherequirementsofthisstandard,thereisnotexpectedtobeasignificantimpactontheMAIB’s
financialstatements.
Theaccountingpoliciessetoutbelowhavebeenappliedinpreparingthefinancialstatementsfortheyearended30June2015andthe
comparativeinformationpresentedinthefinancialstatementsfortheyearended30June2014.
(c) Income tax
UndertheprovisionsoftheGovernment Business Enterprises Act 1995,theMAIBisrequiredtopayincometaxequivalentstotheState
GovernmentundertheNationalTaxEquivalentRegime(NTER).
Theincometaxexpenseorrevenuefortheperiodisthattaxpayableonthecurrentperiod’staxableincomebasedonthetaxrateof
30%,adjustedbychangesindeferredtaxassetsandliabilitiesattributabletotemporarydifferencesbetweenthetaxbasesofassets
andliabilitiesandtheircarryingamounts.
Deferredtaxliabilitiesarerecognisedforalltaxabletemporarydifferences.Deferredtaxassetsarerecognisedtotheextentthatitis
probablethatsufficienttaxableamountswillbeavailableagainstwhichdeductibletemporarydifferencesorunusedtaxlossesandtax
offsetscanbeutilised.
Deferredtaxassetsandliabilitiesaremeasuredattaxratesthatareexpectedtoapplytotheperiodwhentheassetsandliabilities
givingrisetothemarerealisedorsettled,basedontaxratesthathavebeenenactedbyreportingdate.Themeasurementofdeferred
taxliabilitiesandassetsreflectsthetaxconsequencesthatwouldfollowfromthemannerinwhichtheMAIBexpects,atreportingdate,
torecoverorsettlethecarryingamountofitsassetsandliabilities.
DeferredtaxassetsandliabilitiesareoffsetastheMAIBsettlesitscurrenttaxassetsandliabilitiesonanetbasis.
NTERinstalmentsarepaidmonthly.Abalancingpaymentismadesubsequenttoyearendfollowingfinalisationofthetaxposition.
Wheretheinstalmentspaidexceedthetaxliabilitynobalancingpaymentisrequired.Excessinstalmentpaymentsareretainedbythe
StateGovernmentandoffsetagainstfuturetaxobligations.
(d) Dividends
DividendsarepayableannuallytotheStateGovernment,inaccordancewiththeGuidelinesforTasmanianBusinesses-Dividends.
Dividendsarebroughttoaccountinthefinancialstatementsintheyearinwhichtheyaredeclared.
SpecialdividendsarebroughttoaccountinthefinancialstatementsintheyearinwhichthedividendreceivesParliamentaryapproval.
(e) Premium revenue
Premiumrevenueconsistsofcompulsorythirdpartyinsurancepremiumspaidbymotorvehicleowners.Premiumsareleviedatthe
ratesprescribedunderthePremiumsOrder(s)applicableduringtheyear.
PremiumrevenueiscollectedonbehalfoftheMAIBunderaservicelevelagreementwiththeDepartmentofStateGrowth.Premium
collectionfeesareleviedunderthisagreementandrecognisedasunderwritingexpensesinthestatementofcomprehensiveincome.
Theearnedportionofthepremiumschargedisrecognisedasrevenuefromthedateofattachmentofrisk.Thepatternofrecognition
overthepolicyperiodisbasedontime,whichisconsideredtoapproximatecloselythepatternofrisksunderwritten.Unearnedpremiums
representtheproportionofpremiumswrittenwhichrelatetoperiodsofinsurancesubsequenttobalancedate.
26 MOTOR ACCIDENTS INSURANCE BOARD ANNUAL REPORT 2014-15
Notes to the Financial StatementsFor the year ended 30 June 2015
1 Summary of significant accounting policies continued
(f) Deferred acquisition costs
Acquisitioncostsincurredincollectingpremiumsaredeferredandrecognisedasassetswheretheycanbereliablymeasuredandwhere
itisprobablethattheywillgiverisetopremiumrevenuethatwillberecognisedinthestatementofcomprehensiveincomeinsubsequent
reportingperiods.
Deferredacquisitioncostsareamortisedsystematicallyinaccordancewiththeexpectedpatternoftheincidenceofriskunderthe
policiestowhichtheyrelate.Thispatternofamortisationcorrespondstotheearningpatternofthepremiumrevenue.
(g) Outstanding claims liability
Theoutstandingclaimsliabilitycoversclaimsincurredbutnotyetpaid,claimsincurredbutnotreportedandtheanticipateddirectclaims
handlingexpensesofsettlingthoseclaims.
Thisliabilityiscalculatedasthepresentvalueoftheexpectedfuturepaymentsagainstclaimsincurred,reflectingthefactthatallthe
claimsdonothavetobepaidoutintheimmediatefuture.Theexpectedfuturepaymentsarecalculatedbasedontheultimatecostof
settlingclaims,whichincludestheanticipatedeffectsofinflation,thegoodsandservicestaxandotherfactors.Theexpectedfuture
paymentsarethendiscountedtoapresentvalueatthebalancedateusingmarketdeterminedriskfreediscountrates.
Claimshandlingexpensesincludethecostofmanagingclaimssuchasadministrationexpensesandprofessionalfeesthatarenot
otherwisedirectlyallocatedtoindividualclaims.
Indeterminingtheoutstandingclaimsliability,ariskmarginisaddedtothetotalofthenetcentralestimateofthediscountedfuture
claimpaymentsplustheestimatedclaimshandlingexpenses.Theadditionoftheriskmarginrecognisestheinherentuncertainties
containedwithintheactuarialvaluationandprovidesaprobabilitynotlessthan75%(2014:notlessthan75%)thattheliabilityis
sufficienttomeetthecostofclaimsincurred.The75%basisisarecognisedindustrybenchmarkinAustralia,beingtheminimum
probabilityofadequacyrequiredforAustralianlicensedinsurersbytheAustralianPrudentialRegulationAuthority.
Theallowancesforclaimshandlingexpensesandtheriskmarginhavebeendeterminedfortheschemeasawhole.Forreporting
purposestheyhavebeenapplieduniformlytoeachbenefittype.
(h) Unexpired risk liability
Ateachreportingdatetheunearnedpremiumliabilityisactuariallyassessedtodetermineifitissufficienttocoverallexpectedfuture
cashflowsrelatingtofutureclaimsagainstcurrentinsurancecontracts.Thisassessmentisreferredtoastheliabilityadequacytest.If
thepresentvalueoftheexpectedfuturecashflowsrelatingtofutureclaimsplusclaimshandlingexpensesandariskmarginexceeds
theunearnedpremiumliability,thentheunearnedpremiumliabilityisdeemedtobedeficient.Thedeficiencyisinitiallyaccountedforby
awrite-downindeferredacquisitioncostswithanyremainingdeficiencyrecognisedasanunexpiredriskliability.
Ariskmarginisappliedtoachievethesame75%probabilityofsufficiencyforfutureclaimsasisachievedbytheestimateofthe
outstandingclaimsliability.
Themovementinthedeficiencynetofreinsuranceisrecognisedinthestatementofcomprehensiveincome.
(i) Outwards reinsurance
Premiumcededtoreinsurersisrecognisedasoutwardsreinsuranceexpensefromtheattachmentdateovertheperiodofindemnityof
thereinsurancecontractinaccordancewiththeexpectedpatternoftheincidenceofrisk.
(j) Investments
Allinvestmentsareheldtobackinsuranceliabilitiesandaredesignatedatfairvaluethroughprofitorloss.
InvestmentsarerecognisedonthedatetheMAIBbecomesapartytothecontractualprovisionsofthefinancialinstrument.Initial
recognitionisatfairvaluewithanyresultantgainsorlossesrecognisedinprofitorloss.

27
Notes to the Financial StatementsFor the year ended 30 June 2015
1 Summary of significant accounting policies continued
Dividendsarerecognisedasrevenuewhentherighttoreceivepaymentisestablished.Interestincomeisrecognisedonanaccrual
basis.Differencesbetweenthenetfairvaluesofinvestmentsatthereportingdateandtheirnetfairvaluesatthepreviousreportingdate
(orcostofacquisition,ifacquiredduringthefinancialyear)arerecognisedasarevenueorexpenseinthestatementofcomprehensive
incomeinthereportingperiodinwhichthechangesoccur.
Investmentsarederecognisedwhentherightstoreceivecashflowsfromthefinancialassetshaveexpiredorhavebeentransferredand
theMAIBhastransferredsubstantiallyalltherisksandrewardsofownership.Anygainsorlossesarisingonderecognitionareincluded
inprofitorlossintheyeartheassetisderecognisedasrealisedgainsorlossesonfinancialinstruments.
Fair value
DetailsofthefairvalueoftheMAIB’sinvestmentsarelistedbelow:
•Cashandcashequivalentassetsarecarriedatfacevaluewhichapproximatestheirfairvalue.
•Securitiesthatarelistedortradedonanexchangearemarkedtomarketbasedonquotedbidpricesatthereportingdate.
•Unitsinunlistedtrustsarevaluedatredemptionvalueperunitasreportedbythemanagersofsuchfundsatthereportingdate.
•Fixedinterestsecuritiesaremarkedtomarketusingquotedbidpricesatthereportingdate.
•Derivativesarevaluedatfairvalueatreportingdatebasedonpublishedmarketquotationsormarketvaluationrates.
(k) Derivatives
Derivativeinstrumentsarefinancialcontractswhosevaluedependon,orarederivedfrom,thechangeinaspecifiedinterestrate,
financialinstrumentprice,commodityprice,foreignexchangerate,indexofpricesorrates,acreditratingorcreditindex,orsimilar
variable.Anygainorlossfromremeasuringofderivativefinancialinstrumentsisrecognisedinprofitorloss.
TheMAIBanditsfundmanagersareauthorisedtoinvestinderivativefinancialinstrumentssubjecttothosederivativescomplying
withtheguidelinessetoutintheMAIB’sInvestmentPolicyStatement.Derivativefinancialinstrumentsincludefutures,forwardcontracts,
optionsandinterestrateswaps.Derivativesmaybeusedasanalternativetobuyingorsellingthephysicalsecurity,asariskmanagement
toolortomanageexposuretorelevantmarkets.Derivativesmaynotbeusedinaspeculativemannerorforgearingtheinvestment
portfolio.Derivativesarevaluedatfairvalueatreportingdatebasedonpublishedmarketquotationsormarketvaluationrates.
(l) Investment properties
Investmentpropertiesareheldtoearnrentalincomeand/orcapitalappreciation.Theyareinitiallyrecordedatcostatthedate
ofacquisitionandaresubsequentlymeasuredatfairvalueatreportingdate.Fairvalueisdeterminedonthebasisofanannual
independentvaluationpreparedbyexternalvaluerswhichisbasedpredominantlyonmarketevidence.Gainsorlossesarisingfrom
changesinfairvalueareincludedinthestatementofcomprehensiveincomefortheperiodinwhichtheyarise.Thefairvaluesare
recognisedinthestatementoffinancialpositionandarereviewedattheendofeachreportingperiodtoensurethatthecarryingvalueof
investmentpropertiesisnotmateriallydifferentfromtheirfairvalues.
(m) Trade and other receivables
Tradeandotherreceivablesarerecognisedatamortisedcostlessimpairment.Theyaredueforsettlementnomorethan30daysfrom
thedateofrecognition.

28 MOTOR ACCIDENTS INSURANCE BOARD ANNUAL REPORT 2014-15
Notes to the Financial StatementsFor the year ended 30 June 2015
1 Summary of significant accounting policies continued
(n) Reinsurance recoveries receivable
ReinsurancerecoveriesreceivableareassessedbytheMAIB’sreinsurancebrokeronatleastanannualbasis.Areceivableisrecorded
wheretheactualorestimatedcostofclaimsexceedsthereinsurancedeductible.Therecoverableamountforreinsurancerecoveries
receivableismeasuredasthepresentvalueoftheexpectedfuturecashflows.Aprovisionforimpairmentisestablishedwherethereis
objectiveevidencethattheMAIBwillnotbeabletocollectthetotalreinsurancerecoveryamountsowing.
(o) Trade and other payables
Tradeandotherpayablesarerecognisedatcostandrepresentamountsowingforgoodsandservicesprovidedpriortotheendof
thefinancialyearandwhichareunpaidasatthereportingdate.Theamountsareunsecuredandareusuallypaidwithin30daysof
recognition.
(p) Plant and equipment
Plantandequipmentisstatedathistoricalcostlessaccumulateddepreciation.Historicalcostsincludeexpenditurethatisdirectly
attributabletotheacquisitionoftheitems.
Subsequentcostsareincludedintheassetscarryingamountorrecognisedasaseparateasset,asappropriate,whenitisprobablethat
futureeconomicbenefitsassociatedwiththeitemwillbegenerated,andthecostoftheitemcanbereliablymeasured.Repairsand
maintenancearechargedtoprofitorlossduringthereportingperiodinwhichtheyareincurred.
(q) Depreciation
Depreciationofplantandequipmentismadeonthestraightlinebasisusingratesdesignedtowriteoffthenetcostorrevaluedamount
ofeachassetoveritsexpectedusefullifetoitsestimatedresidualvalue.Theestimatedusefullives,residualvaluesanddepreciation
methodarereviewedattheendofeachannualreportingperiod.Theestimatedusefullivesofplantandequipmentare4-10years.
Profitsandlossesondisposalofplantandequipmentaretakenintoaccountindeterminingtheresultfortheyear.
Investmentpropertiesarenotdepreciated.
(r) Intangible assets
Intangibleassetsareidentifiablenon-monetaryassetswithoutphysicalsubstance.
Theintangibleassetsreportedrelatetotheacquisitionordevelopmentofcomputersoftware.Costsdirectlyattributabletocreate,
produceandpreparethecomputersoftwareforoperationarecapitalisedandamortisedonastraightlinebasisovertheexpecteduseful
lifeofthecomputersoftware.
Theusefullivesrangefrom3to10years.Theamortisationperiodforintangibleassetsisreviewedannually.
(s) Impairment
Impairmentoccurswhenanasset’srecoverablevalueislessthantheamountatwhichitisrecorded.Assetsareassessedforindicators
ofimpairmentateachreportingdate.Impairmentlossesarerecognisedinthestatementofcomprehensiveincomewhereanasset’s
carryingamountexceedsitsrecoverableamount.

29
Notes to the Financial StatementsFor the year ended 30 June 2015
1 Summary of significant accounting policies continued
(t) Employee benefits
Annual leave, long service leave and sick leave
Provisionsforannualleaveandlongserviceleaveowingatbalancedatewhichareexpectedtobewhollysettledwithin12monthsare
reportedattheirnominalvaluesusingtheremunerationratesexpectedtoapplyatthetimeofsettlement.Itisexpectedthatallannual
leaveowingatbalancedatewillbetakenwithinthenexttwelvemonths.
Provisionforlongserviceleavenotexpectedtobesettledwithin12monthsismeasuredasthepresentvalueoftheestimated
futurecashoutflows,inrespectofservicesprovidedbyemployeesuptothereportingdate.Discountingisdoneattheappropriate
corporatebondrate.
Noprovisionforsickleaveisraised.Allsickleaveisexpensedinthestatementofcomprehensiveincomeatnominalvalueswhentaken.
Superannuation
TheRetirementBenefitsFund(RBF)definedbenefitsschemecoverseligibleemployeeswhocommencedpriorto15May1999.The
definedbenefitsschemewasclosedtonewmembersfromthatdate.
Thebenefitiscalculatedasafunctionofthemembers’salaries,levelofcontributionsandlengthofservice.
Eachyear,atthereportingdate,theStateActuaryconductsavaluationofthepastserviceandaccruedliabilitieswithinthedefined
benefitsscheme.AnyshortfallbetweenthedefinedbenefitobligationandthefairvalueofRBFassetsrelevantforthosemembers
determinesthevalueofanyunfundedsuperannuationliability,andisshownasaliabilityinthestatementoffinancialposition.Actuarial
gainsandlossesarerecognisedinthestatementofcomprehensiveincomethroughothercomprehensiveincome.
ForallemployeeswhoarenotamemberoftheRBFdefinedbenefitsscheme,theMAIBcontributesatleasttheminimumlevelof
supportrequiredbytheCommonwealth Superannuation Guarantee (Administration) Act 1992.Contributionsaremadetonominated
accumulationschemesandareexpensedwhentheyfalldue.
(u) Goods and services tax
Revenues,expensesandassetsarerecognisednetoftheamountofgoodsandservicestax(GST),except:
•wheretheamountofGSTincurredisnotrecoverablefromtheAustralianTaxationOffice(ATO),itisrecognisedaspartofthecostof
acquisitionofanassetoraspartofanitemofexpense;or
•forreceivablesandpayableswhicharerecognisedinclusiveofGST.
ThenetamountofGSTrecoverablefrom,orpayableto,theATOisincludedaspartofreceivablesorpayables.Cashflowsareincludedin
thestatementofcashflowsonagrossbasis.TheGSTcomponentofcashflowsarisingfrominvestingandfinancingactivities,whichis
recoverablefrom,orpayableto,theATOareclassifiedwithinoperatingcashflows.
(v) Cash and cash equivalents
Cashandcashequivalentsreportedinthestatementoffinancialpositionandstatementofcashflowsincludescashonhand,deposits
heldatcallwithfinancialinstitutionsandothershort-termhighlyliquidinvestmentswithoriginalmaturitiesofthreemonthsorless
fromthedateofacquisition.Cashandcashequivalentinvestmentsarereadilyconvertibletoknownamountsofcashandaresubjectto
aninsignificantriskofchangeinvalue.
(w) Comparative figures
Wherenecessary,comparativefigureshavebeenadjustedtoconformtochangesinpresentationinthecurrentyear.
(x) Rounding
Amountshavebeenroundedtothenearestthousanddollarsunlessotherwisestated.
30 MOTOR ACCIDENTS INSURANCE BOARD ANNUAL REPORT 2014-15
Notes to the Financial StatementsFor the year ended 30 June 2015
2 Critical accounting judgements and estimates
TheMAIBmakesestimatesandassumptionsinrespectofkeyassetsandliabilities.Thekeyareasinwhichcriticalestimatesareappliedare
detailedbelow.
Outstanding claims liability
Provisionismadeatthebalancedatefortheestimatedcostofclaimsincurredbutnotsettled,includingthecostofclaimsincurredbutnot
yetreported(IBNR).
Theestimatedcostofclaimsincludesdirectexpensestobeincurredinsettlingclaimsgrossoftheexpectedvalueofrecoveries.All
reasonablestepsaretakentoensurethatappropriateinformationisobtainedregardingclaimsexposures.However,giventheuncertaintyin
establishingtheoutstandingclaimsliability,itislikelythatthefinaloutcomemayprovetobedifferentfromtheoriginalliabilityestablished.
Theoutstandingclaimsliabilityisassessedbyanindependentactuaryinthreebroadcategories:scheduledbenefits,commonlawand
futurecare.Thevaluationmethodologiesarebasedonthosethatarebestsuitedtothecharacteristicsofthebenefitsbeingvaluedandare
calculatedgrossofanyreinsurancerecoveries.Aseparateestimateismadeoftheamountsthatwillberecoverablefromreinsurers.
Scheduled benefits
Scheduledbenefitsexhibithighinitialpaymentsformostclaimswithsomeclaimsreceivingongoingpaymentsformanyyears.Thisisbest
representedbythePaymentsPerClaimIncurred(PPCI)method.
Common law
CommonLawprojectionstakeintoaccountthefollowing:
•theultimatenumberofcommonlawclaimsintimated(referredtoasCommonLaw“lodgements”);
•therateatwhichthiscommonlawpotentialissettled,separatelyconsidering“non-nil”and“nildamages”claims;
•“non-nil”claimsrepresentthosethatreceiveadamagespayment;
•“nildamages”claimsrepresentthoseintimationsthatultimatelydonotinvolvecommonlawdamagespayments(althoughthey
mayincurothercommonlaw-relatedexpenses,ornon-commonlawpayments);thebulkoftheseclaimantsdonoteverinitiatea
commonlawaction;
•theaveragedamagescostsatsettlement;and
•thelevelofothercommonlawcosts(primarilylegalandotherinvestigationcosts).
Future care
Futurecareliabilitiesareassessedonanindividualclaimbasis.Eachcomponentoffuturecarecostsforindividualsidentifiedasrequiring
dailycareisreviewed.Thisassessmentexaminesthedetailssurroundingtheclaim,medicalreports,andcarereports,withaviewto
determiningthelikelyfutureneedsandongoingcost.
Theestimatedliabilitiesarebasedonanindividualvaluationmodelthatconvertstheseassessmentsintocashflowsforeachclaimant.
Forecastsofcashflowsarebasedonallowanceforstepsupanddownincareneeds,futureclaimsinflation,andmortalityoftheclaimant.
Medicaladviceisoftensoughtifitisthoughtthataclaimant’sinjuriesmayaffecthisorherlifeexpectancy.AllowanceforclaimsIBNRis
basedonassumednumbersofincurredclaimsmultipliedbyanaverageclaimsize.

31
Notes to the Financial StatementsFor the year ended 30 June 2015
3 Risk management policies and procedures
TheMAIB’sriskmanagementpoliciesandproceduresaredetailedbelow.
(a) Objectives in managing risks arising from insurance contracts and policies for mitigating those risks
AsthesoleunderwriterofcompulsorythirdpartyinsuranceinTasmaniathemaininsurancerisksincludeclaimsandrehabilitation
management,maximisinginvestmentreturnswithinacceptableboundsofriskandensuringcollectionofappropriatepremiumrevenue.
Theriskmanagementobjectivesinregardtothesecategoriesaretomaintainthelongtermfundingratiooftheschemeinthetarget
rangeof120%to145%-refernote18(d)-andtoensurethatabalanceexistsbetweenpremiumincome,thecostofclaimsandthe
requirementtoachieveasustainablecommercialrateofreturnthatmaximisesvaluefortheState.
Risk management principles
TheMAIBhasasoundriskmanagementstructureandpracticesinplace.UnderpinningtheprocessisaRiskManagementPolicy(the
Policy)andaRiskManagementPlan(thePlan).TheobjectivesofthePlanareto:
•formalisetheapproachtakentothemanagementofrisk;and
•serveadualpurposeofmitigatingriskandfosteringariskmanagementculture.
TheobjectivesofthePolicyareto:
•protecttheassetsofthebusiness;
•effectivelymanageriskexposure;and
•ensureanorderlyandtimelyapproachtotheMAIB’sriskmanagementpractices.
ThePolicyisreviewedannuallybyManagementandtheAuditCommitteeandapprovedbytheBoardofDirectors.ThePolicysetsoutthe
riskmanagementstructureandassignsresponsibilitiestoeachgroupwithinthatstructure.ItfurtherprescribesthescopeofthePlan
andguidelinesfortheidentificationandrankingofrisks.
Insurance risk
TheMAIBhasidentifiedanumberofinsurancerisksandhasinplacestrategiestomitigatethoserisksinordertoensure:
•acceptanceofvalidclaims;
•accurateassessmentofclaimliabilities;
•costcontrolmeasuresareinplace;
•fraudpreventionanddetection;
•provisionofaccurateinformationintothepremiumsettingprocess;and
•establishmentofappropriateinvestmentstrategiestomeetfutureliabilities.
KeyaspectsoftheprocessesidentifiedinthePlantomitigateinsurancerisksinclude,butarenotlimitedto:
•Acomprehensivedatabaseofaccidentdataismaintainedwhichfacilitatestheprovisionofawiderangeofup-to-dateinformation.
•Exposuretocatastrophicmotoraccidentsismanagedthroughtakingoutappropriatereinsurancecover.Theretentionandlimitsare
approvedbytheBoardofDirectorsandreinsurancetreatiesarere-negotiatedannuallyviaabroker.Onlyfirmsthathaveatleasta
StandardandPoor’s‘A’ratingareconsideredwhenselectingreinsurers.
•Anexternalconsultantisengagedtoprovidearangeofinvestmentadvisoryservices.Aprimaryfunctionoftheengagementisto
undertakeastrategicassetallocationassessmentannuallyandrecommendanappropriateinvestmentportfolio,withinacceptable
boundsofrisk.Themixofgrowthanddefensiveassetclassesselectedisstructuredtoensurelongtermmatchingofinvestment
fundswithfuturefinancialobligations.
•Anindependentactuaryisengagedtovaluetheclaimliabilities(includingtheestablishmentofanappropriateriskmargin),assess
premiumrequirementsannually,assesscapitaladequacyrequirementsandmonitorandreportontrendsincosts.
•AstheTasmanianGovernmentmonopolycompulsorythirdpartyinsurer,theMAIBissubjecttoaperiodicreviewofitsoperationsby
theTasmanianEconomicRegulator.Theregulator’sroleistorecommendmaximumpremiumstobechargedfortheensuingfour
years.Themostrecentreviewwasundertakenin2013,duringwhichtheregulatorengagedtheservicesofanindependentactuary
toreviewtheMAIB’sproposal.

32 MOTOR ACCIDENTS INSURANCE BOARD ANNUAL REPORT 2014-15
Notes to the Financial StatementsFor the year ended 30 June 2015
3 Risk management policies and procedures (b) Terms and conditions of insurance business
TheMAIBoffersoneclassofinsurance,compulsorythirdparty.Thetermsandconditionsareestablishedunderthe Motor Accidents
(Liabilities and Compensation) Act 1973.
(c) Concentration of insurance risk
TheMAIBoperatestheTasmaniancompulsorythirdpartyinsurancescheme.Concentrationsofinsuranceriskaredeterminedbythe
natureandpotentialimpactoftherisk.Themajorconcentrationofinsuranceriskisacatastrophicmotoraccident.TheMAIBpurchases
reinsurancecovertolimititsexposuretothefinancialimpactofcatastrophicmotoraccidents.
(d) Interest rate risk
Noneofthefinancialassetsorliabilitiesarisingfrominsuranceorreinsurancecontractsenteredintoaredirectlyexposedtointerestrate
risk.Insuranceandreinsurancecontractsareenteredintoannually.Atthetimeofenteringintothecontractalltermsandconditionsare
negotiableor,inthecaseofrenewals,renegotiable.
(e) Credit risk
Financialassetsandliabilitiesarisingfrominsuranceandreinsurancecontractsarestatedinthestatementoffinancialpositionatthe
amountthatbestrepresentsthemaximumcreditriskexposureatbalancedate.
Therearenosignificantconcentrationsofcreditrisk.
4 Volatility in results
Outstanding claims liability
ThevaluationoftheoutstandingclaimsliabilitymaybesubjecttosubstantialinfluencebyfactorsexternaltotheMAIB,particularlyby
movementsintheeconomicassumptions(discountandinflationrates).Theseexternalfactorscancausesignificantvariationsinthevalue
oftheoutstandingclaimsliabilityfromyeartoyear.ThediscountandinflationratesappliedbytheMAIB’sactuaryaredetailedinnote22(a).
Note22(e)highlightstheimpactofchangesinclaimsexperienceandeconomicassumptionsonthevariationinthevaluationresults.
Investment returns
TheMAIBhasadoptedastrategythatmatchesitsinvestmentportfoliowithitsfuturefinancialobligations.Giventhelong-termnatureofthe
outstandingclaimsliabilities,theinvestmentstrategycontainsanallocationtobothgrowthassets(suchaslistedequitiesandproperty)and
defensiveassets(suchascashandbonds).
Growthassetsareheldtodeliveradditionalreturnoverthelongertermcomparedtothereturnexpectedtobeachievedbyinvestingsolely
inthedefensiveassetclasses.Growthassetsarevolatileinnatureandinvestmentreturnsmayvarysignificantlyfromyeartoyear.
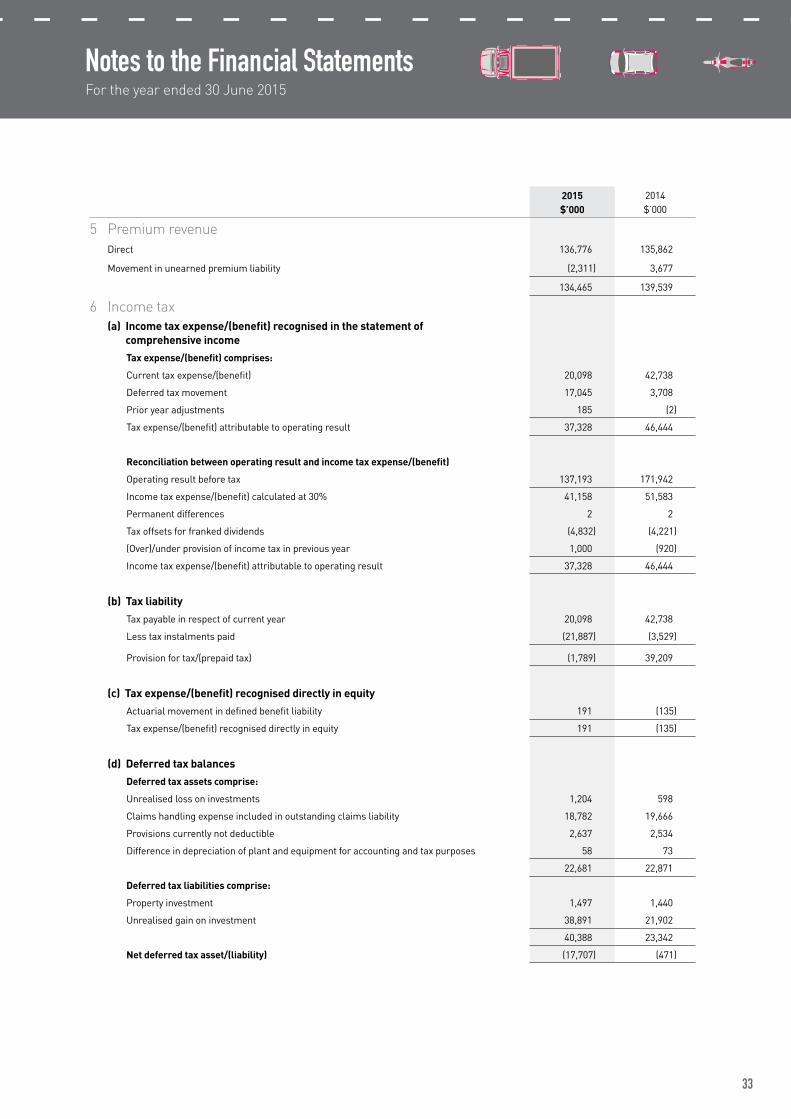
33
Notes to the Financial StatementsFor the year ended 30 June 2015
2015 $’000
2014$’000
5 Premium revenueDirect 136,776 135,862
Movementinunearnedpremiumliability (2,311) 3,677
134,465 139,539
6 Income tax(a) Income tax expense/(benefit) recognised in the statement of
comprehensive income
Tax expense/(benefit) comprises:
Currenttaxexpense/(benefit) 20,098 42,738
Deferredtaxmovement 17,045 3,708
Prioryearadjustments 185 (2)
Taxexpense/(benefit)attributabletooperatingresult 37,328 46,444
Reconciliation between operating result and income tax expense/(benefit)
Operatingresultbeforetax 137,193 171,942
Incometaxexpense/(benefit)calculatedat30% 41,158 51,583
Permanentdifferences 2 2
Taxoffsetsforfrankeddividends (4,832) (4,221)
(Over)/underprovisionofincometaxinpreviousyear 1,000 (920)
Incometaxexpense/(benefit)attributabletooperatingresult 37,328 46,444
(b) Tax liability
Taxpayableinrespectofcurrentyear 20,098 42,738
Lesstaxinstalmentspaid (21,887) (3,529)
Provisionfortax/(prepaidtax) (1,789) 39,209
(c) Tax expense/(benefit) recognised directly in equity
Actuarialmovementindefinedbenefitliability 191 (135)
Taxexpense/(benefit)recogniseddirectlyinequity 191 (135)
(d) Deferred tax balances
Deferred tax assets comprise:
Unrealisedlossoninvestments 1,204 598
Claimshandlingexpenseincludedinoutstandingclaimsliability 18,782 19,666
Provisionscurrentlynotdeductible 2,637 2,534
Differenceindepreciationofplantandequipmentforaccountingandtaxpurposes 58 73
22,681 22,871
Deferred tax liabilities comprise:
Propertyinvestment 1,497 1,440
Unrealisedgainoninvestment 38,891 21,902
40,388 23,342
Net deferred tax asset/(liability) (17,707) (471)

34 MOTOR ACCIDENTS INSURANCE BOARD ANNUAL REPORT 2014-15
30 June 2015 30June2014
Current Year Claims $’000
Prior Years’ Claims $’000
Total $’000
CurrentYearClaims$’000
PriorYears’Claims$’000
Total$’000
Gross claims expense
Grossclaimsincurred 261,805 (354,716) (92,911) 298,261 (273,830) 24,431
Reinsurancerecoveries - 3,110 3,110 - 2,925 2,925
Netclaimsincurred 261,805 (351,606) (89,801) 298,261 (270,905) 27,356
Discount movement
Grossclaimsincurred (131,791) 328,107 196,316 (166,039) 265,315 99,276
Reinsurancerecoveries - (6,192) (6,192) - (7,127) (7,127)
Netdiscountmovement (131,791) 321,915 190,124 (166,039) 258,188 92,149
Discounted
Grossclaimsincurred 130,014 (26,609) 103,405 132,222 (8,515) 123,707
Reinsurancerecoveries - (3,082) (3,082) - (4,202) (4,202)
Netclaimsincurred 130,014 (29,691) 100,323 132,222 (12,717) 119,505
Reconciliation of net claims incurred
Claimsincurred(refernote7) 104,019 124,272
Recoveryrevenue(refernote8) (3,696) (4,767)
Netclaimsincurred 100,323 119,505
2015 $’000
2014$’000
7 Claims expensePaid 81,238 73,505
Outstandingclaimsliabilitymovement 22,781 50,767
Claimsincurred 104,019 124,272
Otherclaimpayments 323 330
104,342 124,602
8 Recovery revenueReinsurancerecoveriesreceived 1,000 8,294
Reinsurancerecoveriesreceivablemovement 2,082 (4,093)
Otherrecoveriesreceived 614 566
3,696 4,767
9 Net claims incurredThefollowingtableshowstheimpactonthecurrentyearresultsofchangestotheestimatesoftheoutstandingclaimsliabilityrelating
toprioryearsbasedonthemostrecentexperience.Currentyearclaimsrelatetorisksborneinthecurrentreportingperiod.Prioryears’
claimsrelatetoareassessmentoftherisksborneinallpreviousreportingperiods.
Notes to the Financial StatementsFor the year ended 30 June 2015

35
2015 $’000
2014$’000
10 Investment incomeInterest 12,948 11,561
Dividends 39,639 28,975
Other 1,288 1,853
Changesinfairvalueofinvestments
Realised 313 51,237
Unrealised 70,734 79,001
124,922 172,627
Investmentexpenses (2,034) (1,633)
122,888 170,994
11 Other incomeBankinterest 7 6
Rent 484 581
491 587
12 Other expensesInvestmentpropertyexpenses 291 305
Lossonsaleofplantandequipment 64 6
Unrealisedchangeinfairvalueofinvestmentproperties 46 135
401 446
13 General and administration expensesSalariesandstaffrelatedexpenses 3,660 3,568
Depreciationandamortisation 205 214
Informationtechnology 341 315
Internationaltravel1 32 39
Otheroperatingcosts 1,688 1,647
5,926 5,7831 In both the 2014-15 and 2013-14 financial years the Chairman and the Chief Executive Officer
completed one international trip to meet with reinsurers in Singapore and London.
14 Trade and other receivablesPremiumsreceivable1 1,755 1,344
Otherreceivables1 34 13
1,789 1,357
1 Premiums receivable and other receivables are due within 12 months.
15 Reinsurance recoveries receivableInflatedreinsurancerecoveriesarebasedonanassessmentoftheamountsduefromreinsurers,basedoncurrentgrossclaim
amounts,assumingthatthereinsurancerecoveriesaremadeinthesameproportionsovertimeasthegrossfuturecareliabilities.
Discountedreinsurancerecoveriesarebasedonanassessmentoftheamountsduefromreinsurers,basedoncurrentgrossclaim
amounts,discountedbytwoyearstoallowfortheaveragedelaybetweenpaymentbytheMAIBandrecoveryfromreinsurers.
Notes to the Financial StatementsFor the year ended 30 June 2015

36 MOTOR ACCIDENTS INSURANCE BOARD ANNUAL REPORT 2014-15
2015 $’000
2014$’000
15 Reinsurance recoveries receivable continuedExpectedfuturereinsurancerecoveriesundiscounted 86,602 90,711
Discounttopresentvalue (62,184) (68,375)
Provisionforimpairmentofreinsuranceassets - -
Reinsurancerecoveriesreceivableonincurredclaims1 24,418 22,336
Expectedfuturereinsurancerecoveriesonunexpiredriskliability - -
24,418 22,336
1 Reinsurance recoveries receivable are due in more than 12 months.
16 InvestmentsListedinstruments 23,085 23,890
Unlistedtrusts 1,007,619 1,039,676
AustralianGovernmentbonds 157,643 149,901
Otherfinancialinstruments 5,859 4,359
1,194,206 1,217,826
Detailed disclosure of financial instruments is contained in note 18.
17 Investment properties(a) Reconciliation of carrying amount
At fair value
Balanceat1July 14,605 14,740
Acquisitions - -
Capitalisedsubsequentexpenditure 71 -
Netgain/(loss)fromfairvalueadjustment (46) (135)
Balanceat30June 14,630 14,605
(b) Measurement of fair value
Fairvaluemeasurementsareclassifiedusingafairvaluehierarchythatreflectsthesubjectivityoftheinputsusedinmakingthemeasurements.Thefairvaluehierarchycomprisesthefollowingthreelevels:
•Level1fairvaluemeasurementsarederivedfromunadjustedquotedpricesinactivemarketsforidenticalassets.
•Level2fairvaluemeasurementsarebasedoninputs,otherthanquotedprices,thatareobservablefortheasset.
•Level3fairvaluemeasurementsarebasedonunobservableinputsfortheasset.
Thefairvalueoftheinvestmentpropertiesisdeterminedbyanexternalindependentpropertyvaluer,havingappropriaterecognisedprofessionalqualificationsandrecentexperienceinthelocationandcategoryofthepropertiesbeingvalued.Theindependentvaluationsarecompletedannually.
Basedontheinputstothevaluationtechniquesthefairvaluemeasurementoftheinvestmentpropertieshasbeencategorisedasfollows:
•Non-specialisedproperties–level2;and
•Specialisedproperties–level3.
Notes to the Financial StatementsFor the year ended 30 June 2015

37
17 Investment properties continued
Thefollowingtablespresenttheinvestmentpropertiesmeasuredandrecognisedatfairvalueat30June2015and30June2014.
30 June 2015
Level 1
$’000
Level 2
$’000
Level 3
$’000
Total
$’000
Investment properties at fair value
through profit or loss
Non-specialisedproperties - 6,850 - 6,850
Specialisedproperties - - 7,780 7,780
- 6,850 7,780 14,630
30 June 2014
Level1
$’000
Level2
$’000
Level3
$’000
Total
$’000
Investment properties at fair value
through profit or loss
Non-specialisedproperties - 6,950 - 6,950
Specialisedproperties - - 7,655 7,655
- 6,950 7,655 14,605
(c) Valuation techniques used to derive fair values
Investmentpropertiesarevaluedusingthefollowingtechniques:
•Non-specialisedpropertiesarevaluedonthebasisofmarketvaluewithreferencetoobservablepricesinanactive
market,usingtraditionalvaluationmethodsincludingsalescomparison.Pointsofdifferencearetakenintoaccountbythe
valuerincludingthelocation,differenceinsizesandthequalityofaccommodationandland.
•Specialisedinvestmentpropertieshavebeenvaluedonadepreciatedreplacementcostbasiswhichtakesintoaccount
currentreplacementcostestimatesderivedfromconstructioncostandactualdevelopmentcostinformationofsimilar
buildings.Thereareinsufficientsalesofsimilarpropertiestoreliablyassessmarketvalues.
Therewerenotransfersbetweenlevels2and3in2014-15or2013-14.
Thefollowingtableshowsareconciliationbetweentheopeningandclosingbalancesforlevel3fairvalues.
2015 $’000
2014$’000
Balanceat1July 7,655 7,840
Acquisitionsandreclassificationfromproperty,plantandequipment - -
Changesinfairvalue(unrealised) 125 (185)
Balanceat30June 7,780 7,655
Notes to the Financial StatementsFor the year ended 30 June 2015
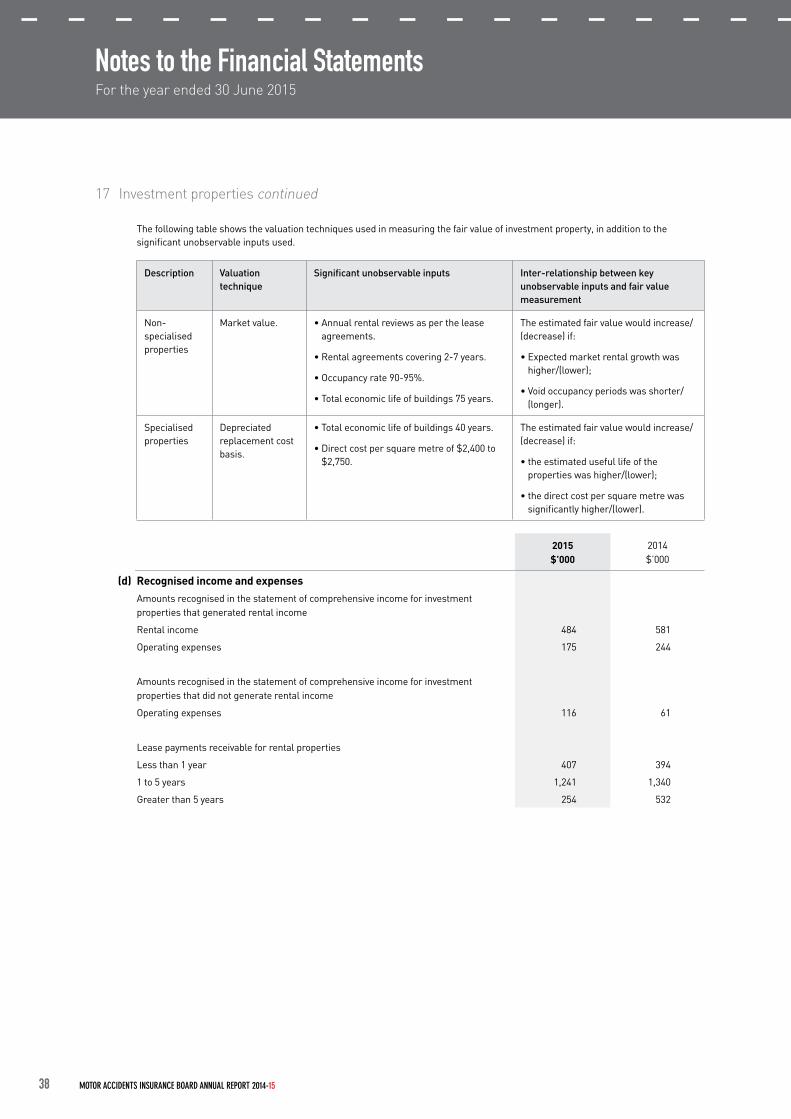
38 MOTOR ACCIDENTS INSURANCE BOARD ANNUAL REPORT 2014-15
17 Investment properties continued
Thefollowingtableshowsthevaluationtechniquesusedinmeasuringthefairvalueofinvestmentproperty,inadditiontothesignificantunobservableinputsused.
Description Valuation technique
Significant unobservable inputs Inter-relationship between key unobservable inputs and fair value measurement
Non-specialisedproperties
Marketvalue. •Annualrentalreviewsaspertheleaseagreements.
•Rentalagreementscovering2-7years.
•Occupancyrate90-95%.
•Totaleconomiclifeofbuildings75years.
Theestimatedfairvaluewouldincrease/(decrease)if:
•Expectedmarketrentalgrowthwashigher/(lower);
•Voidoccupancyperiodswasshorter/(longer).
Specialisedproperties
Depreciatedreplacementcostbasis.
•Totaleconomiclifeofbuildings40years.
•Directcostpersquaremetreof$2,400to$2,750.
Theestimatedfairvaluewouldincrease/(decrease)if:
•theestimatedusefullifeofthepropertieswashigher/(lower);
•thedirectcostpersquaremetrewassignificantlyhigher/(lower).
2015 $’000
2014$’000
(d) Recognised income and expensesAmountsrecognisedinthestatementofcomprehensiveincomeforinvestmentpropertiesthatgeneratedrentalincome
Rentalincome 484 581
Operatingexpenses 175 244
Amountsrecognisedinthestatementofcomprehensiveincomeforinvestmentpropertiesthatdidnotgeneraterentalincome
Operatingexpenses 116 61
Leasepaymentsreceivableforrentalproperties
Lessthan1year 407 394
1to5years 1,241 1,340
Greaterthan5years 254 532
Notes to the Financial StatementsFor the year ended 30 June 2015
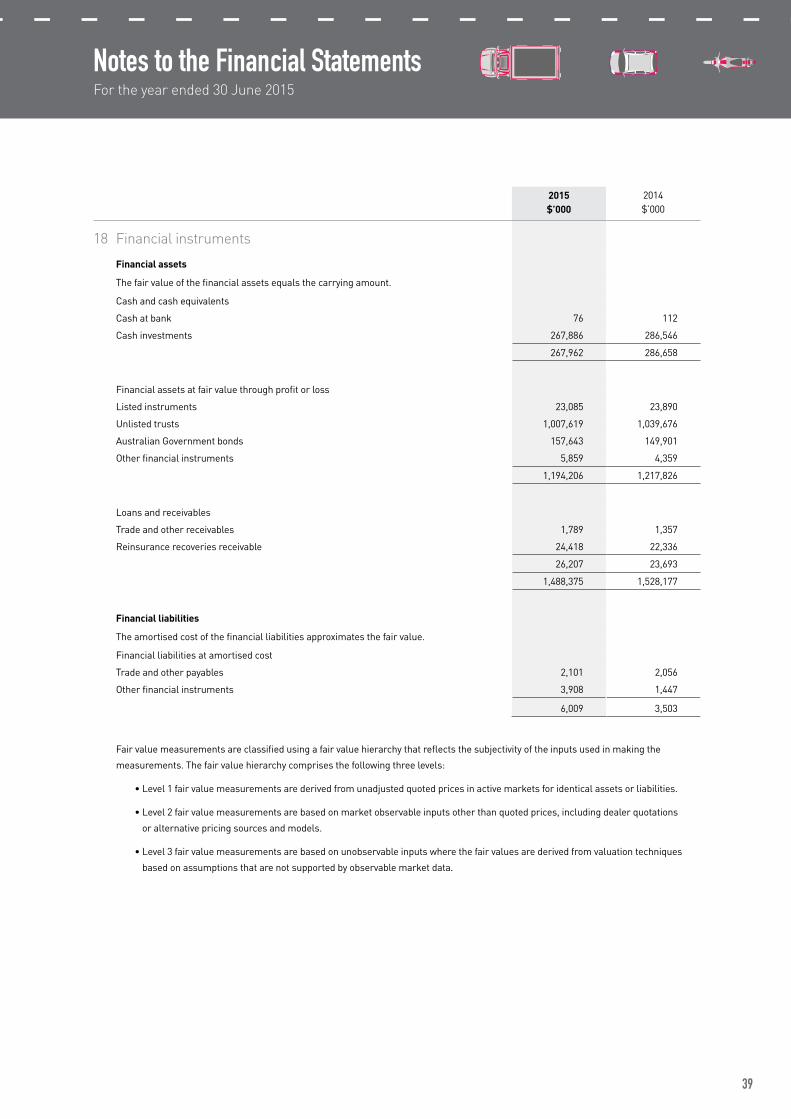
39
17 Investment properties continued
Thefollowingtableshowsthevaluationtechniquesusedinmeasuringthefairvalueofinvestmentproperty,inadditiontothesignificantunobservableinputsused.
Description Valuation technique
Significant unobservable inputs Inter-relationship between key unobservable inputs and fair value measurement
Non-specialisedproperties
Marketvalue. •Annualrentalreviewsaspertheleaseagreements.
•Rentalagreementscovering2-7years.
•Occupancyrate90-95%.
•Totaleconomiclifeofbuildings75years.
Theestimatedfairvaluewouldincrease/(decrease)if:
•Expectedmarketrentalgrowthwashigher/(lower);
•Voidoccupancyperiodswasshorter/(longer).
Specialisedproperties
Depreciatedreplacementcostbasis.
•Totaleconomiclifeofbuildings40years.
•Directcostpersquaremetreof$2,400to$2,750.
Theestimatedfairvaluewouldincrease/(decrease)if:
•theestimatedusefullifeofthepropertieswashigher/(lower);
•thedirectcostpersquaremetrewassignificantlyhigher/(lower).
2015 $’000
2014$’000
(d) Recognised income and expensesAmountsrecognisedinthestatementofcomprehensiveincomeforinvestmentpropertiesthatgeneratedrentalincome
Rentalincome 484 581
Operatingexpenses 175 244
Amountsrecognisedinthestatementofcomprehensiveincomeforinvestmentpropertiesthatdidnotgeneraterentalincome
Operatingexpenses 116 61
Leasepaymentsreceivableforrentalproperties
Lessthan1year 407 394
1to5years 1,241 1,340
Greaterthan5years 254 532
Notes to the Financial StatementsFor the year ended 30 June 2015
2015 $’000
2014$’000
18 Financial instruments
Financial assets
Thefairvalueofthefinancialassetsequalsthecarryingamount.
Cashandcashequivalents
Cashatbank 76 112
Cashinvestments 267,886 286,546
267,962 286,658
Financialassetsatfairvaluethroughprofitorloss
Listedinstruments 23,085 23,890
Unlistedtrusts 1,007,619 1,039,676
AustralianGovernmentbonds 157,643 149,901
Otherfinancialinstruments 5,859 4,359
1,194,206 1,217,826
Loansandreceivables
Tradeandotherreceivables 1,789 1,357
Reinsurancerecoveriesreceivable 24,418 22,336
26,207 23,693
1,488,375 1,528,177
Financial liabilities
Theamortisedcostofthefinancialliabilitiesapproximatesthefairvalue.
Financialliabilitiesatamortisedcost
Tradeandotherpayables 2,101 2,056
Otherfinancialinstruments 3,908 1,447
6,009 3,503
Fairvaluemeasurementsareclassifiedusingafairvaluehierarchythatreflectsthesubjectivityoftheinputsusedinmakingthe
measurements.Thefairvaluehierarchycomprisesthefollowingthreelevels:
•Level1fairvaluemeasurementsarederivedfromunadjustedquotedpricesinactivemarketsforidenticalassetsorliabilities.
•Level2fairvaluemeasurementsarebasedonmarketobservableinputsotherthanquotedprices,includingdealerquotations
oralternativepricingsourcesandmodels.
•Level3fairvaluemeasurementsarebasedonunobservableinputswherethefairvaluesarederivedfromvaluationtechniques
basedonassumptionsthatarenotsupportedbyobservablemarketdata.
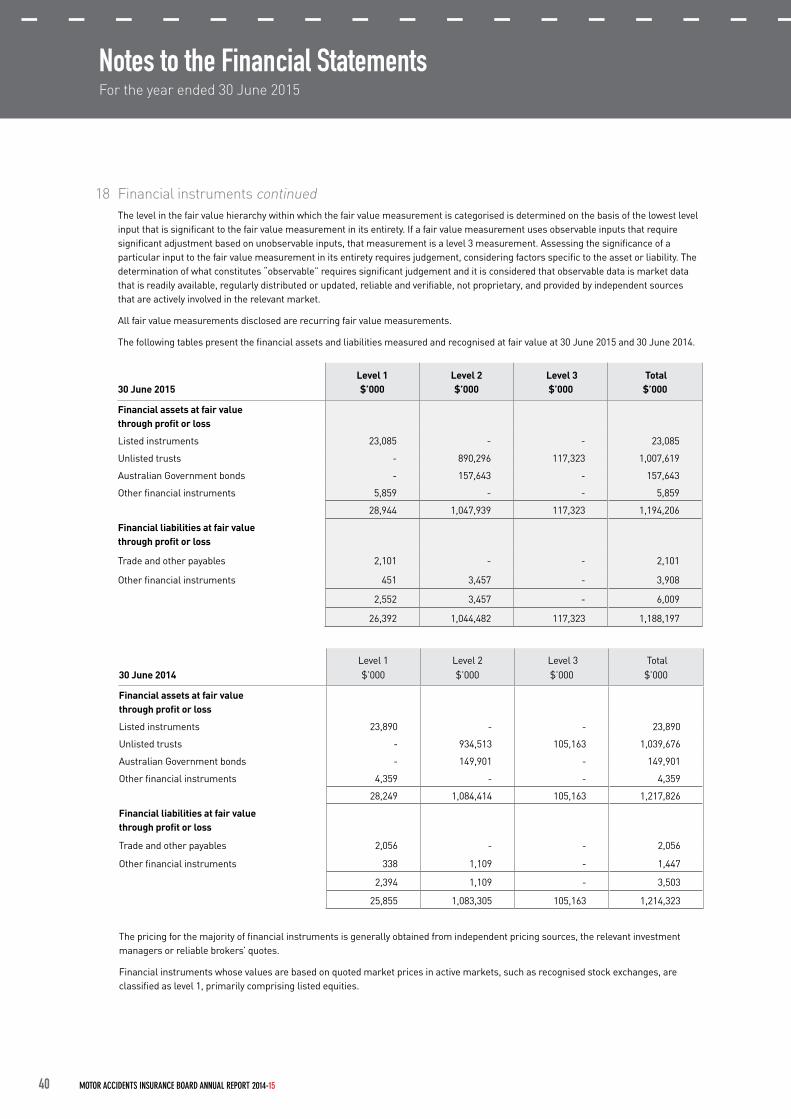
40 MOTOR ACCIDENTS INSURANCE BOARD ANNUAL REPORT 2014-15
18 Financial instruments continued Thelevelinthefairvaluehierarchywithinwhichthefairvaluemeasurementiscategorisedisdeterminedonthebasisofthelowestlevelinputthatissignificanttothefairvaluemeasurementinitsentirety.Ifafairvaluemeasurementusesobservableinputsthatrequiresignificantadjustmentbasedonunobservableinputs,thatmeasurementisalevel3measurement.Assessingthesignificanceofaparticularinputtothefairvaluemeasurementinitsentiretyrequiresjudgement,consideringfactorsspecifictotheassetorliability.Thedeterminationofwhatconstitutes“observable”requiressignificantjudgementanditisconsideredthatobservabledataismarketdatathatisreadilyavailable,regularlydistributedorupdated,reliableandverifiable,notproprietary,andprovidedbyindependentsourcesthatareactivelyinvolvedintherelevantmarket.
Allfairvaluemeasurementsdisclosedarerecurringfairvaluemeasurements.
Thefollowingtablespresentthefinancialassetsandliabilitiesmeasuredandrecognisedatfairvalueat30June2015and30June2014.
30 June 2015Level 1 $’000
Level 2 $’000
Level 3 $’000
Total $’000
Financial assets at fair value through profit or loss
Listedinstruments 23,085 - - 23,085
Unlistedtrusts - 890,296 117,323 1,007,619
AustralianGovernmentbonds - 157,643 - 157,643
Otherfinancialinstruments 5,859 - - 5,859
28,944 1,047,939 117,323 1,194,206
Financial liabilities at fair value through profit or loss
Tradeandotherpayables 2,101 - - 2,101
Otherfinancialinstruments 451 3,457 - 3,908
2,552 3,457 - 6,009
26,392 1,044,482 117,323 1,188,197
30 June 2014Level1$’000
Level2$’000
Level3$’000
Total$’000
Financial assets at fair value through profit or loss
Listedinstruments 23,890 - - 23,890
Unlistedtrusts - 934,513 105,163 1,039,676
AustralianGovernmentbonds - 149,901 - 149,901
Otherfinancialinstruments 4,359 - - 4,359
28,249 1,084,414 105,163 1,217,826
Financial liabilities at fair value through profit or loss
Tradeandotherpayables 2,056 - - 2,056
Otherfinancialinstruments 338 1,109 - 1,447
2,394 1,109 - 3,503
25,855 1,083,305 105,163 1,214,323
Thepricingforthemajorityoffinancialinstrumentsisgenerallyobtainedfromindependentpricingsources,therelevantinvestmentmanagersorreliablebrokers’quotes.
Financialinstrumentswhosevaluesarebasedonquotedmarketpricesinactivemarkets,suchasrecognisedstockexchanges,areclassifiedaslevel1,primarilycomprisinglistedequities.
Notes to the Financial StatementsFor the year ended 30 June 2015
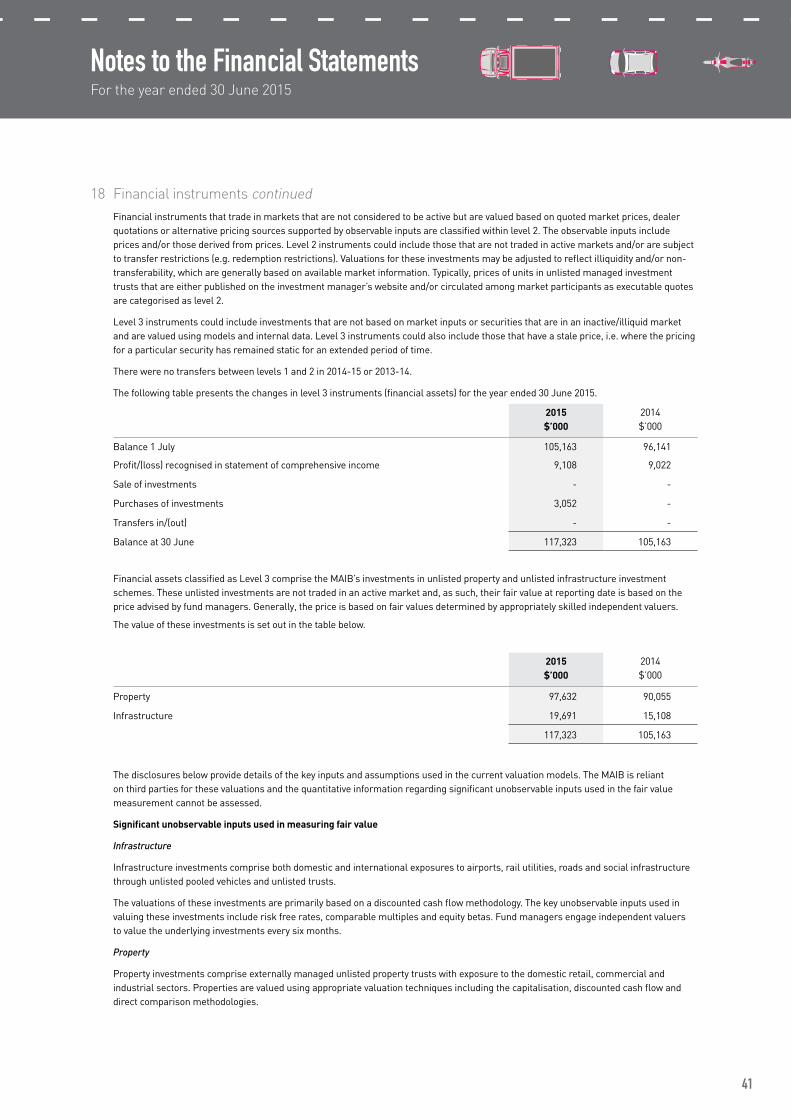
41
Notes to the Financial StatementsFor the year ended 30 June 2015
18 Financial instruments continuedFinancialinstrumentsthattradeinmarketsthatarenotconsideredtobeactivebutarevaluedbasedonquotedmarketprices,dealerquotationsoralternativepricingsourcessupportedbyobservableinputsareclassifiedwithinlevel2.Theobservableinputsincludepricesand/orthosederivedfromprices.Level2instrumentscouldincludethosethatarenottradedinactivemarketsand/oraresubjecttotransferrestrictions(e.g.redemptionrestrictions).Valuationsfortheseinvestmentsmaybeadjustedtoreflectilliquidityand/ornon-transferability,whicharegenerallybasedonavailablemarketinformation.Typically,pricesofunitsinunlistedmanagedinvestmenttruststhatareeitherpublishedontheinvestmentmanager’swebsiteand/orcirculatedamongmarketparticipantsasexecutablequotesarecategorisedaslevel2.
Level3instrumentscouldincludeinvestmentsthatarenotbasedonmarketinputsorsecuritiesthatareinaninactive/illiquidmarketandarevaluedusingmodelsandinternaldata.Level3instrumentscouldalsoincludethosethathaveastaleprice,i.e.wherethepricingforaparticularsecurityhasremainedstaticforanextendedperiodoftime.
Therewerenotransfersbetweenlevels1and2in2014-15or2013-14.
Thefollowingtablepresentsthechangesinlevel3instruments(financialassets)fortheyearended30June2015.
2015 $’000
2014$’000
Balance1July 105,163 96,141
Profit/(loss)recognisedinstatementofcomprehensiveincome 9,108 9,022
Saleofinvestments - -
Purchasesofinvestments 3,052 -
Transfersin/(out) - -
Balanceat30June 117,323 105,163
FinancialassetsclassifiedasLevel3comprisetheMAIB’sinvestmentsinunlistedpropertyandunlistedinfrastructureinvestmentschemes.Theseunlistedinvestmentsarenottradedinanactivemarketand,assuch,theirfairvalueatreportingdateisbasedonthepriceadvisedbyfundmanagers.Generally,thepriceisbasedonfairvaluesdeterminedbyappropriatelyskilledindependentvaluers.
Thevalueoftheseinvestmentsissetoutinthetablebelow.
2015 $’000
2014$’000
Property 97,632 90,055
Infrastructure 19,691 15,108
117,323 105,163
Thedisclosuresbelowprovidedetailsofthekeyinputsandassumptionsusedinthecurrentvaluationmodels.TheMAIBisreliantonthirdpartiesforthesevaluationsandthequantitativeinformationregardingsignificantunobservableinputsusedinthefairvaluemeasurementcannotbeassessed.
Significant unobservable inputs used in measuring fair value
Infrastructure
Infrastructureinvestmentscomprisebothdomesticandinternationalexposurestoairports,railutilities,roadsandsocialinfrastructurethroughunlistedpooledvehiclesandunlistedtrusts.
Thevaluationsoftheseinvestmentsareprimarilybasedonadiscountedcashflowmethodology.Thekeyunobservableinputsusedinvaluingtheseinvestmentsincluderiskfreerates,comparablemultiplesandequitybetas.Fundmanagersengageindependentvaluerstovaluetheunderlyinginvestmentseverysixmonths.
Property
Propertyinvestmentscompriseexternallymanagedunlistedpropertytrustswithexposuretothedomesticretail,commercialandindustrialsectors.Propertiesarevaluedusingappropriatevaluationtechniquesincludingthecapitalisation,discountedcashflowanddirectcomparisonmethodologies.
42 MOTOR ACCIDENTS INSURANCE BOARD ANNUAL REPORT 2014-15
Notes to the Financial StatementsFor the year ended 30 June 2015
18 Financial instruments continued
Thekeyunobservableinputsusedinvaluingtheseinvestmentsare:
•capitalisationrate(rangingbetween5.38%and9.25%(2014:5.75%-10%);and
•discountrate–rangingbetween7.75%and9.75%(2014:8.18%to10.25%).
Fundmanagersengageindependentvaluerstovaluetheunderlyinginvestmentsnolessthaneverysixmonths.
Itispossiblethatthelatestindependentvaluationmaynotfullyreflecttheproceedsofsalewhenapropertyissold,particularlyinarapidlymovingpropertymarketorinamarketoflimitedcomparablesalesevidence.
Sensitivity to changes in significant unobservable inputs
Theuseofdifferentmethodologiesorassumptionscouldleadtodifferentmeasurementsoffairvalue.Significantmovementinanyoneoftheinputslistedabovemayresultinachangeinthefairvalueoftheproperties.Anincreaseinthediscountrateorcapitalisationratewouldresultinalowerfairvalueoftheinvestment.Areductionintheserateswouldincreasethefairvalue.Anincreaseincomparablemultipleswouldresultinahigherfairvalue.
Financial risk management
TheMAIB’sfinancialassetsandliabilitiesareexposedtoavarietyoffinancialrisks,primarily:
(a)marketrisk(includingforeignexchangerisk,interestrateriskandpricerisk);
(b)creditrisk;and
(c)liquidityrisk.
TheRiskManagementPlanaddressestheunpredictabilityoffinancialmarketsandseekstominimisepotentialadverseeffectsonthefinancialperformanceinordertoachievetheMAIB’sinvestmentobjectivesofsatisfactorylongtermrealgrowthandtomaintainanacceptablelevelofsolvency.
(a) Market risk
Marketriskistheriskthatthefairvalueorfuturecashflowsofafinancialinstrumentwillfluctuatebecauseofchangesinmarketprices.Marketpriceriskcomprisesthreetypesofrisk:
(i)pricerisk;
(ii)foreigncurrencyrisk;and
(iii)interestraterisk.
TheMAIB,inconsultationwithitsinvestmentadvisor,mastercustodianandexternalfundmanagers,isresponsibleforthemanagementandcontroloffinancialrisks.TheMAIB’sInvestmentPolicyStatementprovideswrittenprinciplesfortheoverallriskmanagementoftheinvestmentframeworkandoutlinestheapproachformanagingspecificriskareasincludingforeignexchangerisk,interestraterisk,equitypricerisk,creditriskandliquidityrisk.
ThemarketriskdisclosuresarepreparedonthebasisoftheMAIB’sdirectinvestments.ThesensitivityoftheMAIB’sretainedearningsattributabletoequityholdersandoperatingresulttopricerisk,foreignexchangeriskandinterestrateriskisdeterminedbasedonmanagement’sbestestimate,havingregardtoanumberoffactors,includinghistoricallevelsofchangeininterestratesandforeignexchangeratesandmarketvolatility.However,actualmovementsintheriskvariablesmaybegreaterorlessthananticipatedduetoanumberoffactorsincludingunusuallylargemarketshocksresultingfromchangesintheperformanceoftheeconomies,marketsandsecuritiesinwhichtheMAIBinvests.Asaresult,historicvariationsintheriskvariablesarenotadefinitiveindicatoroffuturevariationsintheriskvariables.
(i) Price risk
Priceriskistheriskthatthefairvalueofequitieswillfluctuatebecauseofchangesinmarketprices,whetherthosechangesarecausedbyfactorsspecifictotheindividualfinancialinstrumentoritsissuer,orfactorsaffectingsimilarfinancialinstrumentstradedinthemarket.
TheMAIBhasexposuretoequitysecuritiespriceriskwhicharisesfrominvestmentsheldandclassifiedonthestatementoffinancialpositionatfairvaluethroughprofitorloss.Thereisnoexposuretocommoditypricerisk.Allsecuritiesinvestmentspresentariskoflossofcapital.ThemaximumriskfortheMAIBresultingfromfinancialinstrumentsisdeterminedbythefairvalueofthefinancialinstruments.
TheMAIBmitigatesitspriceriskthroughdiversificationofitsportfolioandbyselectingsecuritiesandotherfinancialinstrumentsinaccordancewiththelimitssetintheInvestmentPolicyStatement.
Sensitivity
Thefollowingtabledemonstratestheimpactonprofitaftertaxandequityofmovementsinthepriceoflistedequitiesandunlistedtrusts.Theanalysisisbasedontheassumptionthattheindexeshadincreasedordecreased10%withallothervariablesheldconstantandalltherelatedinstrumentsmovedaccordingtothehistoricalcorrelationwiththeindex.Thisanalysisrepresentsonepossiblescenarioandisnotcertaintooccur.

43
18 Financial instruments continued
2015 $’000
2014$’000
Impactonprofitandequityofa10%priceincrease:
Listedinstruments 1,616 1,672
Unlistedtrusts 70,533 72,772
Impactonprofitandequityofa10%pricedecrease:
Listedinstruments (1,616) (1,672)
Unlistedtrusts (70,533) (72,772)
(ii) Foreign currency risk
Foreigncurrencyriskistheriskthatthefairvalueoffuturecashflowsofafinancialinstrumentwillfluctuatebecauseofchangesinforeignexchangerates.WheretheMAIBholdsassetsdenominatedincurrenciesotherthantheAustraliandollar(thefunctionalcurrency)itisexposedtoforeigncurrencyriskasthevalueofthoseassetswillfluctuateduetochangesinexchangerates.Theriskismeasuredusingsensitivityanalysis.
Aspartofitsriskmanagementstrategy,theMAIB,inconjunctionwithitsassetconsultant,regularlymonitorsitsforeigncurrencyexposure.Forwardcurrencycontractsareusedtomanageexposuresresultingfromchangesinforeigncurrencies.TheuseofforeignexchangeinstrumentsismanagedinaccordancewiththeguidelinessetoutintheMAIB’sInvestmentPolicyStatement.
TheforeignexchangeriskdisclosureshavebeenpreparedonthebasisoftheMAIB’sdirectinvestment.WheretheMAIBinvestsintruststhatinvestininternationalmarkets,theimpactofcurrencymovementisdealtwithasacomponentofpricerisk.ConsequentlythedisclosureofcurrencyriskmaynotrepresentthetruecurrencyriskprofileoftheMAIB.
ThefollowingtableshowstheMAIB’sdirectexposuretoforeigncurrencyrisk.
2015 $’000
2014$’000
UnitedStatesDollar 55,133 2,976
Euro 19,058 11,799
JapaneseYen 14,487 7,345
BritishPound 13,013 8,073
Othercurrencies 11,880 7,263
113,571 37,456
Sensitivity
Theforeigncurrencyrisksensitivityanalysisisconductedonoutstandingforeigncurrencydenominatedinvestmentsandadjuststheirtranslationatperiodendforachangeinforeigncurrencyrates.ThefollowingtabledetailstheMAIB’ssensitivitytoa10%increaseanddecreaseintheAustralianDollaragainsttheforeigncurrencies.
2015 $’000
2014$’000
Impactonprofitandequityofa10%increaseinforeignexchangerates 7,227 2,384
Impactonprofitandequityofa10%decreaseinforeignexchangerates (8,833) (2,913)
(iii) Interest rate risk
Interestrateriskistheriskthatthefairvalueoffuturecashflowsofafinancialinstrumentwillfluctuatebecauseofchangesinmarketinterestrates.TheMAIB’sinterestbearingfinancialassetsandliabilitiesexposeittorisksassociatedwiththeeffectsoffluctuationsintheprevailinglevelsofmarketinterestratesonitsfinancialposition.
TheMAIBmanagesaportionoftheinterestrateriskonitsoutstandingclaimsliabilitybyestablishinganeconomichedgeinitsinvestmentstrategy.Totheextenttheinvestmentassetsandclaimsliabilitiesarematched,unrealisedgainsandlossesonre-measurementofliabilitiesresultingfrommovementsininterestrateswillbeoffsetbyunrealisedlossesorgainsonthere-measurementoftheseinvestmentassets.
Thefollowingtablesummarisestheinterestrateriskexposureofallfinancialinstruments.Theinterestrateriskoftheoutstandingclaimsliabilityisincludedinnote22(b).
Notes to the Financial StatementsFor the year ended 30 June 2015

44 MOTOR ACCIDENTS INSURANCE BOARD ANNUAL REPORT 2014-15
Notes to the Financial StatementsFor the year ended 30 June 2015
18 Financial instruments continued
Maturity dates
30 June 2015
Floating interest rate
$’0001 year or less
$’0001 to 5 years
$’000
More than 5 years $’000
Non-interest bearing
$’000Total $’000
Financial assets
Cashandcashequivalents 23,752 244,210 - - - 267,962
Listedinstruments - - - - 23,085 23,085
Unlistedtrusts - - - - 1,007,619 1,007,619
AustralianGovernmentbonds 27,286 - 39,284 91,073 - 157,643
Otherfinancialinstruments - 1,981 - - 3,878 5,859
Tradeandotherreceivables - - - - 1,789 1,789
Reinsurancerecoveriesreceivable - - - - 24,418 24,418
Totalfinancialassets 51,038 246,191 39,284 91,073 1,060,789 1,488,375
Financial liabilities
Tradeandotherpayables - - - - 2,101 2,101
Otherfinancialinstruments 2,405 - - - 1,503 3,908
Totalfinancialliabilities 2,405 - - - 3,604 6,009
Netfinancialassets/(liabilities) 48,633 246,191 39,284 91,073 1,057,185 1,482,366
30 June 2014
Financial assets
Cashandcashequivalents 286,658 - - - - 286,658
Listedinstruments - - - - 23,890 23,890
Unlistedtrusts - - - - 1,039,676 1,039,676
AustralianGovernmentbonds 31,222 - 53,644 65,035 - 149,901
Otherfinancialinstruments 217 - - - 4,142 4,359
Tradeandotherreceivables - - - - 1,357 1,357
Reinsurancerecoveriesreceivable - - - - 22,336 22,336
Totalfinancialassets 318,097 - 53,644 65,035 1,091,401 1,528,177
Financial liabilities
Tradeandotherpayables - - - - 2,056 2,056
Otherfinancialinstruments 1,284 - - - 163 1,447
Totalfinancialliabilities 1,284 - - - 2,219 3,503
Netfinancialassets/(liabilities) 316,813 - 53,644 65,035 1,089,182 1,524,674
Sensitivity
ThefollowingtabledetailstheMAIB’ssensitivitytoa0.5%increaseanddecreaseininterestratesfromthoseatyearendwithallothervariablesheldconstant.
2015 $’000
2014$’000
Impactonprofitandequityofa0.5%increaseininterestrates (3,381) (3,061)
Impactonprofitandequityofa0.5%decreaseininterestrates 3,383 3,062

45
Notes to the Financial StatementsFor the year ended 30 June 2015
18 Financial instruments continued
(b) Credit risk
Creditriskistheriskthatonepartytoafinancialinstrumentwillcauseafinanciallossfortheotherpartybyfailingtodischargeanobligation.TheMAIBisexposedtocreditriskon:
•cashandcashequivalents;
•tradeandotherreceivables;
•reinsurancerecoveriesreceivable;and
•investments.
Creditriskoninvestmentsarisesfromcashandcashequivalents,debtsecuritiesandderivativefinancialinstrumentsandismanagedinaccordancewiththeMAIB’sInvestmentPolicyStatementwhich:
•limitsinvestmentstoorganisationsthatmeettheprescribedminimumcreditratings;
•limitsthemaximumamountthatmaybeinvestedwithanyonecounterpartyaccordingtoitscreditratingandacrossanyonecreditratingcategory;and
•prescribesminimumcreditratingsfororganisationsthatprovideperformanceguarantees.
ThemajorityoftradeandotherreceivablescomprisespremiumscollectedonbehalfoftheMAIBbytheDepartmentofStateGrowth.PremiumscollectedaretransferredtotheMAIBwithintwobusinessdays.
TheMAIB’spolicyistoplacereinsurancewithbusinesseswhichhaveaminimumStandardandPoor’screditratingof“A”.Abrokerisengagedtofacilitatetheplacementofreinsurancecover.
CreditriskoninvestmentsismonitoredinaccordancewiththeInvestmentPolicyStatement.Externalfundsmanagersandthecustodianarerequiredtomonitorcounterpartyexposureonanongoingbasistoavoidbreachoflimits.Inaddition,managementundertakesanannualreviewofcompliancewiththecreditriskprovisionscontainedintheInvestmentPolicyStatement.Thelevelofinvestmentwithanyonecounterpartyisassessedbasedonthemarketvalueoftheinvestment.
Financialassetsandliabilitiesarerecordedinthestatementoffinancialpositionattheamountwhichrepresentsthemaximumexposuretocreditriskatthereportingdate.TheMAIBdoesnothaveasignificantcreditriskexposuretoanysinglecounterpartyorgroupofcounterpartieswithsimilarcharacteristics.
Therewerenopastdueorimpairedamountsatbalancedate.
Thecreditqualityoffinancialassetsthatareneitherpastduenorimpairedisassessedbyreferencetoexternalcreditratingsortohistoricalinformationaboutcounterpartydefaultrates.
TheMAIB’screditriskexposureisshowninthefollowingtable.
30 June 2015
Investment grade1 $’000
Non investment grade1 $’000
Financial assets
Tradeandotherreceivables 1,755 34
Reinsurancerecoveriesreceivable 24,376 42
Cashandcashequivalents 267,962 -
AustralianGovernmentbonds 157,643 -
Otherfinancialinstruments 1,981 -
453,717 76
30 June 2014
Financial assets
Tradeandotherreceivables 1,344 13
Reinsurancerecoveriesreceivable 22,104 232
Cashandcashequivalents 286,658 -
AustralianGovernmentbonds 149,901 -
460,007 245
1 Assets with Standard and Poor’s credit ratings of AAA to BBB- are classified as investment grade. Assets falling outside this range,
as well as non-rated assets, are classified as non-investment grade.

46 MOTOR ACCIDENTS INSURANCE BOARD ANNUAL REPORT 2014-15
Notes to the Financial StatementsFor the year ended 30 June 2015
18 Financial instruments continued(c) Liquidity risk
LiquidityriskistheriskthattheMAIBwillnotbeabletomeetitsfinancialobligationsastheyfalldue.TheMAIB’sapproachto
managingliquidityistoensure,asfaraspossible,thatitwillhavesufficientliquiditytomeetitsliabilitieswhendue,duringboth
normalandabnormaltradingconditions,withoutincurringunacceptablelossesordamagingitsreputation.TheMAIBiscashflow
positivewithpremiumandinvestmentincomeexceedingclaimsandadministrativepayments.
LiquidityriskismanagedinaccordancewiththeCashManagementandRebalancingPolicyunderwhich:
•Short-termliquidityrequirementsaremonitoredonadailybasiswithexcesses/(shortfalls)inthetradingaccountdeposited/
(withdrawn)fromtheat-callcashaccount.
•Medium/long-termliquidityrequirementsareassessedatleastmonthlyandcashholdingswithintheinvestmentportfolio
areaccumulatedtomeetknownfuturefinancialobligationsastheyfalldue.Thisapproachalsoprovidesaccessatveryshort
noticetosubstantialamountsofcashintheunlikelyeventofanunforeseenobligation.
Maturities of financial instruments
Thefollowingtablesanalysethefinancialliabilitiesbymaturitydatesbasedontheremainingperiodatthereportingdatetothe
contractualmaturitydate.
30 June 2015Less than 3 months
$’0003-12 months
$’000 1+ years
$’000Total $’000
Financial liabilities
Tradeandotherpayables 2,101 - - 2,101
Otherfinancialinstruments 1,459 412 2,037 3,908
3,560 412 2,037 6,009
30 June 2014Lessthan3months
$’0003-12months
$’0001+years
$’000Total$’000
Financial liabilities
Tradeandotherpayables 1,966 45 45 2,056
Otherfinancialinstruments 132 106 1,209 1,447
2,098 151 1,254 3,503
(d) Capital management
TheAustralianPrudentialRegulationAuthority(APRA)istheagencyresponsiblefortheregulationofprivatesectorinsurersin
Australia.AsaGovernmentBusinessEnterprisetheMAIBisnotgovernedbyAPRArequirements.However,whiletheMAIBisnot
subjecttoanyexternallyimposedcapitalrequirements,forthepurposesofgoodgovernanceandsoundcommercialpractice,in
conjunctionwithitsexternalactuaryithasdevelopedaCapitalAdequacyPolicysuitabletoagovernmentcompulsorymonopoly
insurer.
Thecapitalpositionismeasuredbyreferencetothefundingratiowhichisdefinedastheratiooftotalassetslessnon-claimsrelated
liabilities,deferredtaxassetandfuturedividendsowingtothenetoutstandingclaimsandpremiumliabilities.Atargetrangeof
120%to145%hasbeenestablishedbytheBoardofDirectorsfollowingconsultationwithitsactuaryandtakesaccountoftheliability
profileandanassessmentoftheinvestmentriskprofile.At30June2015thefundingratiois127.8%(2014:133.9%).
Theactualandforecastcapitalpositionisexaminedonamonthlybasisandconsiderationofthefundingpositionisintegraltothe
annualcorporateplanningprocessandtheannualreviewandsettingofstrategicassetallocationbenchmarks.

47
Notes to the Financial StatementsFor the year ended 30 June 2015
2015 $’000
2014$’000
19 Plant and equipmentCost
Balanceat1July 1,609 1,460
Additions 227 232
Disposals (827) (83)
Balanceat30June 1,009 1,609
Accumulated depreciation
Balanceat1July 1,037 930
Disposals (633) (58)
Depreciationexpense 165 165
Balanceat30June 569 1,037
Net book value 440 572
20 IntangiblesComputer software
Cost
Balanceat1July 2,476 2,459
Additions 25 17
Disposals (96) -
Balanceat30June 2,405 2,476
Accumulated amortisation
Balanceat1July 2,137 2,042
Disposals (96) -
Amortisationexpense 102 95
Balanceat30June 2,143 2,137
Net book value 262 339
21 Underwriting expensesDeferredacquisitioncostsat1July - -
Acquisitioncostsintheyear 2,793 2,697
Amortisationchargedtoincome (2,798) (2,631)
Writedownforpremiumdeficiency(refernote23) 5 (66)
Deferredacquisitioncostsat30June - -

48 MOTOR ACCIDENTS INSURANCE BOARD ANNUAL REPORT 2014-15
Notes to the Financial StatementsFor the year ended 30 June 2015
22 Outstanding claims liability(a) Actuarial assumptions and methods
The following assumptions have been made in determining the outstanding claims liability.
2015 2014
Scheduled benefits
Common law
Future care
Scheduledbenefits
Commonlaw
Futurecare
Inflatedmeanterm(years) 5.8 2.8 35.0 5.8 2.8 35.6
Discountedmeanterm(years) 4.0 2.7 20.5 3.7 2.6 20.6
Numberofclaimsincurredbutnotreported
(IBNR)489 214 12 461 229 14
Averageclaimsize($‘000) 9.7 54.3 5,561.4 9.5 55.8 5,196.6
Superimposedinflation 1.5% 1.5% 0.0% 1.5% 1.5% 0.0%
Claimshandlingexpenses 6.5% 6.5% 6.5% 7.0% 7.0% 7.0%
Riskmargin 20.0% 20.0% 20.0% 20.0% 20.0% 20.0%
Wage inflation rates Discount rates
Claims expected to be paid in: 2015 2014 2015 2014
Year1(followingendoffinancialyear) 2.77% 3.16% 1.97% 2.45%
Year2 3.19% 3.25% 1.98% 2.62%
Year3 3.42% 3.80% 2.26% 3.04%
Year4 2.83% 3.54% 2.72% 3.39%
Year5 2.61% 3.54% 3.22% 3.68%
Year6 2.83% 3.54% 3.67% 3.94%
Year7 2.97% 3.54% 3.95% 4.17%
Year8 3.02% 3.54% 4.03% 4.37%
Year9 3.04% 3.54% 4.08% 4.54%
Year10 3.06% 3.54% 4.13% 4.68%
Year11 3.09% 3.54% 4.17% 4.86%
Year12 3.11% 3.54% 4.22% 5.01%
Year13 3.13% 3.54% 4.27% 5.15%
Year14 3.16% 3.54% 4.31% 5.23%
Year15 3.18% 3.54% 4.36% 5.29%
Thereafter 3.20% 3.54% 4.40% 5.29%

49
Notes to the Financial StatementsFor the year ended 30 June 2015
22 Outstanding claims liability continued Inflated mean term
Theinflatedmeantermrepresentsthedollarweightedaverageperiodtopaymentofclaimsandisunaffectedbydiscounting.ItprovidesanindicationofthetimeframeoverwhichtheMAIBmustmanageandcontrolthecostoftheseclaims.
Discounted mean term
Thediscountedmeantermisbasedontheinflatedanddiscountedcashflowsweightedbytheperiodtopayment.
Number of claims incurred but not reported
Thenumberofincurredbutnotreported(IBNR)claimsisestimatedbyprojectingthenumberofclaimstobereportedafterthebalancedatearisingfromincidentspriortothatdate.Thisprojectionisbasedonanalysisofhistoricalreportingpatterns.
Average claim size
Theaverageclaimsizeisshownincurrentdollarsonestimatedincurredclaimnumbers(reportedclaimsplusIBNRclaims).
Inflation
Wageinflationisadoptedasthebasefortheinflationofprojectedfuturepaymentsandissetbyreferencetocurrenteconomicindicators.
Superimposed inflation
Superimposedinflationdescribesthegrowthinclaimscoststhatisnotexplainedbywageinflation,forexample,increasesincourtsettlements.
Claims handling expenses
Claimshandlingexpensesarecalculatedbyreferencetopastexperienceofclaimshandlingcostsasapercentageofpastpayments. Claimshandlingexpensesat30June2015areincludedattherateof6.5%offutureclaimpayments(2014:7%).
Risk margin
Estimatesofoutstandingclaimscontainaconsiderabledegreeofuncertaintydueto:
•randomfluctuationsoccurringinthefutureclaimsexperience;
•futurefundamentalchangestotheunderlyingclaimsexperience;and
•imperfectanalysisandmodellingoftheclaimsexperience.
Giventhelong-tailnatureoftheschemeandthesourcesofuncertaintydescribedabove,at30June2015a20%(2014:20%)riskmarginontopoftheactuariallyassessedcentralestimateandfuturecostsofhandlingthoseclaimsnetofreinsurancerecoveriesisincluded.Thisriskmarginprovidesaprobabilityofnotlessthan75%(2014:notlessthan75%)thattheliabilityissufficienttomeetthecostofclaimsincurred.
Discount rates
DiscountratesarebasedonmarketyieldsavailableonCommonwealthGovernmentsecurities,whichapproximatetheriskfreerate.
(b) Sensitivity analysis
Sensitivityanalysesareundertakentoquantifytheexposuretoriskofchangesinthekeyvaluationvariables.Thevaluationsincludedinthereportedresultsarecalculatedusingcertainassumptionsaboutthesevariablesasdisclosedinsection(a)above.ThemovementinanykeyvariablewillimpacttheMAIB’sperformanceandequity.
Theamountoftheoutstandingclaimsliabilityisinherentlyuncertain,forthefollowinggeneralreasons:
(a)Modelsusedtoestimateoutstandingliabilitiesrepresentasimplificationofacomplexclaimsprocess.
(b)Evenifamodelwereaperfectrepresentationofthenatureoftheunderlyingclaimsprocess,pastrandomfluctuationsintheclaimsexperiencemeanthatuncertaintyarisesfromestimatingtheparametersofthemodel.
(c)Anyshortcomingsofand/orerrorsinthedataavailableincreaseuncertaintyregardingtheestimatedparametersofthemodel.
(d)Evenifthetrueunderlyingparameterscouldbedeterminedpreciselyforaperfectmodel,theamountoftheliabilitywouldstillbeuncertainbecauseof:
(i)randomfluctuationsinthefutureclaimexperience;and
(ii)thepossibilityoffuturesystemic,i.e.non-random,changesintheclaimsexperience.
Forsomeportfolios,theextentofuncertaintyattributabletothesourcesdescribedinpoints(b)and(d)(i)abovecanbeestimatedusingstatisticaltechniques.However,uncertaintyattributabletothegeneralsourcesdescribedinpoints(a),(c)and(d)(ii)ismuchmoredifficulttoquantify.

50 MOTOR ACCIDENTS INSURANCE BOARD ANNUAL REPORT 2014-15
Notes to the Financial StatementsFor the year ended 30 June 2015
22 Outstanding claims liability continued
Thefollowingtabledescribeshowachangeinsomeofthekeyvaluationassumptionsaffectstheoutstandingclaimsliability.
Variable Impact of movement in variable
Inflatedanddiscountedmeanterms Adecreaseintheaveragemeantermtosettlementwouldleadtoclaims
beingpaidsoonerthananticipated.Expectedpaymentpatternsareusedin
determiningtheoutstandingclaimsliability.Anincreaseordecreaseinthe
discountedmeantermwouldhaveanopposingeffectontheclaimsexpense.
Numberofclaimsincurredbutnotreported AnincreaseordecreaseintheassumednumberofIBNRclaimswouldhavea
correspondingimpactontheclaimsexpense.
Averageclaimsize Anincreaseordecreaseintheaverageclaimsizewouldhaveacorresponding
impactontheclaimsexpense.
Wageinflationandsuperimposedinflation Expectedfuturepaymentsareinflatedtotakeaccountofinflationaryincreases.
Anincreaseordecreaseintheassumedlevelsofeitherwageinflationor
superimposedinflationwouldhaveacorrespondingimpactontheclaims
expense.
Claimshandlingexpenses Anincreaseordecreaseintheexpectedclaimshandlingexpenseswillhavea
correspondingimpactontheclaimsexpense.
Riskmargin Anincreaseordecreaseintheriskmarginwillhaveacorrespondingimpacton
theclaimsexpense.
Discountrate Theoutstandingclaimsliabilityiscalculatedbyreferencetoexpectedfuture
payments.Thesepaymentsarediscountedtoadjustforthetimevalueof
money.Anincreaseordecreaseintheassumeddiscountratewillhavean
opposingimpactontheclaimsexpense.
Thefollowingtableillustratesthesensitivityofprofit/(loss)andequitytochangesinsomeofthekeyvaluationassumptionsdescribed
above.Notethatthetableisillustrativeonly,anditisnotintendedthatitcovertherangeofpotentialvariations.
Profit/(loss) from continuing
operations $’000
Equity $’000
Recognisedamountsasperthe2015financialstatements 99,865 440,121
Inflationincreaseby0.5% 44,380 384,636
Inflationdecreaseby0.5% 148,068 488,324
Discountrateincreasedby0.5%alldurations 147,694 487,950
Discountratedecreasedby0.5%alldurations 44,360 384,615
Longtermdiscountrateincreasedby0.5% 102,878 443,134
Longtermdiscountratedecreasedby0.5% 96,789 437,045
CostofcurrentyearFutureCareIBNRclaimsincreasedby10% 94,164 434,420
CostofcurrentyearFutureCareIBNRclaimsdecreasedby10% 105,565 445,821
CommonLawsettlementsizeincreasedby10% 85,300 425,556
CommonLawsettlementsizedecreasedby10% 114,345 454,601
ScheduledBenefitsaveragesizeincreasedby10% 96,453 436,709
ScheduledBenefitsaveragesizedecreasedby10% 103,276 443,532
Increaseinhospitalcostadjustmentfromdoubletotriplecurrentrates 96,280 436,535
Hospitalcostadjustmenteffectiveimmediatelyratherthan30June2016 96,594 436,850
Reinsurancerecoveriesincreasedby20%duetofavourablecommutations 100,548 440,804
Increaseindiscountedmeantermby1yearduetoadelayinpayments 97,854 438,110
Decreasediscountedmeantermby1yearbybringingforwardpayments 101,870 442,126

51
Notes to the Financial StatementsFor the year ended 30 June 2015
22 Outstanding claims liability continued
Profit/(loss) from continuing
operations $’000
Equity $’000
Recognisedamountsasperthe2014financialstatements 125,498 484,380
Inflationincreaseby0.5% 73,063 431,945
Inflationdecreaseby0.5% 171,017 529,899
Discountrateincreasedby0.5%alldurations 170,571 529,453
Discountratedecreasedby0.5%alldurations 73,176 432,058
Longtermdiscountrateincreasedby0.5% 144,424 503,306
Longtermdiscountratedecreasedby0.5% 104,050 462,932
CostofcurrentyearFutureCareIBNRclaimsincreasedby10% 122,038 480,920
CostofcurrentyearFutureCareIBNRclaimsdecreasedby10% 128,959 487,841
CommonLawsettlementsizeincreasedby10% 109,973 468,855
CommonLawsettlementsizedecreasedby10% 141,001 499,883
ScheduledBenefitsaveragesizeincreasedby10% 121,983 480,865
ScheduledBenefitsaveragesizedecreasedby10% 129,013 487,895
Increaseinhospitalcostadjustmentfromdoubletotriplecurrentrates 122,099 480,981
Hospitalcostadjustmenteffectiveimmediatelyratherthan30June2015 122,256 481,138
Reinsurancerecoveriesincreasedby20%duetofavourablecommutations 129,251 488,133
Increaseindiscountedmeantermby1yearduetoadelayinpayments 131,572 490,454
Decreasediscountedmeantermby1yearbybringingforwardpayments 119,366 478,248
(c) Maturity analysis
Thefollowingtablepresentsamaturityanalysisoftheestimatednetdiscountedoutstandingclaimsliabilitybasedontheremaining
termtopaymentatthereportingdate.
30 June 2015
Less than 12 months
$’000
12 months to 10 years
$’000
11 years to 20 years
$’000
20+ years
$’000
Total
$’000
Outstandingclaimsliability 91,362 380,478 186,344 317,280 975,464
91,362 380,478 186,344 317,280 975,464
30 June 2014
Lessthan12months
$’000
12monthsto10years
$’000
11yearsto20years
$’000
20+years
$’000
Total
$’000
Outstandingclaimsliability 97,338 384,237 175,397 295,711 952,683
97,338 384,237 175,397 295,711 952,683

52 MOTOR ACCIDENTS INSURANCE BOARD ANNUAL REPORT 2014-15
Notes to the Financial StatementsFor the year ended 30 June 2015
22 Outstanding claims liability continued(d) Outstanding claims liability by benefit type
Inrecognitionofthethreeclaimsliabilitystreams,theoutstandingclaimsliabilityiscalculatedunderthecategoriesof
scheduledbenefits,commonlawandfuturecareclaims.Thereconciliationbetweentheundiscountedanddiscountedclosing
provisionisasfollows.
2015 $’000
2014$’000
Scheduled benefits claims
Expectedfutureclaimspayments(inflated/undiscounted) 44,356 43,930
Discounttopresentvalue (6,367) (7,103)
Claimshandlingexpenses 2,623 2,738
Riskmargin 8,122 7,913
48,734 47,478
Common law claims
Expectedfutureclaimspayments(inflated/undiscounted) 174,528 192,987
Discounttopresentvalue (10,705) (14,631)
Claimshandlingexpenses 11,355 13,312
Riskmargin 35,036 38,334
210,214 230,002
Future care claims
Expectedfutureclaimspayments(inflated/undiscounted) 1,741,739 1,848,691
Discounttopresentvalue (1,178,767) (1,320,877)
Claimshandlingexpenses 38,194 38,578
Riskmargin 115,350 108,811
716,516 675,203
All claims
Expectedfutureclaimspayments(inflated/undiscounted) 1,960,623 2,085,608
Discounttopresentvalue (1,195,839) (1,342,611)
Claimshandlingexpenses 52,172 54,628
Riskmargin 158,508 155,058
975,464 952,683
Duewithin12months 91,362 97,338
Dueinmorethan12months 884,102 855,345
975,464 952,683
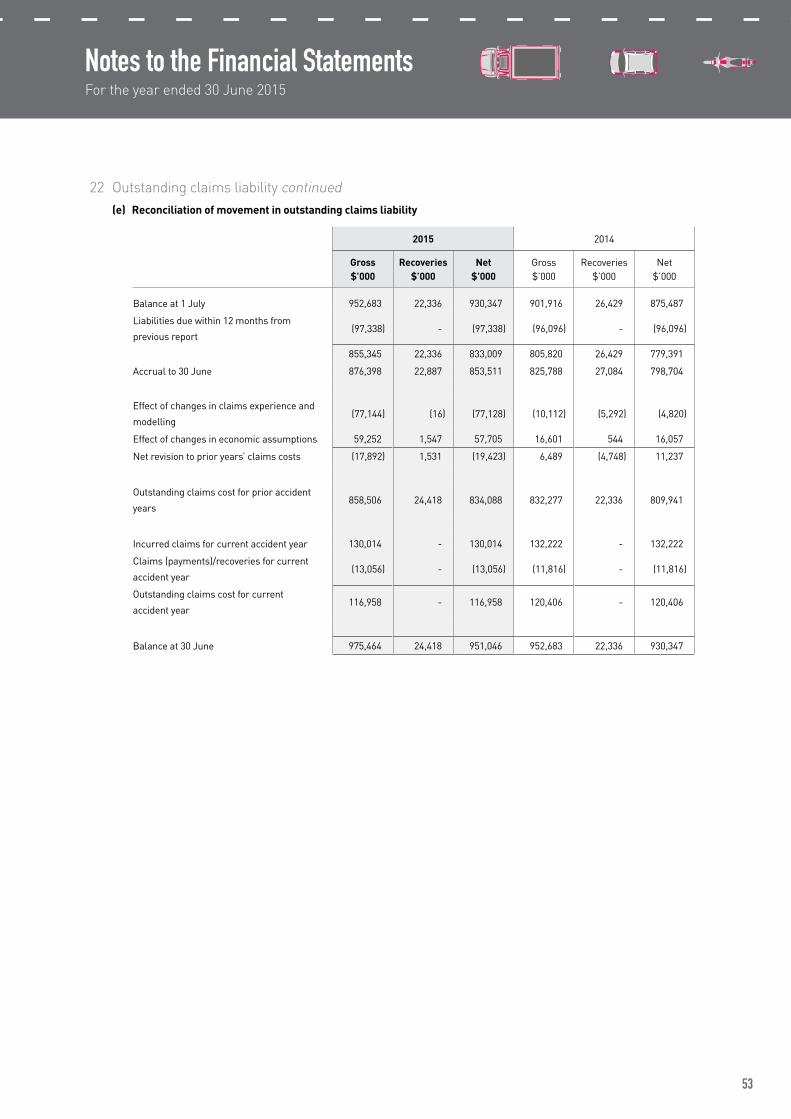
53
Notes to the Financial StatementsFor the year ended 30 June 2015
22 Outstanding claims liability continued (e) Reconciliation of movement in outstanding claims liability
2015 2014
Gross $’000
Recoveries $’000
Net $’000
Gross$’000
Recoveries$’000
Net$’000
Balanceat1July 952,683 22,336 930,347 901,916 26,429 875,487
Liabilitiesduewithin12monthsfrom
previousreport(97,338) - (97,338) (96,096) - (96,096)
855,345 22,336 833,009 805,820 26,429 779,391
Accrualto30June 876,398 22,887 853,511 825,788 27,084 798,704
Effectofchangesinclaimsexperienceand
modelling(77,144) (16) (77,128) (10,112) (5,292) (4,820)
Effectofchangesineconomicassumptions 59,252 1,547 57,705 16,601 544 16,057
Netrevisiontoprioryears’claimscosts (17,892) 1,531 (19,423) 6,489 (4,748) 11,237
Outstandingclaimscostforprioraccident
years858,506 24,418 834,088 832,277 22,336 809,941
Incurredclaimsforcurrentaccidentyear 130,014 - 130,014 132,222 - 132,222
Claims(payments)/recoveriesforcurrent
accidentyear(13,056) - (13,056) (11,816) - (11,816)
Outstandingclaimscostforcurrent
accidentyear116,958 - 116,958 120,406 - 120,406
Balanceat30June 975,464 24,418 951,046 952,683 22,336 930,347

54 MOTOR ACCIDENTS INSURANCE BOARD ANNUAL REPORT 2014-15
Notes to the Financial StatementsFor the year ended 30 June 2015
22 Outstanding claims liability continued (f) Claims development table
Thefollowingtablesshowthedevelopmentofundiscountedoutstandingclaimsgrossandnetofreinsurancerecoveriesrelativetothe
ultimateexpectedclaimsforthetenmostrecentaccidentyears.
Accident year
2006$’000
2007$’000
2008$’000
2009$’000
2010$’000
2011$’000
2012$’000
2013$’000
2014$’000
2015$’000
Total $’000
Gross of reinsurance recoveries
Estimate of ultimate claims cost:
Atendofaccidentyear 288,839 397,697 363,894 281,693 263,884 201,081 218,081 249,933 240,801 208,032
Oneyearlater 340,652 348,300 242,314 297,639 223,297 111,109 221,189 210,096 162,877
Twoyearslater 307,592 205,414 214,801 291,303 198,314 116,768 106,355 158,319
Threeyearslater 194,869 170,510 186,141 235,532 181,337 146,081 176,931
Fouryearslater 193,756 166,291 158,180 251,943 237,782 79,949
Fiveyearslater 203,967 131,362 160,118 169,404 152,367
Sixyearslater 175,132 137,430 116,772 226,806
Sevenyearslater 183,713 183,231 162,847
Eightyearslater 143,850 124,388
Nineyearslater 164,335
Currentestimateof
cumulativeclaimscost164,335 124,388 162,847 226,806 152,367 79,949 176,931 158,319 162,877 208,032 1,616,851
Cumulativepayments (61,104) (64,868) (59,351) (69,724) (60,640) (50,052) (38,084) (30,840) (22,600) (12,920) (470,183)
Outstandingclaims
(undiscounted)103,231 59,520 103,496 157,082 91,727 29,897 138,847 127,479 140,277 195,112 1,146,668
Discount (676,789)
2005andprior(discounted) 294,906
Claimshandlingexpense 52,171
Prudentialmargins 158,508
Outstandingclaims(inflated&discounted) 975,464

55
Notes to the Financial StatementsFor the year ended 30 June 2015
22 Outstanding claims liability continued
Accident year
2006$’000
2007$’000
2008$’000
2009$’000
2010$’000
2011$’000
2012$’000
2013$’000
2014$’000
2015$’000
Total $’000
Net of reinsurance recoveries
Estimate of ultimate claims cost:
Atendofaccidentyear 288,839 397,697 363,894 281,693 263,884 201,081 218,081 249,933 240,801 208,032
Oneyearlater 340,652 348,300 242,314 297,639 212,172 111,109 221,189 210,096 162,877
Twoyearslater 307,592 205,414 207,085 289,837 183,945 116,768 106,355 158,319
Threeyearslater 194,869 170,510 183,277 228,184 162,323 146,081 176,931
Fouryearslater 193,756 166,291 151,970 242,499 208,053 79,949
Fiveyearslater 203,967 131,362 152,400 164,220 126,817
Sixyearslater 175,132 135,903 103,326 220,135
Sevenyearslater 182,128 181,704 150,162
Eightyearslater 142,234 122,861
Nineyearslater 162,720
Currentestimateof
cumulativeclaimscost162,720 122,861 150,162 220,135 126,817 79,949 176,931 158,319 162,877 208,032 1,568,803
Cumulativepayments (59,488) (63,340) (59,351) (69,724) (60,640) (50,052) (38,084) (30,840) (22,600) (12,920) (467,039)
Outstandingclaims
(undiscounted)103,232 59,521 90,811 150,411 66,177 29,897 138,847 127,479 140,277 195,112 1,101,764
Discount (642,455)
2005andprior(discounted) 281,058
Claimshandlingexpense 52,171
Prudentialmargins 158,508
Outstandingclaims(inflated&discounted) 951,046
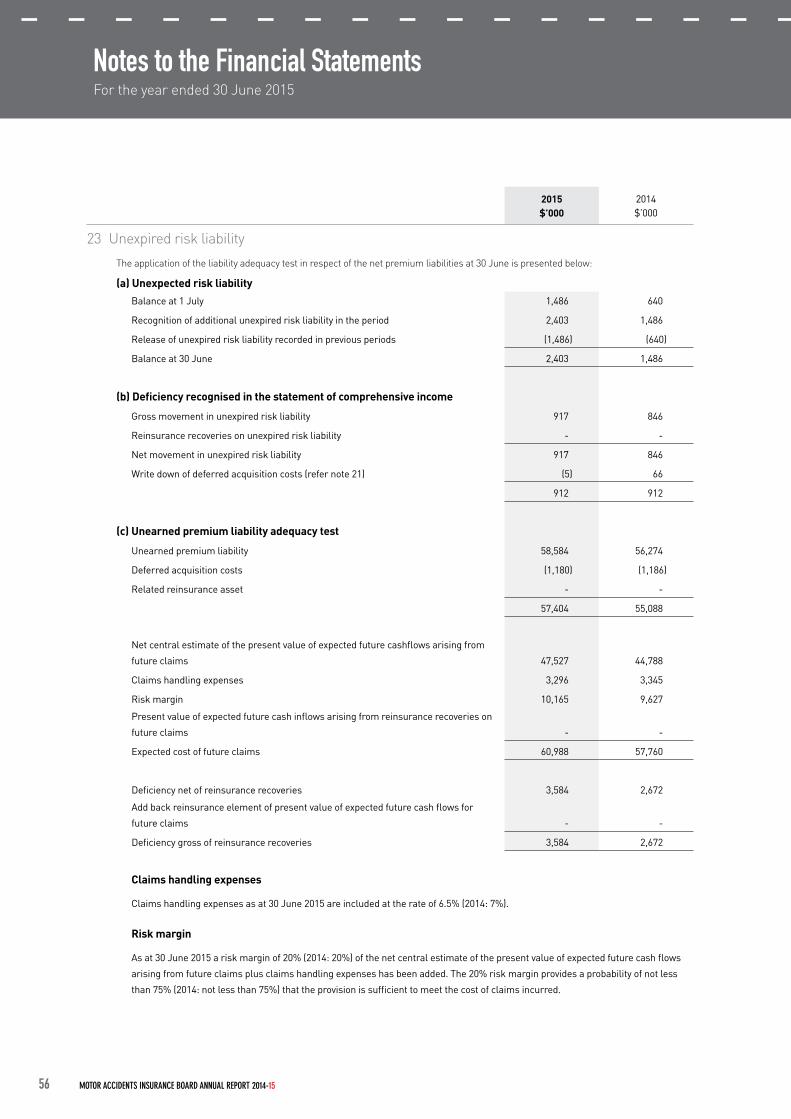
56 MOTOR ACCIDENTS INSURANCE BOARD ANNUAL REPORT 2014-15
Notes to the Financial StatementsFor the year ended 30 June 2015
2015 $’000
2014$’000
23 Unexpired risk liability
The application of the liability adequacy test in respect of the net premium liabilities at 30 June is presented below:
(a) Unexpected risk liability
Balanceat1July 1,486 640
Recognitionofadditionalunexpiredriskliabilityintheperiod 2,403 1,486
Releaseofunexpiredriskliabilityrecordedinpreviousperiods (1,486) (640)
Balanceat30June 2,403 1,486
(b) Deficiency recognised in the statement of comprehensive income
Grossmovementinunexpiredriskliability 917 846
Reinsurancerecoveriesonunexpiredriskliability - -
Netmovementinunexpiredriskliability 917 846
Writedownofdeferredacquisitioncosts(refernote21) (5) 66
912 912
(c) Unearned premium liability adequacy test
Unearnedpremiumliability 58,584 56,274
Deferredacquisitioncosts (1,180) (1,186)
Relatedreinsuranceasset - -
57,404 55,088
Netcentralestimateofthepresentvalueofexpectedfuturecashflowsarisingfrom
futureclaims 47,527 44,788
Claimshandlingexpenses 3,296 3,345
Riskmargin 10,165 9,627
Presentvalueofexpectedfuturecashinflowsarisingfromreinsurancerecoverieson
futureclaims - -
Expectedcostoffutureclaims 60,988 57,760
Deficiencynetofreinsurancerecoveries 3,584 2,672
Addbackreinsuranceelementofpresentvalueofexpectedfuturecashflowsfor
futureclaims - -
Deficiencygrossofreinsurancerecoveries 3,584 2,672
Claims handling expenses
Claimshandlingexpensesasat30June2015areincludedattherateof6.5%(2014:7%).
Risk margin
Asat30June2015ariskmarginof20%(2014:20%)ofthenetcentralestimateofthepresentvalueofexpectedfuturecashflows
arisingfromfutureclaimsplusclaimshandlingexpenseshasbeenadded.The20%riskmarginprovidesaprobabilityofnotless
than75%(2014:notlessthan75%)thattheprovisionissufficienttomeetthecostofclaimsincurred.
24 Provision for Employee Benefits continued

57
Notes to the Financial StatementsFor the year ended 30 June 2015
2015 $’000
2014$’000
24 Provision for employee benefits
Due within 12 months
Annualleave 212 238
Longserviceleave 29 126
RetirementBenefitsFund 49 82
290 446
Due in more than 12 months
Longserviceleave 355 356
RetirementBenefitsFund 4,563 4,885
4,918 5,241
Totalemployeebenefits 5,208 5,687
Retirement Benefits Fund contributions
Definedbenefitmembersreceivelumpsumbenefitsonresignationandlumpsumorpensionbenefitsonretirement,deathorinvalidity.ThedefinedbenefitsectionofRetirementBenefitsFund(RBF)isclosedtonewmembers.Allnewmembersreceiveaccumulationonlybenefits.
Compulsory preserved benefits
FormermembersoftheContributoryschemeandtheformerNon-contributoryschemewhohaveleftservicepriortothepreservationagehavehadtheMAIB’scomponentoftheirbenefittransferredtoaCompulsoryPreservedbenefitaccount.
TheCompulsoryPreservedbenefitispayableintheeventofdeath,incapacityoronattainingpreservationageorotherwisesatisfyingaconditionofrelease.Whenamemberreacheshisorherpreservationage,theCompulsoryPreservedlumpsumbenefitisfundedandmaybepaidtothememberifheorshehasretiredfromtheworkforce.Ifthememberremainsinemploymentitistransferredtotheinvestmentaccount,arolloverfundorcomplyingsuperannuationschemenominatedbythemember.TheCompulsoryPreservedbenefitisincreasedeachsixmonthsbythegreaterofCPIorAWOTE.
Pensioners
Membersareabletoelecttotaketheirbenefitsintheformofapension.Pensionsarepayablethroughoutthelifetimeoftheformermemberandarepayabletoasurvivingwidoworwidowerattwothirdsofthepensionatthetimeofdeath.
PensionsareindexedinlinewithCPI,withindexationoccurringtwiceeachyear.
Regulatory framework
TheschemeoperatesundertheRetirement Benefits Act 1993andtheRetirement Benefits Regulations 2005.
AlthoughtheschemeisnotformallysubjecttotheSuperannuationIndustry(Supervision)(SIS)legislation,theTasmanianGovernmenthasundertaken(inaHeadsofGovernmentAgreement)tooperatetheschemeinaccordancewiththespiritoftheSISlegislation.
Asanexemptpublicsectorsuperannuationscheme(asdefinedintheSISlegislation),theschemeisnotsubjecttoanyminimumfundingrequirements.
RBFisacomplyingsuperannuationfundwithintheprovisionsoftheIncome Tax Assessment Act 1997suchthatthefund’staxableincomeistaxedataconcessionalrateof15%.However,RBFisalsoapublicsectorsuperannuationschemewhichmeansthattheemployercontributionsmaynotbesubjecttothe15%tax(iftheRBFBoardelects)uptotheamountof“untaxed”benefitspaidtomembersintheyear.
Other entities responsibilities for the governance of the scheme
TheRBFBoard(theBoard)isresponsibleforthegovernanceofthescheme.Astrustee,theBoardhasalegalobligationtoactsolelyinthebestinterestoftheschemebeneficiaries.TheBoardhasthefollowingroles:
•Administrationoftheschemeandpaymenttothebeneficiarieswhenrequiredinaccordancewiththeschemerules;
•Managementandinvestmentoftheschemeassets;and
•CompliancewiththeHeadsofGovernmentAgreementreferredtoabove.
24 Provision for Employee Benefits continued

58 MOTOR ACCIDENTS INSURANCE BOARD ANNUAL REPORT 2014-15
Notes to the Financial StatementsFor the year ended 30 June 2015
24 Provision for employee benefits continued
Risks
ThereareanumberofriskstowhichtheschemeexposestheMAIB.Themoresignificantrisksrelatingtothedefinedbenefitsare:
• Investment risk–Theriskthatinvestmentreturnswillbelowerthanassumedandemployerswillneedtoincreasecontributionstooffsetthisshortfall.
• Salary growth risk–Theriskthatwagesorsalaries(onwhichfuturebenefitamountswillbebased)willrisemorerapidlythanassumed,increasingdefinedbenefitamountsandtheassociatedemployercontributions.
• Inflation risk–Theriskthatinflationishigherthananticipated,increasingpensionpaymentsandtheassociatedemployercontributions.
• Benefit options risk–Theriskthatagreaterproportionofmemberswhojoinedpriorto1July1994willelectthepensionoption,whichisgenerallymorecostlythanthealternativelumpsumoption.
• Pensioner mortality risk–Theriskthatpensionermortalitywillbelighterthanexpected,resultinginpensionsbeingpaidforalongerperiod.
• Legislative risk–theriskthatlegislativechangescouldbemadewhichincreasethecostofprovidingthedefinedbenefits.
Significant events
Therewerenoplanamendments,curtailmentsorsettlementsduringtheyear.
Methodology
LiabilitieshavebeencomputedusingtheProjectedUnitCreditMethod.Theobjectiveunderthismethodistoexpenseeachmember’sbenefitsastheywouldaccrue,takingintoconsiderationfuturesalaryincreasesandthebenefitallocationformula.Thetotalbenefittowhicheachmemberisexpectedtobecomeentitledisbrokendownintounits,eachassociatedwithayearofpastorfuturecreditedservice.
Liabilitiesforexistingpensionershavebeencalculatedallowingforthelevelsoftheexistingpension,thelevelofassumedpensionindexationandexpectedmortalityrates.
Liabilitiesforcompulsorypreservedmembershavebeencalculatedallowingfortheleveloftheexistingbenefit,thelevelofassumedindexationandexpectedretirementrates.
ThecalculatedDefinedBenefitObligationisthesumoftheaccruedliabilitiesforallrelevantemployees.
Reconciliation of the net defined benefit obligation
Thedefinedbenefitobligationconsistsentirelyofamountsfromplansthatarewhollyorpartlyfunded.
2015 $’000
2014$’000
Reconciliation of the net defined benefit liability/(asset)
Definedbenefitobligation 5,385 5,612
(-)Fairvalueofplanassets 773 645
Deficit/(surplus) 4,612 4,967
(+)Adjustmentforeffectofassetceiling - -
Netsuperannuationliability/(asset) 4,612 4,967
Duewithin12months 49 82
Dueinmorethan12months 4,563 4,885
4,612 4,967

59
Notes to the Financial StatementsFor the year ended 30 June 2015
24 Provision for employee benefits continued
2015 $’000
2014$’000
Reconciliation of the fair value of scheme assets
Fairvalueofplanassetsat1July 645 592
(+)Interestincome 27 25
(+)Actualreturnonplanassetslessinterestincome 86 17
(+)Employercontributions 63 15
(+)Contributionsbyplanparticipants 38 37
(-)Benefitspaid 81 36
(-)Taxes,premiums&expensespaid 5 5
(+)Transfersin - -
(-)Contributionstoaccumulationsection - -
(+)Settlements - -
(+)Exchangeratechanges - -
Fair value plan assets at 30 June 773 645
Reconciliation of the defined benefit obligation
Presentvalueofdefinedbenefitobligationsat1July 5,612 4,810
(+)Currentservicecost 143 136
(+)Interestcost 228 204
(+)Contributionsbyplanparticipants 38 37
(+)Actuarial(gains)/lossesarisingfromchangesindemographicassumptions - 280
(+)Actuarial(gains)/lossesarisingfromchangesinfinancialassumptions (829) 295
(+)Actuarial(gains)/lossesarisingfromliabilityexperience 279 (108)
(-)Benefitspaid 81 36
(-)Taxes,premiums&expensespaid 5 6
(+)Transfersin - -
(-)Contributionstoaccumulationsection - -
(+)Pastservicecost - -
(+)Gains/lossonsettlements - -
(+)Settlements - -
(+)Exchangeratechanges - -
Presentvalueofdefinedbenefitobligationsat30June 5,385 5,612

60 MOTOR ACCIDENTS INSURANCE BOARD ANNUAL REPORT 2014-15
Notes to the Financial StatementsFor the year ended 30 June 2015
24 Provision for employee benefits continued
Reconciliation of the effect of the asset ceiling
Theassetceilinghasnoimpactonthenetdefinedbenefitliability/(asset).
Fair value of scheme assets
30 June 20151
Asset category
Total
$’000
Quoted prices in active markets for
identical assets Level 1 $’000
Significant observable inputs
Level 2 $’000
Unobservable inputs
Level 3 $’000
Cashandcashequivalents 134 135 - -
Equityinstruments 528 240 232 56
Debtinstruments 104 28 43 33
Derivatives 1 - 1 -
RealEstate 6 - 6 -
Investmentfunds - - - -
Asset-backedsecurities - - - -
Structureddebt - - - -
773 403 282 89
1Estimated based on assets allocated to the MAIB at 30 June 2015 and asset allocation of the RBF scheme at 30 June 2014.
Fair value of entities own financial instruments
Thefairvalueofschemeassetsincludesnoamountsrelatingto:
•anyoftheMAIB’sownfinancialinstruments;or
•anypropertyoccupiedby,orotherassetsusedbytheMAIB.
AssetsarenotheldseparatelyforeachreportingentitybutareheldfortheFundasawhole.Thefairvalueofschemeassetsforeachreporting
entitywasestimatedbyallocatingthetotalFundassetsinproportiontothevalueofeachreportingentity’sfundedliabilities,calculatedusing
theassumptionsoutlinedinthisreport.
Significant actuarial assumptions at the reporting date
2015 % pa
2014%pa
Assumptions to determine defined benefit cost and start of year defined benefit obligation
Discountrate(activemembers) 4.10 4.25
Discountrate(pensioners) 4.10 4.25
Expectedrateofincreaseofcompulsorypreservedamounts 4.50 3.75
Expectedsalaryincreaserate 3.00 3.00
Expectedpensionincreaserate 2.50 2.50
Assumptions to determine end of year defined benefit obligation
Discountrate(activemembers) 4.80 4.10
Discountrate(pensioners) 4.80 4.10
Expectedsalaryincreaserate 3.00 3.00
Expectedrateofincreaseofcompulsorypreservedamounts 4.50 4.50
Expectedpensionincreaserate 2.50 2.50

61
Notes to the Financial StatementsFor the year ended 30 June 2015
24 Provision for employee benefits continued
Sensitivity analysis
Thedefinedbenefitobligationasat30June2015underseveralscenariosispresentedbelow.
ScenarioAandBrelatetodiscountsensitivity.ScenarioCandDrelatetoexpectedpensionincreaseratesensitivity,asfollows:
•ScenarioA:0.5%palowerdiscountrateassumption.
•ScenarioB:0.5%pahigherdiscountrateassumption.
•ScenarioC:0.5%palowerexpectedpensionincreaserateassumption.
•ScenarioD:0.5%pahigherexpectedpensionincreaserateassumption.
Base Case Scenario A Scenario B Scenario C Scenario D
-0.5% pa discount rate
+0.5% pa discount rate
-0.5% pa pension
increase rate
+0.5% pa pension
increase rate
Discountrate 4.80%pa 4.30%pa 5.30%pa 4.80%pa 4.80%pa
Pensionincreaserate 2.50%pa 2.50%pa 2.50%pa 2.00%pa 3.00%pa
Definedbenefitobligation($’000) 5,385 5,961 4,885 5,174 5,619
Thedefinedbenefitobligationhasbeenrecalculatedbychangingtheassumptionsasoutlinedabove,whilstretainingallotherassumptions.
Asset-liability matching strategies
TheMAIBisnotawareofanyassetandliabilitymatchingstrategiesadoptedbytheFund.
Funding arrangements
Theemployercontributesapercentageofeachlumpsumorpensionbenefitpayment.ThispercentagemaybeamendedbytheMinister
ontheadviceoftheActuary.
2016$’000
Expected contributions
Financial year ending 30 June
Expectedemployercontributions 49
Maturity profile of defined benefit obligation
TheweightedaveragedurationofthedefinedbenefitobligationfortheMAIBis20.9years.
2015 $’000
2014$’000
25 Unearned premium liabilityBalanceat1July 56,274 59,951
Earningofpremiumswritteninpreviousperiods (56,274) (59,951)
Premiumswrittenincurrentperiod 136,776 135,862
Earningofpremiumswrittenincurrentperiod (78,192) (79,588)
Balanceat30June 58,584 56,274

62 MOTOR ACCIDENTS INSURANCE BOARD ANNUAL REPORT 2014-15
Notes to the Financial StatementsFor the year ended 30 June 2015
2015 $’000
2014$’000
26 Trade and other payablesSundrycreditors 1,632 1,645
Accruedexpenses-employeeoncosts 27 36
Accruedexpenses-other 442 375
2,101 2,056
Duewithin12months
Sundrycreditors 1,632 1,645
Accruedexpenses-employeeoncosts 11 18
Accruedexpenses-other 442 375
2,085 2,038
Dueinmorethan12months
Accruedexpenses-employeeoncosts 16 18
16 18
2,101 2,056
27 CommitmentsRoadSafetyAdvisoryCouncil
Lessthan1year 3,638 1,740
1to5years 3,748 -
Greaterthan5years - -
7,386 1,740
28 Statement of cash flows (a) Reconciliation of net cash provided by operating activities to profit and
loss from continuing operations
Profit/(loss)fromcontinuingoperations 99,865 125,498
Depreciationandamortisation 266 260
Loss/(profit)onsaleofplantandequipment 119 6
Netunrealisedloss/(gain)innetmarketvalueofinvestments (70,734) (79,001)
Netrealisedloss/(gain)innetmarketvalueofinvestments (313) (51,237)
Netunrealisedloss/(gain)innetmarketvalueofinvestmentproperties 46 135
Netretainedearningremeasurementsofdefinedbenefitsuperannuationplans 446 (315)
Decrease/(increase)indeferredtaxasset 17,236 3,573
Decrease/(increase)inreinsurancerecoveriesreceivable (2,081) 4,093
Decrease/(increase)intradeandotherreceivables (407) 780
Decrease/(increase)inotherassets (1,789) 24
Decrease/(increase)inaccrueddividendsandinterest 1,274 (12)
Increase/(decrease)inoutstandingclaimsliability 22,781 50,767
Increase/(decrease)intaxpayable (39,209) 32,862
Increase/(decrease)inunexpiredriskliability 918 846
Increase/(decrease)inemployeebenefits (480) 775
Increase/(decrease)intradeandotherpayables 23 (821)
Increase/(decrease)inunearnedpremiumliability 2,311 (3,677)
Netcashflowfromoperatingactivities 30,272 84,556

63
Notes to the Financial StatementsFor the year ended 30 June 2015
28 Statement of cash flows continued(b) Financing facilities
At30June2015theMAIBhassevencorporatecreditcardswithatotallimitof$60,000(2014:$55,000).Thebalanceispaidinfull
onamonthlybasis.TheMAIBhasnoformalcreditstandbyarrangementsorunusedloanfacilities.
29 Road Safety Advisory Council
Fortheyearended30June2015contributionsamountingto$3,541,000(2014:$3,480,000)werepaidtotheRoadSafetyAdvisoryCouncil.
AMemorandumofUnderstandingbetweentheMAIB,DepartmentofPoliceandEmergencyManagementandtheDepartmentofState
Growthisinoperationandspecifiestherelevantkeyperformanceindicators.
30 Injury Prevention and Management Foundation
LegislationisinplacewhichallowstheMAIBtofundresearchandeducationandtoservicedevelopmentprogramsthataredirected
towardsthepreventionandimprovedmanagementofinjuriesresultingfrommotoraccidents.
FundingfortheInjuryPreventionandManagementFoundationisbywayofupto1%ofpremiumincomeeachyear.Projectsareapproved
bytheBoardofDirectorsupontherecommendationfromaCommitteesetuptoadministertheFoundation.Fortheyearended30June
2015projectsamountingto$584,926(2014:$54,572)wereapproved.
31 Motorcycle safety strategy Fortheyearended30June2015contributionsamountingto$1,582(2014:$10,786)werepaidinsponsorshipofmotorcycleridereducation
andtrainingunderthemotorcyclesafetystrategy.Ridertrainingissubsidisedperparticipant.
32 Auditor’s remuneration
TheamountpayabletotheAuditor-Generalfortheyearended30June2015is$105,500(2014:$61,675).
33 Dividends Followingtheendofthefinancialyear,afinalordinarydividendrelatingtotheyearended30June2015of$47,691,524(2014:$44,570,226)
isrecommended.
34 Events after the reporting period Therehasbeennomatterorcircumstanceoccurringsubsequenttotheendofthefinancialyearthathassignificantlyaffectedormay
significantlyaffecttheoperationsoftheMAIB.
35 Key management personnel information
(a) Directors
ThefollowingpersonsweredirectorsoftheMAIBduringthefinancialyear:
(i) Nonexecutivedirectors
DWChallenAM
KBarker
MDontschuk
DJMcCarthy
DCSt.John
MEScanlon(to25May2015)
(ii) Executivedirector
PJRoche(to4February2015) ChiefExecutiveOfficer

64 MOTOR ACCIDENTS INSURANCE BOARD ANNUAL REPORT 2014-15
Notes to the Financial StatementsFor the year ended 30 June 2015
35 Key management personnel information continued
(b) Other key management personnel
Thefollowingpersonsalsohadauthorityandresponsibilityforplanning,directingandcontrollingtheactivitiesoftheMAIB,directlyorindirectly,duringthefinancialyear:
PJKingston(from5February2015) ChiefExecutiveOfficer
CMQHill ChiefOperatingOfficer
DWThurm ChiefFinancialOfficer
2015 $’000
2014$’000
(c) Key management personnel compensation
Short-termemployeebenefits 931 1,008
Postemploymentbenefits 101 108
Otherlong-termemployeebenefits (96) (1)
Terminationbenefits 148 -
1,084 1,115
(d) Non-executive director remuneration
Thefollowingtabledisclosestheremunerationdetailsinbandsforeachpersonthatactedasanon-executivedirectorduringthe
financialyear:
2015
Name Position Director Fees $’000
Committee Fees $’000
Superannuation $’000
Other Benefits $’000
Total $’000
DWChallenAM Chairman 74 6 8 - 88
KBarker Director 35 6 4 - 45
MDontschuk Director 35 6 4 - 45
DJMcCarthy Director 35 6 4 - 45
MEScanlon1 Director 33 7 4 - 44
DCSt.John Director 35 6 4 - 45
247 37 28 - 312
1 ME Scanlon’s appointment as director concluded 25 May 2015.
2014
Name Position DirectorFees$’000
CommitteeFees$’000
Superannuation$’000
OtherBenefits$’000
Total$’000
DWChallenAM Chairman 75 6 7 - 88
KBarker Director 35 6 4 - 45
MDontschuk Director 35 6 4 - 45
DJMcCarthy Director 35 6 4 - 45
CRockefeller1 Director 32 5 3 - 40
MEScanlon Director 35 7 4 - 46
DCSt.John Director 35 6 4 - 45
282 42 30 - 354
1 CJ Rockefeller’s appointment as director concluded 15 May 2014.

65
Notes to the Financial StatementsFor the year ended 30 June 2015
35 Key management personnel information continued
(e) Executive remuneration
Thefollowingtabledisclosestheremunerationdetailsforthosepersonswhoactedasseniorexecutivesduringthefinancialyear.
2015
Name PositionGross
Salary1
Short-Term Incentive
Payments2
Termination Benefits3
Super-annuation4 Vehicle5 Other Benefits6
Total Cash Benefits
Other Non-Cash Benefits7
Total Benefits
$’000 $’000 $’000 $’000 $’000 $’000 $’000 $’000 $’000
PRoche CEO 155 31 148 28 23 1 386 (151) 235
PKingston8 CEO 80 - - 8 6 - 94 9 103
CHill COO 172 - - 18 29 1 220 9 229
DThurm CFO 149 - - 20 27 1 197 8 205
Total 556 31 148 74 85 3 897 (125) 772
1 Gross salary includes all forms of consideration paid and payable for services rendered, compensated absences during the period and salary sacrifice amounts.
2 Short term incentive payments are dependent upon achieving specified performance goals within specified timeframes. 3 Termination benefits include all forms of benefit paid or accrued as a consequence of termination. During 2014-15 P Roche ceased employment
effective 4 February 2015 and received $147,799 representing the balance of his accrued annual and long service leave. No other termination benefits were paid.
4 Superannuation means the contribution to the superannuation fund of the individual. Where an individual is a member of a defined benefit scheme the superannuation benefit for the defined benefit component is a notional cost calculated as the base salary multiplied by 11%.
5 Vehicle costs represent the total cost of business and private use of vehicles provided to executives as part of their remuneration. 6 Other benefits includes all forms of employment allowances, payments in lieu of leave, and any other compensation paid and payable. 7 Other non-cash benefits include annual leave and long service leave movements. 8 P Kingston commenced as CEO on 5 February 2015.
2014
Name Position Gross Salary1
Short-Term Incentive
Payments2
Termination Benefits3
Super-annuation4 Vehicle5 Other Benefits6
Total Cash Benefits
Other Non-Cash Benefits7 Total Benefits
$’000 $’000 $’000 $’000 $’000 $’000 $’000 $’000 $’000
PRoche CEO 247 18 - 40 28 1 334 5 339
CHill COO 172 - - 17 28 1 218 8 226
DThurm CFO 145 - - 21 23 16 205 (9) 196
Total 564 18 - 78 79 18 757 4 761
1 Gross salary includes all forms of consideration paid and payable for services rendered, compensated absences during the period and salary sacrifice amounts.
2 Short term incentive payments are dependent upon achieving specified performance goals within specified timeframes. These payments are non-recurrent and do not exceed 10% of base salary.
3 Termination benefits include all forms of benefit paid or accrued as a consequence of termination. No termination payments were paid in 2013-14. 4 Superannuation means the contribution to the superannuation fund of the individual. Where an individual is a member of a defined benefit scheme
the superannuation benefit for the defined benefit component is a notional cost calculated as the base salary multiplied by 11%. 5 Vehicle costs represent the total cost of business and private use of vehicles provided to executives as part of their remuneration. 6 Other benefits includes all forms of employment allowances, payments in lieu of leave, and any other compensation paid and payable.
7 Other non-cash benefits include annual leave and long service leave movements.

66 MOTOR ACCIDENTS INSURANCE BOARD ANNUAL REPORT 2014-15
Notes to the Financial StatementsFor the year ended 30 June 2015
35 Key management personnel information continued
(f) Remuneration policies
Remunerationlevelsforkeymanagementpersonnelarecompetitivelysettoattractandretainappropriatelyqualifiedand
experienceddirectorsandexecutives.Theremunerationstructurestakeintoaccount:
•Thecapabilityandexperienceofkeymanagementpersonnel;
•Thekeymanagementpersonnel’sabilitytocontroltheMAIB’sperformance;and
•Achievementofstrategicinitiatives.
(i) Non-executive director remuneration
Non-executivedirectorsareappointedbytheGovernor-in-CouncilonthejointrecommendationoftheTreasurerandPortfolio
Minister.Eachinstrumentofappointmentisforamaximumperiodofthreeyearsandprescribestherelevantremuneration
provisions.Directorscanbere-appointed.
Non-executivedirectors’remunerationisadministeredbytheDepartmentofPremierandCabinet.Remunerationlevelsarereviewed
periodically,withincreasessubjecttoapprovalbytheTreasurerandPortfolioMinister.
Superannuationispaidattheappropriaterateasprescribedbysuperannuationguaranteelegislation.
Nootherleave,terminationorretirementbenefitsareaccruedorpaidtodirectors.
DirectorsareentitledtoreimbursementofexpensesincurredwhileattendingtoMAIBbusiness.
(ii) Executive remuneration
RemunerationlevelsforkeymanagementpersonnelaresetinaccordancewiththeDirectorandExecutiveRemunerationGuidelines,
datedDecember2014.UndertheseGuidelines,remunerationbandsforChiefExecutiveOfficers(CEOs)aredeterminedbythe
GovernmentBusinessExecutiveRemunerationPanel,reflecttheprinciplesoutlinedintheGuidelinesandbroadlyalignwithState
ServiceHeadsofAgency.Positioningwithinthebandsdependsonthecomplexityandsizeofthebusinessandtheenvironmentin
whichthebusinessoperates.RemunerationforotherseniorexecutivesissetwithreferencetotheCEO’ssalary.
TheCEOisappointedbythePremierandPortfolioMinisterfollowingselectionandrecommendationbytheBoardoftheMAIB.The
BoardofDirectorsconsultswiththeGovernmentBusinessExecutiveRemunerationAdvisoryPanelwhendeterminingtheCEO’s
remunerationpackage.
Theemploymenttermsandconditionsofseniorexecutivesarecontainedinindividualemploymentcontractsandprescribetotal
remuneration,superannuation,motorvehicleandsalarysacrificeprovisions.Inadditiontotheirsalaries,theMAIBalsoprovides
non-cashbenefitsandcontributestopost-employmentsuperannuationplansontheirbehalf.
TheCEOmaybeeligibleforashorttermincentivepayment(cappedat10%ofbasesalary)subjecttomeetingagreedkey
performanceindicators.Thesepaymentsarenon-recurrent.
Theperformanceofeachseniorexecutive,includingtheCEO,isreviewedannuallywhichincludesareviewoftheremuneration
package.
ConsistentwiththerequirementsoftheGovernment Business Enterprises Act 1995, employmentcontractshavedurationsnot
exceedingfiveyears.Whilstnotautomatic,contractscanbeextended.

67
Notes to the Financial StatementsFor the year ended 30 June 2015
35 Key management personnel information continued
Short term incentive payments
Shorttermincentivepaymentsareawardedfollowingassessmentagainstarangeoffinancialandnon-financialKPIs.TheBoard
setsfixedperformancetargetswithgoalsandindicatorsalignedtothecreationofvalue.
Thefollowingshorttermincentivepaymentswereawardedduringtheyear:
•PRoche,ChiefExecutiveOfficer,wasgrantedacashbonusof$30,642followingassessmentofhisperformanceagainsthis
KPIsin2013-14andin2014-15uptohisretirement.
Termination benefits
PRocheceasedemploymentwiththeMAIBeffective4February2015andwaspaidaterminationbenefitof$147,799representing
thebalanceofhisaccruedannualandlongserviceleave.
Nootherterminationbenefitswerepaid.
Acting arrangements
Whenmembersofkeymanagementpersonnelareunabletofulfiltheirduties,considerationisgiventoappointingothermembers
ofseniorstafftothekeymanagementpositionduringtheirperiodofabsence.
Noactingarrangementswereinplaceduring2014-15.
(g) Other transactions of key management personnel and related parties
NobusinesstransactionswereundertakenwithDirectorsfortheyearended30June2015.
TheMAIBundertakesfinancialtransactionswithdirectorrelatedentitiesontermsthatarenomorefavourablethanthoseavailable,
orwhichmightreasonablybeexpectedtobeavailableonsimilartransactionstonon-directorentitiesonanarm’slengthbasis.The
directorrelatedrelationshipsare:
DWChallenAM–DeputyPresidentoftheRetirementBenefitsFundBoard
MEScanlon–MemberoftheGoverningCouncil,TasmanianHealthOrganisationNorth
68 MOTOR ACCIDENTS INSURANCE BOARD ANNUAL REPORT 2014-15
Independent Auditor’s Report
…1 of 2
Independent Auditor’s Report To Members of the Tasmanian Parliament Motor Accidents Insurance Board Financial Report for the Year Ended 30 June 2015 Report on the Financial Report I have audited the accompanying financial report of the Motor Accidents Insurance Board (MAIB) which comprises the statement of financial position as at 30 June 2015 and the statements of comprehensive income, changes in equity and cash flows for the year ended on that date, a summary of significant accounting policies, other explanatory notes and the certification statement by the Directors. Auditor’s Opinion In my opinion:
(a) MAIB’s financial report:
(i) presents fairly, in all material respects, its financial position as at 30 June 2015, and its financial performance, cash flows and changes in equity for the year then ended; and
(ii) is in accordance with the Government Business Enterprises Act 1995 and Australian Accounting Standards
(b) the financial report also complies with International Financial Reporting Standards as disclosed in Note 1(a).
The Responsibility of the Directors for the Financial Report The Directors of the MAIB are responsible for the preparation and fair presentation of the financial report in accordance with Australian Accounting Standards and Section 52 (1) of the Government Business Enterprises Act 1995. This responsibility includes establishing and maintaining internal controls relevant to the preparation and fair presentation of the financial report that is free from material misstatement, whether due to fraud or error; selecting and applying appropriate accounting policies; and making accounting estimates that are reasonable in the circumstances. In Note 1(a), the Directors also state, in accordance with Australian Accounting Standard AASB 101 Presentation of Financial Statements, that the financial report complies with International Financial Reporting Standards.

69
…2 of 2
Auditor’s Responsibility My responsibility is to express an opinion on the financial report based upon my audit. My audit was conducted in accordance with Australian Auditing Standards. These Auditing Standards require that I comply with relevant ethical requirements relating to audit engagements and plan and perform the audit to obtain reasonable assurance as to whether the financial report is free of material misstatement. An audit involves performing procedures to obtain audit evidence about the amounts and disclosures in the financial report. The procedures selected depend on my judgement, including the assessment of risks of material misstatement of the financial report, whether due to fraud or error. In making those risk assessments, I considered internal control relevant to the Directors’ preparation and fair presentation of the financial report in order to design audit procedures that are appropriate to the circumstances, but not for the purpose of expressing an opinion on the effectiveness of the Corporation’s internal control. An audit also includes evaluating the appropriateness of accounting policies used and the reasonableness of accounting estimates made by the Directors, as well as evaluating the overall presentation of the financial report. I believe that the audit evidence I have obtained is sufficient and appropriate to provide a basis for my audit opinion. Independence In conducting this audit, I have complied with the independence requirements of Australian Auditing Standards and other relevant ethical requirements. The Audit Act 2008 further promotes independence by:
providing that only Parliament, and not the executive government, can remove an Auditor-General
mandating the Auditor-General as auditor of State Entities but precluding the provision of non-audit services, thus ensuring the Auditor-General and the Tasmanian Audit Office are not compromised in their role by the possibility of losing clients or income.
I confirm that the independence declaration provided to the Directors dated 12 August 2015 and included in the annual report, would be unchanged if provided to the Directors as at the date of this auditor’s report. Tasmanian Audit Office
H M Blake Auditor-General Hobart 13 August 2015

70 MOTOR ACCIDENTS INSURANCE BOARD ANNUAL REPORT 2014-15
Auditor’s Independence Declaration
…1 of 1
12 August 2015 The Board of Directors Motor Accidents Insurance Board 33 George Street LAUNCESTON TAS 7250 Dear Board Members Auditor’s Independence Declaration In relation to my audit of the financial report of the Motor Accidents Insurance Board for the financial year ended 30 June 2015, I declare that to the best of my knowledge and belief, there have been no contraventions of:
(a) the auditor independence requirements of Australian Auditing Standards in relation to the audit; and
(b) any applicable code of professional conduct in relation to the audit. As agreed with the Audit Committee, a copy of this declaration must be included in the annual report. Yours sincerely
H M Blake Auditor-General

71
IntheopinionofthedirectorsoftheMotorAccidentsInsuranceBoard:
(a) thefinancialstatementsandnotesoftheEnterpriseareinaccordancewiththeGovernment Business Enterprises Act 1995,including:
i. givingatrueandfairviewoftheresultsandcashflowsfortheyearended30June2015andthefinancialpositionasat30June
2015oftheEnterprise;and
ii. complyingwiththeAustralianAccountingStandardsandInterpretationsandwiththeTreasurer’sInstructions.
(b) therearereasonablegroundstobelievethattheEnterprisewillbeabletopayitsdebtsasandwhentheyfalldue.
ThisdeclarationhasbeenmadeafterreceivingthefollowingdeclarationfromtheChiefExecutiveOfficerandtheChiefFinancialOfficerofthe
Enterprise:
(a) thefinancialrecordsoftheEnterprisefortheperiodended30June2015havebeenproperlymaintainedinaccordancewithSection51
oftheGovernment Business Enterprises Act 1995;
(b) thefinancialstatements,andnotesfortheperiodended30June2015havebeenpreparedinaccordancewithSection52ofthe
Government Business Enterprises Act 1995;and
(c) thefinancialstatementsandnotesfortheperiodended30June2015giveatrueandfairview.
Signedinaccordancewitharesolutionofthedirectors:
Dated12August2015
DWChallen DJMcCarthyChairman Director
Certification

72 MOTOR ACCIDENTS INSURANCE BOARD ANNUAL REPORT 2014-15
Appendix
FIVE YEAR SUMMARY - FINANCIAL 2010-11$’000
2011-12$’000
2012-13$’000
2013-14$’000
2014-15$’000
Premiumincomenetofreinsurance 131,131 133,719 133,220 133,514 128,625
Recoveryincome 7,340 13,490 3,514 4,767 3,696
Claimsexpense (133,978) (201,094) (87,348) (124,602) (104,342)
Underwritingexpenses (2,680) (3,093) (3,975) (3,543) (3,710)
Underwriting result 1,813 (56,978) 45,411 10,136 24,269
Investmentandotherrevenue 77,148 23,292 172,521 171,135 122,978
Administration,roadsafetyandFoundationexpenses (9,466) (9,874) (10,165) (9,329) (10,054)
Profit/(loss) before tax 69,495 (43,560) 207,767 171,942 137,193
Tax(expense)/benefit (17,829) 16,506 (60,322) (46,444) (37,328)
Profit/(loss) after tax 51,666 (27,054) 147,445 125,498 99,865
Net assets 288,638 240,388 382,416 484,380 440,121
Dividend paid 34,567 20,249 6,140 23,219 144,570
FIVE YEAR SUMMARY - OPERATIONAL 2010-11 2011-12 2012-13 2013-14 2014-15
Numberofvehiclesregistered 463,567 469,132 473,817 481,656 492,313
Claimpayments($’000) 79,252 78,228 84,129 79,050 87,049
Currentclaims 2,800 2,676 2,750 2,619 2,551
Newclaimsreceived 2,977 2,707 2,839 2,924 2,847
Claimrateper1,000vehicles 6.42 5.77 5.99 6.07 5.78
Tasmanianmotorcar(class1)premium($) 344 344 344 318 318
KEY PERFORMANCE INDICATORS
TheMAIBsignificantlyoutperformeditsinvestmentKPIobjectivesin
2014-15.However,asalongtailinsurertheMAIBistargetinglong
terminvestmentgrowthandissubjecttoshorttermvolatility,which
isevidentintheKPIresultsfromyeartoyear.
Key Performance Indicator Forecast Actual
Fundingratio(%) 120.0 127.7
Returnonequity(%) 8.0 21.6
Returnontotalassets(%) 3.0 9.0
0
50
100
150
200$M
250
300
350
0NSW ACT TAS VICQLDSA NTWA
100
200
300
400
500
600
700
At fault CTP - Benefits paid for liability
No fault CTP - claimantsrecover irrespective of fault
Annu
al P
rem
ium
- 3
0 Ju
ne 2
015
($)
Asset Allocations at 30 June 2015Premium and Investment Income
Financial Year InvestmentPremium
2010-11 2011-12 2012-13 2013-14 2014-15
Cash 18.0%
Infrastructure 5.2%
International Equities-Emerging Markets 5.6%
Australian Equities17.8%
Global InvestmentGrade Credit 5.3%
Australian Government Bonds 11.4%
International Equities-Developed Markets 20.4% Diversified
Property 14.2%
Emerging Markets Debt 2.1%
613531
443
318
604
265324
439

73
INTERSTATE SCHEME COMPARISONS – JUNE 2015
SCHEME COMPONENT TAS VIC NT NSW QLD WA SA ACT
Nofault Yes Yes Yes No1 No No No No
LifetimeCare(supportforcatastrophicallyinjured) Yes Yes Yes Yes No No Yes Yes
CommonLawRights Yes Yes No Yes Yes Yes Yes Yes
MonopolyScheme Yes Yes Yes No No Yes Yes No
MotorCarPremium2 $318 $443 $531 $6133 $3244 $265 $439 $604
1Nofaultforchildrenonly2InclusiveofGST3AverageofSydneymetropolitan4Maximumallowable
INTERSTATE PRIVATE MOTOR CAR PREMIUM RATE COMPARISONS
0
50
100
150
200$M
250
300
350
0NSW ACT TAS VICQLDSA NTWA
100
200
300
400
500
600
700
At fault CTP - Benefits paid for liability
No fault CTP - claimantsrecover irrespective of fault
Annu
al P
rem
ium
- 3
0 Ju
ne 2
015
($)
Asset Allocations at 30 June 2015Premium and Investment Income
Financial Year InvestmentPremium
2010-11 2011-12 2012-13 2013-14 2014-15
Cash 18.0%
Infrastructure 5.2%
International Equities-Emerging Markets 5.6%
Australian Equities17.8%
Global InvestmentGrade Credit 5.3%
Australian Government Bonds 11.4%
International Equities-Developed Markets 20.4% Diversified
Property 14.2%
Emerging Markets Debt 2.1%
613531
443
318
604
265324
439
PAYMENT OF ACCOUNTS
InaccordancewithTreasurer’sInstructionGBE-13-114-09 (Payment
of Accounts),theMAIBisrequiredtoreportonitspaymentof
accountsinatimelymanner.WhiletheMAIB’spolicyistopayall
accountsinatimelymanner,newinternalpoliciesandprocedures
havebeenpreparedtocomplywiththeTIandTreasuryGuidelines,
specifically:
•allrelevant,correctlyrenderedinvoicestobepaidbytheduedate,
andwheretheyarelessthan$50,000tobepaidwithin30days,or
bytheduedateifthepaymenttermsarelessthan30days;
•ifpaymentismadelate,interestistobeselfassessedandpaid
toprovidersinaccordancewithnegotiatedarrangements.The
penaltyinteresttobepaidisthegreaterof$20,oranamount
calculatedonadailybasisfromthepaymentduedateofthe
correctlyrenderedinvoiceuntilthedateofpayment.Theapplicable
interestrateisthesmallbusiness“smalloverdraft”ratepublished
bytheReserveBankofAustraliainitsIndicatorLendingRates
Series.Whereacontractprescribesarateofinterestpayablefor
overduepayments,theamountofpenaltyinterestpayableistobethe
greateroftheamountspecifiedaboveorthatoutlinedinthecontract
conditions;and
•aformalcomplaintprocedureexistsifaproviderisnotsatisfiedwith
thepaymentofaninvoiceand/orthepaymentofpenaltyinterest.
ThefollowingpaymentsareexcludedfromtherequirementsoftheTI
andTreasuryGuideline:
•Paymentsmadeto,oronbehalfof,claimants(hospital,ambulance,
treatmentetc.)-thesereimbursementsareoutsidetheintended
scopeoftheGuideline;and
•Paymentsbycreditcard(creditcardpaymentsaremadeatthetime
ofpurchaseandhavebeenexcludedfrombeingassessedagainstthe
requirementsoftheGuideline).
Accounts due or paid within 2015 (January to July) 1
Measure
CreditorDays 7.7
Numberofaccountsdueforpayment 509
Numberofaccountspaidontime 509
Amountdueforpayment $4,986,962
Amountpaidontime $4,986,962
Numberofpaymentsforinterestonoverdueaccounts 0
Interestpaidonoverdueaccounts 0
1 Year commencing 1 January 2015 – system changes were required to enable reporting in accordance with the new TI and Guidelines which delayed the period for which reporting was available.

74 MOTOR ACCIDENTS INSURANCE BOARD ANNUAL REPORT 2014-15
PROCUREMENT (BUY LOCAL)
InaccordancewithTreasurer’sInstructionGBE-13-114-11 (Buy
Local),theMAIBisrequiredtoreportonitsprocurementpoliciesand
practicesandhowthesesupportlocalbusinesses.Duringtheyear,
theMAIBpreparednewinternalProcurement(BuyLocal)policies
andproceduresthataimtopromoteopenandeffectivecompetition,
pursuevalueformoney,conductethicalprocurementandenhance
opportunitiesforlocalbusinesses.Paymentsmadeto,oronbehalfof,
claimants(hospital,ambulance,treatmentetc.)areexcludedasthese
reimbursementsareoutsidetheintendedscopeoftheGuideline.
DIRECTORS’ MEETINGS
ThenumberofDirectors’BoardmeetingsandCommitteemeetingsheldandattendedbyeachDirectorduring2014-15areshowninthe
followingtable.
Director Board(14 meetings held)
Audit Committee(6 meetings held)
Claims Committee(12 meetings held)
IPMF Committee(6 meetings held)
DonChallenAM •••••••••••••• •••••• ••••••KimBarker •••••••••••••• •••••••••••• ••••••MichaelDontschuk •••••••••••••• ••••••••••••DannyMcCarthy •••••••••••••• ••••••PeterRoche1 •••••••• •••••••DavidSt.John •••••••••••••• ••••••MarkScanlon2 ••••••••••••• •••••
•Attended•DidnotAttend
1 Peter Roche’s appointment as Executive Director concluded on 4 February 2015.2 Mark Scanlon’s appointment as Director concluded on 25 May 2015.
SUPERANNUATION
IcertifythattheMAIBhasmetitsobligationsundertheCommonwealth’sSuperannuation Guarantee (Administration) Act 1992inrespectofany
employeewhoisamemberofacomplyingsuperannuationschemetowhichtheMAIBcontributes.
Paul KingstonChiefExecutiveOfficer
Consultancies1 valued at more than $50,000 (ex GST) in 2014-15
Nameofconsultant Location Description Periodofengagement Amount
AonBenfield Sydney,Australia Reinsurancebroker 1Jul2014to30June2015 $421,888
TaylorFryPtyLtd Melbourne,Victoria Actuary 15Aug2013to14Aug2017 $235,211
TowersWatsonAustraliaPtyLtd Melbourne,Victoria InvestmentAdvisor 1Dec2012to30Nov2015 $299,215
Total $956,314
Therewere3consultantsengagedfor$50,000orlesstotalling $26,830
Total Payment to Consultants $983,144
1 Excludes standard professional services such as accounting, audit, tax and legal services.
MAIB purchases1 from Tasmanian Businesses2 2014-15
Percentageofpurchasesfrom
Tasmanianbusinesses
82%
ValueofpurchasesfromTasmanianbusinesses $16.04million
1 Excludes payments to specialist reinsurers ($5.8 million) – there are no appropriately licensed reinsurers located in Tasmania.
2 Definition of a Tasmanian business (ie local) is a business operating in Tasmania, which has a permanent office or presence in Tasmania and employs Tasmanian workers (as per the Treasury Buy Local Guidelines for Tasmanian Government Businesses Version 1).

75

ABN 93 610 406 210Address Level 1, 33 George Street Launceston 7250, Tasmania Telephone (03) 6336 4800Toll Free 1800 006 224Facsimile (03) 6336 4848Email [email protected] www.maib.tas.gov.au
MOTOR ACCIDENTS INSURANCE BOARD
MOTOR ACCIDENTS INSURANCE BOARD ANNUAL REPORT
MOTOR ACCIDENTS INSURANCE BOARD
ANNUAL REPORT2014-15