Embed Size (px)
Citation preview
MOTIVES AND MARKETING STRATEGIES OF GREEK COMPANIES EXPORTING TO
SOUTH-EAST EUROPEAN MARKETS
PANAGIOTIS G. LIARGOVAS*
KONSTANTINOS S. SKANDALISUniversity of Peloponnese, Greece
AbstractThe purpose of this study is twofold. First, to conceptualize various internal, ex-ternal and strategic factors explaining the motivation and the marketing strategy of Greek exporting firms based on a strategic management model. Second, to em-pirically test this model in the case of Greek firms exporting to South-East Euro-pean (Balkan) markets. The analysis is accomplished through the observed behaviour of 41 firms listed on the Athens stock exchange involved in exporting to South-East Europe. It is based on a questionnaire which has provided several insights into export motivations and export marketing strategy elements. It uses principal component factor analysis technique in order to investigate com-mon factors that might explain underlying beliefs about the perceived variables.
JEL classification: F14Keywords: export marketing, export motives, Greece, South-East European markets, factor analysis
* Corresponding author: Department of Economics, Terma Karaiskaki Str., 22100 Tripolis, Greece, e-mail: [email protected]
We would like to thank two anonymous referees and the editor of this journal for helpful comments and suggestions on earlier versions of this paper. The usual disclaimer applies.
South-Eastern Europe Journal of Economics 2 (2008) 227-244
228 P. LIARGOVAS, K. SKANDALIS, South-Eastern Europe Journal of Economics 2 (2008) 227-244
1. Introduction
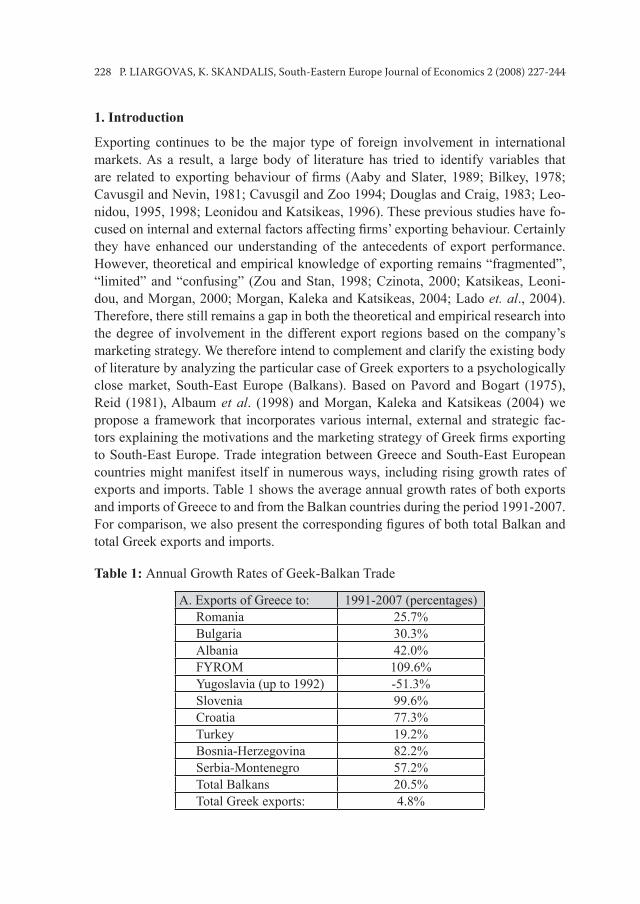
Exporting continues to be the major type of foreign involvement in international markets. As a result, a large body of literature has tried to identify variables that are related to exporting behaviour of firms (Aaby and Slater, 1989; Bilkey, 1978; Cavusgil and Nevin, 1981; Cavusgil and Zoo 1994; Douglas and Craig, 1983; Leo-nidou, 1995, 1998; Leonidou and Katsikeas, 1996). These previous studies have fo-cused on internal and external factors affecting firms’ exporting behaviour. Certainly they have enhanced our understanding of the antecedents of export performance. However, theoretical and empirical knowledge of exporting remains “fragmented”, “limited” and “confusing” (Zou and Stan, 1998; Czinota, 2000; Katsikeas, Leoni-dou, and Morgan, 2000; Morgan, Kaleka and Katsikeas, 2004; Lado et. al., 2004). Therefore, there still remains a gap in both the theoretical and empirical research into the degree of involvement in the different export regions based on the company’s marketing strategy. We therefore intend to complement and clarify the existing body of literature by analyzing the particular case of Greek exporters to a psychologically close market, South-East Europe (Balkans). Based on Pavord and Bogart (1975), Reid (1981), Albaum et al. (1998) and Morgan, Kaleka and Katsikeas (2004) we propose a framework that incorporates various internal, external and strategic fac-tors explaining the motivations and the marketing strategy of Greek firms exporting to South-East Europe. Trade integration between Greece and South-East European countries might manifest itself in numerous ways, including rising growth rates of exports and imports. Table 1 shows the average annual growth rates of both exports and imports of Greece to and from the Balkan countries during the period 1991-2007. For comparison, we also present the corresponding figures of both total Balkan and total Greek exports and imports.
Table 1: Annual Growth Rates of Geek-Balkan Trade
A. Exports of Greece to: 1991-2007 (percentages)Romania 25.7%Bulgaria 30.3%Albania 42.0%FYROM 109.6%Yugoslavia (up to 1992) -51.3%Slovenia 99.6%Croatia 77.3%Turkey 19.2%Bosnia-Herzegovina 82.2%Serbia-Montenegro 57.2%Total Balkans 20.5%Total Greek exports: 4.8%
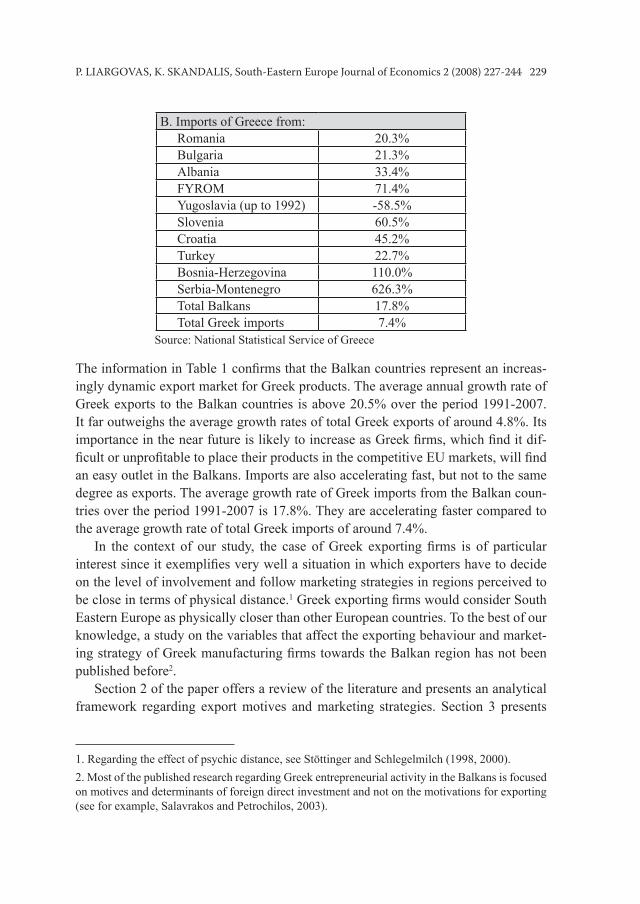
P. LIARGOVAS, K. SKANDALIS, South-Eastern Europe Journal of Economics 2 (2008) 227-244 229
B. Imports of Greece from:Romania 20.3%Bulgaria 21.3%Albania 33.4%FYROM 71.4%Yugoslavia (up to 1992) -58.5%Slovenia 60.5%Croatia 45.2%Turkey 22.7%Bosnia-Herzegovina 110.0%Serbia-Montenegro 626.3%Total Balkans 17.8%Total Greek imports 7.4%
Source: National Statistical Service of Greece
The information in Table 1 confirms that the Balkan countries represent an increas-ingly dynamic export market for Greek products. The average annual growth rate of Greek exports to the Balkan countries is above 20.5% over the period 1991-2007. It far outweighs the average growth rates of total Greek exports of around 4.8%. Its importance in the near future is likely to increase as Greek firms, which find it dif-ficult or unprofitable to place their products in the competitive EU markets, will find an easy outlet in the Balkans. Imports are also accelerating fast, but not to the same degree as exports. The average growth rate of Greek imports from the Balkan coun-tries over the period 1991-2007 is 17.8%. They are accelerating faster compared to the average growth rate of total Greek imports of around 7.4%.
In the context of our study, the case of Greek exporting firms is of particular interest since it exemplifies very well a situation in which exporters have to decide on the level of involvement and follow marketing strategies in regions perceived to be close in terms of physical distance.1 Greek exporting firms would consider South Eastern Europe as physically closer than other European countries. To the best of our knowledge, a study on the variables that affect the exporting behaviour and market-ing strategy of Greek manufacturing firms towards the Balkan region has not been published before2.
Section 2 of the paper offers a review of the literature and presents an analytical framework regarding export motives and marketing strategies. Section 3 presents
1. Regarding the effect of psychic distance, see Stöttinger and Schlegelmilch (1998, 2000).2. Most of the published research regarding Greek entrepreneurial activity in the Balkans is focused on motives and determinants of foreign direct investment and not on the motivations for exporting (see for example, Salavrakos and Petrochilos, 2003).
230 P. LIARGOVAS, K. SKANDALIS, South-Eastern Europe Journal of Economics 2 (2008) 227-244
the paper’s research methodology and empirical results, while section 4 offers some concluding remarks and makes policy proposals.
2. Literature review and the conceptual model
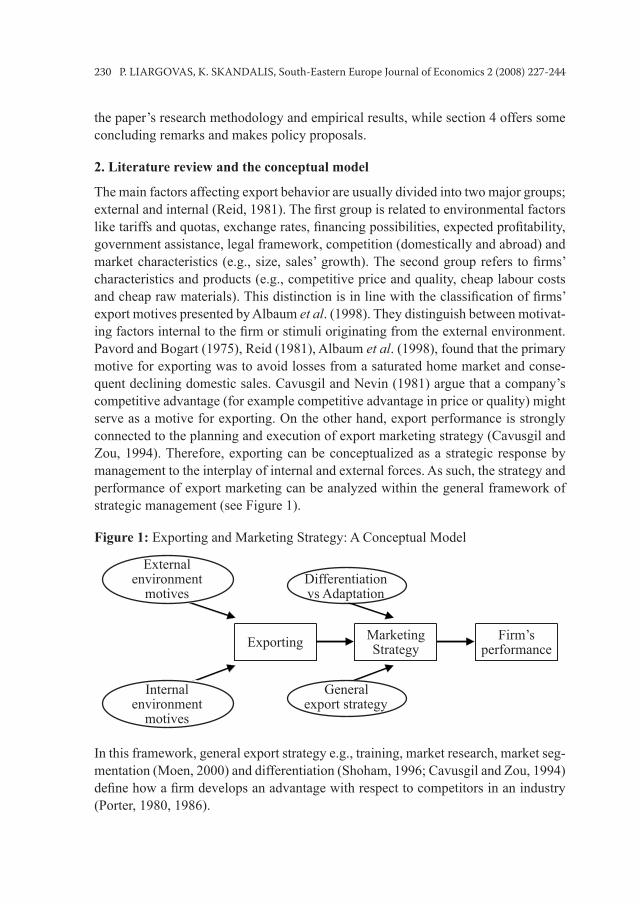
The main factors affecting export behavior are usually divided into two major groups; external and internal (Reid, 1981). The first group is related to environmental factors like tariffs and quotas, exchange rates, financing possibilities, expected profitability, government assistance, legal framework, competition (domestically and abroad) and market characteristics (e.g., size, sales’ growth). The second group refers to firms’ characteristics and products (e.g., competitive price and quality, cheap labour costs and cheap raw materials). This distinction is in line with the classification of firms’ export motives presented by Albaum et al. (1998). They distinguish between motivat-ing factors internal to the firm or stimuli originating from the external environment. Pavord and Bogart (1975), Reid (1981), Albaum et al. (1998), found that the primary motive for exporting was to avoid losses from a saturated home market and conse-quent declining domestic sales. Cavusgil and Nevin (1981) argue that a company’s competitive advantage (for example competitive advantage in price or quality) might serve as a motive for exporting. On the other hand, export performance is strongly connected to the planning and execution of export marketing strategy (Cavusgil and Zou, 1994). Therefore, exporting can be conceptualized as a strategic response by management to the interplay of internal and external forces. As such, the strategy and performance of export marketing can be analyzed within the general framework of strategic management (see Figure 1).
Figure 1: Exporting and Marketing Strategy: A Conceptual Model
Firm’s performance
Marketing StrategyExporting
Differentiation vs Adaptation
External environment
motives
Internal environment
motives
General export strategy
In this framework, general export strategy e.g., training, market research, market seg-mentation (Moen, 2000) and differentiation (Shoham, 1996; Cavusgil and Zou, 1994) define how a firm develops an advantage with respect to competitors in an industry (Porter, 1980, 1986).
P. LIARGOVAS, K. SKANDALIS, South-Eastern Europe Journal of Economics 2 (2008) 227-244 231
As firms begin to compete in export markets, their export success depends upon their ability to develop and implement unique competitive strategies. When develop-ing such strategies, these firms have to match their internal and location specific com-petitive (as explained in Porter, 1998) and comparative advantages (i.e. Ricardian) with the requirements of the external environment in which they compete (Aulakh, Kotabe and Teegen, 2000)3. Firms following a differentiation strategy aim at creat-ing a product or service that customers see as unique. This is usually accomplished through such means as a superior brand image, technology, customer service, com-munication, distribution networks, positioning or innovative products (Miller, 1988). The degree of adapted versus undifferentiated marketing strategies is a function of product, industry, market, organization and environmental characteristics (Dean, Mengüç and Myers, 2000). Firms following a differentiated strategy aim at creat-ing a unique product or service. Miller (1988) suggests that this is usually achieved through such means as a superior brand image, technology, customer service or in-novative products.
3. Methodology and empirical evidence
Based on the above conceptual model, we constructed a questionnaire that obtained replies from 41 Greek exporting firms listed on the Athens Stock Exchange4. The average size of all these firms is large in Greek terms (more than 100 employees). All these firms have been exporting to four South East European countries for ten years on average. They are involved in the manufacture and distribution of a wide variety of capital intensive products and services coming from a wide cross section of industries including food and beverages, clothing and textiles, plastics, paper, metals, furniture, electronics, ceramics, marble and granite, concrete, pharmaceuticals and banking. The questionnaires were replied to over a period of six months (last quar-ter of 2005 and first quarter of 2006). Executives who served in firms that exported products were randomly asked to review the questions and the entire questionnaire was pre-tested. After the pilot test, the questionnaire was used to personally interview respondents from 41 firms out of an original sample of 55 - accounting for an effec-tive response rate of 74.5 percent and considered to be more than adequate (Groves, 1990). Many issues were addressed in the questionnaire, but the responses used in the present study resulted from questions that asked the respondents to indicate the importance of twelve initial motives and sixteen elements for the description of man-
3. According to Michael Porter (1998), a competitive advantage exists when a company makes economic rents, that is, their earnings exceed their costs (including cost of capital).4. We have chosen firms which are listed on the Athens Stock Exchange because these firms are large firms and they have more accurate data.
232 P. LIARGOVAS, K. SKANDALIS, South-Eastern Europe Journal of Economics 2 (2008) 227-244
agement strategy. The list of twelve variables for initial motivations and sixteen vari-ables for marketing was based upon the conceptual model and the existing literature as presented in the previous section.
The twelve variables for initial motivations or export determinants are grouped as following:
A. External EnvironmentMarket size.1. Market growth (percentage increase of sales in a period).2. Market shares of competitors.3. Expected profit margin.4. Economic environment (e.g. inflation, GDP growth, interest rates).5. Political environment (e.g. stability, social intensities, labour peace, govern-6. mental corruption).Legal framework (e.g. terms of installation, tax relief, price controls, possibil-7. ity of profit repatriation).
B. Internal EnvironmentCompetitive advantage in quality against the domestic produced products.8. Competitive advantage in price against the domestic produced products.9. Marketing infrastructure (e.g. personnel, distribution system, technical serv-10. ice).Cheap labour cost.11. Cheap raw materials.12.
The sixteen marketing variables are grouped as following:
A. Differentiation versus adaptationDifferent market segmentation and market targeting than that in Greece.1. Different positioning than that in Greece.2. The main products are different in quality outside Greece.3. We don’t use the same brand names in Greece and South East Europe.4. Price policy doesn’t differ outside Greece.5. Price policy differs from country to country.6. Communication policy differs from country to country.7. Communication policy is the same in all countries.8. Different distribution network characteristics in South-East Europe.9.
B. General export strategyTop executives are not selected by the parent company.10. We need market research.11. Marketing strategy is planned in foreign markets (e.g. by affiliated compa-12. nies).
P. LIARGOVAS, K. SKANDALIS, South-Eastern Europe Journal of Economics 2 (2008) 227-244 233
Marketing strategy is planned in Greece.13. The training of foreign staff takes place in South-East Europe.14. The training of staff takes place in Greece.15. Foreign executives/staff need training.16.
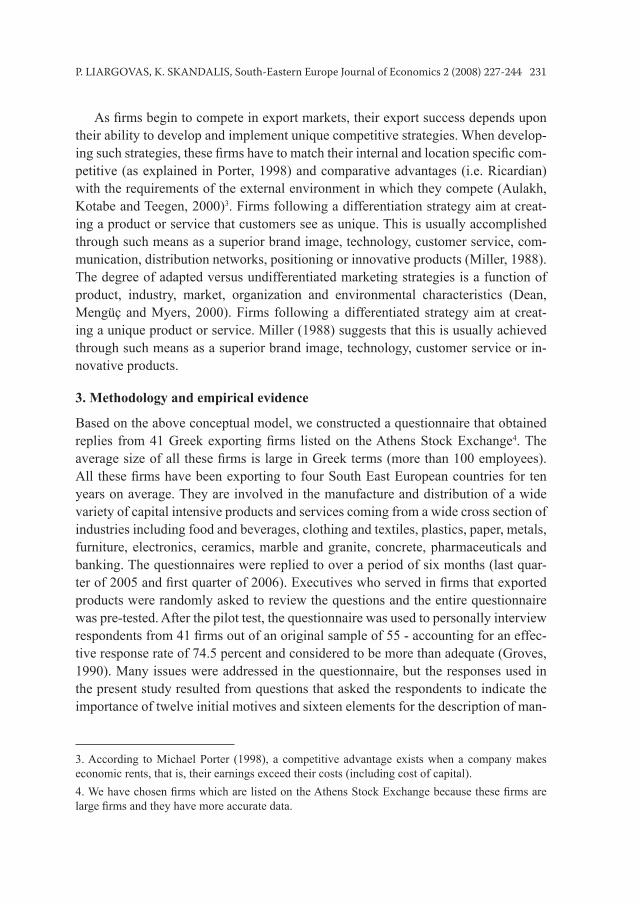
Firms were asked to respond on Likert scales ranging from “not so important” to “extremely important” for initial motivations and from “I strongly disagree” to “I strongly agree” for the several elements of marketing.5 In the course of analysis of the information obtained from the study, it was noted that a high degree of correlation existed among a number of responses to some variables concerning motives and ele-ments of export marketing. This observation provided a basis for the investigation of common factors that might explain underlying beliefs about perceived motives and marketing strategy for export to South-Eastern European markets. Table 2 shows the number of responses, average exports motive item score, standard deviation and the minimum/maximum values. In Table 3 we can see the frequencies of the responses to the question concerning the importance of certain motivations.
Table 2: Descriptive Statistics (Motivations)
Motivations N Minimum Maximum Mean Std. Deviation
A. External environment1. Market size 41 1.00 9.00 5.3171 2.787822. Market growth 41 1.00 9.00 6.1220 2.431003. Market share of competitors 41 1.00 9.00 6.3902 2.023344. Expected profit margin 41 2.00 9.00 6.7561 1.577665. Economic environment 41 3.00 9.00 6.8780 1.749226. Political environment 41 3.00 9.00 6.8049 1.676607. Legal framework 41 1.00 9.00 5.7317 1.98777
B. Internal Environment8. Competitive advantage in quality 41 1.00 9.00 6.5366 2.270449. Competitive advantage in price 41 1.00 9.00 5.3171 2.25210
10. Marketing infrastructure 41 1.00 9.00 4.9268 2.5237911. Cheap labor cost 41 1.00 9.00 5.8049 2.4517312. Cheap raw materials 41 1.00 9.00 5.0976 2.47795
Valid N (listwise) 41
5. Our initial estimations showed no differences between five point and nine point scales. Often five ordered response levels are used, although many researchers advocate using seven or nine levels. A recent empirical study of Dawes (2008) found that data from 5-level, 7-level and 10-level items showed very similar characteristics in terms of mean, variance, skewness and kurtosis after a simple transformation was applied.
234 P. LIARGOVAS, K. SKANDALIS, South-Eastern Europe Journal of Economics 2 (2008) 227-244
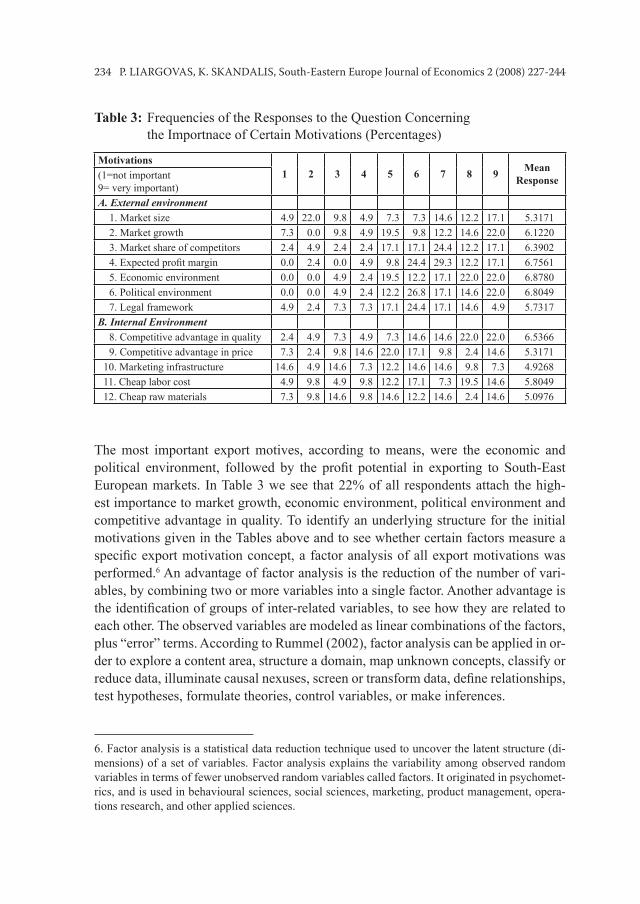
Table 3: Frequencies of the Responses to the Question Concerning the Importnace of Certain Motivations (Percentages)
Motivations 1 2 3 4 5 6 7 8 9 Mean
Response(1=not important9= very important)A. External environment
1. Market size 4.9 22.0 9.8 4.9 7.3 7.3 14.6 12.2 17.1 5.31712. Market growth 7.3 0.0 9.8 4.9 19.5 9.8 12.2 14.6 22.0 6.12203. Market share of competitors 2.4 4.9 2.4 2.4 17.1 17.1 24.4 12.2 17.1 6.39024. Expected profit margin 0.0 2.4 0.0 4.9 9.8 24.4 29.3 12.2 17.1 6.75615. Economic environment 0.0 0.0 4.9 2.4 19.5 12.2 17.1 22.0 22.0 6.87806. Political environment 0.0 0.0 4.9 2.4 12.2 26.8 17.1 14.6 22.0 6.80497. Legal framework 4.9 2.4 7.3 7.3 17.1 24.4 17.1 14.6 4.9 5.7317
B. Internal Environment8. Competitive advantage in quality 2.4 4.9 7.3 4.9 7.3 14.6 14.6 22.0 22.0 6.53669. Competitive advantage in price 7.3 2.4 9.8 14.6 22.0 17.1 9.8 2.4 14.6 5.3171
10. Marketing infrastructure 14.6 4.9 14.6 7.3 12.2 14.6 14.6 9.8 7.3 4.926811. Cheap labor cost 4.9 9.8 4.9 9.8 12.2 17.1 7.3 19.5 14.6 5.804912. Cheap raw materials 7.3 9.8 14.6 9.8 14.6 12.2 14.6 2.4 14.6 5.0976
The most important export motives, according to means, were the economic and political environment, followed by the profit potential in exporting to South-East European markets. In Table 3 we see that 22% of all respondents attach the high-est importance to market growth, economic environment, political environment and competitive advantage in quality. To identify an underlying structure for the initial motivations given in the Tables above and to see whether certain factors measure a specific export motivation concept, a factor analysis of all export motivations was performed.6 An advantage of factor analysis is the reduction of the number of vari-ables, by combining two or more variables into a single factor. Another advantage is the identification of groups of inter-related variables, to see how they are related to each other. The observed variables are modeled as linear combinations of the factors, plus “error” terms. According to Rummel (2002), factor analysis can be applied in or-der to explore a content area, structure a domain, map unknown concepts, classify or reduce data, illuminate causal nexuses, screen or transform data, define relationships, test hypotheses, formulate theories, control variables, or make inferences.
6. Factor analysis is a statistical data reduction technique used to uncover the latent structure (di-mensions) of a set of variables. Factor analysis explains the variability among observed random variables in terms of fewer unobserved random variables called factors. It originated in psychomet-rics, and is used in behavioural sciences, social sciences, marketing, product management, opera-tions research, and other applied sciences.
P. LIARGOVAS, K. SKANDALIS, South-Eastern Europe Journal of Economics 2 (2008) 227-244 235
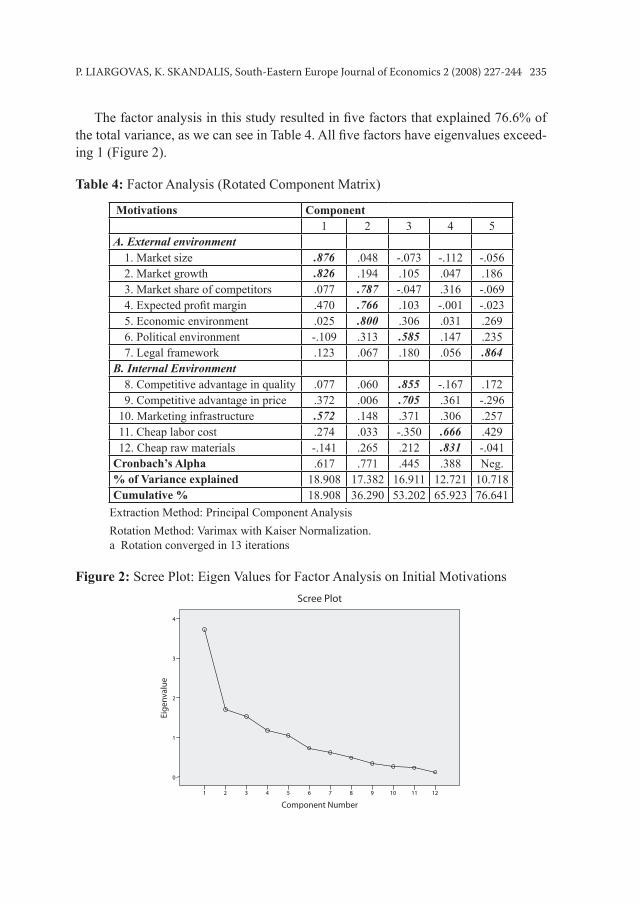
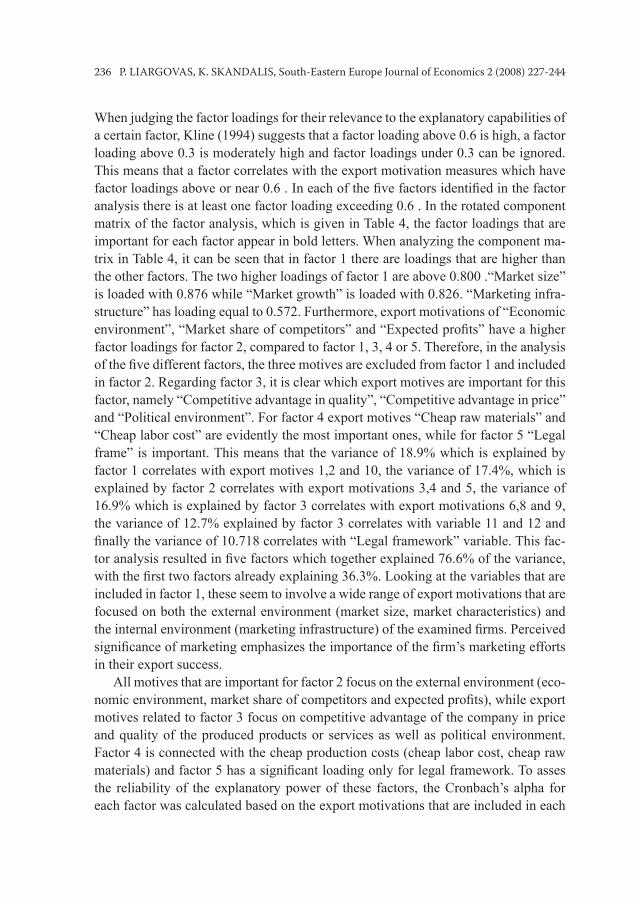
The factor analysis in this study resulted in five factors that explained 76.6% of the total variance, as we can see in Table 4. All five factors have eigenvalues exceed-ing 1 (Figure 2).
Table 4: Factor Analysis (Rotated Component Matrix)
Motivations Component1 2 3 4 5
A. External environment1. Market size .876 .048 -.073 -.112 -.0562. Market growth .826 .194 .105 .047 .1863. Market share of competitors .077 .787 -.047 .316 -.0694. Expected profit margin .470 .766 .103 -.001 -.0235. Economic environment .025 .800 .306 .031 .2696. Political environment -.109 .313 .585 .147 .2357. Legal framework .123 .067 .180 .056 .864
B. Internal Environment8. Competitive advantage in quality .077 .060 .855 -.167 .1729. Competitive advantage in price .372 .006 .705 .361 -.296
10. Marketing infrastructure .572 .148 .371 .306 .25711. Cheap labor cost .274 .033 -.350 .666 .42912. Cheap raw materials -.141 .265 .212 .831 -.041
Cronbach’s Alpha .617 .771 .445 .388 Neg.% of Variance explained 18.908 17.382 16.911 12.721 10.718Cumulative % 18.908 36.290 53.202 65.923 76.641
Extraction Method: Principal Component AnalysisRotation Method: Varimax with Kaiser Normalization. a Rotation converged in 13 iterations
Figure 2: Scree Plot: Eigen Values for Factor Analysis on Initial Motivations
236 P. LIARGOVAS, K. SKANDALIS, South-Eastern Europe Journal of Economics 2 (2008) 227-244
When judging the factor loadings for their relevance to the explanatory capabilities of a certain factor, Kline (1994) suggests that a factor loading above 0.6 is high, a factor loading above 0.3 is moderately high and factor loadings under 0.3 can be ignored. This means that a factor correlates with the export motivation measures which have factor loadings above or near 0.6 . In each of the five factors identified in the factor analysis there is at least one factor loading exceeding 0.6 . In the rotated component matrix of the factor analysis, which is given in Table 4, the factor loadings that are important for each factor appear in bold letters. When analyzing the component ma-trix in Table 4, it can be seen that in factor 1 there are loadings that are higher than the other factors. The two higher loadings of factor 1 are above 0.800 .“Market size” is loaded with 0.876 while “Market growth” is loaded with 0.826. “Marketing infra-structure” has loading equal to 0.572. Furthermore, export motivations of “Economic environment”, “Market share of competitors” and “Expected profits” have a higher factor loadings for factor 2, compared to factor 1, 3, 4 or 5. Therefore, in the analysis of the five different factors, the three motives are excluded from factor 1 and included in factor 2. Regarding factor 3, it is clear which export motives are important for this factor, namely “Competitive advantage in quality”, “Competitive advantage in price” and “Political environment”. For factor 4 export motives “Cheap raw materials” and “Cheap labor cost” are evidently the most important ones, while for factor 5 “Legal frame” is important. This means that the variance of 18.9% which is explained by factor 1 correlates with export motives 1,2 and 10, the variance of 17.4%, which is explained by factor 2 correlates with export motivations 3,4 and 5, the variance of 16.9% which is explained by factor 3 correlates with export motivations 6,8 and 9, the variance of 12.7% explained by factor 3 correlates with variable 11 and 12 and finally the variance of 10.718 correlates with “Legal framework” variable. This fac-tor analysis resulted in five factors which together explained 76.6% of the variance, with the first two factors already explaining 36.3%. Looking at the variables that are included in factor 1, these seem to involve a wide range of export motivations that are focused on both the external environment (market size, market characteristics) and the internal environment (marketing infrastructure) of the examined firms. Perceived significance of marketing emphasizes the importance of the firm’s marketing efforts in their export success.
All motives that are important for factor 2 focus on the external environment (eco-nomic environment, market share of competitors and expected profits), while export motives related to factor 3 focus on competitive advantage of the company in price and quality of the produced products or services as well as political environment. Factor 4 is connected with the cheap production costs (cheap labor cost, cheap raw materials) and factor 5 has a significant loading only for legal framework. To asses the reliability of the explanatory power of these factors, the Cronbach’s alpha for each factor was calculated based on the export motivations that are included in each
P. LIARGOVAS, K. SKANDALIS, South-Eastern Europe Journal of Economics 2 (2008) 227-244 237
factor. The Cronbach’s alpha is 0.617 for factor 1, 0.771 for factor 2, 0.445 for factor 3, 0.388 for factor 4 and negative for factor 5. In many studies a Cronbach’s alpha more than 0.5 is used to indicate that the measurement is reliable (Rummel, 2002). For the five factor analyses this means that factor 1 and factor 2 are valid measures for the variance in this study. This indicates that the six export motives included in fac-tor 1 and 2 are a reliable measurement when one wants to assess the most important motivations of a Greek firm exporting to South-East Europe.
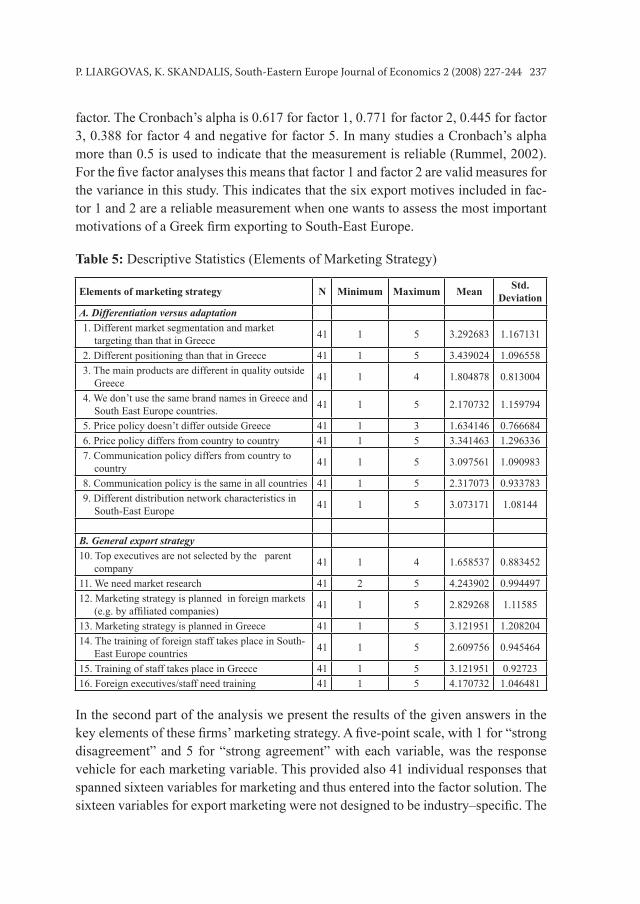
Table 5: Descriptive Statistics (Elements of Marketing Strategy)
Elements of marketing strategy N Minimum Maximum Mean Std. Deviation
A. Differentiation versus adaptation1. Different market segmentation and market
targeting than that in Greece 41 1 5 3.292683 1.167131
2. Different positioning than that in Greece 41 1 5 3.439024 1.0965583. The main products are different in quality outside
Greece 41 1 4 1.804878 0.813004
4. We don’t use the same brand names in Greece and South East Europe countries. 41 1 5 2.170732 1.159794
5. Price policy doesn’t differ outside Greece 41 1 3 1.634146 0.7666846. Price policy differs from country to country 41 1 5 3.341463 1.2963367. Communication policy differs from country to
country 41 1 5 3.097561 1.090983
8. Communication policy is the same in all countries 41 1 5 2.317073 0.9337839. Different distribution network characteristics in
South-East Europe 41 1 5 3.073171 1.08144
B. General export strategy10. Top executives are not selected by the parent
company 41 1 4 1.658537 0.883452
11. We need market research 41 2 5 4.243902 0.99449712. Marketing strategy is planned in foreign markets
(e.g. by affiliated companies) 41 1 5 2.829268 1.11585
13. Marketing strategy is planned in Greece 41 1 5 3.121951 1.20820414. The training of foreign staff takes place in South-
East Europe countries 41 1 5 2.609756 0.945464
15. Training of staff takes place in Greece 41 1 5 3.121951 0.9272316. Foreign executives/staff need training 41 1 5 4.170732 1.046481
In the second part of the analysis we present the results of the given answers in the key elements of these firms’ marketing strategy. A five-point scale, with 1 for “strong disagreement” and 5 for “strong agreement” with each variable, was the response vehicle for each marketing variable. This provided also 41 individual responses that spanned sixteen variables for marketing and thus entered into the factor solution. The sixteen variables for export marketing were not designed to be industry–specific. The
238 P. LIARGOVAS, K. SKANDALIS, South-Eastern Europe Journal of Economics 2 (2008) 227-244
responses to the various questions were analyzed with respect to the frequency of response and the mean response. Table 5 shows the minimum, maximum, mean and the standard deviation values of these responses.
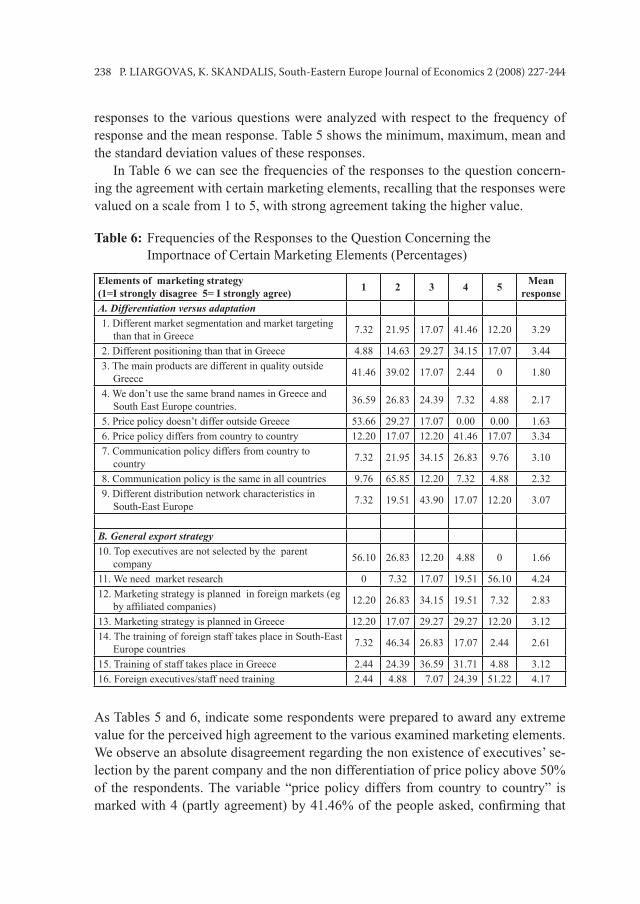
In Table 6 we can see the frequencies of the responses to the question concern-ing the agreement with certain marketing elements, recalling that the responses were valued on a scale from 1 to 5, with strong agreement taking the higher value.
Table 6: Frequencies of the Responses to the Question Concerning the Importnace of Certain Marketing Elements (Percentages)
Elements of marketing strategy(1=I strongly disagree 5= I strongly agree) 1 2 3 4 5 Mean
responseA. Differentiation versus adaptation1. Different market segmentation and market targeting
than that in Greece 7.32 21.95 17.07 41.46 12.20 3.29
2. Different positioning than that in Greece 4.88 14.63 29.27 34.15 17.07 3.443. The main products are different in quality outside
Greece 41.46 39.02 17.07 2.44 0 1.80
4. We don’t use the same brand names in Greece and South East Europe countries. 36.59 26.83 24.39 7.32 4.88 2.17
5. Price policy doesn’t differ outside Greece 53.66 29.27 17.07 0.00 0.00 1.636. Price policy differs from country to country 12.20 17.07 12.20 41.46 17.07 3.347. Communication policy differs from country to
country 7.32 21.95 34.15 26.83 9.76 3.10
8. Communication policy is the same in all countries 9.76 65.85 12.20 7.32 4.88 2.329. Different distribution network characteristics in
South-East Europe 7.32 19.51 43.90 17.07 12.20 3.07
B. General export strategy10. Top executives are not selected by the parent
company 56.10 26.83 12.20 4.88 0 1.66
11. We need market research 0 7.32 17.07 19.51 56.10 4.2412. Marketing strategy is planned in foreign markets (eg
by affiliated companies) 12.20 26.83 34.15 19.51 7.32 2.83
13. Marketing strategy is planned in Greece 12.20 17.07 29.27 29.27 12.20 3.1214. The training of foreign staff takes place in South-East
Europe countries 7.32 46.34 26.83 17.07 2.44 2.61
15. Training of staff takes place in Greece 2.44 24.39 36.59 31.71 4.88 3.1216. Foreign executives/staff need training 2.44 4.88 7.07 24.39 51.22 4.17
As Tables 5 and 6, indicate some respondents were prepared to award any extreme value for the perceived high agreement to the various examined marketing elements. We observe an absolute disagreement regarding the non existence of executives’ se-lection by the parent company and the non differentiation of price policy above 50% of the respondents. The variable “price policy differs from country to country” is marked with 4 (partly agreement) by 41.46% of the people asked, confirming that
P. LIARGOVAS, K. SKANDALIS, South-Eastern Europe Journal of Economics 2 (2008) 227-244 239
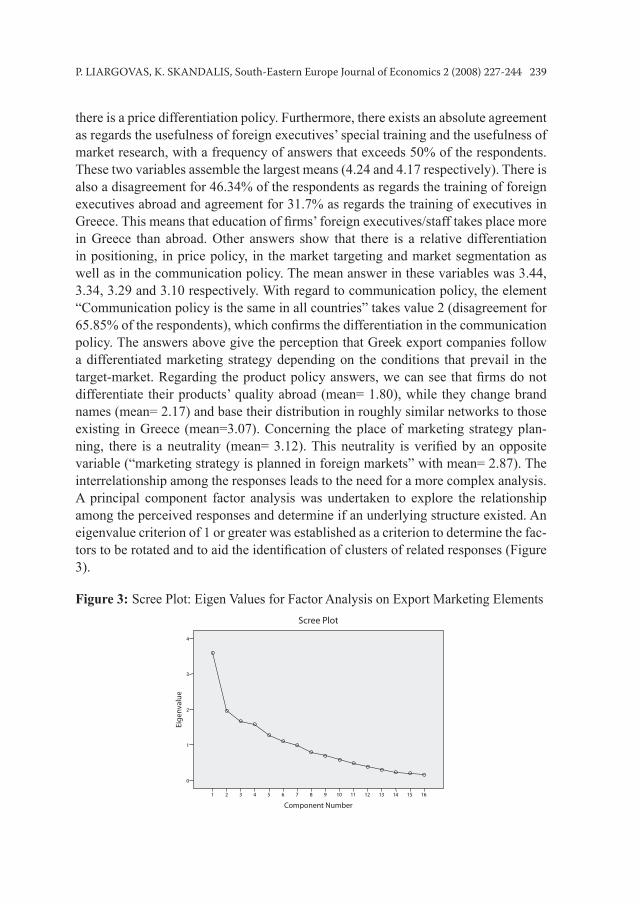
there is a price differentiation policy. Furthermore, there exists an absolute agreement as regards the usefulness of foreign executives’ special training and the usefulness of market research, with a frequency of answers that exceeds 50% of the respondents. These two variables assemble the largest means (4.24 and 4.17 respectively). There is also a disagreement for 46.34% of the respondents as regards the training of foreign executives abroad and agreement for 31.7% as regards the training of executives in Greece. This means that education of firms’ foreign executives/staff takes place more in Greece than abroad. Other answers show that there is a relative differentiation in positioning, in price policy, in the market targeting and market segmentation as well as in the communication policy. The mean answer in these variables was 3.44, 3.34, 3.29 and 3.10 respectively. With regard to communication policy, the element “Communication policy is the same in all countries” takes value 2 (disagreement for 65.85% of the respondents), which confirms the differentiation in the communication policy. The answers above give the perception that Greek export companies follow a differentiated marketing strategy depending on the conditions that prevail in the target-market. Regarding the product policy answers, we can see that firms do not differentiate their products’ quality abroad (mean= 1.80), while they change brand names (mean= 2.17) and base their distribution in roughly similar networks to those existing in Greece (mean=3.07). Concerning the place of marketing strategy plan-ning, there is a neutrality (mean= 3.12). This neutrality is verified by an opposite variable (“marketing strategy is planned in foreign markets” with mean= 2.87). The interrelationship among the responses leads to the need for a more complex analysis. A principal component factor analysis was undertaken to explore the relationship among the perceived responses and determine if an underlying structure existed. An eigenvalue criterion of 1 or greater was established as a criterion to determine the fac-tors to be rotated and to aid the identification of clusters of related responses (Figure 3).
Figure 3: Scree Plot: Eigen Values for Factor Analysis on Export Marketing Elements
240 P. LIARGOVAS, K. SKANDALIS, South-Eastern Europe Journal of Economics 2 (2008) 227-244
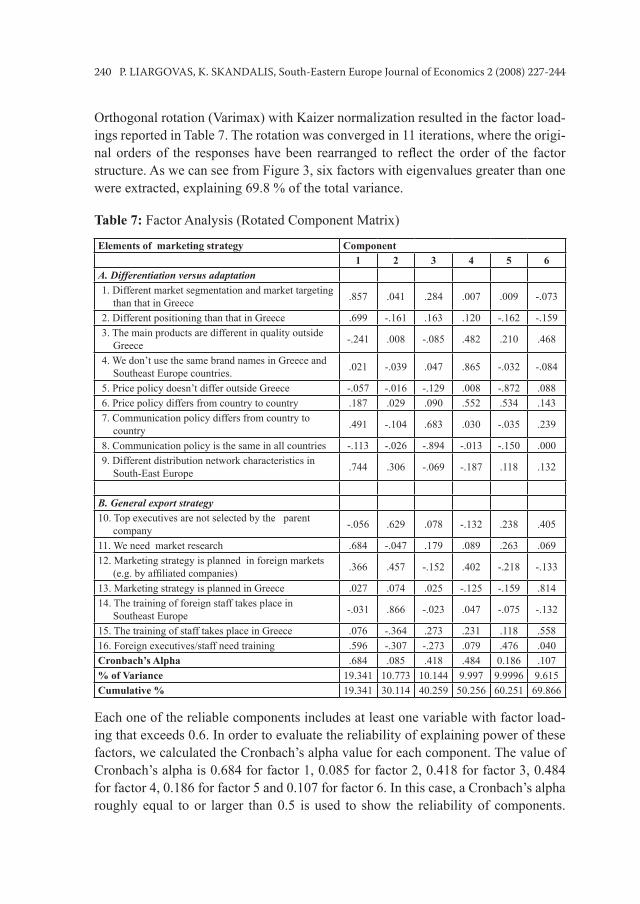
Orthogonal rotation (Varimax) with Kaizer normalization resulted in the factor load-ings reported in Table 7. The rotation was converged in 11 iterations, where the origi-nal orders of the responses have been rearranged to reflect the order of the factor structure. As we can see from Figure 3, six factors with eigenvalues greater than one were extracted, explaining 69.8 % of the total variance.
Table 7: Factor Analysis (Rotated Component Matrix)
Elements of marketing strategy Component1 2 3 4 5 6
A. Differentiation versus adaptation1. Different market segmentation and market targeting
than that in Greece .857 .041 .284 .007 .009 -.073
2. Different positioning than that in Greece .699 -.161 .163 .120 -.162 -.1593. The main products are different in quality outside
Greece -.241 .008 -.085 .482 .210 .468
4. We don’t use the same brand names in Greece and Southeast Europe countries. .021 -.039 .047 .865 -.032 -.084
5. Price policy doesn’t differ outside Greece -.057 -.016 -.129 .008 -.872 .0886. Price policy differs from country to country .187 .029 .090 .552 .534 .1437. Communication policy differs from country to
country .491 -.104 .683 .030 -.035 .239
8. Communication policy is the same in all countries -.113 -.026 -.894 -.013 -.150 .0009. Different distribution network characteristics in
South-East Europe .744 .306 -.069 -.187 .118 .132
B. General export strategy10. Top executives are not selected by the parent
company -.056 .629 .078 -.132 .238 .405
11. We need market research .684 -.047 .179 .089 .263 .06912. Marketing strategy is planned in foreign markets
(e.g. by affiliated companies) .366 .457 -.152 .402 -.218 -.133
13. Marketing strategy is planned in Greece .027 .074 .025 -.125 -.159 .81414. The training of foreign staff takes place in
Southeast Europe -.031 .866 -.023 .047 -.075 -.132
15. The training of staff takes place in Greece .076 -.364 .273 .231 .118 .55816. Foreign executives/staff need training .596 -.307 -.273 .079 .476 .040Cronbach’s Alpha .684 .085 .418 .484 0.186 .107% of Variance 19.341 10.773 10.144 9.997 9.9996 9.615Cumulative % 19.341 30.114 40.259 50.256 60.251 69.866
Each one of the reliable components includes at least one variable with factor load-ing that exceeds 0.6. In order to evaluate the reliability of explaining power of these factors, we calculated the Cronbach’s alpha value for each component. The value of Cronbach’s alpha is 0.684 for factor 1, 0.085 for factor 2, 0.418 for factor 3, 0.484 for factor 4, 0.186 for factor 5 and 0.107 for factor 6. In this case, a Cronbach’s alpha roughly equal to or larger than 0.5 is used to show the reliability of components.
P. LIARGOVAS, K. SKANDALIS, South-Eastern Europe Journal of Economics 2 (2008) 227-244 241
Therefore, components 1, 3 and 4 are the most reliable. Component 1 relates the importance of differentiation in market segmentation and market targeting, distri-bution networks and positioning with the importance of market research and staff training (export strategy). The factor loadings are 0.857, 0.744, 0.699, 0.596 and 0.684 respectively. These variables have higher factor loadings in the first factor than in the other five. Component 1 measures a perceived dimension of differentiation in the processes of market entry and planning of marketing strategy for the South-East European markets. It combines elements of strategic planning (training of execu-tives, market research) with elements of marketing mix (distribution networks and positioning). The explaining power of this factor reaches 19.34% of total variance. As regards component 3, there is only one variable, “communication policy differs from country to country”, which has a factor loading 0.683, explaining 10.14% of the total variance. Component 4 relates the attributed importance in the differentiation of products’ brand names and the price policy in the various target-markets with factor loadings 0.865 and 0.552 respectively. Thus, this component reveals the differentia-tion as regards the promotion and price policy which constitute elements of market-ing mix (the 4Ps of marketing mix: price, promotion, product, place/distribution). This component explains 9.99% of the total variance. It is evident from the above that Greek firms engaged in South-East Europe apply differentiated marketing strat-egy combined with elements of the general export strategy such as market research and training. In other words, they adapt some of the main elements of marketing strategy to the local markets’ needs. Factor analysis shows that the larger amount of differentiation can be analyzed in the light of three basic factors: (a) differentiation in the processes of market entry and planning of marketing strategy, (b) differentia-tion as regards the product promotion and price policy and (c) differentiation in the communication policy.
Before concluding this section we should stress that our study suffers from a number of limitations. One is related to the relatively small and specialized sample size: the scope of this research is focused on listed (on the Athens stock exchange) ex-porters to South-East Europe. In addition, only a number of export initial incentives and export marketing elements have been explored and hence the effect of other vari-ables not included was not measured or considered. We should also take into account the possibility that respondents may have been more likely to attribute their export performance to their own efforts rather than the efforts of their local representatives or alternatively external, environmental factors e.g. general economic and political conditions. Finally the lack of uniformity in the region of the Balkans in terms of the level of development and the socioeconomic and political environment of the region’s countries adds to the difficulty of achieving reliable findings with the factor analysis technique, especially concerning differentiated marketing strategies.
242 P. LIARGOVAS, K. SKANDALIS, South-Eastern Europe Journal of Economics 2 (2008) 227-244
4. Conclusions and policy implications
A considerable number of academic papers are focused on exporting, one of the most common entry modes to the international markets. As a result, export marketing strat-egies and export behaviour motives have been a primary area of interest. Our paper has made two contributions. It proposed a framework that incorporates various in-ternal, external and strategic factors explaining the motivation and the marketing strategy of exporting firms. In particular, we conceptualized Greek exports to a geo-graphically and psychologically close market to Greece, South-East Europe, within the framework of a model of strategic management. Under this framework exporting behaviour is affected by external factors, such as market size and characteristics, ex-pected profits, competition, economic stability, as well as by internal factors, namely marketing infrastructure (personnel, technical support etc). As firms begin to com-pete in export markets, their export success depends upon their ability to develop and implement unique competitive strategies. This can be achieved through differentiated marketing strategy as regards price, promotion, product, placement/distribution with elements of the general export strategy such as market research and training.
Our study differs from most published research dealing with export behavior in a number of aspects. First, it looks at the export behavior of active Greek exporters listed on the Athens stock exchange with their major exports to the South-East Eu-rope, which is a geographically and psychologically close market to Greece. Second, it analyses the behavior of exporting firms in their initial export incentives and some basic elements of marketing strategy. Finally, we use factor analysis technique for both parts of the analysis. An avenue of future research could be related to the vali-dation of our results through data collection concerning Greek firms exporting prin-cipally to other world markets. Furthermore the results of our study suggest that in order to increase exports, Greek policy makers should continue to support economic restructuring and stability in the Balkans. Additionally, they should assist Greek firms by various measures to build marketing infrastructure, research and training of per-sonnel.
ReferencesAaby N., Slater S., 1989, “Management influences on export performance: a review of the empiri-
cal literature 1978-88”, International Marketing Review, 6, 4, 7-26.Albaum, G., Strandskov, J. and Duerr, E., 1998, International Marketing and Export Management,
Wokingham: Addison-Wesley.Aulakh, P., Kotabe, M. and Teegen, H., 2000, “Export strategies and performance of firms from
emerging economies: Evidence from Brazil, Chile and Mexico”, Academy of Management Journal, 43, 3, 342-361.
Bilkey, W. J. 1978, “An Attempted Integration of the Literature on the Export Behavior of Firms”, Journal of International Business Studies, 9, 1, 33-46.
P. LIARGOVAS, K. SKANDALIS, South-Eastern Europe Journal of Economics 2 (2008) 227-244 243
Cavusgil, S. T. and Zou, S., 1994, “Marketing Strategy-Performance Relationship: An Investiga-tion of the Empirical Link in Export Market Ventures”, Journal of Marketing, 58,1, 1-21.
Cavusgil, S. T., and Nevin, J. R., 1981, “Internal Determinants of Export Marketing Behaviour: An Empirical Investigation”, Journal of Marketing Research, 18, 14-119.
Czinkota, M.R., 2000, “Educator insights: the policy gap in international marketing”, Journal of International Marketing, 8, 1, 99-111.
Dawes, J., 2008, “Do data characteristics change according to the number of scale points used? An experiment using 5-point, 7-point and 10-point scales”, International Journal of Market Research, 50, 1, 61-77.
Dean, D., Mengüç, B. and Myers, C.P., 2000, “Revisiting Firm Characteristics, Strategy, and Ex-port Performance Relationship: A Survey of the Literature and an Investigation of New Zealand Small Manufacturing Firms”, Industrial Marketing Management, 29, 5, 461-477.
Douglas, S. P. and Craig C.S., 1983, International Marketing Research, Englewood Cliffs, NJ. Prentice Hall.
Groves, R., 1990, Survey Errors and Survey Costs, New York: John P. Wiley and Sons.Katsikeas, C., Leonidou, C.L., and Morgan, N., 2000, “Firm-level export performance assessment:
review, evaluation and development”, Journal of the Academy of Marketing Science, 28, 4, 493-511.
Kline, P., 1994, An Easy Guide to Factor Analysis, Cornwall, Great Britain: TJ Press Ltd.Lado N., Martínez-Ros E. and Valenzuela A., 2004, “Identifying successful marketing strategies by
export regional destination”, International Marketing Review, 21, 6, 573-597.Leonidou, L.C., 1995, “Export Stimulation Research: Review, Evaluation, and Integration”, Inter-
national Business Review, 4, 2, 133-156.Leonidou, L.C., 1998 “Organizational Determinants of Exporting: Conceptual, Methodological,
and Empirical Insights”, Management International Review, 38, 1, 7-52.Leonidou, L.C., and Katsikeas, C.S., 1996, “The export development process: an integrative review
of empirical models”, Journal of International Business Studies, 27, 3, 517-551.Miller, D., 1988, “Relating Porter’s business strategies to environment and structure: Analysis and
performance implications”, Academy of Management Journal, 31, 280-308.Moen, Q., 2000, “SMEs and International Marketing: Investigating the Differences in Export Strat-
egy Between Firms of Different Size”, Journal of Global Marketing, 13, 4, 7-28.Morgan, N. A., Kaleka A., and Katsikeas C. S., 2004, “Antecedents of Export Venture Perform-
ance: A Theoretical Model and Empirical Assessment”, Journal of Marketing, 68, 90-108.Pavord, W.C., and Bogart, R.G., 1975, “The Dynamics of the Decision to Export”, Akron Business
and Economic Review, Spring, 6-11.Porter E. M., 1998, Competitive Advantage: Creating and Sustaining Superior Performance, New
York: Free Press.Porter, M. E., 1980, Competitive strategy: Techniques for analyzing industries and competitors,
New York: Free Press.Porter, M.E., 1986, Competition in global industries, Boston: Harvard Business School Press.Reid, S.D., 1981, “Decision maker and export entry and expansion”, Journal of International Busi-
ness Studies, Fall,101-13.
244 P. LIARGOVAS, K. SKANDALIS, South-Eastern Europe Journal of Economics 2 (2008) 227-244
Rummel R.J., 2002, “Understanding Factor Analysis”, Retrieved from http://www.hawaii.edu/powerkills/UFA.HTM
Salavrakos I.D. and Petrochilos G. A., 2003, “An Assessment of the Greek Entrepreneurial Activity in the Black Sea Area (1989-2000): Causes and Prospects”, Journal of Socio-Economics, 32, 331-349.
Shoham, A., 1996, “Marketing-mix standardization: determinants of export performance”, Journal of Global Marketing, 10, 2, 53-73.
Stöttinger, B. and Schlegelmilch, B., 1998, “Explaining Export Development through Psychic Dis-tance: Enlightening or Elusive”, International Marketing Review, 15, 5, 357-72.
Stöttinger, B. and Schlegelmilch, B., 2000, “Psychic distance: A concept past its due date?” , Inter-national Marketing Review, 17, 2, 169-73.
Zou, S. and Stan, S., 1998, “The Determinants of Export Performance: A Review of the Empirical Literature Between 1987 and 1997”, International Marketing Review, 15, 5, 333-356.