Embed Size (px)
Citation preview
http://mcr.sagepub.com/Review
Medical Care Research and
http://mcr.sagepub.com/content/70/6/621The online version of this article can be found at:
DOI: 10.1177/1077558713496319 2013 70: 621 originally published online 22 July 2013Med Care Res Rev
Kimberley H. Geissler, Mark W. Friedberg, Gillian K. SteelFisher and Eric C. SchneiderPerformance Improvement
Motivators and Barriers to Using Patient Experience Reports for
Published by:
http://www.sagepublications.com
can be found at:Medical Care Research and ReviewAdditional services and information for
http://mcr.sagepub.com/cgi/alertsEmail Alerts:
http://mcr.sagepub.com/subscriptionsSubscriptions:
http://www.sagepub.com/journalsReprints.navReprints:
http://www.sagepub.com/journalsPermissions.navPermissions:
http://mcr.sagepub.com/content/70/6/621.refs.htmlCitations:
What is This?
- Jul 22, 2013OnlineFirst Version of Record
- Nov 13, 2013Version of Record >>
at SMU on August 15, 2014mcr.sagepub.comDownloaded from at SMU on August 15, 2014mcr.sagepub.comDownloaded from
Medical Care Research and Review70(6) 621 –635
© The Author(s) 2013Reprints and permissions:
sagepub.com/journalsPermissions.nav DOI: 10.1177/1077558713496319
mcr.sagepub.com
Empirical Research
Motivators and Barriers to Using Patient Experience Reports for Performance Improvement
Kimberley H. Geissler1,2, Mark W. Friedberg3,4,5, Gillian K. SteelFisher6, and Eric C. Schneider3,4,5,6
AbstractIncreasingly, patient experience surveys are available to provide performance feedback to physician groups. However, limited published literature addresses factors influencing use of these reports for performance improvement. To address this gap, we conducted semistructured interviews with leaders of Massachusetts physician groups. We asked about factors influencing groups’ use of performance data and report characteristics. Motivating characteristics included having group leaders who emphasized a positive patient experience and prioritized patient retention; public reporting was not an important motivator for most groups. Full physician panels were perceived as a barrier to use of reports. Performance reports from a statewide public reporting collaborative were not sufficient for the majority of groups, with many seeking external reports. As policy makers create financial incentives to support performance improvement, assisting leaders to articulate the professional case for patient experience and enhancing the content and timing of performance reports may be important.
This article, submitted to Medical Care Research and Review on November 21, 2012, was revised and accepted for publication on June 3, 2013.
1Boston University School of Management, Boston, MA, USA2Gillings School of Global Public Health, The University of North Carolina at Chapel Hill, Chapel Hill, NC, USA3RAND Corporation, Boston, MA, USA4Harvard Medical School, Boston, MA, USA5Brigham and Women’s Hospital, Boston, MA, USA6Harvard School of Public Health, Boston, MA, USA
Corresponding Author:Kimberley H. Geissler, Department of Markets, Public Policy, and Law, Boston University School of Management, 595 Commonwealth Avenue, Boston, MA 02215, USA. Email: [email protected]
496319 MCR70610.1177/1077558713496319Medical Care Research and ReviewGeissler et al.research-article2013
at SMU on August 15, 2014mcr.sagepub.comDownloaded from
622 Medical Care Research and Review 70(6)
Keywordspatient experience, quality of care, performance improvement, physician groups
Improving patients’ experiences of care is a key priority for health system reform in the United States (Institute of Medicine, 2001). The Affordable Care Act of 2010 mandated new payment approaches based in part on the results of validated surveys of patient experience (Millenson & Macri, 2012). For example, hospitals are penal-ized if they fail to measure and publicly report standardized patient experience measures (Elliott et al., 2010). In the ambulatory setting, public reporting and pay-for-performance based on patient experience data are well under way in some locales (Rodriguez, Von Glahn, Elliott, Rogers, & Safran, 2009; Safran et al., 2006). In 2006, Massachusetts became one of the first states to report selected patient experience measures publicly for consumers and nonpublicly to ambulatory physi-cian groups (Safran et al., 2006; Massachusetts Health Quality Partners [MHQP], 2011).
Beyond imposing incentives through reporting and pay-for-performance programs, limited published research has focused on the modifiable factors associated with improvement of patient experience in the ambulatory physician group setting. In an earlier study, we found that groups with integrated organizational models were more likely to dedicate effort to improving patient experience (Friedberg, SteelFisher, Karp, & Schneider, 2011); however, groups’ organizational models may not be modifiable in the near term. If other factors, such as the goals articulated by group leaders and the characteristics of patient experience reports, can be modified more easily, policy mak-ers and other stakeholders could alter these factors to better motivate improvement in patients’ experiences. In the ambulatory care setting, physicians may value guidance on productive responses to patient experience reports, and report designers could con-struct reports to maximize their utility to physicians and others.
New Contribution
To our knowledge, no prior study has examined the views of a broad, cross-sectional sample of community-based physician group leaders about the motivators and barriers to engaging in efforts to improve patient experience. Prior studies have focused on medical groups voluntarily participating in quality improvement collaboratives (Davies & Cleary, 2005; Davies et al., 2008), and these self-selected groups may be different from most other physician groups. The statewide sample of leaders approached in this study were known to vary in the level of familiarity and use of patient experience measures (Friedberg et al., 2011), potentially increasing the gener-alizability of our results to other settings. Massachusetts Health Quality Partners (MHQP), a multi-stakeholder collaborative, has distributed biennial patient experi-ence survey data in a confidential, detailed format to nearly all Massachusetts
at SMU on August 15, 2014mcr.sagepub.comDownloaded from
Geissler et al. 623
physician groups since 2006. This reporting has created a sustained opportunity for the state’s physician groups to learn about and use these reports.
In addition, this article examines how characteristics of patient experience reports themselves may influence physician group leaders’ decisions to engage in improve-ment efforts. While prior studies have examined the characteristics of performance reports that best inform patients’ choices of providers (Glickman, Baggett, Krubert, Peterson, & Schulman, 2007; Hibbard, Greene, & Daniel, 2010; Ranganathan et al., 2009), limited research has focused on the design and effectiveness of nonpublic reporting to physicians and ambulatory groups (Shaller & Kanouse, 2012). Recent research on nonpublic reporting relied primarily on information from community quality collaboratives and did not focus exclusively on patient experience, combining information on clinical and patient experience performance reports (Shaller & Kanouse, 2012; Teleki, Shaw, Damberg, & McGlynn, 2006).
Finally, our study addresses not just the MHQP report, but also other patient experi-ence and satisfaction data that are increasingly available for groups to purchase from customer satisfaction survey firms. These purchased reports may differ from the MHQP report in data collection (including instruments and sampling methods), data presentation (including the content and frequency of reports), and other features. Understanding how physician group leaders respond to these various features may inform the design of future reports, both in the public and private sectors.
Conceptual Model
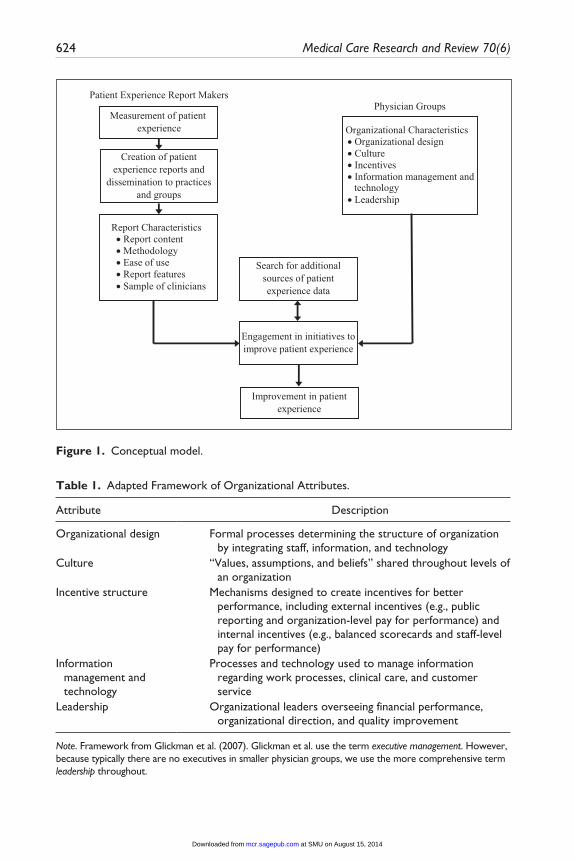
The conceptual model (Figure 1) recognizes that characteristics of reports and organi-zations can interact to motivate or discourage efforts to improve patient experience. The model examines the pathway leading from the measurement of patient experience by report makers to improvement in patient experience by physician groups. Performance report makers analyze response data from patient experience surveys and format survey results to create patient experience reports that can be disseminated to audiences, including physician groups, payers, and the public (MHQP, 2011). Characteristics of these reports—including content, methodology, and ease of use—influence physician groups’ interpretation of the results, their likelihood of engage-ment in performance improvement initiatives, and actions they may take to improve patient experience. Based on an existing model of organizational influences on quality improvement in health care (Glickman et al., 2007), we expect five categories of orga-nizational characteristics to influence physician groups’ responses to performance reports: organizational design, culture, incentives, information management and tech-nology, and leadership (Table 1).
Several types of interactions between organizational characteristics and perfor-mance report characteristics are possible. For example, if a group lacks organizational characteristics conducive to conducting performance improvement initiatives, even a well-designed reporting system may fail to drive improvement. Alternatively, a group that is highly motivated to improve performance on patient experience measures may
at SMU on August 15, 2014mcr.sagepub.comDownloaded from
624 Medical Care Research and Review 70(6)
Measurement of patient experience
Creation of patientexperience reports and
dissemination to practicesand groups
Organizational Characteristics• Organizational design• Culture• Incentives• Information management and
technology• Leadership
Report Characteristics• Report content• Methodology• Ease of use• Report features• Sample of clinicians
Patient Experience Report MakersPhysician Groups
Engagement in initiatives toimprove patient experience
Improvement in patientexperience
Search for additionalsources of patientexperience data
Figure 1. Conceptual model.
Table 1. Adapted Framework of Organizational Attributes.
Attribute Description
Organizational design Formal processes determining the structure of organization by integrating staff, information, and technology
Culture “Values, assumptions, and beliefs” shared throughout levels of an organization
Incentive structure Mechanisms designed to create incentives for better performance, including external incentives (e.g., public reporting and organization-level pay for performance) and internal incentives (e.g., balanced scorecards and staff-level pay for performance)
Information management and technology
Processes and technology used to manage information regarding work processes, clinical care, and customer service
Leadership Organizational leaders overseeing financial performance, organizational direction, and quality improvement
Note. Framework from Glickman et al. (2007). Glickman et al. use the term executive management. However, because typically there are no executives in smaller physician groups, we use the more comprehensive term leadership throughout.
at SMU on August 15, 2014mcr.sagepub.comDownloaded from
Geissler et al. 625
actively seek multiple reports and other sources of feedback. This search may be itera-tive, with a group assessing several different report types before settling on the report (or reports) that group leaders believe best meets the group’s specific needs. An inter-nal report that meets a group’s needs may make subsequent search unnecessary. If a group has some of the organizational characteristics associated with a willingness to engage in performance improvement but is undecided about whether or not to engage, receiving a report conducive to improvement may sway its decision in favor of engage-ment. Although our model makes the optimistic assumption that engagement in per-formance improvement initiatives leads to improvement in patient experience, currently there is little empirical evidence indicating which strategies groups can use to achieve such improvements (Davies et al., 2008; Davies, Meterko, Charns, Nealon Seibert, & Cleary, 2011; Vingerhoets, Wensing, & Grol, 2001).
Method
Details of the group leader interviews have been described elsewhere (Friedberg et al., 2011) and are summarized briefly here.
Physician Group Sample
We identified physician groups eligible for sampling using the 2007 MHQP statewide physician directory, which included all Massachusetts physician groups with at least three physicians providing care to enrollees in at least one of the five largest commer-cial health plans in Massachusetts. Physician groups were defined as sets of physicians practicing at one or more office addresses and sharing at least one group-level man-ager. We excluded physician groups not providing adult primary care from the study sample, resulting in the final study sample of 117 physician groups.
Interviews With Group Leaders
We created a guide for 30-minute semistructured interviews designed to assess the use of patient experience reports. The guide included questions about the extent to which groups engaged in efforts to improve patient experience as well as motivators and bar-riers to initiating such efforts. In addition, the guide asked which reports each group leader had seen in the prior year and elicited specific properties of these reports that added to or detracted from their usefulness in performance improvement efforts.
In each group, we invited a medical director, administrator, or manager for an inter-view; these respondents were considered to be group leaders who were knowledgeable about their groups’ performance improvement initiatives. We conducted and recorded the interviews by telephone between June and November 2008, and the interview recordings were then transcribed. The RAND Human Subjects Protection Committee and Harvard School of Public Health Office of Human Research Administration approved the study.
at SMU on August 15, 2014mcr.sagepub.comDownloaded from
626 Medical Care Research and Review 70(6)
Analysis
We analyzed the interview transcripts using a variation of content analysis (Pope, Ziebland, & Mays, 2000). For each section of the analysis, we reviewed relevant por-tions of the transcripts. These portions included responses to questions about motivators and barriers to using patient experience reports for performance improvement initiatives, responses to questions about the characteristics of patient experience reports, and any mentions of these topics occurring elsewhere in the interviews (e.g., when a respondent mentioned a motivator as part of a response to another question).
In the first round of analysis for each section (i.e., motivators and barriers, report characteristics), an author and a research assistant reviewed all the interviews and developed a coding scheme that captured the concepts respondents discussed. Codes were added until we felt there was thematic saturation. We reached consensus on defi-nitions for each code and its application through discussion with all authors. After developing the coding scheme, we categorized the motivators and barriers into the five elements of organizational structure as described in the conceptual model (Glickman et al., 2007); report characteristics were grouped into related categories developed by consensus among the authors. In a second round of analysis, a second research assis-tant used these organized coding schemes to consistently code all the interviews. After coding was completed, we calculated the code frequencies to identify the most fre-quently mentioned themes.
Results
Characteristics of Responding Groups
We completed interviews with leaders from 72 groups (62% response rate). Responding groups had a median of 15 physicians per group (range = 3-244 physicians). Nonresponding groups had fewer physicians per group but were similar on other observed characteristics (Friedberg et al., 2011).
Motivators
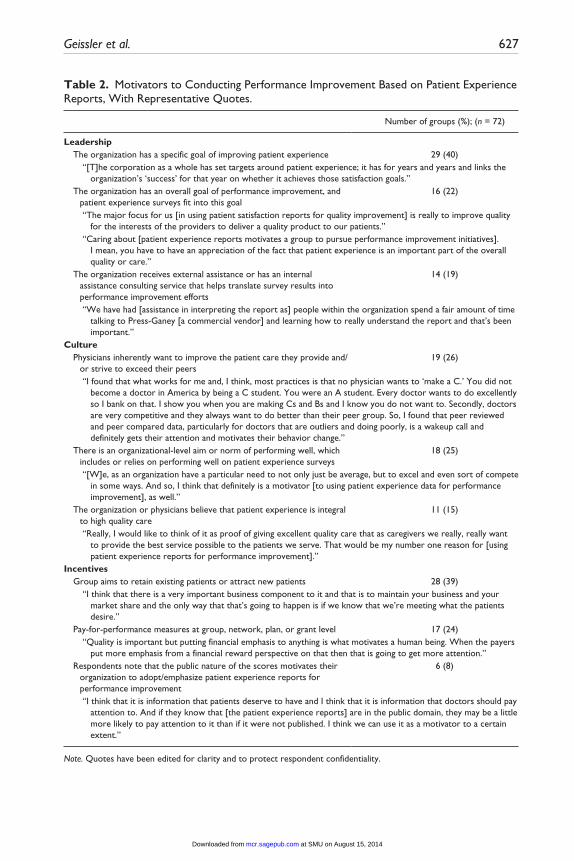
Group leaders described motivators classified in three categories of organizational structure (Glickman et al., 2007): leadership, culture, and incentives (Table 2). No group leader mentioned motivators or barriers that could be classified in the categories of organizational design or information management and technology.
Frequently mentioned motivators within the leadership category included having organization goals that emphasized improving performance on patient experience sur-veys (40%) or performance overall (22%). Nineteen percent of respondents mentioned receipt of external assistance (e.g., consultation from a commercial patient experience survey firm) or dedication of internal resources (e.g., a staff member tasked with inter-preting quality reports) as motivating the translation of patient experience reports to performance improvement initiatives.
at SMU on August 15, 2014mcr.sagepub.comDownloaded from
Geissler et al. 627
Table 2. Motivators to Conducting Performance Improvement Based on Patient Experience Reports, With Representative Quotes.
Number of groups (%); (n = 72)
Leadership The organization has a specific goal of improving patient experience 29 (40) “[T]he corporation as a whole has set targets around patient experience; it has for years and years and links the
organization’s ‘success’ for that year on whether it achieves those satisfaction goals.” The organization has an overall goal of performance improvement, and
patient experience surveys fit into this goal16 (22)
“The major focus for us [in using patient satisfaction reports for quality improvement] is really to improve quality for the interests of the providers to deliver a quality product to our patients.”
“Caring about [patient experience reports motivates a group to pursue performance improvement initiatives]. I mean, you have to have an appreciation of the fact that patient experience is an important part of the overall quality or care.”
The organization receives external assistance or has an internal assistance consulting service that helps translate survey results into performance improvement efforts
14 (19)
“We have had [assistance in interpreting the report as] people within the organization spend a fair amount of time talking to Press-Ganey [a commercial vendor] and learning how to really understand the report and that’s been important.”
Culture Physicians inherently want to improve the patient care they provide and/
or strive to exceed their peers19 (26)
“I found that what works for me and, I think, most practices is that no physician wants to ‘make a C.’ You did not become a doctor in America by being a C student. You were an A student. Every doctor wants to do excellently so I bank on that. I show you when you are making Cs and Bs and I know you do not want to. Secondly, doctors are very competitive and they always want to do better than their peer group. So, I found that peer reviewed and peer compared data, particularly for doctors that are outliers and doing poorly, is a wakeup call and definitely gets their attention and motivates their behavior change.”
There is an organizational-level aim or norm of performing well, which includes or relies on performing well on patient experience surveys
18 (25)
“[W]e, as an organization have a particular need to not only just be average, but to excel and even sort of compete in some ways. And so, I think that definitely is a motivator [to using patient experience data for performance improvement], as well.”
The organization or physicians believe that patient experience is integral to high quality care
11 (15)
“Really, I would like to think of it as proof of giving excellent quality care that as caregivers we really, really want to provide the best service possible to the patients we serve. That would be my number one reason for [using patient experience reports for performance improvement].”
Incentives Group aims to retain existing patients or attract new patients 28 (39) “I think that there is a very important business component to it and that is to maintain your business and your
market share and the only way that that’s going to happen is if we know that we’re meeting what the patients desire.”
Pay-for-performance measures at group, network, plan, or grant level 17 (24) “Quality is important but putting financial emphasis to anything is what motivates a human being. When the payers
put more emphasis from a financial reward perspective on that then that is going to get more attention.” Respondents note that the public nature of the scores motivates their
organization to adopt/emphasize patient experience reports for performance improvement
6 (8)
“I think that it is information that patients deserve to have and I think that it is information that doctors should pay attention to. And if they know that [the patient experience reports] are in the public domain, they may be a little more likely to pay attention to it than if it were not published. I think we can use it as a motivator to a certain extent.”
Note. Quotes have been edited for clarity and to protect respondent confidentiality.
at SMU on August 15, 2014mcr.sagepub.comDownloaded from
628 Medical Care Research and Review 70(6)
Items related to organizational culture were frequently mentioned as motivators for implementing improvement efforts. Twenty-six percent of respondents mentioned that physicians intrinsically wanted to improve the patient care they provided or, in a com-petitive spirit, achieve better performance than their peers.
Group leaders also described external incentives that motivated their use of patient experience reports to guide performance improvement. Thirty-nine percent of respon-dents mentioned retaining current or attracting new patients as motivators of such performance improvement efforts. Twenty-four percent of respondents reported that pay-for-performance incentives motivated their improvement efforts, but only 8% of respondents mentioned public reporting as a motivator.
Barriers
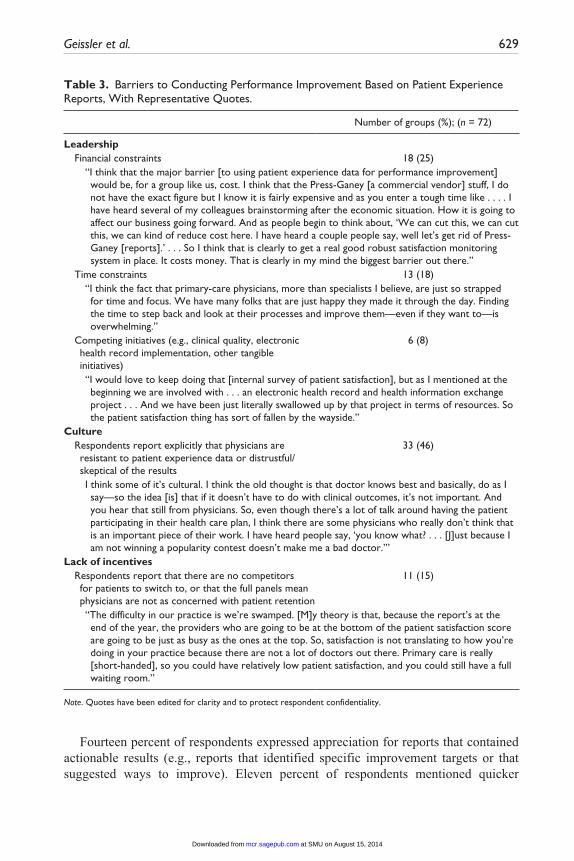
Like the motivators, barriers to engaging in improvement efforts based on patient experience reports fell into the three categories of leadership, culture, and incentives (Table 3). In the leadership category, the most frequently mentioned barriers were financial (25%) and time (18%) constraints. These constraints were mentioned as bar-riers both to collecting patient experience data for the group and for implementing performance improvement initiatives based on patient experience reports.
Within the category of organizational culture, 46% of respondents reported physi-cian resistance to patient experience data as a barrier. Respondents mentioning this barrier noted that physicians often were more concerned with their performance on clinical performance measures or felt that patient experience was not an important measure of the care they were providing. The lack of incentives was a barrier for some groups, with 15% of respondents mentioning that having a surplus of patients was a barrier to focusing on patient experience. These respondents noted that their practices would be full regardless of patients’ satisfaction with their care.
Number and Type of Reports Used
Nearly all respondents (93%) reported seeing at least one patient experience report in the prior year: 31% saw one patient experience reports in the prior year, 33% saw two reports, and 29% saw three or more reports. Forty-three percent of respondents reported that the MHQP report was the preferred report for their group, with 29% preferring reports pur-chased from Press-Ganey, the most commonly mentioned commercial vendor.
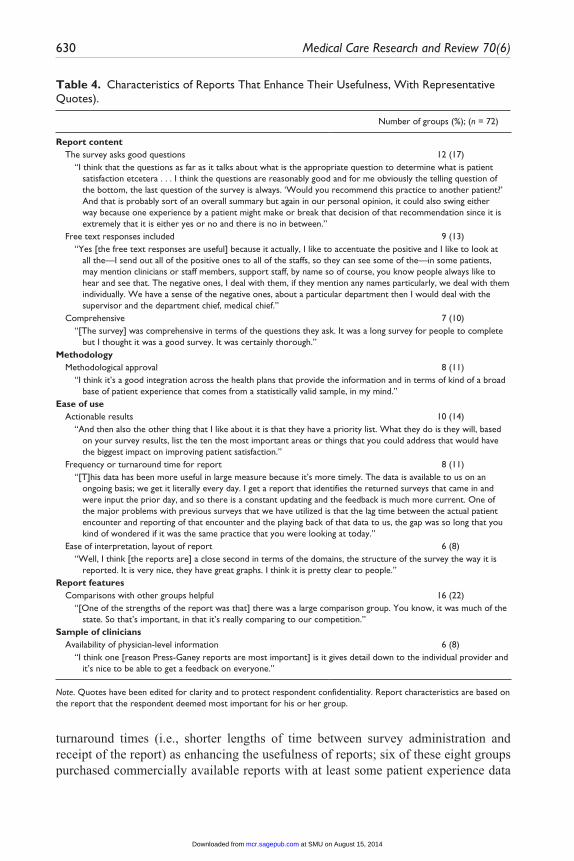
Report Characteristics That Enhance Usefulness
Group leaders identified several report characteristics that enhanced their useful-ness as guides for performance improvement initiatives (Table 4). Thirteen percent of respondents identified patients’ narrative responses as beneficial. Some respon-dents (11%) noted approval of the methodology used to construct the reports, such as statistical reliability, sufficient sample size, and other aspects of survey methodology.
at SMU on August 15, 2014mcr.sagepub.comDownloaded from
Geissler et al. 629
Fourteen percent of respondents expressed appreciation for reports that contained actionable results (e.g., reports that identified specific improvement targets or that suggested ways to improve). Eleven percent of respondents mentioned quicker
Table 3. Barriers to Conducting Performance Improvement Based on Patient Experience Reports, With Representative Quotes.
Number of groups (%); (n = 72)
Leadership Financial constraints 18 (25) “I think that the major barrier [to using patient experience data for performance improvement]
would be, for a group like us, cost. I think that the Press-Ganey [a commercial vendor] stuff, I do not have the exact figure but I know it is fairly expensive and as you enter a tough time like . . . . I have heard several of my colleagues brainstorming after the economic situation. How it is going to affect our business going forward. And as people begin to think about, ‘We can cut this, we can cut this, we can kind of reduce cost here. I have heard a couple people say, well let’s get rid of Press-Ganey [reports].’ . . . So I think that is clearly to get a real good robust satisfaction monitoring system in place. It costs money. That is clearly in my mind the biggest barrier out there.”
Time constraints 13 (18) “I think the fact that primary-care physicians, more than specialists I believe, are just so strapped
for time and focus. We have many folks that are just happy they made it through the day. Finding the time to step back and look at their processes and improve them—even if they want to—is overwhelming.”
Competing initiatives (e.g., clinical quality, electronic health record implementation, other tangible initiatives)
6 (8)
“I would love to keep doing that [internal survey of patient satisfaction], but as I mentioned at the beginning we are involved with . . . an electronic health record and health information exchange project . . . And we have been just literally swallowed up by that project in terms of resources. So the patient satisfaction thing has sort of fallen by the wayside.”
Culture Respondents report explicitly that physicians are
resistant to patient experience data or distrustful/ skeptical of the results
33 (46)
I think some of it’s cultural. I think the old thought is that doctor knows best and basically, do as I say—so the idea [is] that if it doesn’t have to do with clinical outcomes, it’s not important. And you hear that still from physicians. So, even though there’s a lot of talk around having the patient participating in their health care plan, I think there are some physicians who really don’t think that is an important piece of their work. I have heard people say, ‘you know what? . . . [J]ust because I am not winning a popularity contest doesn’t make me a bad doctor.’”
Lack of incentives Respondents report that there are no competitors
for patients to switch to, or that the full panels mean physicians are not as concerned with patient retention
11 (15)
“The difficulty in our practice is we’re swamped. [M]y theory is that, because the report’s at the end of the year, the providers who are going to be at the bottom of the patient satisfaction score are going to be just as busy as the ones at the top. So, satisfaction is not translating to how you’re doing in your practice because there are not a lot of doctors out there. Primary care is really [short-handed], so you could have relatively low patient satisfaction, and you could still have a full waiting room.”
Note. Quotes have been edited for clarity and to protect respondent confidentiality.
at SMU on August 15, 2014mcr.sagepub.comDownloaded from
630 Medical Care Research and Review 70(6)
Table 4. Characteristics of Reports That Enhance Their Usefulness, With Representative Quotes).
Number of groups (%); (n = 72)
Report content The survey asks good questions 12 (17) “I think that the questions as far as it talks about what is the appropriate question to determine what is patient
satisfaction etcetera . . . I think the questions are reasonably good and for me obviously the telling question of the bottom, the last question of the survey is always. ‘Would you recommend this practice to another patient?’ And that is probably sort of an overall summary but again in our personal opinion, it could also swing either way because one experience by a patient might make or break that decision of that recommendation since it is extremely that it is either yes or no and there is no in between.”
Free text responses included 9 (13) “Yes [the free text responses are useful] because it actually, I like to accentuate the positive and I like to look at
all the—I send out all of the positive ones to all of the staffs, so they can see some of the—in some patients, may mention clinicians or staff members, support staff, by name so of course, you know people always like to hear and see that. The negative ones, I deal with them, if they mention any names particularly, we deal with them individually. We have a sense of the negative ones, about a particular department then I would deal with the supervisor and the department chief, medical chief.”
Comprehensive 7 (10) “[The survey] was comprehensive in terms of the questions they ask. It was a long survey for people to complete
but I thought it was a good survey. It was certainly thorough.”Methodology Methodological approval 8 (11) “I think it’s a good integration across the health plans that provide the information and in terms of kind of a broad
base of patient experience that comes from a statistically valid sample, in my mind.”Ease of use Actionable results 10 (14) “And then also the other thing that I like about it is that they have a priority list. What they do is they will, based
on your survey results, list the ten the most important areas or things that you could address that would have the biggest impact on improving patient satisfaction.”
Frequency or turnaround time for report 8 (11) “[T]his data has been more useful in large measure because it’s more timely. The data is available to us on an
ongoing basis; we get it literally every day. I get a report that identifies the returned surveys that came in and were input the prior day, and so there is a constant updating and the feedback is much more current. One of the major problems with previous surveys that we have utilized is that the lag time between the actual patient encounter and reporting of that encounter and the playing back of that data to us, the gap was so long that you kind of wondered if it was the same practice that you were looking at today.”
Ease of interpretation, layout of report 6 (8) “Well, I think [the reports are] a close second in terms of the domains, the structure of the survey the way it is
reported. It is very nice, they have great graphs. I think it is pretty clear to people.”Report features Comparisons with other groups helpful 16 (22) “[One of the strengths of the report was that] there was a large comparison group. You know, it was much of the
state. So that’s important, in that it’s really comparing to our competition.”Sample of clinicians Availability of physician-level information 6 (8) “I think one [reason Press-Ganey reports are most important] is it gives detail down to the individual provider and
it’s nice to be able to get a feedback on everyone.”
Note. Quotes have been edited for clarity and to protect respondent confidentiality. Report characteristics are based on the report that the respondent deemed most important for his or her group.
turnaround times (i.e., shorter lengths of time between survey administration and receipt of the report) as enhancing the usefulness of reports; six of these eight groups purchased commercially available reports with at least some patient experience data
at SMU on August 15, 2014mcr.sagepub.comDownloaded from
Geissler et al. 631
available on a continuous, rolling basis. Fewer respondents (8%) reported that indi-vidual physician-level results enhanced report usefulness.
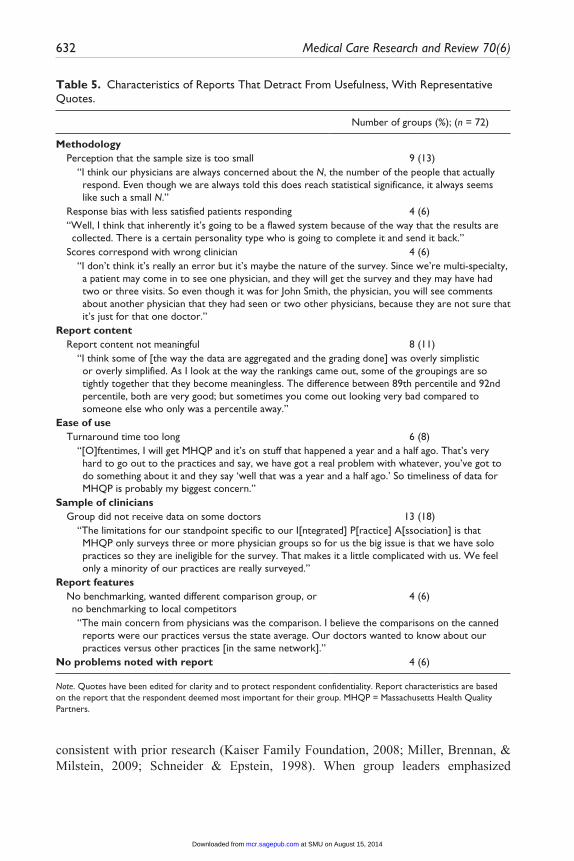
Report Characteristics That Detract From Usefulness
Group leaders also mentioned characteristics that detracted from the usefulness of reports for engagement in performance improvement initiatives (Table 5). Respondents reported that their groups perceived the survey sample size as being too small (13%), even though the report makers considered the sample large enough to be statistically valid and reliable for the purpose of public reporting (i.e., achieving reliability of 0.7 or greater for group-to-group comparisons). Eight percent of respondents reported that turnaround time was too long; three quarters of these respondents relied on the MHQP report, which is pub-lished every 2 years. Eighteen percent of respondents reported that they failed to receive data on some physicians practicing in their group. Among respondents noting this issue, most (85%) relied on MHQP patient experience reports, which conducted patient experi-ence surveys only for practice sites, including three or more physicians.
Discussion
Leaders of ambulatory physician groups are well positioned to implement perfor-mance improvement initiatives based on patient experience reports. The factors they perceive as influencing their ability to use these reports for performance improvement may therefore influence whether such reports ultimately lead to better patient experi-ence. Our interviews with a statewide sample of physician group leaders in Massachusetts revealed group characteristics that motivate or function as barriers to performance improvement efforts. The interviews also highlighted key features of reports that enhance or detract from their usefulness for performance improvement, suggesting opportunities for further enhancement of the content and format of patient experience reports.
Our study contributes three new insights relative to prior research. First, we iden-tify insufficient incentives to attract and retain patients as a previously underappreci-ated barrier to groups’ engagement in efforts to improve patient experience. In Massachusetts, enactment of health insurance reform in 2006 led to primary care shortages in some areas, producing lengthy waiting lists (Bodenheimer & Pham, 2010); physicians with full patient panels may have little motivation to improve patient experience. One study in the Netherlands noted that general practitioners were not inclined to respond to patient criticism because of a shortage of physicians (Vingerhoets et al., 2001), but few published studies have focused on this issue in the United States. As the Affordable Care Act expands insurance coverage, other states may face increased demand for ambulatory care, filling physician panels and undermining moti-vation to improve patient experience.
Second, group leaders did not identify public reporting as a significant motivator of performance improvement. In fact, group leaders expressed beliefs that patients gener-ally are unaware of or unresponsive to publicly reported patient experience data,
at SMU on August 15, 2014mcr.sagepub.comDownloaded from
632 Medical Care Research and Review 70(6)
consistent with prior research (Kaiser Family Foundation, 2008; Miller, Brennan, & Milstein, 2009; Schneider & Epstein, 1998). When group leaders emphasized
Table 5. Characteristics of Reports That Detract From Usefulness, With Representative Quotes.
Number of groups (%); (n = 72)
Methodology Perception that the sample size is too small 9 (13) “I think our physicians are always concerned about the N, the number of the people that actually
respond. Even though we are always told this does reach statistical significance, it always seems like such a small N.”
Response bias with less satisfied patients responding 4 (6) “Well, I think that inherently it’s going to be a flawed system because of the way that the results are
collected. There is a certain personality type who is going to complete it and send it back.” Scores correspond with wrong clinician 4 (6) “I don’t think it’s really an error but it’s maybe the nature of the survey. Since we’re multi-specialty,
a patient may come in to see one physician, and they will get the survey and they may have had two or three visits. So even though it was for John Smith, the physician, you will see comments about another physician that they had seen or two other physicians, because they are not sure that it’s just for that one doctor.”
Report content Report content not meaningful 8 (11) “I think some of [the way the data are aggregated and the grading done] was overly simplistic
or overly simplified. As I look at the way the rankings came out, some of the groupings are so tightly together that they become meaningless. The difference between 89th percentile and 92nd percentile, both are very good; but sometimes you come out looking very bad compared to someone else who only was a percentile away.”
Ease of use Turnaround time too long 6 (8) “[O]ftentimes, I will get MHQP and it’s on stuff that happened a year and a half ago. That’s very
hard to go out to the practices and say, we have got a real problem with whatever, you’ve got to do something about it and they say ‘well that was a year and a half ago.’ So timeliness of data for MHQP is probably my biggest concern.”
Sample of clinicians Group did not receive data on some doctors 13 (18) “The limitations for our standpoint specific to our I[ntegrated] P[ractice] A[ssociation] is that
MHQP only surveys three or more physician groups so for us the big issue is that we have solo practices so they are ineligible for the survey. That makes it a little complicated with us. We feel only a minority of our practices are really surveyed.”
Report features No benchmarking, wanted different comparison group, or
no benchmarking to local competitors4 (6)
“The main concern from physicians was the comparison. I believe the comparisons on the canned reports were our practices versus the state average. Our doctors wanted to know about our practices versus other practices [in the same network].”
No problems noted with report 4 (6)
Note. Quotes have been edited for clarity and to protect respondent confidentiality. Report characteristics are based on the report that the respondent deemed most important for their group. MHQP = Massachusetts Health Quality Partners.
at SMU on August 15, 2014mcr.sagepub.comDownloaded from
Geissler et al. 633
improving patient experience, they did so regardless of its measurement and reporting, suggesting that fostering loyalty and retention may be a more potent intrinsic motiva-tion than concern about public comparative reports.
Third, performance reports from a statewide public reporting collaborative were not, for the majority of groups, sufficient guides for performance improvement. Most groups invested in additional reports from one or more commercial sources, and for nearly all such groups, these commercial reports were the preferred source of patient experience data. These findings suggest that reports designed primarily for public reporting may lack elements important to guiding performance improvement efforts: timeliness, perceived methodological soundness, and actionability of results (e.g., suggested “action items” a group could take to improve its performance on patient experience measures). However, to our knowledge, the evidence base concerning spe-cific methods to improve patient experience is scant. Therefore, when groups follow the “action items” recommended in commercial patient experience reports, the degree of improvement that should be expected is unknown.
Some of the group and report characteristics we identified as influential have been reported as such in previous studies. For example, we found that establishing excellent patient experience as a clearly articulated organizational goal was a key motivator of improvement efforts, and a prior study of physician groups participat-ing in a quality improvement collaborative found that developing a culture of patient-centeredness was important for use of patient experience data (Davies & Cleary, 2005). We also found that report timeliness and actionable findings were particularly important to respondents in our sample, echoing findings from previous studies of quality improvement collaboratives (Davies & Cleary, 2005; Shaller & Kanouse, 2012). Our replication of these findings in a statewide sample suggests that they generalize beyond the subset of groups that volunteer for quality improve-ment collaboratives.
The results of our study suggest actions that a variety of stakeholders can take to enhance physician groups’ use of patient experience reports. For policy makers, under-standing the role of full patient panels as a barrier to use of patient experience reports may be vital to identifying alternative approaches to engaging ambulatory physicians, particularly if any physician shortages occur with implementation of the Affordable Care Act. For example, initiatives that appeal to professionalism or performance-based payment incentives may be more useful than competitive motivators based on rank-ings or ratings.
For report designers, the results suggest that performance reporting collaboratives like MHQP may wish to consider increasing the timeliness and frequency of their reports and incorporating evidence-based “action steps to improve performance” for group lead-ers to follow, once evidence to support such “action steps” becomes available. Similarly, if reports from local performance reporting collaboratives do not provide sufficient information to guide improvement efforts, physician groups should provide feedback to the report makers, highlighting the features they would find helpful.
Our study has limitations. The interview sample was restricted to groups with three or more primary care physicians, so the findings may not generalize to smaller,
at SMU on August 15, 2014mcr.sagepub.comDownloaded from
634 Medical Care Research and Review 70(6)
independent practices. At the time of data collection, Massachusetts was, to our knowledge, the only state engaged in statewide patient experience reporting, and study findings may not generalize to other states. However, our findings may provide a preview of how physician groups in other states will respond to expanding measure-ment and reporting of performance on patient experience surveys (e.g., as envisioned in planned accountable care organization pilots; Millenson & Macri, 2012).
Our results suggest important pathways to improving patient experience reports and promoting their use for performance improvement initiatives in primary care. With new initiatives to collect, publicly report, and financially incentivize patient experience survey data, improving the content and format of these private reports pro-vided to groups will be helpful. Such steps may be crucial to encouraging ambulatory care physician group leaders to pursue performance improvement efforts to improve patients’ experience of care.
Acknowledgments
The authors would like to thank Elizabeth Steiner and Lauren Hunter for assistance in coding the interview transcripts.
Declaration of Conflicting Interests
The author(s) declared no potential conflicts of interest with respect to the research, authorship, and/or publication of this article.
Funding
The author(s) disclosed receipt of the following financial support for the research, authorship, and/or publication of this article: Funding for this study was received from The Commonwealth Fund under the grant titled “Assessing How Health Plans and Providers Use Publicly Reported Information on Patient Experiences.”
References
Bodenheimer, T., & Pham, H. H. (2010). Primary care: Current problems and proposed solu-tions. Health Affairs, 29, 799-805.
Davies, E. A., Meterko, M. M., Charns, M. P., Nealon Seibert, M. E., & Cleary, P. D. (2011). Factors affecting the use of patient survey data for quality improvement in the Veterans Health Administration. BMC Health Services Research, 11(334).
Davies, E., & Cleary, P. D. (2005). Hearing the patient’s voice? Factors affecting the use of patient survey data in quality improvement. Quality & Safety in Health Care, 14, 428-432.
Davies, E., Shaller, D., Edgman-Levitan, S., Safran, D. G., Oftedahl, G., Sakowski, J., & Cleary, P. D. (2008). Evaluating the use of a modified CAHPS survey to support improve-ments in patient-centred care: Lessons from a quality improvement collaborative. Health Expectations, 11, 160-176.
Elliott, M. N., Lehrman, W. G., Goldstein, E. H., Giordano, L. A., Beckett, M. K., Cohea, C. W., & Cleary, P. D. (2010). Hospital survey shows improvements in patient experience. Health Affairs, 29, 2061-2067.
at SMU on August 15, 2014mcr.sagepub.comDownloaded from
Geissler et al. 635
Friedberg, M. W., SteelFisher, G. K., Karp, M., & Schneider, E. C. (2011). Physician groups’ use of data from patient experience surveys. Journal of General Internal Medicine, 26, 498-504.
Glickman, S. W., Baggett, K. A., Krubert, C. G., Peterson, E. D., & Schulman, K. A. (2007). Promoting quality: The health-care organization from a management perspective. International Journal for Quality in Health Care, 19, 341-348.
Hibbard, J. H., Greene, J., & Daniel, D. (2010). What is quality anyway? Performance reports that clearly communicate to consumers the meaning of quality of care. Medical Care Research and Review, 67, 275-293.
Institute of Medicine. Committee on Quality of Health Care in America. (2001). Crossing the quality chasm: A new health system for the 21st century. Washington, DC: National Academies Press.
Kaiser Family Foundation. (2008). 2008 Update on consumers’ views of patient safety and quality information. Menlo Park, CA: Author.
Massachusetts Health Quality Partners. (2011). Quality insights: 2011 patient experiences in pri-mary care. Retrieved from http://www.mhqp.org/quality/pes/pesMASumm.asp?nav=031600
Millenson, M. L., & Macri, J. (2012, March). Will the affordable care act move patient- centeredness to center stage? Timely analysis of immediate health policy issues. Washington, DC: Urban Institute and Robert Wood Johnson Foundation.
Miller, T. P., Brennan, T. A., & Milstein, A. (2009). How can we make more progress in measuring physicians’ performance to improve the value of care? Health Affairs, 28, 1429-1437.
Pope, C., Ziebland, S., & Mays, N. (2000). Qualitative research in health care. Analysing quali-tative data. British Medical Journal, 320, 114-116.
Ranganathan, M., Hibbard, J., Rodday, A. M., de Brantes, F., Conroy, K., Rogers, W. H., & D. G. Safran, D. G. (2009). Motivating public use of physician-level performance data: An experiment on the effects of message and mode. Medical Care Research and Review, 66, 68-81.
Rodriguez, H. P., Von Glahn, T., Elliott, M. N., Rogers, W. H., & Safran, D. G. (2009). The effect of performance-based financial incentives on improving patient care experiences: A statewide evaluation. Journal of General Internal Medicine, 24, 1281-1288.
Safran, D. G., Karp, M., Coltin, K., Chang, H., Li, A., Ogren, J., & Rogers, W. H. (2006). Measuring patients’ experiences with individual primary care physicians. Results of a statewide demonstration project. Journal of General Internal Medicine, 21, 13-21.
Schneider, E. C., & Epstein, A. M. (1998). Use of public performance reports. Journal of the American Medical Association, 279, 1638-1642.
Shaller, D., & Kanouse, D. (2012). Private “performance feedback” reporting for physicians: Guidance for community quality collaboratives. Rockville, MD: Agency for Healthcare Research and Quality.
Teleki, S., Shaw, S., Damberg, C. L., & McGlynn, E. A. (2006). Providing performance feed-back to individual physicians: Current practice and emerging lessons. Santa Monica, CA: RAND.
Vingerhoets, E., Wensing, M., & Grol, R. (2001). Feedback of patients’ evaluations of general practice care: A randomised trial. Quality in Health Care, 10, 224-228.
at SMU on August 15, 2014mcr.sagepub.comDownloaded from