Embed Size (px)
Citation preview
MOTION IN
ONE
DIMENSIO
N
S E P T EMB
ER 8
- 9 2
0 1 4
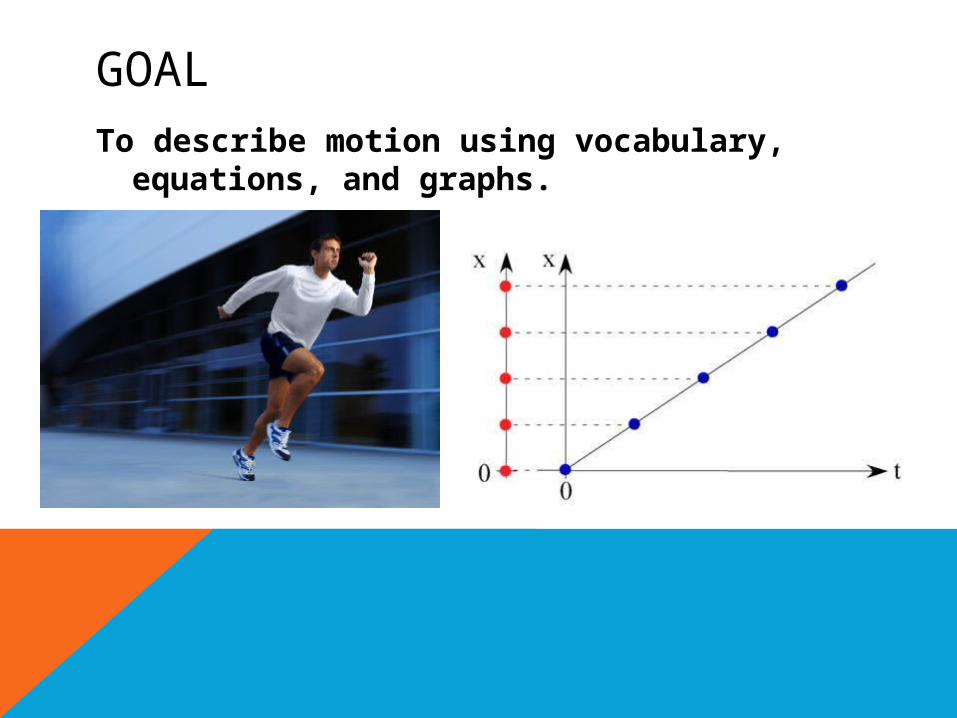
GOALTo describe motion using vocabulary,
equations, and graphs.

Example: Even while sitting in the classroom appearing motionless, you are moving very fast.• Rotating 0.4 km/s (0.25 mi/s) around the center of the Earth
• Revolving 30 km/s relative to the Sun
• Revolving 250 km/s with the solar system around the center of the milky way galaxy
• Moving 600 km/s with the Milky Way away from the center of the universe, towards the constellation Hydra
The Sea Serpent
HOW WOULD YOU DESCRIBE AN A OBJECT’S MOTION? The answer depends on your perspective -- your frame
of reference

Example:
You drive your car home from school at speed of 30 mph.
… your frame of reference is relative to road
…. Your coordinate system has a starting point (origin) at school and a positive direction towards home
When we discuss the motion of something, we describe its motion relative to something else.
A frame of reference is a perspective from which a system is observed together with a
coordinate system used to describe motion of that system.
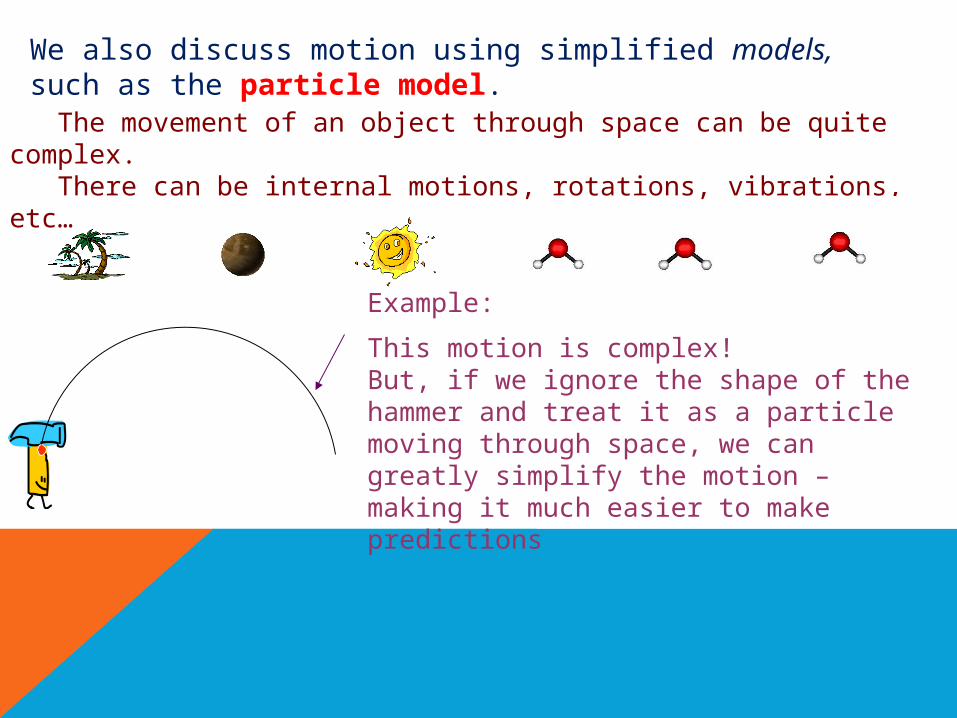
The movement of an object through space can be quite complex. There can be internal motions, rotations, vibrations, etc…
Example:
This motion is complex!But, if we ignore the shape of the hammer and treat it as a particle moving through space, we can greatly simplify the motion – making it much easier to make predictions
We also discuss motion using simplified models, such as the particle model.

DisplacementDisplacement is the change in position of an object
Δ x = xf – xi
(Change in postion = final position – initial position)
path;length is distance traveled
P
displacement Q
Displacement is a vector quantity, so it tells us how far an object is from its starting position and in what direction
+
+_
_Note: Traditionally, the coordinate system for displacement is positive for displacement upwards or towards the right, and negative for displacement downwards or towards the left. Sometimes, it might be
convenient to change that system, but if so, YOU MUST DEFINE THE COORDINATE SYSTEM IN THE PROBLEM

DISPLACEMENT EXAMPLE PROBLEMS
1. A butterfly flies 5 m left then 8 m right. What is its final position?
2. A ball drops off a 10 foot shelf onto the floor. What is its final position?
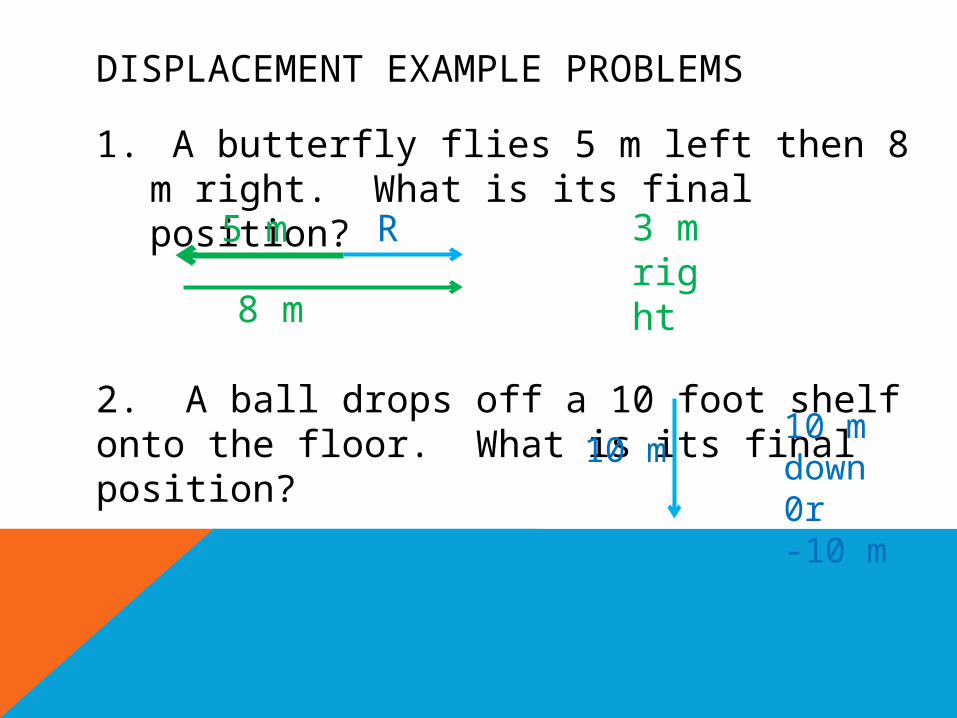
DISPLACEMENT EXAMPLE PROBLEMS
1. A butterfly flies 5 m left then 8 m right. What is its final position?
2. A ball drops off a 10 foot shelf onto the floor. What is its final position?
5 m
8 m
3 m right
R
10 m10 m down0r -10 m
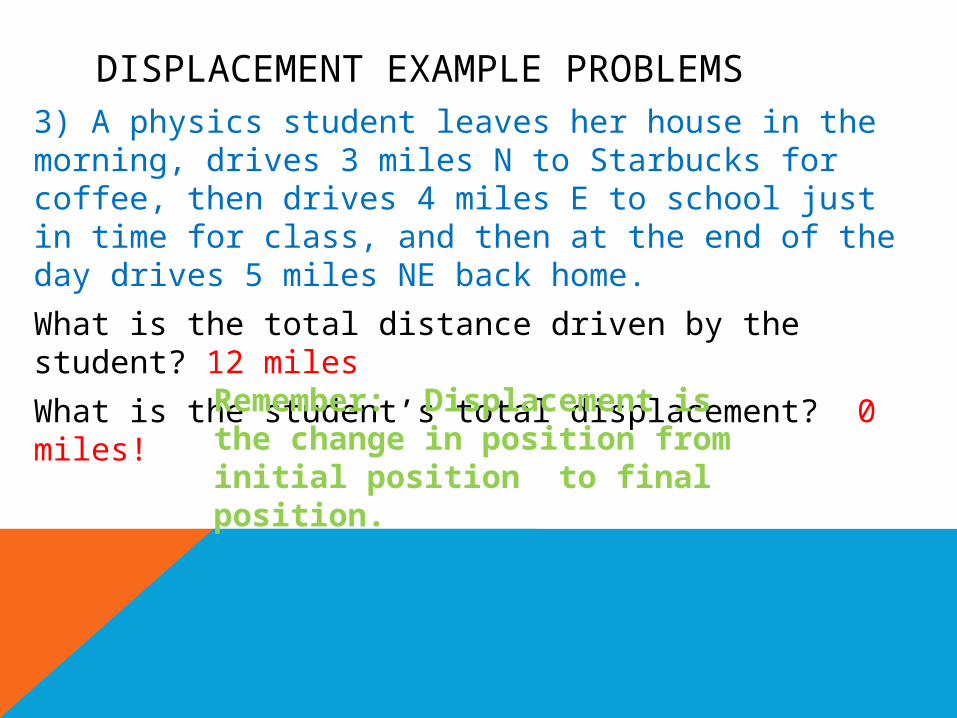
DISPLACEMENT EXAMPLE PROBLEMS3) A physics student leaves her house in the morning, drives 3 miles N to Starbucks for coffee, then drives 4 miles E to school just in time for class, and then at the end of the day drives 5 miles NE back home.
What is the total distance driven by the student? 12 miles
What is the student’s total displacement? 0 miles!Remember: Displacement is the change in position from initial position to final position.

VELOCITY• Change in the position of an object over time.
Without velocity, there is no change in position!
= =
Average velocity = change in position / change in time
• Velocity is a vector quantity. It goes in the same direction as the change of position. +
+_
_

VELOCITY EXAMPLE PROBLEMS
1. If Joe rides south on his bicycle in a straight line for 15 minutes with an average speed of 12.5 km/hr, how far has he ridden?
2. Simpson drives his car with an average velocity of 48.0km/h to the east. a) How long will it take him to drive 144 km?b) How much time will he save by increasing his
average velocity to 56.0 km/h to the east?
VELOCITY EXAMPLE PROBLEMS
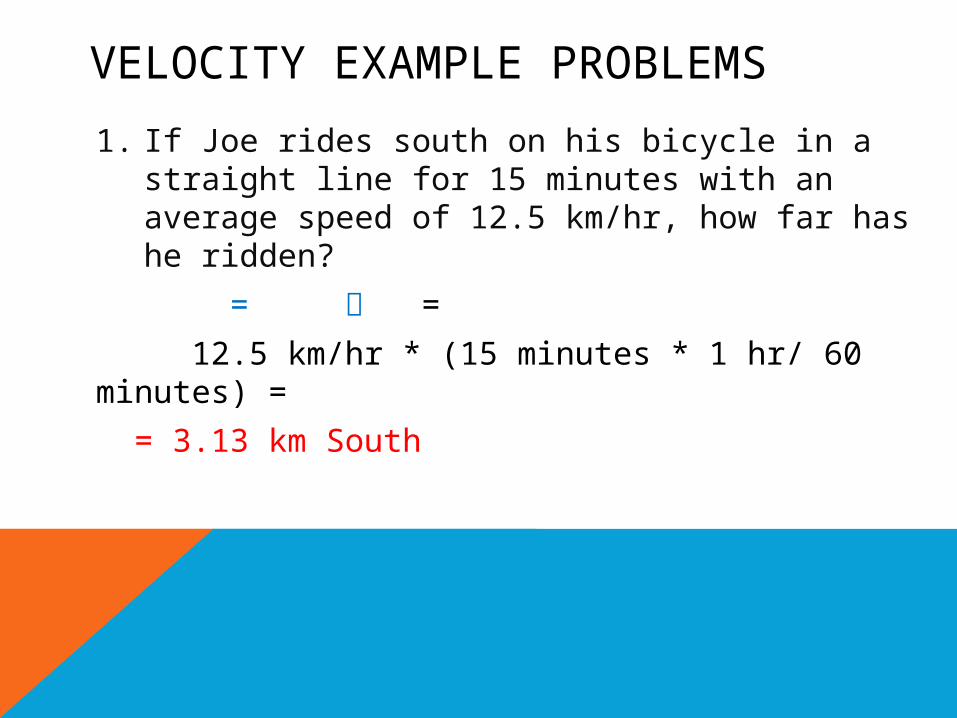
1. If Joe rides south on his bicycle in a straight line for 15 minutes with an average speed of 12.5 km/hr, how far has he ridden?
= =
12.5 km/hr * (15 minutes * 1 hr/ 60 minutes) =
= 3.13 km South

VELOCITY EXAMPLE PROBLEMS
2. Simpson drives his car with an average velocity of 48.0km/h to the east.
a) How long will it take him to drive 144 km?b) How much time will he save by increasing his
average velocity to 56.0 km/h to the east? / = 144 km / (48.0 km/hr) = 3.00 hours144 km / 56.0 km/hr = 2.57 hours.3.00 hours – 2.57 hours = 0.43 hours or 25.8 minutes
=
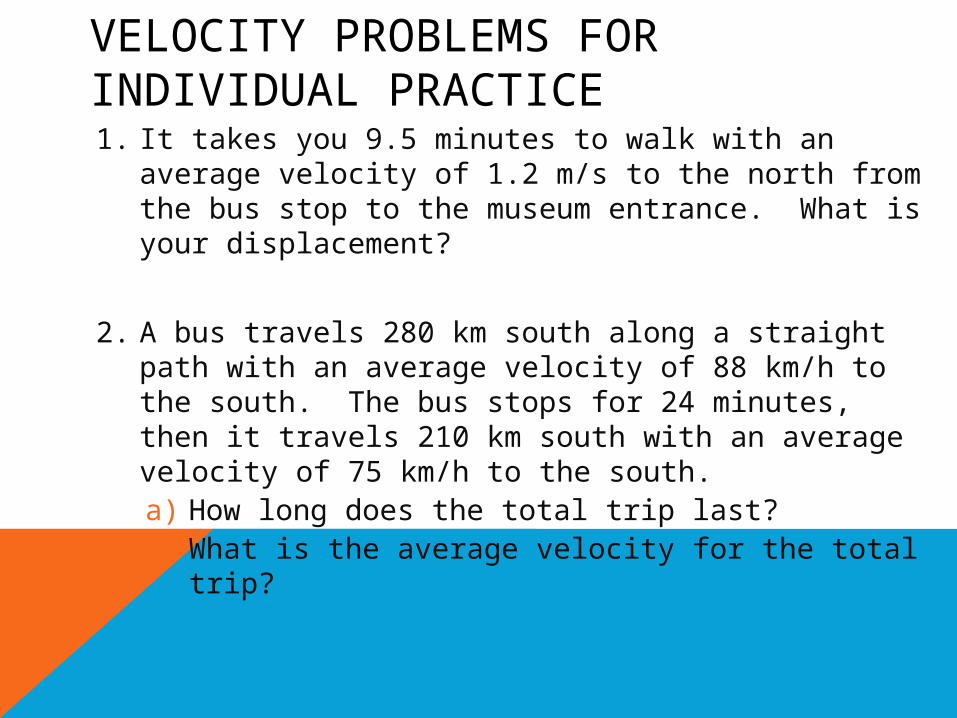
VELOCITY PROBLEMS FOR INDIVIDUAL PRACTICE1. It takes you 9.5 minutes to walk with an average
velocity of 1.2 m/s to the north from the bus stop to the museum entrance. What is your displacement?
2. A bus travels 280 km south along a straight path with an average velocity of 88 km/h to the south. The bus stops for 24 minutes, then it travels 210 km south with an average velocity of 75 km/h to the south.a) How long does the total trip last?b) What is the average velocity for the total trip?

VELOCITY PROBLEMS FOR INDIVIDUAL PRACTICE1. It takes you 9.5 minutes to walk with an average
velocity of 1.2 m/s to the north from the bus stop to the museum entrance. What is your displacement? 680 m North
2. A bus travels 280 km south along a straight path with an average velocity of 88 km/h to the south. The bus stops for 24 minutes, then it travels 210 km south with an average velocity of 75 km/h to the south.a) How long does the total trip last? 6.4 hoursb) What is the average velocity for the total trip? 76 km/hr South

VELOCITY TERMINOLOGYSo far we’ve talked about average velocity, defined as change
in position over change in time. =
Sometimes, of course, our velocity fluctuates from moment tomoment.
Instantaneous velocity is the speed and direction of motion at aparticular instant in time.
Uniform motion describes any motion where the velocity does NOT
fluctuate, but instead remains constant. The only equation weneed to describe uniform motion is the one above.
Real – world example: Your car’s speedometer tells you instantaneous speed. If your car also has a compass, then you know your instantaneous velocity!

POSITION VS TIME GRAPHS
Motion is often represented graphically. One such graph is a position – time graph, where position is on the y-axis and time is on the x axis.
Position (m)
Time (hr)
+_
Describe the bike’s motion.
The bike is moving to the right at constant velocity.
Coordinate system
HOW CAN I TELL?• A straight line on a position vs time graph =
constant velocity• A positive slope (as time increase, position
increases) means that the bike is moving an a positive direction (right).

POSITION VS TIME GRAPHS
Motion is often represented graphically. One such graph is a position – time graph, where position is on the y-axis and time is on the x axis.
Position (m)
Time (hr)
+_
Describe the bike’s motion.
The bike is moving to the left at constant velocity.
HOW CAN I TELL?• A straight line on a position vs time graph =
constant velocity• A negative slope (as time increases, position
decreases) means that the bike is moving an a negative direction (left).
What does a negative
POSITION VS TIME GRAPHS
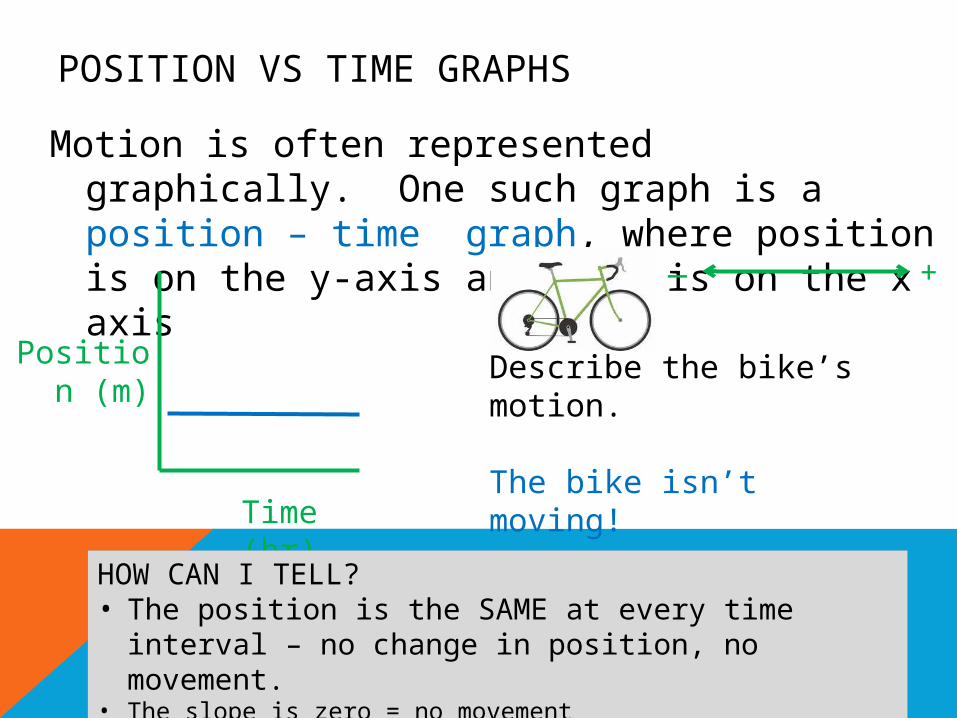
Motion is often represented graphically. One such graph is a position – time graph, where position is on the y-axis and time is on the x axis
Position (m)
Time (hr)
+_
Describe the bike’s motion.
The bike isn’t moving!
HOW CAN I TELL?• The position is the SAME at every time interval – no
change in position, no movement.• The slope is zero = no movement
POSITION VS TIME GRAPHS (WE DO)
1. A bus drives 40 km/hr to the east for 20 minutes, then stops for 5 minutes, then drives 50 km/hr to the west for 10 minutes. Draw the motion graph.

POSITION VS TIME GRAPHS (WE DO)
1. A bus drives 40 km/hr to the east for 20 minutes, then stops for 5 minutes, then drives 50 km/hr to the west for 10 minutes. Draw the motion graph.
Posi
tion
to t
he
East Time (minutes)5 1
0 15
20
25
30
35
13.3 km
5 km

POSITION VS TIME GRAPHS (WE DO)
2. Describe the motion of the ladybug shown in the graph below.
Posi
tion
to t
he
Nort
h
Time (seconds)5 1
0 15
20
25
30
35
4 m
3 m
2 m
1 m

POSITION VS TIME GRAPHS (WE DO)
2. Describe the motion of the ladybug shown in the graph below.
Posi
tion
to t
he
Nort
h
Time (seconds)5 1
0 15
20
25
30
35
4 m
3 m
2 m
1 m
• The lady bug is stationary at position 4 m N for 10 seconds,
• then it moves 0.6 m/s South for 5 seconds,
• then it moves 0.1 m/s North for 10 seconds,
• Then it is stationary at position 2 m N for 10 seconds
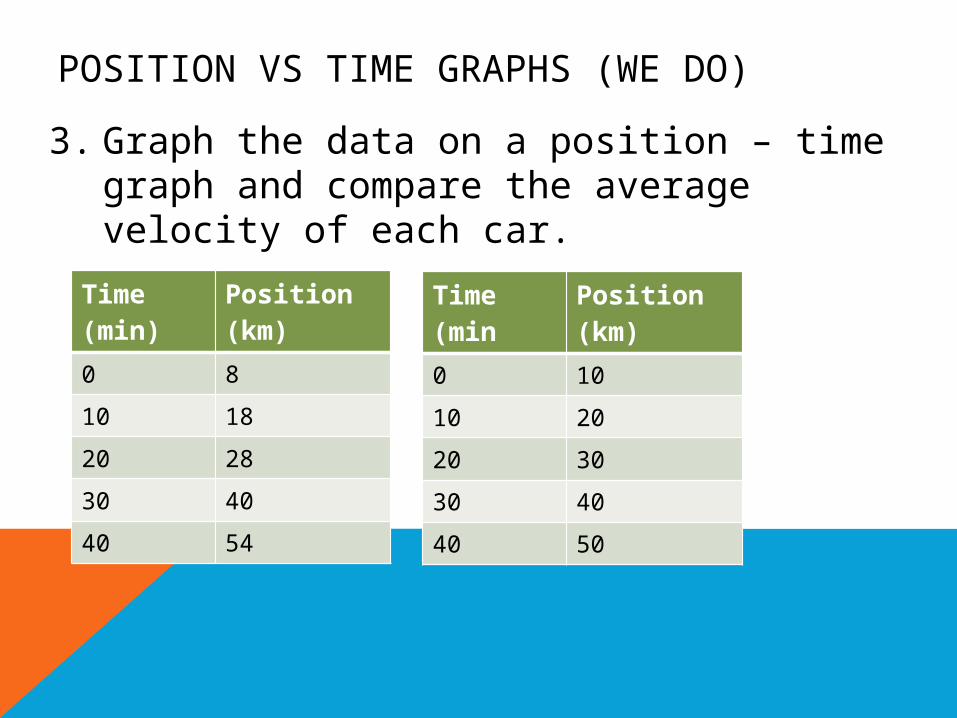
POSITION VS TIME GRAPHS (WE DO)
3. Graph the data on a position – time graph and compare the average velocity of each car.
Car A Car BTime (min)
Position (km)
0 8
10 18
20 28
30 40
40 54
Time (min
Position (km)
0 10
10 20
20 30
30 40
40 50

POSITION VS TIME GRAPHS (WE DO)
3. Graph the data on a position – time graph and compare the average velocity of each car.
0 10 20 30 400
10
20
30
40
50
60
Car ACar B
Time (minutes)
Posi
tion
(km
)
Average velocity of Car A:1.4 km/min
Average velocity of Car B:1.3 km/min
Are either of the cars traveling at constant velocity?
Are either of the cars accelerating?
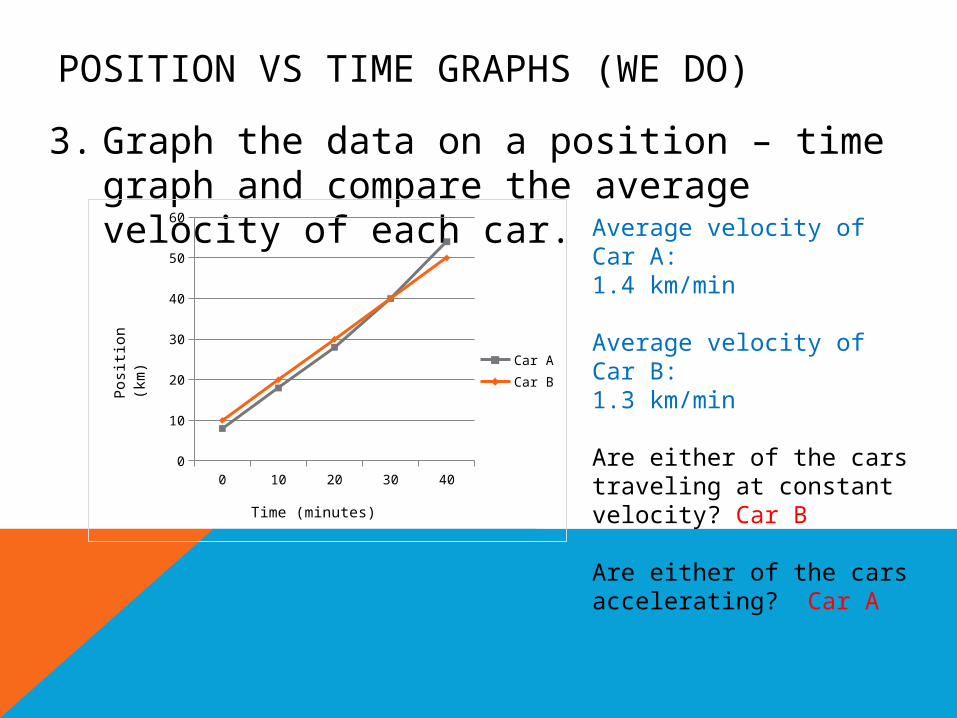
POSITION VS TIME GRAPHS (WE DO)
3. Graph the data on a position – time graph and compare the average velocity of each car.
0 10 20 30 400
10
20
30
40
50
60
Car ACar B
Time (minutes)
Posi
tion
(km
)
Average velocity of Car A:1.4 km/min
Average velocity of Car B:1.3 km/min
Are either of the cars traveling at constant velocity? Car B
Are either of the cars accelerating? Car A

POSITION VS TIME GRAPHS (YOU DO)
1. A car drives 50km/hr North for 30 minutes, then stops for 15 minutes, then drives 40 km/hr South for 1 hour. Draw a position – time graph.
2. Describe the motion of the bicyclist in the position-time graph below.
Time (minutes)
Posi
tion
(km
) East
10 20 30 40 50
5
101520

POSITION VS TIME GRAPHS (YOU DO)
3. Plot the motion of the bus on a graph and calculate the bus’s average velocity.
Time (minutes) Position (km South)
0 30
5 30
10 10
15 -10
20 -10
35 5