Embed Size (px)
Citation preview
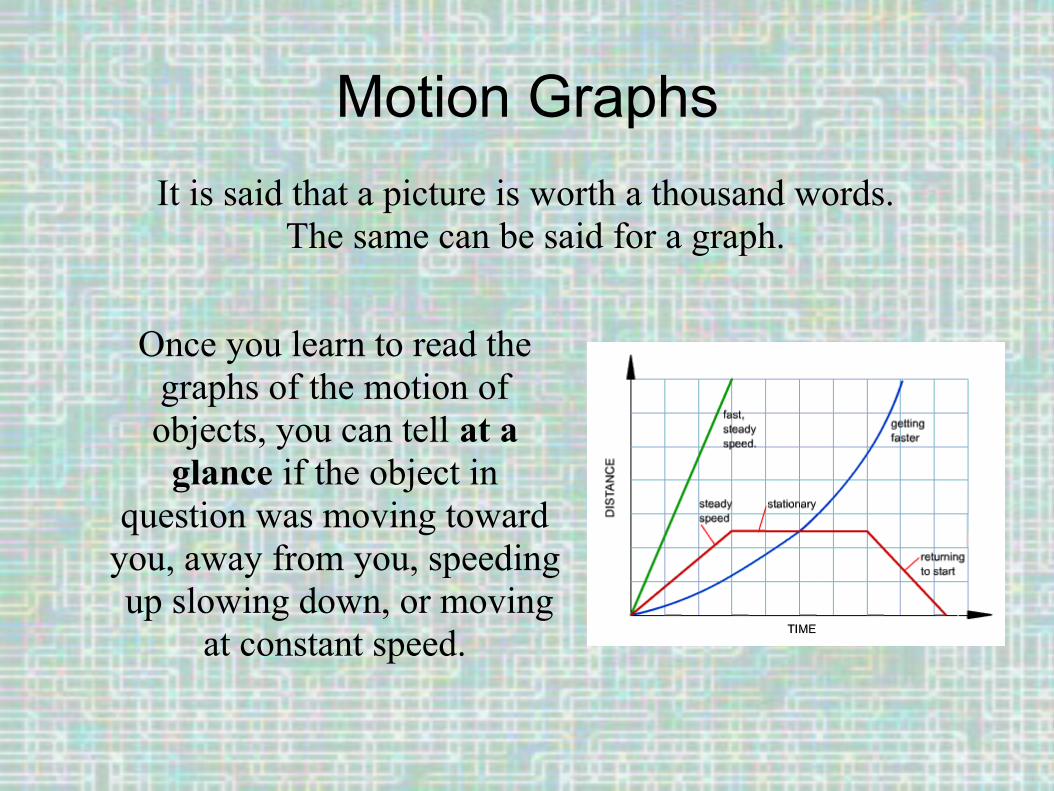
Motion GraphsIt is said that a picture is worth a thousand words.
The same can be said for a graph.
Once you learn to read the graphs of the motion of objects, you can tell at a
glance if the object in question was moving toward
you, away from you, speeding up slowing down, or moving
at constant speed.

Case Study #1Imagine you are standing by the side of the road.
An automobile approaches you from behind, traveling at a constant speed.
Then the car passes you, disappearing off into the
distance.
To graph the motion of this car, you will
need some data.

The Data TableUsing a stopwatch and roadside markers, you keep track of how far the car is from you (it's displacement) at each
moment in time.
time (s) displacement (m)0 -301 -202 -103 04 105 206 30
Negative displacements show
that the car was behind you.
Positive displacements show that the car was in
front of you.
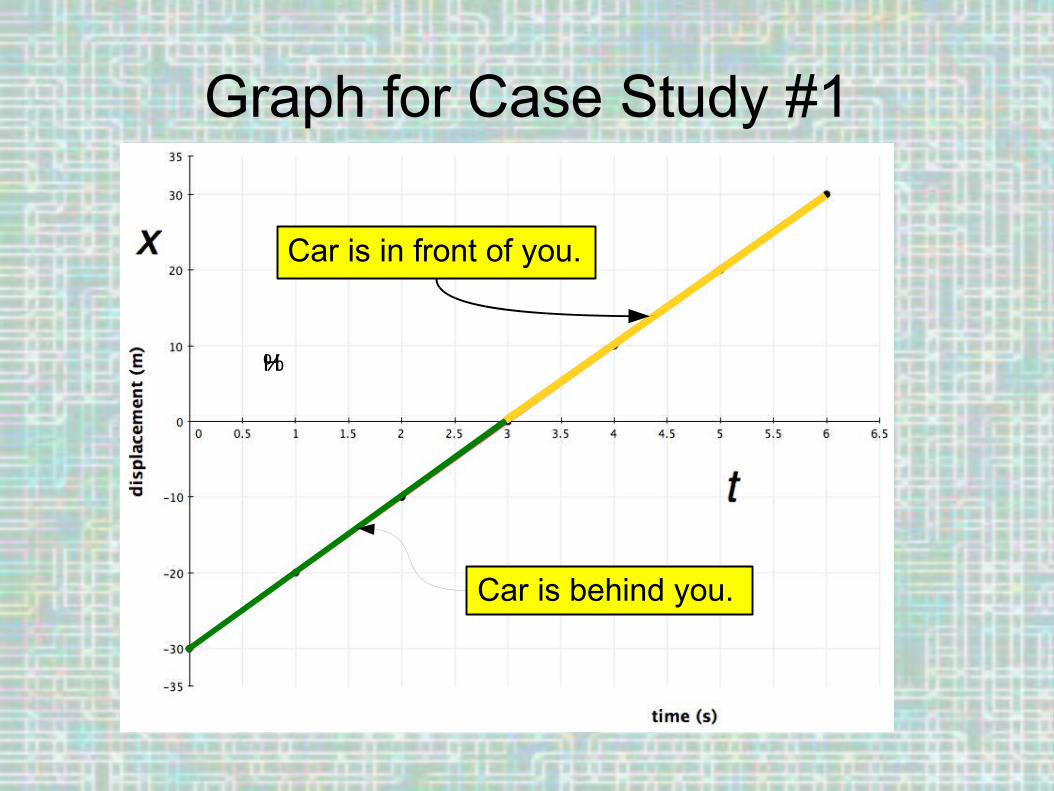
Graph for Case Study #1
Car is in front of you.
%��H�
Car is behind you.

Slope of GraphThe slope of a displacement vs. time graph tells us the
object's velocity.
In this case, the line is straight,
meaning that the slope (and hence,
the velocity) remains constant
for this automobile.
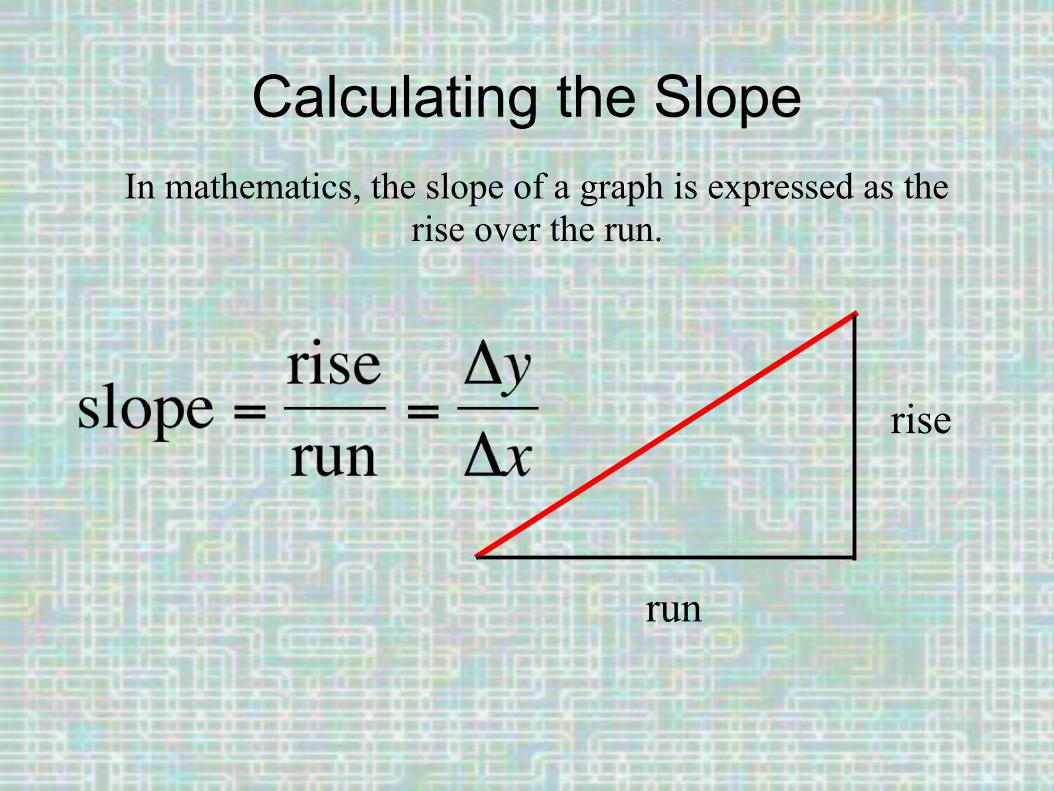
Calculating the SlopeIn mathematics, the slope of a graph is expressed as the
rise over the run.
run
rise

Slope as Velocity
In this particular example, we have put time (∆t) on the horizontal axis and displacement (∆x) on the vertical axis.
The equation now becomes:
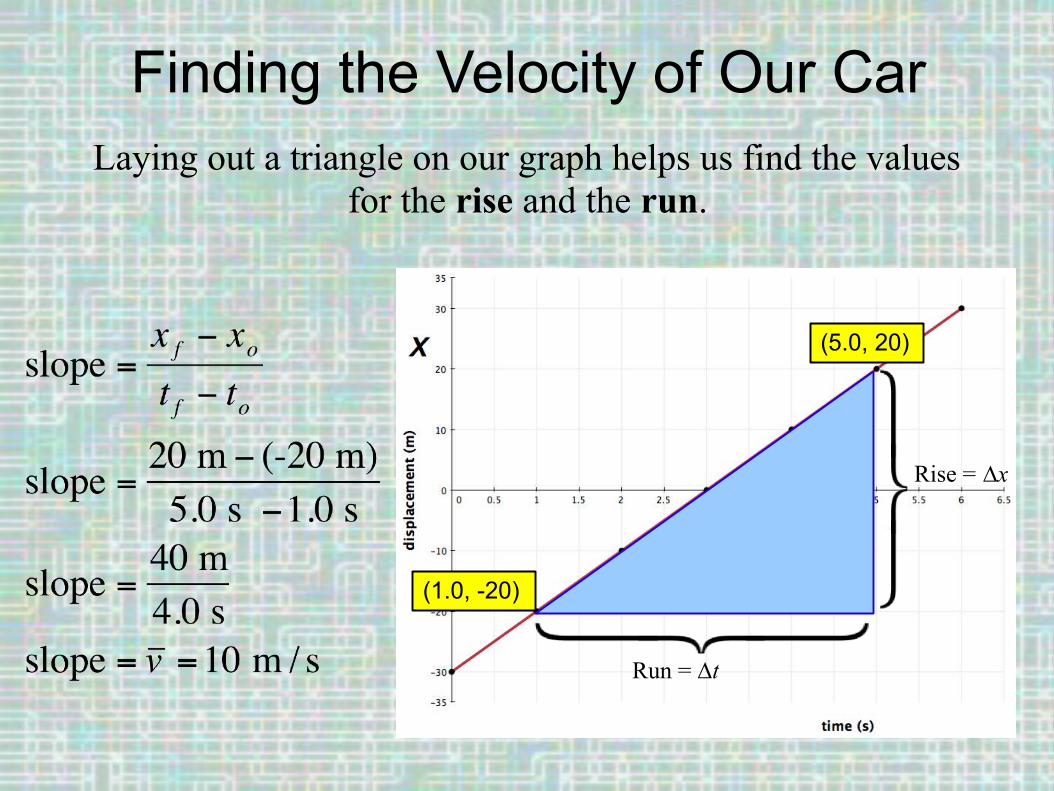
Finding the Velocity of Our CarLaying out a triangle on our graph helps us find the values
for the rise and the run.
(5.0, 20)
(1.0, -20)
Rise = ∆x
Run = ∆t
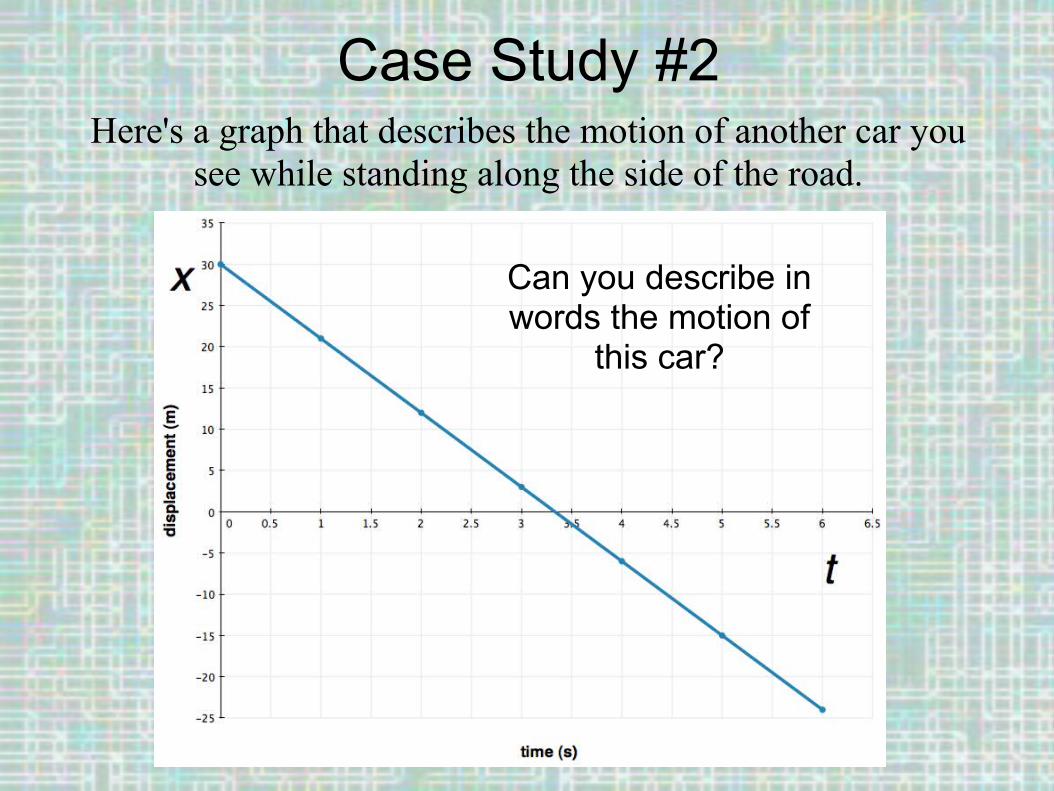
Case Study #2Here's a graph that describes the motion of another car you
see while standing along the side of the road.
Can you describe in words the motion of
this car?
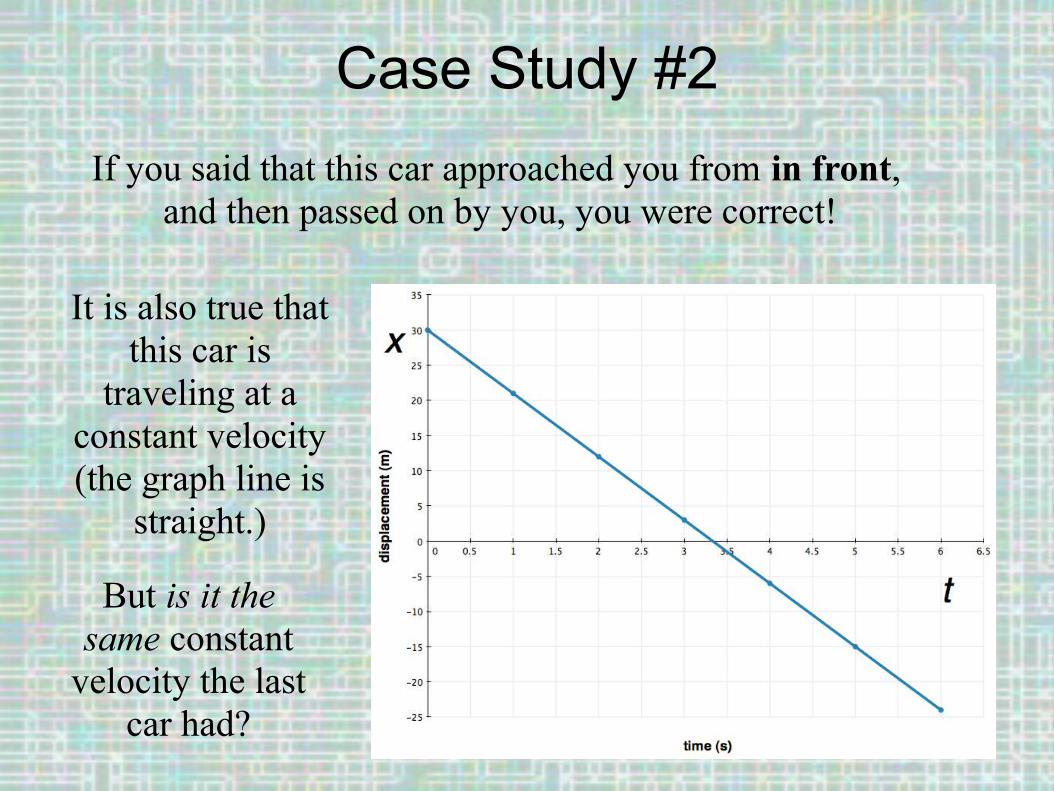
Case Study #2If you said that this car approached you from in front,
and then passed on by you, you were correct!
It is also true that this car is
traveling at a constant velocity (the graph line is
straight.)
But is it the same constant
velocity the last car had?

Velocity from SlopeIt is the same velocity if the slope of the graph line is the same.
(5.0, -15)
(0, 30)To find out, we must calculate the
slope.In the case of this graph,
the “rise” is actually a “drop”. The value of the displacement drops from an original value of 30 m
down to –15 meters.
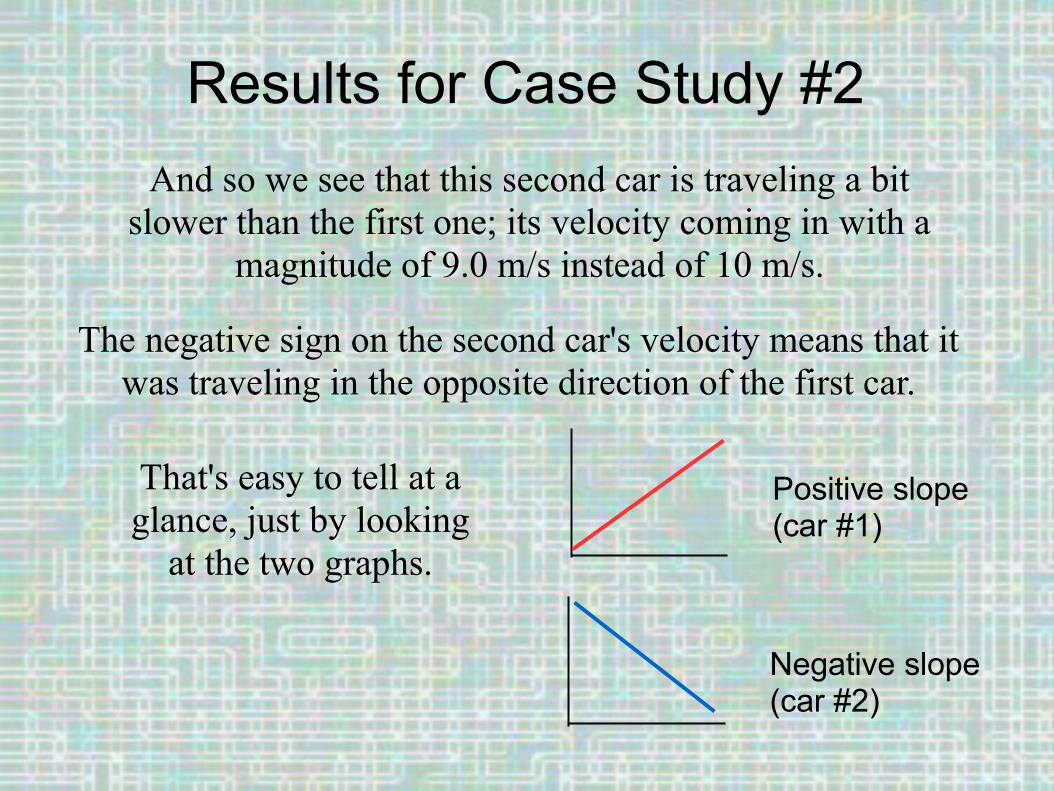
Results for Case Study #2And so we see that this second car is traveling a bit
slower than the first one; its velocity coming in with a magnitude of 9.0 m/s instead of 10 m/s.
The negative sign on the second car's velocity means that it was traveling in the opposite direction of the first car.
Positive slope(car #1)
Negative slope(car #2)
That's easy to tell at a glance, just by looking
at the two graphs.
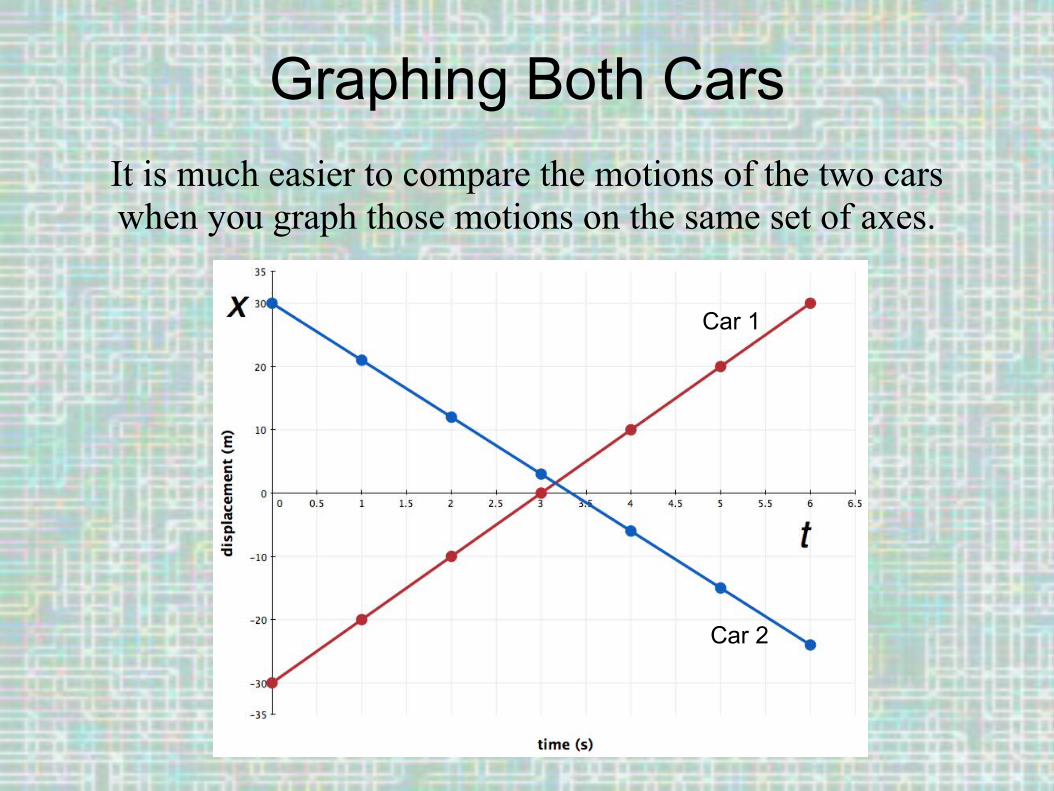
Graphing Both CarsIt is much easier to compare the motions of the two cars when you graph those motions on the same set of axes.
Car 1
Car 2
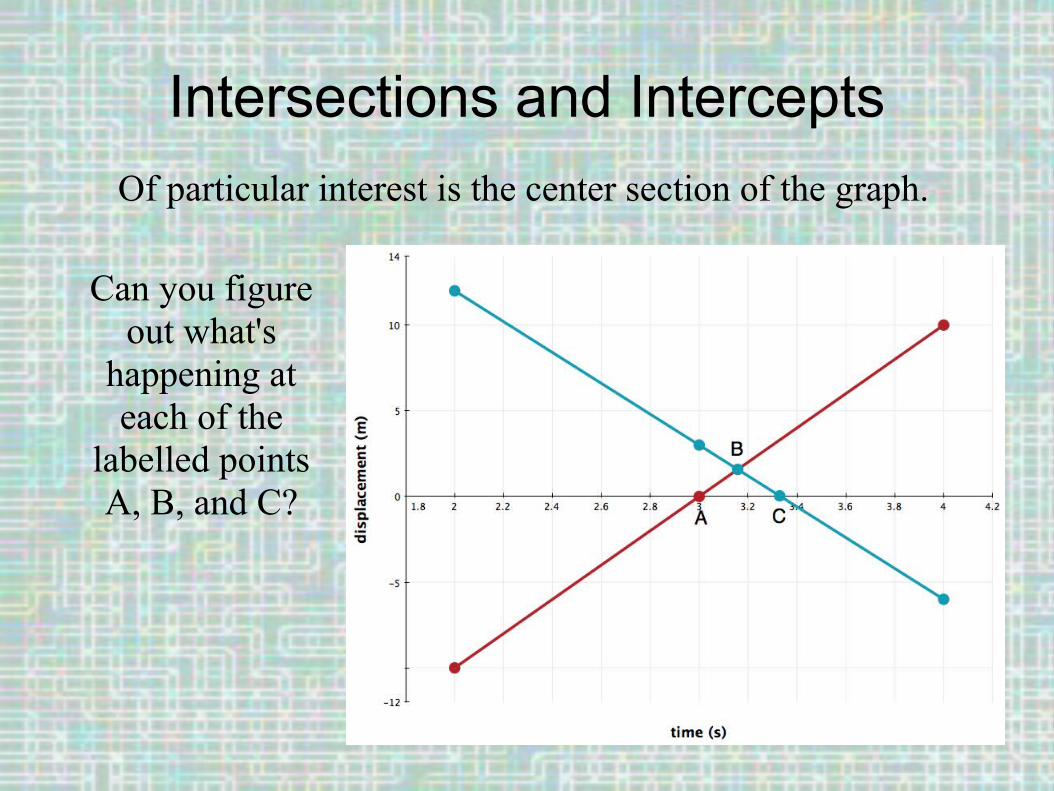
Intersections and InterceptsOf particular interest is the center section of the graph.
Can you figure out what's
happening at each of the
labelled points A, B, and C?
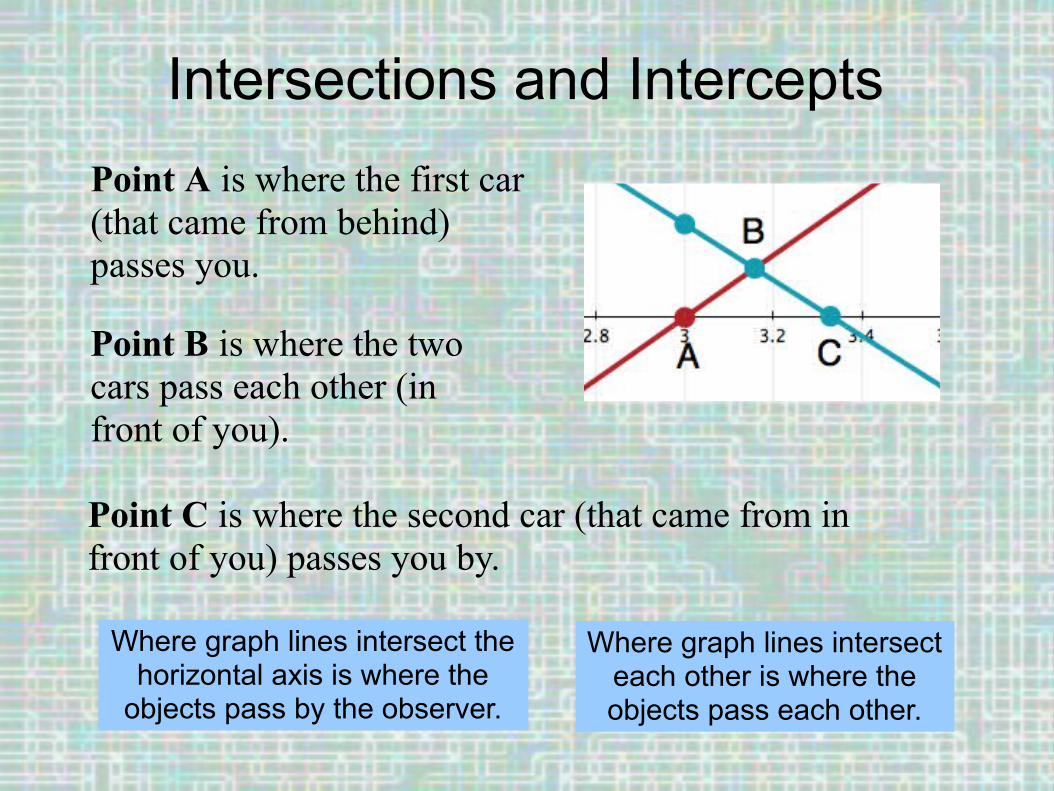
Intersections and InterceptsPoint A is where the first car (that came from behind) passes you.
Point B is where the two cars pass each other (in front of you).
Point C is where the second car (that came from in front of you) passes you by.
Where graph lines intersect the horizontal axis is where the
objects pass by the observer.
Where graph lines intersect each other is where the objects pass each other.

Moving in the Same DirectionWhen two cars are moving in the same direction, it is much easier to compare their speeds, both in real life,
and on a graph.
The slopes of their graph lines are obviously
different. The slope for car 1 is steeper, therefore it must be going faster.
For practice, try calculating the slope of each car's graph line.
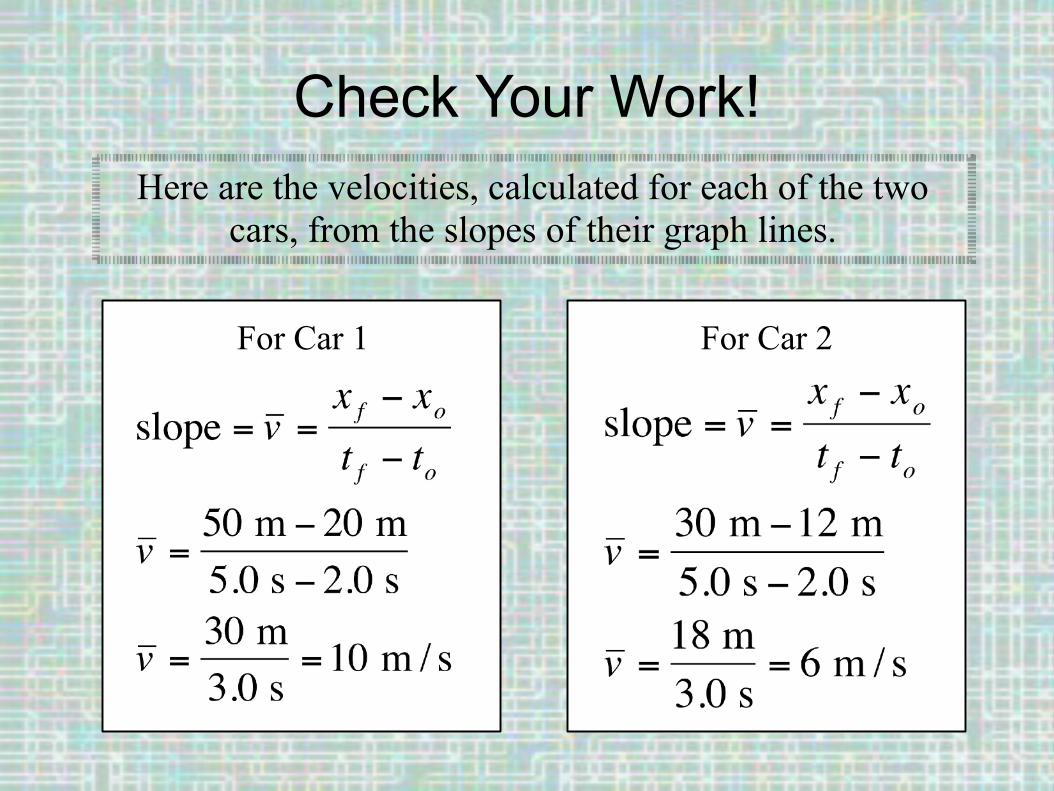
Check Your Work!Here are the velocities, calculated for each of the two
cars, from the slopes of their graph lines.
For Car 1 For Car 2
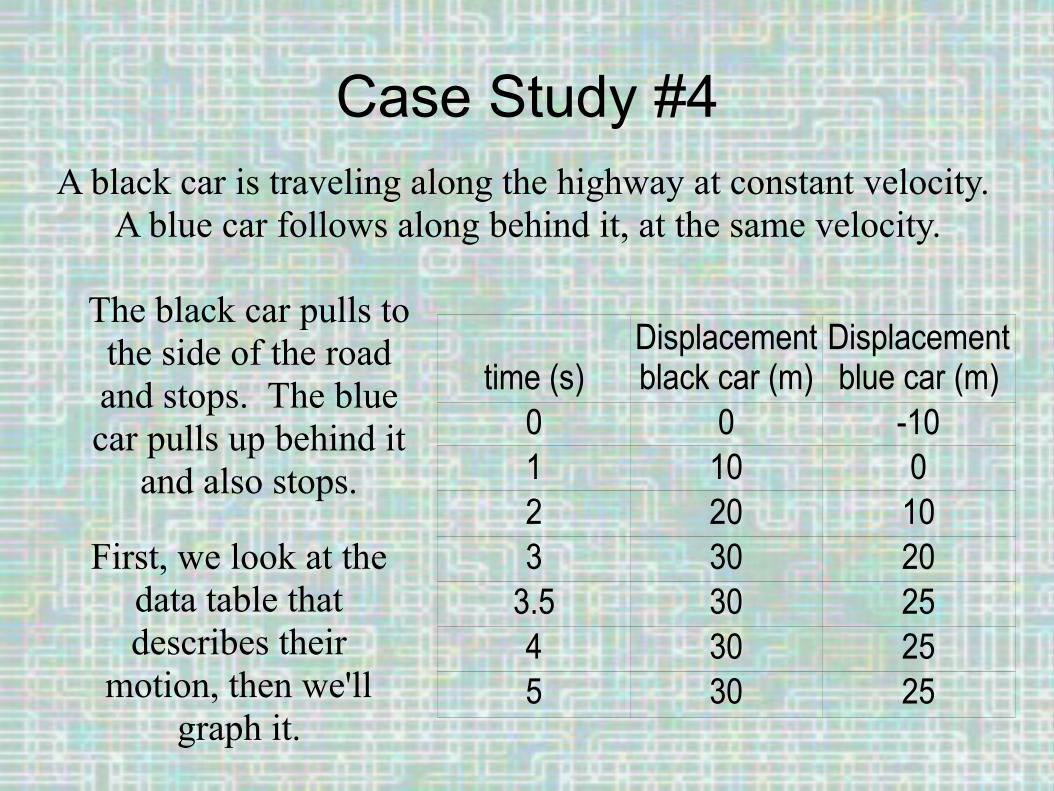
Case Study #4A black car is traveling along the highway at constant velocity.
A blue car follows along behind it, at the same velocity.
The black car pulls to the side of the road and stops. The blue car pulls up behind it
and also stops.
First, we look at the data table that describes their
motion, then we'll graph it.
time (s)0 0 -101 10 02 20 103 30 20
3.5 30 254 30 255 30 25
Displacement black car (m)
Displacement blue car (m)
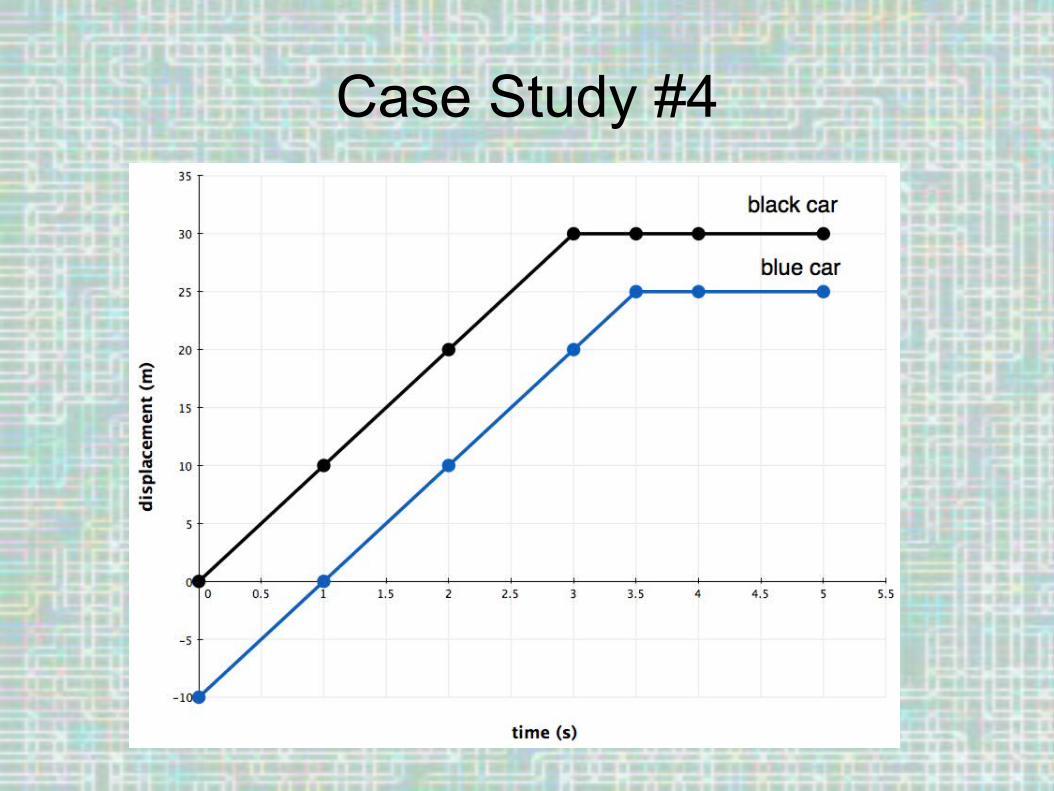
Case Study #4
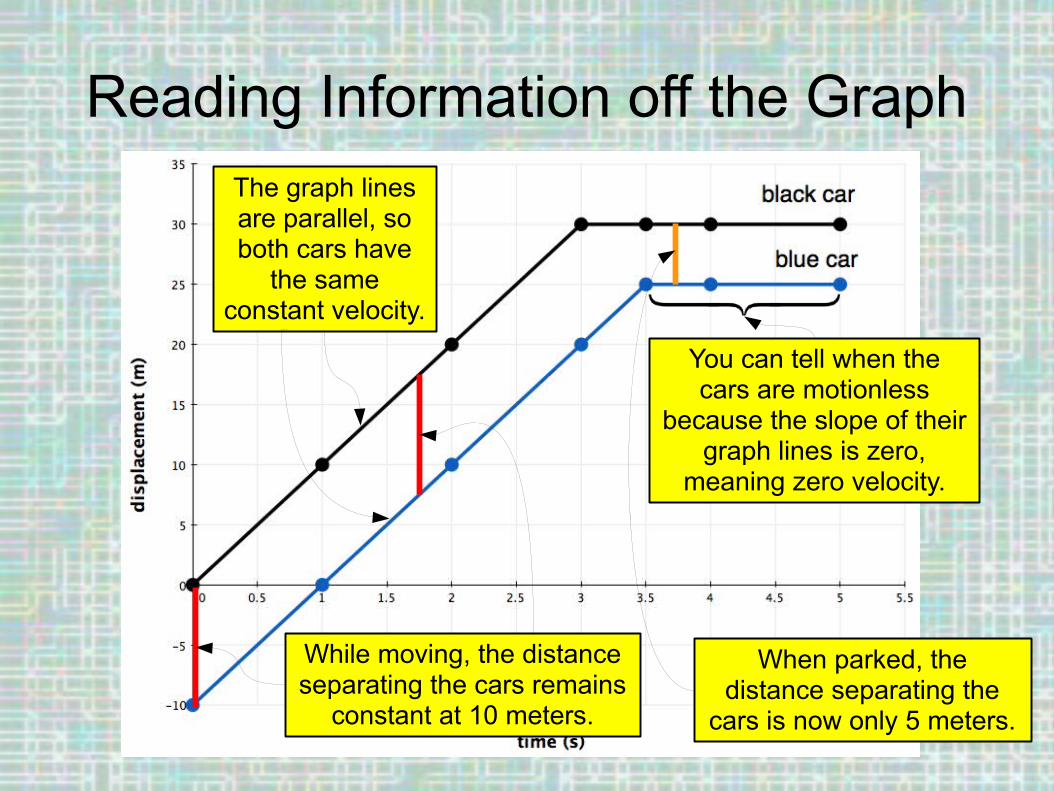
Reading Information off the GraphThe graph lines are parallel, so both cars have
the same constant velocity.
You can tell when the cars are motionless
because the slope of their graph lines is zero,
meaning zero velocity.
While moving, the distance separating the cars remains
constant at 10 meters.
When parked, the distance separating the
cars is now only 5 meters.
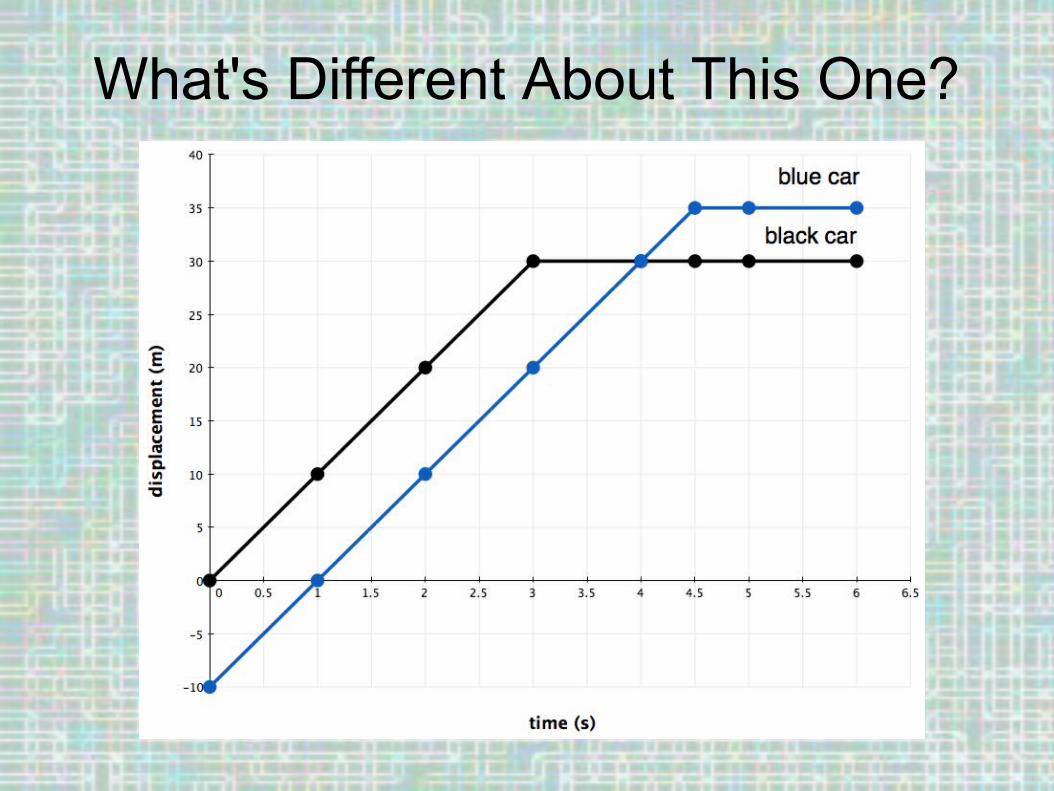
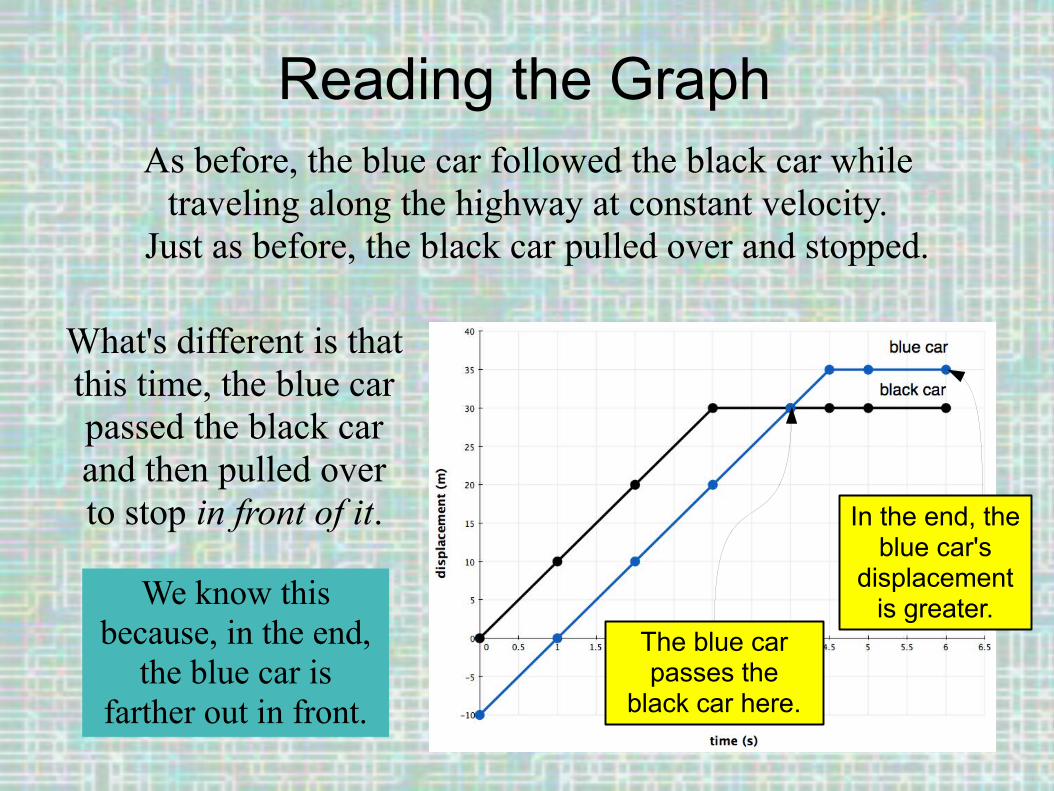
What's Different About This One?
Reading the GraphAs before, the blue car followed the black car while
traveling along the highway at constant velocity. Just as before, the black car pulled over and stopped.
What's different is that this time, the blue car passed the black car and then pulled over to stop in front of it.
We know this because, in the end,
the blue car is farther out in front.
The blue car passes the
black car here.
In the end, the blue car's
displacement is greater.
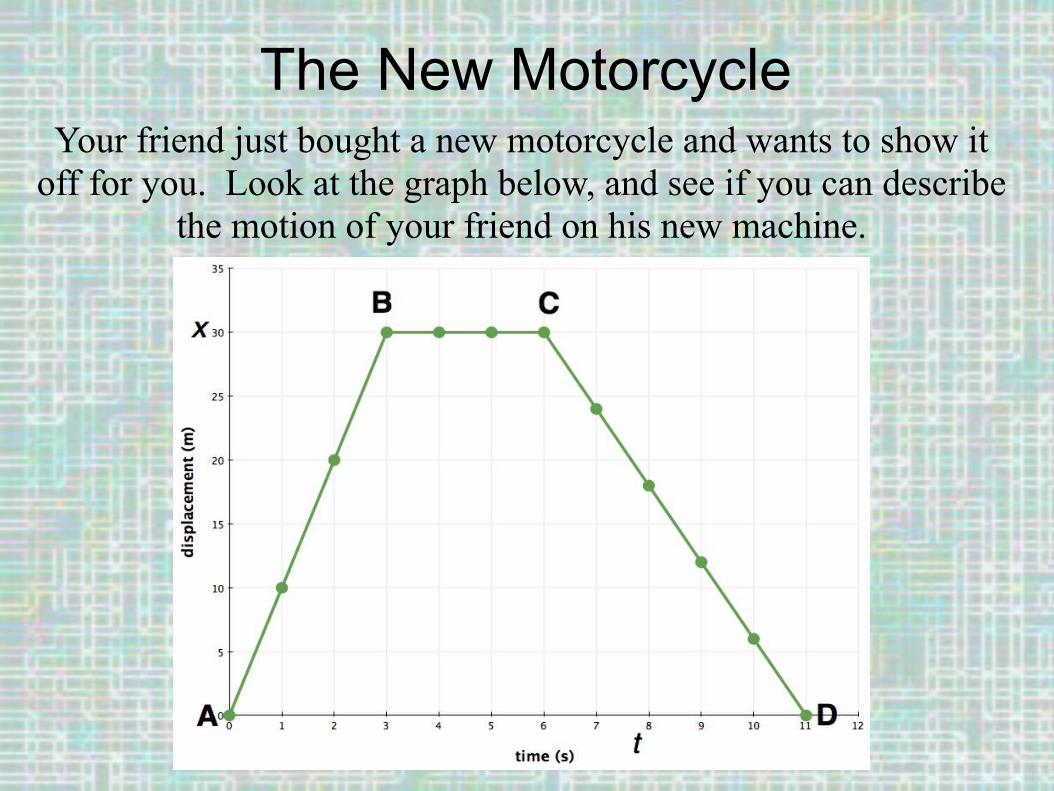
The New MotorcycleYour friend just bought a new motorcycle and wants to show it
off for you. Look at the graph below, and see if you can describe the motion of your friend on his new machine.
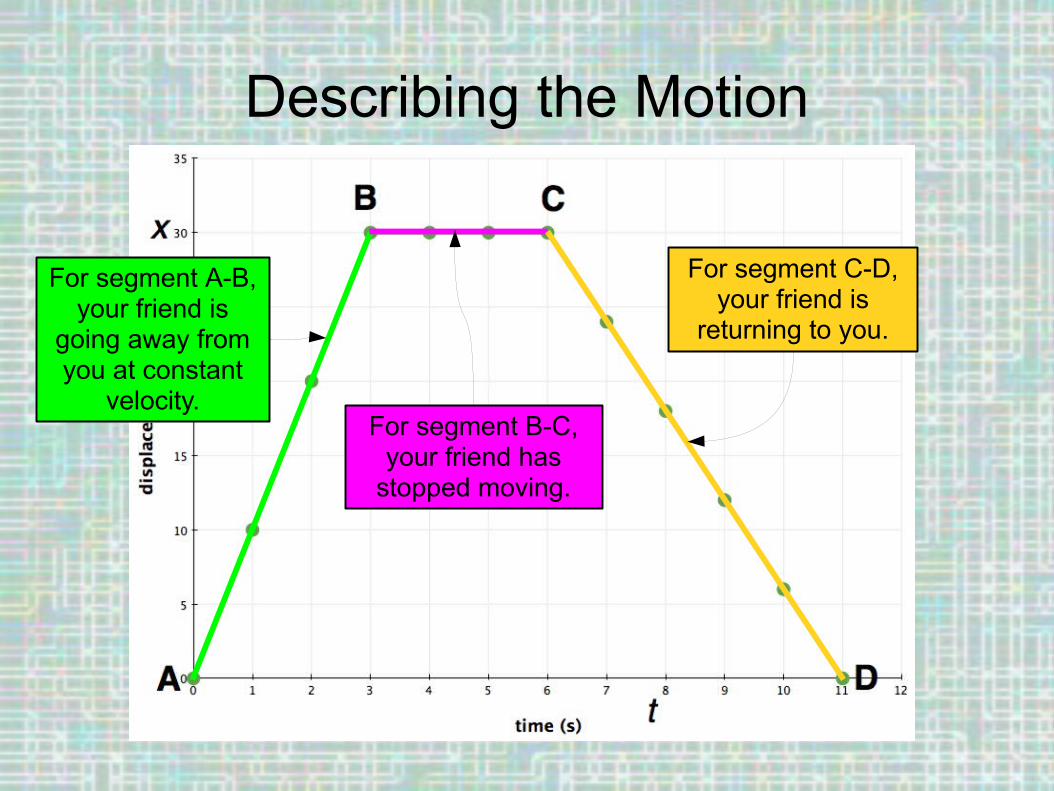
Describing the Motion
For segment A-B, your friend is
going away from you at constant
velocity.For segment B-C,
your friend has stopped moving.
For segment C-D, your friend is
returning to you.
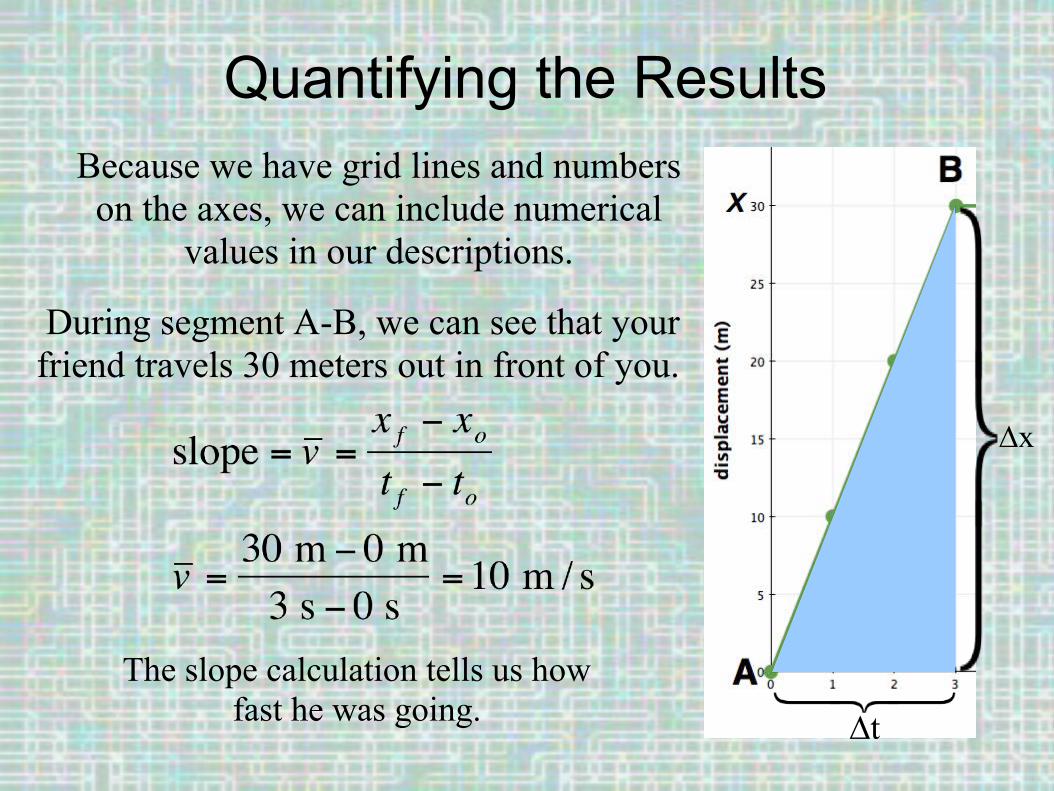
Quantifying the ResultsBecause we have grid lines and numbers
on the axes, we can include numerical values in our descriptions.
During segment A-B, we can see that your friend travels 30 meters out in front of you.
The slope calculation tells us how fast he was going.
∆x
∆t

Quantifying the ResultsFor segment B-C, your friend
remains at a distance of 30 meters in front of you for 3 seconds.
He's motionless. The slope of the graph line is quite obviously zero, but if you had to show your work,
here's how you'd do it.

Quantifying the Results
For the C-D segment, the distance between you and your friend continuously decreases
as he returns to you.
Again, a slope calculation tells us how fast he's going.
∆t
∆x

Curved Lines Mean Changing Slopes
The slope gets steeper with time. This means the object's
velocity is increasing. (As before, the increasing
displacement means it's going away from you.)
The slope flattens out with time. This means the object's velocity is decreasing, approaching zero.
(As before, the increasing displacement means it's going away
from you.)
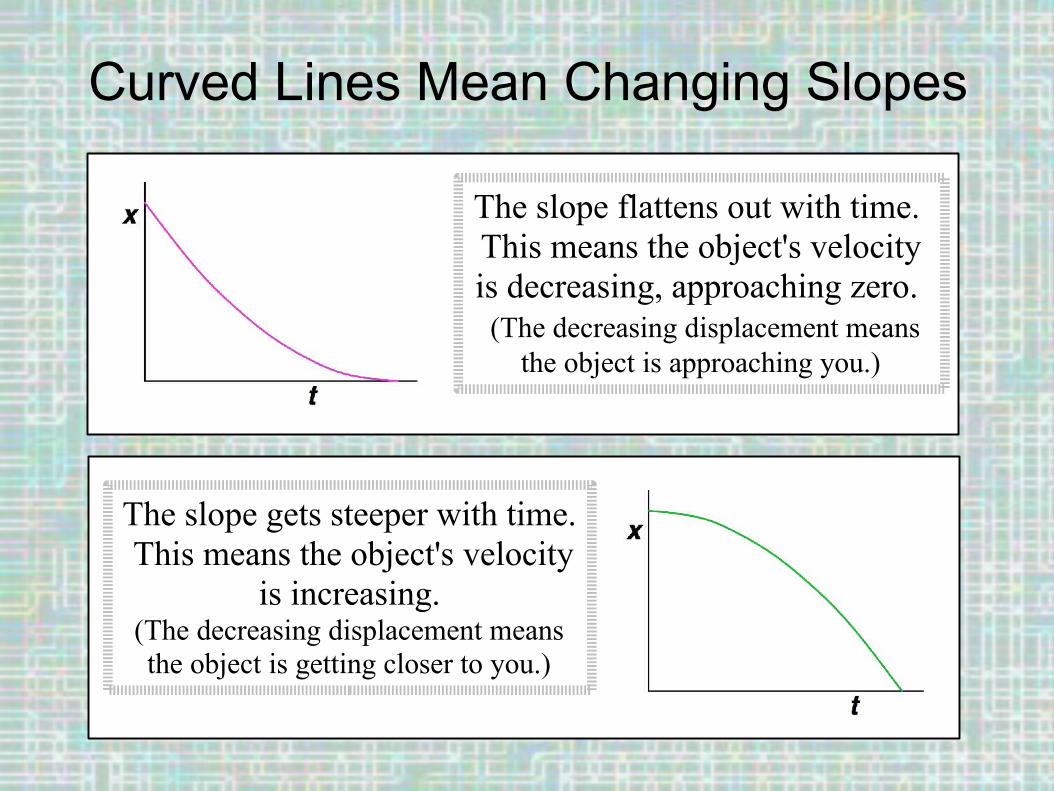
Curved Lines Mean Changing Slopes
The slope flattens out with time. This means the object's velocity is decreasing, approaching zero. (The decreasing displacement means
the object is approaching you.)
The slope gets steeper with time. This means the object's velocity
is increasing.(The decreasing displacement means the object is getting closer to you.)
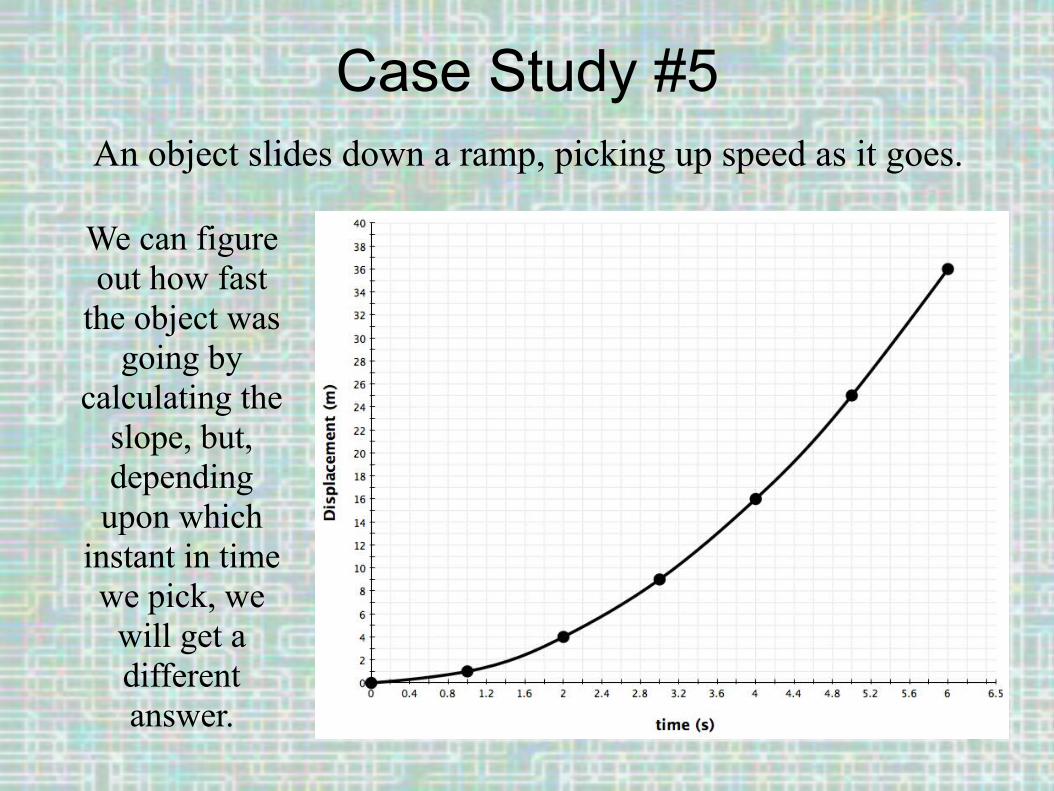
Case Study #5An object slides down a ramp, picking up speed as it goes.
We can figure out how fast
the object was going by
calculating the slope, but, depending
upon which instant in time we pick, we
will get a different answer.
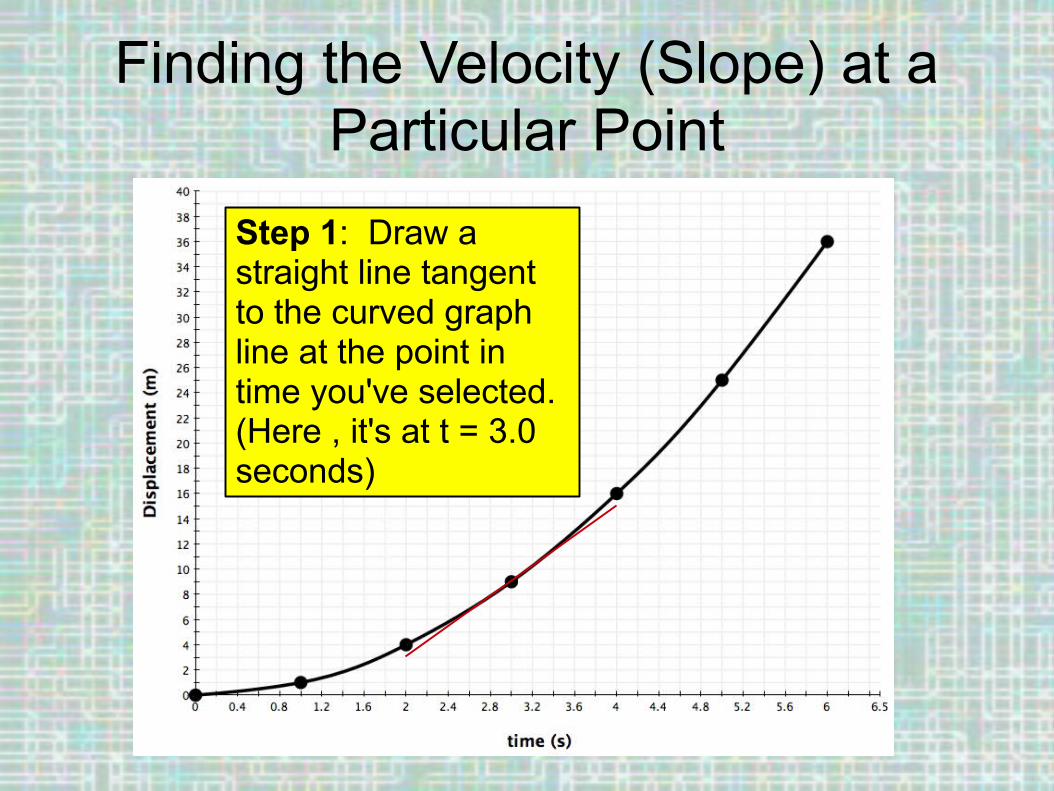
Finding the Velocity (Slope) at a Particular Point
Step 1: Draw a straight line tangent to the curved graph line at the point in time you've selected. (Here , it's at t = 3.0 seconds)

Finding the Velocity (Slope) at a Particular Point
Step 2: Construct a right triangle, using the tangent line as its hypotenuse. (The other two sides of the triangle will become the rise and the run.)
rise
run
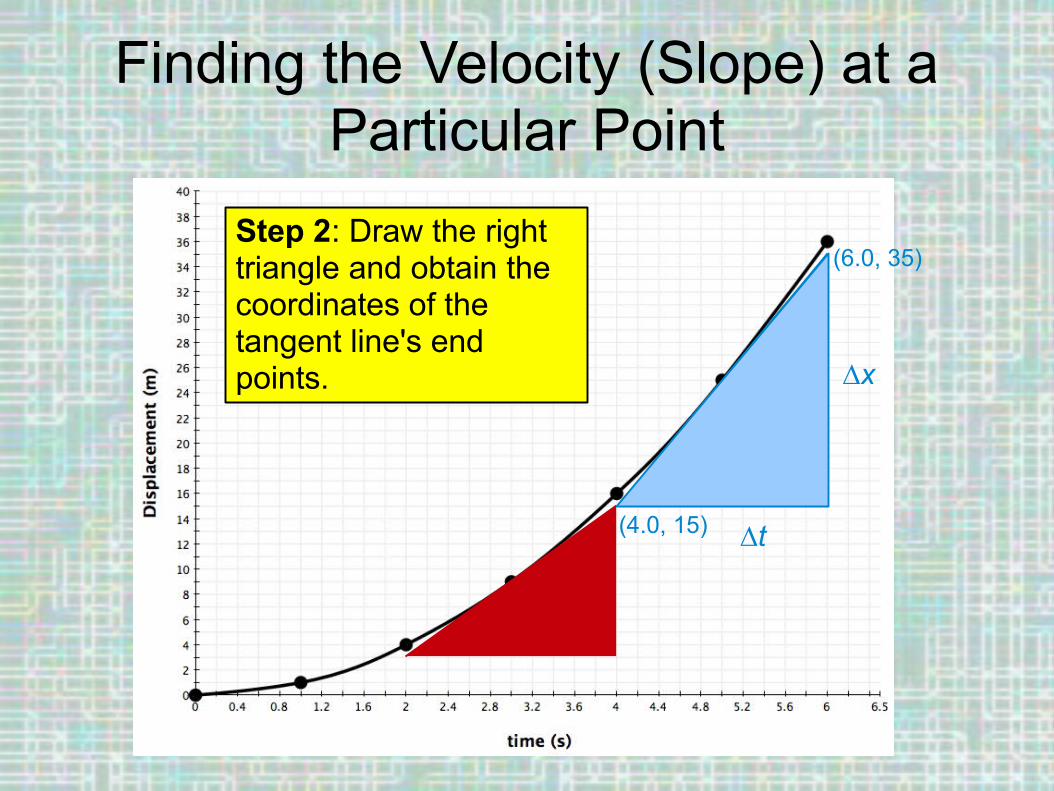
Finding the Velocity (Slope) at a Particular Point
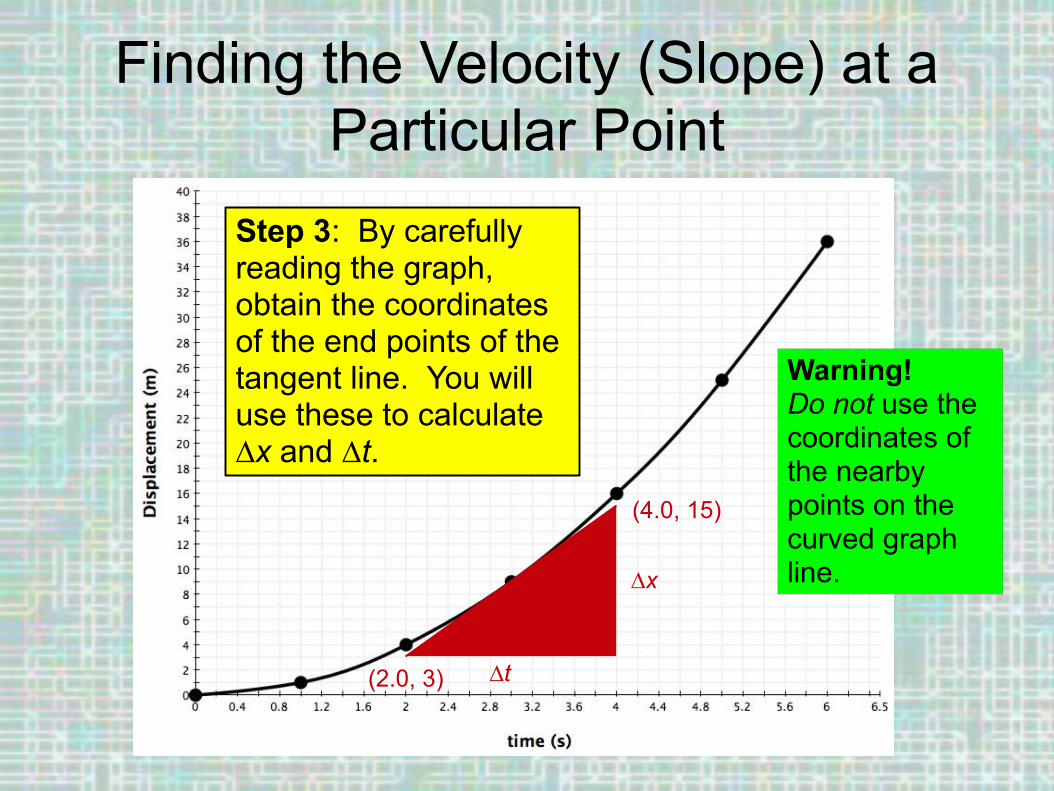
Step 3: By carefully reading the graph, obtain the coordinates of the end points of the tangent line. You will use these to calculate ∆x and ∆t.
∆x
∆t
(4.0, 15)
(2.0, 3)
Warning! Do not use the coordinates of the nearby points on the curved graph line.
Finding the Velocity (Slope) at a Particular Point
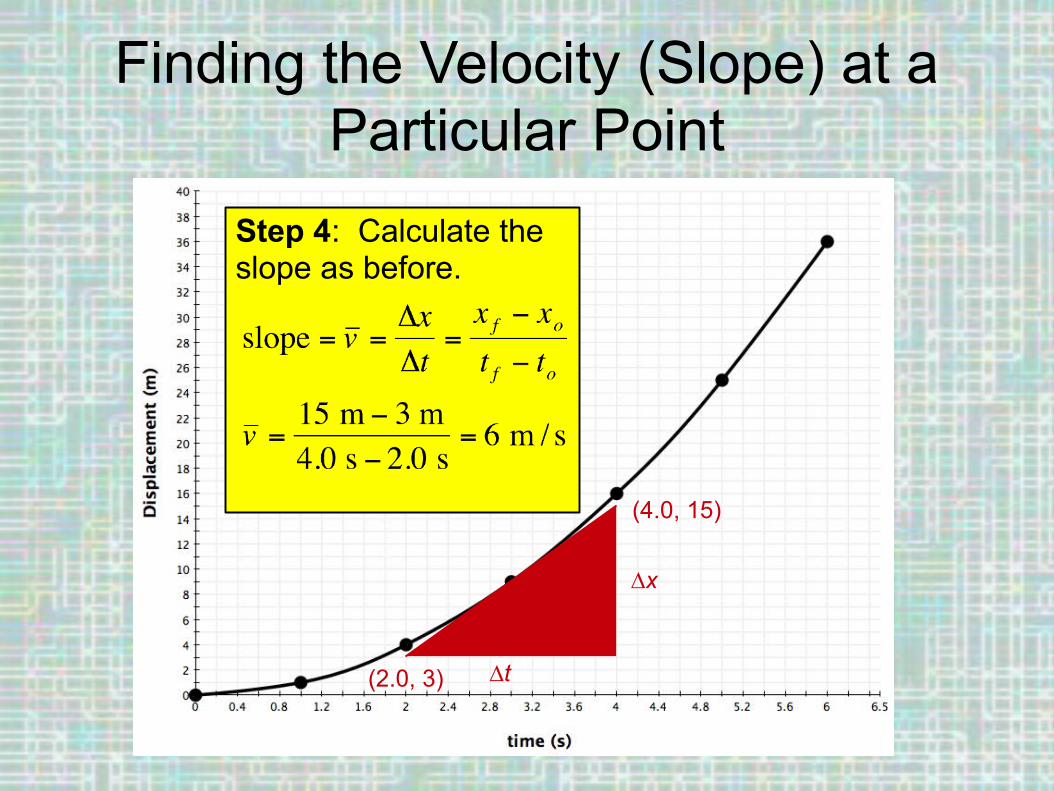
Step 4: Calculate the slope as before.
∆x
∆t
(4.0, 15)
(2.0, 3)
Finding the Velocity (Slope) at a Particular Point
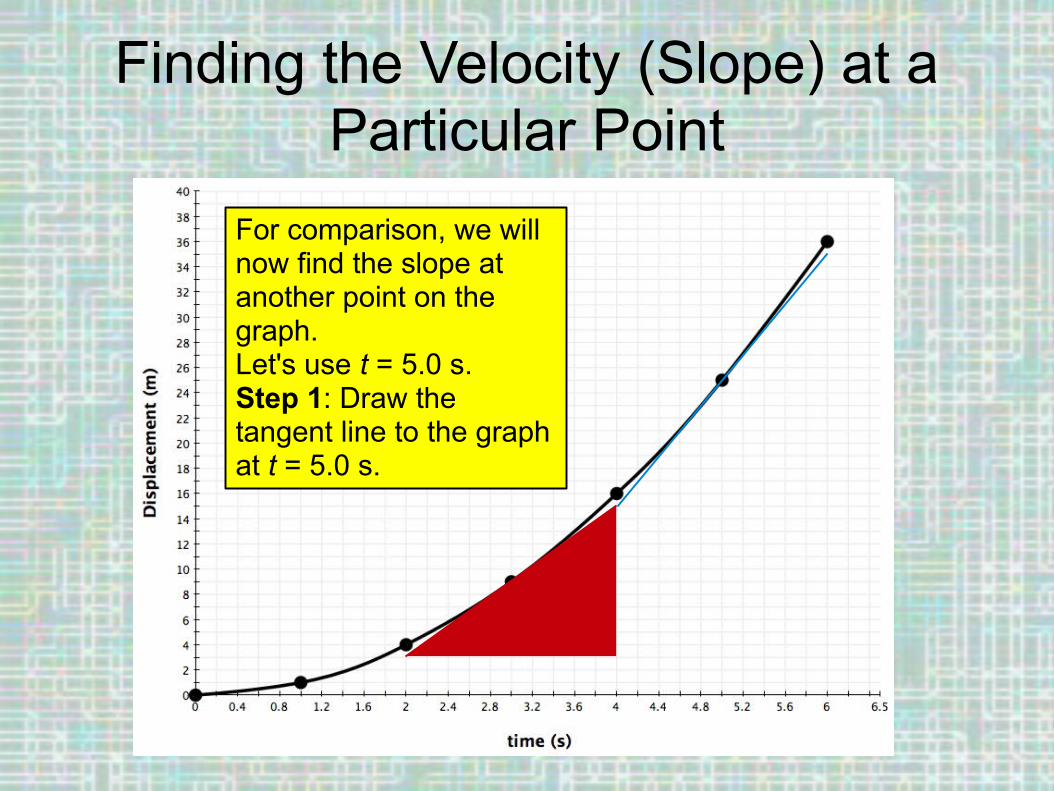
For comparison, we will now find the slope at another point on the graph.Let's use t = 5.0 s.Step 1: Draw the tangent line to the graph at t = 5.0 s.
Finding the Velocity (Slope) at a Particular Point
Step 2: Draw the right triangle and obtain the coordinates of the tangent line's end points.
(6.0, 35)
(4.0, 15)
∆x
∆t
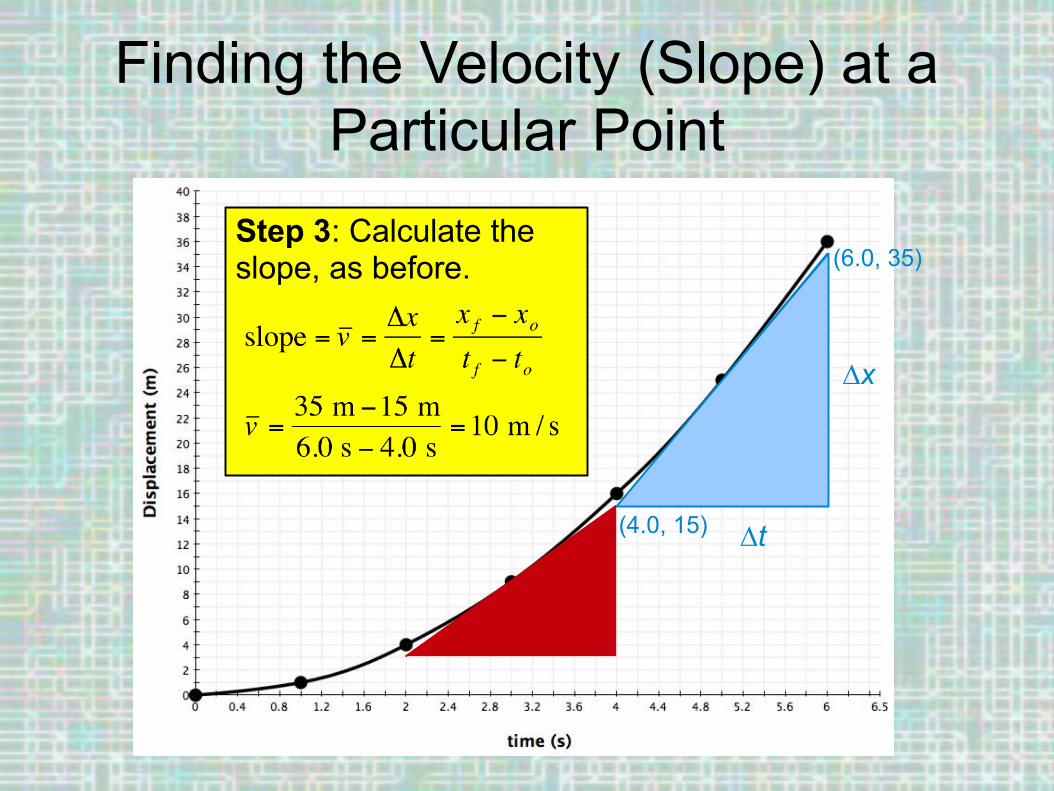
Finding the Velocity (Slope) at a Particular Point
Step 3: Calculate the slope, as before. (6.0, 35)
(4.0, 15)
∆x
∆t

Case Study #6Imagine you're standing at the top of a ramp. Your friend rolls a ball up the ramp toward you. The following graph
describes the motion of the ball.
For additional practice, try finding the velocity of the ball at several different instants in time through
slope calculation.
By the way: the ramp is straight, not curved.
This is a graph of the ball's motion, not a picture of the ramp!
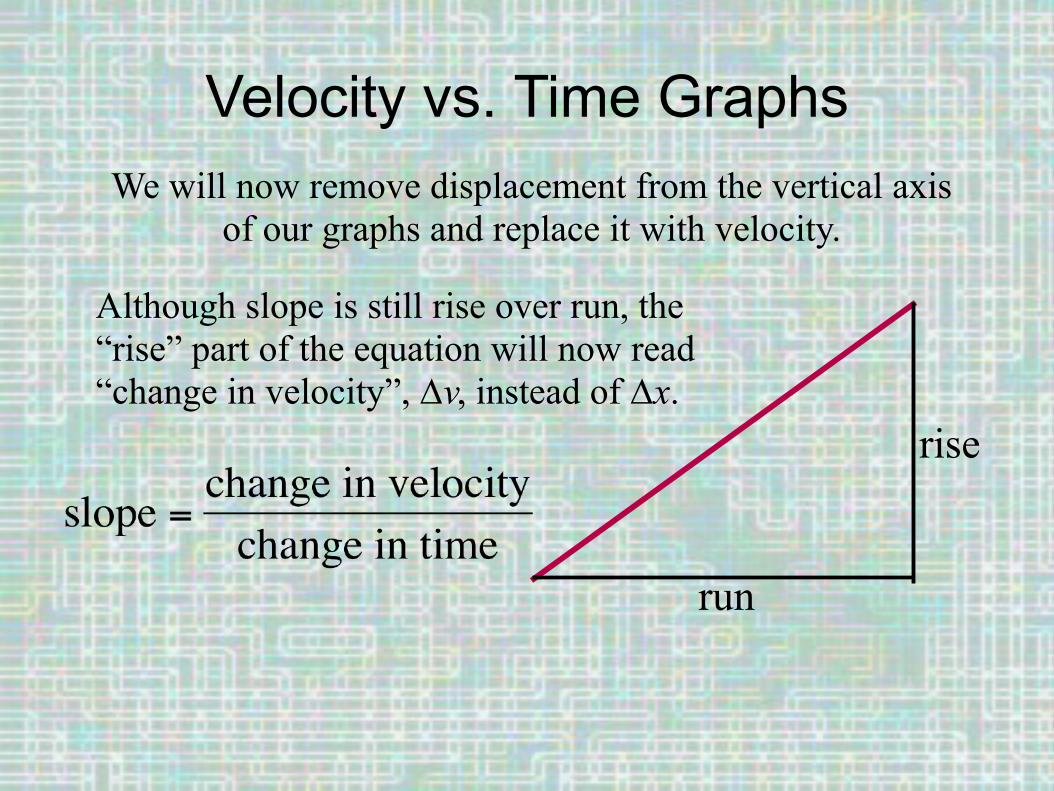
Velocity vs. Time GraphsWe will now remove displacement from the vertical axis
of our graphs and replace it with velocity.
Although slope is still rise over run, the “rise” part of the equation will now read “change in velocity”, ∆v, instead of ∆x.
run
rise
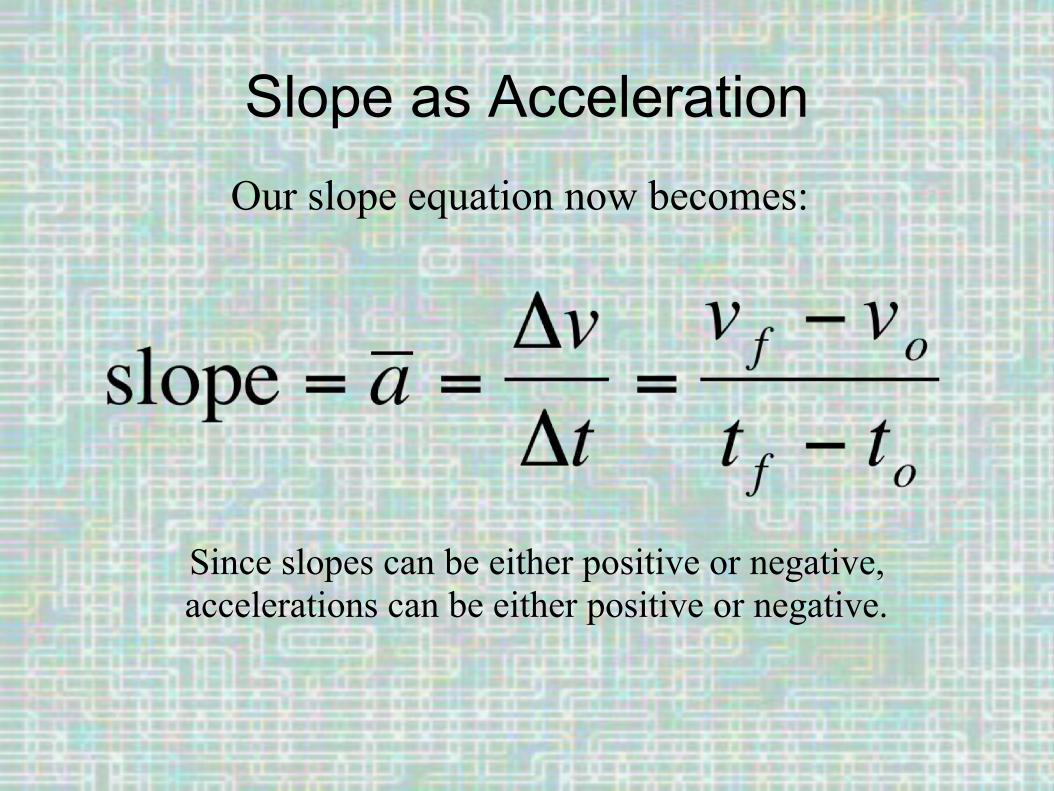
Slope as AccelerationOur slope equation now becomes:
Since slopes can be either positive or negative, accelerations can be either positive or negative.

Speeding Up or Slowing Down?Warning: Many people mistakenly believe that a positive
acceleration means the object is speeding up and a negative acceleration means the object is slowing down.
Here's the truth:
If the numerical values of an object's velocity and acceleration have the same sign (both positive or both
negative), then the object is speeding up.
If the velocity and acceleration have opposite signs (one of positive and the other is negative), then the
object is slowing down.
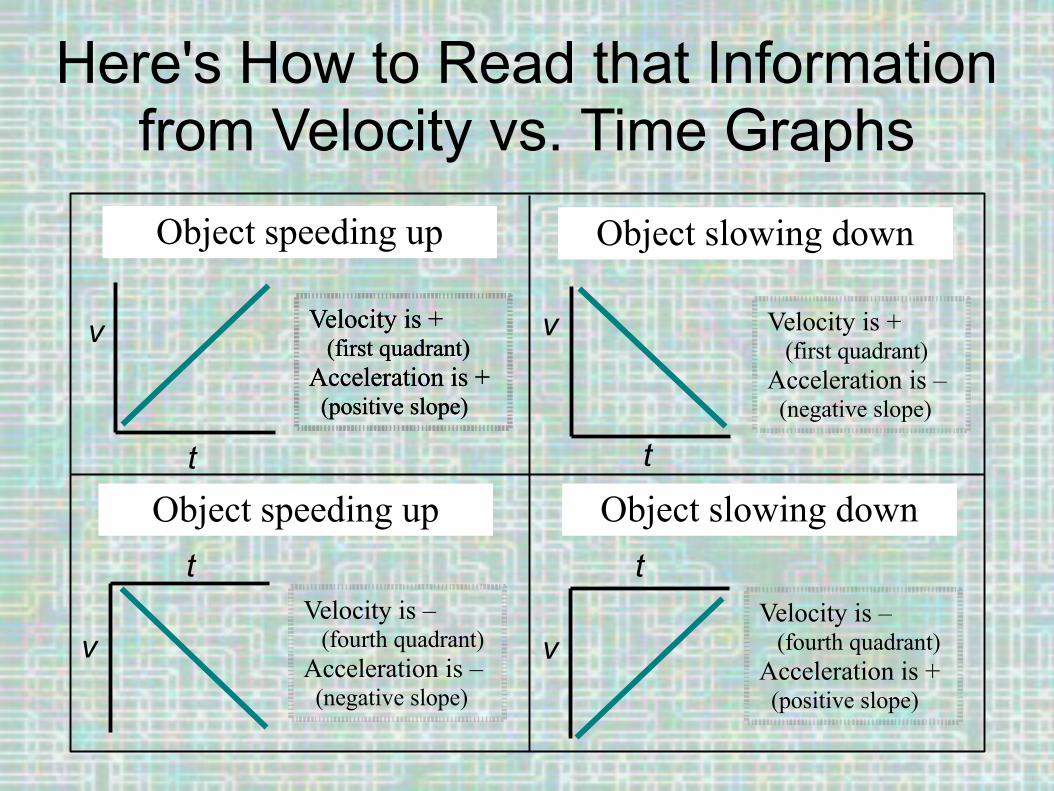
Here's How to Read that Information from Velocity vs. Time Graphs
v
v
v
v
t t
t t
Object speeding up
Object speeding up
Object slowing down
Object slowing down
Velocity is + (first quadrant)Acceleration is + (positive slope)
Velocity is – (fourth quadrant)Acceleration is – (negative slope)
Velocity is + (first quadrant)Acceleration is – (negative slope)
Velocity is + (first quadrant)Acceleration is + (positive slope)
Velocity is – (fourth quadrant)Acceleration is + (positive slope)
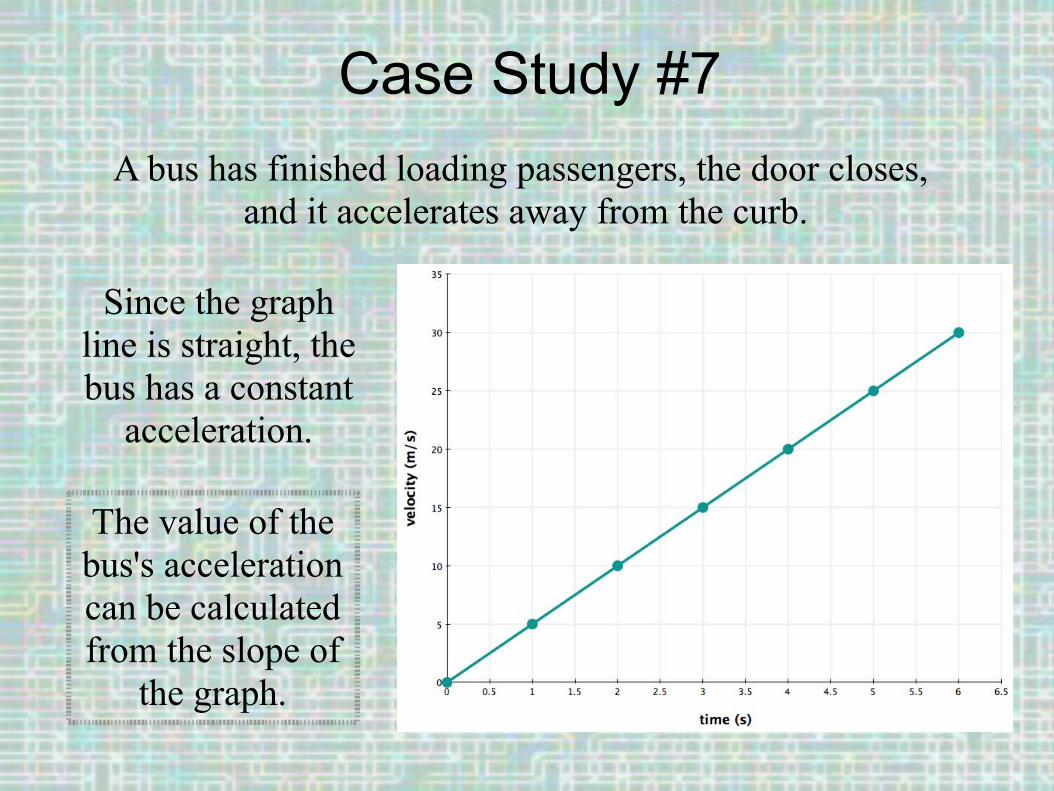
Case Study #7A bus has finished loading passengers, the door closes,
and it accelerates away from the curb.
Since the graph line is straight, the bus has a constant
acceleration.
The value of the bus's acceleration can be calculated from the slope of
the graph.

Obtaining the Acceleration from the Slope
Draw a right triangle and obtain the slope
by finding the rise over the run.
(5.0, 25)
(1.0, 5)
∆v
∆t
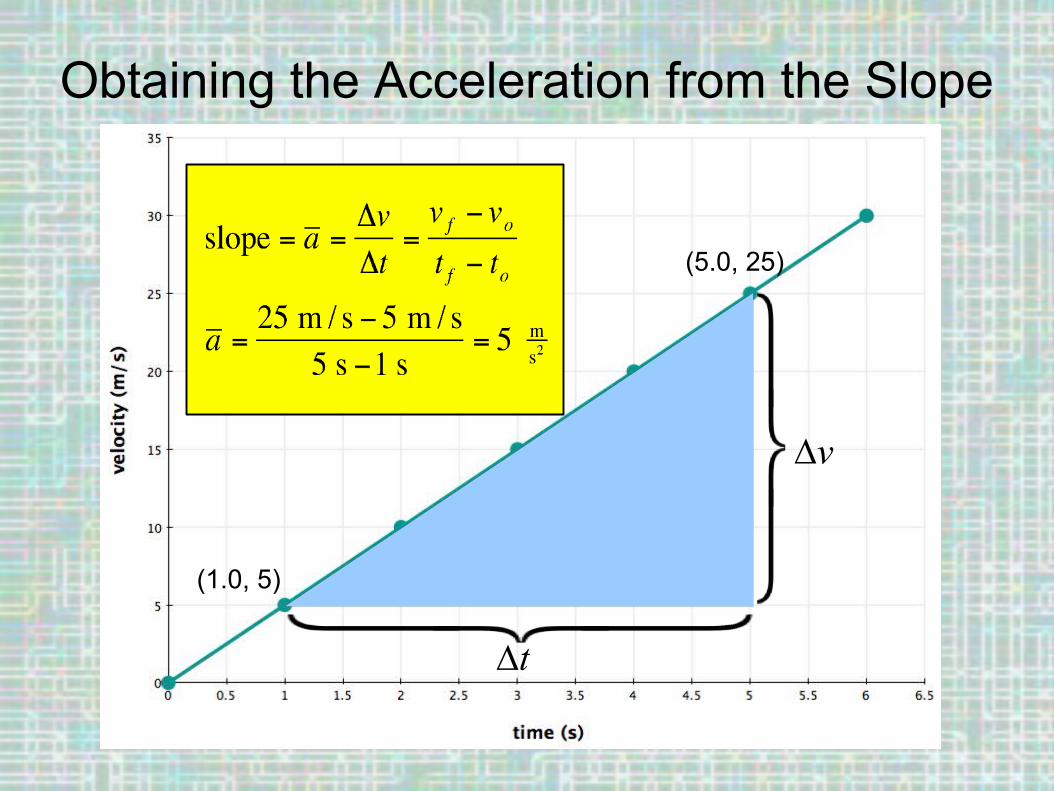
Obtaining the Acceleration from the Slope
(5.0, 25)
(1.0, 5)
∆v
∆t
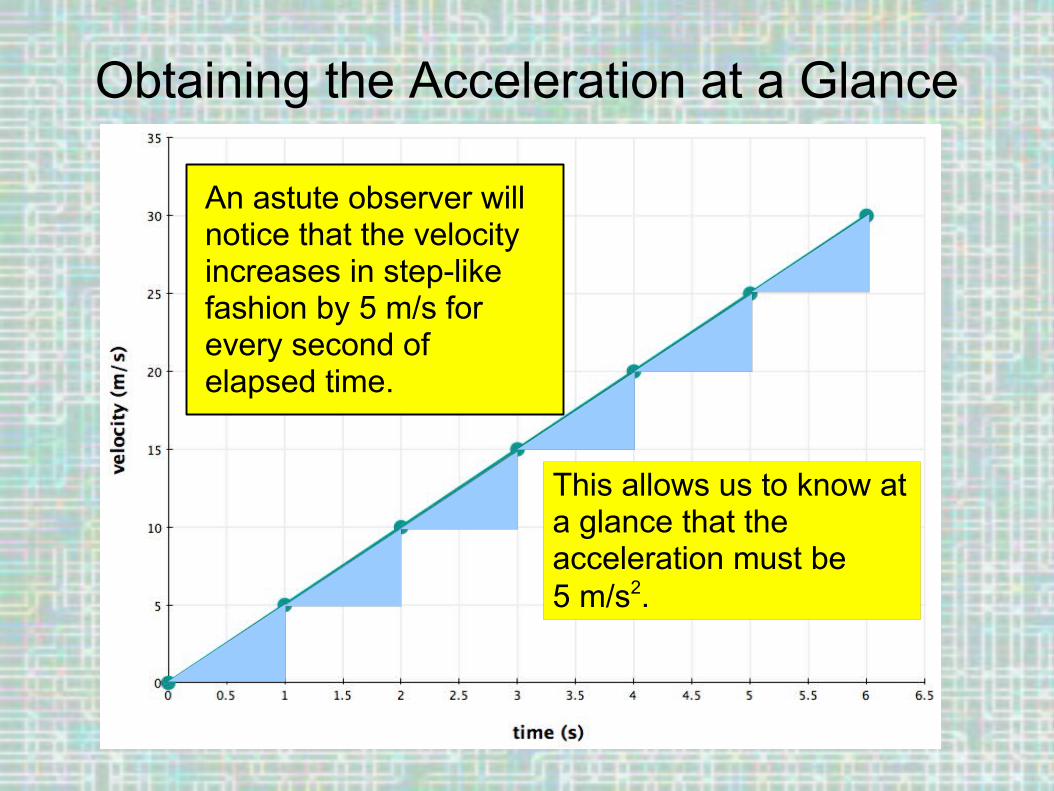
Obtaining the Acceleration at a Glance
An astute observer will notice that the velocity increases in step-like fashion by 5 m/s for every second of elapsed time.
This allows us to know at a glance that the acceleration must be 5 m/s2.
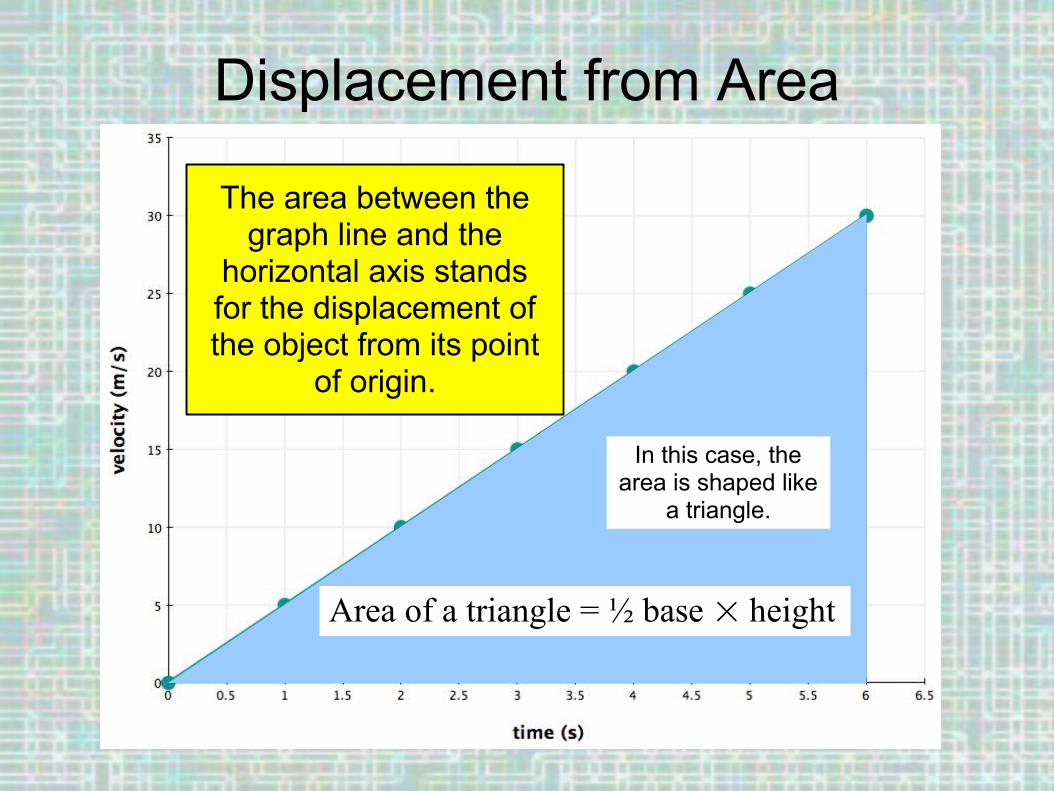
Displacement from Area
The area between the graph line and the
horizontal axis stands for the displacement of the object from its point
of origin.
Area of a triangle = ½ base height
In this case, the area is shaped like
a triangle.
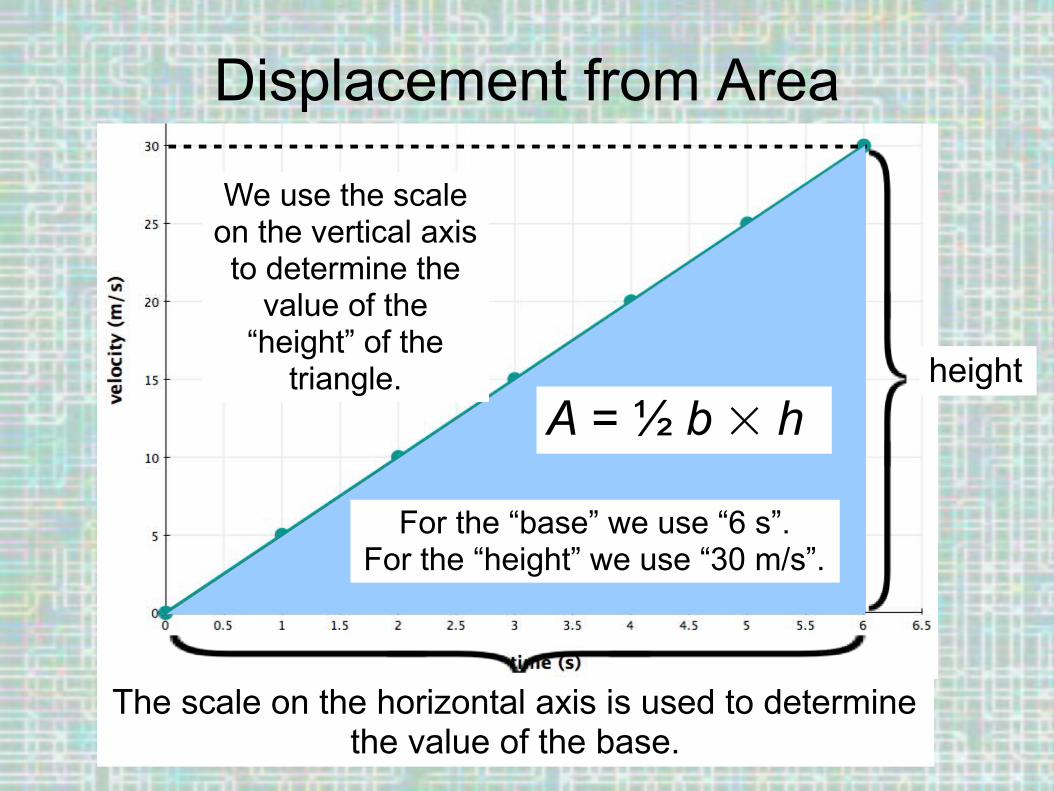
Displacement from Area
For the “base” we use “6 s”.For the “height” we use “30 m/s”.
We use the scale on the vertical axis to determine the
value of the “height” of the
triangle. height
The scale on the horizontal axis is used to determine the value of the base.
A = ½ b h
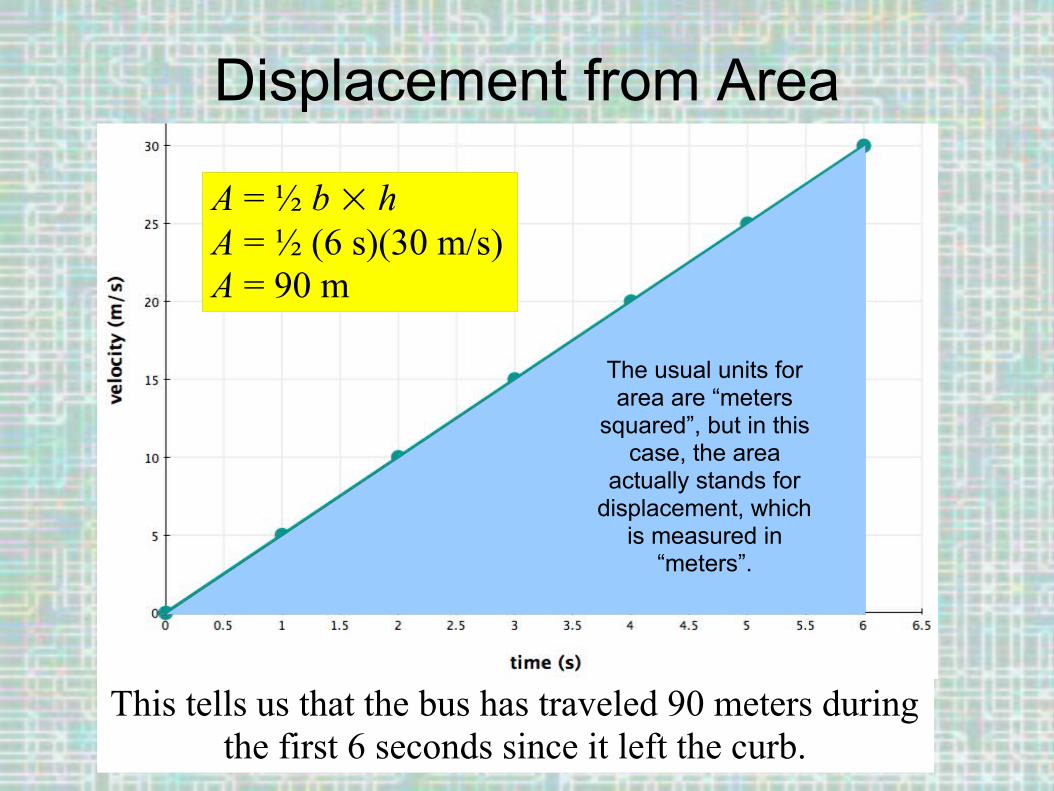
Displacement from Area
A = ½ b hA = ½ (6 s)(30 m/s)A = 90 m
This tells us that the bus has traveled 90 meters during the first 6 seconds since it left the curb.
The usual units for area are “meters
squared”, but in this case, the area
actually stands for displacement, which
is measured in “meters”.
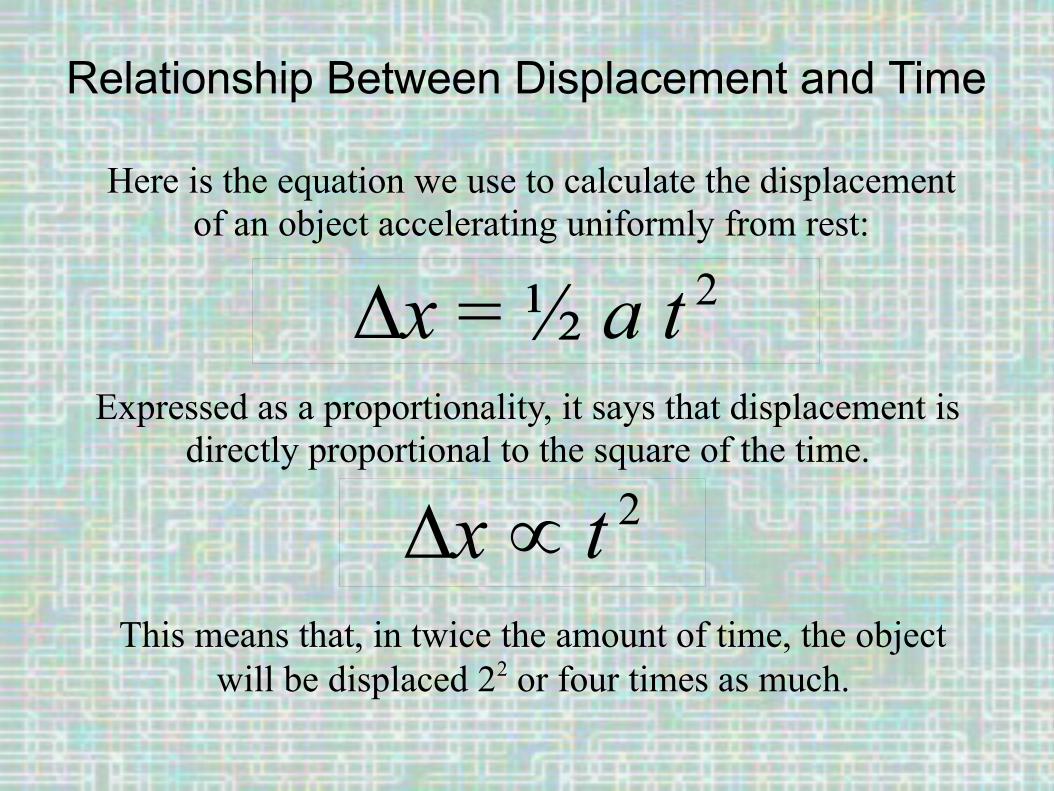
Relationship Between Displacement and Time
Here is the equation we use to calculate the displacement of an object accelerating uniformly from rest:
∆x = ½ a t 2
Expressed as a proportionality, it says that displacement is directly proportional to the square of the time.
∆x t 2
This means that, in twice the amount of time, the object will be displaced 22 or four times as much.

Displacement Time SquaredThe area of the red triangle is 10 meters. It represents the displacement of the bus during the first 2 seconds.
The area of the large triangle outlined in yellow is 40 meters. It represents the displacement of the bus during the first4 seconds.
12
3
4
One can tell at a glance that the
area of the yellow triangle is
four times the area of the red
triangle.

Case Study #8A policeman waits by the side of the road with a radar unit.
At the instant a speeding car passes by, the police car begins to accelerate from rest in an effort to catch up to the
speeder and pull him over.
Here's the data:
time (s)0 30 01 30 102 30 203 30 304 30 405 30 406 30 407 30 40
speeder's velocity (m/s)
cops's velocity (m/s) Question:
At what time does the policeman catch up with the speeder?
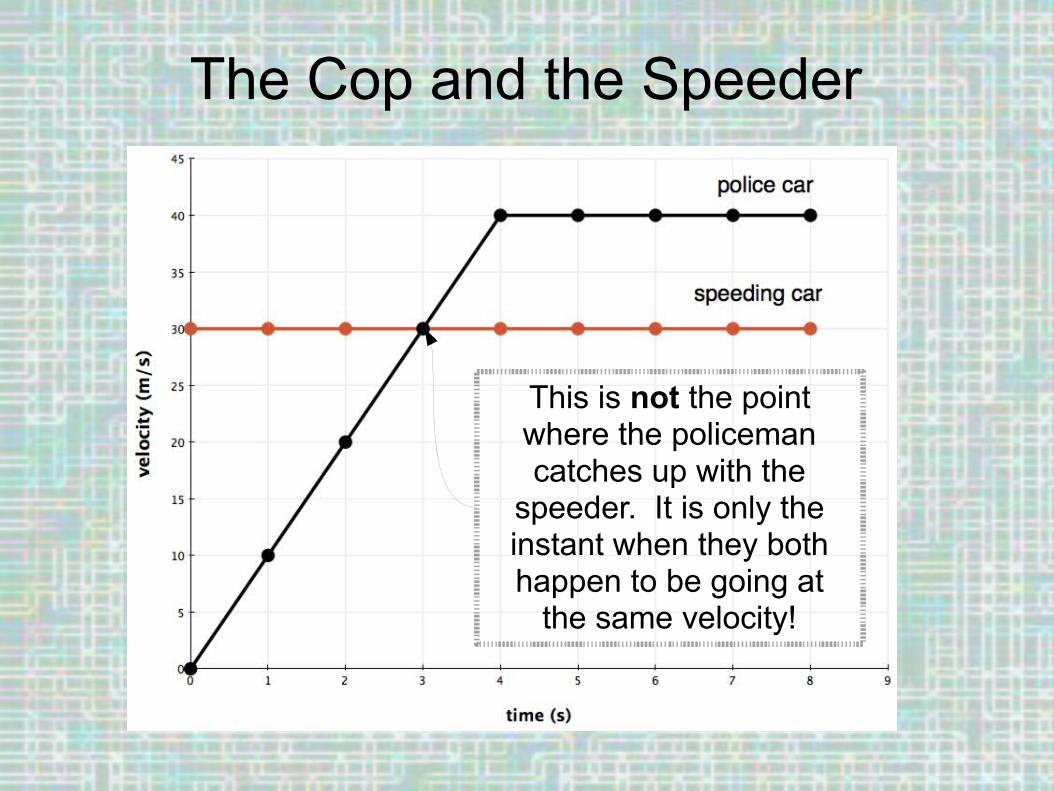
The Cop and the Speeder
This is not the point where the policeman catches up with the
speeder. It is only the instant when they both happen to be going at
the same velocity!
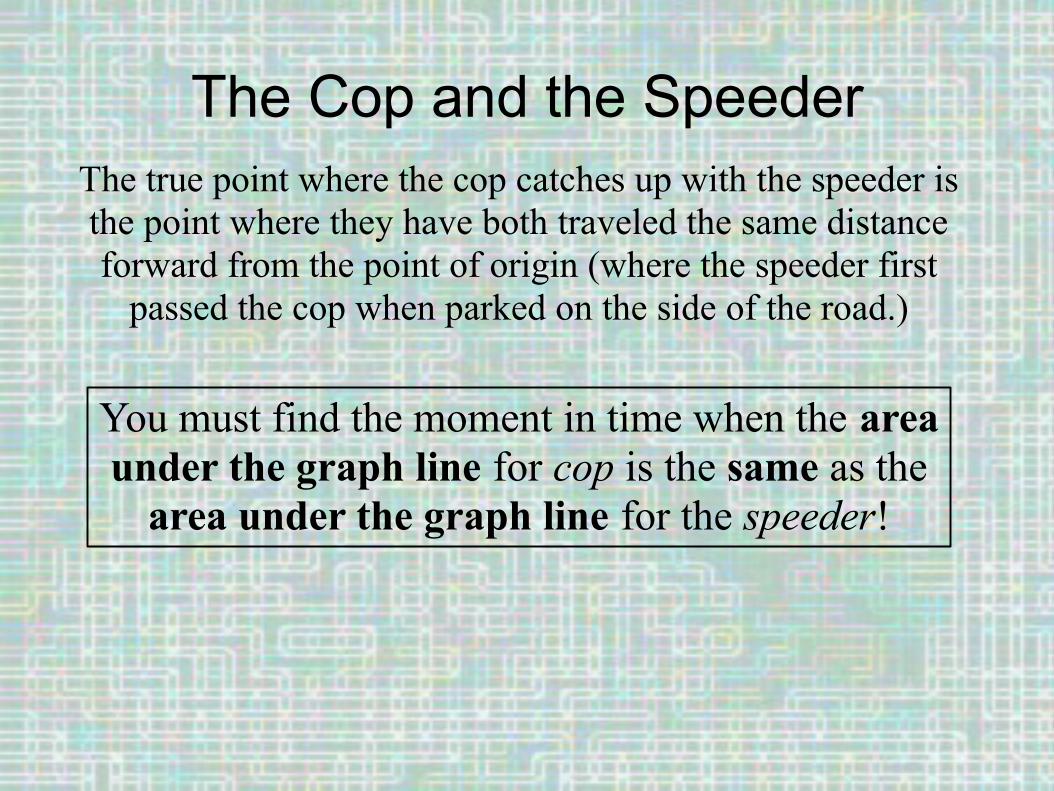
The Cop and the SpeederThe true point where the cop catches up with the speeder is the point where they have both traveled the same distance forward from the point of origin (where the speeder first
passed the cop when parked on the side of the road.)
You must find the moment in time when the area under the graph line for cop is the same as the
area under the graph line for the speeder!
The Cop and the Speeder
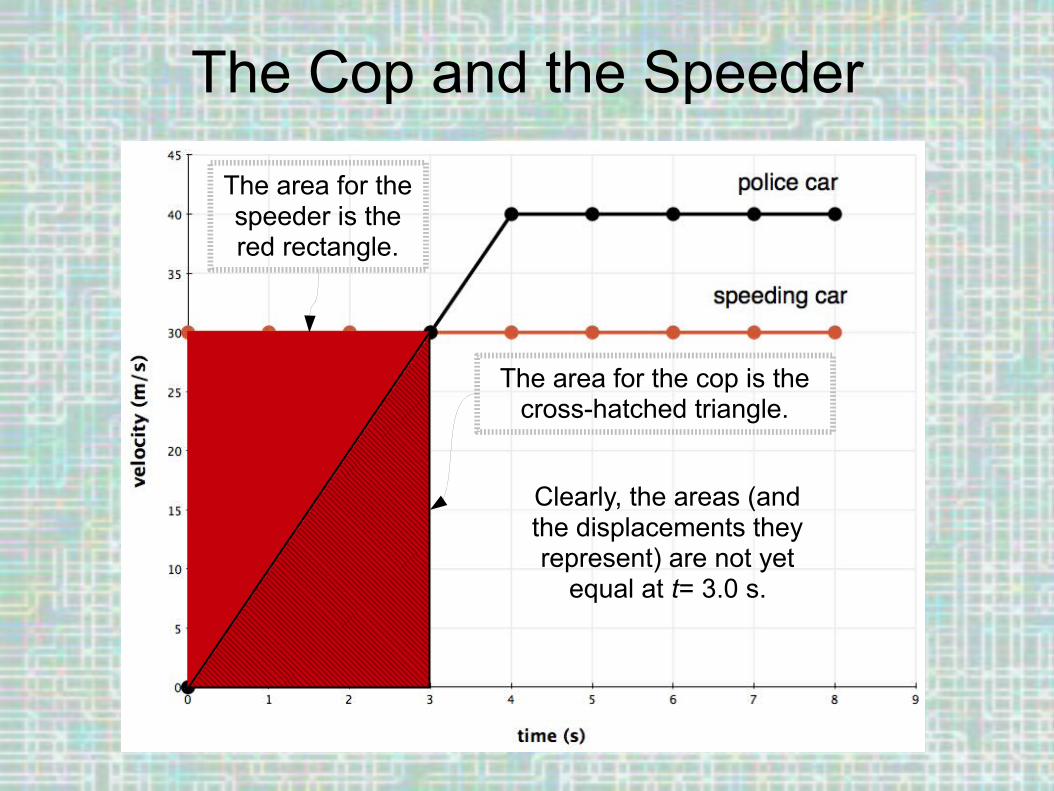
The area for the speeder is the red rectangle.
The area for the cop is the cross-hatched triangle.
Clearly, the areas (and the displacements they represent) are not yet
equal at t= 3.0 s.
The Cop and the Speeder
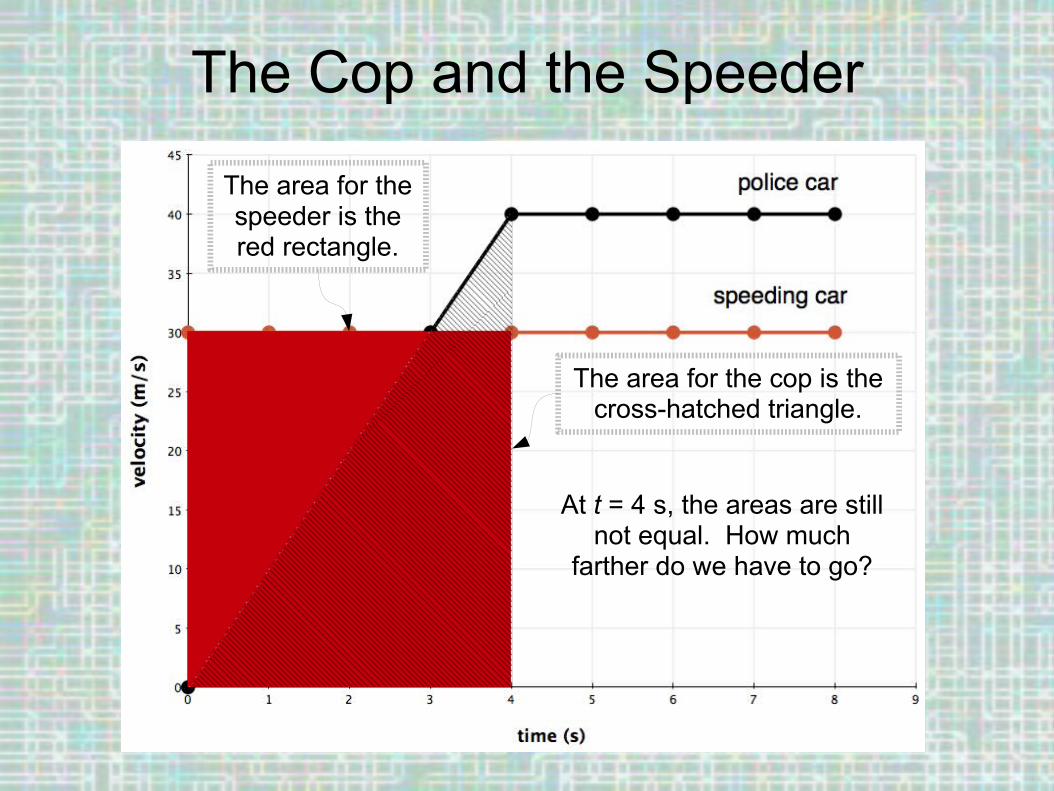
The area for the speeder is the red rectangle.
The area for the cop is the cross-hatched triangle.
At t = 4 s, the areas are still not equal. How much
farther do we have to go?
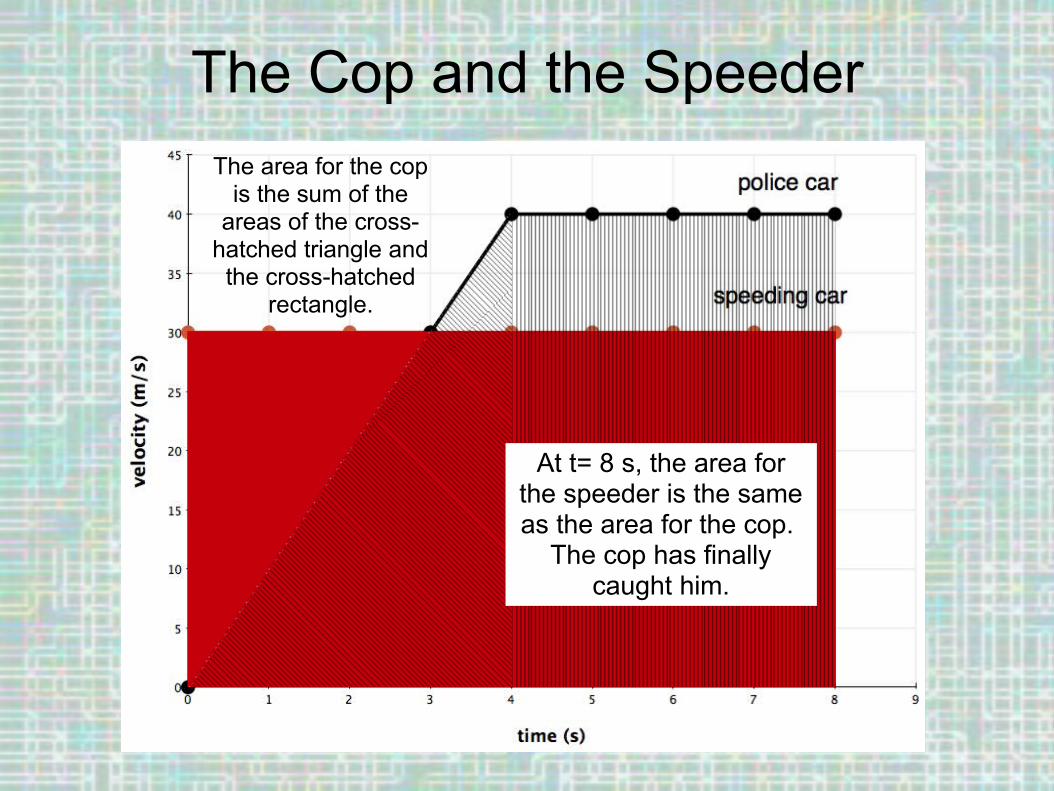
The Cop and the SpeederThe area for the cop
is the sum of the areas of the cross-
hatched triangle and the cross-hatched
rectangle.
At t= 8 s, the area for the speeder is the same as the area for the cop.
The cop has finally caught him.
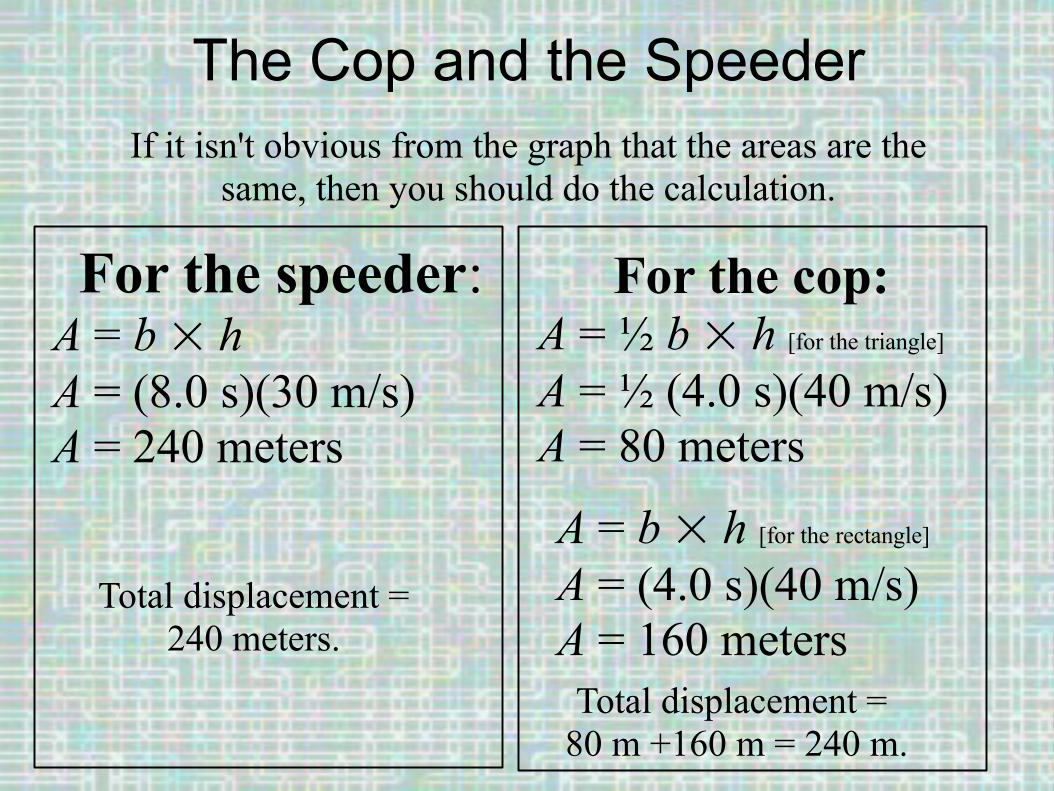
The Cop and the SpeederIf it isn't obvious from the graph that the areas are the
same, then you should do the calculation.
For the speeder:A = b hA = (8.0 s)(30 m/s)A = 240 meters
For the cop:A = ½ b h [for the triangle]
A = ½ (4.0 s)(40 m/s)A = 80 meters
Total displacement = 240 meters.
A = b h [for the rectangle]
A = (4.0 s)(40 m/s)A = 160 meters
Total displacement = 80 m +160 m = 240 m.
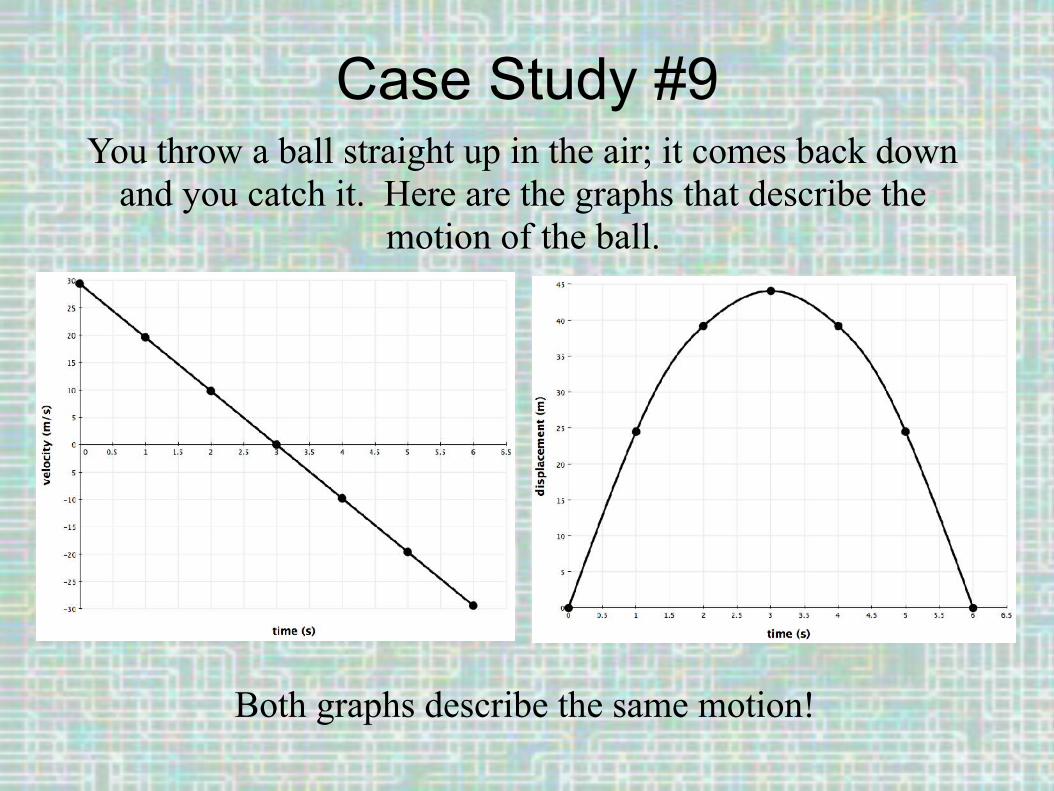
Case Study #9You throw a ball straight up in the air; it comes back down
and you catch it. Here are the graphs that describe the motion of the ball.
Both graphs describe the same motion!
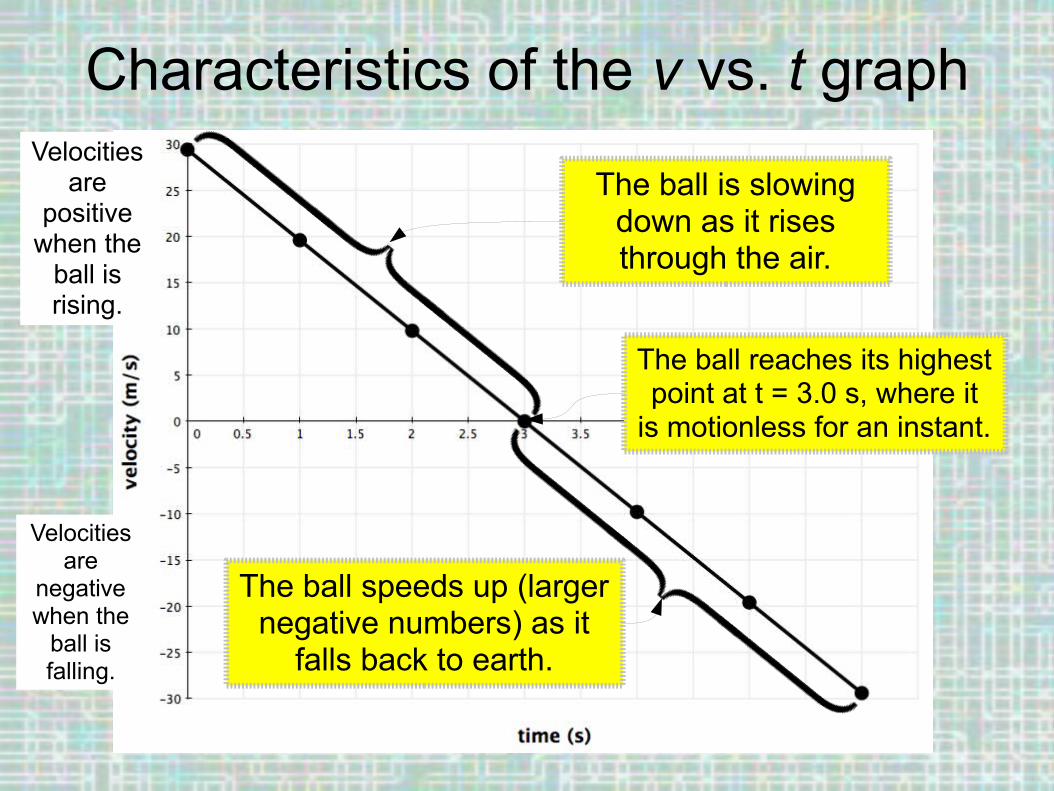
Characteristics of the v vs. t graphVelocities
are positive
when the ball is rising.
Velocities are
negative when the
ball is falling.
The ball is slowing down as it rises through the air.
The ball speeds up (larger negative numbers) as it
falls back to earth.
The ball reaches its highest point at t = 3.0 s, where it
is motionless for an instant.
Characteristics of the v vs. t graph
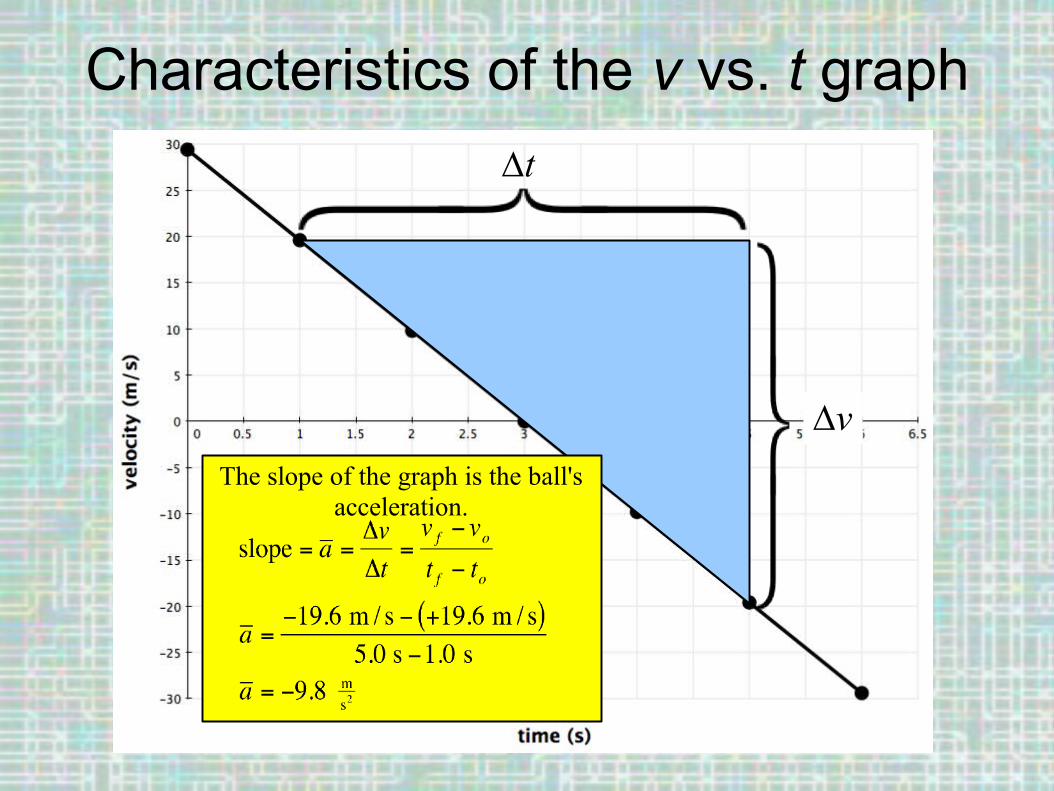
The slope of the graph is the ball's acceleration.
∆v
∆t

Characteristics of the v vs. t graph
This area represents the displacement of the ball from
when it was thrown on up to its highest point. It is a positive area.
The displacement is in the positive or upward direction.
This area represents the displacement of the ball from its highest point back down to its original point of origin. It is a negative area. This
displacement is in the negative or downward
direction.
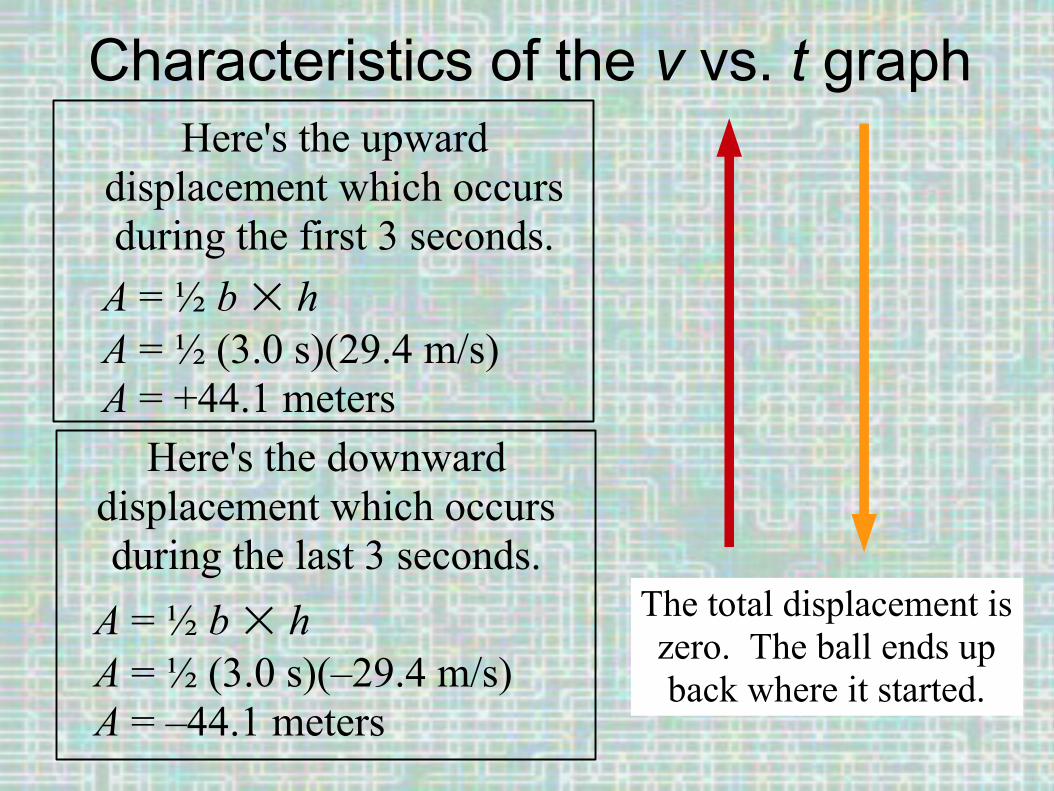
Characteristics of the v vs. t graphHere's the upward
displacement which occurs during the first 3 seconds.
A = ½ b hA = ½ (3.0 s)(29.4 m/s)A = +44.1 meters
Here's the downward displacement which occurs during the last 3 seconds.
A = ½ b hA = ½ (3.0 s)(–29.4 m/s)A = –44.1 meters
The total displacement is zero. The ball ends up back where it started.
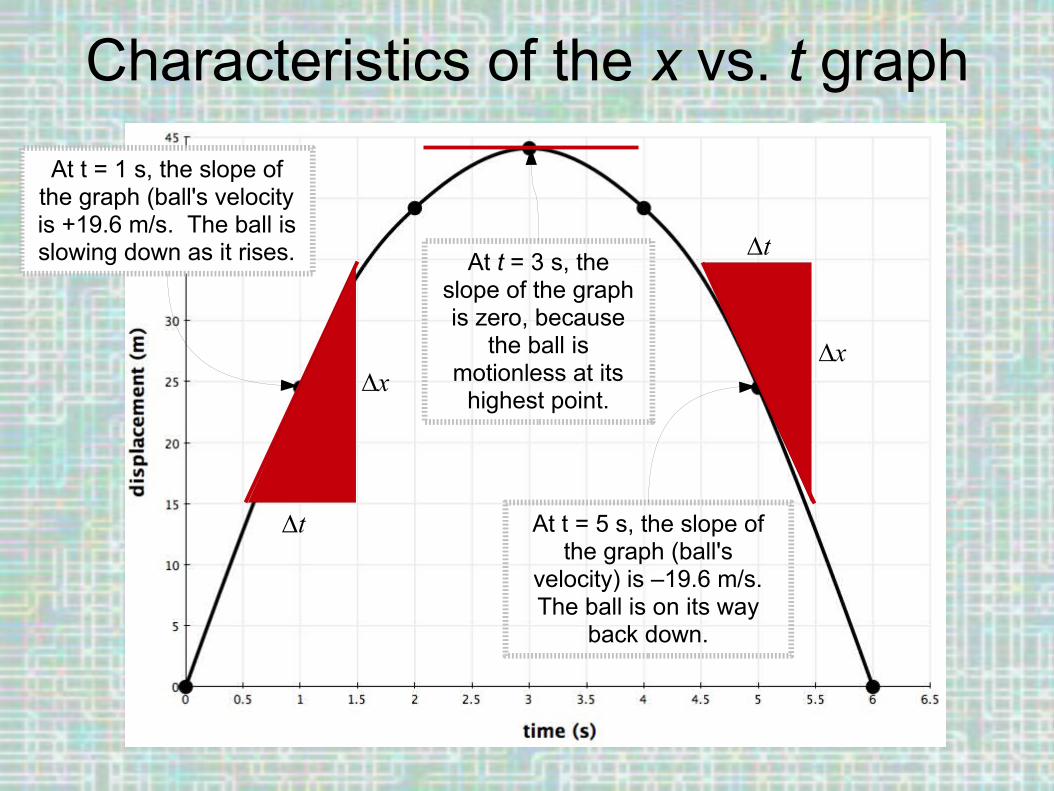
Characteristics of the x vs. t graph
∆t
∆t
∆x∆x
At t = 3 s, the slope of the graph is zero, because
the ball is motionless at its
highest point.
At t = 5 s, the slope of the graph (ball's
velocity) is –19.6 m/s. The ball is on its way
back down.
At t = 1 s, the slope of the graph (ball's velocity is +19.6 m/s. The ball is slowing down as it rises.