Embed Size (px)
Citation preview

MOTION GRAPH Review
Select Your Team
This TP goes along with 1: Motion Worksheet – Interpreting Motion Graphs

Please select a Team.
Team
1
Team
2
Team
3
Team
4
Team
5
0% 0% 0%0%0%
1. Team 1
2. Team 2
3. Team 3
4. Team 4
5. Team 5

Lets start easy: Speed
Scala
r
Vect
or
0%0%
1. Scalar
2. Vector
Countdown
10

Lets start easy: Acceleration
Scala
r
Vect
or
0%0%
1. Scalar
2. Vector
Countdown
10

Lets start easy: Displacement
Scala
r
Vect
or
0%0%
1. Scalar
2. Vector
Countdown
10

Lets start easy: Distance
Scala
r
Vect
or
0%0%
1. Scalar
2. Vector
Countdown
10

Lets start easy: Velocity
Scala
r
Vect
or
0%0%
1. Scalar
2. Vector
Countdown
10

Team Scores
500 Team 2
400 Team 1

The slope of a position-time graph indicates an objects …
velo
city
dist
ance
acc
elera
tion
disp
lace
ment
0% 0%0%0%
1. velocity
2. distance
3. acceleration
4. displacement

The slope of a velocity-time graph indicates an objects …
velo
city
dist
ance
acc
elera
tion
disp
lace
ment
0% 0%0%0%
1. velocity
2. distance
3. acceleration
4. displacement

Team Scores
141.67 Team 1
100 Team 2
0 Team 3
0 Team 5
0 Team 4

Use the phrase to describe the graph. There may be more than 1 correct answer.
Const
ant Velo
c...
Decr
easing V
el...
Not m
oving
Incr
easing V
el...
+ A
ccele
ratio
n
- Acc
elera
tion
Getti
ng Furth
e...
0% 0% 0% 0%0%0%0%
time(s)
Position(m)
1. Constant Velocity
2. Decreasing Velocity
3. Not moving
4. Increasing Velocity
5. + Acceleration
6. - Acceleration
7. Getting Further away.

Use the phrase to describe the graph. There may be more than 1 correct answer.
Const
ant Velo
c...
Decr
easing V
el...
Not m
oving
Incr
easing V
el...
+ A
ccele
ratio
n
- Acc
elera
tion
Getti
ng Furth
e...
0% 0% 0% 0%0%0%0%
time(s)
Velocity(m/s)
1. Constant Velocity
2. Decreasing Velocity
3. Not moving
4. Increasing Velocity
5. + Acceleration
6. - Acceleration
7. Getting Further away.

Use the phrase to describe the graph. There may be more than 1 correct answer.
Const
ant Velo
c...
Decr
easing V
el...
Not m
oving
Incr
easing V
el...
+ A
ccele
ratio
n
- Acc
elera
tion
Getti
ng Furth
e...
0% 0% 0% 0%0%0%0%
time(s)
Position(m)
1. Constant Velocity
2. Decreasing Velocity
3. Not moving
4. Increasing Velocity
5. + Acceleration
6. - Acceleration
7. Getting Further away.

Team Scores
441.67 Team 1
400 Team 2
300 Team 3
300 Team 5
300 Team 4

Use the phrase to describe the graph. There may be more than 1 correct answer.
Const
ant Velo
c...
Decr
easing V
el...
Not m
oving
Incr
easing V
el...
+ A
ccele
ratio
n
- Acc
elera
tion
Getti
ng Furth
e...
0% 0% 0% 0%0%0%0%
1. Constant Velocity
2. Decreasing Velocity
3. Not moving
4. Increasing Velocity
5. + Acceleration
6. - Acceleration
7. Getting Further away.
time(s)
Velocity(m/s)

Use the phrase to describe the graph. There may be more than 1 correct answer.
Const
ant Velo
c...
Decr
easing V
el...
Not m
oving
Incr
easing V
el...
+ A
ccele
ratio
n
- Acc
elera
tion
Getti
ng Furth
e...
0% 0% 0% 0%0%0%0%
time(s)
Position(m)
1. Constant Velocity
2. Decreasing Velocity
3. Not moving
4. Increasing Velocity
5. + Acceleration
6. - Acceleration
7. Getting Further away.

Use the phrase to describe the graph. There may be more than 1 correct answer.
Airp
lane takin
...
Car d
rivin
g do...
Rock
falli
ng o...
Car a
pproac
hin...
A ca
r which
is...
A st
udent init.
..
0% 0% 0%0%0%0%
time(s)
Position(m)
1. Airplane taking off.
2. Car driving down the highway.
3. Rock falling off a cliff.
4. Car approaching a red light.
5. A car which is stopped.
6. A student initially traveling at 2m/s that accelerates to pass a slower student in the hall.

Team Scores
441.67 Team 1
400 Team 2
300 Team 3
300 Team 5
300 Team 4

Which shape fits a position-time graph of an object moving at constant (non-zero)
speed?
A B C D E
Cannot b
e dete
rmin
ed
0% 0% 0%0%0%0%
1. A
2. B
3. C
4. D
5. E
6. Cannot be determined
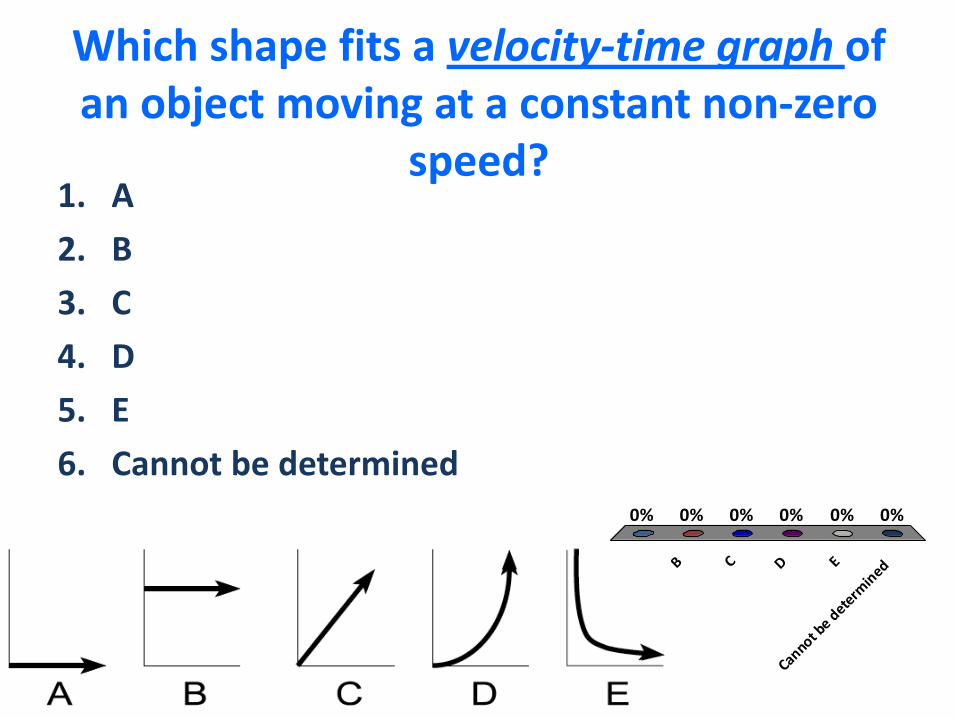
Which shape fits a velocity-time graph of an object moving at a constant non-zero
speed?
A B C D E
Cannot b
e dete
rmin
ed
0% 0% 0%0%0%0%
1. A
2. B
3. C
4. D
5. E
6. Cannot be determined
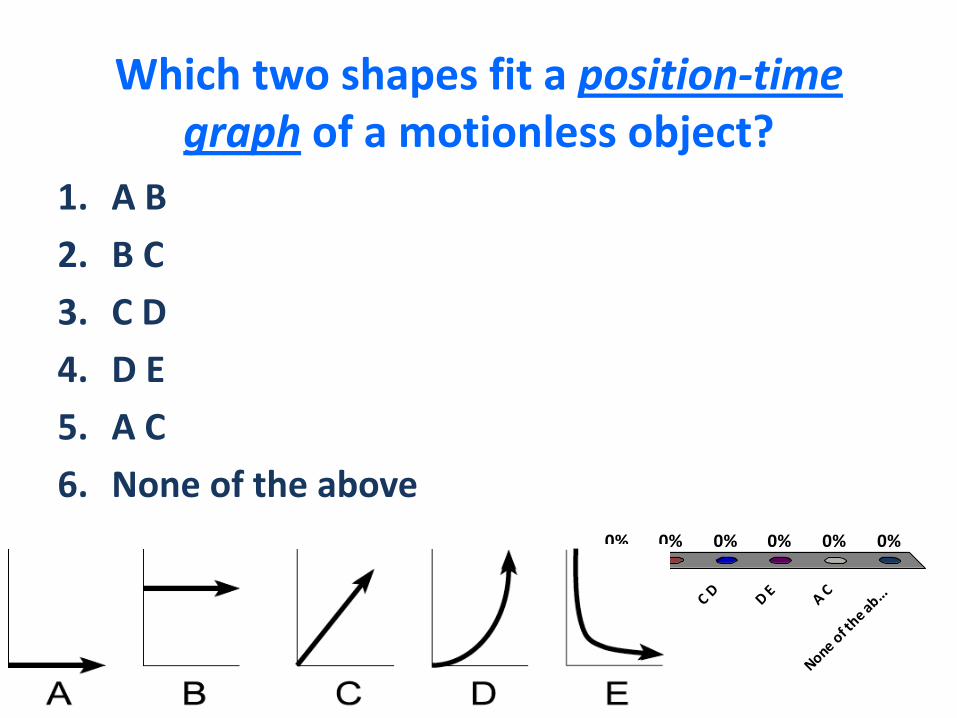
Which two shapes fit a position-time graph of a motionless object?
A B
B C
C D
D E
A C
None o
f the ab...
0% 0% 0%0%0%0%
1. A B
2. B C
3. C D
4. D E
5. A C
6. None of the above

Team Scores
441.67 Team 1
400 Team 2
300 Team 3
300 Team 5
300 Team 4

Which shape fits a velocity-time graph of a motionless object?
A
B
C
D E
Cannot b
e dete
...
0% 0% 0%0%0%0%
1. A
2. B
3. C
4. D
5. E
6. Cannot be determined

Which shape fits a position-time graph of an object that is moving at a steady rate?
A
B
C
D E
Cannot b
e dete
rmin
ed
0% 0% 0%0%0%0%
1. A
2. B
3. C
4. D
5. E
6. Cannot be determined

Which shape fits a velocity time graph of an object that is speeding up at a steady
rate?
A
B
C
D E
Can
not b
e det
erm
ined
0% 0% 0%0%0%0%
1. A
2. B
3. C
4. D
5. E
6. Cannot be determined

Team Scores
975 Team 1
925 Team 2
858.33 Team 5
816.67 Team 4
608.33 Team 3

A woman walks away from a starting position in a straight line. A position-time graph for her motion is shown to the right.
Describe the woman’s motion between 0 and 2 s.
Walk
ing to
the...
Walk
ing to
the...
Walk
ing to
the...
Walk
ing to
the...
Cannot b
e dete
...
0% 0% 0%0%0%
1. Walking to the east at a a constant speed.
2. Walking to the west at a constant speed
3. Walking to the east at an increasing speed
4. Walking to the west at an increasing speed
5. Cannot be determine

Which of the following units is equivalent to (meters per second) per second?
m
m/s
m/s
/s o
r m/s
2
None o
f the ab...
0% 0%0%0%
1. m
2. m/s
3. m/s/s or m/s2
4. None of the above

Which of the following units corresponds to the slope of a position-time graph?
m s
m/s
m/s
2
0% 0%0%0%
1. m
2. s
3. m/s
4. m/s2

Which of the following units corresponds to the slope of a velocity-time graph?
m s
m/s
m/s
2
0% 0%0%0%
1. m
2. s
3. m/s
4. m/s2

Final Team Scores
1350 Team 1
1258.33 Team 2
1198.33 Team 5
1183.33 Team 4
1008.33 Team 3

Pay attention to how much the time intervals are changing as the distance rises in 20m increments.
Distance (m) Time (s)
0 0
20 4.5
40 6.3
60 7.7
80 8.9
100 10

12. Which of the position-time graphs corresponds to the data table?
a b c d
0% 0%0%0%
1. a
2. b
3. c
4. d

13. Which of the following descriptions matches the graph you selected in
question 12?
A m
otionle
ss o
...
An o
bject
movi..
.
An o
bject
unde...
An o
bject
unde...
0% 0%0%0%
1. A motionless object
2. An object moving at a constant speed
3. An object undergoing positive acceleration
4. An object undergoing negative acceleration

14. Which of the following velocity-time graphs corresponds to the data table?
a b c d e
0% 0% 0%0%0%
1. a
2. b
3. c
4. d
5. e

15. Which of the following descriptions matches the graph you selected in
question 14?
A m
otionle
ss o
...
An o
bject
movi..
.
An o
bject
unde...
An o
bject
unde...
0% 0%0%0%
1. A motionless object
2. An object moving at a constant speed
3. An object undergoing positive acceleration
4. An object undergoing negative acceleration

Team Scores
0 Team 1
0 Team 2
0 Team 3
0 Team 4
0 Team 5