Embed Size (px)
Citation preview
Mossyrock Dam/Spillway Piers Toby Brewer
Chief Dam Safety Engineer
Tacoma Power May 17, 2017
AGENDA Overview Background Mossyrock Dam and Spillways Seismicity and Potential Impacts Current Risks Temporary Risk Reduction Methods Approvals and Path Forward Finite Element Modeling Uncertainties Need to Calibrate Models Questions 2
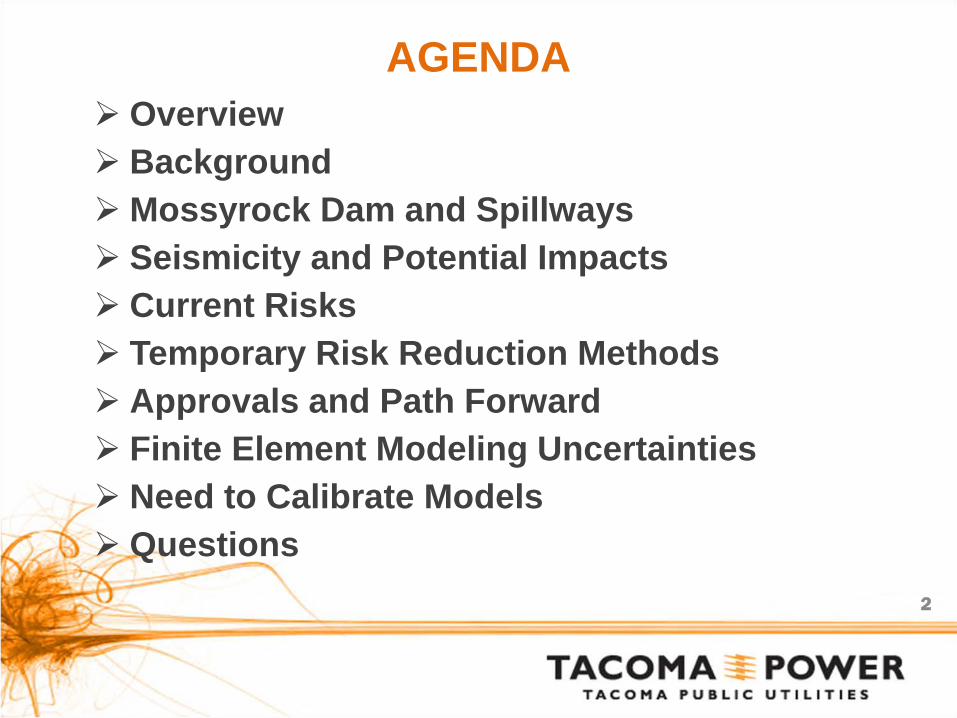
BACKGROUND
3
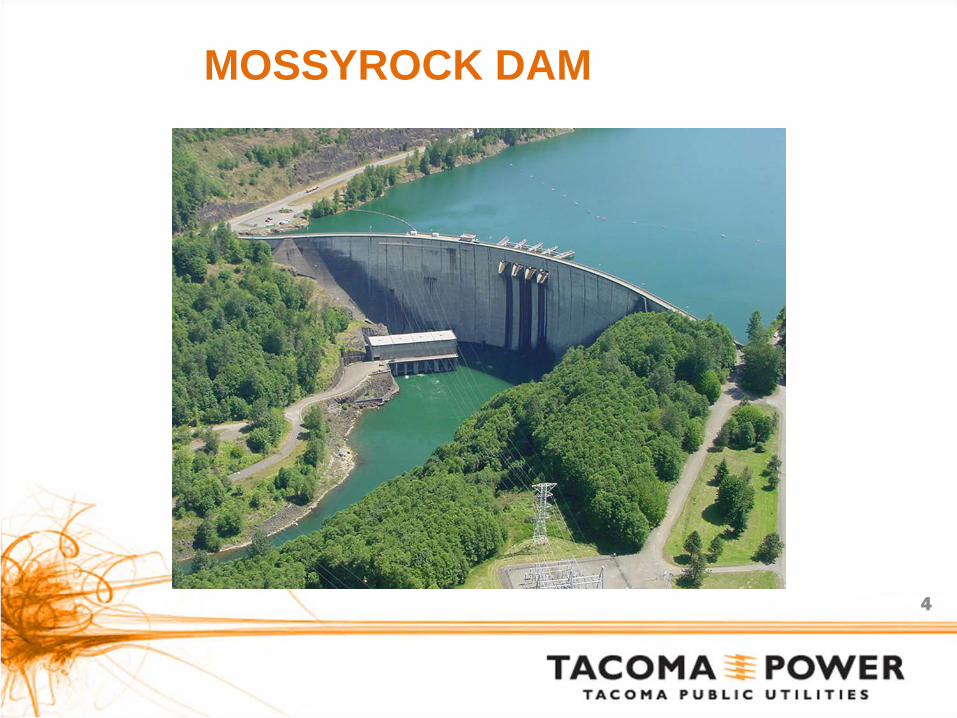
MOSSYROCK DAM
4

MOSSYROCK SPILLWAY PIERS
5
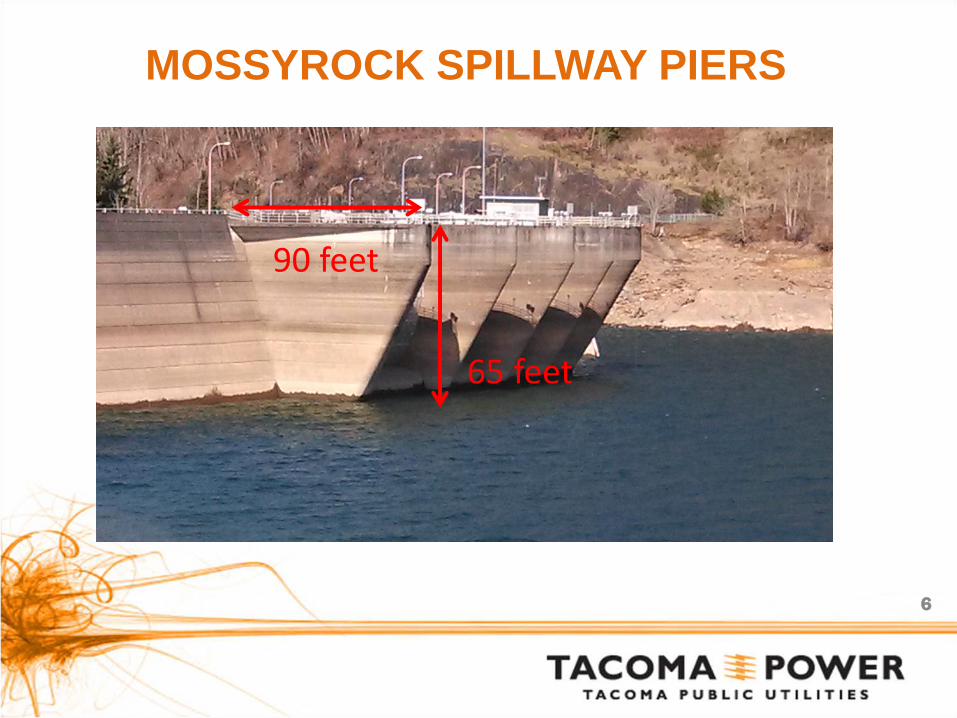
MOSSYROCK SPILLWAY PIERS
65 feet
90 feet
6
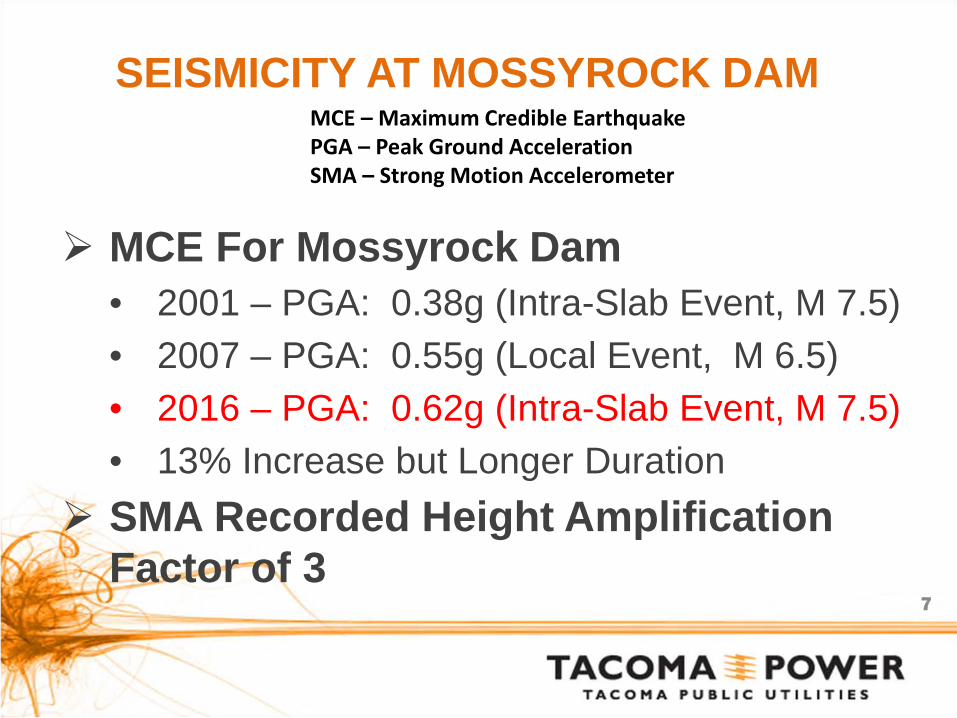
SEISMICITY AT MOSSYROCK DAM
MCE For Mossyrock Dam • 2001 – PGA: 0.38g (Intra-Slab Event, M 7.5) • 2007 – PGA: 0.55g (Local Event, M 6.5) • 2016 – PGA: 0.62g (Intra-Slab Event, M 7.5) • 13% Increase but Longer Duration
SMA Recorded Height Amplification Factor of 3
7
MCE – Maximum Credible Earthquake PGA – Peak Ground Acceleration SMA – Strong Motion Accelerometer
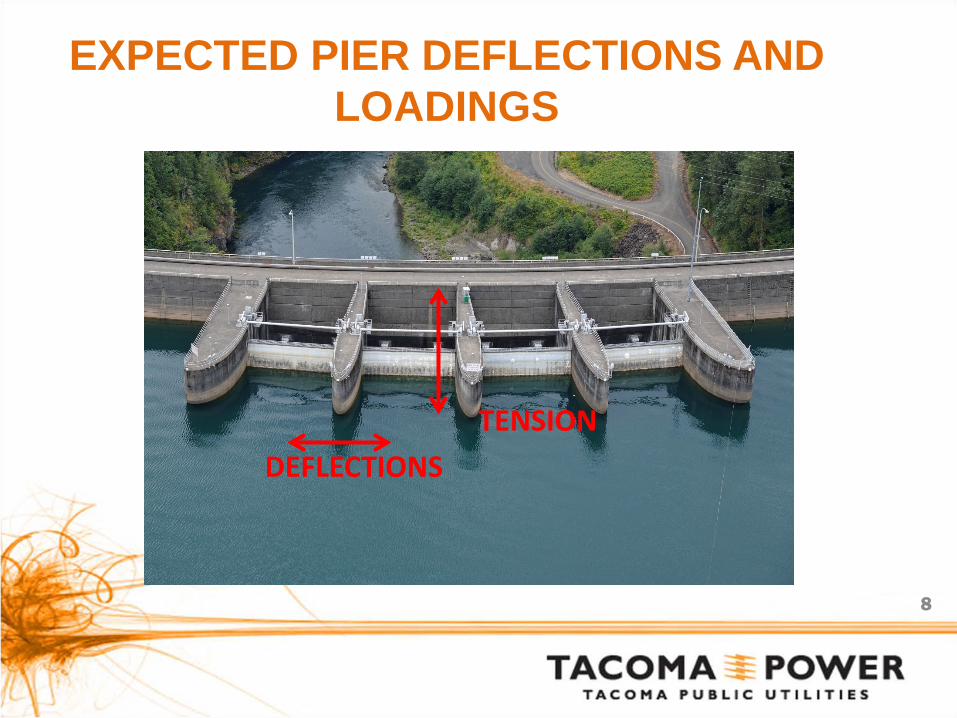
EXPECTED PIER DEFLECTIONS AND LOADINGS
8
TENSION DEFLECTIONS
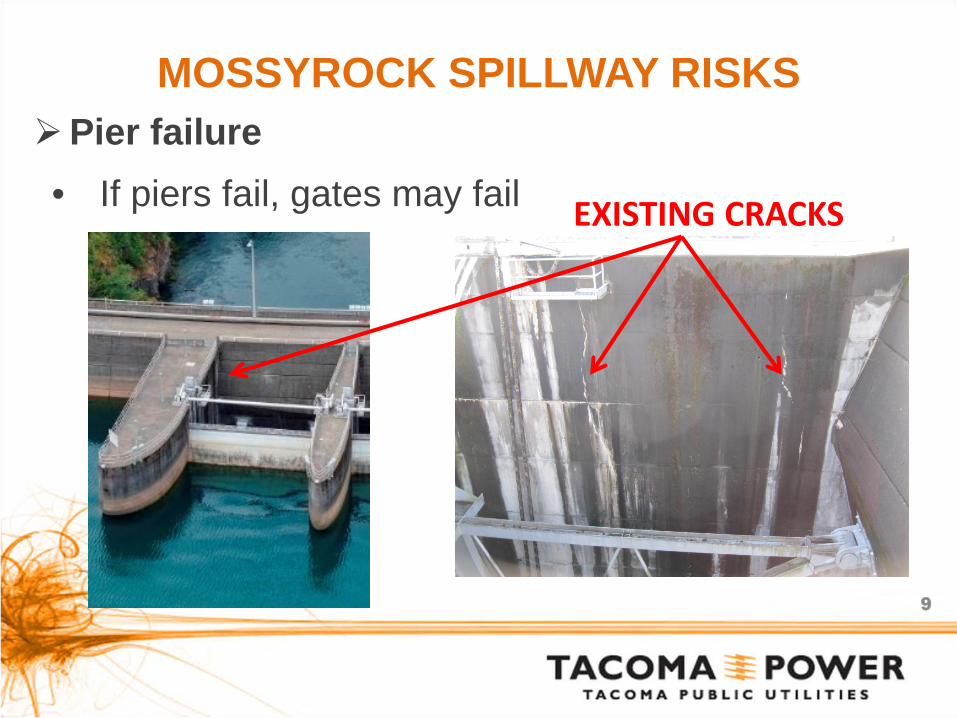
MOSSYROCK SPILLWAY RISKS Pier failure • If piers fail, gates may fail
9
EXISTING CRACKS
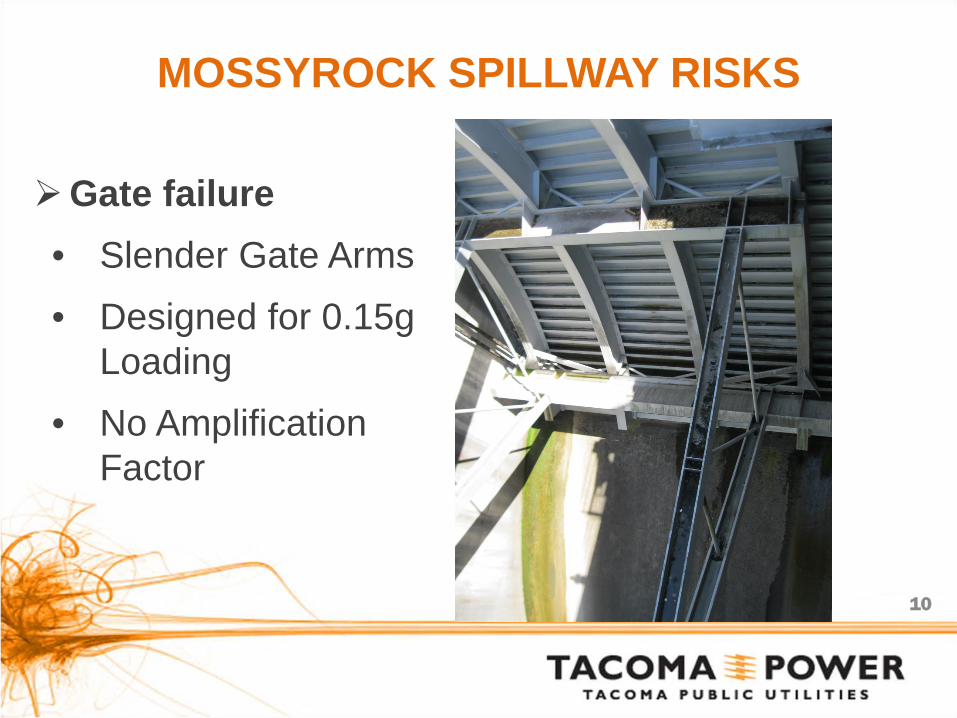
MOSSYROCK SPILLWAY RISKS
Gate failure • Slender Gate Arms • Designed for 0.15g
Loading • No Amplification
Factor
10
CURRENT RISKS If Reservoir is at Full Pool, 778.5 feet
• Release of approximately 230,000 cfs • 1995 Flood of Record was 60,000 cfs • Flooding of Mossyrock Powerhouse • Immediate Opening of Mayfield Spillway (Full) • Flooding of Mayfield Powerhouse • Flooding of Salmon and Trout Hatcheries • Overtopping and Failure of Barrier Dam • Potential Flooding of Toledo, Castle Rock, Kelso
and Longview • Downstream Recreationalist / Anglers
11
RISK REDUCTIONS Modify Flood Control Curve to Maintain
Reservoir Around 749-ft • Allowance for short term storm events (similar to winter rule
curve) • Limits discharge to approximately 60,000 cfs • Limits flooding impacts • Provides short term option – Allows future structural modifications • Recreational and cultural resources impacts
Complete Additional Engineering Analyses • FERC concurrence of the new seismicity • New analyses of the arch, piers and embankment (higher PGA)
12
MODIFIED FLOOD CONTROL - CURVE
Mid-February through Late November • Restrict Maximum Lake Elevation to 749-feet
• Allowance for Short Term Storm Events (similar to winter rule curve of 745-feet)
• If above 749-feet, Full Generation to get the Reservoir Back Down Once Flows in the Lower Valley Subside
• Eliminates the Need to Potentially Flood Homes to Prevent Flooding Homes
• Creates a Slightly Higher Short Term Risk
13
APPROVALS FERC Approved the Plan
• Establish a Board of Consultants
• Coordinate with Local Emergency Management Agencies Review EAP
Revised Inundation Maps
• Submit a Plan to Mitigate Impacts; Recreation
New Mossyrock Park Swim Beach
Modify Mossyrock Park Boat Ramp
Close Some Boat Ramps
Cultural Resources 14
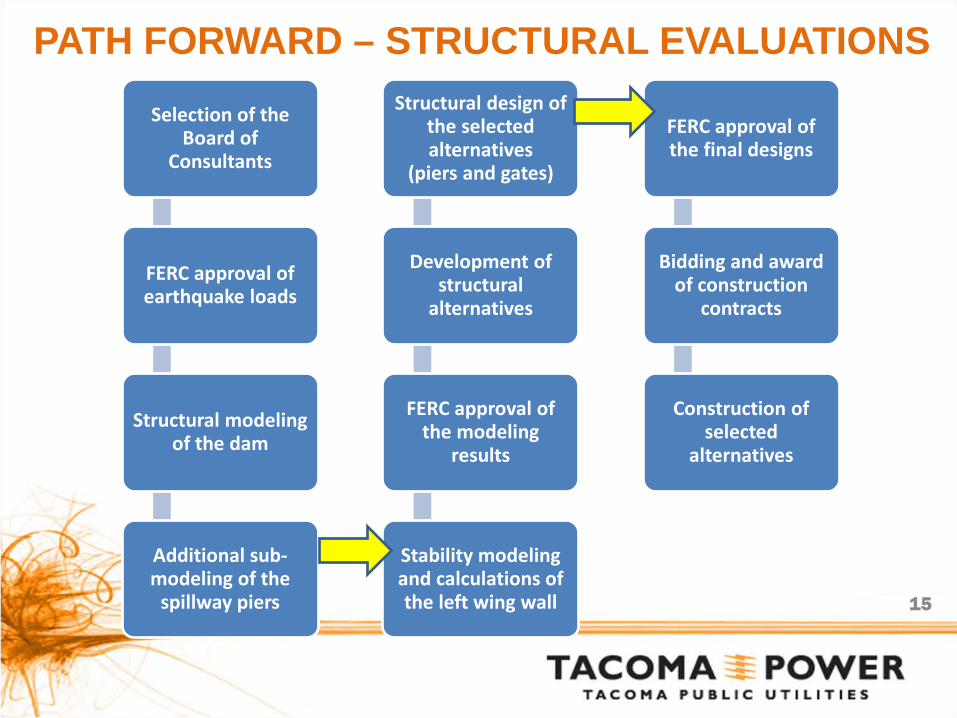
PATH FORWARD – STRUCTURAL EVALUATIONS
Selection of the Board of
Consultants
FERC approval of earthquake loads
Structural modeling of the dam
Additional sub-modeling of the
spillway piers
Stability modeling and calculations of the left wing wall
FERC approval of the modeling
results
Development of structural
alternatives
Structural design of the selected alternatives
(piers and gates)
FERC approval of the final designs
Bidding and award of construction
contracts
Construction of selected
alternatives
15
FINITE ELEMENT MODELING UNCERTAINTIES Finite Element Modeling of the Dams
• Models are Developed Foundations and Rock Types Concrete Properties Reservoir Interaction Assumptions
Seismic Time Histories • In-Stream, Cross-Stream and Vertical Accelerations
Estimated / Predicted Behavior is Determined But the Models Don’t Match Reality
• Limited Seismic Events to Calibrate the Models
16
FINITE ELEMENT MODELING UNCERTAINTIES Computer Models are Predicting Structural
Failures No Concrete Arch Dam has ever Failed due to a
Seismic Event. Why? Is it Because Computer Models are not
Calibrated and are they Overly Conservative? • Foundation Interaction? • Energy Absorption? • Reservoir Interaction?
Or Have We Just Been Lucky?
17
NEED TO CALIBRATE MODELS
Mossyrock Dam • ANSYS Predicted a Crest Amplification Factor of 6 • SMA’s Captured a Seismic Event; Crest
Amplification Factor of 3 • With a Base Acceleration of 0.55g, • The Crest Amplification of 3.3 g went down to 1.6g
Justified the Calibration of the Computer Model
We need More SMA Data
18
NEED TO CALIBRATE MODELS
2016 and 2017 USSD Workshops • Monticello Dam Study
No Predictions Were Correct
• There May be a Need For More Scaled Models But There are Issues with Scaled Models
• SMA Records may Exist but Hesitancy to Share • Are Concrete Numerical Models too Complex? • Are the Structures More Complicated than We Can
Model?
19
NEED TO CALIBRATE MODELS
Association of State Dam Safety Officials • California Division of Safety of Dams Created
Models of Lower Crystal Springs and Pacoima Dams • Used Accelerations from the Loma Prieta (M6.9) and
Northridge (M6.7) earthquakes and they were able to Validate their Models
• Validation / Calibration of the Models is Possible but we Need More SMA Data
20
NEED TO CALIBRATE MODELS
CEATI Dam Safety Interest Group • Seismic Workgroup / Task Force • EDF has SMA data from Japanese Events – But Not the
Structural Details of their Dams • SMA’s Captured a Seismic Event; Crest Amplification
Factor of 3
Actual events could be used to Calibrate and/or Validate the Computer Models
Confidence in the Models will Increase We need More SMA Data
21

QUESTIONS