Embed Size (px)
Citation preview
Prepared by: Leonard E.G. Mboera Benjamin K. Mayala Kesheni P. Senkoro Stephen M. Magesa Andrew Y. Kitua July 2008
Final Report ____________________________________Mosquito net Coverage and Utilisation for Malaria Control in Tanzania
National Institute for Medical Research P.O. Box 9653, Dar es Salaam,Tanzania www.nimr.or.tz
Mosquito net coverage and utilisation for malaria control in Tanzania
Recommended Citation Mboera, L.E.G., Mayala, B.K., Senkoro, K.P., Magesa, S.M., Kitua, A.Y., Temu, M.M., Nkya, T., Kitau, J., Nkya, G.M., Mbilu, T., Manga, C., Kabula, B.I., Emidi, B., Kalinga, A.K., Emmanuel, E. and Kaluwa, B. (2008) Mosquito net Coverage and Utilisation for Malaria Control in Tanzania. National Institute for Medical Research, Dar es Salaam, Tanzania.
National Institute for Medical Research, P.O. Box 9653, Dar es Salaam, Tanzania Website: nimr.or.tz
July 2008
TABLE OF CONTENTS ACKNOWLEDGEMENTS ........................................................................................................................................ i EXECUTIVE SUMMARY ......................................................................................................................................... ii CHAPTER 1: INTRODUCTION...............................................................................................................................1
1.1. Malaria burden in Tanzania ..........................................................................................................................1 1.2. Malaria control strategies...............................................................................................................................1
1.2.1. Mosquito nets ..........................................................................................................................................1
CHAPTER 2: METHODOLOGY ..............................................................................................................................5 2.0. Study area ........................................................................................................................................................5 2.1. Zones.................................................................................................................................................................5
2.1.1. Southern Highlands................................................................................................................................5
2.1.2. Northern Zone .........................................................................................................................................5
2.1.3. Western Zone...........................................................................................................................................6
2.1.4. Lake Victoria Zone ..................................................................................................................................6
2.1.5. Eastern Zone ............................................................................................................................................6
2.1.6. Central Zone ............................................................................................................................................7
2.1.7. Southern Zone .........................................................................................................................................7
2.2. Study design ....................................................................................................................................................7 2.3. Data collection .................................................................................................................................................8 2.4. Data entry and analysis..................................................................................................................................8
CHAPTER 3: RESULTS..............................................................................................................................................9 3.1. Demographic characteristics .........................................................................................................................9 3.2. Household knowledge on malaria transmission and control.................................................................11 3.3. Mosquito net ownership ..............................................................................................................................14
3.3.1. Mosquito net ownership in Northern Zone.......................................................................................15
3.3.2. Mosquito net ownership in Central Zone..........................................................................................16
3.3.3. Mosquito net ownership in Eastern Zone..........................................................................................16
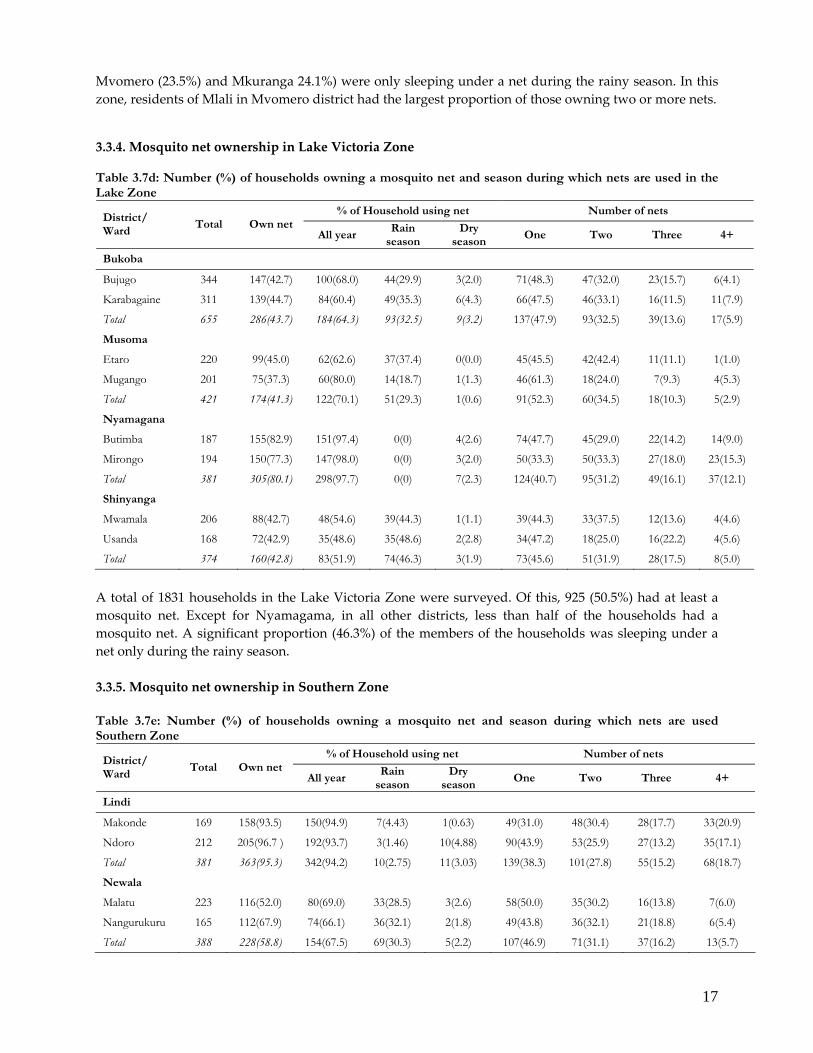
3.3.4. Mosquito net ownership in Lake Victoria Zone ...............................................................................17
3.3.5. Mosquito net ownership in Southern Zone.......................................................................................17
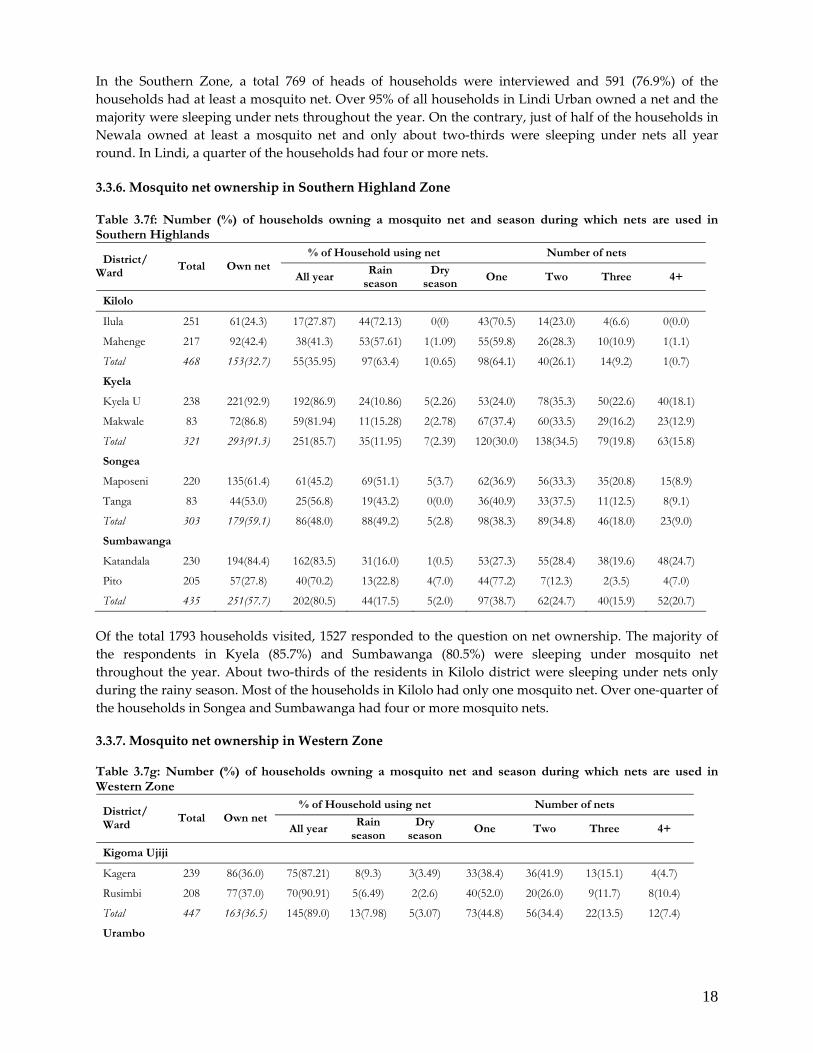
3.3.6. Mosquito net ownership in Southern Highland Zone .....................................................................18
3.3.7. Mosquito net ownership in Western Zone ........................................................................................18
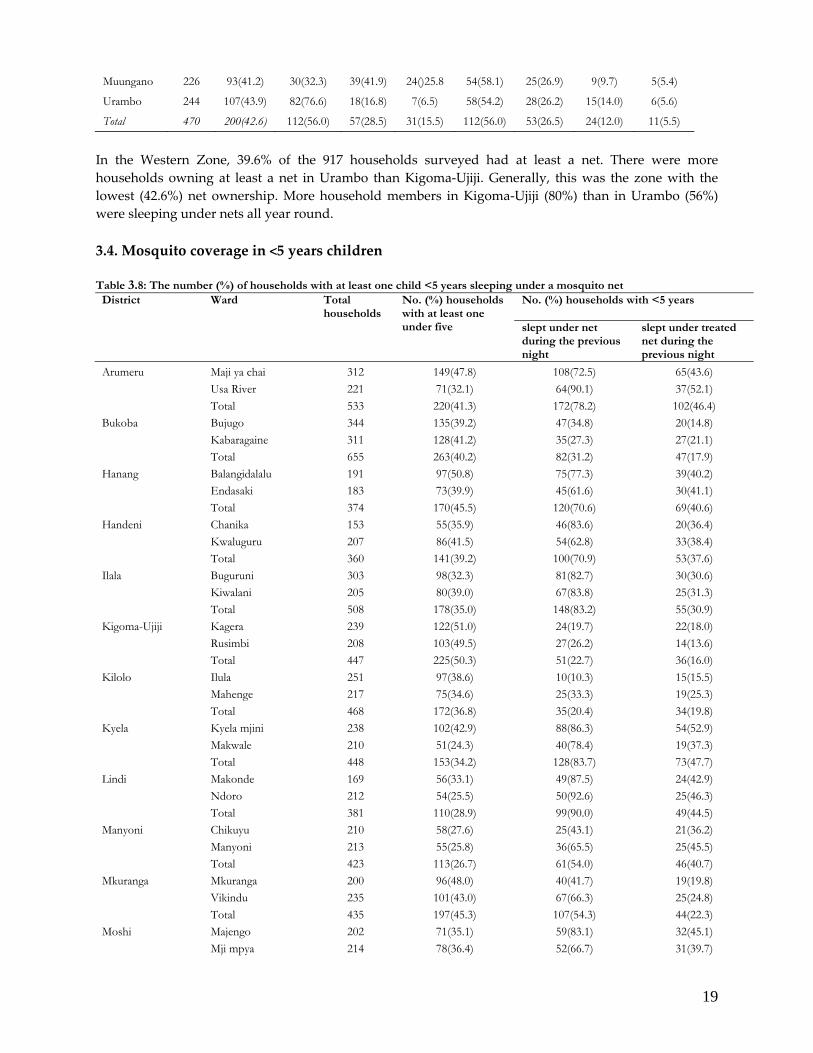
3.4. Mosquito coverage in <5 years children ....................................................................................................19 3.5. Mosquito net ownership and household size ...........................................................................................21 3.6. Insecticide treated nets coverage ................................................................................................................23 3.7. Management of torn nets and preference for indoor residual spray, net colour and shape ..............25
DISCUSSION.............................................................................................................................................................32 REFERENCES............................................................................................................................................................35 APPENDIX: SCHEMATIC PRESENTATION OF MOSQUITO COVERAGE BY DISTRICT ........................38
i
ACKNOWLEDGEMENTS We are very grateful to the Earth Institute at Columbia University, in particular to Prof. Jeff Sachs for his strong support in this project. The United Nations Development Programme (Tanzania) played a great role in the coordination of the financial support. We are indebted to Research Centre Directors for Mwanza, Amani, Tabora and Tukuyu for their enthusiasm and logistic support. We would like to thank the Council Health Management Teams of all study districts for their enthusiasm and participation in this survey. We are grateful to the following individuals for their excellent field assistance and data collection: Dionis Rwegoshora, Aza Kimambo, Jamila Khamisi, Eliapendavyo Msuya, Elias Emmanuel, Eva Mmasy, Haruni Mkinga, Sahani J. Kaboya, Felesiana Rawille, Edward Nsekeli, Enock Anderson, Brayton Mwakyusa, Adam Mwaikonyole, Addow Kibweja, Magdalena Awe, Donald Charles, Scola Mapunda, A. Mapunda, Florence Maholani, Charles Mwesiga, Said Msomoka, Sylivester Msamila, Aden Mwakasitu, Peter Rufutu, Juakali Jumanne, Kusika Mwenula, Lilian Kaiza, Emmanuel Ndunguru, Francis Izengo, Deodadart Ngaiza, Ladislaus Kyeromba, Ruhumbika Karani, Julieth Mawalla, Rodgers Rindeni, Glorious Muhulo, Glory Moshi, Susan Milton, Thomas Mwenyeheri, Amir Shiwari, Juma Shari, Jackson Daniel, Julia Eriyo, James Janyansa and Yahya Gwilla. We are grateful to the heads of households in all districts surveyed for allowing us access to their bedrooms. Thanks to Rodgers Rindeni, Mark Komba, Thomas Mwenyeheri and Fagason Mduma for data entry. This study received financial assistance from Norvartis Stiftung fur Nachhaltige Entwicklung, Basel Switzerland and International Access Process. The National Institute for Medical Research is thanked for the logistic support.
ii
EXECUTIVE SUMMARY _____________________________________________________________________________________________ Background: In recent years malaria parasites have developed resistance to the most commonly used antimalarial drugs in Tanzania, posing a major challenge for its control. This has led to frequent changes of malaria treatment guidelines, more recently to expensive, yet more effective arthemether/lumefantrine. The use of insecticide treated mosquito nets (ITNs) and long lasting nets (LLINs) in Tanzania has increased slowly over the past few years. Despite the introduction of a voucher scheme to the vulnerable groups, the proportion of households with at least an ITN/LLIN in the country has not been able to achieve the Abuja Declaration of 60% net coverage. Statistics available on the utilisation of nets do not provide a good estimate of the coverage, because of the different study design used to collect the information. Objective: This survey was carried out in 21 districts of Tanzania to determine the coverage and utilisation of insecticide treated nets to provide baseline information of the net requirement to cover every sleeping bed in the country. Specifically, this study aimed to (i) determine the ITN coverage by and its distribution in the country; and (ii) determine knowledge, attitudes and practice of the householders as regards to malaria prevention and control Methods: Twenty one districts (one from each region) of Mainland Tanzania were selected for the survey. Selection of the district was random. In each district, two wards were selected, one urban (within the district capital) and one rural or sub‐urban. Households were selected randomly using a table of random numbers. At household level, the head or any adult who represented the head of household was interviewed. A structured pre‐tested questionnaire was used to collect information on knowledge, attitude and practices in malaria control, with emphasis on mosquito net ownership and utilisation. Results: Of the 9549 targeted households, 9166 (96%) participated in the survey. Majority of the respondents (76.8%) were from rural district.The mean household size was 3.9 persons. On average, children <5 years old accounted for 39.3% of the members of the households. Respondents with no formal education accounted for 15.8‐37.4% of the interviewees. Most of them were from Mkuranga (55%), Kigoma‐Ujiji (44.2%) and Newala (37.9%). High literate rates were observed in Arumeru and Moshi districts. The majority of the respondents knew that the mosquito is the vector of the malaria parasite (92.6‐99.4%) and infection is through a mosquito bite (92.7‐99.8%). The knowledge of respondents on malaria transmission was generally high (94.0‐99.0%). The majority of the respondents (95.2%) considered the use of mosquito nets as the most effective way of malaria prevention. However, of these, only 66.7% said to have actually used nets in their life time. Knowledge on the use of mosquito nets in the control of malaria was highest and lowest in Eastern and Central zones, respectively. Seventy‐seven percent (4457/8933) agreed to have the investigator entry into their houses and verify the number of nets owned. On average, 62.9% (5,785/8933) of the households had at least a mosquito net. Majority of the respondents in Northern (76.5%) and Southern (76.5%) zones owned at least a mosquito net. The lowest mosquito net ownership was observed among respondents in Western Zone (39.6%). District‐wise, net ownership was highest in Lindi (94.5%), Kyela (91.3%) Arumeru (86.1%), Ilala (83.1%) and Nyamagana (80.0%). Ownership of net was very low in Kilolo (34.8%), Kigoma (36.5%) and Musoma Rural (41.3%). Of the households with nets, 74.4% were using nets all year round. A larger proportion of respondents in Kilolo (68.5%), Mpwapwa (51.9%), Songea Rural (49.2%) and Shinyanga Rural (46.3%) were only using the nets during the rainy season.
iii
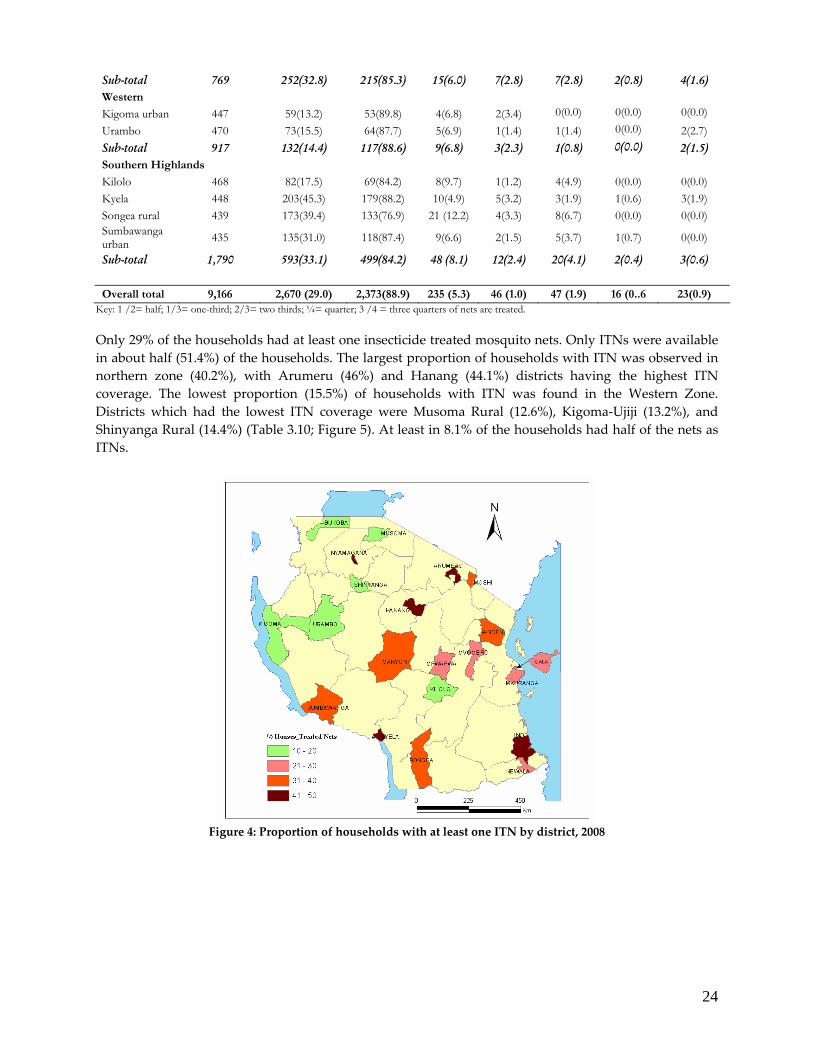
Out of 9,166 households visited, 3,610 (39.3%) had at least one under five child. Of these, in 1,939 (53.7%) of the households the child slept under a mosquito net during the previous night. Use of nets in children <5 years was most common in northern zone (74%); followed by eastern (66.9%) and southern zone (61.1%). Districts with the largest proportion of <5 year children sleeping under a mosquito nets were Lindi (90.0%), Kyela (85.2%), Ilala (83.2%) and Arumeru (78.2%). Only about a quarter (27%) of the children <5% in western zone were sleeping under a mosquito net. Lowest net coverage for <5 year was in Kigoma (22.7%), Kilolo (25%) and Bukoba Rural (31.2%). A total of 5,785 (62.9%) owned at least a mosquito net. Of these, 4,219 and 1,566 were from the rural and urban districts, respectively. More households in the urban districts (73.4%) than rural districts (59.7%) owned at least a mosquito net. Likewise, there were more households (64.9%) in the urban districts with <5years children sleeping under mosquito nets than in the rural districts (50.4%). More households in urban (32.8%) than in rural districts (25.1%) had at least one insecticide treated net. The number of households with mosquito nets enough for all members of the households ranged from 18.9% (in Urambo) to 37.4% (in Hanang). Households with at least 50% or more occupants using mosquito nets ranged from 16.4% (in Urambo) to 42.8% (in Arumeru). Districts with the largest proportion of ≥50% of the household members sleeping under mosquito nets were Arumeru (46.9%) and Lindi (46.7%). In Manyoni and Lindi, 3.1% and 5% of the households were found to have more nets than the number of household occupants. Only 9% (801/9196) of the households had all occupants sleeping under a mosquito net. Kyela district had about a quarter (23.9%) of the households with all occupants sleeping under nets. Only 29% of the households had at least one insecticide treated mosquito nets. All nets in 51.4% of the households surveyed were ITNs. The largest proportion of households with ITN was observed in northern zone (40.2%), with Arumeru (46%) and Hanang (44.1%) districts having the highest ITN coverage. The lowest proportion (15.5%) of households with ITN was found in the Western Zone. Districts which had the lowest ITN coverage were Musoma Rural (12.6%), Kigoma‐Ujiji (13.2%), and Shinyanga Rural (14.4%). On average, 90.7% (8,123/8,953) of the respondents would prefer using ITN than having their house sprayed with long lasting residual insecticide. More households in urban (32.8%) than in rural districts (25.1%) had at least an ITN> A total of 1939 children underfives were sleeping under mosquito net (any type). Of these, 1140 (58.8%) were using insecticide treated nets (ITN). Overall, 31.6% of the underfives slept under an insecticide treated net during the previous night. Highest coverage was reported in Kyela (47.7%), Nyamagana (47.7%) and Arumeru (46.4%). Lowest ITN in underfives was reported in Kigoma‐Ujiji (16.0%), Musoma (17.2%) and Urambo (17.7%). In Songea more underfives children were sleeping under ITN (43.6%) than in untreated nets (40.9%). Control of bedbugs, lice, fleas, mites and cockroaches was the major added advantage of using insecticide treated nets. On average, 30.8% and 19.6% of the respondents mentioned cockroach and bedbug control as the main advantage of using ITN, respectively. The majority (52.9%) preferred blue coloured net (Northern=45.6%; Central=59.2%; Eastern=56.4%; Lake= 54.4%; Southern= 60.3%, Western= 58.5%) and Southern Highlands= 49.1%). Other colour preferences were white (29.6%), green (14.1%), black (2.1%) and pink (1.2%). A strong preference for blue mosquito nets was observed among respondents in Musoma (77.3%) and Newala (75.5%) districts. On the other hand, the weakest preference (24.7%) for blue nets was observed among respondents in Arumeru district. The majority of the respondents (82%) preferred rectangular shaped net. A larger percent (61.8%) the respondents preferred to have the map of Tanzania as a national logo to identify nets distributed in the country.
iv
Conclusion: On average, 62.7% and 28.8% of the households in Tanzania own at least one mosquito net (any type) and insecticide treated net, respectively. Tanzania expects that ITN coverage of under fives in 2009, after the Under Five Catch‐up Campaign is complete, to be at least 80%. If this is to be achieved, there is a need for concerted effort in scaling up the distribution and demand for long lasting nets throughout the country. Moreover, the planned use of IRS in malaria control, currently considered unpopular should be accompanied by rigorous community health education to avoid resistance from household members.
1
CHAPTER 1: INTRODUCTION 1.1. Malaria burden in Tanzania In Tanzania malaria is the leading cause of morbidity and mortality (MoH, 2006). The number of clinical malaria cases per year is estimated to be 17–20 million resulting in approximately 100,000 deaths. The population groups most vulnerable to malaria are children under five years and pregnant women, due to their particular immunity status. However, all age groups are equally susceptible in epidemic prone areas. The disease ranks number one in both outpatient and inpatient statistics. The socio‐economic impact of malaria is so high that it contributes highly to poverty and underdevelopment (Sachs, 2005; Mboera et al., 2007a). Malaria is the single most significant disease in Tanzania affecting the health and welfare of its 38.4 million inhabitants. The climatic conditions are favourable for mosquito breeding almost throughout the country. The transmission is stable perennial to stable seasonal in over 80% of the country and about 20% of the population live in unstable malaria transmission areas that are prone to frequent malaria epidemics. 1.2. Malaria control strategies Malaria control in Tanzania appears difficult, and prospects for a lasting solution have in the past decade diminished with the advent of widespread antimalarial drug resistance (Schönfeld et al. 2007). Antimalarial drug resistance (chloroquine and sulfadoxine pyrimethamine) in the country has led to frequent changes of malaria treatment guidelines, more recently to expensive arthemether/lumefantrine. The just ended Tanzania National Malaria Medium Term Strategic Plan (2002–2007) (MoH, 2002) aimed at reducing the level of malaria to a point where it is neither a major public health problem nor an obstacle to socio‐economic development through four operational and two supportive strategies. These include malaria case management; malaria vector control using insecticide treated mosquito nets (ITN); intermittent preventive treatment of malaria in pregnant mothers; malaria epidemics prevention and control; information, education and communication; and operational research. However, with only a few months until the end of 2007, malaria cases and deaths have been increasing in the country. For instance, deaths attributable to malaria increased from 34.3% in 2003 to 37.3% in 2004 (Mboera et al., 2007a). At the end of 2007, community access to prompt antimalarial treatment within 24 hours was very low and less than one third of the total clinical cases of malaria were confirmed by laboratory tests. An evaluation of the previous strategic plan has also indicated that coverage of ITN was below 60%; coverage for intermittent preventive treatment of malaria in pregnancy (IPTp) was only 31% for IPTp2; early detection and response to malaria epidemic is weak and malaria communication strategy was never implemented. In its current Medium Term Strategic Plan (2008‐2013), the National Malaria Control Programme goal is to reduce malaria by 80%, by the end of 2013 from the current morbidity (18 million cases) and mortality (80,000 deaths) levels. The goal is to be attained through the implementation of five strategies which include (i) malaria diagnosis and treatment; (ii) malaria prevention; (iii) monitoring, evaluation and surveillance; (iv) behavioural change communication and community based malaria control; and (v) regional/district support and capacity building (MoH, 2008). 1.2.1. Mosquito nets The armies of Russia, Germany and United States were the first to use insecticide impregnated nets in the protection against mosquito bites during the World War II. Later, researches carried on the use of various insecticide treated nets (ITNs) in Burkina Faso during the mid 1970s. Pyrethroid insecticides were later
2
employed in treating nets during the 1980s under experimental conditions. In 1984, the first community‐based experiments on the use of insecticide treated nets were initiated in Mali, and later in 1986 in Tanzania. The critical path of ITN research and implementation in Tanzania is summarised in Table 1.1. Table 1.1: Critical path of insecticide treated mosquito nets research and implementation in Tanzania 1983‐1995 1985‐1995 1992‐2000 1997‐2000 2000‐2008 Efficacy studies Effectiveness
studies Policy developments
Going to scale
Reducing malaria vector exposure (including net and insecticide developments)
Reducing malaria morbidity and mortality
Impact (morbidity and mortality) and cost assessment in pilot programmes
National strategies and partnerships for an enabling environment
National ITN strategy and policy NATNETS
Re‐thinking of ITN national policy on possible free net coverage of all sleeping beds?
Source: Modified after Magesa et al. 2005
Since mid 1980s, much work has taken place on ITNs in Tanzania. A number of research institutions, donor agencies, non‐governmental organizations, net manufacturers, the private and public agencies have been closely involved in the improvement of this tool and preparing ground for national scale expansion. Initially, a number of studies on ITNs focused on its entomological efficacy. This was followed by initial work on a number of small scale trials to demonstrate epidemiological impact under controlled conditions (efficacy trials) (Lines et al., 1987; Magesa et al., 1991; Curtis et al., 1996; Maxwell et al. 1999) . Subsequently, the emphasis was put on larger trials and exploring community‐wide benefits of ITNs on both morbidity and mortality (Schellenberg et al. 2001; Abdulla et al., 2001; Marchant et al., 2002). Accessibility and distribution of net occupied much of the researches activities during the late 1990s (Njunwa et al., 1991; Makemba et al., 1996; Fraser‐Hurt & Lyimo, 1998). Studies on community‐based net distribution and socio‐marketing formed the largest part of the studies during this period. Other studies included the design and testing of insecticide home treatment kits (Miller et al., 1999a,b) and factors influencing net re‐treatment among Tanzania communities. In recent years, most work concentrated on the efficacy and introduction of long‐lasting insecticide treated nets (Tami et al., 2004; Malima et al., 2008). Insecticide‐treated nets (ITNs) are a powerful public health tool in the fight against malaria. Regular use by young children can reduce their overall risk of mortality by over 20% and the number of clinical malaria episodes by 50%. An ITN consists of an untreated net and an insecticide treatment kit. This type of net requires regular re‐treatment. However, retreatement rate in Tanzania has remained low over the years. Long‐lasting insecticidal nets (LLINs) have been developed in response to the low re‐treatment rates of conventional insecticide‐treated nets. A long‐lasting net is a ready‐to‐use pre‐treated mosquito net, which requires no further treatment during its expected life span. Tanzania has advanced considerably in the implementation of social marketing of insecticide treated nets. This strategy has been developed through various studies and is currently being implemented at a nation‐wide scale. To scale up ITN, the government is currently, spearheading the so‐called voucher scheme strategy, which harnesses the strength of the private sector to distribute highly subsidised ITNs/LLINs throughout the country (Magesa et al., 2005). However, the programme specifically targets pregnant women and their infants while ensuring long‐term and widespread commercial availability. Unfortunately, the coverage of the population with this scheme is likely to be very low. To‐date, the programme has not reached the whole country and ITN coverage therefore, remains very low. The approach is yet facing some a number of challenges including the fact that the targeted pregnant women
3
have little decision whether to purchase a net or not in a patriarchal cultural structure that is common in Tanzania. Other obstacles within this approach include the fact that women attend antenatal care clinics (ANC) too late (week 20 on average) to achieve the desired target. The 60% coverage of pregnant women will not be achieved unless women can be persuaded to attend ANC much earlier in their pregnancy. The scaling up of net distribution in Tanzania has been enhanced by public‐private partnership policy. A close collaboration among the public, private and non‐governmental organization (NGO) was advocated around the issue of demand creation and increased supply and use of ITNs. In this scenario, the public sector role is focusing on consumer protection, policy and regulatory issues, as well as generic demand creation, in order to create and ITN‐enabling environment. The NGO role focuses on more local, grass‐root demand creation and support for specific niche supply. The commercial sector role focuses on supply and distribution, product development, and brand‐specific demand creation (Magesa et al., 2005). All these are supported by the research community (public and private) in product development, operations research, market research, and monitoring and evaluation. Public‐private partnership has played a great role in the promotion and distribution of mosquito nets in Tanzania. For instance, the National Insecticide Treated Nets (NATNETS) was formed in July 2002 as a steering committee to implement the scaling up of ITN strategies through promotion of ITN use by making nets available, accessible and acceptable. This body is made up of Tanzanian Government Departments, Non‐governmental organizations and development partners. Despite the rigorous social marketing and voucher scheme strategies that have been highly publicized in Tanzania, the ITN coverage in most rural areas remain extremely low. The use of ITNs/LLINs in Tanzania has increased markedly over the past few years. Statistics indicate that the proportion of households with at least one untreated net has increased from 14% in 2001 to 57% in 2006. On the other hand, the proportion of households with at least an ITN has increased from 14% in 2001 to 28.9% in 2006. However, the use of ITN in the underfives has remained lower in rural areas (14%), than in the peri‐urban (25%) or urban areas (28%) (Mboera et al., 2007a). The low ITN coverage has mostly been attributed to low re‐treatment rates. With this kind of scenario, the targeted 60% ITN coverage of the population in malaria endemic areas of the country is unlikely to be reached in the foreseeable future. While the socio‐marketing and voucher scheme strategies have increased the coverage substantially, there is concern that they may not result into substantial impact on the malaria morbidity and mortality. Currently, data coming from studies elsewhere in Africa have shown that a high level of ITN coverage and use can easily be achieved and sustained by sequential community based campaigns through mass, free distribution (catch‐up) and keep‐up strategies, accompanied by strong IEC/BCC to beneficiary communities. The Government of Tanzania needs to review its strategy in malaria control through the distribution modalities of ITN/LLIN. The goal of the proposed NMCP strategic plan (2008‐2013) is to reduce the burden of Malaria by 80% by the end of 2012 from current levels. In order to fill the gaps in the requirements of ITN/LLIN, this study was proposed in order to determine net coverage and utilization in selected districts of Tanzania. It is important therefore to determine the actual ITN/LLIN coverage and utilisation to provide adequate baseline data for a proposed scaling‐up exercise. The objective of this study was to determine mosquito net coverage and utilisation in Tanzania. Specifically, to determine the mosquito net coverage in selected 21 districts spread out in 21 regions of the country; and to explore knowledge, attitudes and practice of the household as regards to malaria prevention and control.
4
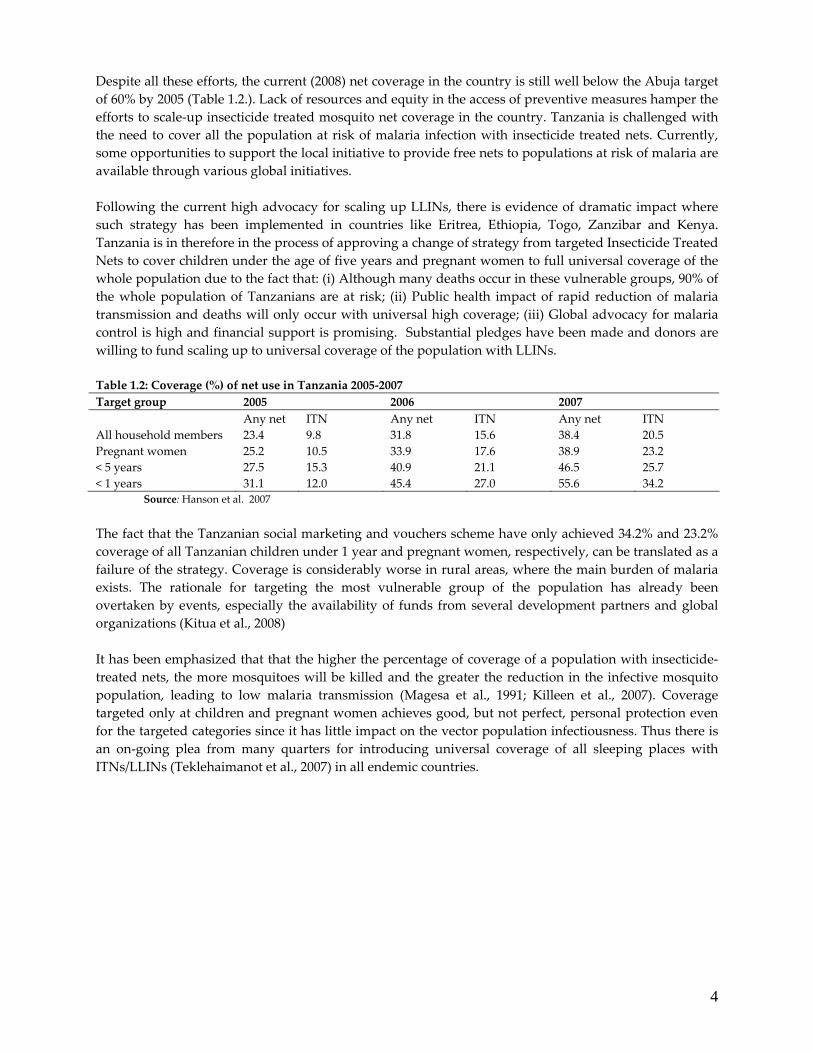
Despite all these efforts, the current (2008) net coverage in the country is still well below the Abuja target of 60% by 2005 (Table 1.2.). Lack of resources and equity in the access of preventive measures hamper the efforts to scale‐up insecticide treated mosquito net coverage in the country. Tanzania is challenged with the need to cover all the population at risk of malaria infection with insecticide treated nets. Currently, some opportunities to support the local initiative to provide free nets to populations at risk of malaria are available through various global initiatives. Following the current high advocacy for scaling up LLINs, there is evidence of dramatic impact where such strategy has been implemented in countries like Eritrea, Ethiopia, Togo, Zanzibar and Kenya. Tanzania is in therefore in the process of approving a change of strategy from targeted Insecticide Treated Nets to cover children under the age of five years and pregnant women to full universal coverage of the whole population due to the fact that: (i) Although many deaths occur in these vulnerable groups, 90% of the whole population of Tanzanians are at risk; (ii) Public health impact of rapid reduction of malaria transmission and deaths will only occur with universal high coverage; (iii) Global advocacy for malaria control is high and financial support is promising. Substantial pledges have been made and donors are willing to fund scaling up to universal coverage of the population with LLINs. Table 1.2: Coverage (%) of net use in Tanzania 2005‐2007 Target group 2005 2006 2007 Any net ITN Any net ITN Any net ITN All household members 23.4 9.8 31.8 15.6 38.4 20.5 Pregnant women 25.2 10.5 33.9 17.6 38.9 23.2 < 5 years 27.5 15.3 40.9 21.1 46.5 25.7 < 1 years 31.1 12.0 45.4 27.0 55.6 34.2
Source: Hanson et al. 2007 The fact that the Tanzanian social marketing and vouchers scheme have only achieved 34.2% and 23.2% coverage of all Tanzanian children under 1 year and pregnant women, respectively, can be translated as a failure of the strategy. Coverage is considerably worse in rural areas, where the main burden of malaria exists. The rationale for targeting the most vulnerable group of the population has already been overtaken by events, especially the availability of funds from several development partners and global organizations (Kitua et al., 2008) It has been emphasized that that the higher the percentage of coverage of a population with insecticide‐treated nets, the more mosquitoes will be killed and the greater the reduction in the infective mosquito population, leading to low malaria transmission (Magesa et al., 1991; Killeen et al., 2007). Coverage targeted only at children and pregnant women achieves good, but not perfect, personal protection even for the targeted categories since it has little impact on the vector population infectiousness. Thus there is an on‐going plea from many quarters for introducing universal coverage of all sleeping places with ITNs/LLINs (Teklehaimanot et al., 2007) in all endemic countries.
5
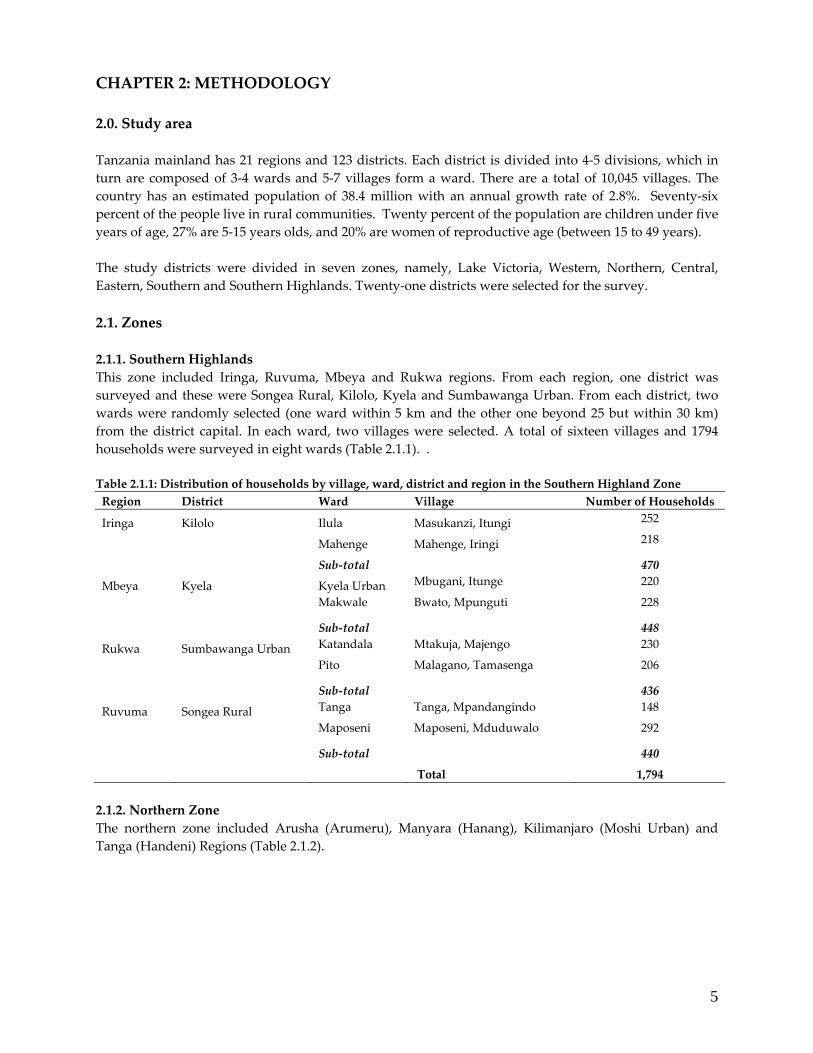
CHAPTER 2: METHODOLOGY 2.0. Study area Tanzania mainland has 21 regions and 123 districts. Each district is divided into 4‐5 divisions, which in turn are composed of 3‐4 wards and 5‐7 villages form a ward. There are a total of 10,045 villages. The country has an estimated population of 38.4 million with an annual growth rate of 2.8%. Seventy‐six percent of the people live in rural communities. Twenty percent of the population are children under five years of age, 27% are 5‐15 years olds, and 20% are women of reproductive age (between 15 to 49 years). The study districts were divided in seven zones, namely, Lake Victoria, Western, Northern, Central, Eastern, Southern and Southern Highlands. Twenty‐one districts were selected for the survey. 2.1. Zones 2.1.1. Southern Highlands This zone included Iringa, Ruvuma, Mbeya and Rukwa regions. From each region, one district was surveyed and these were Songea Rural, Kilolo, Kyela and Sumbawanga Urban. From each district, two wards were randomly selected (one ward within 5 km and the other one beyond 25 but within 30 km) from the district capital. In each ward, two villages were selected. A total of sixteen villages and 1794 households were surveyed in eight wards (Table 2.1.1). . Table 2.1.1: Distribution of households by village, ward, district and region in the Southern Highland Zone Region District Ward Village Number of Households
Iringa Kilolo Ilula Masukanzi, Itungi 252
Mahenge Mahenge, Iringi 218
Sub‐total 470
Mbeya Kyela Kyela Urban Mbugani, Itunge 220
Makwale Bwato, Mpunguti 228
Sub‐total 448
Rukwa Sumbawanga Urban Katandala Mtakuja, Majengo 230
Pito Malagano, Tamasenga 206
Sub‐total 436
Ruvuma Songea Rural Tanga Tanga, Mpandangindo 148
Maposeni Maposeni, Mduduwalo 292
Sub‐total 440
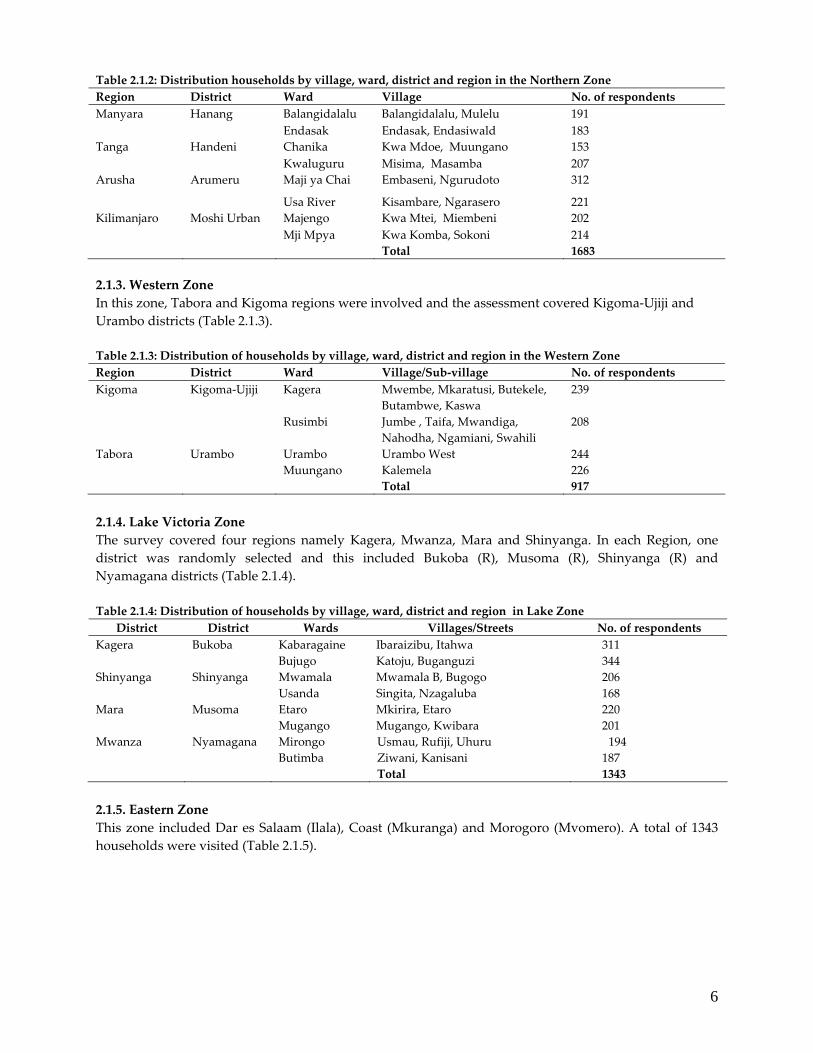
Total 1,794 2.1.2. Northern Zone The northern zone included Arusha (Arumeru), Manyara (Hanang), Kilimanjaro (Moshi Urban) and Tanga (Handeni) Regions (Table 2.1.2).
6
Table 2.1.2: Distribution households by village, ward, district and region in the Northern Zone Region District Ward Village No. of respondents
Hanang Balangidalalu Balangidalalu, Mulelu 191 Manyara Endasak Endasak, Endasiwald 183 Handeni Chanika Kwa Mdoe, Muungano 153 Tanga Kwaluguru Misima, Masamba 207 Arumeru Maji ya Chai Embaseni, Ngurudoto 312 Arusha
Usa River Kisambare, Ngarasero 221 Moshi Urban Majengo Kwa Mtei, Miembeni 202 Kilimanjaro Mji Mpya Kwa Komba, Sokoni 214
Total 1683 2.1.3. Western Zone In this zone, Tabora and Kigoma regions were involved and the assessment covered Kigoma‐Ujiji and Urambo districts (Table 2.1.3). Table 2.1.3: Distribution of households by village, ward, district and region in the Western Zone Region District Ward Village/Sub‐village No. of respondents Kigoma Kigoma‐Ujiji Kagera Mwembe, Mkaratusi, Butekele,
Butambwe, Kaswa 239
Rusimbi Jumbe , Taifa, Mwandiga, Nahodha, Ngamiani, Swahili
208
Tabora Urambo Urambo Urambo West 244 Muungano Kalemela 226 Total 917 2.1.4. Lake Victoria Zone The survey covered four regions namely Kagera, Mwanza, Mara and Shinyanga. In each Region, one district was randomly selected and this included Bukoba (R), Musoma (R), Shinyanga (R) and Nyamagana districts (Table 2.1.4). Table 2.1.4: Distribution of households by village, ward, district and region in Lake Zone
District District Wards Villages/Streets No. of respondents Kabaragaine Ibaraizibu, Itahwa 311 Kagera Bukoba Bujugo Katoju, Buganguzi 344 Mwamala Mwamala B, Bugogo 206 Shinyanga Shinyanga Usanda Singita, Nzagaluba 168 Etaro Mkirira, Etaro 220 Mara Musoma Mugango Mugango, Kwibara 201 Mirongo Usmau, Rufiji, Uhuru 194 Mwanza Nyamagana Butimba Ziwani, Kanisani 187
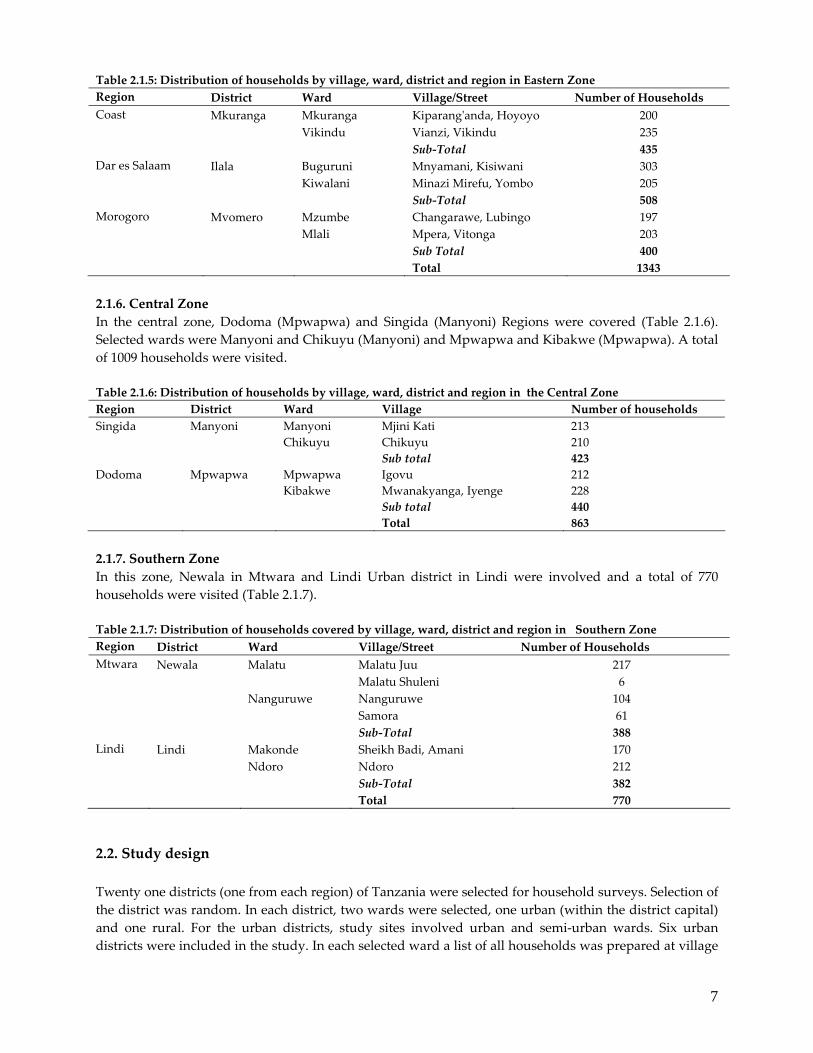
Total 1343 2.1.5. Eastern Zone This zone included Dar es Salaam (Ilala), Coast (Mkuranga) and Morogoro (Mvomero). A total of 1343 households were visited (Table 2.1.5).
7
Table 2.1.5: Distribution of households by village, ward, district and region in Eastern Zone Region District Ward Village/Street Number of Households Coast Mkuranga Mkuranga Kiparangʹanda, Hoyoyo 200 Vikindu Vianzi, Vikindu 235 Sub‐Total 435 Dar es Salaam Ilala Buguruni Mnyamani, Kisiwani 303 Kiwalani Minazi Mirefu, Yombo 205 Sub‐Total 508 Morogoro Mvomero Mzumbe Changarawe, Lubingo 197 Mlali Mpera, Vitonga 203 Sub Total 400 Total 1343 2.1.6. Central Zone In the central zone, Dodoma (Mpwapwa) and Singida (Manyoni) Regions were covered (Table 2.1.6). Selected wards were Manyoni and Chikuyu (Manyoni) and Mpwapwa and Kibakwe (Mpwapwa). A total of 1009 households were visited. Table 2.1.6: Distribution of households by village, ward, district and region in the Central Zone Region District Ward Village Number of households Singida Manyoni Manyoni Mjini Kati 213 Chikuyu Chikuyu 210 Sub total 423 Dodoma Mpwapwa Mpwapwa Igovu 212 Kibakwe Mwanakyanga, Iyenge 228 Sub total 440 Total 863 2.1.7. Southern Zone In this zone, Newala in Mtwara and Lindi Urban district in Lindi were involved and a total of 770 households were visited (Table 2.1.7). Table 2.1.7: Distribution of households covered by village, ward, district and region in Southern Zone Region District Ward Village/Street Number of Households Mtwara Newala Malatu Malatu Juu 217 Malatu Shuleni 6 Nanguruwe Nanguruwe 104 Samora 61 Sub‐Total 388 Lindi Lindi Makonde Sheikh Badi, Amani 170 Ndoro Ndoro 212 Sub‐Total 382 Total 770 2.2. Study design Twenty one districts (one from each region) of Tanzania were selected for household surveys. Selection of the district was random. In each district, two wards were selected, one urban (within the district capital) and one rural. For the urban districts, study sites involved urban and semi‐urban wards. Six urban districts were included in the study. In each selected ward a list of all households was prepared at village
8
level. Households were selected randomly using a table of random numbers. The household head or in his/her absence, any other adult in the household who could be relied upon was interviewed using a structured pre‐tested questionnaire. The data collectors were trained beforehand. In each district, a member or two of the Council Health Management Team participated in the survey. After a courtesy call to respective district, ward and village authorities, each member of the research team was accompanied by the Sub‐Village (Kitongoji) leader. A house to house visit was made whereby the Sub‐villager leader introduced the researcher to the householders. 2.3. Data collection A structured pre‐tested questionnaire was used to collect information on knowledge, attitudes and practices in malaria control. The geographicla location of the household, health facility and village centre was determined using a hand held Geographical Positioning System. Information sought from the households included sex, marital status and education of the respondent and family size. Household knowledge, attitudes and practices as regards to malaria transmission and control were explored. Information included number of mosquito net(s), number of those who sleeps under a net, whether the net was treated or not during the last six months and what do the householders do when a net gets torn. Other information sought was on respondent’s preference for shape and colour of the net, and preference of ITN versus indoor residual spraying. For each respondent who had a net, a request was made to examine the net. 2.4. Data entry and analysis Data were double entered using EPIDATA software version 3.1 (EpiData Association 2000‐2008). Data cleaning including consistence and range checks were performed before the database transferred to STATA version 6 statistical package (STATA Corp 2001) for further analysis. Descriptive statistic technique was used to describe and summarize data. Specifically, a univariate analysis was employed to explore characteristics of variables of interest. These included exploring the central tendency (frequencies, means, ranges, etc) to describe the pattern of response of values.
9
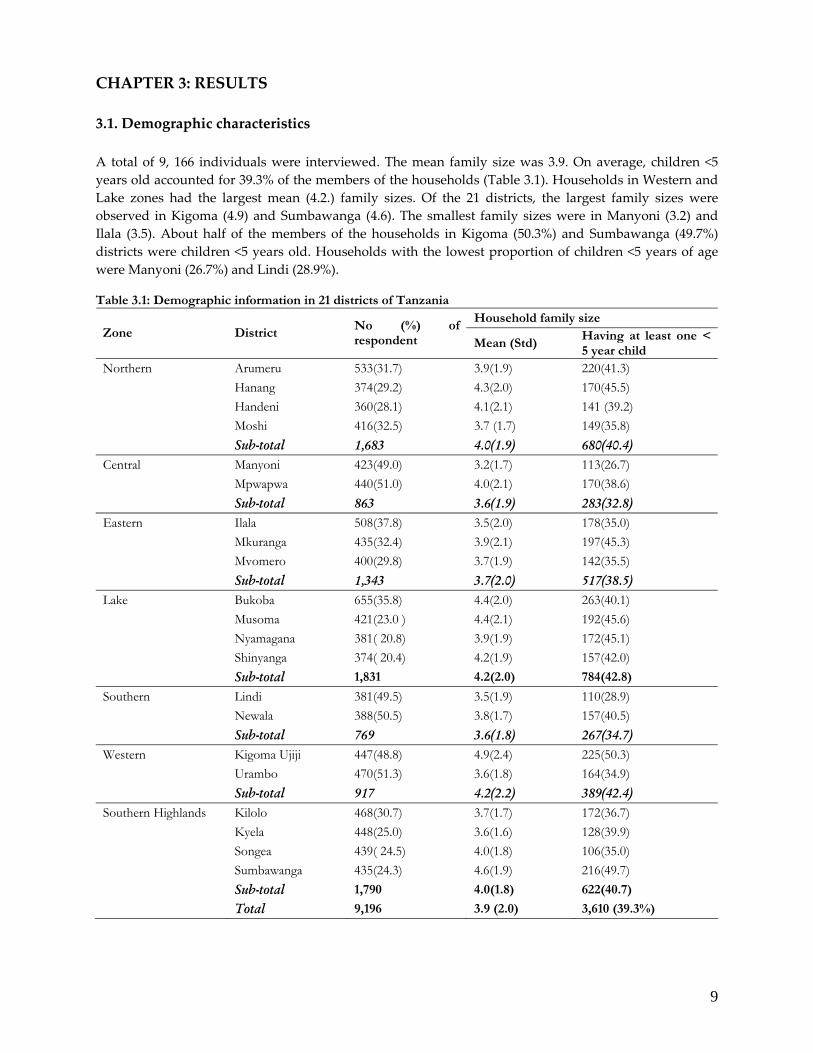
CHAPTER 3: RESULTS 3.1. Demographic characteristics A total of 9, 166 individuals were interviewed. The mean family size was 3.9. On average, children <5 years old accounted for 39.3% of the members of the households (Table 3.1). Households in Western and Lake zones had the largest mean (4.2.) family sizes. Of the 21 districts, the largest family sizes were observed in Kigoma (4.9) and Sumbawanga (4.6). The smallest family sizes were in Manyoni (3.2) and Ilala (3.5). About half of the members of the households in Kigoma (50.3%) and Sumbawanga (49.7%) districts were children <5 years old. Households with the lowest proportion of children <5 years of age were Manyoni (26.7%) and Lindi (28.9%). Table 3.1: Demographic information in 21 districts of Tanzania
Household family size Zone District
No (%) of respondent Mean (Std)
Having at least one < 5 year child
Northern Arumeru 533(31.7) 3.9(1.9) 220(41.3) Hanang 374(29.2) 4.3(2.0) 170(45.5) Handeni 360(28.1) 4.1(2.1) 141 (39.2) Moshi 416(32.5) 3.7 (1.7) 149(35.8) Sub-total 1,683 4.0(1.9) 680(40.4) Central Manyoni 423(49.0) 3.2(1.7) 113(26.7) Mpwapwa 440(51.0) 4.0(2.1) 170(38.6) Sub-total 863 3.6(1.9) 283(32.8) Eastern Ilala 508(37.8) 3.5(2.0) 178(35.0) Mkuranga 435(32.4) 3.9(2.1) 197(45.3) Mvomero 400(29.8) 3.7(1.9) 142(35.5) Sub-total 1,343 3.7(2.0) 517(38.5) Lake Bukoba 655(35.8) 4.4(2.0) 263(40.1) Musoma 421(23.0 ) 4.4(2.1) 192(45.6) Nyamagana 381( 20.8) 3.9(1.9) 172(45.1) Shinyanga 374( 20.4) 4.2(1.9) 157(42.0) Sub-total 1,831 4.2(2.0) 784(42.8)
Southern Lindi 381(49.5) 3.5(1.9) 110(28.9) Newala 388(50.5) 3.8(1.7) 157(40.5) Sub-total 769 3.6(1.8) 267(34.7) Western Kigoma Ujiji 447(48.8) 4.9(2.4) 225(50.3) Urambo 470(51.3) 3.6(1.8) 164(34.9) Sub-total 917 4.2(2.2) 389(42.4) Southern Highlands Kilolo 468(30.7) 3.7(1.7) 172(36.7) Kyela 448(25.0) 3.6(1.6) 128(39.9) Songea 439( 24.5) 4.0(1.8) 106(35.0) Sumbawanga 435(24.3) 4.6(1.9) 216(49.7) Sub-total 1,790 4.0(1.8) 622(40.7)
Total 9,196 3.9 (2.0) 3,610 (39.3%)
10
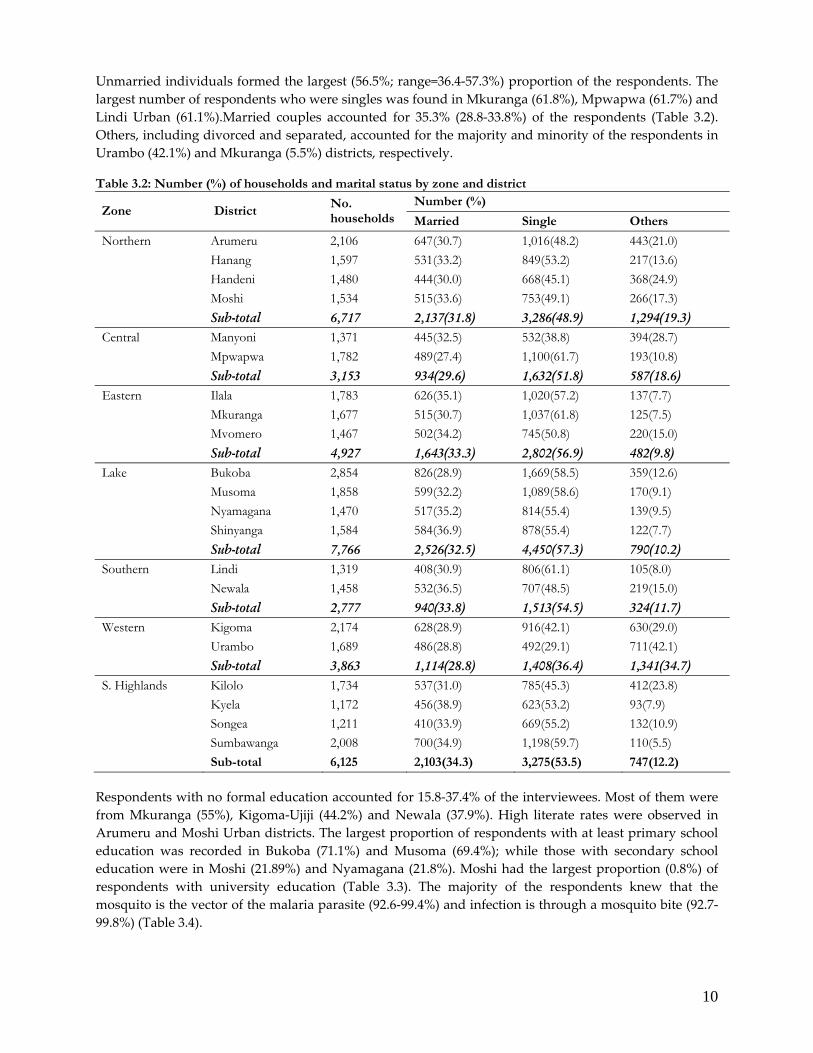
Unmarried individuals formed the largest (56.5%; range=36.4‐57.3%) proportion of the respondents. The largest number of respondents who were singles was found in Mkuranga (61.8%), Mpwapwa (61.7%) and Lindi Urban (61.1%).Married couples accounted for 35.3% (28.8‐33.8%) of the respondents (Table 3.2). Others, including divorced and separated, accounted for the majority and minority of the respondents in Urambo (42.1%) and Mkuranga (5.5%) districts, respectively. Table 3.2: Number (%) of households and marital status by zone and district
Number (%) Zone District
No. households Married Single Others
Northern Arumeru 2,106 647(30.7) 1,016(48.2) 443(21.0) Hanang 1,597 531(33.2) 849(53.2) 217(13.6) Handeni 1,480 444(30.0) 668(45.1) 368(24.9) Moshi 1,534 515(33.6) 753(49.1) 266(17.3) Sub-total 6,717 2,137(31.8) 3,286(48.9) 1,294(19.3) Central Manyoni 1,371 445(32.5) 532(38.8) 394(28.7) Mpwapwa 1,782 489(27.4) 1,100(61.7) 193(10.8) Sub-total 3,153 934(29.6) 1,632(51.8) 587(18.6) Eastern Ilala 1,783 626(35.1) 1,020(57.2) 137(7.7) Mkuranga 1,677 515(30.7) 1,037(61.8) 125(7.5) Mvomero 1,467 502(34.2) 745(50.8) 220(15.0) Sub-total 4,927 1,643(33.3) 2,802(56.9) 482(9.8) Lake Bukoba 2,854 826(28.9) 1,669(58.5) 359(12.6) Musoma 1,858 599(32.2) 1,089(58.6) 170(9.1) Nyamagana 1,470 517(35.2) 814(55.4) 139(9.5) Shinyanga 1,584 584(36.9) 878(55.4) 122(7.7) Sub-total 7,766 2,526(32.5) 4,450(57.3) 790(10.2) Southern Lindi 1,319 408(30.9) 806(61.1) 105(8.0) Newala 1,458 532(36.5) 707(48.5) 219(15.0) Sub-total 2,777 940(33.8) 1,513(54.5) 324(11.7) Western Kigoma 2,174 628(28.9) 916(42.1) 630(29.0) Urambo 1,689 486(28.8) 492(29.1) 711(42.1) Sub-total 3,863 1,114(28.8) 1,408(36.4) 1,341(34.7) S. Highlands Kilolo 1,734 537(31.0) 785(45.3) 412(23.8) Kyela 1,172 456(38.9) 623(53.2) 93(7.9) Songea 1,211 410(33.9) 669(55.2) 132(10.9) Sumbawanga 2,008 700(34.9) 1,198(59.7) 110(5.5) Sub-total 6,125 2,103(34.3) 3,275(53.5) 747(12.2)
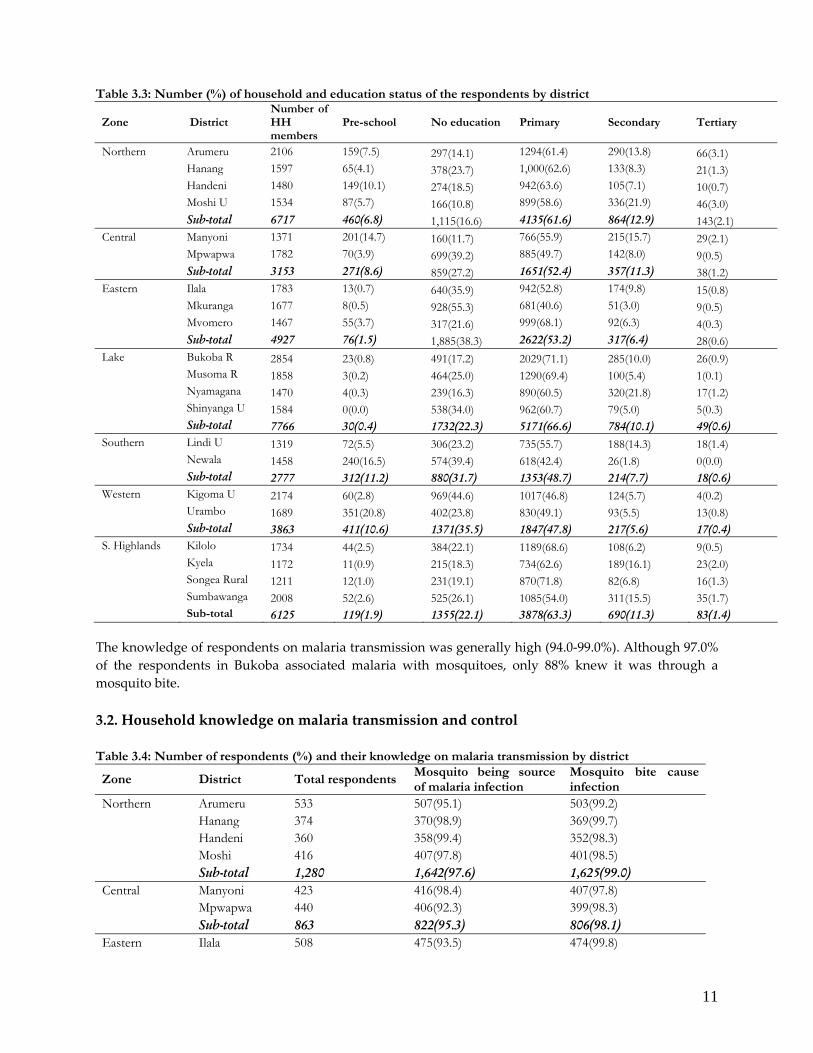
Respondents with no formal education accounted for 15.8‐37.4% of the interviewees. Most of them were from Mkuranga (55%), Kigoma‐Ujiji (44.2%) and Newala (37.9%). High literate rates were observed in Arumeru and Moshi Urban districts. The largest proportion of respondents with at least primary school education was recorded in Bukoba (71.1%) and Musoma (69.4%); while those with secondary school education were in Moshi (21.89%) and Nyamagana (21.8%). Moshi had the largest proportion (0.8%) of respondents with university education (Table 3.3). The majority of the respondents knew that the mosquito is the vector of the malaria parasite (92.6‐99.4%) and infection is through a mosquito bite (92.7‐99.8%) (Table 3.4).
11
Table 3.3: Number (%) of household and education status of the respondents by district
Zone District Number of HH members
Pre-school No education Primary Secondary Tertiary
Northern Arumeru 2106 159(7.5) 297(14.1) 1294(61.4) 290(13.8) 66(3.1) Hanang 1597 65(4.1) 378(23.7) 1,000(62.6) 133(8.3) 21(1.3) Handeni 1480 149(10.1) 274(18.5) 942(63.6) 105(7.1) 10(0.7) Moshi U 1534 87(5.7) 166(10.8) 899(58.6) 336(21.9) 46(3.0) Sub-total 6717 460(6.8) 1,115(16.6) 4135(61.6) 864(12.9) 143(2.1) Central Manyoni 1371 201(14.7) 160(11.7) 766(55.9) 215(15.7) 29(2.1) Mpwapwa 1782 70(3.9) 699(39.2) 885(49.7) 142(8.0) 9(0.5) Sub-total 3153 271(8.6) 859(27.2) 1651(52.4) 357(11.3) 38(1.2) Eastern Ilala 1783 13(0.7) 640(35.9) 942(52.8) 174(9.8) 15(0.8) Mkuranga 1677 8(0.5) 928(55.3) 681(40.6) 51(3.0) 9(0.5) Mvomero 1467 55(3.7) 317(21.6) 999(68.1) 92(6.3) 4(0.3) Sub-total 4927 76(1.5) 1,885(38.3) 2622(53.2) 317(6.4) 28(0.6) Lake Bukoba R 2854 23(0.8) 491(17.2) 2029(71.1) 285(10.0) 26(0.9) Musoma R 1858 3(0.2) 464(25.0) 1290(69.4) 100(5.4) 1(0.1) Nyamagana 1470 4(0.3) 239(16.3) 890(60.5) 320(21.8) 17(1.2) Shinyanga U 1584 0(0.0) 538(34.0) 962(60.7) 79(5.0) 5(0.3) Sub-total 7766 30(0.4) 1732(22.3) 5171(66.6) 784(10.1) 49(0.6) Southern Lindi U 1319 72(5.5) 306(23.2) 735(55.7) 188(14.3) 18(1.4) Newala 1458 240(16.5) 574(39.4) 618(42.4) 26(1.8) 0(0.0) Sub-total 2777 312(11.2) 880(31.7) 1353(48.7) 214(7.7) 18(0.6) Western Kigoma U 2174 60(2.8) 969(44.6) 1017(46.8) 124(5.7) 4(0.2) Urambo 1689 351(20.8) 402(23.8) 830(49.1) 93(5.5) 13(0.8) Sub-total 3863 411(10.6) 1371(35.5) 1847(47.8) 217(5.6) 17(0.4) S. Highlands Kilolo 1734 44(2.5) 384(22.1) 1189(68.6) 108(6.2) 9(0.5) Kyela 1172 11(0.9) 215(18.3) 734(62.6) 189(16.1) 23(2.0) Songea Rural 1211 12(1.0) 231(19.1) 870(71.8) 82(6.8) 16(1.3) Sumbawanga 2008 52(2.6) 525(26.1) 1085(54.0) 311(15.5) 35(1.7) Sub-total 6125 119(1.9) 1355(22.1) 3878(63.3) 690(11.3) 83(1.4)
The knowledge of respondents on malaria transmission was generally high (94.0‐99.0%). Although 97.0% of the respondents in Bukoba associated malaria with mosquitoes, only 88% knew it was through a mosquito bite. 3.2. Household knowledge on malaria transmission and control Table 3.4: Number of respondents (%) and their knowledge on malaria transmission by district
Zone District Total respondents Mosquito being source of malaria infection
Mosquito bite cause infection
Northern Arumeru 533 507(95.1) 503(99.2) Hanang 374 370(98.9) 369(99.7) Handeni 360 358(99.4) 352(98.3) Moshi 416 407(97.8) 401(98.5) Sub-total 1,280 1,642(97.6) 1,625(99.0) Central Manyoni 423 416(98.4) 407(97.8) Mpwapwa 440 406(92.3) 399(98.3) Sub-total 863 822(95.3) 806(98.1) Eastern Ilala 508 475(93.5) 474(99.8)
12
Zone District Total respondents Mosquito being source of malaria infection
Mosquito bite cause infection
Mkuranga 435 404(92.9) 400(99.0) Mvomero 400 394(98.5) 378(95.9) Sub-total 1,343 1,273(94.8) 1,252(98.4) Lake Bukoba 655 635(97.0) 561(88.4) Musoma 421 401(95.3) 395(98.5) Nyamagana 381 368(96.6) 366(99.5) Shinyanga 374 336(89.8) 333(99.1) Sub-total 1,831 1,740(95.0) 1,655(95.1) Southern Lindi 381 352(92.4) 339(96.3) Newala 388 360(92.8) 330(91.7) Sub-total 770 712(92.6) 669(94.0) Western Kigoma 447 437(97.8) 430(98.4) Urambo 470 454(96.6) 449(98.9) Sub-total 917 891(97.2) 879(98.7) S. Highlands Kilolo 468 448(95.7) 443(98.9) Kyela 321 309(96.3) 303(98.1) Songea 303 290(95.7) 281(96.9) Sumbawanga 435 401(92.2) 387(96.5) Sub-total 1,527 1,448(94.8) 1,414(97.7)
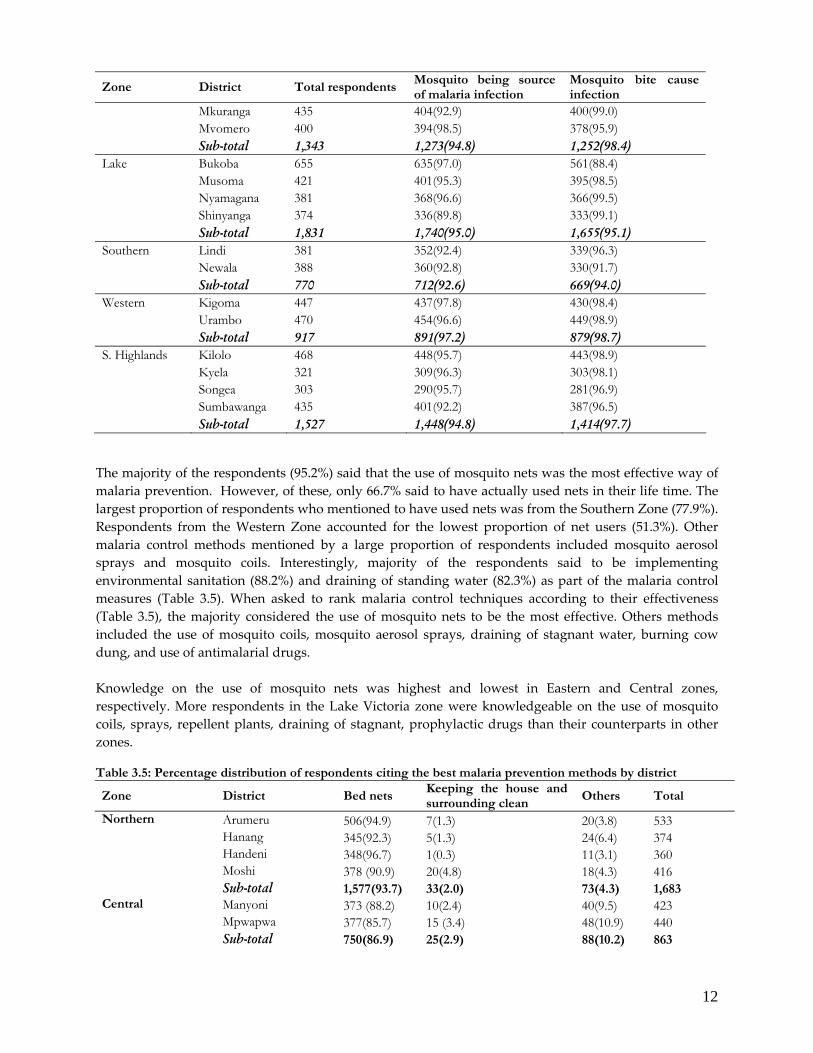
The majority of the respondents (95.2%) said that the use of mosquito nets was the most effective way of malaria prevention. However, of these, only 66.7% said to have actually used nets in their life time. The largest proportion of respondents who mentioned to have used nets was from the Southern Zone (77.9%). Respondents from the Western Zone accounted for the lowest proportion of net users (51.3%). Other malaria control methods mentioned by a large proportion of respondents included mosquito aerosol sprays and mosquito coils. Interestingly, majority of the respondents said to be implementing environmental sanitation (88.2%) and draining of standing water (82.3%) as part of the malaria control measures (Table 3.5). When asked to rank malaria control techniques according to their effectiveness (Table 3.5), the majority considered the use of mosquito nets to be the most effective. Others methods included the use of mosquito coils, mosquito aerosol sprays, draining of stagnant water, burning cow dung, and use of antimalarial drugs. Knowledge on the use of mosquito nets was highest and lowest in Eastern and Central zones, respectively. More respondents in the Lake Victoria zone were knowledgeable on the use of mosquito coils, sprays, repellent plants, draining of stagnant, prophylactic drugs than their counterparts in other zones. Table 3.5: Percentage distribution of respondents citing the best malaria prevention methods by district
Zone District Bed nets Keeping the house and surrounding clean
Others Total
Northern Arumeru 506(94.9) 7(1.3) 20(3.8) 533 Hanang 345(92.3) 5(1.3) 24(6.4) 374 Handeni 348(96.7) 1(0.3) 11(3.1) 360 Moshi 378 (90.9) 20(4.8) 18(4.3) 416 Sub-total 1,577(93.7) 33(2.0) 73(4.3) 1,683 Central Manyoni 373 (88.2) 10(2.4) 40(9.5) 423 Mpwapwa 377(85.7) 15 (3.4) 48(10.9) 440 Sub-total 750(86.9) 25(2.9) 88(10.2) 863
13
Zone District Bed nets Keeping the house and surrounding clean
Others Total
Eastern Ilala 417(82.1) 23(4.5) 68(13.4) 508 Mkuranga 373(85.8) 28(6.4) 34(7.8) 435 Mvomero 385(96.3) 2(0.5) 13(3.3) 400 Sub-total 1,175(87.5) 53(4.0) 115(8.6) 1,343 Lake Bukoba 627(95.7) 5(0.8) 23(3.5) 655 Musoma 414(98.3) 0(0.0) 7(1.7) 421 Nyamagana 375(98.4) 1(0.3) 5(1.3) 381 Shinyanga 355(94.9) 2(0.5) 17(4.6) 374 Sub-total 1,771(96.7) 8(0.4) 52(2.8) 1,831 Southern Lindi 313(82.2) 11(2.9) 57(15.0) 381 Newala 313(80.7) 14(3.6) 61(15.7) 388 Sub-total 626(81.4) 25(3.3) 118(15.3) 769 Western Kigoma Ujiji 395(88.4) 24(5.4) 28(6.3) 447 Urambo 432(91.9) 16(3.4) 22(4.7) 470 Sub-total 827(90.2) 40(4.4) 50(5.5) 917 Southern Highlands
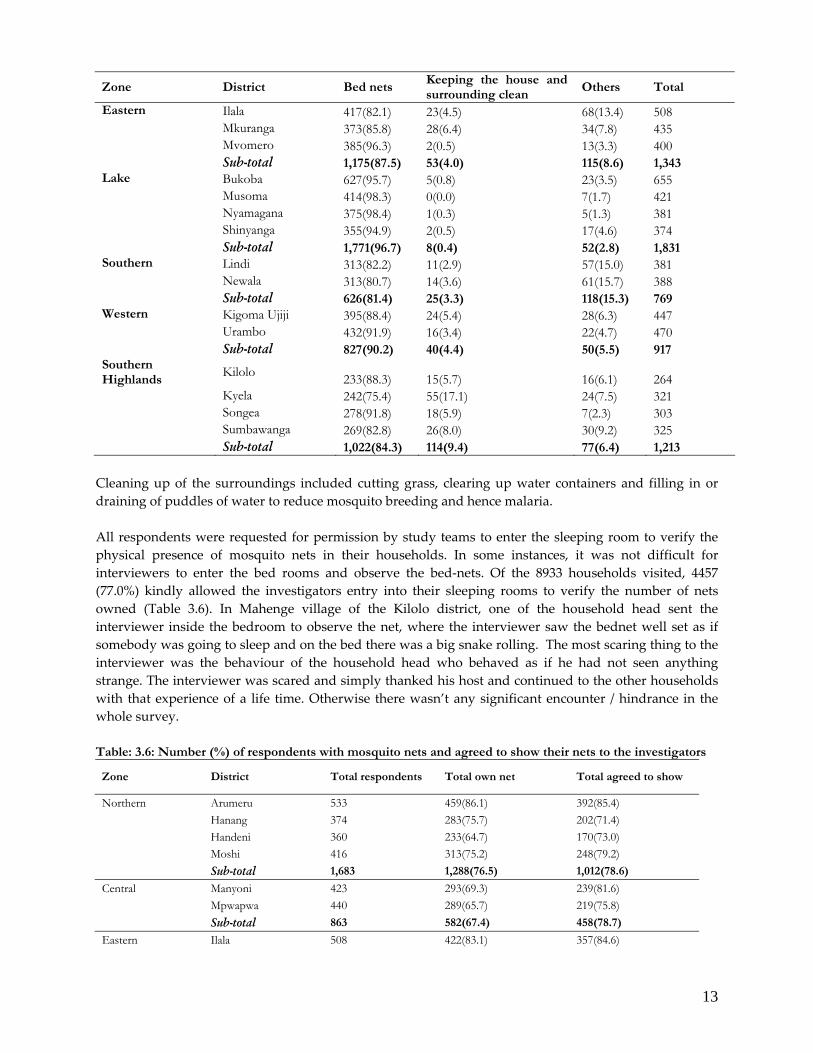
Kilolo 233(88.3) 15(5.7) 16(6.1) 264 Kyela 242(75.4) 55(17.1) 24(7.5) 321 Songea 278(91.8) 18(5.9) 7(2.3) 303 Sumbawanga 269(82.8) 26(8.0) 30(9.2) 325 Sub-total 1,022(84.3) 114(9.4) 77(6.4) 1,213 Cleaning up of the surroundings included cutting grass, clearing up water containers and filling in or draining of puddles of water to reduce mosquito breeding and hence malaria. All respondents were requested for permission by study teams to enter the sleeping room to verify the physical presence of mosquito nets in their households. In some instances, it was not difficult for interviewers to enter the bed rooms and observe the bed‐nets. Of the 8933 households visited, 4457 (77.0%) kindly allowed the investigators entry into their sleeping rooms to verify the number of nets owned (Table 3.6). In Mahenge village of the Kilolo district, one of the household head sent the interviewer inside the bedroom to observe the net, where the interviewer saw the bednet well set as if somebody was going to sleep and on the bed there was a big snake rolling. The most scaring thing to the interviewer was the behaviour of the household head who behaved as if he had not seen anything strange. The interviewer was scared and simply thanked his host and continued to the other households with that experience of a life time. Otherwise there wasn’t any significant encounter / hindrance in the whole survey. Table: 3.6: Number (%) of respondents with mosquito nets and agreed to show their nets to the investigators
Zone District Total respondents Total own net Total agreed to show
Northern Arumeru 533 459(86.1) 392(85.4) Hanang 374 283(75.7) 202(71.4) Handeni 360 233(64.7) 170(73.0) Moshi 416 313(75.2) 248(79.2) Sub-total 1,683 1,288(76.5) 1,012(78.6)
Central Manyoni 423 293(69.3) 239(81.6) Mpwapwa 440 289(65.7) 219(75.8) Sub-total 863 582(67.4) 458(78.7)
Eastern Ilala 508 422(83.1) 357(84.6)
14
Zone District Total respondents Total own net Total agreed to show
Mkuranga 435 282(64.8) 206 (73.1) Mvomero 400 272(68.0) 216 (79.4) Sub-total 1,343 976(72.7) 779 (79.8)
Lake Bukoba 655 286(43.7) 202(70.6) Musoma 421 174(41.3) 156(89.7) Nyamagana 381 305(80.1) 261(85.6) Shinyanga 374 160(42.8) 119(74.4) Sub-total 1,831 925(50.5) 738(79.8)
Southern Lindi 381 363(95.3) 308(84.9) Newala 388 228(58.8) 181(79.4) Sub-total 769 591(76.9) 489(82.7)
Western Kigoma-Ujiji 447 163(36.5) 130(79.8) Urambo 470 200(42.6) 138(69.0) Sub-total 917 363(39.6) 268(73.8)
Southern Highlands Kilolo 468 153(32.7) 122(79.7) Kyela 448 400(89.3) 235(58.8) Songea 439 256 (58.3) 160(62.5) Sumbawanga 435 251(57.7) 196(78.1) Sub-total 1,790 1,060 (59.2) 713 (67.3)
Total average 8,933 5,785(62.9) 4,457 (77.0)
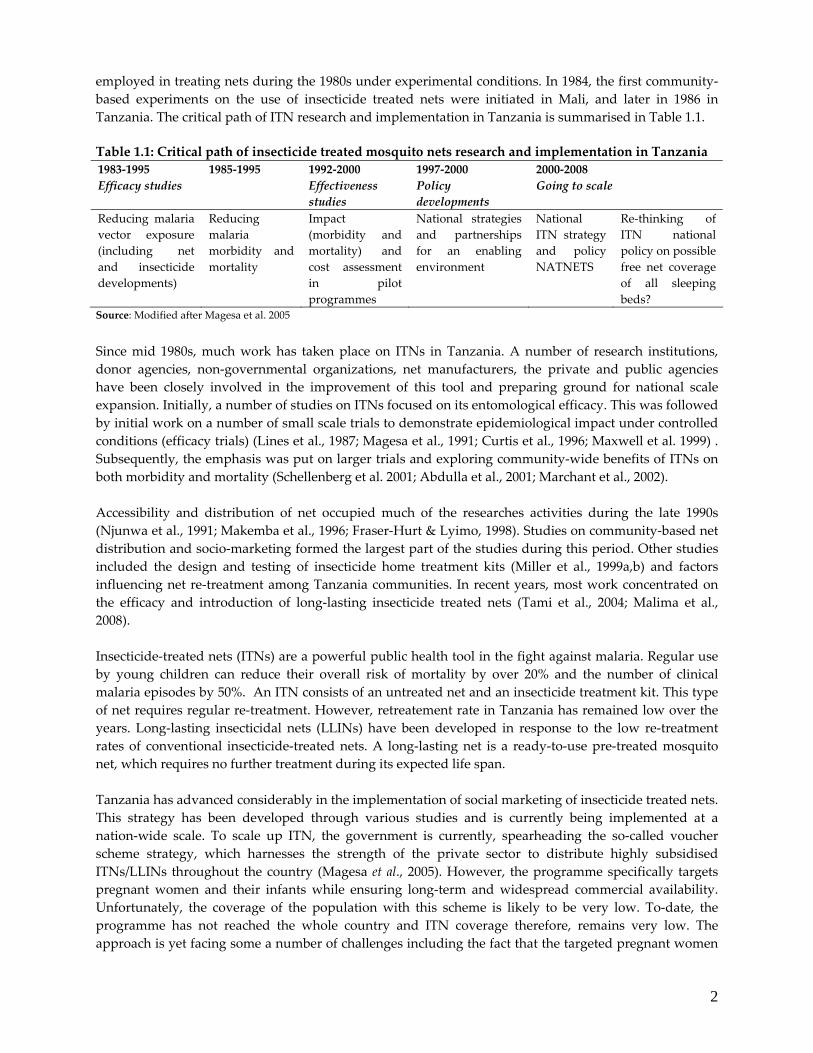
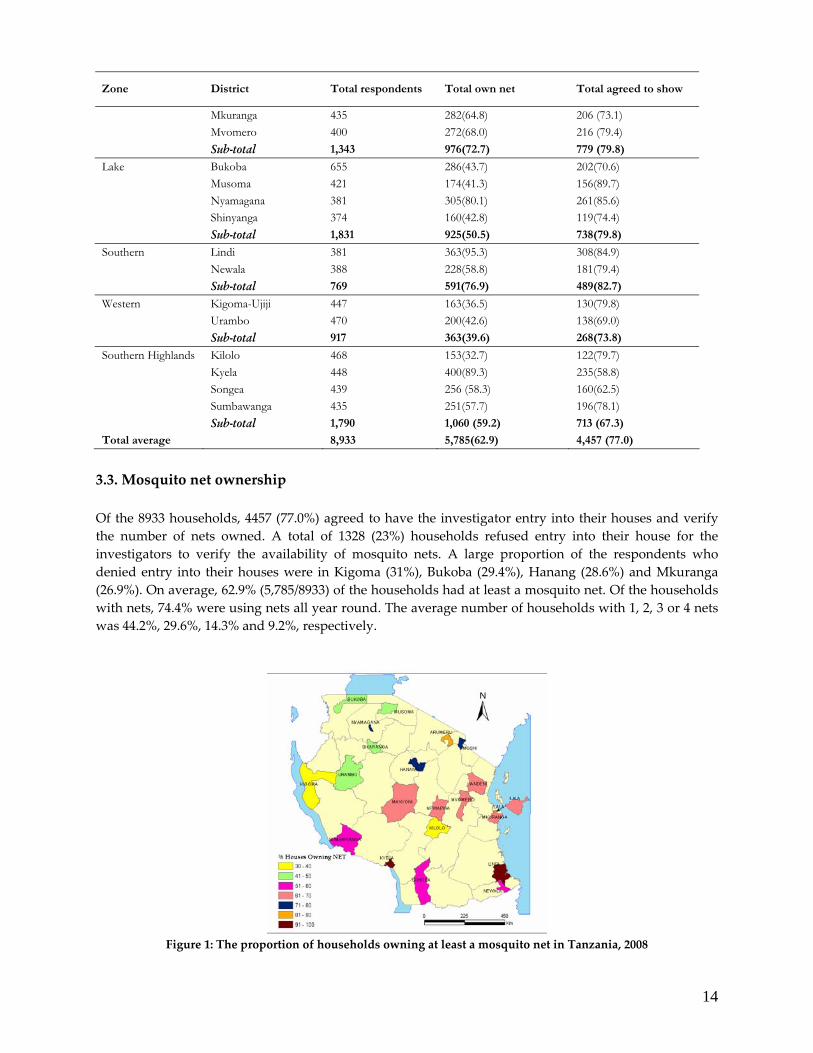
3.3. Mosquito net ownership Of the 8933 households, 4457 (77.0%) agreed to have the investigator entry into their houses and verify the number of nets owned. A total of 1328 (23%) households refused entry into their house for the investigators to verify the availability of mosquito nets. A large proportion of the respondents who denied entry into their houses were in Kigoma (31%), Bukoba (29.4%), Hanang (28.6%) and Mkuranga (26.9%). On average, 62.9% (5,785/8933) of the households had at least a mosquito net. Of the households with nets, 74.4% were using nets all year round. The average number of households with 1, 2, 3 or 4 nets was 44.2%, 29.6%, 14.3% and 9.2%, respectively.
Figure 1: The proportion of households owning at least a mosquito net in Tanzania, 2008
15
Majority of the respondents in Northern (76.5%) and Southern (76.5%) zones owned at least one mosquito net per household. The lowest mosquito net ownership was observed among respondents in Western Zone (39.6%). District‐wise, net ownership was highest in Lindi Urban (94.5%), Kyela (91.3%) Arumeru (86.1%), Ilala (83.1%) and Nyamagana (80.0%). Ownership of net was very low in Kilolo (34.8%), Kigoma (36.5%) and Musoma Rural (41.3%). A larger proportion of respondents in Kilolo (68.5%), Mpwapwa (51.9%), Songea Rural (49.2%) and Shinyanga Rural (46.3%) were using the nets during the rainy season (Tables 3.7). 3.3.1. Mosquito net ownership in Northern Zone Table 3.7a: Number (%) of households owning a mosquito net and season during which nets are used in Northern Zone
% of Household using net Number of nets District/ Ward
Total Own net All year
Rain season
Dry season
One Two Three 4+
Arumeru
Maji ya Chai 312 263(84.3) 228(86.7) 25(9.5) 10(3.8) 93(35.4) 87(33.1) 44(16.7) 39(14.8)
Usa river 221 196(88.7) 180(91.8) 3(1.5) 13(6.6) 86(43.9) 52(26.5) 38(19.4) 20(10.2)
Total 533 459(86.1) 408(88.9) 28(6.1) 23(5.0) 179(39.0) 139(30.3) 82(17.9) 59(12.9)
Hanang
Balangidalalu 191 155(81.2) 136(87.7) 14(9.0) 5(3.2) 50(32.3) 56(36.1) 36(23.2) 13(8.4)
Endasaki 183 128(70.0) 102(79.7) 16(12.5) 10(7.8) 56(43.8) 52(40.6) 15(11.7) 5(3.9)
Total 374 283(75.7) 238(84.1) 30(10.6) 15(5.3) 106(37.5) 108(38.2) 51(18.0) 18(6.4)
Handeni
Chanika 153 111(72.6 ) 92(82.9) 12(10.8) 7(6.3) 51(46.0) 36(32.4) 19(17.1) 5(4.5)
Kwaluguru 207 122(58.9) 94(77.1) 22(18.0) 6(4.9) 52(42.6) 47(38.5) 20(16.4) 3(2.5)
Total 360 233(64.7 ) 186(79.8) 34(14.6) 13(5.6) 103(44.2) 83(35.6) 39(16.7) 8(3.4)
Moshi
Majengo 202 176(87.1) 162(92.1) 7(4.0) 7(4.0) 77(43.8) 51(29.0) 24(13.6) 24(13.6)
Mji mpya 214 137(64.0) 121(88.3) 7(5.1) 9(6.6) 69(50.4) 44(32.1) 19(13.9) 5(3.7)
Total 416 313(75.2) 283(90.4) 14(4.5) 16(5.1) 146(46.7) 95(30.4) 43(13.7) 29(9.3)
In the northern zone, the largest proportion (86.1%) of households with at least a mosquito net was observed in Arumeru district. Within the same district, mosquito net ownership was similar between the wards. However, respondents in Usa River (within the district capital) had a slightly higher rate of net ownership. In Handeni, a significantly higher rate of net ownership was observed within the district capital (Chanika=72.6%) than in the rural village of Kwaluguru (58.9%). Similarly, in Moshi Municipality, the proportion of households owning at least a net was higher in Majengo (87.1%) than in the sub‐urban area of Mji Mpya (64%). Contrary to the above findings, in Hanang, a largest proportion of households in Balang’idalalu (81.2%) owned nets than in Endasak (70%), which is within the district capital radius.
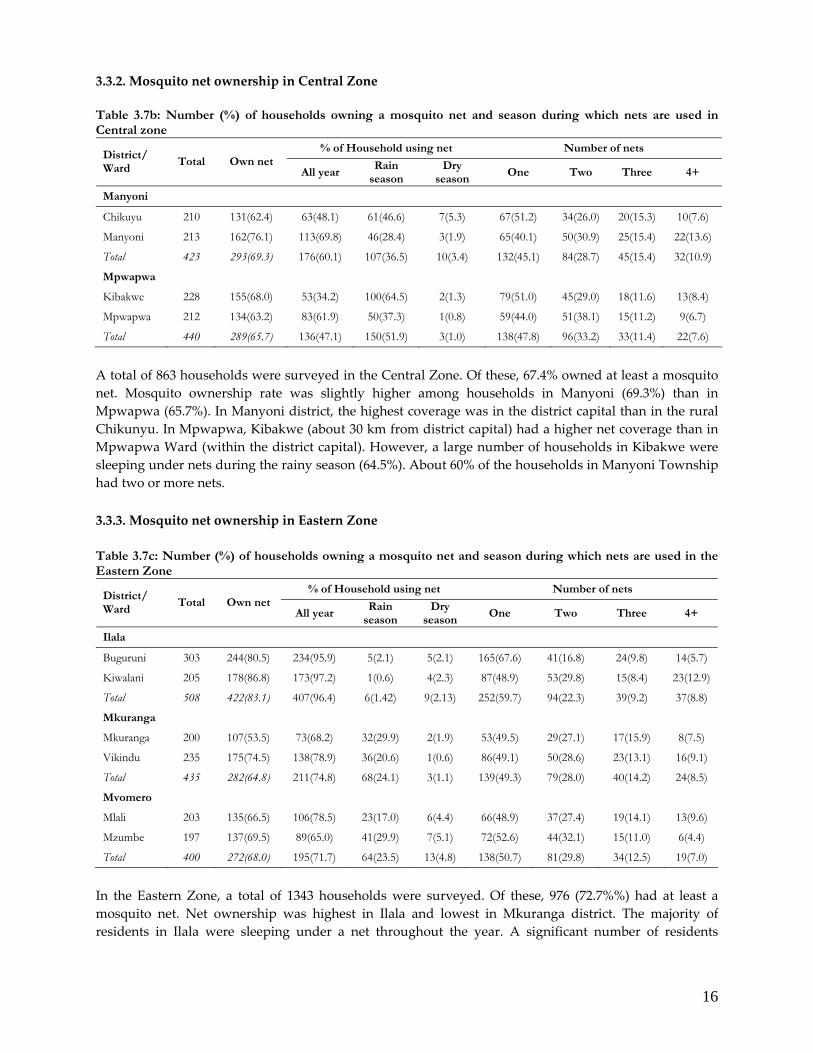
16
3.3.2. Mosquito net ownership in Central Zone Table 3.7b: Number (%) of households owning a mosquito net and season during which nets are used in Central zone
% of Household using net Number of nets District/ Ward
Total Own net All year
Rain season
Dry season
One Two Three 4+
Manyoni
Chikuyu 210 131(62.4) 63(48.1) 61(46.6) 7(5.3) 67(51.2) 34(26.0) 20(15.3) 10(7.6)
Manyoni 213 162(76.1) 113(69.8) 46(28.4) 3(1.9) 65(40.1) 50(30.9) 25(15.4) 22(13.6)
Total 423 293(69.3) 176(60.1) 107(36.5) 10(3.4) 132(45.1) 84(28.7) 45(15.4) 32(10.9)
Mpwapwa
Kibakwe 228 155(68.0) 53(34.2) 100(64.5) 2(1.3) 79(51.0) 45(29.0) 18(11.6) 13(8.4)
Mpwapwa 212 134(63.2) 83(61.9) 50(37.3) 1(0.8) 59(44.0) 51(38.1) 15(11.2) 9(6.7)
Total 440 289(65.7) 136(47.1) 150(51.9) 3(1.0) 138(47.8) 96(33.2) 33(11.4) 22(7.6)
A total of 863 households were surveyed in the Central Zone. Of these, 67.4% owned at least a mosquito net. Mosquito ownership rate was slightly higher among households in Manyoni (69.3%) than in Mpwapwa (65.7%). In Manyoni district, the highest coverage was in the district capital than in the rural Chikunyu. In Mpwapwa, Kibakwe (about 30 km from district capital) had a higher net coverage than in Mpwapwa Ward (within the district capital). However, a large number of households in Kibakwe were sleeping under nets during the rainy season (64.5%). About 60% of the households in Manyoni Township had two or more nets. 3.3.3. Mosquito net ownership in Eastern Zone Table 3.7c: Number (%) of households owning a mosquito net and season during which nets are used in the Eastern Zone
% of Household using net Number of nets District/ Ward
Total Own net All year
Rain season
Dry season
One Two Three 4+
Ilala
Buguruni 303 244(80.5) 234(95.9) 5(2.1) 5(2.1) 165(67.6) 41(16.8) 24(9.8) 14(5.7)
Kiwalani 205 178(86.8) 173(97.2) 1(0.6) 4(2.3) 87(48.9) 53(29.8) 15(8.4) 23(12.9)
Total 508 422(83.1) 407(96.4) 6(1.42) 9(2.13) 252(59.7) 94(22.3) 39(9.2) 37(8.8)
Mkuranga
Mkuranga 200 107(53.5) 73(68.2) 32(29.9) 2(1.9) 53(49.5) 29(27.1) 17(15.9) 8(7.5)
Vikindu 235 175(74.5) 138(78.9) 36(20.6) 1(0.6) 86(49.1) 50(28.6) 23(13.1) 16(9.1)
Total 435 282(64.8) 211(74.8) 68(24.1) 3(1.1) 139(49.3) 79(28.0) 40(14.2) 24(8.5)
Mvomero
Mlali 203 135(66.5) 106(78.5) 23(17.0) 6(4.4) 66(48.9) 37(27.4) 19(14.1) 13(9.6)
Mzumbe 197 137(69.5) 89(65.0) 41(29.9) 7(5.1) 72(52.6) 44(32.1) 15(11.0) 6(4.4)
Total 400 272(68.0) 195(71.7) 64(23.5) 13(4.8) 138(50.7) 81(29.8) 34(12.5) 19(7.0)
In the Eastern Zone, a total of 1343 households were surveyed. Of these, 976 (72.7%%) had at least a mosquito net. Net ownership was highest in Ilala and lowest in Mkuranga district. The majority of residents in Ilala were sleeping under a net throughout the year. A significant number of residents
17
Mvomero (23.5%) and Mkuranga 24.1%) were only sleeping under a net during the rainy season. In this zone, residents of Mlali in Mvomero district had the largest proportion of those owning two or more nets. 3.3.4. Mosquito net ownership in Lake Victoria Zone Table 3.7d: Number (%) of households owning a mosquito net and season during which nets are used in the Lake Zone
% of Household using net Number of nets District/ Ward
Total Own net All year
Rain season
Dry season
One Two Three 4+
Bukoba
Bujugo 344 147(42.7) 100(68.0) 44(29.9) 3(2.0) 71(48.3) 47(32.0) 23(15.7) 6(4.1)
Karabagaine 311 139(44.7) 84(60.4) 49(35.3) 6(4.3) 66(47.5) 46(33.1) 16(11.5) 11(7.9)
Total 655 286(43.7) 184(64.3) 93(32.5) 9(3.2) 137(47.9) 93(32.5) 39(13.6) 17(5.9)
Musoma
Etaro 220 99(45.0) 62(62.6) 37(37.4) 0(0.0) 45(45.5) 42(42.4) 11(11.1) 1(1.0)
Mugango 201 75(37.3) 60(80.0) 14(18.7) 1(1.3) 46(61.3) 18(24.0) 7(9.3) 4(5.3)
Total 421 174(41.3) 122(70.1) 51(29.3) 1(0.6) 91(52.3) 60(34.5) 18(10.3) 5(2.9)
Nyamagana
Butimba 187 155(82.9) 151(97.4) 0(0) 4(2.6) 74(47.7) 45(29.0) 22(14.2) 14(9.0)
Mirongo 194 150(77.3) 147(98.0) 0(0) 3(2.0) 50(33.3) 50(33.3) 27(18.0) 23(15.3)
Total 381 305(80.1) 298(97.7) 0(0) 7(2.3) 124(40.7) 95(31.2) 49(16.1) 37(12.1)
Shinyanga
Mwamala 206 88(42.7) 48(54.6) 39(44.3) 1(1.1) 39(44.3) 33(37.5) 12(13.6) 4(4.6)
Usanda 168 72(42.9) 35(48.6) 35(48.6) 2(2.8) 34(47.2) 18(25.0) 16(22.2) 4(5.6)
Total 374 160(42.8) 83(51.9) 74(46.3) 3(1.9) 73(45.6) 51(31.9) 28(17.5) 8(5.0)
A total of 1831 households in the Lake Victoria Zone were surveyed. Of this, 925 (50.5%) had at least a mosquito net. Except for Nyamagama, in all other districts, less than half of the households had a mosquito net. A significant proportion (46.3%) of the members of the households was sleeping under a net only during the rainy season. 3.3.5. Mosquito net ownership in Southern Zone Table 3.7e: Number (%) of households owning a mosquito net and season during which nets are used Southern Zone
% of Household using net Number of nets District/ Ward
Total Own net All year
Rain season
Dry season
One Two Three 4+
Lindi
Makonde 169 158(93.5) 150(94.9) 7(4.43) 1(0.63) 49(31.0) 48(30.4) 28(17.7) 33(20.9)
Ndoro 212 205(96.7 ) 192(93.7) 3(1.46) 10(4.88) 90(43.9) 53(25.9) 27(13.2) 35(17.1)
Total 381 363(95.3) 342(94.2) 10(2.75) 11(3.03) 139(38.3) 101(27.8) 55(15.2) 68(18.7)
Newala
Malatu 223 116(52.0) 80(69.0) 33(28.5) 3(2.6) 58(50.0) 35(30.2) 16(13.8) 7(6.0)
Nangurukuru 165 112(67.9) 74(66.1) 36(32.1) 2(1.8) 49(43.8) 36(32.1) 21(18.8) 6(5.4)
Total 388 228(58.8) 154(67.5) 69(30.3) 5(2.2) 107(46.9) 71(31.1) 37(16.2) 13(5.7)
18
In the Southern Zone, a total 769 of heads of households were interviewed and 591 (76.9%) of the households had at least a mosquito net. Over 95% of all households in Lindi Urban owned a net and the majority were sleeping under nets throughout the year. On the contrary, just of half of the households in Newala owned at least a mosquito net and only about two‐thirds were sleeping under nets all year round. In Lindi, a quarter of the households had four or more nets. 3.3.6. Mosquito net ownership in Southern Highland Zone Table 3.7f: Number (%) of households owning a mosquito net and season during which nets are used in Southern Highlands
% of Household using net Number of nets District/
Ward Total Own net
All year Rain
season Dry
season One Two Three 4+
Kilolo
Ilula 251 61(24.3) 17(27.87) 44(72.13) 0(0) 43(70.5) 14(23.0) 4(6.6) 0(0.0)
Mahenge 217 92(42.4) 38(41.3) 53(57.61) 1(1.09) 55(59.8) 26(28.3) 10(10.9) 1(1.1)
Total 468 153(32.7) 55(35.95) 97(63.4) 1(0.65) 98(64.1) 40(26.1) 14(9.2) 1(0.7)
Kyela
Kyela U 238 221(92.9) 192(86.9) 24(10.86) 5(2.26) 53(24.0) 78(35.3) 50(22.6) 40(18.1)
Makwale 83 72(86.8) 59(81.94) 11(15.28) 2(2.78) 67(37.4) 60(33.5) 29(16.2) 23(12.9)
Total 321 293(91.3) 251(85.7) 35(11.95) 7(2.39) 120(30.0) 138(34.5) 79(19.8) 63(15.8)
Songea
Maposeni 220 135(61.4) 61(45.2) 69(51.1) 5(3.7) 62(36.9) 56(33.3) 35(20.8) 15(8.9)
Tanga 83 44(53.0) 25(56.8) 19(43.2) 0(0.0) 36(40.9) 33(37.5) 11(12.5) 8(9.1)
Total 303 179(59.1) 86(48.0) 88(49.2) 5(2.8) 98(38.3) 89(34.8) 46(18.0) 23(9.0)
Sumbawanga
Katandala 230 194(84.4) 162(83.5) 31(16.0) 1(0.5) 53(27.3) 55(28.4) 38(19.6) 48(24.7)
Pito 205 57(27.8) 40(70.2) 13(22.8) 4(7.0) 44(77.2) 7(12.3) 2(3.5) 4(7.0)
Total 435 251(57.7) 202(80.5) 44(17.5) 5(2.0) 97(38.7) 62(24.7) 40(15.9) 52(20.7) Of the total 1793 households visited, 1527 responded to the question on net ownership. The majority of the respondents in Kyela (85.7%) and Sumbawanga (80.5%) were sleeping under mosquito net throughout the year. About two‐thirds of the residents in Kilolo district were sleeping under nets only during the rainy season. Most of the households in Kilolo had only one mosquito net. Over one‐quarter of the households in Songea and Sumbawanga had four or more mosquito nets. 3.3.7. Mosquito net ownership in Western Zone Table 3.7g: Number (%) of households owning a mosquito net and season during which nets are used in Western Zone
% of Household using net Number of nets District/ Ward
Total Own net All year
Rain season
Dry season
One Two Three 4+
Kigoma Ujiji
Kagera 239 86(36.0) 75(87.21) 8(9.3) 3(3.49) 33(38.4) 36(41.9) 13(15.1) 4(4.7)
Rusimbi 208 77(37.0) 70(90.91) 5(6.49) 2(2.6) 40(52.0) 20(26.0) 9(11.7) 8(10.4)
Total 447 163(36.5) 145(89.0) 13(7.98) 5(3.07) 73(44.8) 56(34.4) 22(13.5) 12(7.4)
Urambo
19
Muungano 226 93(41.2) 30(32.3) 39(41.9) 24()25.8 54(58.1) 25(26.9) 9(9.7) 5(5.4)
Urambo 244 107(43.9) 82(76.6) 18(16.8) 7(6.5) 58(54.2) 28(26.2) 15(14.0) 6(5.6)
Total 470 200(42.6) 112(56.0) 57(28.5) 31(15.5) 112(56.0) 53(26.5) 24(12.0) 11(5.5)
In the Western Zone, 39.6% of the 917 households surveyed had at least a net. There were more households owning at least a net in Urambo than Kigoma‐Ujiji. Generally, this was the zone with the lowest (42.6%) net ownership. More household members in Kigoma‐Ujiji (80%) than in Urambo (56%) were sleeping under nets all year round. 3.4. Mosquito coverage in <5 years children Table 3.8: The number (%) of households with at least one child <5 years sleeping under a mosquito net
No. (%) households with <5 years
District Ward Total households
No. (%) households with at least one under five slept under net
during the previous night
slept under treated net during the previous night
Arumeru Maji ya chai 312 149(47.8) 108(72.5) 65(43.6) Usa River 221 71(32.1) 64(90.1) 37(52.1) Total 533 220(41.3) 172(78.2) 102(46.4) Bukoba Bujugo 344 135(39.2) 47(34.8) 20(14.8) Kabaragaine 311 128(41.2) 35(27.3) 27(21.1) Total 655 263(40.2) 82(31.2) 47(17.9) Hanang Balangidalalu 191 97(50.8) 75(77.3) 39(40.2) Endasaki 183 73(39.9) 45(61.6) 30(41.1) Total 374 170(45.5) 120(70.6) 69(40.6) Handeni Chanika 153 55(35.9) 46(83.6) 20(36.4) Kwaluguru 207 86(41.5) 54(62.8) 33(38.4) Total 360 141(39.2) 100(70.9) 53(37.6) Ilala Buguruni 303 98(32.3) 81(82.7) 30(30.6) Kiwalani 205 80(39.0) 67(83.8) 25(31.3) Total 508 178(35.0) 148(83.2) 55(30.9) Kigoma-Ujiji Kagera 239 122(51.0) 24(19.7) 22(18.0) Rusimbi 208 103(49.5) 27(26.2) 14(13.6) Total 447 225(50.3) 51(22.7) 36(16.0) Kilolo Ilula 251 97(38.6) 10(10.3) 15(15.5) Mahenge 217 75(34.6) 25(33.3) 19(25.3) Total 468 172(36.8) 35(20.4) 34(19.8) Kyela Kyela mjini 238 102(42.9) 88(86.3) 54(52.9) Makwale 210 51(24.3) 40(78.4) 19(37.3) Total 448 153(34.2) 128(83.7) 73(47.7) Lindi Makonde 169 56(33.1) 49(87.5) 24(42.9) Ndoro 212 54(25.5) 50(92.6) 25(46.3) Total 381 110(28.9) 99(90.0) 49(44.5) Manyoni Chikuyu 210 58(27.6) 25(43.1) 21(36.2) Manyoni 213 55(25.8) 36(65.5) 25(45.5) Total 423 113(26.7) 61(54.0) 46(40.7) Mkuranga Mkuranga 200 96(48.0) 40(41.7) 19(19.8) Vikindu 235 101(43.0) 67(66.3) 25(24.8) Total 435 197(45.3) 107(54.3) 44(22.3) Moshi Majengo 202 71(35.1) 59(83.1) 32(45.1) Mji mpya 214 78(36.4) 52(66.7) 31(39.7)
20
No. (%) households with <5 years
District Ward Total households
No. (%) households with at least one under five slept under net
during the previous night
slept under treated net during the previous night
Total 416 149(35.8) 111(74.5) 63(42.3) Mpwapwa Kibakwe 228 102(44.7) 64(62.8) 45(44.1) Mpwapwa 212 68(32.1) 29(42.7) 22(32.4) Total 440 170(38.6) 93(54.7) 67(39.4) Musoma Etaro 220 94(42.7) 36(38.3) 24(25.5) Mugango 201 90(44.8) 33(36.7) 9(10.0) Total 421 192(45.6) 71(37.0) 33(17.2) Mvomero Mlali 203 73(36.0) 43(58.9) 19(26.0) Mzumbe 197 69(35.0) 48(69.6) 26(37.7) Total 400 142(35.5) 91(64.1) 45(31.7) Newala Malatu 223 83(37.2) 34(41.0) 20(24.1) Nangurukuru 165 74(44.8) 30(40.5) 28(37.8) Total 388 157()40.5 64(40.8) 48(30.6) Nyamagana Butimba 187 102(54.5) 78(76.5) 50(49.0) Mirongo 194 70(36.1) 54(77.1) 32(45.7) Total 381 172(45.1) 132(76.7) 82(47.7) Shinyanga Mwamala 206 83(40.3) 46(55.4) 23(27.7) Usanda 168 74(44.0) 25(33.8) 10()13.5 Total 374 157(42.0) 71(45.2) 33(21.0) Songea Maposeni 301 83(27.6) 30(36.1) 31(37.3) Tanga 138 66(47.8) 31(47.0) 34(51.5) Total 439 149(33.9) 61(40.9) 65(43.6) Sumbawanga Katandala 230 89(38.7) 68(76.4) 40(44.9) Pito 205 127(62.0) 20(15.8) 27(21.3) Total 435 216(49.7) 88(40.7) 67(31.0) Urambo Muungano 226 75(33.2) 25(33.3) 8(10.7) Urambo 244 89(36.5) 29(32.6) 21(23.6) Total 470 164(34.9) 54(32.9) 29(17.7) Overall 9,166 3,610 (39.3) 1,939 (53.7) 1,140(31.6)
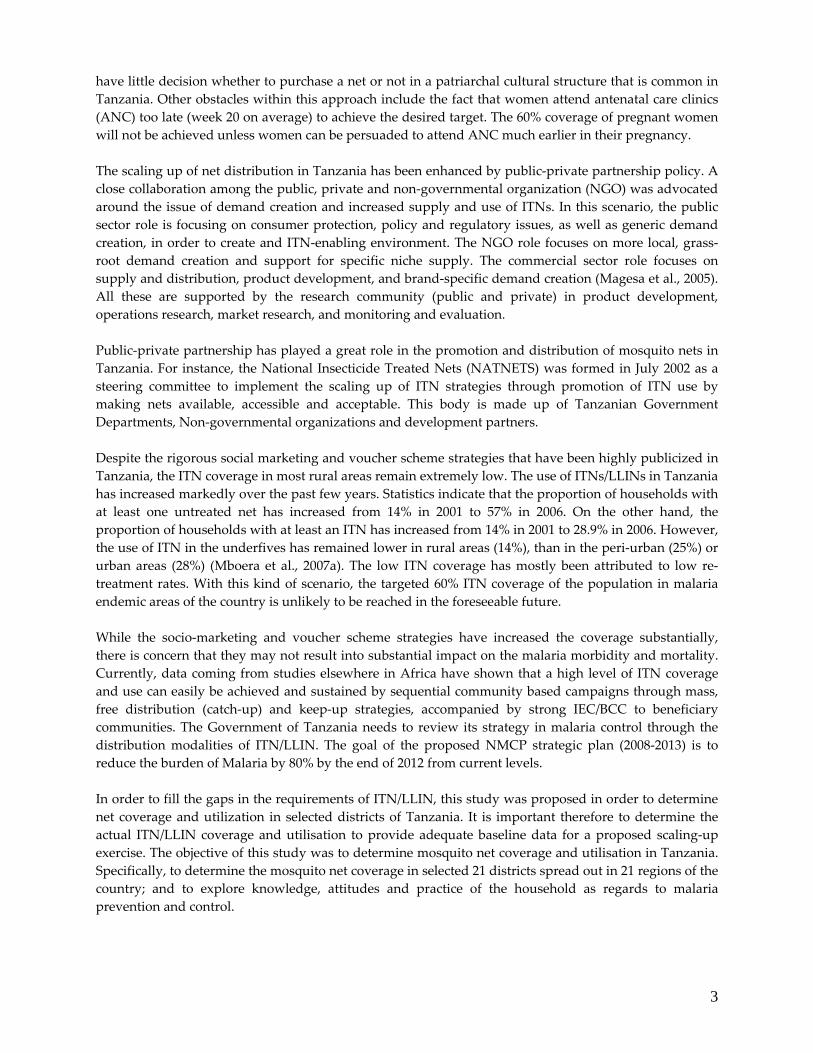
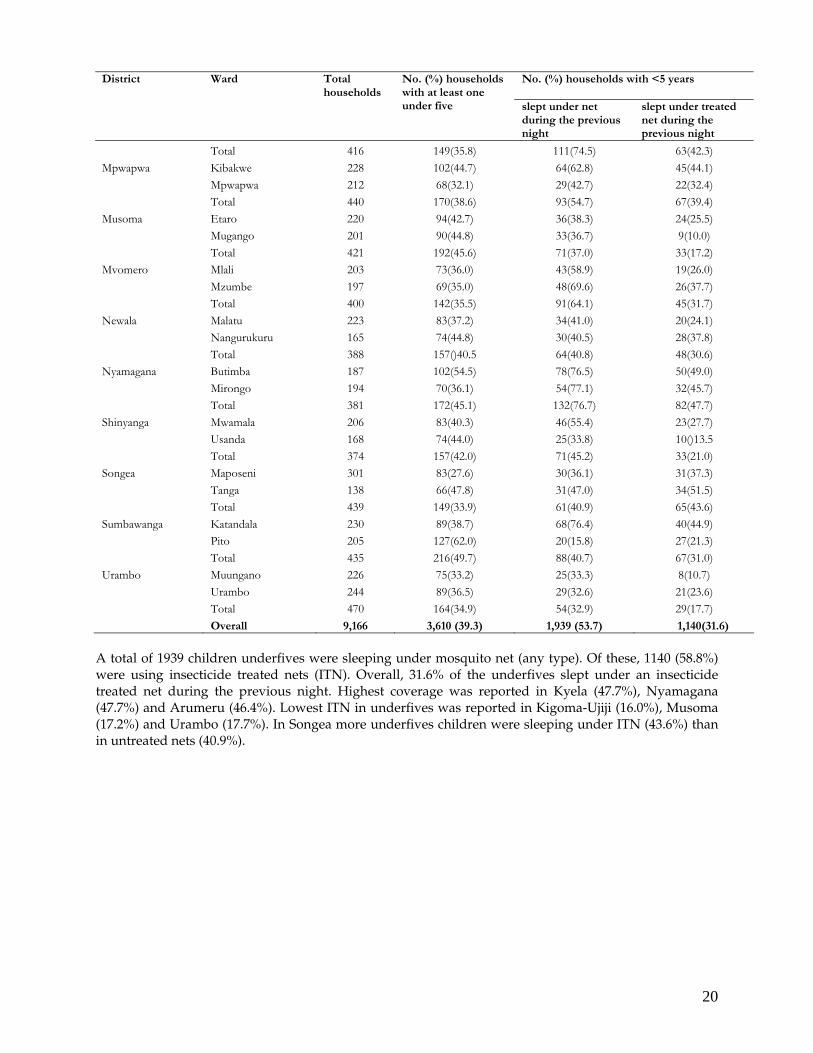
A total of 1939 children underfives were sleeping under mosquito net (any type). Of these, 1140 (58.8%) were using insecticide treated nets (ITN). Overall, 31.6% of the underfives slept under an insecticide treated net during the previous night. Highest coverage was reported in Kyela (47.7%), Nyamagana (47.7%) and Arumeru (46.4%). Lowest ITN in underfives was reported in Kigoma-Ujiji (16.0%), Musoma (17.2%) and Urambo (17.7%). In Songea more underfives children were sleeping under ITN (43.6%) than in untreated nets (40.9%).
21
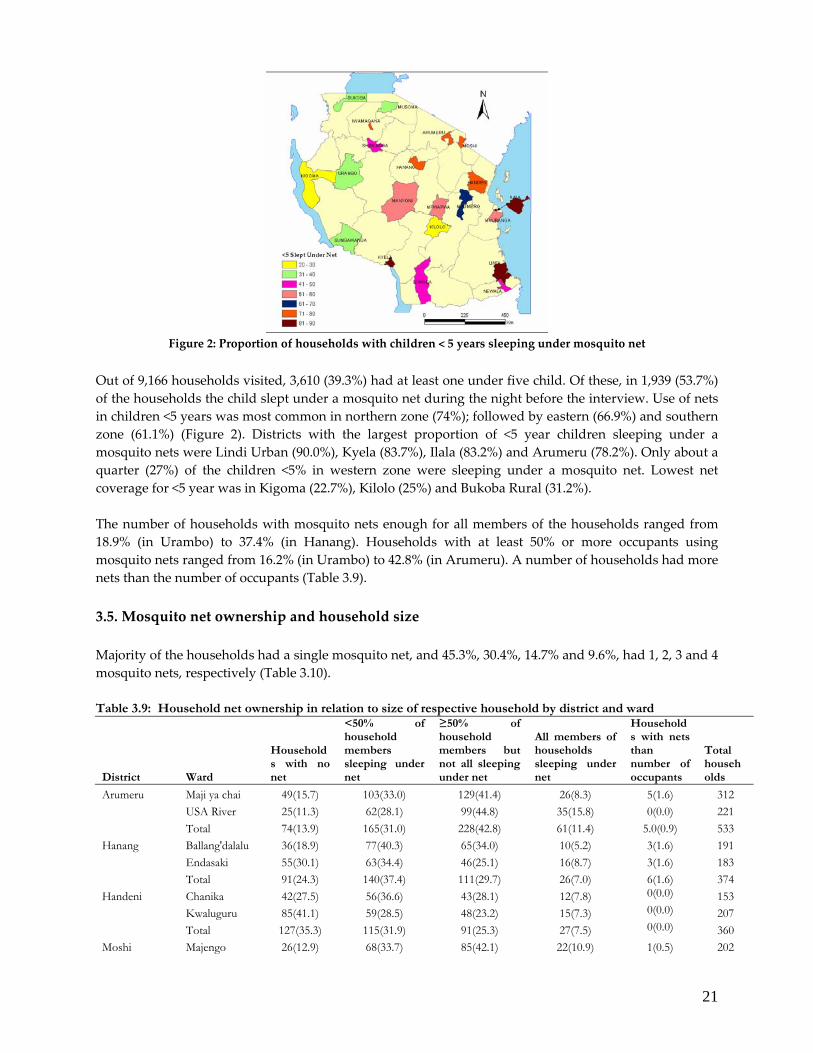
Figure 2: Proportion of households with children < 5 years sleeping under mosquito net
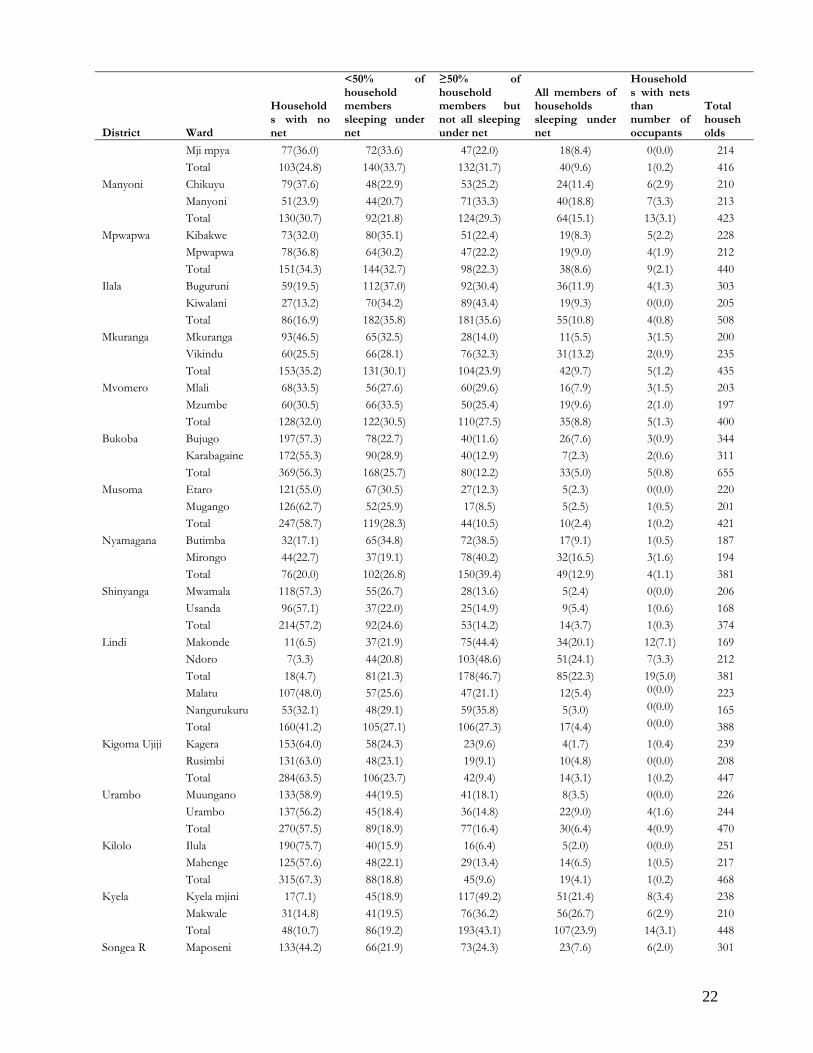
Out of 9,166 households visited, 3,610 (39.3%) had at least one under five child. Of these, in 1,939 (53.7%) of the households the child slept under a mosquito net during the night before the interview. Use of nets in children <5 years was most common in northern zone (74%); followed by eastern (66.9%) and southern zone (61.1%) (Figure 2). Districts with the largest proportion of <5 year children sleeping under a mosquito nets were Lindi Urban (90.0%), Kyela (83.7%), Ilala (83.2%) and Arumeru (78.2%). Only about a quarter (27%) of the children <5% in western zone were sleeping under a mosquito net. Lowest net coverage for <5 year was in Kigoma (22.7%), Kilolo (25%) and Bukoba Rural (31.2%). The number of households with mosquito nets enough for all members of the households ranged from 18.9% (in Urambo) to 37.4% (in Hanang). Households with at least 50% or more occupants using mosquito nets ranged from 16.2% (in Urambo) to 42.8% (in Arumeru). A number of households had more nets than the number of occupants (Table 3.9). 3.5. Mosquito net ownership and household size Majority of the households had a single mosquito net, and 45.3%, 30.4%, 14.7% and 9.6%, had 1, 2, 3 and 4 mosquito nets, respectively (Table 3.10). Table 3.9: Household net ownership in relation to size of respective household by district and ward
District Ward
Households with no net
<50% of household members sleeping under net
≥50% of household members but not all sleeping under net
All members of households sleeping under net
Households with nets than number of occupants
Total households
Arumeru Maji ya chai 49(15.7) 103(33.0) 129(41.4) 26(8.3) 5(1.6) 312 USA River 25(11.3) 62(28.1) 99(44.8) 35(15.8) 0(0.0) 221 Total 74(13.9) 165(31.0) 228(42.8) 61(11.4) 5.0(0.9) 533 Hanang Ballang'dalalu 36(18.9) 77(40.3) 65(34.0) 10(5.2) 3(1.6) 191 Endasaki 55(30.1) 63(34.4) 46(25.1) 16(8.7) 3(1.6) 183 Total 91(24.3) 140(37.4) 111(29.7) 26(7.0) 6(1.6) 374 Handeni Chanika 42(27.5) 56(36.6) 43(28.1) 12(7.8) 0(0.0) 153 Kwaluguru 85(41.1) 59(28.5) 48(23.2) 15(7.3) 0(0.0) 207 Total 127(35.3) 115(31.9) 91(25.3) 27(7.5) 0(0.0) 360 Moshi Majengo 26(12.9) 68(33.7) 85(42.1) 22(10.9) 1(0.5) 202
22
District Ward
Households with no net
<50% of household members sleeping under net
≥50% of household members but not all sleeping under net
All members of households sleeping under net
Households with nets than number of occupants
Total households
Mji mpya 77(36.0) 72(33.6) 47(22.0) 18(8.4) 0(0.0) 214 Total 103(24.8) 140(33.7) 132(31.7) 40(9.6) 1(0.2) 416 Manyoni Chikuyu 79(37.6) 48(22.9) 53(25.2) 24(11.4) 6(2.9) 210 Manyoni 51(23.9) 44(20.7) 71(33.3) 40(18.8) 7(3.3) 213 Total 130(30.7) 92(21.8) 124(29.3) 64(15.1) 13(3.1) 423 Mpwapwa Kibakwe 73(32.0) 80(35.1) 51(22.4) 19(8.3) 5(2.2) 228 Mpwapwa 78(36.8) 64(30.2) 47(22.2) 19(9.0) 4(1.9) 212 Total 151(34.3) 144(32.7) 98(22.3) 38(8.6) 9(2.1) 440 Ilala Buguruni 59(19.5) 112(37.0) 92(30.4) 36(11.9) 4(1.3) 303 Kiwalani 27(13.2) 70(34.2) 89(43.4) 19(9.3) 0(0.0) 205 Total 86(16.9) 182(35.8) 181(35.6) 55(10.8) 4(0.8) 508 Mkuranga Mkuranga 93(46.5) 65(32.5) 28(14.0) 11(5.5) 3(1.5) 200 Vikindu 60(25.5) 66(28.1) 76(32.3) 31(13.2) 2(0.9) 235 Total 153(35.2) 131(30.1) 104(23.9) 42(9.7) 5(1.2) 435 Mvomero Mlali 68(33.5) 56(27.6) 60(29.6) 16(7.9) 3(1.5) 203 Mzumbe 60(30.5) 66(33.5) 50(25.4) 19(9.6) 2(1.0) 197 Total 128(32.0) 122(30.5) 110(27.5) 35(8.8) 5(1.3) 400 Bukoba Bujugo 197(57.3) 78(22.7) 40(11.6) 26(7.6) 3(0.9) 344 Karabagaine 172(55.3) 90(28.9) 40(12.9) 7(2.3) 2(0.6) 311 Total 369(56.3) 168(25.7) 80(12.2) 33(5.0) 5(0.8) 655 Musoma Etaro 121(55.0) 67(30.5) 27(12.3) 5(2.3) 0(0.0) 220 Mugango 126(62.7) 52(25.9) 17(8.5) 5(2.5) 1(0.5) 201 Total 247(58.7) 119(28.3) 44(10.5) 10(2.4) 1(0.2) 421 Nyamagana Butimba 32(17.1) 65(34.8) 72(38.5) 17(9.1) 1(0.5) 187 Mirongo 44(22.7) 37(19.1) 78(40.2) 32(16.5) 3(1.6) 194 Total 76(20.0) 102(26.8) 150(39.4) 49(12.9) 4(1.1) 381 Shinyanga Mwamala 118(57.3) 55(26.7) 28(13.6) 5(2.4) 0(0.0) 206 Usanda 96(57.1) 37(22.0) 25(14.9) 9(5.4) 1(0.6) 168 Total 214(57.2) 92(24.6) 53(14.2) 14(3.7) 1(0.3) 374 Lindi Makonde 11(6.5) 37(21.9) 75(44.4) 34(20.1) 12(7.1) 169 Ndoro 7(3.3) 44(20.8) 103(48.6) 51(24.1) 7(3.3) 212 Total 18(4.7) 81(21.3) 178(46.7) 85(22.3) 19(5.0) 381 Malatu 107(48.0) 57(25.6) 47(21.1) 12(5.4) 0(0.0) 223 Nangurukuru 53(32.1) 48(29.1) 59(35.8) 5(3.0) 0(0.0) 165 Total 160(41.2) 105(27.1) 106(27.3) 17(4.4) 0(0.0) 388 Kigoma Ujiji Kagera 153(64.0) 58(24.3) 23(9.6) 4(1.7) 1(0.4) 239 Rusimbi 131(63.0) 48(23.1) 19(9.1) 10(4.8) 0(0.0) 208 Total 284(63.5) 106(23.7) 42(9.4) 14(3.1) 1(0.2) 447 Urambo Muungano 133(58.9) 44(19.5) 41(18.1) 8(3.5) 0(0.0) 226 Urambo 137(56.2) 45(18.4) 36(14.8) 22(9.0) 4(1.6) 244 Total 270(57.5) 89(18.9) 77(16.4) 30(6.4) 4(0.9) 470 Kilolo Ilula 190(75.7) 40(15.9) 16(6.4) 5(2.0) 0(0.0) 251 Mahenge 125(57.6) 48(22.1) 29(13.4) 14(6.5) 1(0.5) 217 Total 315(67.3) 88(18.8) 45(9.6) 19(4.1) 1(0.2) 468 Kyela Kyela mjini 17(7.1) 45(18.9) 117(49.2) 51(21.4) 8(3.4) 238 Makwale 31(14.8) 41(19.5) 76(36.2) 56(26.7) 6(2.9) 210 Total 48(10.7) 86(19.2) 193(43.1) 107(23.9) 14(3.1) 448 Songea R Maposeni 133(44.2) 66(21.9) 73(24.3) 23(7.6) 6(2.0) 301
23
District Ward
Households with no net
<50% of household members sleeping under net
≥50% of household members but not all sleeping under net
All members of households sleeping under net
Households with nets than number of occupants
Total households
Tanga 50(36.2) 47(34.1) 34(24.6) 6(4.4) 1(0.7) 138 Total 183(41.7) 113(25.7) 107(24.4) 29(6.6) 7(1.6) 439 Sumbawanga Katandala 36(15.7) 65(28.3) 89(38.7) 30(13.0) 10(4.4) 230 Pito 148(72.2) 49(23.9) 8(3.9) 0(0.0) 0(0.0) 205 Total 184(42.3) 114(26.2) 97(22.3) 30(6.9) 10(2.3) 435 Overall total 3,411 (37.1) 2,494 (27.1) 2,351 (25.6) 825 (9.0) 115 (1.3) 9,166
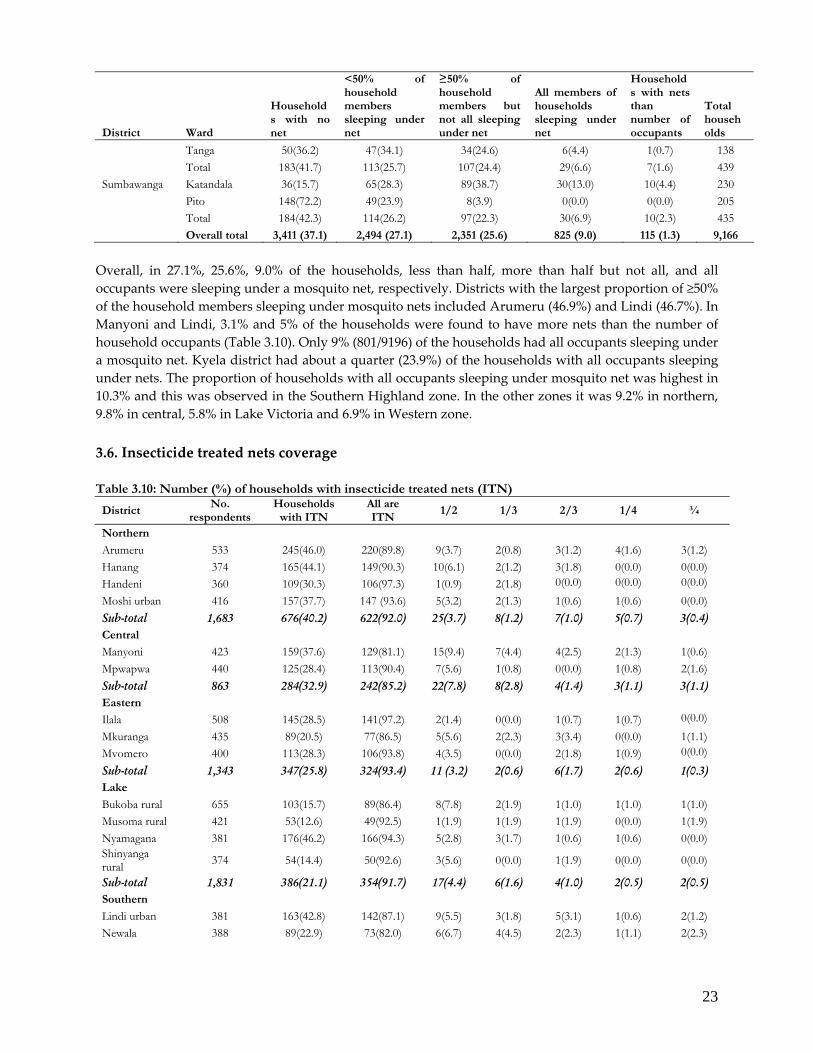
Overall, in 27.1%, 25.6%, 9.0% of the households, less than half, more than half but not all, and all occupants were sleeping under a mosquito net, respectively. Districts with the largest proportion of ≥50% of the household members sleeping under mosquito nets included Arumeru (46.9%) and Lindi (46.7%). In Manyoni and Lindi, 3.1% and 5% of the households were found to have more nets than the number of household occupants (Table 3.10). Only 9% (801/9196) of the households had all occupants sleeping under a mosquito net. Kyela district had about a quarter (23.9%) of the households with all occupants sleeping under nets. The proportion of households with all occupants sleeping under mosquito net was highest in 10.3% and this was observed in the Southern Highland zone. In the other zones it was 9.2% in northern, 9.8% in central, 5.8% in Lake Victoria and 6.9% in Western zone. 3.6. Insecticide treated nets coverage Table 3.10: Number (%) of households with insecticide treated nets (ITN)
District No.
respondents Households
with ITN All are ITN
1/2 1/3 2/3 1/4 ¾
Northern
Arumeru 533 245(46.0) 220(89.8) 9(3.7) 2(0.8) 3(1.2) 4(1.6) 3(1.2) Hanang 374 165(44.1) 149(90.3) 10(6.1) 2(1.2) 3(1.8) 0(0.0) 0(0.0) Handeni 360 109(30.3) 106(97.3) 1(0.9) 2(1.8) 0(0.0) 0(0.0) 0(0.0) Moshi urban 416 157(37.7) 147 (93.6) 5(3.2) 2(1.3) 1(0.6) 1(0.6) 0(0.0) Sub-total 1,683 676(40.2) 622(92.0) 25(3.7) 8(1.2) 7(1.0) 5(0.7) 3(0.4) Central Manyoni 423 159(37.6) 129(81.1) 15(9.4) 7(4.4) 4(2.5) 2(1.3) 1(0.6) Mpwapwa 440 125(28.4) 113(90.4) 7(5.6) 1(0.8) 0(0.0) 1(0.8) 2(1.6) Sub-total 863 284(32.9) 242(85.2) 22(7.8) 8(2.8) 4(1.4) 3(1.1) 3(1.1) Eastern Ilala 508 145(28.5) 141(97.2) 2(1.4) 0(0.0) 1(0.7) 1(0.7) 0(0.0) Mkuranga 435 89(20.5) 77(86.5) 5(5.6) 2(2.3) 3(3.4) 0(0.0) 1(1.1) Mvomero 400 113(28.3) 106(93.8) 4(3.5) 0(0.0) 2(1.8) 1(0.9) 0(0.0) Sub-total 1,343 347(25.8) 324(93.4) 11 (3.2) 2(0.6) 6(1.7) 2(0.6) 1(0.3) Lake Bukoba rural 655 103(15.7) 89(86.4) 8(7.8) 2(1.9) 1(1.0) 1(1.0) 1(1.0) Musoma rural 421 53(12.6) 49(92.5) 1(1.9) 1(1.9) 1(1.9) 0(0.0) 1(1.9) Nyamagana 381 176(46.2) 166(94.3) 5(2.8) 3(1.7) 1(0.6) 1(0.6) 0(0.0) Shinyanga rural 374 54(14.4) 50(92.6) 3(5.6) 0(0.0) 1(1.9) 0(0.0) 0(0.0)
Sub-total 1,831 386(21.1) 354(91.7) 17(4.4) 6(1.6) 4(1.0) 2(0.5) 2(0.5) Southern Lindi urban 381 163(42.8) 142(87.1) 9(5.5) 3(1.8) 5(3.1) 1(0.6) 2(1.2) Newala 388 89(22.9) 73(82.0) 6(6.7) 4(4.5) 2(2.3) 1(1.1) 2(2.3)
24
Sub-total 769 252(32.8) 215(85.3) 15(6.0) 7(2.8) 7(2.8) 2(0.8) 4(1.6) Western Kigoma urban 447 59(13.2) 53(89.8) 4(6.8) 2(3.4) 0(0.0) 0(0.0) 0(0.0) Urambo 470 73(15.5) 64(87.7) 5(6.9) 1(1.4) 1(1.4) 0(0.0) 2(2.7) Sub-total 917 132(14.4) 117(88.6) 9(6.8) 3(2.3) 1(0.8) 0(0.0) 2(1.5) Southern Highlands Kilolo 468 82(17.5) 69(84.2) 8(9.7) 1(1.2) 4(4.9) 0(0.0) 0(0.0) Kyela 448 203(45.3) 179(88.2) 10(4.9) 5(3.2) 3(1.9) 1(0.6) 3(1.9) Songea rural 439 173(39.4) 133(76.9) 21 (12.2) 4(3.3) 8(6.7) 0(0.0) 0(0.0) Sumbawanga urban 435 135(31.0) 118(87.4) 9(6.6) 2(1.5) 5(3.7) 1(0.7) 0(0.0)
Sub-total 1,790 593(33.1) 499(84.2) 48 (8.1) 12(2.4) 20(4.1) 2(0.4) 3(0.6) Overall total 9,166 2,670 (29.0) 2,373(88.9) 235 (5.3) 46 (1.0) 47 (1.9) 16 (0..6 23(0.9)
Key: 1 /2= half; 1/3= one-third; 2/3= two thirds; ¼= quarter; 3 /4 = three quarters of nets are treated. Only 29% of the households had at least one insecticide treated mosquito nets. Only ITNs were available in about half (51.4%) of the households. The largest proportion of households with ITN was observed in northern zone (40.2%), with Arumeru (46%) and Hanang (44.1%) districts having the highest ITN coverage. The lowest proportion (15.5%) of households with ITN was found in the Western Zone. Districts which had the lowest ITN coverage were Musoma Rural (12.6%), Kigoma‐Ujiji (13.2%), and Shinyanga Rural (14.4%) (Table 3.10; Figure 5). At least in 8.1% of the households had half of the nets as ITNs.
Figure 4: Proportion of households with at least one ITN by district, 2008
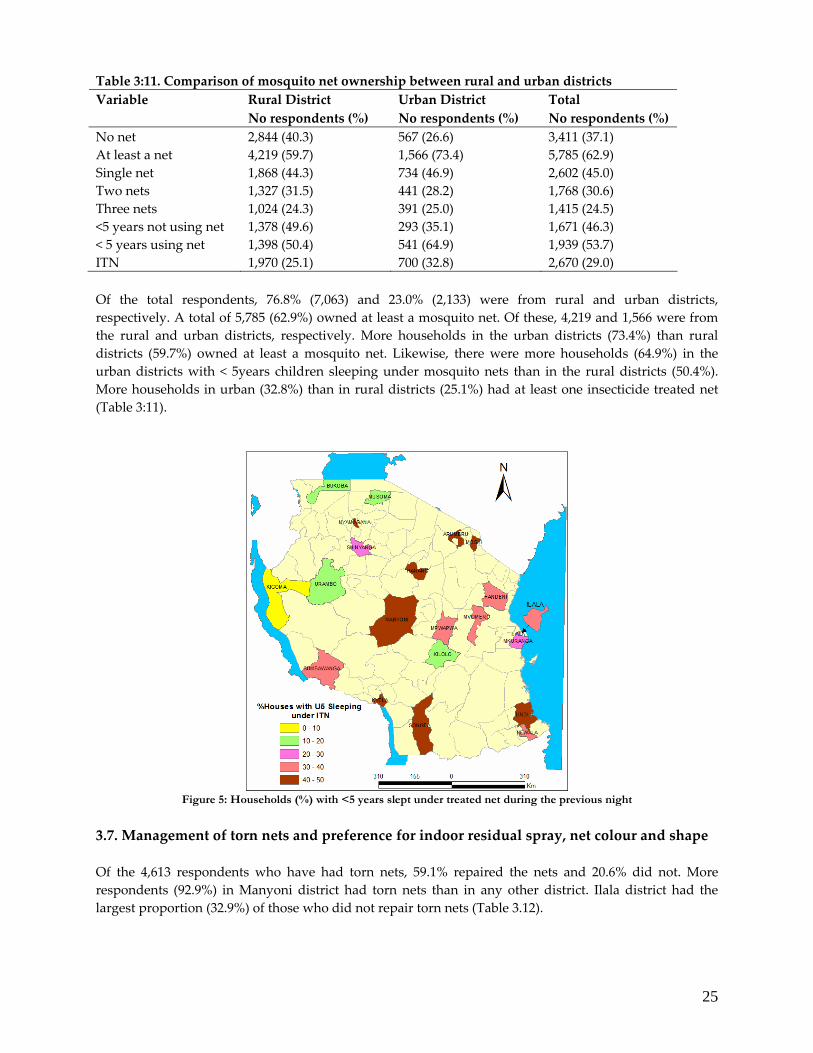
25
Table 3:11. Comparison of mosquito net ownership between rural and urban districts Rural District Urban District Total Variable No respondents (%) No respondents (%) No respondents (%)
No net 2,844 (40.3) 567 (26.6) 3,411 (37.1) At least a net 4,219 (59.7) 1,566 (73.4) 5,785 (62.9) Single net 1,868 (44.3) 734 (46.9) 2,602 (45.0) Two nets 1,327 (31.5) 441 (28.2) 1,768 (30.6) Three nets 1,024 (24.3) 391 (25.0) 1,415 (24.5) <5 years not using net 1,378 (49.6) 293 (35.1) 1,671 (46.3) < 5 years using net 1,398 (50.4) 541 (64.9) 1,939 (53.7) ITN 1,970 (25.1) 700 (32.8) 2,670 (29.0) Of the total respondents, 76.8% (7,063) and 23.0% (2,133) were from rural and urban districts, respectively. A total of 5,785 (62.9%) owned at least a mosquito net. Of these, 4,219 and 1,566 were from the rural and urban districts, respectively. More households in the urban districts (73.4%) than rural districts (59.7%) owned at least a mosquito net. Likewise, there were more households (64.9%) in the urban districts with < 5years children sleeping under mosquito nets than in the rural districts (50.4%). More households in urban (32.8%) than in rural districts (25.1%) had at least one insecticide treated net (Table 3:11).
Figure 5: Households (%) with <5 years slept under treated net during the previous night
3.7. Management of torn nets and preference for indoor residual spray, net colour and shape Of the 4,613 respondents who have had torn nets, 59.1% repaired the nets and 20.6% did not. More respondents (92.9%) in Manyoni district had torn nets than in any other district. Ilala district had the largest proportion (32.9%) of those who did not repair torn nets (Table 3.12).
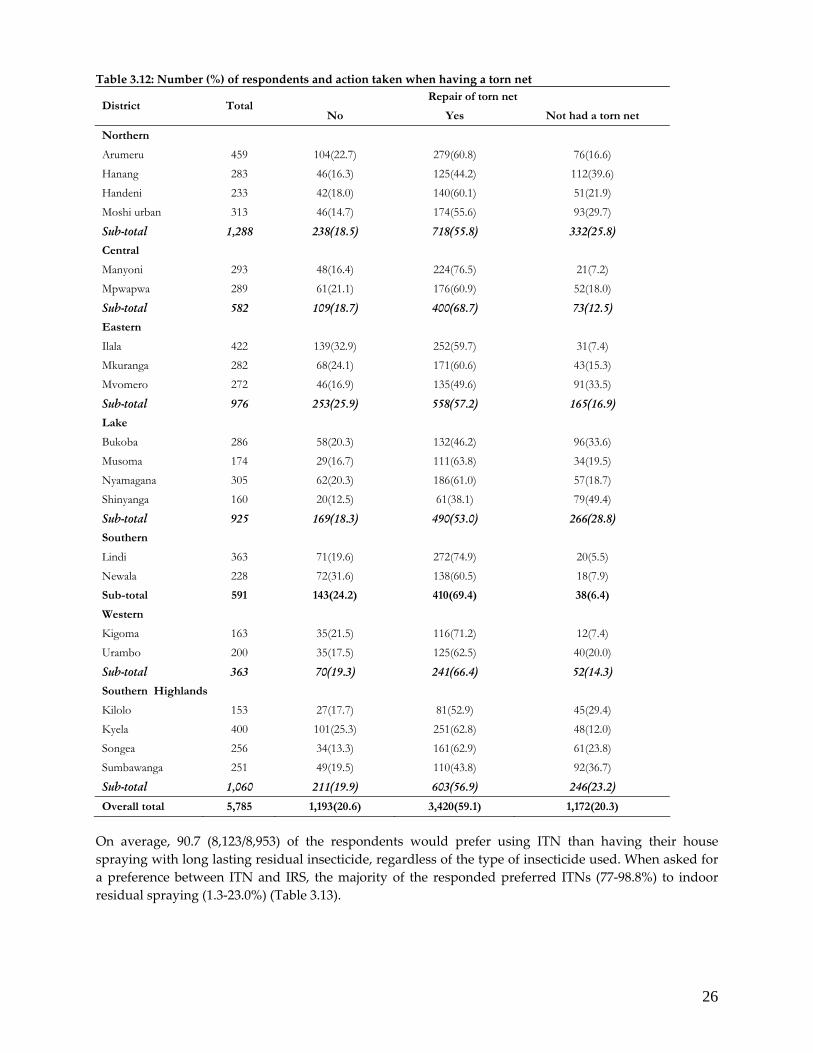
26
Table 3.12: Number (%) of respondents and action taken when having a torn net Repair of torn net
District Total No Yes Not had a torn net
Northern
Arumeru 459 104(22.7) 279(60.8) 76(16.6) Hanang 283 46(16.3) 125(44.2) 112(39.6) Handeni 233 42(18.0) 140(60.1) 51(21.9) Moshi urban 313 46(14.7) 174(55.6) 93(29.7)
Sub-total 1,288 238(18.5) 718(55.8) 332(25.8) Central Manyoni 293 48(16.4) 224(76.5) 21(7.2) Mpwapwa 289 61(21.1) 176(60.9) 52(18.0)
Sub-total 582 109(18.7) 400(68.7) 73(12.5) Eastern Ilala 422 139(32.9) 252(59.7) 31(7.4) Mkuranga 282 68(24.1) 171(60.6) 43(15.3) Mvomero 272 46(16.9) 135(49.6) 91(33.5)
Sub-total 976 253(25.9) 558(57.2) 165(16.9) Lake Bukoba 286 58(20.3) 132(46.2) 96(33.6) Musoma 174 29(16.7) 111(63.8) 34(19.5) Nyamagana 305 62(20.3) 186(61.0) 57(18.7) Shinyanga 160 20(12.5) 61(38.1) 79(49.4)
Sub-total 925 169(18.3) 490(53.0) 266(28.8) Southern Lindi 363 71(19.6) 272(74.9) 20(5.5) Newala 228 72(31.6) 138(60.5) 18(7.9) Sub-total 591 143(24.2) 410(69.4) 38(6.4)
Western Kigoma 163 35(21.5) 116(71.2) 12(7.4) Urambo 200 35(17.5) 125(62.5) 40(20.0)
Sub-total 363 70(19.3) 241(66.4) 52(14.3) Southern Highlands Kilolo 153 27(17.7) 81(52.9) 45(29.4) Kyela 400 101(25.3) 251(62.8) 48(12.0) Songea 256 34(13.3) 161(62.9) 61(23.8) Sumbawanga 251 49(19.5) 110(43.8) 92(36.7)
Sub-total 1,060 211(19.9) 603(56.9) 246(23.2)
Overall total 5,785 1,193(20.6) 3,420(59.1) 1,172(20.3)
On average, 90.7 (8,123/8,953) of the respondents would prefer using ITN than having their house spraying with long lasting residual insecticide, regardless of the type of insecticide used. When asked for a preference between ITN and IRS, the majority of the responded preferred ITNs (77‐98.8%) to indoor residual spraying (1.3‐23.0%) (Table 3.13).
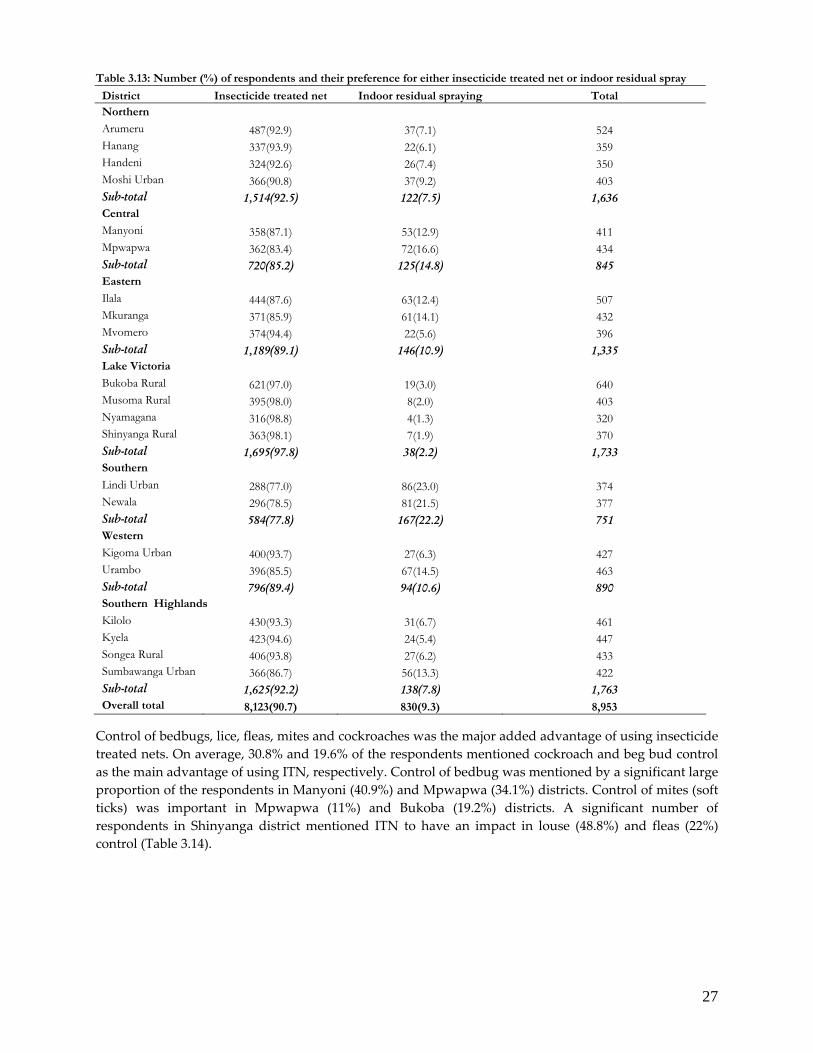
27
Table 3.13: Number (%) of respondents and their preference for either insecticide treated net or indoor residual spray
District Insecticide treated net Indoor residual spraying Total Northern
Arumeru 487(92.9) 37(7.1) 524 Hanang 337(93.9) 22(6.1) 359 Handeni 324(92.6) 26(7.4) 350 Moshi Urban 366(90.8) 37(9.2) 403 Sub-total 1,514(92.5) 122(7.5) 1,636 Central Manyoni 358(87.1) 53(12.9) 411 Mpwapwa 362(83.4) 72(16.6) 434 Sub-total 720(85.2) 125(14.8) 845 Eastern Ilala 444(87.6) 63(12.4) 507 Mkuranga 371(85.9) 61(14.1) 432 Mvomero 374(94.4) 22(5.6) 396 Sub-total 1,189(89.1) 146(10.9) 1,335 Lake Victoria Bukoba Rural 621(97.0) 19(3.0) 640 Musoma Rural 395(98.0) 8(2.0) 403 Nyamagana 316(98.8) 4(1.3) 320 Shinyanga Rural 363(98.1) 7(1.9) 370 Sub-total 1,695(97.8) 38(2.2) 1,733 Southern Lindi Urban 288(77.0) 86(23.0) 374 Newala 296(78.5) 81(21.5) 377 Sub-total 584(77.8) 167(22.2) 751 Western Kigoma Urban 400(93.7) 27(6.3) 427 Urambo 396(85.5) 67(14.5) 463 Sub-total 796(89.4) 94(10.6) 890 Southern Highlands Kilolo 430(93.3) 31(6.7) 461 Kyela 423(94.6) 24(5.4) 447 Songea Rural 406(93.8) 27(6.2) 433 Sumbawanga Urban 366(86.7) 56(13.3) 422 Sub-total 1,625(92.2) 138(7.8) 1,763 Overall total 8,123(90.7) 830(9.3) 8,953
Control of bedbugs, lice, fleas, mites and cockroaches was the major added advantage of using insecticide treated nets. On average, 30.8% and 19.6% of the respondents mentioned cockroach and beg bud control as the main advantage of using ITN, respectively. Control of bedbug was mentioned by a significant large proportion of the respondents in Manyoni (40.9%) and Mpwapwa (34.1%) districts. Control of mites (soft ticks) was important in Mpwapwa (11%) and Bukoba (19.2%) districts. A significant number of respondents in Shinyanga district mentioned ITN to have an impact in louse (48.8%) and fleas (22%) control (Table 3.14).
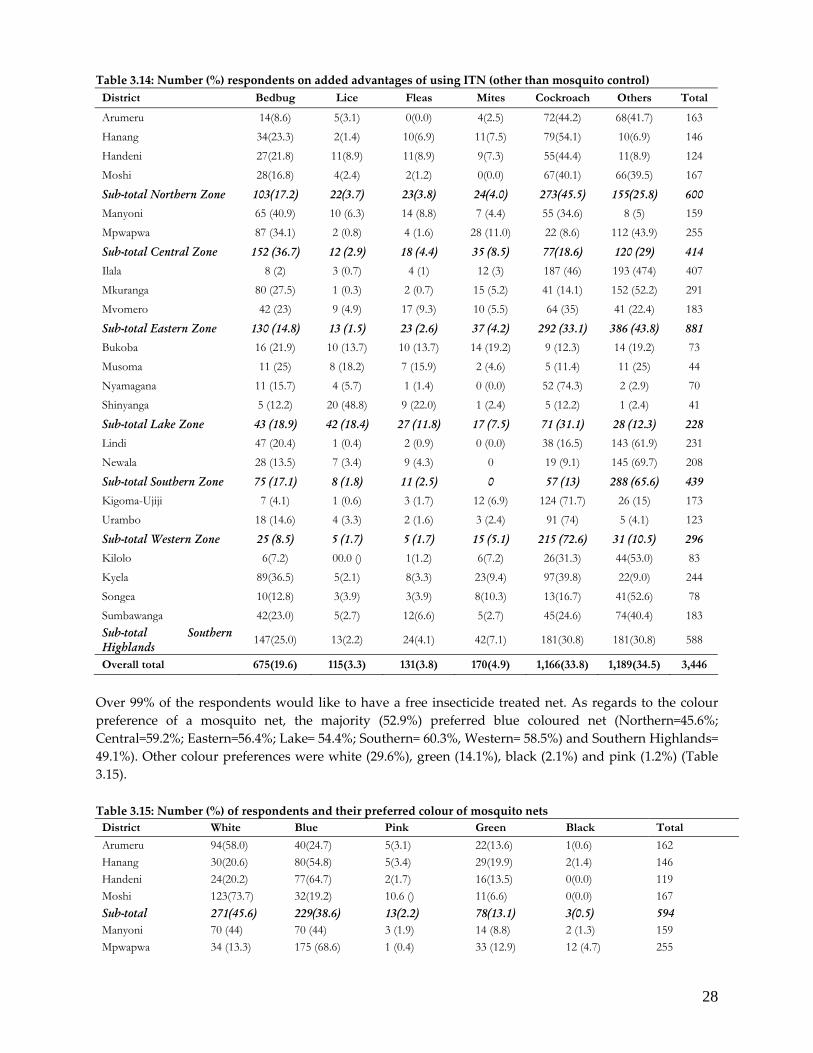
28
Table 3.14: Number (%) respondents on added advantages of using ITN (other than mosquito control) District Bedbug Lice Fleas Mites Cockroach Others Total
Arumeru 14(8.6) 5(3.1) 0(0.0) 4(2.5) 72(44.2) 68(41.7) 163 Hanang 34(23.3) 2(1.4) 10(6.9) 11(7.5) 79(54.1) 10(6.9) 146 Handeni 27(21.8) 11(8.9) 11(8.9) 9(7.3) 55(44.4) 11(8.9) 124 Moshi 28(16.8) 4(2.4) 2(1.2) 0(0.0) 67(40.1) 66(39.5) 167
Sub-total Northern Zone 103(17.2) 22(3.7) 23(3.8) 24(4.0) 273(45.5) 155(25.8) 600 Manyoni 65 (40.9) 10 (6.3) 14 (8.8) 7 (4.4) 55 (34.6) 8 (5) 159 Mpwapwa 87 (34.1) 2 (0.8) 4 (1.6) 28 (11.0) 22 (8.6) 112 (43.9) 255
Sub-total Central Zone 152 (36.7) 12 (2.9) 18 (4.4) 35 (8.5) 77(18.6) 120 (29) 414 Ilala 8 (2) 3 (0.7) 4 (1) 12 (3) 187 (46) 193 (474) 407 Mkuranga 80 (27.5) 1 (0.3) 2 (0.7) 15 (5.2) 41 (14.1) 152 (52.2) 291 Mvomero 42 (23) 9 (4.9) 17 (9.3) 10 (5.5) 64 (35) 41 (22.4) 183
Sub-total Eastern Zone 130 (14.8) 13 (1.5) 23 (2.6) 37 (4.2) 292 (33.1) 386 (43.8) 881 Bukoba 16 (21.9) 10 (13.7) 10 (13.7) 14 (19.2) 9 (12.3) 14 (19.2) 73 Musoma 11 (25) 8 (18.2) 7 (15.9) 2 (4.6) 5 (11.4) 11 (25) 44 Nyamagana 11 (15.7) 4 (5.7) 1 (1.4) 0 (0.0) 52 (74.3) 2 (2.9) 70 Shinyanga 5 (12.2) 20 (48.8) 9 (22.0) 1 (2.4) 5 (12.2) 1 (2.4) 41
Sub-total Lake Zone 43 (18.9) 42 (18.4) 27 (11.8) 17 (7.5) 71 (31.1) 28 (12.3) 228 Lindi 47 (20.4) 1 (0.4) 2 (0.9) 0 (0.0) 38 (16.5) 143 (61.9) 231 Newala 28 (13.5) 7 (3.4) 9 (4.3) 0 19 (9.1) 145 (69.7) 208
Sub-total Southern Zone 75 (17.1) 8 (1.8) 11 (2.5) 0 57 (13) 288 (65.6) 439 Kigoma-Ujiji 7 (4.1) 1 (0.6) 3 (1.7) 12 (6.9) 124 (71.7) 26 (15) 173 Urambo 18 (14.6) 4 (3.3) 2 (1.6) 3 (2.4) 91 (74) 5 (4.1) 123
Sub-total Western Zone 25 (8.5) 5 (1.7) 5 (1.7) 15 (5.1) 215 (72.6) 31 (10.5) 296 Kilolo 6(7.2) 00.0 () 1(1.2) 6(7.2) 26(31.3) 44(53.0) 83 Kyela 89(36.5) 5(2.1) 8(3.3) 23(9.4) 97(39.8) 22(9.0) 244 Songea 10(12.8) 3(3.9) 3(3.9) 8(10.3) 13(16.7) 41(52.6) 78 Sumbawanga 42(23.0) 5(2.7) 12(6.6) 5(2.7) 45(24.6) 74(40.4) 183 Sub-total Southern Highlands
147(25.0) 13(2.2) 24(4.1) 42(7.1) 181(30.8) 181(30.8) 588
Overall total 675(19.6) 115(3.3) 131(3.8) 170(4.9) 1,166(33.8) 1,189(34.5) 3,446
Over 99% of the respondents would like to have a free insecticide treated net. As regards to the colour preference of a mosquito net, the majority (52.9%) preferred blue coloured net (Northern=45.6%; Central=59.2%; Eastern=56.4%; Lake= 54.4%; Southern= 60.3%, Western= 58.5%) and Southern Highlands= 49.1%). Other colour preferences were white (29.6%), green (14.1%), black (2.1%) and pink (1.2%) (Table 3.15). Table 3.15: Number (%) of respondents and their preferred colour of mosquito nets
District White Blue Pink Green Black Total
Arumeru 94(58.0) 40(24.7) 5(3.1) 22(13.6) 1(0.6) 162 Hanang 30(20.6) 80(54.8) 5(3.4) 29(19.9) 2(1.4) 146 Handeni 24(20.2) 77(64.7) 2(1.7) 16(13.5) 0(0.0) 119 Moshi 123(73.7) 32(19.2) 10.6 () 11(6.6) 0(0.0) 167 Sub-total 271(45.6) 229(38.6) 13(2.2) 78(13.1) 3(0.5) 594 Manyoni 70 (44) 70 (44) 3 (1.9) 14 (8.8) 2 (1.3) 159 Mpwapwa 34 (13.3) 175 (68.6) 1 (0.4) 33 (12.9) 12 (4.7) 255
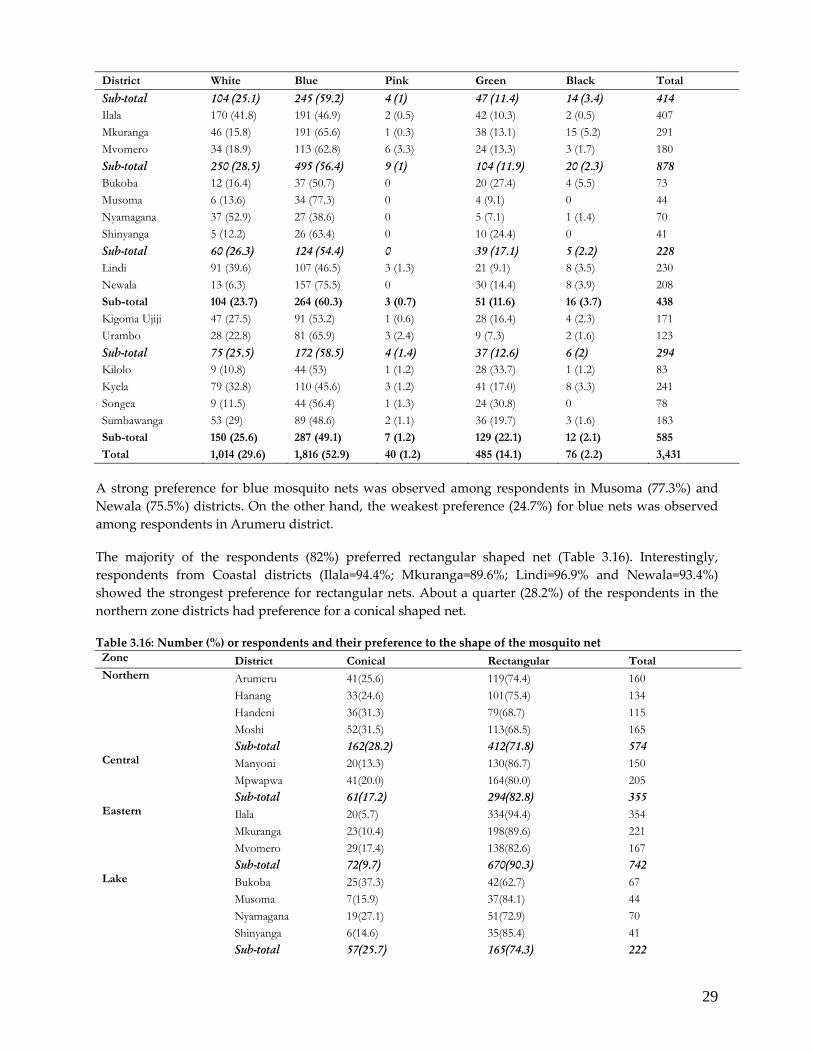
29
District White Blue Pink Green Black Total
Sub-total 104 (25.1) 245 (59.2) 4 (1) 47 (11.4) 14 (3.4) 414 Ilala 170 (41.8) 191 (46.9) 2 (0.5) 42 (10.3) 2 (0.5) 407 Mkuranga 46 (15.8) 191 (65.6) 1 (0.3) 38 (13.1) 15 (5.2) 291 Mvomero 34 (18.9) 113 (62.8) 6 (3.3) 24 (13.3) 3 (1.7) 180 Sub-total 250 (28.5) 495 (56.4) 9 (1) 104 (11.9) 20 (2.3) 878 Bukoba 12 (16.4) 37 (50.7) 0 20 (27.4) 4 (5.5) 73 Musoma 6 (13.6) 34 (77.3) 0 4 (9.1) 0 44 Nyamagana 37 (52.9) 27 (38.6) 0 5 (7.1) 1 (1.4) 70 Shinyanga 5 (12.2) 26 (63.4) 0 10 (24.4) 0 41 Sub-total 60 (26.3) 124 (54.4) 0 39 (17.1) 5 (2.2) 228 Lindi 91 (39.6) 107 (46.5) 3 (1.3) 21 (9.1) 8 (3.5) 230 Newala 13 (6.3) 157 (75.5) 0 30 (14.4) 8 (3.9) 208 Sub-total 104 (23.7) 264 (60.3) 3 (0.7) 51 (11.6) 16 (3.7) 438
Kigoma Ujiji 47 (27.5) 91 (53.2) 1 (0.6) 28 (16.4) 4 (2.3) 171 Urambo 28 (22.8) 81 (65.9) 3 (2.4) 9 (7.3) 2 (1.6) 123 Sub-total 75 (25.5) 172 (58.5) 4 (1.4) 37 (12.6) 6 (2) 294 Kilolo 9 (10.8) 44 (53) 1 (1.2) 28 (33.7) 1 (1.2) 83 Kyela 79 (32.8) 110 (45.6) 3 (1.2) 41 (17.0) 8 (3.3) 241 Songea 9 (11.5) 44 (56.4) 1 (1.3) 24 (30.8) 0 78 Sumbawanga 53 (29) 89 (48.6) 2 (1.1) 36 (19.7) 3 (1.6) 183 Sub-total 150 (25.6) 287 (49.1) 7 (1.2) 129 (22.1) 12 (2.1) 585
Total 1,014 (29.6) 1,816 (52.9) 40 (1.2) 485 (14.1) 76 (2.2) 3,431
A strong preference for blue mosquito nets was observed among respondents in Musoma (77.3%) and Newala (75.5%) districts. On the other hand, the weakest preference (24.7%) for blue nets was observed among respondents in Arumeru district. The majority of the respondents (82%) preferred rectangular shaped net (Table 3.16). Interestingly, respondents from Coastal districts (Ilala=94.4%; Mkuranga=89.6%; Lindi=96.9% and Newala=93.4%) showed the strongest preference for rectangular nets. About a quarter (28.2%) of the respondents in the northern zone districts had preference for a conical shaped net. Table 3.16: Number (%) or respondents and their preference to the shape of the mosquito net
Zone District Conical Rectangular Total Northern Arumeru 41(25.6) 119(74.4) 160 Hanang 33(24.6) 101(75.4) 134 Handeni 36(31.3) 79(68.7) 115 Moshi 52(31.5) 113(68.5) 165 Sub-total 162(28.2) 412(71.8) 574 Central Manyoni 20(13.3) 130(86.7) 150 Mpwapwa 41(20.0) 164(80.0) 205 Sub-total 61(17.2) 294(82.8) 355 Eastern Ilala 20(5.7) 334(94.4) 354 Mkuranga 23(10.4) 198(89.6) 221 Mvomero 29(17.4) 138(82.6) 167 Sub-total 72(9.7) 670(90.3) 742 Lake Bukoba 25(37.3) 42(62.7) 67 Musoma 7(15.9) 37(84.1) 44 Nyamagana 19(27.1) 51(72.9) 70 Shinyanga 6(14.6) 35(85.4) 41 Sub-total 57(25.7) 165(74.3) 222
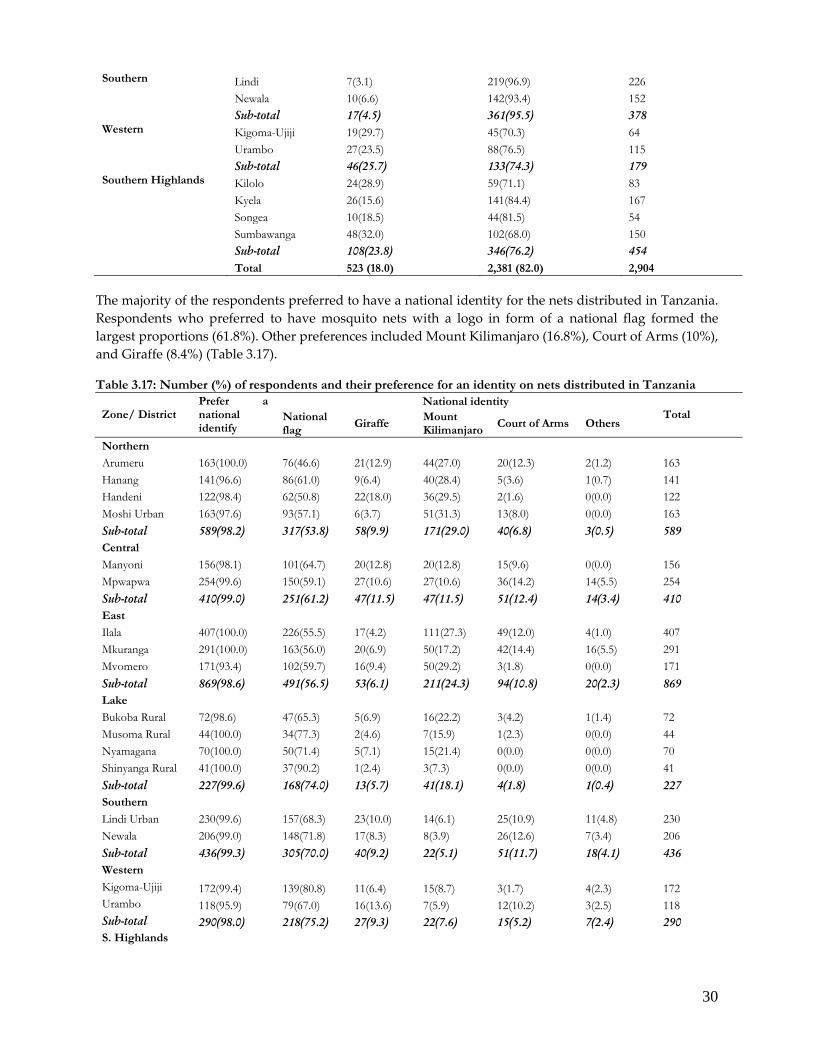
30
Southern Lindi 7(3.1) 219(96.9) 226 Newala 10(6.6) 142(93.4) 152 Sub-total 17(4.5) 361(95.5) 378 Western Kigoma-Ujiji 19(29.7) 45(70.3) 64 Urambo 27(23.5) 88(76.5) 115 Sub-total 46(25.7) 133(74.3) 179 Southern Highlands Kilolo 24(28.9) 59(71.1) 83 Kyela 26(15.6) 141(84.4) 167 Songea 10(18.5) 44(81.5) 54 Sumbawanga 48(32.0) 102(68.0) 150 Sub-total 108(23.8) 346(76.2) 454 Total 523 (18.0) 2,381 (82.0) 2,904
The majority of the respondents preferred to have a national identity for the nets distributed in Tanzania. Respondents who preferred to have mosquito nets with a logo in form of a national flag formed the largest proportions (61.8%). Other preferences included Mount Kilimanjaro (16.8%), Court of Arms (10%), and Giraffe (8.4%) (Table 3.17). Table 3.17: Number (%) of respondents and their preference for an identity on nets distributed in Tanzania
National identity Zone/ District
Prefer a national identify
National flag
Giraffe Mount Kilimanjaro
Court of Arms Others Total
Northern
Arumeru 163(100.0) 76(46.6) 21(12.9) 44(27.0) 20(12.3) 2(1.2) 163 Hanang 141(96.6) 86(61.0) 9(6.4) 40(28.4) 5(3.6) 1(0.7) 141 Handeni 122(98.4) 62(50.8) 22(18.0) 36(29.5) 2(1.6) 0(0.0) 122 Moshi Urban 163(97.6) 93(57.1) 6(3.7) 51(31.3) 13(8.0) 0(0.0) 163 Sub-total 589(98.2) 317(53.8) 58(9.9) 171(29.0) 40(6.8) 3(0.5) 589 Central Manyoni 156(98.1) 101(64.7) 20(12.8) 20(12.8) 15(9.6) 0(0.0) 156 Mpwapwa 254(99.6) 150(59.1) 27(10.6) 27(10.6) 36(14.2) 14(5.5) 254 Sub-total 410(99.0) 251(61.2) 47(11.5) 47(11.5) 51(12.4) 14(3.4) 410 East Ilala 407(100.0) 226(55.5) 17(4.2) 111(27.3) 49(12.0) 4(1.0) 407 Mkuranga 291(100.0) 163(56.0) 20(6.9) 50(17.2) 42(14.4) 16(5.5) 291 Mvomero 171(93.4) 102(59.7) 16(9.4) 50(29.2) 3(1.8) 0(0.0) 171 Sub-total 869(98.6) 491(56.5) 53(6.1) 211(24.3) 94(10.8) 20(2.3) 869 Lake Bukoba Rural 72(98.6) 47(65.3) 5(6.9) 16(22.2) 3(4.2) 1(1.4) 72 Musoma Rural 44(100.0) 34(77.3) 2(4.6) 7(15.9) 1(2.3) 0(0.0) 44 Nyamagana 70(100.0) 50(71.4) 5(7.1) 15(21.4) 0(0.0) 0(0.0) 70 Shinyanga Rural 41(100.0) 37(90.2) 1(2.4) 3(7.3) 0(0.0) 0(0.0) 41 Sub-total 227(99.6) 168(74.0) 13(5.7) 41(18.1) 4(1.8) 1(0.4) 227 Southern Lindi Urban 230(99.6) 157(68.3) 23(10.0) 14(6.1) 25(10.9) 11(4.8) 230 Newala 206(99.0) 148(71.8) 17(8.3) 8(3.9) 26(12.6) 7(3.4) 206 Sub-total 436(99.3) 305(70.0) 40(9.2) 22(5.1) 51(11.7) 18(4.1) 436 Western Kigoma-Ujiji 172(99.4) 139(80.8) 11(6.4) 15(8.7) 3(1.7) 4(2.3) 172 Urambo 118(95.9) 79(67.0) 16(13.6) 7(5.9) 12(10.2) 3(2.5) 118 Sub-total 290(98.0) 218(75.2) 27(9.3) 22(7.6) 15(5.2) 7(2.4) 290 S. Highlands
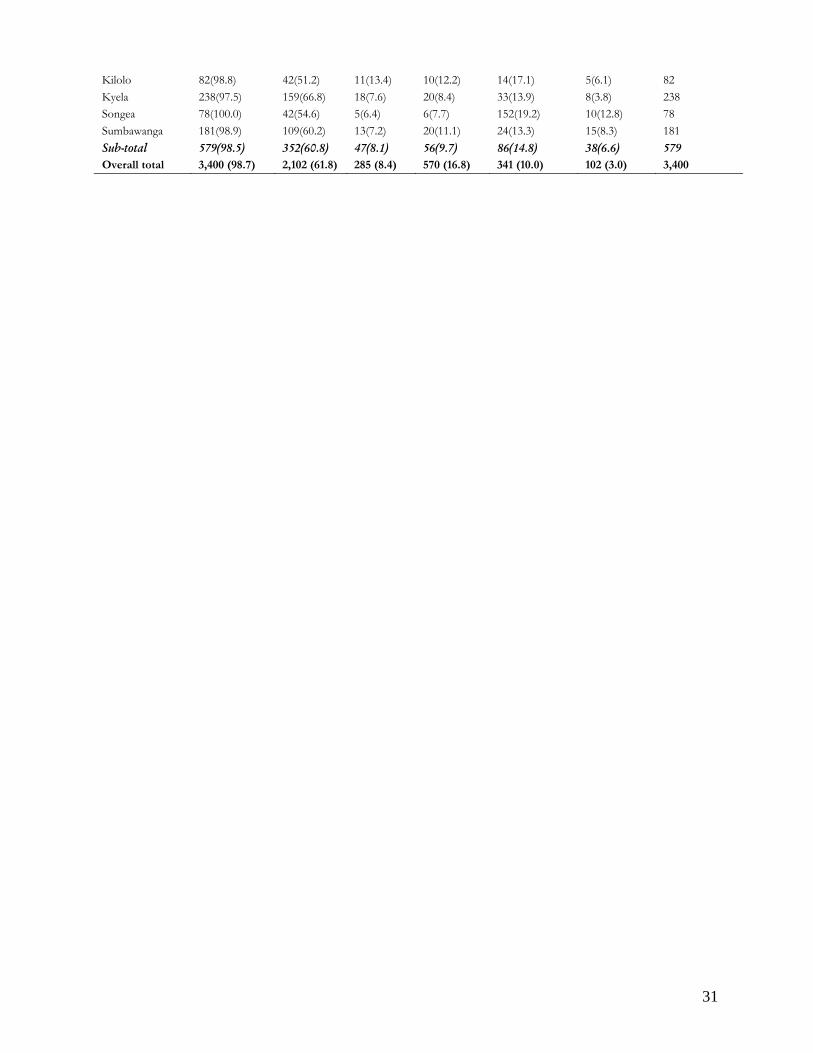
31
Kilolo 82(98.8) 42(51.2) 11(13.4) 10(12.2) 14(17.1) 5(6.1) 82 Kyela 238(97.5) 159(66.8) 18(7.6) 20(8.4) 33(13.9) 8(3.8) 238 Songea 78(100.0) 42(54.6) 5(6.4) 6(7.7) 152(19.2) 10(12.8) 78 Sumbawanga 181(98.9) 109(60.2) 13(7.2) 20(11.1) 24(13.3) 15(8.3) 181 Sub-total 579(98.5) 352(60.8) 47(8.1) 56(9.7) 86(14.8) 38(6.6) 579 Overall total 3,400 (98.7) 2,102 (61.8) 285 (8.4) 570 (16.8) 341 (10.0) 102 (3.0) 3,400
32
DISCUSSION In this study, it was observed that two thirds (62.7%) of the households in Tanzania own at least one mosquito net. However, the proportion of those with insecticide treated nets is still low (29%). A significant variation was observed between districts with the highest and lowest net coverage. While the majority of the respondents in northern (76.5%) and southern (76.5%) zones own at least a mosquito net, the majority of people in Kilolo (65.2%), Kigoma‐Ujiji (63.5%) and Musoma Rural (58.7%) had no mosquito nets. Ownership of ITN showed a similar trend. The largest proportions of households with ITN were found in northern zone (40.2%), particularly in Arumeru (46%) and Hanang (44.1%) districts. The lowest proportions of households with ITN were in Musoma (12.6%), Kigoma‐Ujiji (13.2%), and Shinyanga (14.4%). Mosquiot net ownership was higher among households in urban than rural districts Mosquito net ownership was highest in Lindi Urban, Kyela, Arumeru, Ilala, and Nyamagana. Lindi, Ilala and Nyamagana are urban districts. Like in a recent survey by Hanson et al. (2007), urban residence was a significant predictor of mosquito net use among households in Tanzania. However, this was not true for Kigoma‐Ujiji. This is most probably due to poor knowledge on the relationship between mosquito density and malaria transmission. Low mosquito coverage in Kilolo district (located in higher altitudes) (Mboera et al., 2006) is likely to be attributed to low mosquito densities and hence prompting people from using nets mainly during the cool part of the year. The reasons for low net utilisation in some districts could not be established. However, poverty, low knowledge on the linkage between mosquito and malaria transmission and low ITN promotion in these districts are likely to play a great role in the low coverage of ITN. There was a seasonal variation in the mosquito net usage in some districts. In such districts a high mosquito net utilisation was observed during the rainy season. The low net usage during the dry season is likely to be attributed to low mosquito densities. In a recent study in India, low mosquito density was reported as one of the reasons given by people for the low use rate of ITN (Jambulingam et al., 2008). Mosquito nets may have a higher acceptability in many households as a defense against mosquito nuisance bites than as malaria prevention (Okenu et al., 1999; Yohannes et al., 2000; Jambulingam et al., 2008). The seasonal usage of mosquito net among households in a number of districts needs to be addressed through appropriate health education programmes. Communities should be made aware of the benefits of mosquito net use in the prevention of malaria rather than prevention of mosquito biting nuisance. It is important communities are made aware of the benefit of mosquito nets in the prevention of malaria to enhance the use rate throughout the year. The observations that insecticide treated nets had added advantage in the control of coackroaches, bed bugs and fleas should be included in in health education and promotion packages. Already, it has been established that affordability of voucher nets has been another significant contributor to low coverage of pregnant women in the poorer quintiles (Hanson et al., 2007). Mosquito net possession has been reported to be lower among poorest quintiles compared to least‐poor quintiles. Moreover, campaigns have shown to have a significant contribution to the increase in net ownership in southern Tanzania (Skarbinski et al., 2007). Although our findings indicate ITN coverage of 42.8% in Lindi, reports available indicate a much higher coverage (Skarbinski et al., 2007). In 2005, 162,254 bednets bundled with insecticide were distributed in Lindi Region, achieving a 98.3% (NMCP, 2005). The highest net coverage among children in Lindi (90%) is likely to be a result of the distribution done in 2005. In a study by Skarbinski et al. (2007), 79.6% of the children in Lindi Region had received a mosquito net. In general, the higher net coverage among the under 5s was as expected because this is one of the target population for the subsidised mosquito nets.
33
The low ITN found in Lindi in the current study is likely to indicate that the previously distributed nets were not re‐treated by the time of this survey. Generally, household ownership of any mosquito net in this study is slightly higher than that reported recently. In a recent survey by Hanson et al. (2007), household ownership of at least one net increased from 43% to 57% between 2005 and 2006. The same report has shown that among children under five years of age, use of any net increased from 28 to 41%, and ITN use from 15 to 28%. According to Tanzania Net Voucher Scheme, 36% of the households in Tanzania have at least one ITN and 65% have at least one net; 26% of children < 5years sleep under an ITN and 23 % of pregnant women sleep under an ITN (MoH, 2008). In over three quarters (77%) of the households, mosquito nets were visually inspected by the research team. Household owners denying entry of their bed room made it difficult to verify their responses. In a recent study in Mvomero, Tanzania, the response of households on the number of mosquito nets they had differ significantly from the available nets (Mboera et al., 2007b). This has an implication in determining net coverage by just relying solely on the verbal responses from the household respondent. The presence of torn nets in a number of households was common. Interestingly, the majority of the people do repair their torn nets. Respondents in Manyoni district had the largest proportion (97.5%) of individuals who had torn nets. The tendency to repair torn nets indicates community knowledge that an intact net has high protective effect. A preference for shape and colour of net was observed in all districts. However, this varied from district to district. Over half of the respondents prefer blue coloured nets while over three‐quarters of the respondents prefer rectangular nets. Another recent study in the country has established that blue colour and rectangular‐shaped nets were important attributes in determining the choice of an ITN (Mujinja, 2002). Similarly, in Uganda, rectangular nets were preferred more than conical or triangular nets (Okello‐Ogojo, 2001). In a study in Malawi, rural communities preferred rectangular nets followed by conical nets, whereas in urban areas the preference was for conical nets followed by rectangular nets. Unlike in studies in Tanzania, the most popular colour in Malawi was white, which was slightly higher amongst urban compared to rural responders (Coombes et al., 1998). It was interesting to note that the majority of the respondents were in favour of the use of ITN rather than indoor residual spraying (IRS). The low preference of IRS is likely to be due to its requirement for taking out personal belonging before the beginning of the spraying exercise. The National Malaria Control Programme in collaboration with development partners plan to introduce new interventions from late 2008. These include a catch up campaign in which all children under five will receive a free LLIN. The voucher will continue to be distributed to pregnant women and infants as a keep up strategy to maintain the high coverage achieved from the catch up campaign. Complementing these efforts will be the re‐treatment of the existing net crop and a major scale up of behaviour change communication activities. According to NATNET Tanzania, the target for high ITN/LLIN coverage has shifted from the Abuja target of 60% to 80% with the aim of producing more broad based impact (NATNETS, 2008). Tanzania has planned a “Catch Up” campaign combined with a “Keep Up” campaign using LLINs to rapidly increase coverage. It is important that the variations in mosquito net coverage observed in this study are taken into consideration. Already, it has been shown in southern Tanzania that free mosquito net distribution is effective in rapidly and equitably increasing household ownership and use of nets (Skarbinski et al., 2007).
34
In conclusion, on average, only two thirds and one‐third of the households in Tanzania own at least one mosquito net (any type) and insecticide treated net, respectively. Tanzania expects that ITN coverage of under fives in 2009, after the Under Five Catch‐up Campaign is complete, to be at least 80%. It is clear from this and other studies that coverage targeted only at the vulnerable groups may be appropriate but not perfect. Community‐wide distribution of mosquito nets for universal coverage needs to be emphasised to accelerate the scaling up of net coverage for impact in the country. This is possible now that initiatives to provide every sleeping bed with an ITN are available.
35
REFERENCES Abdulla, S., Schellenberg, JR., Nathan, R., Mukasa, O., Marchant, T., Smith, T., Tanner, M. & Lengeler, C.
(2001) Impact on malaria morbidity of a programme supplying insecticide treated nets in children aged under 2 years in Tanzania: community cross sectional study. BMJ 322, 270‐273.
Coombes, Y., Ngwale, M. & Chavasse, D. (1998) Baseline Malaria and Mosquito Net Survey. Blantyre Insecticide Treated Bednet Project. September/October 1998.
Curtis, CF., Myamba, J. & Wilkes, TJ. (1996) Comparison of different insecticide and fabrics for anti‐mosquito bednets and curtains. Medical and Veterinary Entomology 10, 1‐11.
Fraser‐Hurt, N. & Lyimo, EO. (1998) Insecticide‐treated nets and treatment service: a trial using public and private sector channels in rural United Republic of Tanzania. Bulletin of the World Health Organization 76, 607‐615.
Hanson, K., Marchant, T., Mponda, H., Nathan, R. & Bruce, J. (2007) Monitoring and Evaluation of the TNVS: Report on 2006 TNVS Household, Facility services and Facility users surveys (a comparison between baseline and 12 month follow‐up).
Jambulingam, P., Gunasekaran, K., Sahu, S.S. & Vijayakumar, T. (2008) Insecticide treated mosquito nets for malaria control in India: experience from a tribal area on operational feasibility and uptake. Memorias do Instituto Oswaldo Cruz, Rio de Janeiro 103, 165‐171.
Killeen, GF., Smith, TA., Ferguson, HM., Mshinda, H., Abdulla, S., Lengeler, C., Kachur, SP., (2007) Preventing Childhood Malaria in Africa by Protecting Adults from Mosquitoes with Insecticide‐Treated Nets. PLoS Medicine. Vol. 4 (7): 1246‐1258.
Kitua, AY., Mboera, L., Magesa, SM., Maxwell, CA. & Curtis, C.F. (2008) The untapped potential of bed nets. Science 319, 900.
Lines, JD., Myamba, J., Curtis, CF. (1987) Experimental hut trials of permethrin‐impregnated mosquito nets and eave curtains against malaria vectors in Tanzania. Medical and Veterinary Entomology 1, 37‐51.
Magesa, SM., Wilkes, TJ., Mnzava, AE., Njunwa, KJ., Myamba, J., Kivuyo, MD., Hill, N., Lines, JD., Curtis, CF. (1991) Trial of pyrethroid impregnated bednets in an area of Tanzania holoendemic for malaria Part 2. Effects on the malaria vector population. Acta Tropica, 49: 97‐108.
Magesa, SM., Lengeler, C., de Savigny, D., Miller, JE., Njau, RJA., Kramer, K., Kitua, AY. and Mwita, A. (2005) Creating an ʺEnabling Environmentʺ for taking Insecticide Treated Nets to National Scale: The Tanzanian Experience. Malaria Journal 4: 34. 22 July 2005.
Makemba, AM., Winch, PJ., Makame, VM., Mehl, GL., Premji, Z., Minjas, JN. & Shiff, CJ. (1996) Treatment practices for degedege, a locally recognised febrile illness, and implications for strategies to decrease mortality from severe malaria in Bagamoyo District, Tanzania. Tropical Medicine and International Health 1, 305‐313.
Malima, RC., Magesa, S M., Tungu, PK., Mwingira, V., Magogo, FS., Sudi, W., Mosha, FW., Curtis, CF., Maxwell, CA. and Rowland, M. (2008) An experimental hut evaluation of Olyset® nets against anopheline mosquitoes after seven years use in Tanzanian villages. Malaria Journal, 2008, 7: 38.
Marchant, T., Schellenberg, JA., Edgar, T., Nathan, R., Abdulla, S., Mukasa, O., Mponda, H. & Lengeler, C. (2002) Socially marketed insecticide‐treated nets improve malaria and anaemia in pregnancy in southern Tanzania. Tropical Medicine & International Health 7, 149‐158.
Maxwell, CA., Myamba, J., Njunwa, KJ., Greenwood, BM., Curtis, CF. (1999) Comparison of bednets impregnated with different pyrethroids for their impacts on mosquitoes and on re‐infection with malaria fever after clearance of pre‐existing infections with chlorproguanil‐dapsone. Transactions of the Royal Society of Tropical Medicine and Hygiene 93, 4‐11.
Mboera, LEG., Mlozi, MRS., Senkoro, KP., Rwegoshora, RT., Rumisha, SF., Mayala, BK., Shayo, EH., Senkondo, E., Mutayoba, B., Mwingira, V. & Maerere, V. (2007a) Malaria and Agriculture in Tanzania: Impact of land‐use and agricultural practices on malaria burden in Mvomero District.
36
Mboera, LEG., Magesa, SM. & Molteni, F. (2006) Indoors man‐biting mosquitoes and their implication on malaria transmission in Mpwapwa and Iringa Districts, Tanzania. Tanzania Health Research Bulletin 8 (3), 141‐144.
Mboera, LEG., Makundi, AE. & Kitua, AY. (2007a) Uncertainty in malaria control in Tanzania: crossroads and challenges for future interventions. American Journal of Tropical Medicine and Hygiene 77, (Suppl 6), 112‐118.
Mboera, LEG., Mlozi, MRS., Senkoro, KP., Rwegoshora, RT., Rumisha, SF., Mayala, BK., Shayo, EH., Senkondo, E., Mutayoba, B., Mwingira, V. & Maerere, V. (2007b) Malaria and Agriculture in Tanzania: Impact of land‐use and agricultural practices on malaria burden in Mvomero District.
Miller, JE., Buriyo, A., Karugila, A., Lines, JD. (1999) A new strategy for treating nets. Part 1: formulation and dosage. Tropical Medicine and International Health 4, 160‐166.
Miller, JE., Jones, CO., Ndunguru, S., Curtis, V., Lines, J. (1999) A new strategy for treating nets. Part 2: users’ perceptions for insecticide dosage. Tropical Medicine and International Health 4, 167‐174.
MoH (2002) Ministry of Health: National Medium Term Malaria Strategic Plan (2002‐2007). Ministry of Health, Dar es Salaam, United Republic of Tanzania, 2002.
MoH (2006) Annual Health Statistical Abstract. Ministry of Health and Social Welfare, Dar es Salaam, United Republic of Tanzania.
MoH (2008) Medium Term Malaria Strategic Plan 2008‐2013. Ministry of Health and Social Welfare, Dar es Salaam, United Republic of Tanzania. February 2008 (unpublished).
Mujinja, PGM. (2002) Use and Relevance of Stated Preference Methods in Determining Willingness to Pay for Insecticide Treated Bed Nets in a Rural Area in Tanzania. PhD Thesis.
NATNETS (2008) NATNETS Consultative Group Meeting. Progressing Towards Universal Coverage. Final Report. The National Insecticide Treated Nets Programme (NATNETS), Dar es Salaam Tanzania. April 17, 2008
Njunwa, KJ., Lines, JD., Magesa, SM., Mnzava, AE., Wilkes, TJ., Alilio, M., Kivumbi, K., Curtis, CF. (1991) Trial of pyrethroid impregnated bednets in an area of Tanzania holoendemic for Malaria Part 1. Operational Methods and acceptability. Acta Tropica, 49: 87‐96..
Okello‐Ogojo, F. (2001) Knowledge, Attitudes, and Practices Related to Malaria and Insecticide Treated Nets in Uganda. Baseline Survey: December 1999 – January 2000. Deloitte Touche Tohmatsu, US Agency for International Development. February 2001.
Okenu, D.M.N. (1999) An integrated approach for malaria control in Africa. Malaria and Infectious Diseases in Africa. 10, 4‐13.
Sachs. JD. (2005), The end of poverty: How can we make it happen in our lifetime. The Penguin Books, London.
Schellenberg, JA., Abdulla, S., Nathan, R., Mukasa, O., Marchant, TJ., KIkumbih, N., Mushi, AK., Mponda, H., Minja, H., Mshinda, H., Tanner, M. & Lengeler, C. (2001) Effect of large‐scale social marketing of insecticide treated nets on child survival in rural Tanzania. Lancet 357, 1241‐1247.
Schönfeld, M., Miranda, IB., Schunk, M., Maduhu, I., Maboko, L., Hoelscher, M., Berens‐Riha, N., Kitua, A. & Löscher, T., 2007. Molecular surveillance of drug‐resistance associated mutations of Plasmodium falciparum in south‐west Tanzania. Malaria Journal 6: 2.
Skarbinski, J., Massaga, J.J., Rowe, A.K. & Kachur, P. (2007) Distribution of free untreated bednet bundled with insecticide via an integrated child health campaign in Lindi Region, Tanzania: Lessons for future campaigns. American Journal of Tropical Medicine and Hygiene 76, 1100‐1106.
Tami, A., Mubyazi, G., Talbert, A., Mshinda, H., Duchon, S., Lengeler, C. (2004) Evaluation of Olyset insecticide treated nets distributed seven year previosly in Tanzania. Malaria Journal 3, 19.
Teklehaimanot, A., Sachs, JD. & Curtis, CF. (2007) Malaria control needs mass distribution of insecticidal bednets. Lancet 369, 2143.

37
Yohannes, K., Dulhunty, J.M., Kourleoutov, C., Manuopangai, V.T., Polyn, M.K., Parks, W.J., Williams, G.M., Bryan, J.H. (2000) Malaria control in central Malaita, Solomon Islands. 1. Use of insecticide impregnated bed nets. Acta Tropica 75, 173‐183.
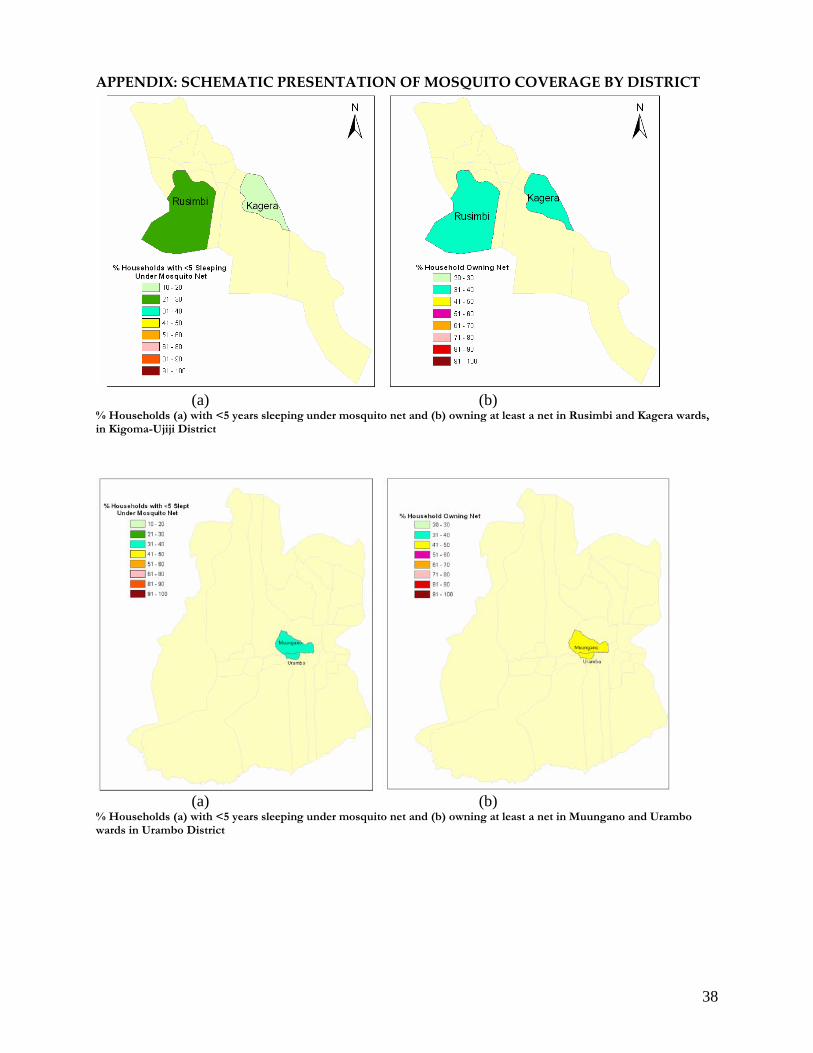
38
APPENDIX: SCHEMATIC PRESENTATION OF MOSQUITO COVERAGE BY DISTRICT
(a) (b)
% Households (a) with <5 years sleeping under mosquito net and (b) owning at least a net in Rusimbi and Kagera wards, in Kigoma-Ujiji District
(a) (b)
% Households (a) with <5 years sleeping under mosquito net and (b) owning at least a net in Muungano and Urambo wards in Urambo District
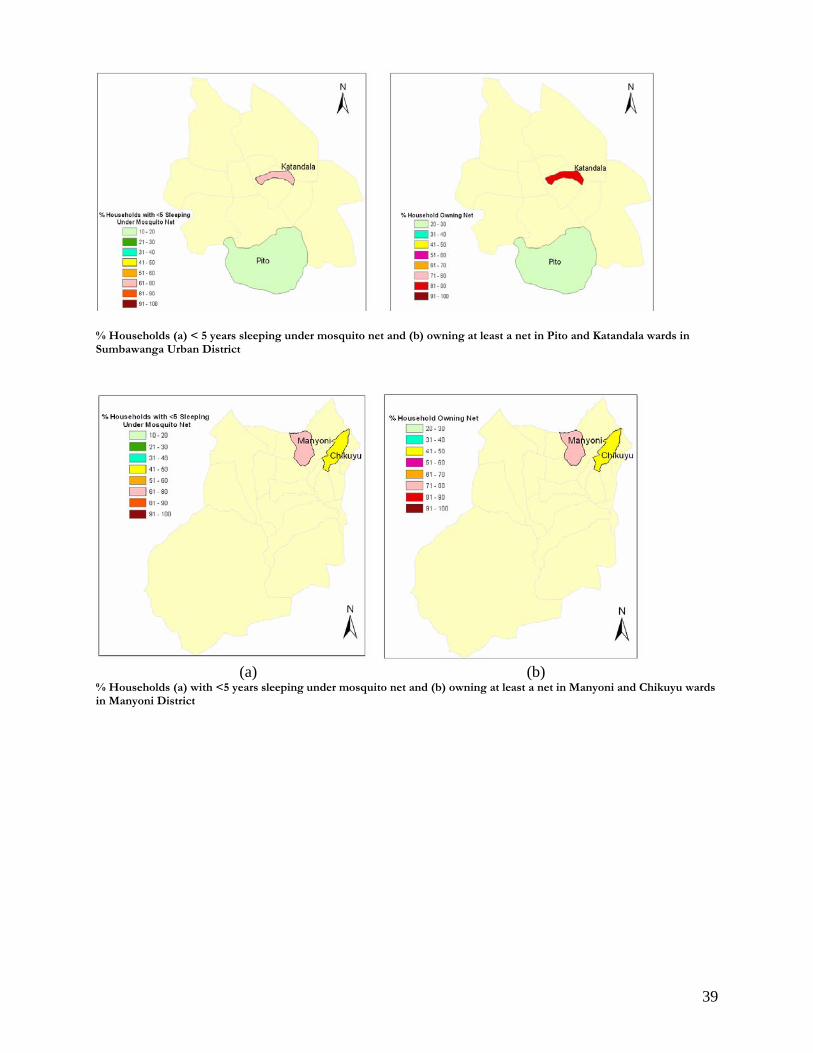
39
% Households (a) < 5 years sleeping under mosquito net and (b) owning at least a net in Pito and Katandala wards in Sumbawanga Urban District
(a) (b)
% Households (a) with <5 years sleeping under mosquito net and (b) owning at least a net in Manyoni and Chikuyu wards in Manyoni District
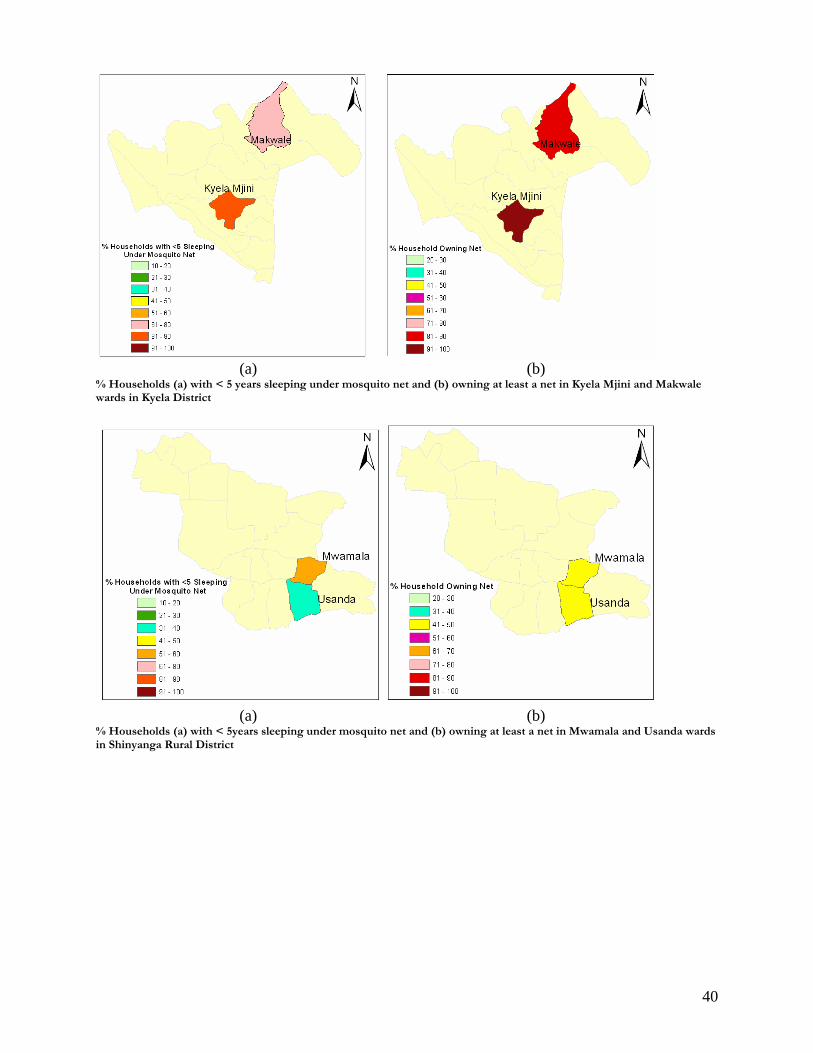
40
(a) (b)
% Households (a) with < 5 years sleeping under mosquito net and (b) owning at least a net in Kyela Mjini and Makwale wards in Kyela District
(a) (b)
% Households (a) with < 5years sleeping under mosquito net and (b) owning at least a net in Mwamala and Usanda wards in Shinyanga Rural District
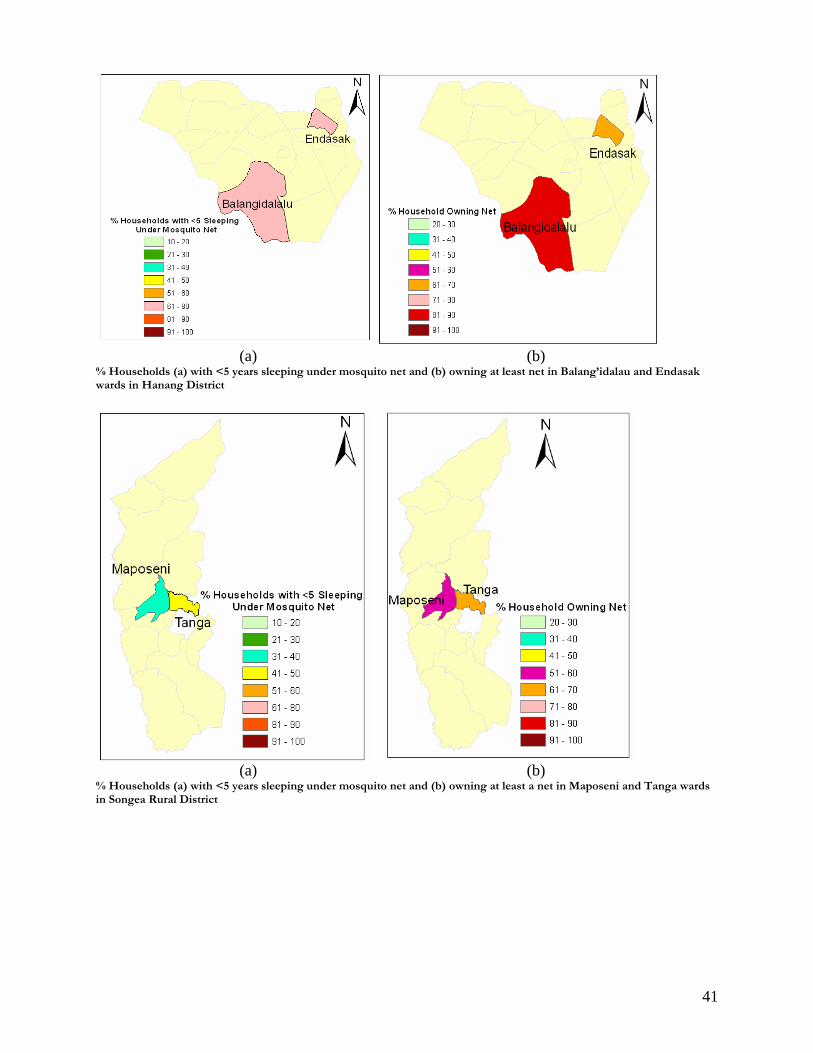
41
(a) (b)
% Households (a) with <5 years sleeping under mosquito net and (b) owning at least net in Balang’idalau and Endasak wards in Hanang District
(a) (b)
% Households (a) with <5 years sleeping under mosquito net and (b) owning at least a net in Maposeni and Tanga wards in Songea Rural District
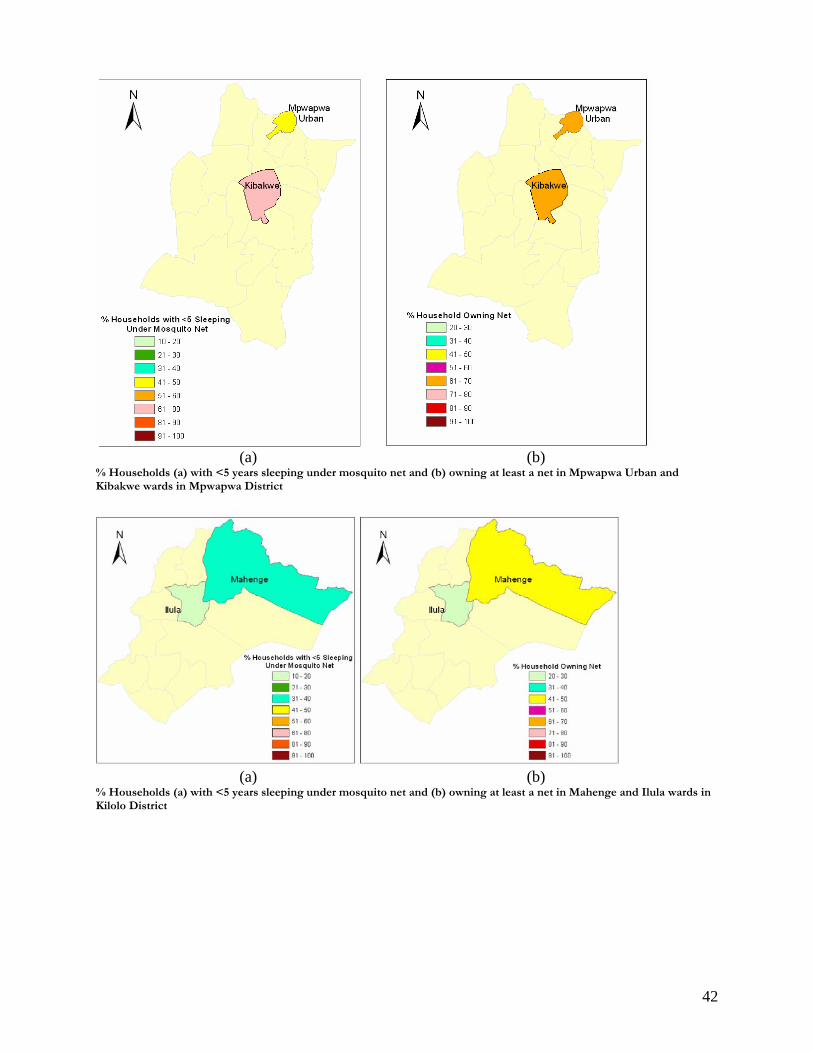
42
(a) (b)
% Households (a) with <5 years sleeping under mosquito net and (b) owning at least a net in Mpwapwa Urban and Kibakwe wards in Mpwapwa District
(a) (b)
% Households (a) with <5 years sleeping under mosquito net and (b) owning at least a net in Mahenge and Ilula wards in Kilolo District
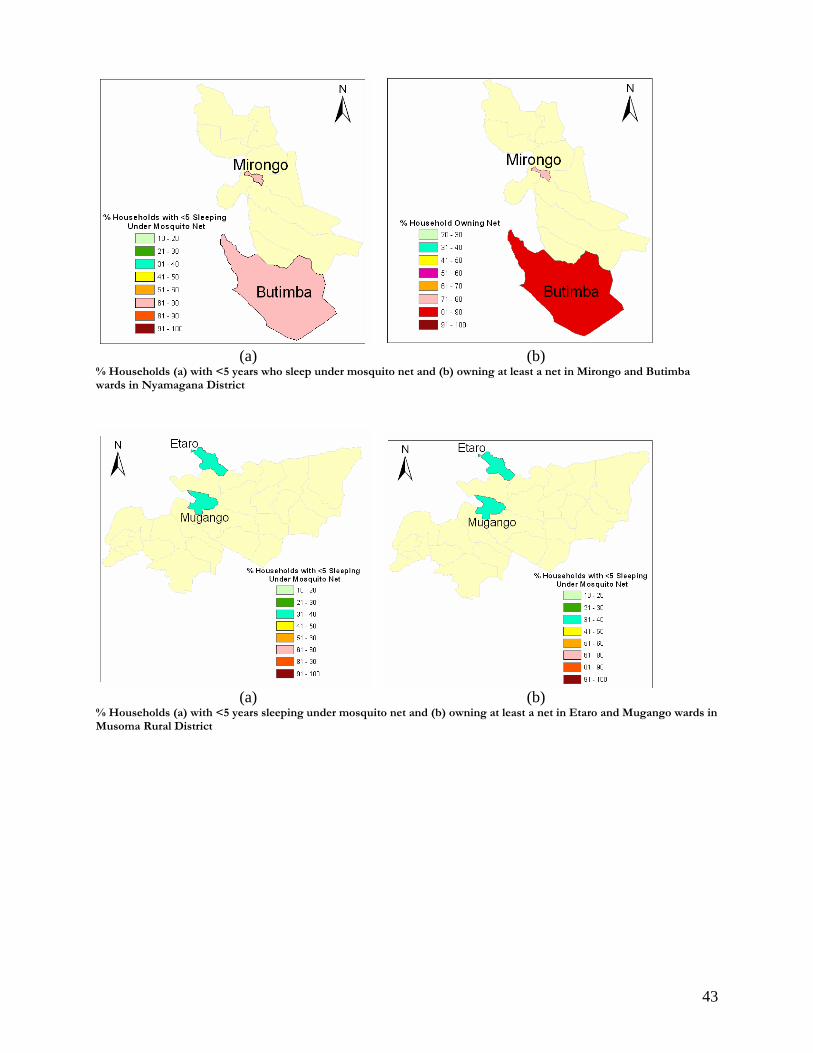
43
(a) (b)
% Households (a) with <5 years who sleep under mosquito net and (b) owning at least a net in Mirongo and Butimba wards in Nyamagana District
(a) (b)
% Households (a) with <5 years sleeping under mosquito net and (b) owning at least a net in Etaro and Mugango wards in Musoma Rural District
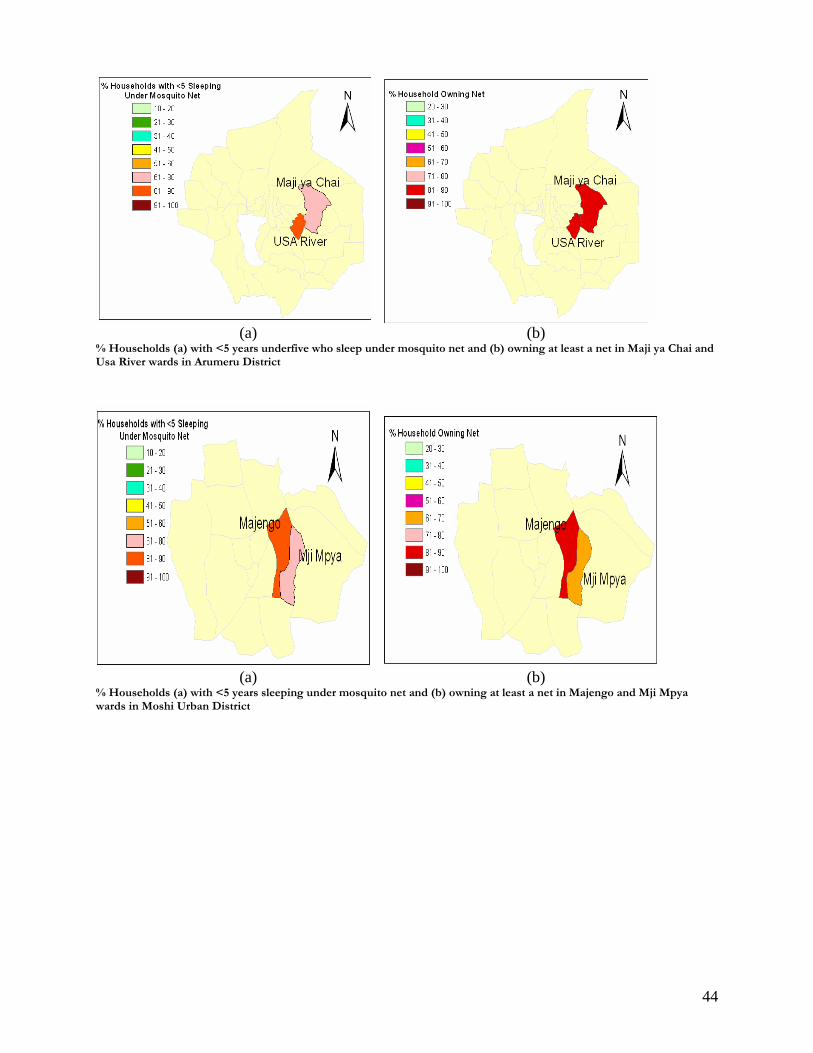
44
(a) (b)
% Households (a) with <5 years underfive who sleep under mosquito net and (b) owning at least a net in Maji ya Chai and Usa River wards in Arumeru District
(a) (b)
% Households (a) with <5 years sleeping under mosquito net and (b) owning at least a net in Majengo and Mji Mpya wards in Moshi Urban District
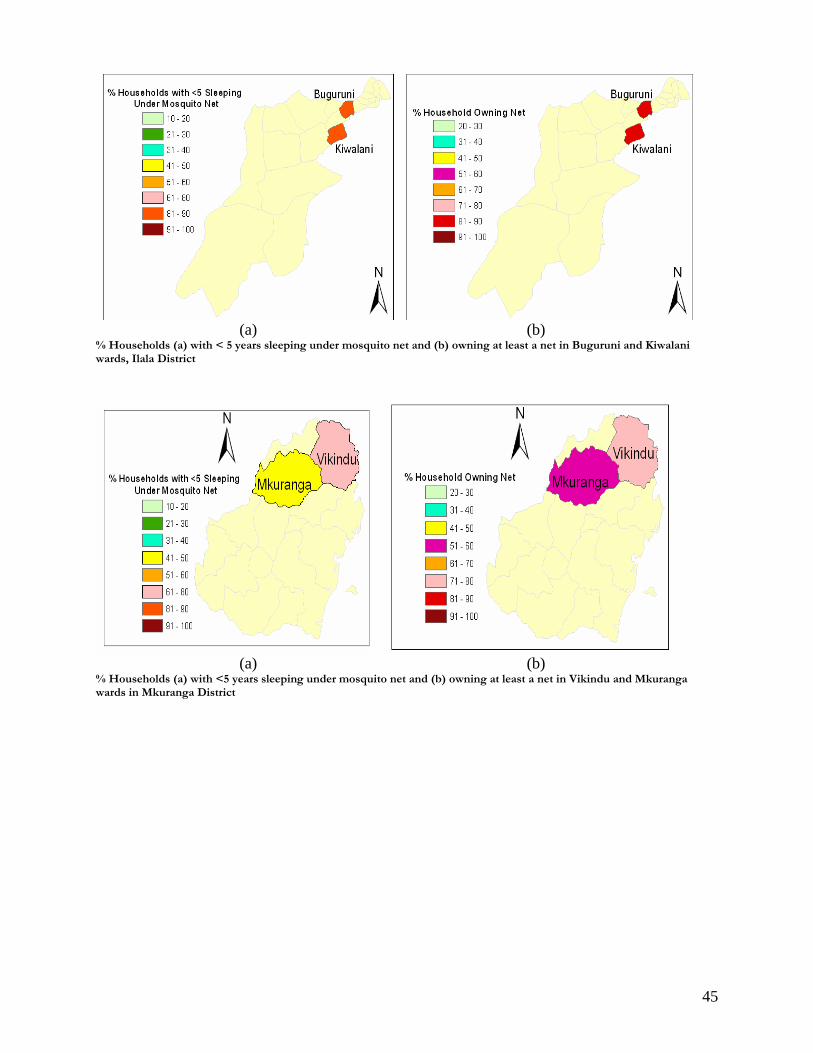
45
(a) (b)
% Households (a) with < 5 years sleeping under mosquito net and (b) owning at least a net in Buguruni and Kiwalani wards, Ilala District
(a) (b)
% Households (a) with <5 years sleeping under mosquito net and (b) owning at least a net in Vikindu and Mkuranga wards in Mkuranga District
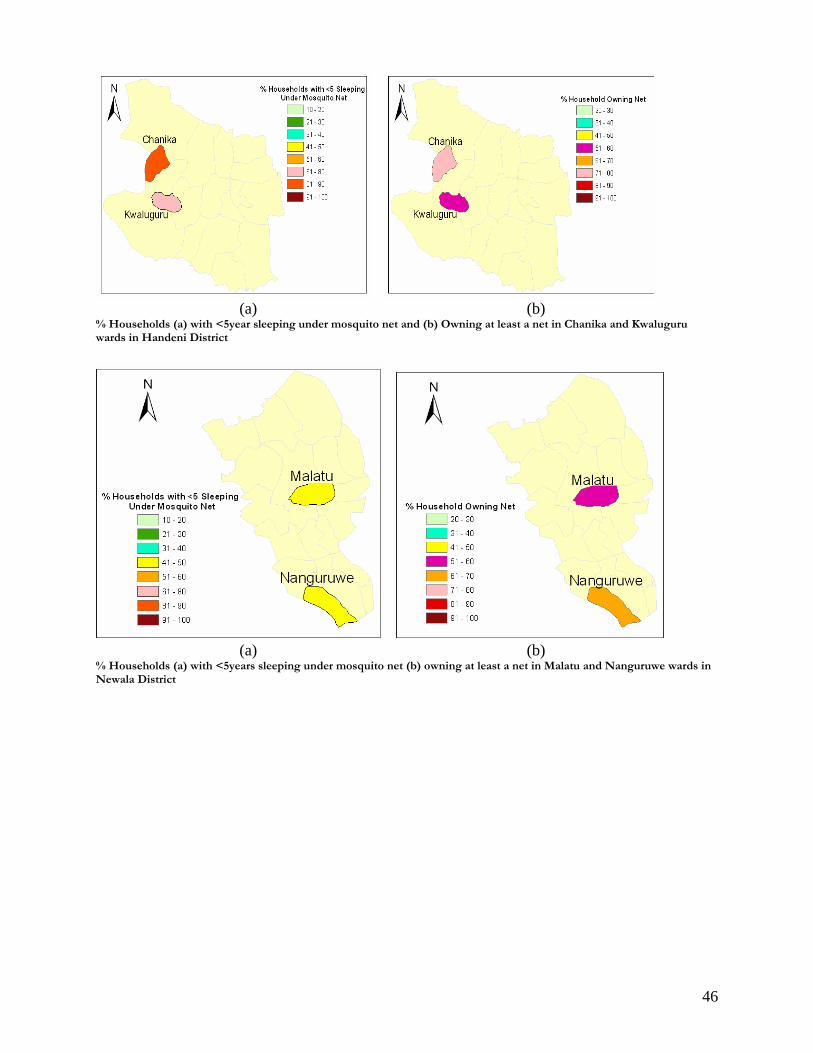
46
(a) (b)
% Households (a) with <5year sleeping under mosquito net and (b) Owning at least a net in Chanika and Kwaluguru wards in Handeni District
(a) (b)
% Households (a) with <5years sleeping under mosquito net (b) owning at least a net in Malatu and Nanguruwe wards in Newala District
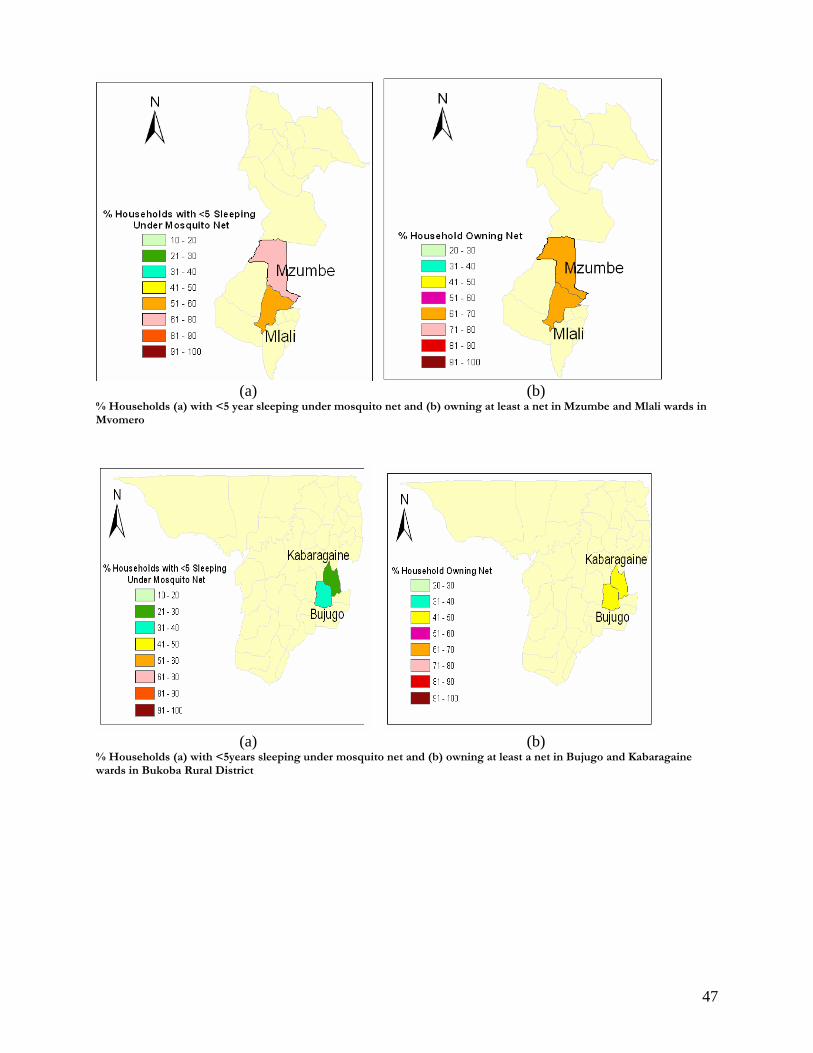
47
(a) (b)
% Households (a) with <5 year sleeping under mosquito net and (b) owning at least a net in Mzumbe and Mlali wards in Mvomero
(a) (b)
% Households (a) with <5years sleeping under mosquito net and (b) owning at least a net in Bujugo and Kabaragaine wards in Bukoba Rural District
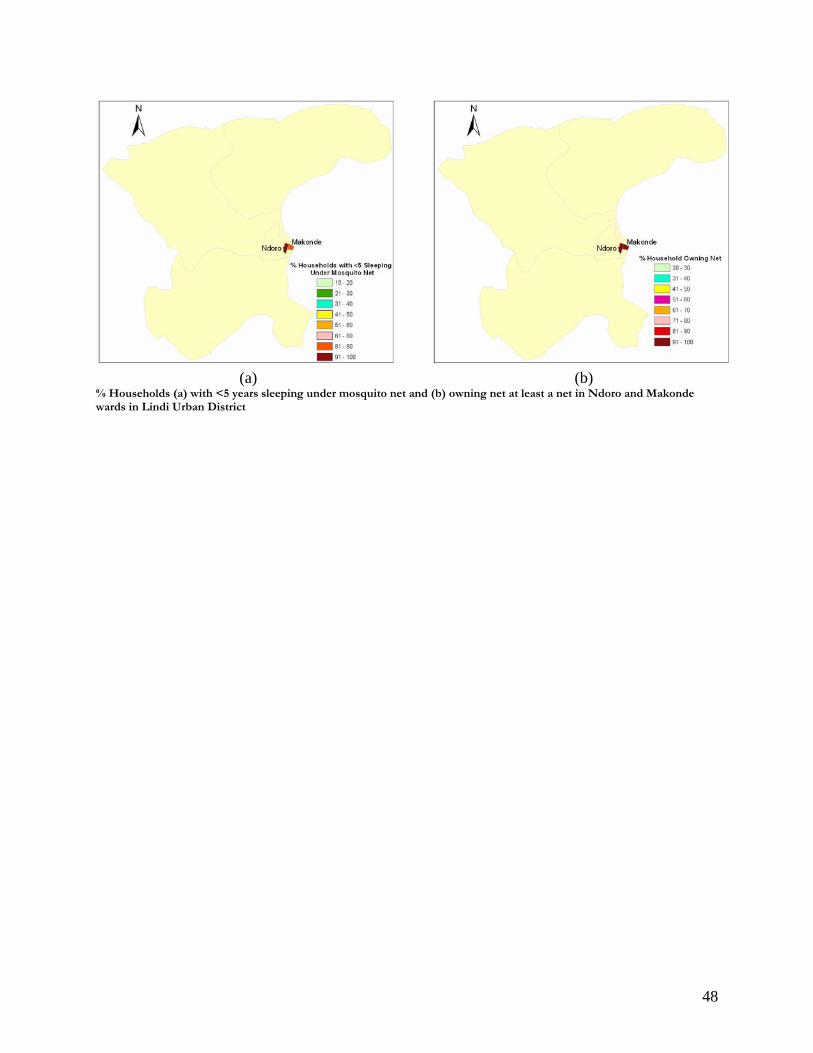
48
(a)
(b)
% Households (a) with <5 years sleeping under mosquito net and (b) owning net at least a net in Ndoro and Makonde wards in Lindi Urban District