Embed Size (px)
Citation preview
November 2013Vol. 99, No. 4
Mortgage Market Conditions and BorrowerOutcomes: Evidence from the 2012 HMDA Dataand Matched HMDA–Credit Record Data
Neil Bhutta and Glenn B. Canner, of the Division of Research and Statistics, prepared this
article. Shira Stolarsky and Madura Watanagase provided research assistance.
The Home Mortgage Disclosure Act of 1975 (HMDA) requires most mortgage lending
institutions with offices in metropolitan areas to disclose to the public detailed information
about their home-lending activity each year. The HMDA data include the disposition of
each application for mortgage credit; the type, purpose, and characteristics of each home
mortgage that lenders originate or purchase during the calendar year; the census-tract des-
ignations of the properties related to those loans; loan pricing information; personal demo-
graphic and other information about loan applicants, including their race or ethnicity and
income; and information about loan sales.1
HMDA was enacted to help members of the public determine whether financial institu-
tions are serving the housing needs of their local communities and treating borrowers and
loan applicants fairly, provide information that could facilitate the efforts of public entities
to distribute funds to local communities for the purpose of attracting private investment,
and help households decide where they may want to deposit their savings.2 The data have
proven to be valuable for research and are often used in public policy deliberations related
to the mortgage market.
The 2012 HMDA data consist of information pertaining to more than 15.3 million applica-
tions for home loans resulting in nearly 9.8 million loans reported by 7,400 home lenders,
including all of the nation’s largest mortgage originators. Together, the home-purchase,
refinance, and home-improvement loans reported represent most home lending nationwide
and thus are broadly representative of all such lending in the United States.3
On July 21, 2011, rulemaking responsibility for HMDA was transferred from the Federal
Reserve Board to the newly established Consumer Financial Protection Bureau (CFPB).4
The Federal Financial Institutions Examination Council (FFIEC) continues to be respon-
1 A list of the items reported under HMDA for 2012 is provided in appendix A. The 2012 HMDA data reflect prop-erty locations using the census-tract geographic boundaries created for the 2010 decennial census. The 2012HMDA data do not reflect recent updates to the list of metropolitan statistical areas (MSAs) published by theOffice of Management and Budget. Reporters will use the updated list of MSAs in preparing their 2014 HMDAdata. For further information, see Federal Financial Institutions Examination Council (2013), “OMB Announce-ment—Revised Delineations of MSAs,” press release, February 28, www.ffiec.gov/hmda/OMB_MSA.htm.
2 A brief history of HMDA is available at Federal Financial Institutions Examination Council, “History ofHMDA,” webpage, www.ffiec.gov/hmda/history2.htm.
3 It is estimated that the HMDA data cover about 90 to 95 percent of Federal Housing Administration lending andbetween 75 and 85 percent of other first-lien home loans. See U.S. Department of Housing and Urban Develop-ment, Office of Policy Development and Research (2011), “A Look at the FHA’s Evolving Market Shares by Raceand Ethnicity,” U.S. Housing Market Conditions (May), pp. 6–12, www.huduser.org/portal/periodicals/ushmc/spring11/USHMC_1q11.pdf.
4 For information about the Consumer Financial Protection Bureau, see www.consumerfinance.gov.
sible for collecting the HMDA data from reporting institutions and facilitating public
access to the information.5 In September of each year, the FFIEC releases to the public
summary disclosure tables pertaining to lending activity from the previous calendar year
for each reporting lender as well as aggregations of home-lending activity for each metro-
politan statistical area (MSA) and for the nation as a whole.6 The FFIEC also makes avail-
able to the public a data file containing virtually all of the reported information for each
lending institution as well as a file that includes key demographic and housing-related data
for each census tract drawn from census sources.7
One purpose of this article, similar to that of previous articles, is to describe mortgage mar-
ket activity in 2012 and in prior years using the HMDA data.8 Notably, for their 2012 lend-
ing, covered institutions were directed to use the census-tract definitions created for the
2010 decennial census to identify property location, whereas in the previous 10 years, cen-
sus-tract definitions based on the 2000 census were used. Moreover, in preparing public dis-
closures for the 2012 HMDA data, the FFIEC used census-tract population and housing
characteristics derived from the 2010 decennial census and the 2006–10 American Commu-
nity Survey (ACS).9 Because many census tracts have changed boundaries and have had
substantial changes in their population and housing characteristics over the past decade,
some caution needs to be exercised when comparing lending patterns across census tracts
between 2012 and earlier years.10
5 The FFIEC (www.ffiec.gov) was established by federal law in 1979 as an interagency body to prescribe uniformexamination procedures, and to promote uniform supervision, among the federal agencies responsible for theexamination and supervision of financial institutions. The member agencies are the Board of Governors of theFederal Reserve System, the Consumer Financial Protection Bureau, the Federal Deposit Insurance Corpora-tion, the National Credit Union Administration, the Office of the Comptroller of the Currency, and represen-tatives from state bank supervisory agencies. Under agreements with these agencies and the Department ofHousing and Urban Development, the Federal Reserve Board collects and processes the HMDA data.
6 MSAs have at least one urbanized area of 50,000 or more individuals plus adjacent geographies that have ahigh degree of economic and social integration with the core area as measured by information on commutingpatterns. MSAs are composed of entire counties and include about 85 percent of the U.S. population.
The designation of MSAs is not static. From time to time, the Office of Management and Budget updates thelist and geographic scope of metropolitan and micropolitan statistical areas. See Office of Management andBudget, “Statistical Programs and Standards,” webpage, www.whitehouse.gov/omb/inforeg_statpolicy#ms.
For the 2012 data, the FFIEC prepared and made available to the public 49,829 MSA-specific HMDA reportson behalf of reporting institutions. The FFIEC also makes available to the public similar reports about privatemortgage insurance (PMI) activity. The costs incurred by the FFIEC to process the annual PMI data and makereports available to the public are borne by the PMI industry. All of the HMDA and PMI reports are availableon the FFIEC’s reports website at www.ffiec.gov/reports.htm.
7 The only reported items not included in the HMDA data made available to the public are the loan applicationnumber, the date of the application, and the date on which action was taken on the application.
8 Some lenders file amended HMDA reports, which are not reflected in the initial public data release. A finalHMDA data set reflecting these changes is created two years following the initial data release. The data used toprepare this article are drawn from the initial public release for 2012 and from the final HMDA data set foryears prior to that. Consequently, numbers in this article for the years 2011 and earlier may differ somewhatfrom numbers calculated from the initial public release files.
9 The 2000 census distributed both short- and long-form questionnaires to households. The long-form question-naire collected more-detailed information on population and housing characteristics about each householdthan the short form, and the long form was the source of several of the detailed characteristics of census tractsmade available to the public. The 2010 census used only a short-form questionnaire; consequently, the FFIECuses data from the annual ACS to identify many population and housing characteristics of census tracts.Because the annual ACS covers a relatively small sample of households, five years of aggregated annual ACSdata are needed to provide reliable estimates of population and housing characteristics at the census-tract levelof geography. The disclosure reports prepared by the FFIEC for the 2012 data use the same MSA definitionsthat were used for the 2011 data reports.
10 For a more complete discussion of the potential effects on interpreting lending patterns of the change from the2000 to the 2010 census-tract delineations, see the section “Transition to the 2010 Census Data and RevisedCensus-Tract Boundaries” in Robert B. Avery, Neil Bhutta, Kenneth P. Brevoort, and Glenn B. Canner (2012),“The Mortgage Market in 2011: Highlights from the Data Reported under the Home Mortgage DisclosureAct,” Federal Reserve Bulletin, vol. 98 (December), pp. 1–46, www.federalreserve.gov/pubs/bulletin/2012/articles/HMDA/default.htm.
2 Federal Reserve Bulletin | November 2013
In addition to our review of the 2012 HMDA data, we present the results of a first look at
a new data set composed of HMDA records matched to borrowers’ credit records. The
matched data provide an opportunity to explore many aspects of home lending that the
HMDA data alone cannot address. In particular, we are able to compare the credit charac-
teristics (for example, credit scores) at loan origination, and subsequent payment perfor-
mance, by various HMDA attributes such as income, minority status, and type of lender.
Also, because the credit record data are longitudinal and follow individuals rather than just
their mortgages, we are able to study long-term outcomes of mortgage borrowers beyond
performance on their mortgage, such as whether credit scores recover after delinquency at a
different pace for different demographic groups. We focus on loans made in 2006, which
reflect lending activity at the height of the recent housing boom, and loans made in 2010,
which reflect the far more subdued market conditions that were still largely present in 2012.
We examine credit profiles at origination and subsequent performance for both vintages,
and they reveal how dramatically the lending environment has changed.
Our analysis of the annual HMDA data yields several key findings:
‰ The number of mortgage originations reported in the HMDA data for 2012 increased by
about 2.7 million to 9.8 million, or 38 percent, from 2011, driven by a 54 percent increase
in the number of refinance loans.
‰ Home-purchase lending increased at a more modest pace of 13 percent. Government-
backed loans originated under programs such as the Federal Housing Administration
(FHA) mortgage insurance program and the Department of Veterans Affairs (VA) loan
guarantee program continue to play a major role, accounting for nearly 45 percent of
first-lien, owner-occupant home-purchase loans.
‰ Home-purchase lending rose across all income and racial or ethnic groups, but to varying
degrees. High-income, as well as non-Hispanic white and Asian, groups posted signifi-
cantly larger gains than other groups. In contrast, the rise in refinance lending was more
even across groups.
‰ Higher-priced lending (a proxy for subprime lending) remained subdued at about 3 per-
cent of all loans, down from a high of about 28 percent in 2006. Similar to patterns
observed in the past, black and Hispanic-white borrowers were more likely, and Asian
borrowers less likely, to obtain higher-priced loans than were non-Hispanic white
borrowers.
‰ As in previous years, denial rates were significantly higher for black and Hispanic-white
applicants compared with Asian and non-Hispanic white applicants. The HMDA data
do not provide sufficient information to determine the extent to which the differences in
higher-priced lending and denials reflect illegal discrimination.
Some of the main findings from our analysis of the matched HMDA–credit record data are
as follows:
‰ The credit scores of black and Hispanic-white mortgage borrowers at the time of loan
origination tend to be lower, and their subsequent delinquency rates higher, compared
with those of Asian and non-Hispanic white borrowers. Among home-purchase borrow-
ers in 2006, for example, we find that over 20 percent of black and Hispanic-white bor-
rowers became 60 days or more past due within two years of origination, compared with
about 7 percent of non-Hispanic white borrowers and about 6 percent of Asian borrow-
ers. Delinquency is highly correlated with credit score, local area house price declines,
and higher-priced loan status, but substantive differences in delinquency rates across
racial and ethnic groups remain after accounting for these variables.
Mortgage Market Conditions and Borrower Outcomes 3
‰ Loans to low- and moderate-income (LMI) borrowers made by banking institutions in
2006 within their Community Reinvestment Act (CRA) assessment areas—loans that
the CRA encourages—had a delinquency rate that was lower than that for all loans com-
bined and less than one-fourth the rate for all higher-priced loans of the same vintage.
These findings are inconsistent with the notion that the CRA was a principal driver of
the mortgage and financial crisis.
‰ The credit scores of individuals obtaining a mortgage were much higher in 2010 than in
2006, and delinquency rates on 2010 loans were much lower than those on 2006 loans.
We estimate that the fraction of conventional (not government backed) home-purchase
loans originated in 2010 that became 60 days or more past due within two years of origi-
nation was just 0.5 percent, about one-twentieth the rate for the 2006 vintage. The delin-
quency rate on 2010 FHA and VA home-purchase loans was 5 percent—significantly
higher than that on 2010 conventional loans but lower than that on 2006 FHA and VA
loans. Increases in credit scores and reductions in delinquency were substantial across
borrowers of all demographic groups.
‰ The matched data allow back-end payment-to-income (PTI) ratios for mortgage borrow-
ers to be estimated.11 The fraction of borrowers with an estimated PTI ratio above
43 percent—the threshold level identified in the qualified mortgage rule adopted by the
CFPB—declined between 2006 and 2010. In 2010, lower-income borrowers and black
and Hispanic-white borrowers were more likely than other groups to have PTI ratios
above 43 percent. That said, most home-purchase loans in 2010 with PTI ratios above
43 percent were government backed; under the current regulations, such loans could still
be qualified mortgages despite exceeding the threshold.
‰ Declines in credit scores and their subsequent recovery through 2012 for those who
became delinquent on the mortgages they took out in 2006 are very similar across racial
and ethnic groups. Credit score recovery occurs only over a long period of time, on aver-
age, perhaps reflecting the severity of the financial stress faced by delinquent mortgage
borrowers. Indeed, we also find that the majority of those who became delinquent on
their mortgages were late on at least one nonmortgage account, such as credit cards or
automobile loans. The rate of multiple delinquencies is largely invariant across demo-
graphic groups.
A Profile of the 2012 HMDA Data
For 2012, a total of 7,400 institutions reported on their home-lending activity under
HMDA: 4,370 banking institutions; 2,004 credit unions; and 1,026 mortgage companies,
814 of which were not affiliated with a banking institution (these companies are referred to
in this article as independent mortgage companies) (table 1). The number of reporting
institutions fluctuates some from year to year because of changes in reporting require-
ments, primarily related to increases in the minimum asset level used to determine cover-
age.12 Mergers, acquisitions, and failures also account for some of the year-over-year
changes. Finally, periodic changes in the number and geographic footprints of metropoli-
tan areas influence reporting over time, as HMDA’s coverage is limited to institutions that
have at least one office in an MSA. For 2012, the number of reporting institutions fell
11 As discussed later, the estimated PTI ratios from the matched data are likely to understate the actual PTI usedin underwriting.
12 For the 2013 reporting year (covering lending in 2012), the minimum asset size for purposes of coverage was$41 million. The minimum asset size changes from year to year with changes in the Consumer Price Index forUrban Wage Earners and Clerical Workers. See the FFIEC’s guide to HMDA reporting at www.ffiec.gov/hmda/guide.htm.
4 Federal Reserve Bulletin | November 2013
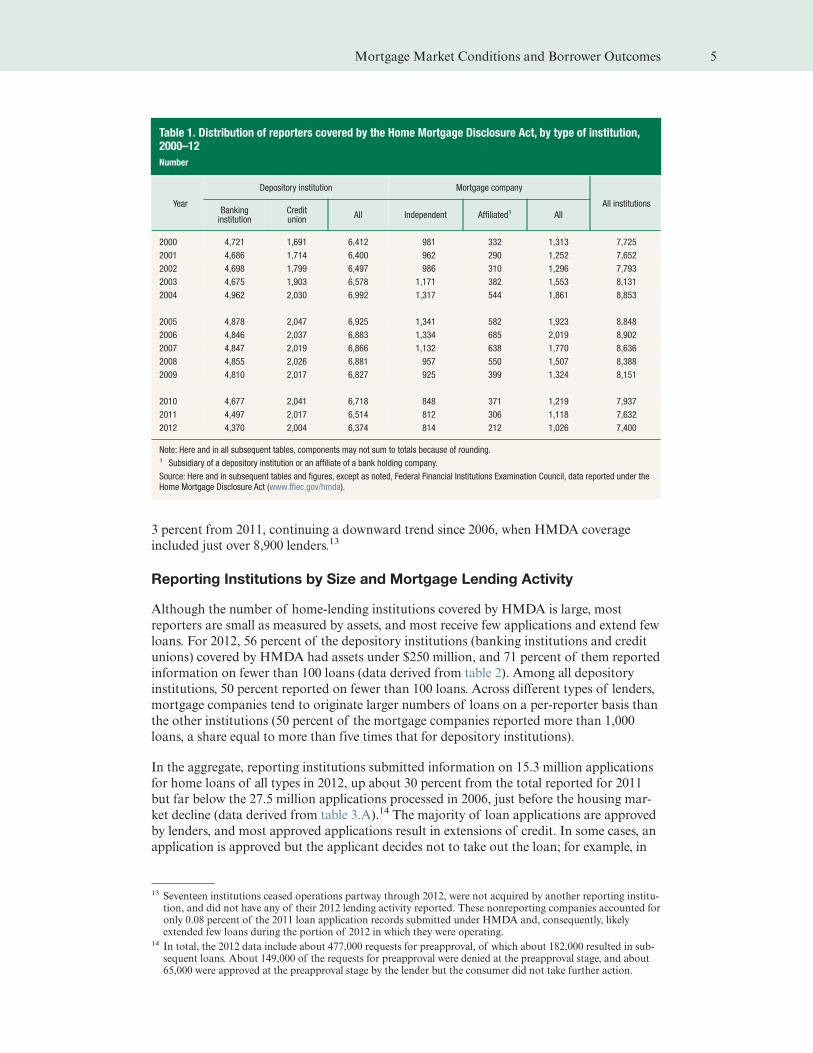
3 percent from 2011, continuing a downward trend since 2006, when HMDA coverage
included just over 8,900 lenders.13
Reporting Institutions by Size and Mortgage Lending Activity
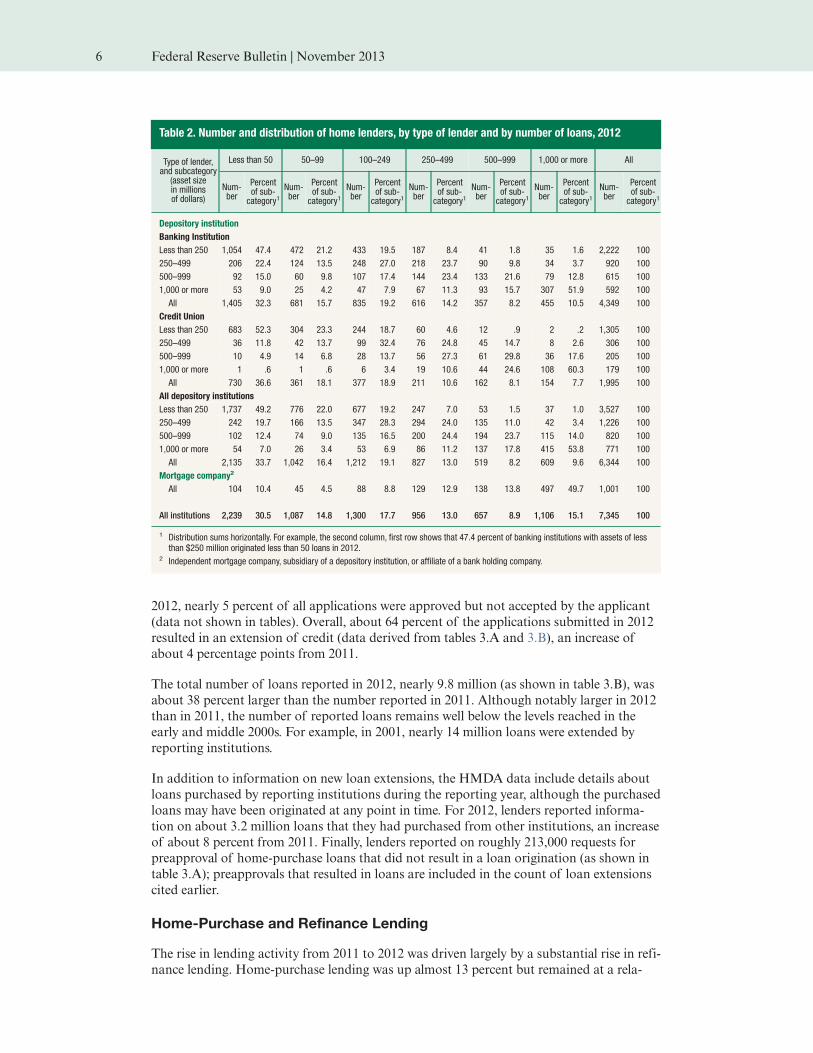
Although the number of home-lending institutions covered by HMDA is large, most
reporters are small as measured by assets, and most receive few applications and extend few
loans. For 2012, 56 percent of the depository institutions (banking institutions and credit
unions) covered by HMDA had assets under $250 million, and 71 percent of them reported
information on fewer than 100 loans (data derived from table 2). Among all depository
institutions, 50 percent reported on fewer than 100 loans. Across different types of lenders,
mortgage companies tend to originate larger numbers of loans on a per-reporter basis than
the other institutions (50 percent of the mortgage companies reported more than 1,000
loans, a share equal to more than five times that for depository institutions).
In the aggregate, reporting institutions submitted information on 15.3 million applications
for home loans of all types in 2012, up about 30 percent from the total reported for 2011
but far below the 27.5 million applications processed in 2006, just before the housing mar-
ket decline (data derived from table 3.A).14 The majority of loan applications are approved
by lenders, and most approved applications result in extensions of credit. In some cases, an
application is approved but the applicant decides not to take out the loan; for example, in
13 Seventeen institutions ceased operations partway through 2012, were not acquired by another reporting institu-tion, and did not have any of their 2012 lending activity reported. These nonreporting companies accounted foronly 0.08 percent of the 2011 loan application records submitted under HMDA and, consequently, likelyextended few loans during the portion of 2012 in which they were operating.
14 In total, the 2012 data include about 477,000 requests for preapproval, of which about 182,000 resulted in sub-sequent loans. About 149,000 of the requests for preapproval were denied at the preapproval stage, and about65,000 were approved at the preapproval stage by the lender but the consumer did not take further action.
Table 1. Distribution of reporters covered by the Home Mortgage Disclosure Act, by type of institution,2000–12
Number
Year
Depository institution Mortgage company
All institutionsBankinginstitution
Creditunion
All Independent Affiliated1 All
2000 4,721 1,691 6,412 981 332 1,313 7,725
2001 4,686 1,714 6,400 962 290 1,252 7,652
2002 4,698 1,799 6,497 986 310 1,296 7,793
2003 4,675 1,903 6,578 1,171 382 1,553 8,131
2004 4,962 2,030 6,992 1,317 544 1,861 8,853
2005 4,878 2,047 6,925 1,341 582 1,923 8,848
2006 4,846 2,037 6,883 1,334 685 2,019 8,902
2007 4,847 2,019 6,866 1,132 638 1,770 8,636
2008 4,855 2,026 6,881 957 550 1,507 8,388
2009 4,810 2,017 6,827 925 399 1,324 8,151
2010 4,677 2,041 6,718 848 371 1,219 7,937
2011 4,497 2,017 6,514 812 306 1,118 7,632
2012 4,370 2,004 6,374 814 212 1,026 7,400
Note: Here and in all subsequent tables, components may not sum to totals because of rounding.1 Subsidiary of a depository institution or an affiliate of a bank holding company.
Source: Here and in subsequent tables and figures, except as noted, Federal Financial Institutions Examination Council, data reported under theHome Mortgage Disclosure Act (www.ffiec.gov/hmda).
Mortgage Market Conditions and Borrower Outcomes 5
2012, nearly 5 percent of all applications were approved but not accepted by the applicant
(data not shown in tables). Overall, about 64 percent of the applications submitted in 2012
resulted in an extension of credit (data derived from tables 3.A and 3.B), an increase of
about 4 percentage points from 2011.
The total number of loans reported in 2012, nearly 9.8 million (as shown in table 3.B), was
about 38 percent larger than the number reported in 2011. Although notably larger in 2012
than in 2011, the number of reported loans remains well below the levels reached in the
early and middle 2000s. For example, in 2001, nearly 14 million loans were extended by
reporting institutions.
In addition to information on new loan extensions, the HMDA data include details about
loans purchased by reporting institutions during the reporting year, although the purchased
loans may have been originated at any point in time. For 2012, lenders reported informa-
tion on about 3.2 million loans that they had purchased from other institutions, an increase
of about 8 percent from 2011. Finally, lenders reported on roughly 213,000 requests for
preapproval of home-purchase loans that did not result in a loan origination (as shown in
table 3.A); preapprovals that resulted in loans are included in the count of loan extensions
cited earlier.
Home-Purchase and Refinance Lending
The rise in lending activity from 2011 to 2012 was driven largely by a substantial rise in refi-
nance lending. Home-purchase lending was up almost 13 percent but remained at a rela-
Table 2. Number and distribution of home lenders, by type of lender and by number of loans, 2012
Type of lender,and subcategory
(asset sizein millionsof dollars)
Less than 50 50–99 100–249 250–499 500–999 1,000 or more All
Num-ber
Percentof sub-category1
Num-ber
Percentof sub-category1
Num-ber
Percentof sub-category1
Num-ber
Percentof sub-category1
Num-ber
Percentof sub-category1
Num-ber
Percentof sub-category1
Num-ber
Percentof sub-category1
Depository institution
Banking Institution
Less than 250 1,054 47.4 472 21.2 433 19.5 187 8.4 41 1.8 35 1.6 2,222 100
250–499 206 22.4 124 13.5 248 27.0 218 23.7 90 9.8 34 3.7 920 100
500–999 92 15.0 60 9.8 107 17.4 144 23.4 133 21.6 79 12.8 615 100
1,000 or more 53 9.0 25 4.2 47 7.9 67 11.3 93 15.7 307 51.9 592 100
All 1,405 32.3 681 15.7 835 19.2 616 14.2 357 8.2 455 10.5 4,349 100
Credit Union
Less than 250 683 52.3 304 23.3 244 18.7 60 4.6 12 .9 2 .2 1,305 100
250–499 36 11.8 42 13.7 99 32.4 76 24.8 45 14.7 8 2.6 306 100
500–999 10 4.9 14 6.8 28 13.7 56 27.3 61 29.8 36 17.6 205 100
1,000 or more 1 .6 1 .6 6 3.4 19 10.6 44 24.6 108 60.3 179 100
All 730 36.6 361 18.1 377 18.9 211 10.6 162 8.1 154 7.7 1,995 100
All depository institutions
Less than 250 1,737 49.2 776 22.0 677 19.2 247 7.0 53 1.5 37 1.0 3,527 100
250–499 242 19.7 166 13.5 347 28.3 294 24.0 135 11.0 42 3.4 1,226 100
500–999 102 12.4 74 9.0 135 16.5 200 24.4 194 23.7 115 14.0 820 100
1,000 or more 54 7.0 26 3.4 53 6.9 86 11.2 137 17.8 415 53.8 771 100
All 2,135 33.7 1,042 16.4 1,212 19.1 827 13.0 519 8.2 609 9.6 6,344 100
Mortgage company2
All 104 10.4 45 4.5 88 8.8 129 12.9 138 13.8 497 49.7 1,001 100
All institutions 2,239 30.5 1,087 14.8 1,300 17.7 956 13.0 657 8.9 1,106 15.1 7,345 100
1 Distribution sums horizontally. For example, the second column, first row shows that 47.4 percent of banking institutions with assets of lessthan $250 million originated less than 50 loans in 2012.
2 Independent mortgage company, subsidiary of a depository institution, or affiliate of a bank holding company.
6 Federal Reserve Bulletin | November 2013
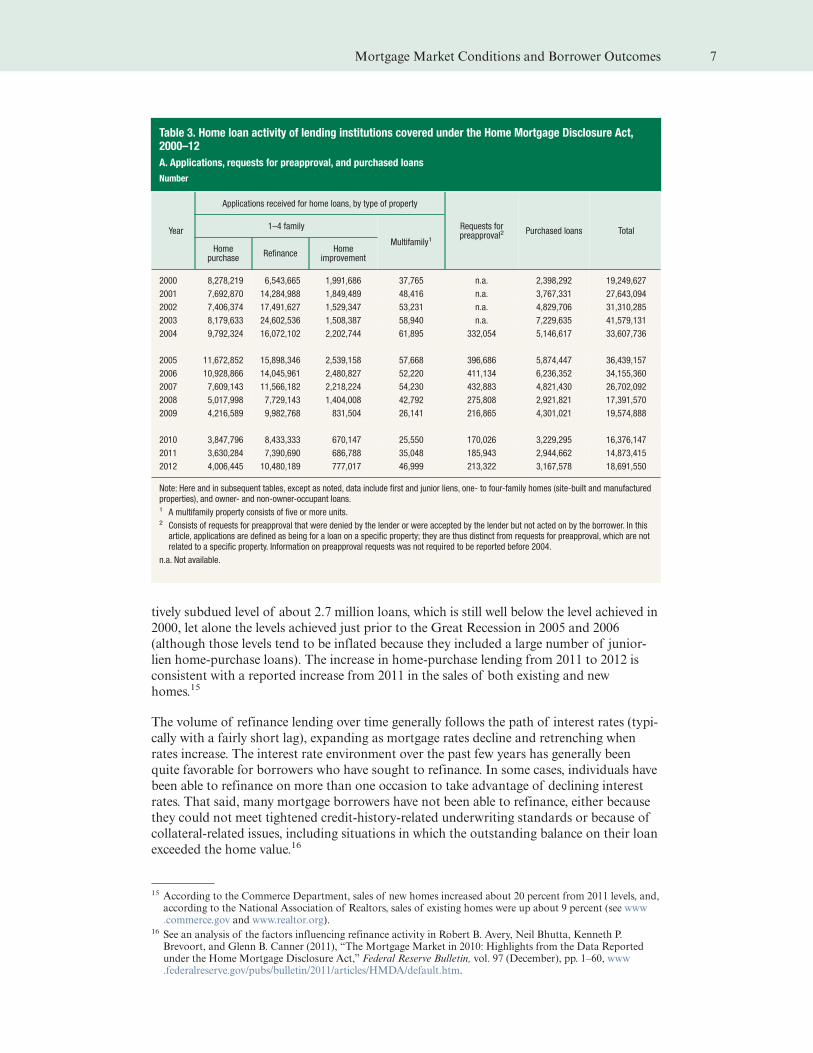
tively subdued level of about 2.7 million loans, which is still well below the level achieved in
2000, let alone the levels achieved just prior to the Great Recession in 2005 and 2006
(although those levels tend to be inflated because they included a large number of junior-
lien home-purchase loans). The increase in home-purchase lending from 2011 to 2012 is
consistent with a reported increase from 2011 in the sales of both existing and new
homes.15
The volume of refinance lending over time generally follows the path of interest rates (typi-
cally with a fairly short lag), expanding as mortgage rates decline and retrenching when
rates increase. The interest rate environment over the past few years has generally been
quite favorable for borrowers who have sought to refinance. In some cases, individuals have
been able to refinance on more than one occasion to take advantage of declining interest
rates. That said, many mortgage borrowers have not been able to refinance, either because
they could not meet tightened credit-history-related underwriting standards or because of
collateral-related issues, including situations in which the outstanding balance on their loan
exceeded the home value.16
15 According to the Commerce Department, sales of new homes increased about 20 percent from 2011 levels, and,according to the National Association of Realtors, sales of existing homes were up about 9 percent (see www.commerce.gov and www.realtor.org).
16 See an analysis of the factors influencing refinance activity in Robert B. Avery, Neil Bhutta, Kenneth P.Brevoort, and Glenn B. Canner (2011), “The Mortgage Market in 2010: Highlights from the Data Reportedunder the Home Mortgage Disclosure Act,” Federal Reserve Bulletin, vol. 97 (December), pp. 1–60, www.federalreserve.gov/pubs/bulletin/2011/articles/HMDA/default.htm.
Table 3. Home loan activity of lending institutions covered under the Home Mortgage Disclosure Act,2000–12
A. Applications, requests for preapproval, and purchased loans
Number
Year
Applications received for home loans, by type of property
Requests forpreapproval2
Purchased loans Total1–4 family
Multifamily1Home
purchaseRefinance
Homeimprovement
2000 8,278,219 6,543,665 1,991,686 37,765 n.a. 2,398,292 19,249,627
2001 7,692,870 14,284,988 1,849,489 48,416 n.a. 3,767,331 27,643,094
2002 7,406,374 17,491,627 1,529,347 53,231 n.a. 4,829,706 31,310,285
2003 8,179,633 24,602,536 1,508,387 58,940 n.a. 7,229,635 41,579,131
2004 9,792,324 16,072,102 2,202,744 61,895 332,054 5,146,617 33,607,736
2005 11,672,852 15,898,346 2,539,158 57,668 396,686 5,874,447 36,439,157
2006 10,928,866 14,045,961 2,480,827 52,220 411,134 6,236,352 34,155,360
2007 7,609,143 11,566,182 2,218,224 54,230 432,883 4,821,430 26,702,092
2008 5,017,998 7,729,143 1,404,008 42,792 275,808 2,921,821 17,391,570
2009 4,216,589 9,982,768 831,504 26,141 216,865 4,301,021 19,574,888
2010 3,847,796 8,433,333 670,147 25,550 170,026 3,229,295 16,376,147
2011 3,630,284 7,390,690 686,788 35,048 185,943 2,944,662 14,873,415
2012 4,006,445 10,480,189 777,017 46,999 213,322 3,167,578 18,691,550
Note: Here and in subsequent tables, except as noted, data include first and junior liens, one- to four-family homes (site-built and manufacturedproperties), and owner- and non-owner-occupant loans.1 A multifamily property consists of five or more units.2 Consists of requests for preapproval that were denied by the lender or were accepted by the lender but not acted on by the borrower. In thisarticle, applications are defined as being for a loan on a specific property; they are thus distinct from requests for preapproval, which are notrelated to a specific property. Information on preapproval requests was not required to be reported before 2004.
n.a. Not available.
Mortgage Market Conditions and Borrower Outcomes 7
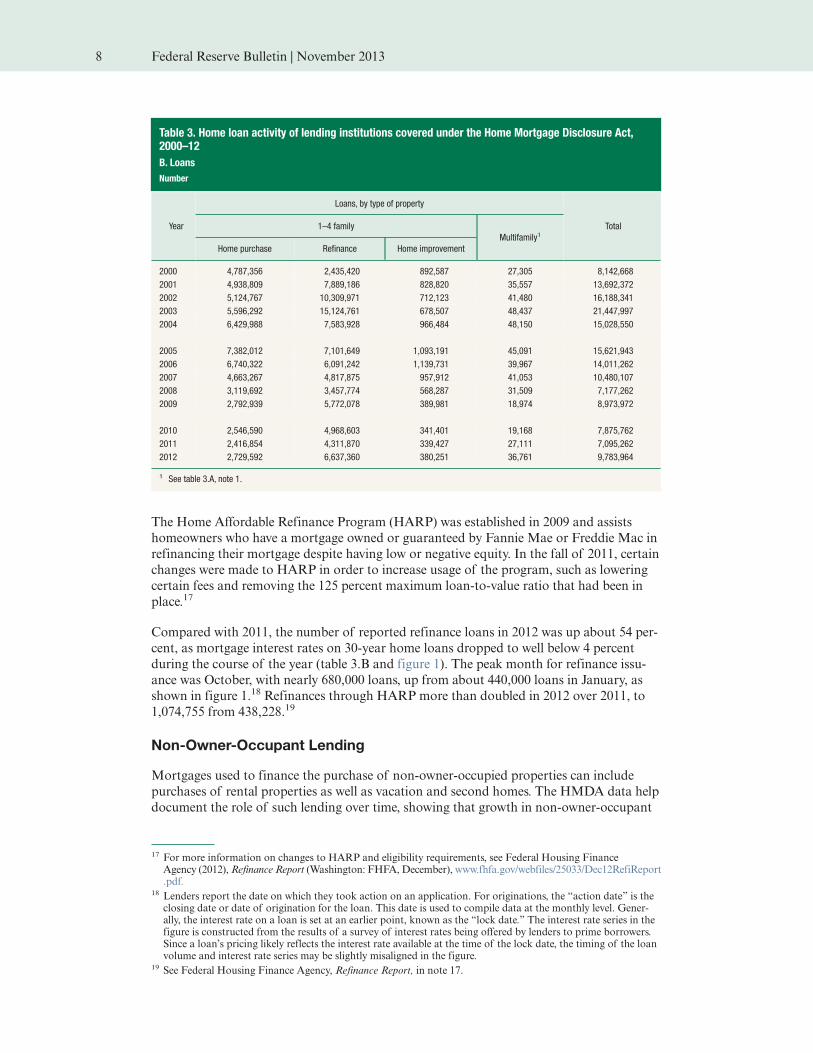
The Home Affordable Refinance Program (HARP) was established in 2009 and assists
homeowners who have a mortgage owned or guaranteed by Fannie Mae or Freddie Mac in
refinancing their mortgage despite having low or negative equity. In the fall of 2011, certain
changes were made to HARP in order to increase usage of the program, such as lowering
certain fees and removing the 125 percent maximum loan-to-value ratio that had been in
place.17
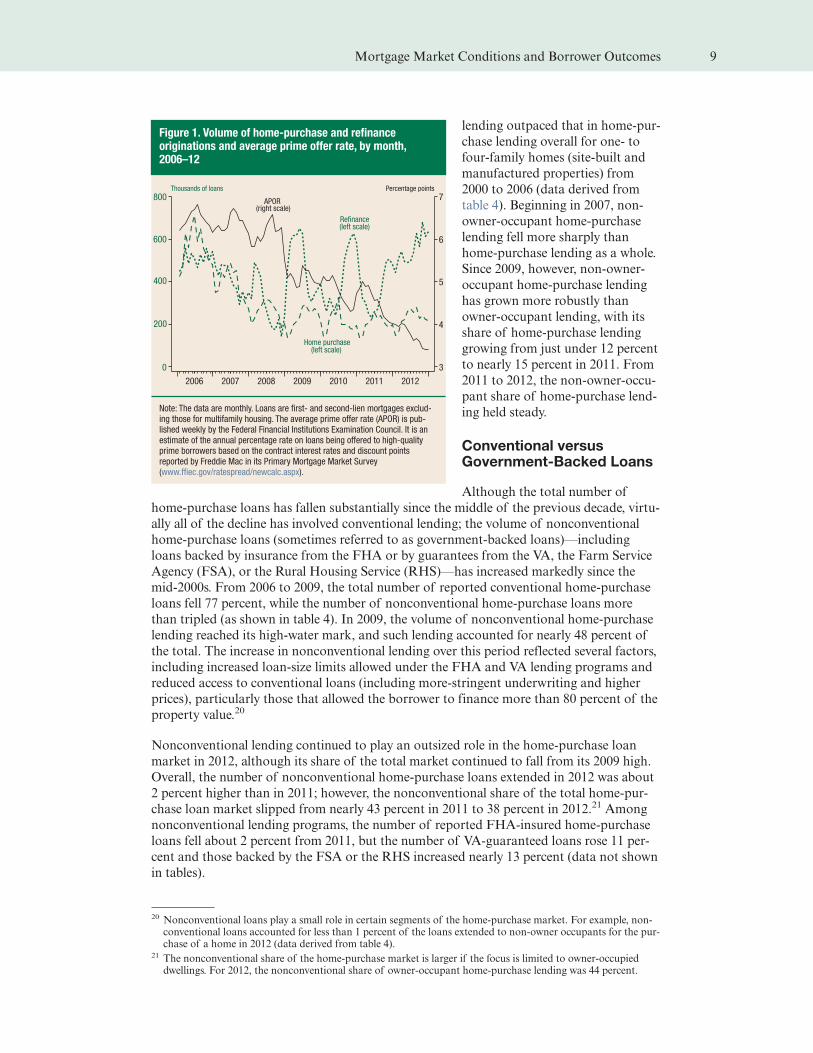
Compared with 2011, the number of reported refinance loans in 2012 was up about 54 per-
cent, as mortgage interest rates on 30-year home loans dropped to well below 4 percent
during the course of the year (table 3.B and figure 1). The peak month for refinance issu-
ance was October, with nearly 680,000 loans, up from about 440,000 loans in January, as
shown in figure 1.18 Refinances through HARP more than doubled in 2012 over 2011, to
1,074,755 from 438,228.19
Non-Owner-Occupant Lending
Mortgages used to finance the purchase of non-owner-occupied properties can include
purchases of rental properties as well as vacation and second homes. The HMDA data help
document the role of such lending over time, showing that growth in non-owner-occupant
17 For more information on changes to HARP and eligibility requirements, see Federal Housing FinanceAgency (2012),Refinance Report (Washington: FHFA,December), www.fhfa.gov/webfiles/25033/Dec12RefiReport.pdf.
18 Lenders report the date on which they took action on an application. For originations, the “action date” is theclosing date or date of origination for the loan. This date is used to compile data at the monthly level. Gener-ally, the interest rate on a loan is set at an earlier point, known as the “lock date.” The interest rate series in thefigure is constructed from the results of a survey of interest rates being offered by lenders to prime borrowers.Since a loan’s pricing likely reflects the interest rate available at the time of the lock date, the timing of the loanvolume and interest rate series may be slightly misaligned in the figure.
19 See Federal Housing Finance Agency, Refinance Report, in note 17.
Table 3. Home loan activity of lending institutions covered under the Home Mortgage Disclosure Act,2000–12
B. Loans
Number
Year
Loans, by type of property
Total1–4 family
Multifamily1
Home purchase Refinance Home improvement
2000 4,787,356 2,435,420 892,587 27,305 8,142,668
2001 4,938,809 7,889,186 828,820 35,557 13,692,372
2002 5,124,767 10,309,971 712,123 41,480 16,188,341
2003 5,596,292 15,124,761 678,507 48,437 21,447,997
2004 6,429,988 7,583,928 966,484 48,150 15,028,550
2005 7,382,012 7,101,649 1,093,191 45,091 15,621,943
2006 6,740,322 6,091,242 1,139,731 39,967 14,011,262
2007 4,663,267 4,817,875 957,912 41,053 10,480,107
2008 3,119,692 3,457,774 568,287 31,509 7,177,262
2009 2,792,939 5,772,078 389,981 18,974 8,973,972
2010 2,546,590 4,968,603 341,401 19,168 7,875,762
2011 2,416,854 4,311,870 339,427 27,111 7,095,262
2012 2,729,592 6,637,360 380,251 36,761 9,783,964
1 See table 3.A, note 1.
8 Federal Reserve Bulletin | November 2013
lending outpaced that in home-pur-
chase lending overall for one- to
four-family homes (site-built and
manufactured properties) from
2000 to 2006 (data derived from
table 4). Beginning in 2007, non-
owner-occupant home-purchase
lending fell more sharply than
home-purchase lending as a whole.
Since 2009, however, non-owner-
occupant home-purchase lending
has grown more robustly than
owner-occupant lending, with its
share of home-purchase lending
growing from just under 12 percent
to nearly 15 percent in 2011. From
2011 to 2012, the non-owner-occu-
pant share of home-purchase lend-
ing held steady.
Conventional versusGovernment-Backed Loans
Although the total number of
home-purchase loans has fallen substantially since the middle of the previous decade, virtu-
ally all of the decline has involved conventional lending; the volume of nonconventional
home-purchase loans (sometimes referred to as government-backed loans)—including
loans backed by insurance from the FHA or by guarantees from the VA, the Farm Service
Agency (FSA), or the Rural Housing Service (RHS)—has increased markedly since the
mid-2000s. From 2006 to 2009, the total number of reported conventional home-purchase
loans fell 77 percent, while the number of nonconventional home-purchase loans more
than tripled (as shown in table 4). In 2009, the volume of nonconventional home-purchase
lending reached its high-water mark, and such lending accounted for nearly 48 percent of
the total. The increase in nonconventional lending over this period reflected several factors,
including increased loan-size limits allowed under the FHA and VA lending programs and
reduced access to conventional loans (including more-stringent underwriting and higher
prices), particularly those that allowed the borrower to finance more than 80 percent of the
property value.20
Nonconventional lending continued to play an outsized role in the home-purchase loan
market in 2012, although its share of the total market continued to fall from its 2009 high.
Overall, the number of nonconventional home-purchase loans extended in 2012 was about
2 percent higher than in 2011; however, the nonconventional share of the total home-pur-
chase loan market slipped from nearly 43 percent in 2011 to 38 percent in 2012.21 Among
nonconventional lending programs, the number of reported FHA-insured home-purchase
loans fell about 2 percent from 2011, but the number of VA-guaranteed loans rose 11 per-
cent and those backed by the FSA or the RHS increased nearly 13 percent (data not shown
in tables).
20 Nonconventional loans play a small role in certain segments of the home-purchase market. For example, non-conventional loans accounted for less than 1 percent of the loans extended to non-owner occupants for the pur-chase of a home in 2012 (data derived from table 4).
21 The nonconventional share of the home-purchase market is larger if the focus is limited to owner-occupieddwellings. For 2012, the nonconventional share of owner-occupant home-purchase lending was 44 percent.
Figure 1. Volume of home-purchase and refinanceoriginations and average prime offer rate, by month,2006–12
2006 2007 2008 2009 2010 2011 2012
7
6
5
4
3
800
600
400
200
0
Thousands of loans Percentage points
APOR(right scale)
Re!nance(left scale)
Home purchase(left scale)
Note: The data are monthly. Loans are first- and second-lien mortgages exclud-ing those for multifamily housing. The average prime offer rate (APOR) is pub-lished weekly by the Federal Financial Institutions Examination Council. It is anestimate of the annual percentage rate on loans being offered to high-qualityprime borrowers based on the contract interest rates and discount pointsreported by Freddie Mac in its Primary Mortgage Market Survey(www.ffiec.gov/ratespread/newcalc.aspx).
Mortgage Market Conditions and Borrower Outcomes 9
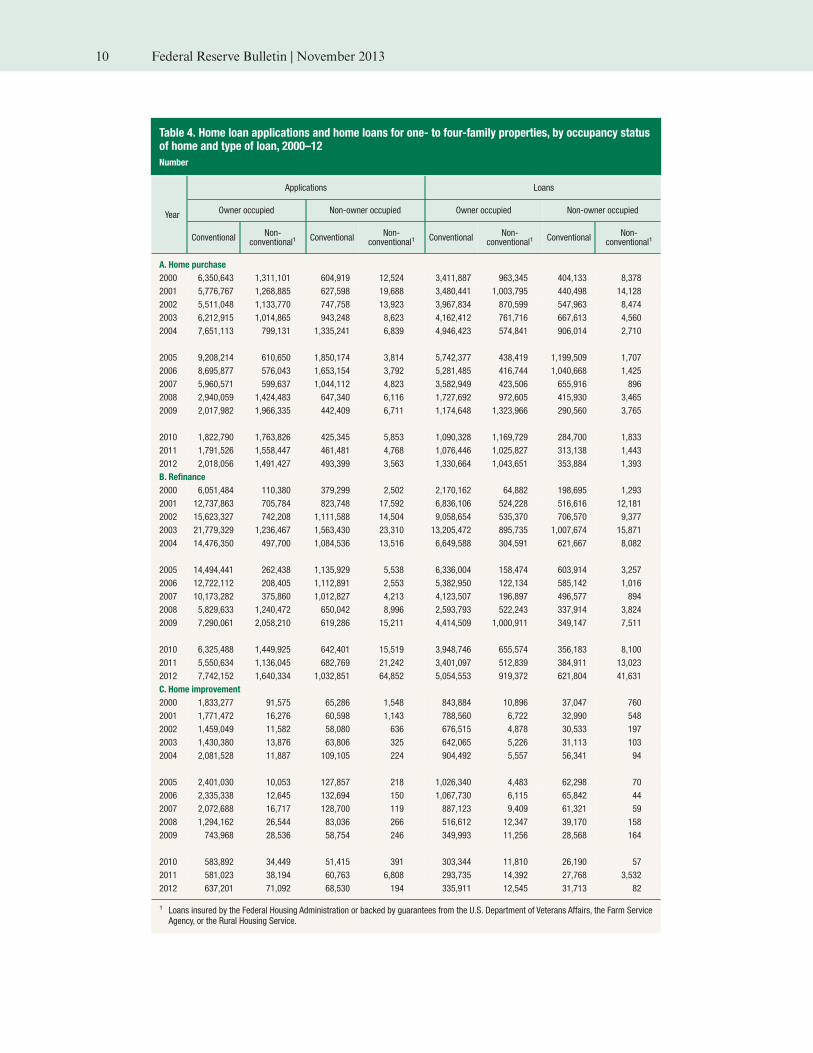
Table 4. Home loan applications and home loans for one- to four-family properties, by occupancy statusof home and type of loan, 2000–12
Number
Year
Applications Loans
Owner occupied Non-owner occupied Owner occupied Non-owner occupied
ConventionalNon-
conventional1Conventional
Non-conventional1
ConventionalNon-
conventional1Conventional
Non-conventional1
A. Home purchase
2000 6,350,643 1,311,101 604,919 12,524 3,411,887 963,345 404,133 8,378
2001 5,776,767 1,268,885 627,598 19,688 3,480,441 1,003,795 440,498 14,128
2002 5,511,048 1,133,770 747,758 13,923 3,967,834 870,599 547,963 8,474
2003 6,212,915 1,014,865 943,248 8,623 4,162,412 761,716 667,613 4,560
2004 7,651,113 799,131 1,335,241 6,839 4,946,423 574,841 906,014 2,710
2005 9,208,214 610,650 1,850,174 3,814 5,742,377 438,419 1,199,509 1,707
2006 8,695,877 576,043 1,653,154 3,792 5,281,485 416,744 1,040,668 1,425
2007 5,960,571 599,637 1,044,112 4,823 3,582,949 423,506 655,916 896
2008 2,940,059 1,424,483 647,340 6,116 1,727,692 972,605 415,930 3,465
2009 2,017,982 1,966,335 442,409 6,711 1,174,648 1,323,966 290,560 3,765
2010 1,822,790 1,763,826 425,345 5,853 1,090,328 1,169,729 284,700 1,833
2011 1,791,526 1,558,447 461,481 4,768 1,076,446 1,025,827 313,138 1,443
2012 2,018,056 1,491,427 493,399 3,563 1,330,664 1,043,651 353,884 1,393
B. Refinance
2000 6,051,484 110,380 379,299 2,502 2,170,162 64,882 198,695 1,293
2001 12,737,863 705,784 823,748 17,592 6,836,106 524,228 516,616 12,181
2002 15,623,327 742,208 1,111,588 14,504 9,058,654 535,370 706,570 9,377
2003 21,779,329 1,236,467 1,563,430 23,310 13,205,472 895,735 1,007,674 15,871
2004 14,476,350 497,700 1,084,536 13,516 6,649,588 304,591 621,667 8,082
2005 14,494,441 262,438 1,135,929 5,538 6,336,004 158,474 603,914 3,257
2006 12,722,112 208,405 1,112,891 2,553 5,382,950 122,134 585,142 1,016
2007 10,173,282 375,860 1,012,827 4,213 4,123,507 196,897 496,577 894
2008 5,829,633 1,240,472 650,042 8,996 2,593,793 522,243 337,914 3,824
2009 7,290,061 2,058,210 619,286 15,211 4,414,509 1,000,911 349,147 7,511
2010 6,325,488 1,449,925 642,401 15,519 3,948,746 655,574 356,183 8,100
2011 5,550,634 1,136,045 682,769 21,242 3,401,097 512,839 384,911 13,023
2012 7,742,152 1,640,334 1,032,851 64,852 5,054,553 919,372 621,804 41,631
C. Home improvement
2000 1,833,277 91,575 65,286 1,548 843,884 10,896 37,047 760
2001 1,771,472 16,276 60,598 1,143 788,560 6,722 32,990 548
2002 1,459,049 11,582 58,080 636 676,515 4,878 30,533 197
2003 1,430,380 13,876 63,806 325 642,065 5,226 31,113 103
2004 2,081,528 11,887 109,105 224 904,492 5,557 56,341 94
2005 2,401,030 10,053 127,857 218 1,026,340 4,483 62,298 70
2006 2,335,338 12,645 132,694 150 1,067,730 6,115 65,842 44
2007 2,072,688 16,717 128,700 119 887,123 9,409 61,321 59
2008 1,294,162 26,544 83,036 266 516,612 12,347 39,170 158
2009 743,968 28,536 58,754 246 349,993 11,256 28,568 164
2010 583,892 34,449 51,415 391 303,344 11,810 26,190 57
2011 581,023 38,194 60,763 6,808 293,735 14,392 27,768 3,532
2012 637,201 71,092 68,530 194 335,911 12,545 31,713 82
1 Loans insured by the Federal Housing Administration or backed by guarantees from the U.S. Department of Veterans Affairs, the Farm ServiceAgency, or the Rural Housing Service.
10 Federal Reserve Bulletin | November 2013
Most mortgage refinancings involve conventional loans, but just as nonconventional lend-
ing has come to play an important role in the home-purchase lending market over the past
couple of years, so its role in the refinance market has also become significant. In 2007 and
earlier years, no more than 6 percent of refinance loans were nonconventional. Since then,
the nonconventional share of refinance loans has been substantially higher, increasing from
12 percent in 2011 to 14 percent in 2012 as the number of reported nonconventional refi-
nance loans rose nearly 83 percent over the same period (as shown in table 4).22 Among
nonconventional loans, those backed by the VA increased 90 percent from 2011, while those
backed by FHA insurance increased 78 percent.
Lending for Manufactured Homes
Beginning with the 2004 HMDA data, reporting institutions have distinguished between
loans secured by site-built properties and those related to manufactured homes. Manufac-
tured homes are an important segment of the housing market, accounting for about 8 per-
cent of all one- to four-family housing units.23 Manufactured-home lending differs along a
number of dimensions from lending on site-built homes, in part because most of the homes
are sold without land and are treated as chattel-secured lending, which typically carries
higher interest rates and shorter terms to maturity than those on loans to purchase site-
built homes.24
Because manufactured homes typically are less expensive than site-built homes, they pro-
vide a low-cost housing option for households with more moderate incomes.25 The 2012
HMDA data indicate that the mean first-lien, owner-occupant loan amount extended for
the purchase of a manufactured home in 2012 was about $67,000, compared with about
$220,000 for a site-built home, and that the mean income of borrowers purchasing manu-
factured homes that year was $50,000, compared with $95,000 for those borrowing to buy a
site-built home (data not shown in tables).
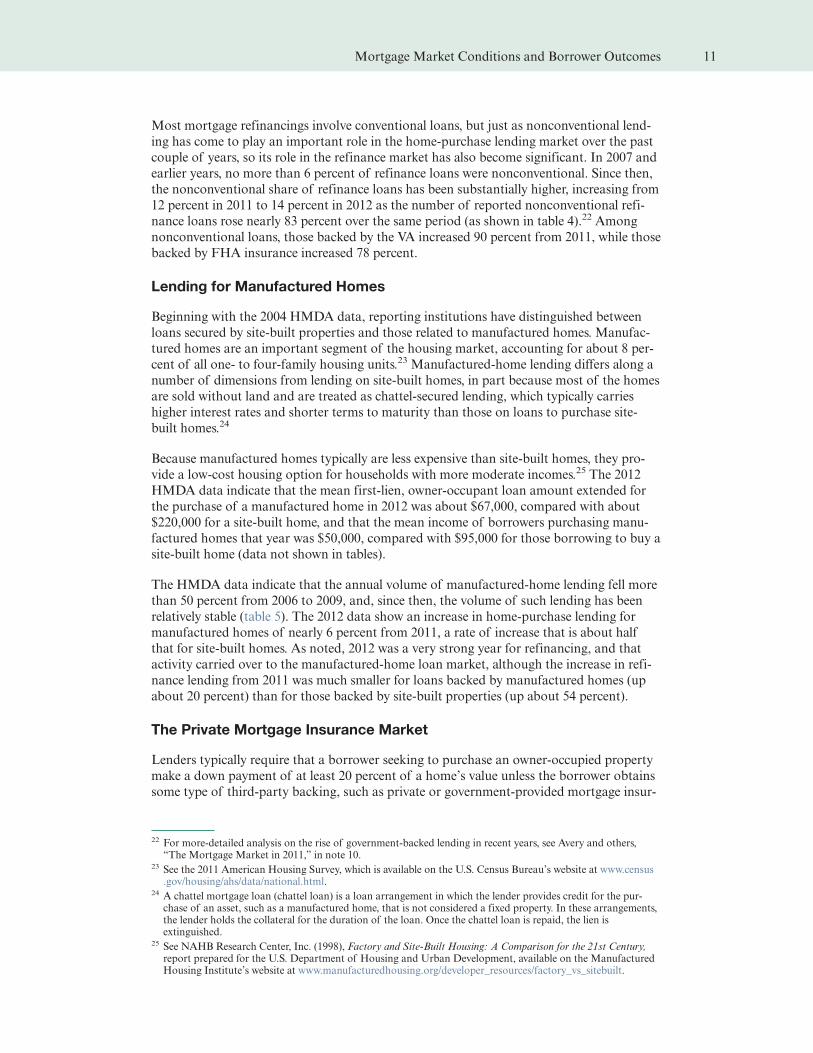
The HMDA data indicate that the annual volume of manufactured-home lending fell more
than 50 percent from 2006 to 2009, and, since then, the volume of such lending has been
relatively stable (table 5). The 2012 data show an increase in home-purchase lending for
manufactured homes of nearly 6 percent from 2011, a rate of increase that is about half
that for site-built homes. As noted, 2012 was a very strong year for refinancing, and that
activity carried over to the manufactured-home loan market, although the increase in refi-
nance lending from 2011 was much smaller for loans backed by manufactured homes (up
about 20 percent) than for those backed by site-built properties (up about 54 percent).
The Private Mortgage Insurance Market
Lenders typically require that a borrower seeking to purchase an owner-occupied property
make a down payment of at least 20 percent of a home’s value unless the borrower obtains
some type of third-party backing, such as private or government-provided mortgage insur-
22 For more-detailed analysis on the rise of government-backed lending in recent years, see Avery and others,“The Mortgage Market in 2011,” in note 10.
23 See the 2011 American Housing Survey, which is available on the U.S. Census Bureau’s website at www.census.gov/housing/ahs/data/national.html.
24 A chattel mortgage loan (chattel loan) is a loan arrangement in which the lender provides credit for the pur-chase of an asset, such as a manufactured home, that is not considered a fixed property. In these arrangements,the lender holds the collateral for the duration of the loan. Once the chattel loan is repaid, the lien isextinguished.
25 See NAHB Research Center, Inc. (1998), Factory and Site-Built Housing: A Comparison for the 21st Century,report prepared for the U.S. Department of Housing and Urban Development, available on the ManufacturedHousing Institute’s website at www.manufacturedhousing.org/developer_resources/factory_vs_sitebuilt.
Mortgage Market Conditions and Borrower Outcomes 11
ance. For a borrower seeking a conventional loan with a low down payment, a lender can
require that the borrower purchase mortgage insurance from a private mortgage insurance
(PMI) company to protect the lender against default-related losses up to a contractually
established percentage of the principal amount. PMI competes with FHA insurance and
VA loan guarantees, and, consequently, the volume of PMI issued in a given year reflects
not only the general state of the housing market and pricing and underwriting decisions by
the PMI companies, but also pricing and underwriting decisions by the FHA and VA as
well as loan-size limits applicable to these government programs. PMI also competes with
lenders willing to extend junior-lien loans used in conjunction with the purchase of a home
(junior-lien lending is discussed in the next section).
Table 5. Loans on manufactured homes, by occupancy status of home and type of loan, 2004–12
Number
Year
Owner occupied Non-owner occupied
Conventional Nonconventional1 Conventional Nonconventional1
A. Home purchase
2004 107,686 23,974 16,243 125
2005 101,539 27,229 17,927 56
2006 102,458 30,530 19,105 257
2007 95,584 28,554 13,963 92
2008 68,821 27,615 11,392 93
2009 43,543 20,630 7,920 29
2010 44,856 17,086 7,655 29
2011 40,312 14,663 7,482 218
2012 44,697 14,005 7,705 24
B. Refinance
2004 79,838 6,922 6,507 57
2005 73,520 7,727 6,331 26
2006 64,969 11,750 6,240 68
2007 59,591 16,174 6,332 74
2008 44,342 21,926 6,817 177
2009 37,001 21,768 6,002 73
2010 26,340 9,751 5,024 69
2011 25,299 8,919 4,765 161
2012 31,712 10,363 4,806 225
C. Home improvement
2004 17,119 128 1,269 5
2005 20,239 219 1,372 3
2006 20,886 490 1,425 2
2007 19,428 889 1,494 2
2008 12,621 681 1,324 36
2009 9,781 439 1,116 1
2010 8,012 427 999 2
2011 8,244 349 972 75
2012 8,814 251 1,026 0
1 See table 4, note 1.
12 Federal Reserve Bulletin | November 2013
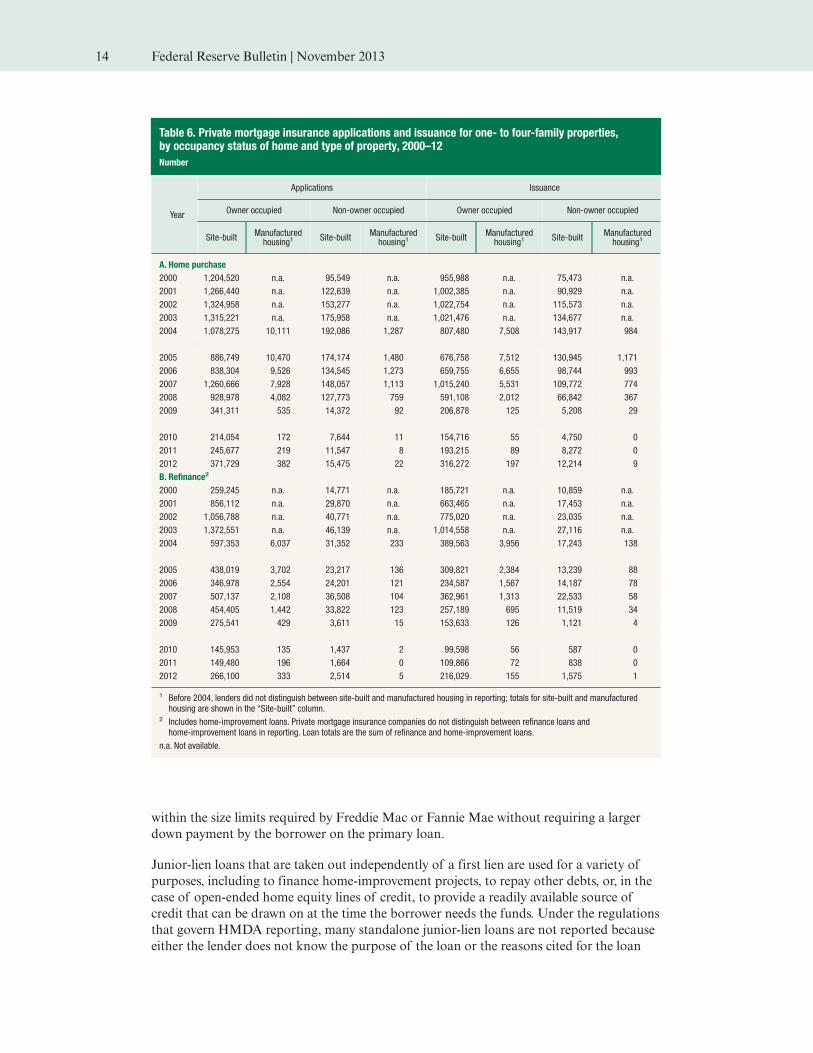
The five companies that reported data to the FFIEC for 2012 dominate the PMI industry.26
For 2012, these PMI companies reported on nearly 657,000 applications for mortgage
insurance leading to the issuance of 546,000 insurance policies, up from about 409,000
applications and 312,000 policies in 2011 (data derived from table 6). Although rebounding
from 2011 levels, reported volumes of PMI issuance in 2012, as in recent years, have been
substantially smaller than levels prior to 2009. The large reduction in PMI issuance reflects
several factors, including tighter underwriting and higher prices adopted by the PMI com-
panies (largely in response to elevated claims and losses experienced during the recent reces-
sion and the ongoing recovery) and, as noted, an expansion of government-backed lend-
ing.27
Overall, nearly 60 percent of the PMI policies issued in 2012 covered home-purchase loans,
and the remainder covered refinance mortgages (home-improvement loans are classified as
refinance loans by the PMI reporters). Although the number of PMI policies issued
increased for both home-purchase and refinance purposes from 2011 to 2012, the increase
on a percentage basis was notably larger for refinancings, consistent with the relatively large
increase in conventional refinance loans described earlier. Virtually all of the applications
for PMI policies issued involved loans to purchase site-built properties, and almost all of
the applications for PMI related to owner-occupied units.
The data reported by the PMI industry over the years have consistently shown that most
applications for insurance are approved, as lenders are very familiar with the underwriting
policies of the insurers and generally are not going to submit an application that is unlikely
to be approved. Overall, about 3 percent of PMI applications were denied in 2012, down
from about 5 percent in 2011 and over 10 percent in 2010 (data not shown in tables).28 As
with the HMDA data, PMI companies report the reason for denial. The three most com-
monly reported reasons cited by the PMI companies are related to issues with the collat-
eral, the applicants’ debt-to-income levels, or their credit histories.
Junior-Lien Lending
Junior-lien loans can be taken out either in conjunction with the primary mortgage (a pig-
gyback loan) or independently of the first-lien loan. Piggyback loans can be used by bor-
rowers to avoid having to pay for private or government mortgage insurance. Similarly, pig-
gyback loans can also be used to reduce the size of the first-lien conventional loan to be
26 In 1993, the Mortgage Insurance Companies of America, a trade association, asked the FFIEC to process datafrom the largest PMI companies on applications for mortgage insurance. These data largely mirror the types ofinformation submitted by lenders covered by HMDA. However, because the PMI companies do not receive allof the information about a prospective loan from the lenders seeking insurance coverage, some items reportedunder HMDA are not included in the PMI data. In particular, loan pricing information and requests for preap-proval are unavailable in the PMI data. In the PMI data, the reported disposition of an application for insur-ance reflects the actions of the PMI companies or, in the case of a withdrawal of an application, the action ofthe lender. Two firms that reported data covering activity in 2011, Republic Mortgage Insurance Company andPMI Mortgage Insurance Company, did not report activity for 2012, reflecting financial circumstances thatprevented them from underwriting new policies. A third insurer, Triad Guaranty Insurance Corporation, lastreported data for activity in 2009. Two additional mortgage insurance companies are relatively active issuers ofnew policies. Essent Guaranty, Inc., is a relatively new firm (having started operations in 2010), and CMGMortgage Insurance Company has traditionally specialized in serving the needs of credit unions; combined,these two firms accounted for about 13 percent of the dollar volume of PMI policies written in 2012.
27 For a more detailed analysis of the decline in PMI issuance, see Robert B. Avery, Neil Bhutta, Kenneth P.Brevoort, and Glenn B. Canner (2010), “The 2009 HMDA Data: The Mortgage Market in a Time of LowInterest Rates and Economic Distress,” Federal Reserve Bulletin, vol. 96 (December), pp. A39–A77, www.federalreserve.gov/pubs/bulletin/2010/articles/2009HMDA/default.htm. For additional information about thePMI industry and its financial condition, see the Mortgage Insurance Companies of America’s website athttp://micadc.org.
28 For the other applications that did not result in a policy being written, either the application was withdrawn,the application file closed because it was not completed, or the request was approved but no policy was issued.
Mortgage Market Conditions and Borrower Outcomes 13
within the size limits required by Freddie Mac or Fannie Mae without requiring a larger
down payment by the borrower on the primary loan.
Junior-lien loans that are taken out independently of a first lien are used for a variety of
purposes, including to finance home-improvement projects, to repay other debts, or, in the
case of open-ended home equity lines of credit, to provide a readily available source of
credit that can be drawn on at the time the borrower needs the funds. Under the regulations
that govern HMDA reporting, many standalone junior-lien loans are not reported because
either the lender does not know the purpose of the loan or the reasons cited for the loan
Table 6. Private mortgage insurance applications and issuance for one- to four-family properties,by occupancy status of home and type of property, 2000–12
Number
Year
Applications Issuance
Owner occupied Non-owner occupied Owner occupied Non-owner occupied
Site-builtManufacturedhousing1
Site-builtManufacturedhousing1
Site-builtManufacturedhousing1
Site-builtManufacturedhousing1
A. Home purchase
2000 1,204,520 n.a. 95,549 n.a. 955,988 n.a. 75,473 n.a.
2001 1,266,440 n.a. 122,639 n.a. 1,002,385 n.a. 90,929 n.a.
2002 1,324,958 n.a. 153,277 n.a. 1,022,754 n.a. 115,573 n.a.
2003 1,315,221 n.a. 175,958 n.a. 1,021,476 n.a. 134,677 n.a.
2004 1,078,275 10,111 192,086 1,287 807,480 7,508 143,917 984
2005 886,749 10,470 174,174 1,480 676,758 7,512 130,945 1,171
2006 838,304 9,526 134,545 1,273 659,755 6,655 98,744 993
2007 1,260,666 7,928 148,057 1,113 1,015,240 5,531 109,772 774
2008 928,978 4,082 127,773 759 591,108 2,012 66,842 367
2009 341,311 535 14,372 92 206,878 125 5,208 29
2010 214,054 172 7,644 11 154,716 55 4,750 0
2011 245,677 219 11,547 8 193,215 89 8,272 0
2012 371,729 382 15,475 22 316,272 197 12,214 9
B. Refinance2
2000 259,245 n.a. 14,771 n.a. 185,721 n.a. 10,859 n.a.
2001 856,112 n.a. 29,870 n.a. 663,465 n.a. 17,453 n.a.
2002 1,056,788 n.a. 40,771 n.a. 775,020 n.a. 23,035 n.a.
2003 1,372,551 n.a. 46,139 n.a. 1,014,558 n.a. 27,116 n.a.
2004 597,353 6,037 31,352 233 389,563 3,956 17,243 138
2005 438,019 3,702 23,217 136 309,821 2,384 13,239 88
2006 346,978 2,554 24,201 121 234,587 1,567 14,187 78
2007 507,137 2,108 36,508 104 362,961 1,313 22,533 58
2008 454,405 1,442 33,822 123 257,189 695 11,519 34
2009 275,541 429 3,611 15 153,633 126 1,121 4
2010 145,953 135 1,437 2 99,598 56 587 0
2011 149,480 196 1,664 0 109,866 72 838 0
2012 266,100 333 2,514 5 216,029 155 1,575 1
1 Before 2004, lenders did not distinguish between site-built and manufactured housing in reporting; totals for site-built and manufacturedhousing are shown in the “Site-built” column.
2 Includes home-improvement loans. Private mortgage insurance companies do not distinguish between refinance loans andhome-improvement loans in reporting. Loan totals are the sum of refinance and home-improvement loans.
n.a. Not available.
14 Federal Reserve Bulletin | November 2013
are not ones that trigger a reporting requirement.29 Nonetheless, the annual HMDA data
provide an opportunity to monitor junior-lien lending related to home purchases or home
improvements.
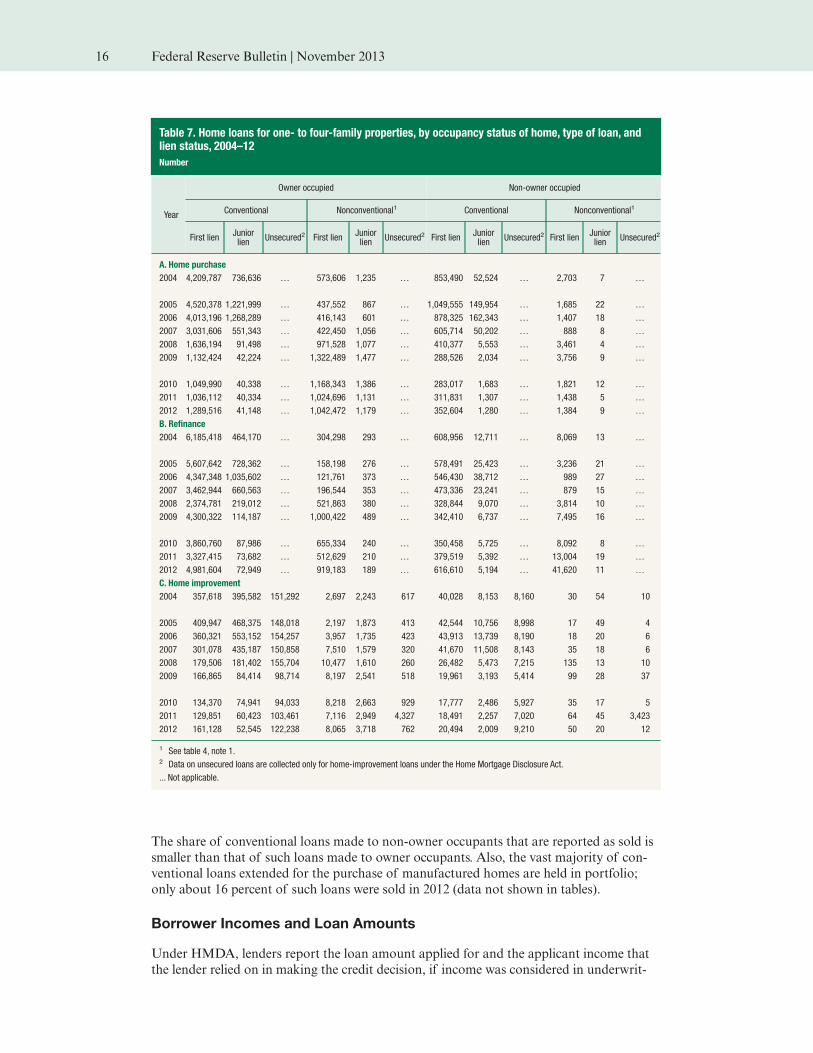
In the run-up to the Great Recession, large numbers of homebuyers used junior-lien loans
to help purchase their homes. In 2006, close to 1.3 million junior liens used for the purchase
of owner-occupied properties were reported under HMDA (table 7). This number fell by
more than one-half in 2007, dropped sharply again in each of the two ensuing years, and
decreased to about 42,000 or fewer such loans annually from 2010 to 2012. More than
1 million junior-lien loans were taken out to refinance loans backed by owner-occupied
properties in 2006, and this number also fell substantially starting in 2007 and continued to
fall, reaching a low point of roughly 73,000 loans in 2012.
The HMDA data also include information on junior-lien loans used for home improve-
ment. In 2012, about 58,000 junior-lien loans were used for such a purpose, down from
about 66,000 reported in 2011. Both the 2011 and 2012 totals are sharply below the histori-
cal high mark of nearly 570,000 reached in 2006.
Loan Sales
For each loan origination reported under HMDA in a given year, lenders report whether
that loan was sold during the same year and what type of institution purchased the loan.30
Broadly, these purchaser types can be broken into those that are government related—Gin-
nie Mae, Fannie Mae, Freddie Mac, and Farmer Mac—and those that are not. Ginnie Mae
and Farmer Mac focus on loans backed directly by government guarantees or insurance,
while Fannie Mae and Freddie Mac purchase conventional loans that meet certain loan-
size and underwriting standards.
Overall, about 80 percent of the first-lien home-purchase and refinance loans for one- to
four-family properties originated in 2012 were reported as sold during the year (data not
shown in tables).31 The share of originations that are sold varies some from year to year
and by type and purpose of loan (table 8).32 For example, 71 percent of the conventional
loans extended in 2012 for the purchase of owner-occupied one- to four-family dwellings
were sold that year. In contrast, nearly 94 percent of the nonconventional loans used to
purchase owner-occupied homes were reported as sold in 2012, with just over one-
third reported as sold directly to a government-sponsored enterprise (including Ginnie
Mae).33
29 Unless a junior lien is used for home purchase or explicitly for home improvements, or to refinance an existinglien, it is not reported under HMDA. Further, home equity lines of credit, many of which are junior liens, donot have to be reported in the HMDA data regardless of the purpose of the loan.
30 The HMDA data tend to understate the importance of the secondary market. HMDA reporters are instructedto record loans sold in a calendar year different from the year originated as being held in portfolio, leading thereported loan sales to understate the proportion of each year’s originations that are eventually sold.
31 Because HMDA reporters are instructed to identify loan sales only if the sale occurs in the same calendar yearas the origination, loans made toward the end of the year tend to have a low incidence of being reported assold. For 2012, the fraction of loans originated in the first nine months of the year that were reported as soldwas about 85 percent.
32 Some loans recorded as sold in the HMDA data are sold to affiliated institutions and thus are not true second-ary-market sales. In 2012, about 3 percent of the loans recorded as sold in the HMDA data were sales toaffiliates.
33 Technically, Ginnie Mae does not purchase mortgages; rather, it provides guarantees for mortgage-backed secu-rities composed of government-backed mortgages. The data indicate that commercial banks purchased about35 percent of government-backed home-purchase mortgages in 2012. Banks may then put these loans into Gin-nie Mae securities or hold them in portfolio.
Mortgage Market Conditions and Borrower Outcomes 15
The share of conventional loans made to non-owner occupants that are reported as sold is
smaller than that of such loans made to owner occupants. Also, the vast majority of con-
ventional loans extended for the purchase of manufactured homes are held in portfolio;
only about 16 percent of such loans were sold in 2012 (data not shown in tables).
Borrower Incomes and Loan Amounts
Under HMDA, lenders report the loan amount applied for and the applicant income that
the lender relied on in making the credit decision, if income was considered in underwrit-
Table 7. Home loans for one- to four-family properties, by occupancy status of home, type of loan, andlien status, 2004–12
Number
Year
Owner occupied Non-owner occupied
Conventional Nonconventional1 Conventional Nonconventional1
First lienJuniorlien
Unsecured2 First lienJuniorlien
Unsecured2 First lienJuniorlien
Unsecured2 First lienJuniorlien
Unsecured2
A. Home purchase
2004 4,209,787 736,636 … 573,606 1,235 … 853,490 52,524 … 2,703 7 …
2005 4,520,378 1,221,999 … 437,552 867 … 1,049,555 149,954 … 1,685 22 …
2006 4,013,196 1,268,289 … 416,143 601 … 878,325 162,343 … 1,407 18 …
2007 3,031,606 551,343 … 422,450 1,056 … 605,714 50,202 … 888 8 …
2008 1,636,194 91,498 … 971,528 1,077 … 410,377 5,553 … 3,461 4 …
2009 1,132,424 42,224 … 1,322,489 1,477 … 288,526 2,034 … 3,756 9 …
2010 1,049,990 40,338 … 1,168,343 1,386 … 283,017 1,683 … 1,821 12 …
2011 1,036,112 40,334 … 1,024,696 1,131 … 311,831 1,307 … 1,438 5 …
2012 1,289,516 41,148 … 1,042,472 1,179 … 352,604 1,280 … 1,384 9 …
B. Refinance
2004 6,185,418 464,170 … 304,298 293 … 608,956 12,711 … 8,069 13 …
2005 5,607,642 728,362 … 158,198 276 … 578,491 25,423 … 3,236 21 …
2006 4,347,348 1,035,602 … 121,761 373 … 546,430 38,712 … 989 27 …
2007 3,462,944 660,563 … 196,544 353 … 473,336 23,241 … 879 15 …
2008 2,374,781 219,012 … 521,863 380 … 328,844 9,070 … 3,814 10 …
2009 4,300,322 114,187 … 1,000,422 489 … 342,410 6,737 … 7,495 16 …
2010 3,860,760 87,986 … 655,334 240 … 350,458 5,725 … 8,092 8 …
2011 3,327,415 73,682 … 512,629 210 … 379,519 5,392 … 13,004 19 …
2012 4,981,604 72,949 … 919,183 189 … 616,610 5,194 … 41,620 11 …
C. Home improvement
2004 357,618 395,582 151,292 2,697 2,243 617 40,028 8,153 8,160 30 54 10
2005 409,947 468,375 148,018 2,197 1,873 413 42,544 10,756 8,998 17 49 4
2006 360,321 553,152 154,257 3,957 1,735 423 43,913 13,739 8,190 18 20 6
2007 301,078 435,187 150,858 7,510 1,579 320 41,670 11,508 8,143 35 18 6
2008 179,506 181,402 155,704 10,477 1,610 260 26,482 5,473 7,215 135 13 10
2009 166,865 84,414 98,714 8,197 2,541 518 19,961 3,193 5,414 99 28 37
2010 134,370 74,941 94,033 8,218 2,663 929 17,777 2,486 5,927 35 17 5
2011 129,851 60,423 103,461 7,116 2,949 4,327 18,491 2,257 7,020 64 45 3,423
2012 161,128 52,545 122,238 8,065 3,718 762 20,494 2,009 9,210 50 20 12
1 See table 4, note 1.2 Data on unsecured loans are collected only for home-improvement loans under the Home Mortgage Disclosure Act.
... Not applicable.
16 Federal Reserve Bulletin | November 2013
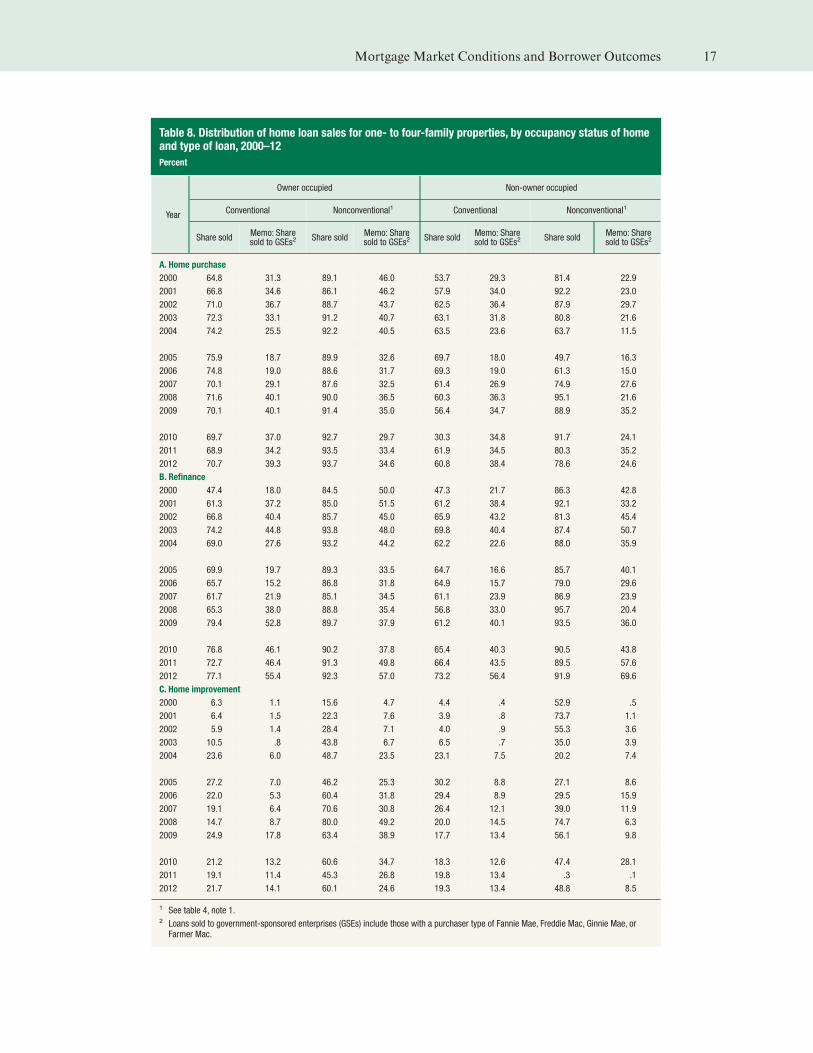
Table 8. Distribution of home loan sales for one- to four-family properties, by occupancy status of homeand type of loan, 2000–12
Percent
Year
Owner occupied Non-owner occupied
Conventional Nonconventional1 Conventional Nonconventional1
Share soldMemo: Sharesold to GSEs2
Share soldMemo: Sharesold to GSEs2
Share soldMemo: Sharesold to GSEs2
Share soldMemo: Sharesold to GSEs2
A. Home purchase
2000 64.8 31.3 89.1 46.0 53.7 29.3 81.4 22.9
2001 66.8 34.6 86.1 46.2 57.9 34.0 92.2 23.0
2002 71.0 36.7 88.7 43.7 62.5 36.4 87.9 29.7
2003 72.3 33.1 91.2 40.7 63.1 31.8 80.8 21.6
2004 74.2 25.5 92.2 40.5 63.5 23.6 63.7 11.5
2005 75.9 18.7 89.9 32.6 69.7 18.0 49.7 16.3
2006 74.8 19.0 88.6 31.7 69.3 19.0 61.3 15.0
2007 70.1 29.1 87.6 32.5 61.4 26.9 74.9 27.6
2008 71.6 40.1 90.0 36.5 60.3 36.3 95.1 21.6
2009 70.1 40.1 91.4 35.0 56.4 34.7 88.9 35.2
2010 69.7 37.0 92.7 29.7 30.3 34.8 91.7 24.1
2011 68.9 34.2 93.5 33.4 61.9 34.5 80.3 35.2
2012 70.7 39.3 93.7 34.6 60.8 38.4 78.6 24.6
B. Refinance
2000 47.4 18.0 84.5 50.0 47.3 21.7 86.3 42.8
2001 61.3 37.2 85.0 51.5 61.2 38.4 92.1 33.2
2002 66.8 40.4 85.7 45.0 65.9 43.2 81.3 45.4
2003 74.2 44.8 93.8 48.0 69.8 40.4 87.4 50.7
2004 69.0 27.6 93.2 44.2 62.2 22.6 88.0 35.9
2005 69.9 19.7 89.3 33.5 64.7 16.6 85.7 40.1
2006 65.7 15.2 86.8 31.8 64.9 15.7 79.0 29.6
2007 61.7 21.9 85.1 34.5 61.1 23.9 86.9 23.9
2008 65.3 38.0 88.8 35.4 56.8 33.0 95.7 20.4
2009 79.4 52.8 89.7 37.9 61.2 40.1 93.5 36.0
2010 76.8 46.1 90.2 37.8 65.4 40.3 90.5 43.8
2011 72.7 46.4 91.3 49.8 66.4 43.5 89.5 57.6
2012 77.1 55.4 92.3 57.0 73.2 56.4 91.9 69.6
C. Home improvement
2000 6.3 1.1 15.6 4.7 4.4 .4 52.9 .5
2001 6.4 1.5 22.3 7.6 3.9 .8 73.7 1.1
2002 5.9 1.4 28.4 7.1 4.0 .9 55.3 3.6
2003 10.5 .8 43.8 6.7 6.5 .7 35.0 3.9
2004 23.6 6.0 48.7 23.5 23.1 7.5 20.2 7.4
2005 27.2 7.0 46.2 25.3 30.2 8.8 27.1 8.6
2006 22.0 5.3 60.4 31.8 29.4 8.9 29.5 15.9
2007 19.1 6.4 70.6 30.8 26.4 12.1 39.0 11.9
2008 14.7 8.7 80.0 49.2 20.0 14.5 74.7 6.3
2009 24.9 17.8 63.4 38.9 17.7 13.4 56.1 9.8
2010 21.2 13.2 60.6 34.7 18.3 12.6 47.4 28.1
2011 19.1 11.4 45.3 26.8 19.8 13.4 .3 .1
2012 21.7 14.1 60.1 24.6 19.3 13.4 48.8 8.5
1 See table 4, note 1.2 Loans sold to government-sponsored enterprises (GSEs) include those with a purchaser type of Fannie Mae, Freddie Mac, Ginnie Mae, orFarmer Mac.
Mortgage Market Conditions and Borrower Outcomes 17
ing. Lenders do not necessarily collect and report loan applicants’ entire income, because in
some cases borrowers have more income than is needed to qualify for the loan.
Borrower Income
The vast majority of loan applications and loans reported under HMDA include income
information. For example, in 2012, income information was not reported for less than
1 percent of the borrowers purchasing a home with a nonconventional loan and for 3 per-
cent of those using a conventional loan (data not shown in tables). Income information is
reported less often for refinance loans (about 10 percent of all such loans), particularly
those that are nonconventional (about 55 percent of the FHA loans and 68 percent of the
VA loans), most likely because of streamlined refinance programs that do not require
current income to be considered in underwriting.
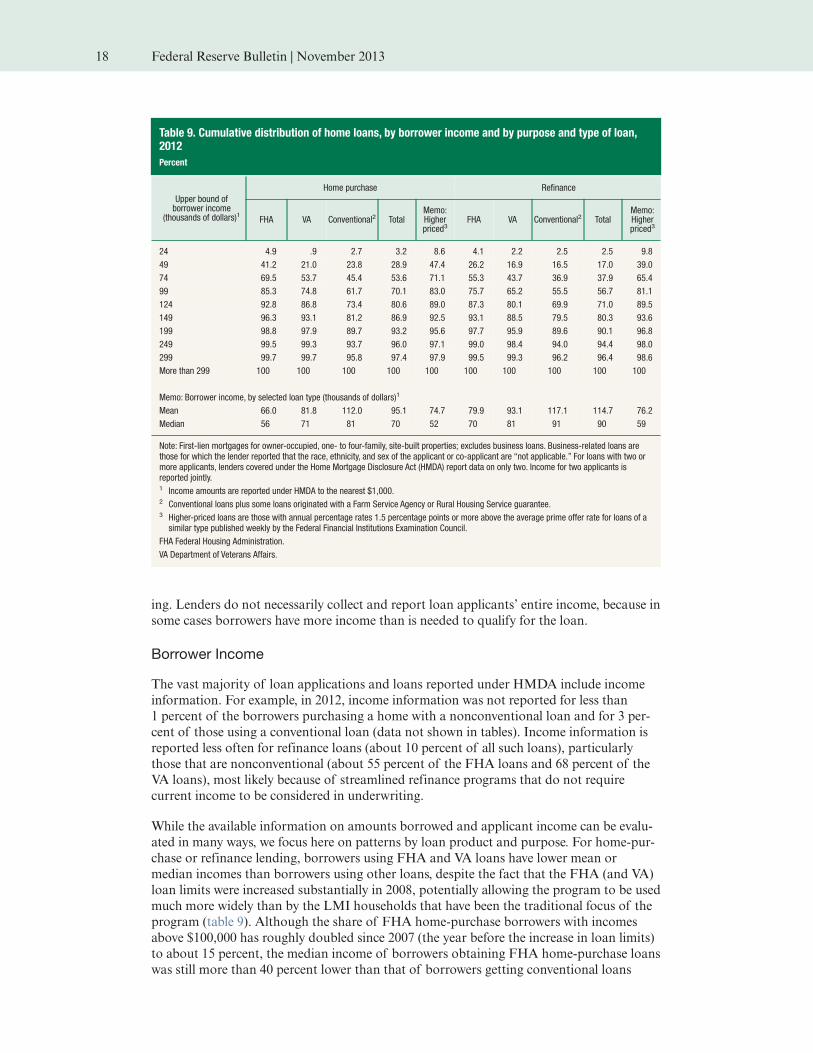
While the available information on amounts borrowed and applicant income can be evalu-
ated in many ways, we focus here on patterns by loan product and purpose. For home-pur-
chase or refinance lending, borrowers using FHA and VA loans have lower mean or
median incomes than borrowers using other loans, despite the fact that the FHA (and VA)
loan limits were increased substantially in 2008, potentially allowing the program to be used
much more widely than by the LMI households that have been the traditional focus of the
program (table 9). Although the share of FHA home-purchase borrowers with incomes
above $100,000 has roughly doubled since 2007 (the year before the increase in loan limits)
to about 15 percent, the median income of borrowers obtaining FHA home-purchase loans
was still more than 40 percent lower than that of borrowers getting conventional loans
Table 9. Cumulative distribution of home loans, by borrower income and by purpose and type of loan,2012
Percent
Upper bound ofborrower income
(thousands of dollars)1
Home purchase Refinance
FHA VA Conventional2 TotalMemo:Higherpriced3
FHA VA Conventional2 TotalMemo:Higherpriced3
24 4.9 .9 2.7 3.2 8.6 4.1 2.2 2.5 2.5 9.8
49 41.2 21.0 23.8 28.9 47.4 26.2 16.9 16.5 17.0 39.0
74 69.5 53.7 45.4 53.6 71.1 55.3 43.7 36.9 37.9 65.4
99 85.3 74.8 61.7 70.1 83.0 75.7 65.2 55.5 56.7 81.1
124 92.8 86.8 73.4 80.6 89.0 87.3 80.1 69.9 71.0 89.5
149 96.3 93.1 81.2 86.9 92.5 93.1 88.5 79.5 80.3 93.6
199 98.8 97.9 89.7 93.2 95.6 97.7 95.9 89.6 90.1 96.8
249 99.5 99.3 93.7 96.0 97.1 99.0 98.4 94.0 94.4 98.0
299 99.7 99.7 95.8 97.4 97.9 99.5 99.3 96.2 96.4 98.6
More than 299 100 100 100 100 100 100 100 100 100 100
Memo: Borrower income, by selected loan type (thousands of dollars)1
Mean 66.0 81.8 112.0 95.1 74.7 79.9 93.1 117.1 114.7 76.2
Median 56 71 81 70 52 70 81 91 90 59
Note: First-lien mortgages for owner-occupied, one- to four-family, site-built properties; excludes business loans. Business-related loans arethose for which the lender reported that the race, ethnicity, and sex of the applicant or co-applicant are “not applicable.” For loans with two ormore applicants, lenders covered under the Home Mortgage Disclosure Act (HMDA) report data on only two. Income for two applicants isreported jointly.1 Income amounts are reported under HMDA to the nearest $1,000.2 Conventional loans plus some loans originated with a Farm Service Agency or Rural Housing Service guarantee.3 Higher-priced loans are those with annual percentage rates 1.5 percentage points or more above the average prime offer rate for loans of asimilar type published weekly by the Federal Financial Institutions Examination Council.
FHA Federal Housing Administration.
VA Department of Veterans Affairs.
18 Federal Reserve Bulletin | November 2013
(data derived from table 9). The low down-payment requirements on FHA-insured loans—
the average loan-to-value ratio for FHA home-purchase loans was 96 percent in 2012—
may be continuing to attract borrowers with more moderate incomes.34
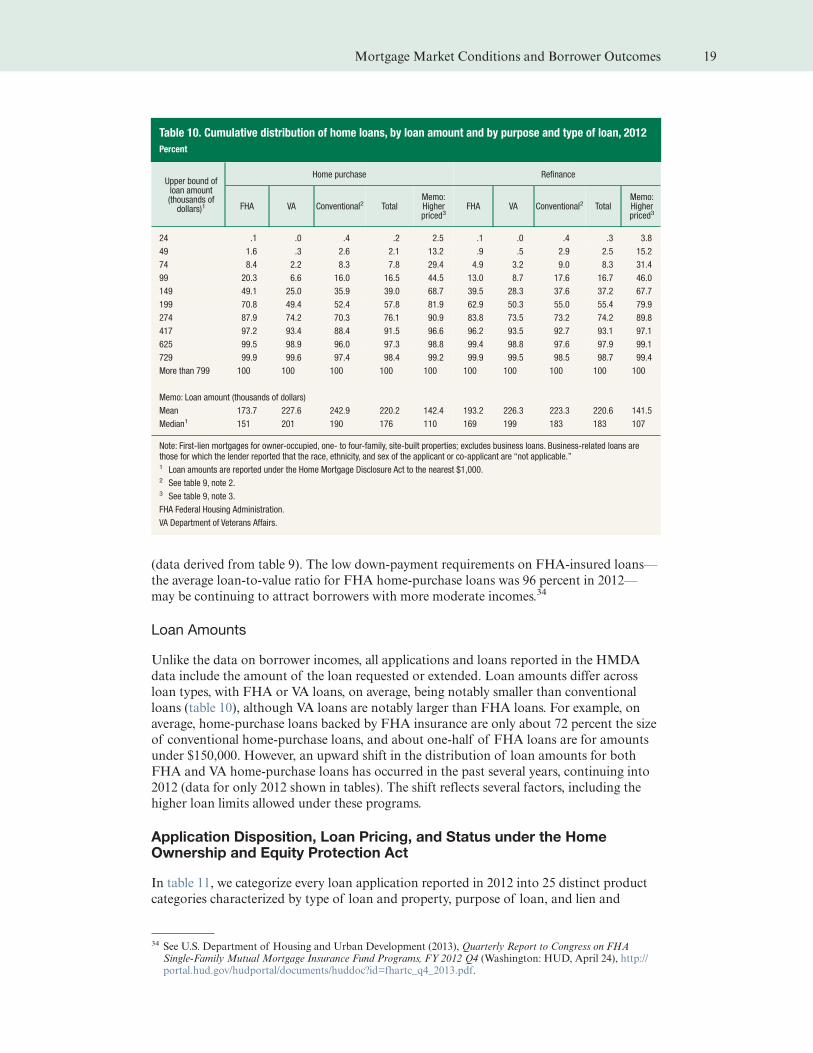
Loan Amounts
Unlike the data on borrower incomes, all applications and loans reported in the HMDA
data include the amount of the loan requested or extended. Loan amounts differ across
loan types, with FHA or VA loans, on average, being notably smaller than conventional
loans (table 10), although VA loans are notably larger than FHA loans. For example, on
average, home-purchase loans backed by FHA insurance are only about 72 percent the size
of conventional home-purchase loans, and about one-half of FHA loans are for amounts
under $150,000. However, an upward shift in the distribution of loan amounts for both
FHA and VA home-purchase loans has occurred in the past several years, continuing into
2012 (data for only 2012 shown in tables). The shift reflects several factors, including the
higher loan limits allowed under these programs.
Application Disposition, Loan Pricing, and Status under the HomeOwnership and Equity Protection Act
In table 11, we categorize every loan application reported in 2012 into 25 distinct product
categories characterized by type of loan and property, purpose of loan, and lien and
34 See U.S. Department of Housing and Urban Development (2013), Quarterly Report to Congress on FHASingle-Family Mutual Mortgage Insurance Fund Programs, FY 2012 Q4 (Washington: HUD, April 24), http://portal.hud.gov/hudportal/documents/huddoc?id=fhartc_q4_2013.pdf.
Table 10. Cumulative distribution of home loans, by loan amount and by purpose and type of loan, 2012
Percent
Upper bound ofloan amount(thousands ofdollars)1
Home purchase Refinance
FHA VA Conventional2 TotalMemo:Higherpriced3
FHA VA Conventional2 TotalMemo:Higherpriced3
24 .1 .0 .4 .2 2.5 .1 .0 .4 .3 3.8
49 1.6 .3 2.6 2.1 13.2 .9 .5 2.9 2.5 15.2
74 8.4 2.2 8.3 7.8 29.4 4.9 3.2 9.0 8.3 31.4
99 20.3 6.6 16.0 16.5 44.5 13.0 8.7 17.6 16.7 46.0
149 49.1 25.0 35.9 39.0 68.7 39.5 28.3 37.6 37.2 67.7
199 70.8 49.4 52.4 57.8 81.9 62.9 50.3 55.0 55.4 79.9
274 87.9 74.2 70.3 76.1 90.9 83.8 73.5 73.2 74.2 89.8
417 97.2 93.4 88.4 91.5 96.6 96.2 93.5 92.7 93.1 97.1
625 99.5 98.9 96.0 97.3 98.8 99.4 98.8 97.6 97.9 99.1
729 99.9 99.6 97.4 98.4 99.2 99.9 99.5 98.5 98.7 99.4
More than 799 100 100 100 100 100 100 100 100 100 100
Memo: Loan amount (thousands of dollars)
Mean 173.7 227.6 242.9 220.2 142.4 193.2 226.3 223.3 220.6 141.5
Median1 151 201 190 176 110 169 199 183 183 107
Note: First-lien mortgages for owner-occupied, one- to four-family, site-built properties; excludes business loans. Business-related loans arethose for which the lender reported that the race, ethnicity, and sex of the applicant or co-applicant are “not applicable.”1 Loan amounts are reported under the Home Mortgage Disclosure Act to the nearest $1,000.2 See table 9, note 2.3 See table 9, note 3.
FHA Federal Housing Administration.
VA Department of Veterans Affairs.
Mortgage Market Conditions and Borrower Outcomes 19
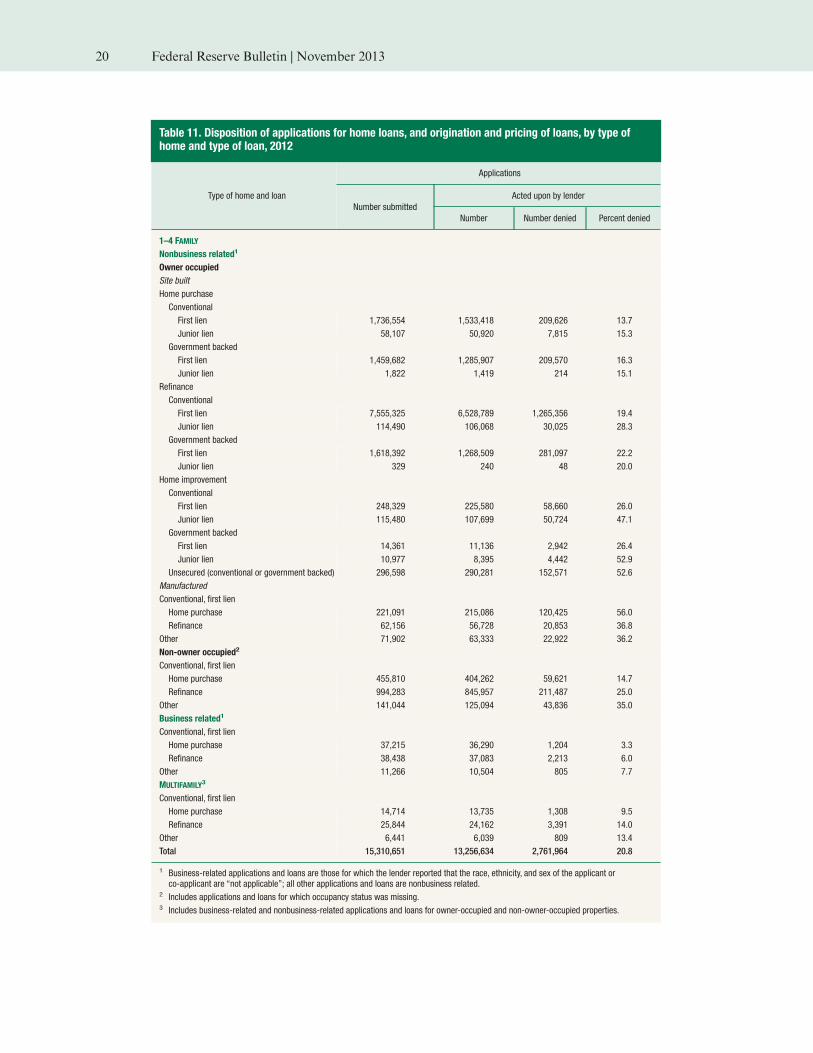
Table 11. Disposition of applications for home loans, and origination and pricing of loans, by type ofhome and type of loan, 2012
Type of home and loan
Applications
Number submitted
Acted upon by lender
Number Number denied Percent denied
1–4 FAMILY
Nonbusiness related1
Owner occupied
Site built
Home purchase
Conventional
First lien 1,736,554 1,533,418 209,626 13.7
Junior lien 58,107 50,920 7,815 15.3
Government backed
First lien 1,459,682 1,285,907 209,570 16.3
Junior lien 1,822 1,419 214 15.1
Refinance
Conventional
First lien 7,555,325 6,528,789 1,265,356 19.4
Junior lien 114,490 106,068 30,025 28.3
Government backed
First lien 1,618,392 1,268,509 281,097 22.2
Junior lien 329 240 48 20.0
Home improvement
Conventional
First lien 248,329 225,580 58,660 26.0
Junior lien 115,480 107,699 50,724 47.1
Government backed
First lien 14,361 11,136 2,942 26.4
Junior lien 10,977 8,395 4,442 52.9
Unsecured (conventional or government backed) 296,598 290,281 152,571 52.6
Manufactured
Conventional, first lien
Home purchase 221,091 215,086 120,425 56.0
Refinance 62,156 56,728 20,853 36.8
Other 71,902 63,333 22,922 36.2
Non-owner occupied2
Conventional, first lien
Home purchase 455,810 404,262 59,621 14.7
Refinance 994,283 845,957 211,487 25.0
Other 141,044 125,094 43,836 35.0
Business related1
Conventional, first lien
Home purchase 37,215 36,290 1,204 3.3
Refinance 38,438 37,083 2,213 6.0
Other 11,266 10,504 805 7.7
MULTIFAMILY3
Conventional, first lien
Home purchase 14,714 13,735 1,308 9.5
Refinance 25,844 24,162 3,391 14.0
Other 6,441 6,039 809 13.4
Total 15,310,651 13,256,634 2,761,964 20.8
1 Business-related applications and loans are those for which the lender reported that the race, ethnicity, and sex of the applicant orco-applicant are “not applicable”; all other applications and loans are nonbusiness related.
2 Includes applications and loans for which occupancy status was missing.3 Includes business-related and nonbusiness-related applications and loans for owner-occupied and non-owner-occupied properties.
20 Federal Reserve Bulletin | November 2013
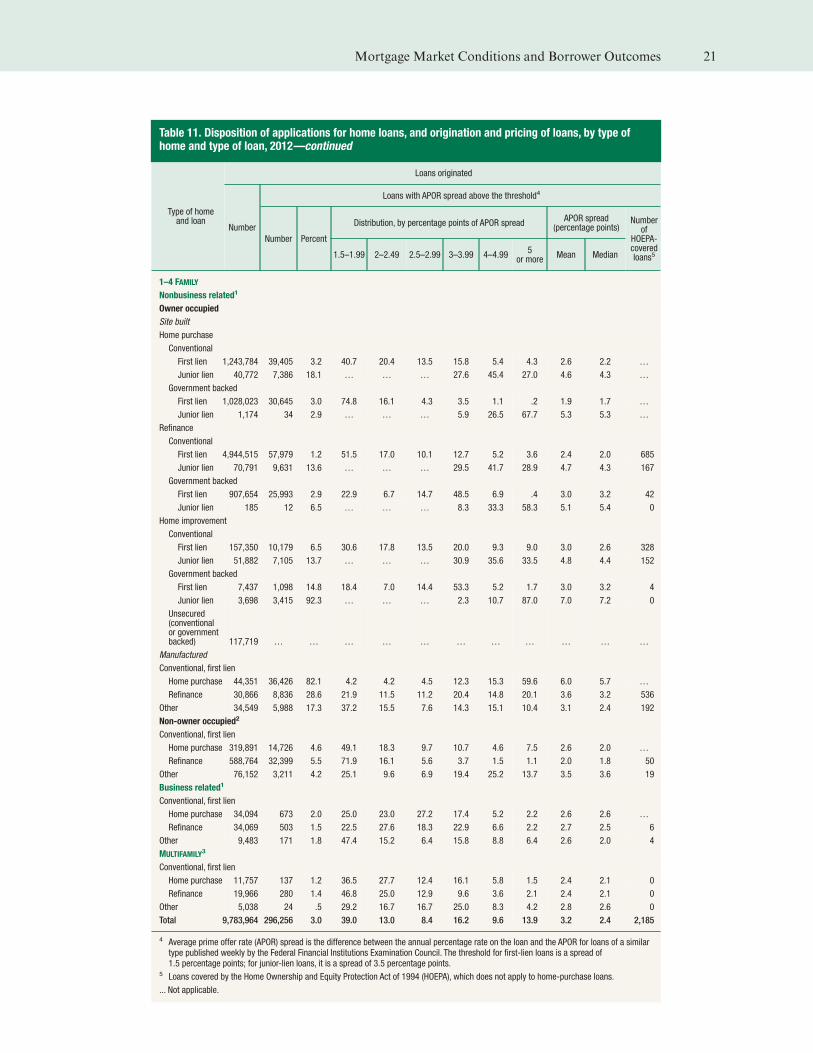
Table 11. Disposition of applications for home loans, and origination and pricing of loans, by type ofhome and type of loan, 2012—continued
Type of homeand loan
Loans originated
Number
Loans with APOR spread above the threshold4
Number Percent
Distribution, by percentage points of APOR spreadAPOR spread
(percentage points)Number
ofHOEPA-coveredloans51.5–1.99 2–2.49 2.5–2.99 3–3.99 4–4.99
5or more
Mean Median
1–4 FAMILY
Nonbusiness related1
Owner occupied
Site built
Home purchase
Conventional
First lien 1,243,784 39,405 3.2 40.7 20.4 13.5 15.8 5.4 4.3 2.6 2.2 …
Junior lien 40,772 7,386 18.1 … … … 27.6 45.4 27.0 4.6 4.3 …
Government backed
First lien 1,028,023 30,645 3.0 74.8 16.1 4.3 3.5 1.1 .2 1.9 1.7 …
Junior lien 1,174 34 2.9 … … … 5.9 26.5 67.7 5.3 5.3 …
Refinance
Conventional
First lien 4,944,515 57,979 1.2 51.5 17.0 10.1 12.7 5.2 3.6 2.4 2.0 685
Junior lien 70,791 9,631 13.6 … … … 29.5 41.7 28.9 4.7 4.3 167
Government backed
First lien 907,654 25,993 2.9 22.9 6.7 14.7 48.5 6.9 .4 3.0 3.2 42
Junior lien 185 12 6.5 … … … 8.3 33.3 58.3 5.1 5.4 0
Home improvement
Conventional
First lien 157,350 10,179 6.5 30.6 17.8 13.5 20.0 9.3 9.0 3.0 2.6 328
Junior lien 51,882 7,105 13.7 … … … 30.9 35.6 33.5 4.8 4.4 152
Government backed
First lien 7,437 1,098 14.8 18.4 7.0 14.4 53.3 5.2 1.7 3.0 3.2 4
Junior lien 3,698 3,415 92.3 … … … 2.3 10.7 87.0 7.0 7.2 0
Unsecured(conventionalor governmentbacked) 117,719 … … … … … … … … … … …
Manufactured
Conventional, first lien
Home purchase 44,351 36,426 82.1 4.2 4.2 4.5 12.3 15.3 59.6 6.0 5.7 …
Refinance 30,866 8,836 28.6 21.9 11.5 11.2 20.4 14.8 20.1 3.6 3.2 536
Other 34,549 5,988 17.3 37.2 15.5 7.6 14.3 15.1 10.4 3.1 2.4 192
Non-owner occupied2
Conventional, first lien
Home purchase 319,891 14,726 4.6 49.1 18.3 9.7 10.7 4.6 7.5 2.6 2.0 …
Refinance 588,764 32,399 5.5 71.9 16.1 5.6 3.7 1.5 1.1 2.0 1.8 50
Other 76,152 3,211 4.2 25.1 9.6 6.9 19.4 25.2 13.7 3.5 3.6 19
Business related1
Conventional, first lien
Home purchase 34,094 673 2.0 25.0 23.0 27.2 17.4 5.2 2.2 2.6 2.6 …
Refinance 34,069 503 1.5 22.5 27.6 18.3 22.9 6.6 2.2 2.7 2.5 6
Other 9,483 171 1.8 47.4 15.2 6.4 15.8 8.8 6.4 2.6 2.0 4
MULTIFAMILY3
Conventional, first lien
Home purchase 11,757 137 1.2 36.5 27.7 12.4 16.1 5.8 1.5 2.4 2.1 0
Refinance 19,966 280 1.4 46.8 25.0 12.9 9.6 3.6 2.1 2.4 2.1 0
Other 5,038 24 .5 29.2 16.7 16.7 25.0 8.3 4.2 2.8 2.6 0
Total 9,783,964 296,256 3.0 39.0 13.0 8.4 16.2 9.6 13.9 3.2 2.4 2,185
4 Average prime offer rate (APOR) spread is the difference between the annual percentage rate on the loan and the APOR for loans of a similartype published weekly by the Federal Financial Institutions Examination Council. The threshold for first-lien loans is a spread of1.5 percentage points; for junior-lien loans, it is a spread of 3.5 percentage points.
5 Loans covered by the Home Ownership and Equity Protection Act of 1994 (HOEPA), which does not apply to home-purchase loans.
... Not applicable.
Mortgage Market Conditions and Borrower Outcomes 21
owner-occupancy status. Each product category contains information on the number of
total and preapproval applications, application denials, originated loans, loans with prices
above the reporting thresholds established by HMDA reporting rules for identifying
higher-priced loans, loans covered by the Home Ownership and Equity Protection Act of
1994 (HOEPA), and the mean and median average prime offer rate (APOR) spreads for
loans reported as higher priced.
Disposition of Applications
As noted, the 2012 HMDA data include information on about 15.3 million loan applica-
tions, nearly 87 percent of which were acted on by the lender (data derived from table 11).
With respect to the disposition of applications, patterns of denial rates are largely consis-
tent with what had been observed in earlier years.35 In 2012, denial rates on applications for
home-purchase loans are notably lower than those observed on applications for refinance
or home-improvement loans. Denial rates on applications backed by manufactured housing
are much higher than those on applications backed by site-built homes. For example, the
denial rate for first-lien conventional home-purchase loan applications for owner-occupied
site-built properties was 13.7 percent in 2012, compared with a denial rate of 56 percent for
such applications for owner-occupied manufactured homes.
Under the provisions of HMDA, reporting institutions may choose to report the reasons
they provide consumers whose applications are turned down. Reporting institutions may
cite up to three reasons for each denied application, although most of those that provide
this information cite only one reason. An analysis of the reasons for denial provided to pro-
spective borrowers whose applications for conventional credit for the purchase of owner-
occupied homes were turned down finds that collateral-related issues and debt-to-income
considerations were the two categories of reasons that have had the largest increases since
2006 (data not shown in tables). Debt-to-income issues were also cited somewhat more
often for applications for FHA or VA home-purchase loans, but collateral was the category
that had the largest percentage increase.
The Incidence of Higher-Priced Lending
Price-reporting rules under HMDA since late 2009 define higher-priced first-lien loans as
those with an annual percentage rate (APR) of at least 1.5 percentage points above the
APOR for loans of a similar type (for example, a 30-year fixed-rate mortgage).36 The
spread for junior-lien loans must be at least 3.5 percentage points for such loans to be con-
35 The information provided in the tables is identical to that provided in analyses of earlier years of HMDA data.Comparisons of the numbers in the tables with those in tables from earlier years, including statistics on denialrates, can be made by consulting the following articles: Avery and others, “The Mortgage Market in 2011,” innote 10; Avery and others, “The Mortgage Market in 2010,” in note 16; Avery and others, “The 2009 HMDAData,” in note 27; and Robert B. Avery, Neil Bhutta, Kenneth P. Brevoort, Glenn B. Canner, and Christa N.Gibbs (2010), “The 2008 HMDA Data: The Mortgage Market during a Turbulent Year,” Federal Reserve Bulle-tin, vol. 96 (April), pp. A169–A211, www.federalreserve.gov/pubs/bulletin/2010/articles/HMDA/default.htm.Also see Robert B. Avery, Kenneth P. Brevoort, and Glenn B. Canner (2008), “The 2007 HMDA Data,” FederalReserve Bulletin, vol. 94 (December), pp. A107–A146, www.federalreserve.gov/pubs/bulletin/2008/articles/hmda/default.htm; Robert B. Avery, Kenneth P. Brevoort, and Glenn B. Canner (2007), “The 2006 HMDA Data,”Federal Reserve Bulletin, vol. 93 (December), pp. A73–A109, www.federalreserve.gov/pubs/bulletin/2007/articles/hmda/default.htm; Robert B. Avery, Kenneth P. Brevoort, and Glenn B. Canner (2006), “Higher-Priced HomeLending and the 2005 HMDA Data,” Federal Reserve Bulletin, vol. 92 (September), pp. A123–A166, www.federalreserve.gov/pubs/bulletin/2006/hmda/default.htm; and Robert B. Avery, Glenn B. Canner, and Robert E.Cook (2005),“New Information Reported under HMDA and Its Application in Fair Lending Enforcement,”Federal Reserve Bulletin, vol. 91 (Summer), pp. 344–94, www.federalreserve.gov/pubs/bulletin/2005/summer05_hmda.pdf.
36 For more information about the rule changes related to higher-priced lending and the ways in which they affectthe incidence of reported higher-priced lending over time, see Avery and others, “The 2009 HMDA Data,” innote 27.
22 Federal Reserve Bulletin | November 2013
sidered higher priced. The APOR, which is published weekly by the FFIEC, is an estimate
of the APR on loans being offered to high-quality prime borrowers based on the contract
interest rates and discount points reported by Freddie Mac in its Primary Mortgage
Market Survey.37
The data show that the incidence of higher-priced lending across all products in 2012 was
about 3 percent, down about 70 basis points, or 0.7 percentage points, from 2011 (as shown
in table 11). The incidence varies across loan types, products, and purposes. First, among
home-purchase loans, conventional loans tend to have a higher incidence of higher-priced
lending than nonconventional loans, although the difference has narrowed in recent years.
In 2012, among �rst-lien home-purchase loans for site-built homes, 3.2 percent of conven-
tional loans had APRs above the price-reporting threshold, compared with 3.0 percent of
nonconventional loans. (Among nonconventional loans, those backed by VA guarantees
have a particularly low incidence of being higher priced: In 2012, only about 0.1 percent of
the VA-guaranteed first-lien home-purchase loans were higher priced.)
Second, with few exceptions, �rst-lien loans have a lower incidence of higher-priced lending
than do junior-lien loans for the same purposes. For example, in 2012, the incidence of
higher-priced lending for conventional �rst-lien re�nance loans was 1.2 percent, whereas
for comparable junior-lien loans it was 13.6 percent. This relationship is found despite the
fact that the threshold for reporting a junior-lien loan as higher priced is 2 percentage
points higher than it is for so reporting a first-lien loan. Third, manufactured-home loans
have a very elevated incidence of higher-priced lending. For 2012, 82 percent of the conven-
tional �rst-lien loans used to purchase manufactured homes were higher priced.
The HMDA data also show that the incidence of higher-priced lending is related to bor-
rower incomes and the amounts borrowed, with borrowers with lower incomes and those
receiving smaller loans being more likely to obtain a higher-priced loan. For example,
54 percent of home-purchase loans were extended to borrowers with incomes under
$75,000, while such borrowers account for 71 percent of all higher-priced home-purchase
loans (as shown in table 9). Data in table 10 indicate that, across loan amounts, about
17 percent of home-purchase loans were under $100,000, whereas roughly 45 percent of
higher-priced home-purchase loans were under that amount.
Rate Spreads for Higher-Priced Loans
In 2012, the mean APOR spread reported for higher-priced first-lien conventional loans for
the purchase of an owner-occupied site-built home was about 2.6 percentage points, com-
pared with about 1.9 percentage points for higher-priced first-lien nonconventional loans
used for the same purpose (as shown in table 11). Average spreads for first-lien conven-
tional and government-backed refinance loans were 2.4 percentage points and 3.0 percent-
age points, respectively. (In 2011, the incidence of higher-priced lending for nonconven-
tional refinancings was nearly the same as it was for conventional refinance loans—about
2.5 percent.)
It is worth noting that most first-lien nonconventional loans for home purchase reported as
higher priced in 2012 exceeded the HMDA price-reporting thresholds by only a small
amount. Specifically, nearly 75 percent of the higher-priced nonconventional first-lien
home-purchase loans had reported spreads between 150 and 199 basis points above the
threshold. By comparison, only about 41 percent of the comparable conventional loans
37 See Freddie Mac, “Weekly Primary Mortgage Market Survey (PMMS),” webpage, www.freddiemac.com/pmms; and Federal Financial Institutions Examination Council, “FFIEC Rate Spread Calculator,” webpage,www.ffiec.gov/ratespread/newcalc.aspx.
Mortgage Market Conditions and Borrower Outcomes 23
reported as higher priced had prices this close to the margin of reporting. In contrast, the
share of higher-priced nonconventional refinancing loans with prices close to the margin of
reporting (23 percent) is less than that of higher-priced conventional refinancing loans with
such pricing (about 52 percent).
As expected, consistent with the higher reporting threshold of junior-lien lending, higher-
priced junior-lien loan products have higher mean and median APOR spreads than do
higher-priced �rst-lien loans. Higher-priced loans for manufactured homes differ from
other loan products in that they generally have the highest mean spreads. In 2012, the typi-
cal higher-priced conventional first-lien loan to purchase a manufactured home had a
reported spread of about 6.0 percentage points, compared with an average spread of
roughly 2.6 percentage points for comparable higher-priced loans for site-built properties.
HOEPA Loans
The HMDA data indicate which loans are covered by the protections afforded by HOEPA.
Under HOEPA, certain types of mortgage loans that have interest rates or fees above speci-
fied levels require additional disclosures to consumers and are subject to various restric-
tions on loan terms.38 For 2012, 524 lenders reported extending 2,185 loans covered by
HOEPA (as shown in table 11; data regarding the number of lenders not shown in tables).
In comparison, 574 lenders reported on 2,387 loans covered by HOEPA in 2011. In the
aggregate, HOEPA-related lending made up less than 0.03 percent of all of the originations
of home-secured refinancings and home-improvement loans reported for 2012 (data
derived from tables).39 Very few HOEPA loans are sold: Among the newly issued loans cov-
ered by HOEPA in 2012, only 5 were reported as sold to a secondary-market participant.
Lending across Population Groups and Neighborhoods
The HMDA data can be used to track changes in lending activity across different popula-
tion groups and areas. In this section, we show changes in lending, from 2011 to 2012, to
borrowers sorted by income, race and ethnicity, and the income or minority population
characteristics of the areas where the borrowers reside.40
As noted earlier, for purposes of reporting the 2012 HMDA data and facilitating their dis-
semination to the public by the FFIEC, there has been a switch from using census-tract
geographic designations and population and housing data from the 2000 decennial census
to using a combination of data from the 2010 decennial census and the 2006–10 ACS. This
switch makes it challenging to study trends in lending across geographies from 2011 to 2012
because of sharp changes in the number of tracts classified in a given category. For
example, the number of census tracts in the low-income category increased 40 percent,
while the share of census tracts in which minorities make up less than 10 percent of the
total population decreased about 10 percentage points (data not shown in tables).41
An alternative way to measure the changes in lending across census-tract categories
between 2011 and 2012 is to use the subset of census tracts that had few or no changes in
38 Unlike the threshold rules used to report higher-priced loans, the threshold rules to identify HOEPA loans didnot change.
39 HOEPA does not apply to home-purchase loans.40 Previous articles have reviewed changes in lending in earlier years. See, for example, Avery and others, “The
Mortgage Market in 2011,” in note 10.41 The share of the U.S. population in census tracts whose residents are predominantly non-Hispanic white
dropped from nearly 33 percent in 2000 to about 23 percent in 2010.
24 Federal Reserve Bulletin | November 2013
their physical boundaries for the 2000 and 2010 decennial censuses (these tracts are referred
to in this article as stable-boundary tracts). We categorized these tracts according to their
income and minority status as used in the 2012 HMDA data and then calculated changes in
lending that were free of reclassification effects for these tracts.42
Changes in Lending across Populations, 2011 to 2012
As noted, home-purchase lending increased about 13 percent from 2011 to 2012. Virtually
all population segments experienced gains, although the increase in activity was larger for
some borrower groups than for others (table 12, first memo item).43 Across racial or ethnic
groups, the largest increase in home-purchase loan activity was experienced by Asians and
non-Hispanic whites; the number of home-purchase loans extended to borrowers in each of
these groups increased about 15 percent, while lending to blacks and Hispanic whites
increased at a rate of less than half this value. Lending to all borrower income groups also
increased, with the largest gains experienced by middle- or high-income households.
Ignoring the reclassification effect discussed earlier, we observe that the change in home-
purchase lending by census-tract category between 2011 and 2012 was greatest in low-in-
come census tracts (62 percent) and tracts with a high share of minorities in the population
(67 percent in tracts with a minority share of 50 to 79 percent) (as shown in table 12, first
memo item). However, focusing on the stable-boundary tracts and using a constant catego-
rization, we find that home-purchase lending growth was actually weakest in the low-
income category and in neighborhoods with a high minority share (table 12, second memo
item).
Borrowers of all racial and ethnic groups and borrowers in all income segments experienced
significant gains in refinance and home-improvement loan activity. Similarly, focusing on
our adjusted measure of change, sizable increases in such lending were experienced across
nearly all neighborhood types (as shown in table 12, second memo item).
Use of Loan Types across Populations
Populations differ considerably in their use of different types of loan products. Most nota-
bly, black, Hispanic white, and lower-income borrowers, and those residing in areas with
larger shares of minority populations, use nonconventional loans to purchase homes to a
greater extent than other groups. Greater reliance on nonconventional loans may reflect the
relatively low down-payment requirements of the FHA and VA lending programs, which
serve the needs of borrowers who have few assets to meet down-payment and closing-cost
requirements.44 The patterns of product incidence could also reflect the behavior of lenders
to some extent; for example, concerns have been raised about the possibility that lenders
steer borrowers in certain neighborhoods toward government-backed loans. The HMDA
data indicate that all groups relied a bit less on nonconventional loans to purchase homes in
2012 than in 2011.
42 Stable-boundary tracts account for over 70 percent of all census tracts in the 2010 census, roughly two-thirds ofthe U.S. population resides in these census tracts, and they include about two-thirds of the 2012 home-purchaselending. Nonetheless, stable-boundary tracts may not be fully representative of all census tracts—in particular,they may be more reflective of slow-growing areas—so some caution should be used in drawing conclusionsbased on lending outcomes in this subset of census tracts.
43 Changes in lending to different groups over the period 2006–10 were presented in a previous article. See Averyand others, “The Mortgage Market in 2010,” in note 16.
44 Findings of the Federal Reserve Board’s Survey of Consumer Finances for 2010 indicate that liquid asset levelsand financial wealth holdings for minorities and lower-income groups are substantially smaller than they are fornon-Hispanic whites or higher-income populations. See Board of Governors of the Federal Reserve System,“2010 Survey of Consumer Finances,” webpage, www.federalreserve.gov/econresdata/scf/scf_2010.htm.
Mortgage Market Conditions and Borrower Outcomes 25
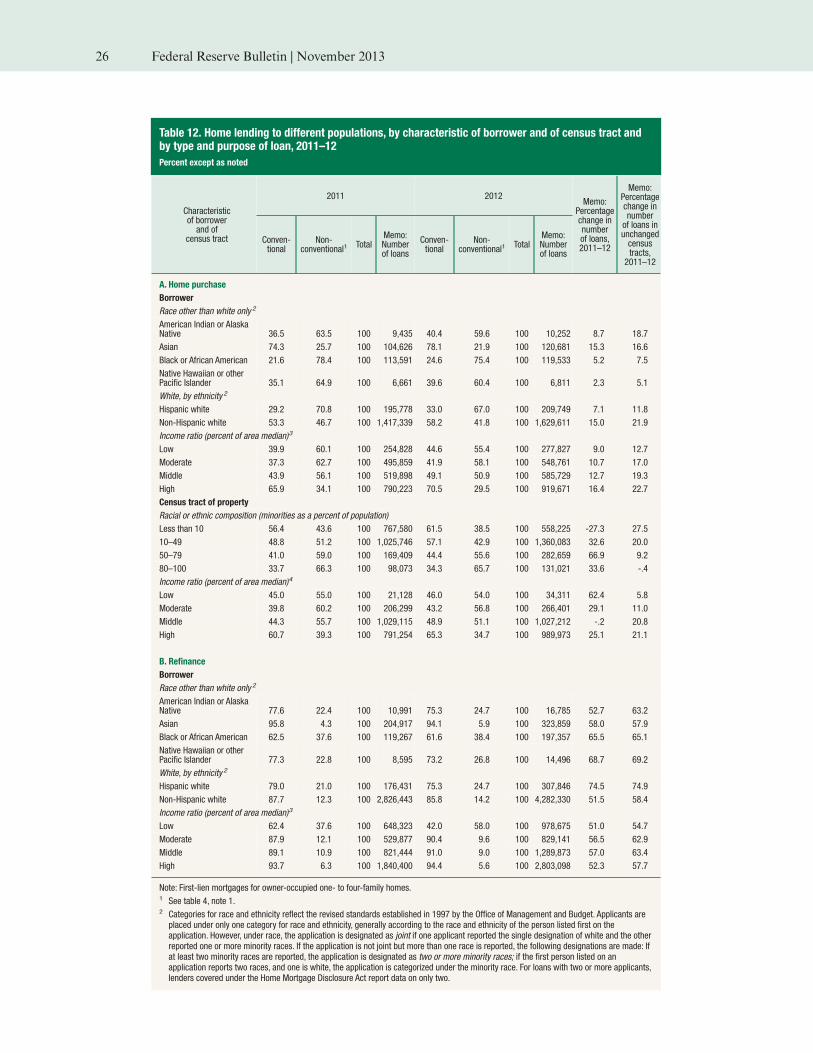
Table 12. Home lending to different populations, by characteristic of borrower and of census tract andby type and purpose of loan, 2011–12
Percent except as noted
Characteristicof borrowerand of
census tract
2011 2012Memo:
Percentagechange innumberof loans,2011–12
Memo:Percentagechange innumberof loans inunchangedcensustracts,
2011–12
Conven-tional
Non-conventional1
TotalMemo:Numberof loans
Conven-tional
Non-conventional1
TotalMemo:Numberof loans
A. Home purchase
Borrower
Race other than white only 2
American Indian or AlaskaNative 36.5 63.5 100 9,435 40.4 59.6 100 10,252 8.7 18.7
Asian 74.3 25.7 100 104,626 78.1 21.9 100 120,681 15.3 16.6
Black or African American 21.6 78.4 100 113,591 24.6 75.4 100 119,533 5.2 7.5
Native Hawaiian or otherPacific Islander 35.1 64.9 100 6,661 39.6 60.4 100 6,811 2.3 5.1
White, by ethnicity 2
Hispanic white 29.2 70.8 100 195,778 33.0 67.0 100 209,749 7.1 11.8
Non-Hispanic white 53.3 46.7 100 1,417,339 58.2 41.8 100 1,629,611 15.0 21.9
Income ratio (percent of area median)3
Low 39.9 60.1 100 254,828 44.6 55.4 100 277,827 9.0 12.7
Moderate 37.3 62.7 100 495,859 41.9 58.1 100 548,761 10.7 17.0
Middle 43.9 56.1 100 519,898 49.1 50.9 100 585,729 12.7 19.3
High 65.9 34.1 100 790,223 70.5 29.5 100 919,671 16.4 22.7
Census tract of property
Racial or ethnic composition (minorities as a percent of population)
Less than 10 56.4 43.6 100 767,580 61.5 38.5 100 558,225 -27.3 27.5
10–49 48.8 51.2 100 1,025,746 57.1 42.9 100 1,360,083 32.6 20.0
50–79 41.0 59.0 100 169,409 44.4 55.6 100 282,659 66.9 9.2
80–100 33.7 66.3 100 98,073 34.3 65.7 100 131,021 33.6 -.4
Income ratio (percent of area median)4
Low 45.0 55.0 100 21,128 46.0 54.0 100 34,311 62.4 5.8
Moderate 39.8 60.2 100 206,299 43.2 56.8 100 266,401 29.1 11.0
Middle 44.3 55.7 100 1,029,115 48.9 51.1 100 1,027,212 -.2 20.8
High 60.7 39.3 100 791,254 65.3 34.7 100 989,973 25.1 21.1
B. Refinance
Borrower
Race other than white only 2
American Indian or AlaskaNative 77.6 22.4 100 10,991 75.3 24.7 100 16,785 52.7 63.2
Asian 95.8 4.3 100 204,917 94.1 5.9 100 323,859 58.0 57.9
Black or African American 62.5 37.6 100 119,267 61.6 38.4 100 197,357 65.5 65.1
Native Hawaiian or otherPacific Islander 77.3 22.8 100 8,595 73.2 26.8 100 14,496 68.7 69.2
White, by ethnicity 2
Hispanic white 79.0 21.0 100 176,431 75.3 24.7 100 307,846 74.5 74.9
Non-Hispanic white 87.7 12.3 100 2,826,443 85.8 14.2 100 4,282,330 51.5 58.4
Income ratio (percent of area median)3
Low 62.4 37.6 100 648,323 42.0 58.0 100 978,675 51.0 54.7
Moderate 87.9 12.1 100 529,877 90.4 9.6 100 829,141 56.5 62.9
Middle 89.1 10.9 100 821,444 91.0 9.0 100 1,289,873 57.0 63.4
High 93.7 6.3 100 1,840,400 94.4 5.6 100 2,803,098 52.3 57.7
Note: First-lien mortgages for owner-occupied one- to four-family homes.1 See table 4, note 1.2 Categories for race and ethnicity reflect the revised standards established in 1997 by the Office of Management and Budget. Applicants areplaced under only one category for race and ethnicity, generally according to the race and ethnicity of the person listed first on theapplication. However, under race, the application is designated as joint if one applicant reported the single designation of white and the otherreported one or more minority races. If the application is not joint but more than one race is reported, the following designations are made: Ifat least two minority races are reported, the application is designated as two or more minority races; if the first person listed on anapplication reports two races, and one is white, the application is categorized under the minority race. For loans with two or more applicants,lenders covered under the Home Mortgage Disclosure Act report data on only two.
26 Federal Reserve Bulletin | November 2013
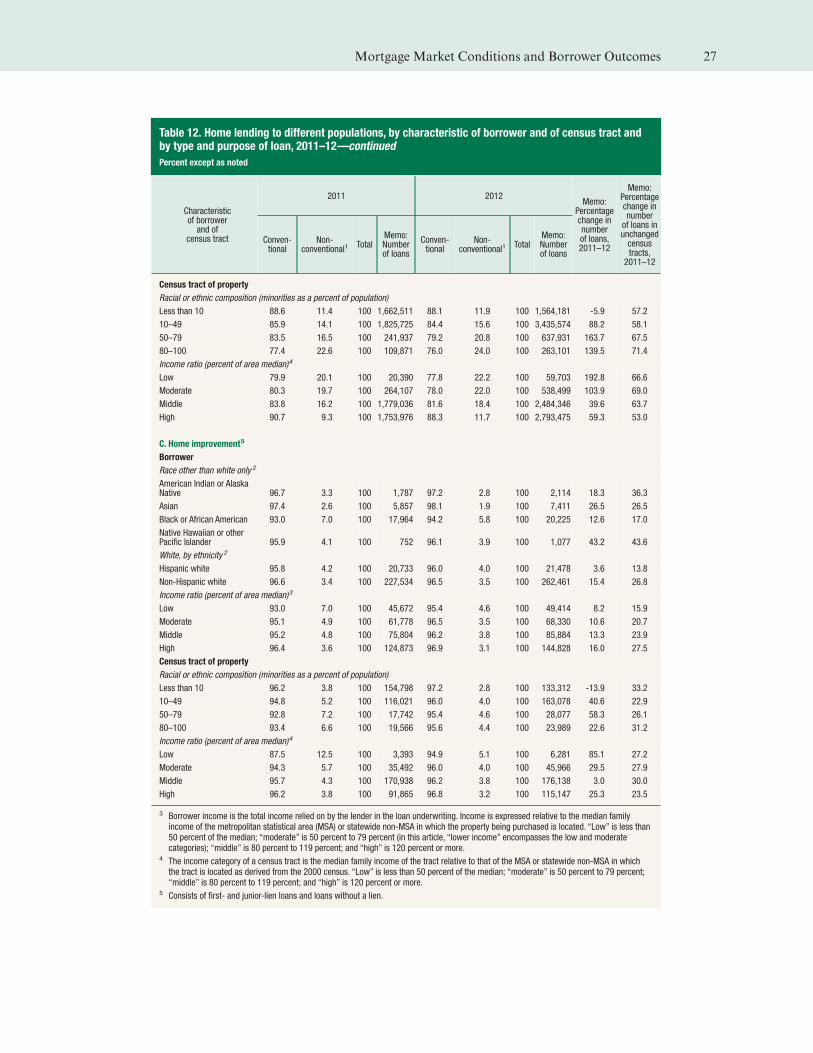
Table 12. Home lending to different populations, by characteristic of borrower and of census tract andby type and purpose of loan, 2011–12—continued
Percent except as noted
Characteristicof borrowerand of
census tract
2011 2012Memo:
Percentagechange innumberof loans,2011–12
Memo:Percentagechange innumberof loans inunchangedcensustracts,
2011–12
Conven-tional
Non-conventional1
TotalMemo:Numberof loans
Conven-tional
Non-conventional1
TotalMemo:Numberof loans
Census tract of property
Racial or ethnic composition (minorities as a percent of population)
Less than 10 88.6 11.4 100 1,662,511 88.1 11.9 100 1,564,181 -5.9 57.2
10–49 85.9 14.1 100 1,825,725 84.4 15.6 100 3,435,574 88.2 58.1
50–79 83.5 16.5 100 241,937 79.2 20.8 100 637,931 163.7 67.5
80–100 77.4 22.6 100 109,871 76.0 24.0 100 263,101 139.5 71.4
Income ratio (percent of area median)4
Low 79.9 20.1 100 20,390 77.8 22.2 100 59,703 192.8 66.6
Moderate 80.3 19.7 100 264,107 78.0 22.0 100 538,499 103.9 69.0
Middle 83.8 16.2 100 1,779,036 81.6 18.4 100 2,484,346 39.6 63.7
High 90.7 9.3 100 1,753,976 88.3 11.7 100 2,793,475 59.3 53.0
C. Home improvement5
Borrower
Race other than white only 2
American Indian or AlaskaNative 96.7 3.3 100 1,787 97.2 2.8 100 2,114 18.3 36.3
Asian 97.4 2.6 100 5,857 98.1 1.9 100 7,411 26.5 26.5
Black or African American 93.0 7.0 100 17,964 94.2 5.8 100 20,225 12.6 17.0
Native Hawaiian or otherPacific Islander 95.9 4.1 100 752 96.1 3.9 100 1,077 43.2 43.6
White, by ethnicity 2
Hispanic white 95.8 4.2 100 20,733 96.0 4.0 100 21,478 3.6 13.8
Non-Hispanic white 96.6 3.4 100 227,534 96.5 3.5 100 262,461 15.4 26.8
Income ratio (percent of area median)3
Low 93.0 7.0 100 45,672 95.4 4.6 100 49,414 8.2 15.9
Moderate 95.1 4.9 100 61,778 96.5 3.5 100 68,330 10.6 20.7
Middle 95.2 4.8 100 75,804 96.2 3.8 100 85,884 13.3 23.9
High 96.4 3.6 100 124,873 96.9 3.1 100 144,828 16.0 27.5
Census tract of property
Racial or ethnic composition (minorities as a percent of population)
Less than 10 96.2 3.8 100 154,798 97.2 2.8 100 133,312 -13.9 33.2
10–49 94.8 5.2 100 116,021 96.0 4.0 100 163,078 40.6 22.9
50–79 92.8 7.2 100 17,742 95.4 4.6 100 28,077 58.3 26.1
80–100 93.4 6.6 100 19,566 95.6 4.4 100 23,989 22.6 31.2
Income ratio (percent of area median)4
Low 87.5 12.5 100 3,393 94.9 5.1 100 6,281 85.1 27.2
Moderate 94.3 5.7 100 35,492 96.0 4.0 100 45,966 29.5 27.9
Middle 95.7 4.3 100 170,938 96.2 3.8 100 176,138 3.0 30.0
High 96.2 3.8 100 91,865 96.8 3.2 100 115,147 25.3 23.5
3 Borrower income is the total income relied on by the lender in the loan underwriting. Income is expressed relative to the median familyincome of the metropolitan statistical area (MSA) or statewide non-MSA in which the property being purchased is located. “Low” is less than50 percent of the median; “moderate” is 50 percent to 79 percent (in this article, “lower income” encompasses the low and moderatecategories); “middle” is 80 percent to 119 percent; and “high” is 120 percent or more.
4 The income category of a census tract is the median family income of the tract relative to that of the MSA or statewide non-MSA in whichthe tract is located as derived from the 2000 census. “Low” is less than 50 percent of the median; “moderate” is 50 percent to 79 percent;“middle” is 80 percent to 119 percent; and “high” is 120 percent or more.
5 Consists of first- and junior-lien loans and loans without a lien.
Mortgage Market Conditions and Borrower Outcomes 27
Differences in Lending Outcomes by Race, Ethnicity, and Sexof the Borrower
One reason the Congress amended HMDA in 1989 was to enhance its value for fair lending
enforcement by adding to the items reported the disposition of applications for loans and
the race, ethnicity, and sex of applicants. A similar motivation underlay the Federal
Reserve’s decision to add pricing data for higher-priced loans in 2004, although such data
serve other purposes, including to help identify lenders active in the higher-cost or higher-
risk segments of the mortgage market and provide information on the volume and loca-
tions of borrowers receiving higher-priced loans.
Over the years, analyses of HMDA data have consistently found substantial differences in
the incidence of higher-priced lending and in application denial rates across racial and eth-
nic lines, differences that cannot be fully explained by factors included in the HMDA
data.45 Analyses also have found that differences across groups in mean APR spreads paid
by those with higher-priced loans were generally small.46 Here we examine the 2012
HMDA data to determine the extent to which these differences persist.
The analysis here presents aggregated lending outcomes across all reporting institutions.
Patterns for any given financial institution may differ from those shown, and, for any given
financial institution, relationships may vary by loan product, geographic market, and loan
purpose. Further, although the HMDA data include some detailed information about each
mortgage transaction, many key factors that are considered by lenders in credit underwrit-
ing and pricing are not included. Accordingly, it is not possible to determine from HMDA
data alone whether racial and ethnic pricing disparities reflect illegal discrimination.
Comparisons of outcomes (for both loan pricing and denial rates) are shown for each
racial, ethnic, or gender group. The analysis here distinguishes among three loan purposes
(home purchase, refinance, and home improvement) and between two broad types of lend-
ing (conventional and nonconventional), reflecting the different underwriting standards
and fees associated with these two broad loan product categories.
Incidence of Higher-Priced Lending by Race, Ethnicity, and Sex
Overall, the reported incidence of higher-priced lending was about 50 basis points lower in
2012 than in 2011 (data for 2011 not shown in tables). Pricing relationships across popula-
tion groups observed in the 2012 HMDA data are very similar to those found in the 2011
data. The 2012 HMDA data indicate that black and Hispanic-white borrowers are more
likely, and Asian borrowers less likely, to obtain conventional loans with prices above the
HMDA price-reporting thresholds than are non-Hispanic white borrowers. These relation-
ships hold both for home-purchase and refinance lending and for nonconventional loans
(tables 13.A and 13.B). For example, for conventional home-purchase lending in 2012, the
incidence of higher-priced lending was 6.7 percent for black borrowers, 7.4 percent for His-
panic white borrowers, and 1.3 percent for Asians, compared with 3.2 percent for non-His-
panic white borrowers. With regard to the gender of applicants, we find relatively small dif-
45 See Avery, Brevoort, and Canner, “The 2006 HMDA Data”; Avery, Brevoort, and Canner, “Higher-PricedHome Lending and the 2005 HMDA Data”; and Avery, Canner, and Cook, “New Information Reported underHMDA”; all three references are in note 35.
46 See, for example, Andrew Haughwout, Christopher Mayer, and Joseph Tracy (2009), “Subprime MortgagePricing: The Impact of Race, Ethnicity, and Gender on the Cost of Borrowing,” Federal Reserve Bank of NewYork Staff Reports 368 (New York: Federal Reserve Bank of New York, April), www.newyorkfed.org/research/staff_reports/sr368.pdf; and Marsha J. Courchane (2007), “The Pricing of Home Mortgage Loans to MinorityBorrowers: How Much of the APR Differential Can We Explain?” Journal of Real Estate Research, vol. 29 (4),pp. 399–439.
28 Federal Reserve Bulletin | November 2013
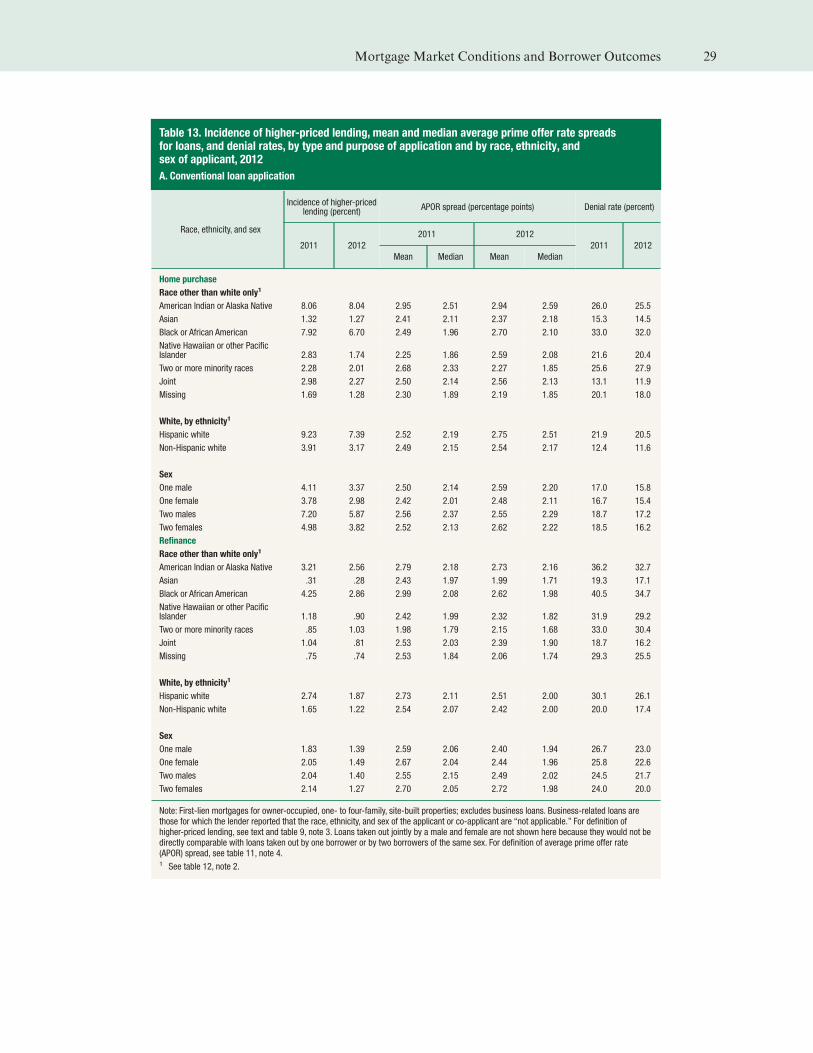
Table 13. Incidence of higher-priced lending, mean and median average prime offer rate spreadsfor loans, and denial rates, by type and purpose of application and by race, ethnicity, andsex of applicant, 2012
A. Conventional loan application
Race, ethnicity, and sex
Incidence of higher-pricedlending (percent)
APOR spread (percentage points) Denial rate (percent)
2011 2012
2011 2012
2011 2012
Mean Median Mean Median
Home purchase
Race other than white only1
American Indian or Alaska Native 8.06 8.04 2.95 2.51 2.94 2.59 26.0 25.5
Asian 1.32 1.27 2.41 2.11 2.37 2.18 15.3 14.5
Black or African American 7.92 6.70 2.49 1.96 2.70 2.10 33.0 32.0
Native Hawaiian or other PacificIslander 2.83 1.74 2.25 1.86 2.59 2.08 21.6 20.4
Two or more minority races 2.28 2.01 2.68 2.33 2.27 1.85 25.6 27.9
Joint 2.98 2.27 2.50 2.14 2.56 2.13 13.1 11.9
Missing 1.69 1.28 2.30 1.89 2.19 1.85 20.1 18.0
White, by ethnicity1
Hispanic white 9.23 7.39 2.52 2.19 2.75 2.51 21.9 20.5
Non-Hispanic white 3.91 3.17 2.49 2.15 2.54 2.17 12.4 11.6
Sex
One male 4.11 3.37 2.50 2.14 2.59 2.20 17.0 15.8
One female 3.78 2.98 2.42 2.01 2.48 2.11 16.7 15.4
Two males 7.20 5.87 2.56 2.37 2.55 2.29 18.7 17.2
Two females 4.98 3.82 2.52 2.13 2.62 2.22 18.5 16.2
Refinance
Race other than white only1
American Indian or Alaska Native 3.21 2.56 2.79 2.18 2.73 2.16 36.2 32.7
Asian .31 .28 2.43 1.97 1.99 1.71 19.3 17.1
Black or African American 4.25 2.86 2.99 2.08 2.62 1.98 40.5 34.7
Native Hawaiian or other PacificIslander 1.18 .90 2.42 1.99 2.32 1.82 31.9 29.2
Two or more minority races .85 1.03 1.98 1.79 2.15 1.68 33.0 30.4
Joint 1.04 .81 2.53 2.03 2.39 1.90 18.7 16.2
Missing .75 .74 2.53 1.84 2.06 1.74 29.3 25.5
White, by ethnicity1
Hispanic white 2.74 1.87 2.73 2.11 2.51 2.00 30.1 26.1
Non-Hispanic white 1.65 1.22 2.54 2.07 2.42 2.00 20.0 17.4
Sex
One male 1.83 1.39 2.59 2.06 2.40 1.94 26.7 23.0
One female 2.05 1.49 2.67 2.04 2.44 1.96 25.8 22.6
Two males 2.04 1.40 2.55 2.15 2.49 2.02 24.5 21.7
Two females 2.14 1.27 2.70 2.05 2.72 1.98 24.0 20.0
Note: First-lien mortgages for owner-occupied, one- to four-family, site-built properties; excludes business loans. Business-related loans arethose for which the lender reported that the race, ethnicity, and sex of the applicant or co-applicant are “not applicable.” For definition ofhigher-priced lending, see text and table 9, note 3. Loans taken out jointly by a male and female are not shown here because they would not bedirectly comparable with loans taken out by one borrower or by two borrowers of the same sex. For definition of average prime offer rate(APOR) spread, see table 11, note 4.1 See table 12, note 2.
Mortgage Market Conditions and Borrower Outcomes 29
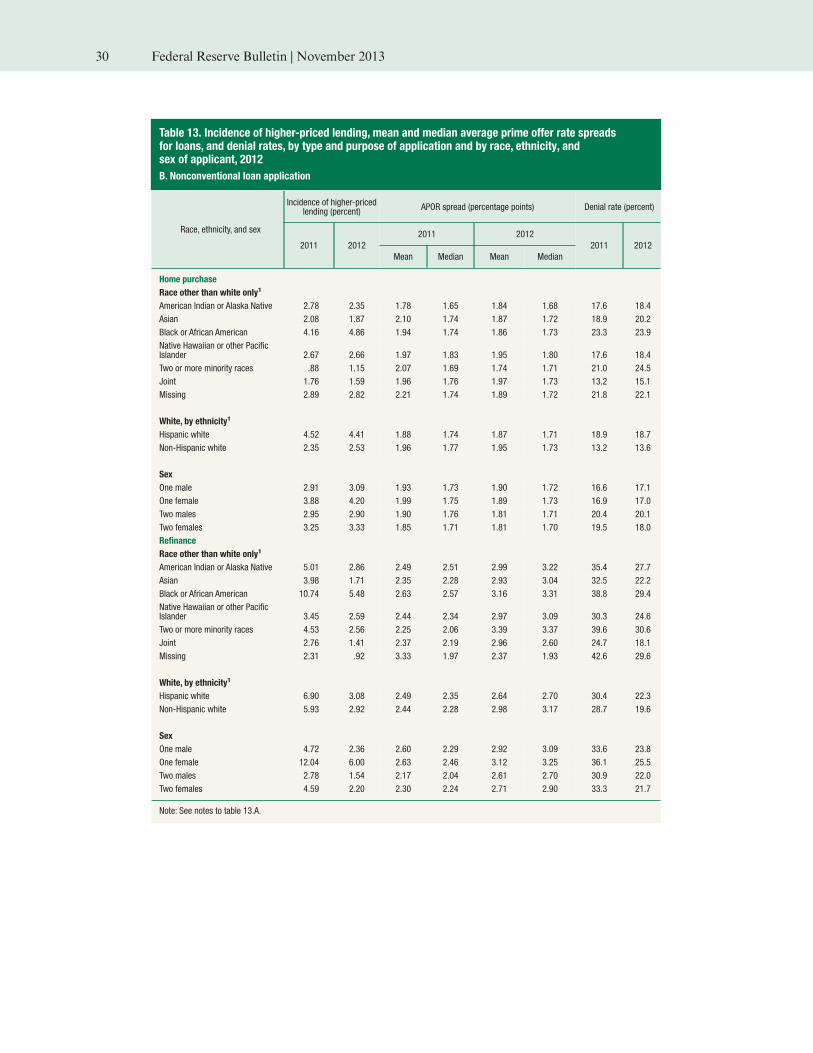
Table 13. Incidence of higher-priced lending, mean and median average prime offer rate spreadsfor loans, and denial rates, by type and purpose of application and by race, ethnicity, andsex of applicant, 2012
B. Nonconventional loan application
Race, ethnicity, and sex
Incidence of higher-pricedlending (percent)
APOR spread (percentage points) Denial rate (percent)
2011 2012
2011 2012
2011 2012
Mean Median Mean Median
Home purchase
Race other than white only1
American Indian or Alaska Native 2.78 2.35 1.78 1.65 1.84 1.68 17.6 18.4
Asian 2.08 1.87 2.10 1.74 1.87 1.72 18.9 20.2
Black or African American 4.16 4.86 1.94 1.74 1.86 1.73 23.3 23.9
Native Hawaiian or other PacificIslander 2.67 2.66 1.97 1.83 1.95 1.80 17.6 18.4
Two or more minority races .88 1.15 2.07 1.69 1.74 1.71 21.0 24.5
Joint 1.76 1.59 1.96 1.76 1.97 1.73 13.2 15.1
Missing 2.89 2.82 2.21 1.74 1.89 1.72 21.8 22.1
White, by ethnicity1
Hispanic white 4.52 4.41 1.88 1.74 1.87 1.71 18.9 18.7
Non-Hispanic white 2.35 2.53 1.96 1.77 1.95 1.73 13.2 13.6
Sex
One male 2.91 3.09 1.93 1.73 1.90 1.72 16.6 17.1
One female 3.88 4.20 1.99 1.75 1.89 1.73 16.9 17.0
Two males 2.95 2.90 1.90 1.76 1.81 1.71 20.4 20.1
Two females 3.25 3.33 1.85 1.71 1.81 1.70 19.5 18.0
Refinance
Race other than white only1
American Indian or Alaska Native 5.01 2.86 2.49 2.51 2.99 3.22 35.4 27.7
Asian 3.98 1.71 2.35 2.28 2.93 3.04 32.5 22.2
Black or African American 10.74 5.48 2.63 2.57 3.16 3.31 38.8 29.4
Native Hawaiian or other PacificIslander 3.45 2.59 2.44 2.34 2.97 3.09 30.3 24.6
Two or more minority races 4.53 2.56 2.25 2.06 3.39 3.37 39.6 30.6
Joint 2.76 1.41 2.37 2.19 2.96 2.60 24.7 18.1
Missing 2.31 .92 3.33 1.97 2.37 1.93 42.6 29.6
White, by ethnicity1
Hispanic white 6.90 3.08 2.49 2.35 2.64 2.70 30.4 22.3
Non-Hispanic white 5.93 2.92 2.44 2.28 2.98 3.17 28.7 19.6
Sex
One male 4.72 2.36 2.60 2.29 2.92 3.09 33.6 23.8
One female 12.04 6.00 2.63 2.46 3.12 3.25 36.1 25.5
Two males 2.78 1.54 2.17 2.04 2.61 2.70 30.9 22.0
Two females 4.59 2.20 2.30 2.24 2.71 2.90 33.3 21.7
Note: See notes to table 13.A.
30 Federal Reserve Bulletin | November 2013
ferences in the incidence of higher-priced lending between single applicants of different
genders.
Rate Spreads by Race, Ethnicity, and Sex
The 2012 data indicate that, among borrowers with higher-priced loans, the gross APOR
spreads are similar across groups. This result holds for both conventional (table 13.A) and
nonconventional lending (table 13.B). For example, for conventional home-purchase loans
for owner-occupied properties, the gross mean APOR spread was 2.70 percentage points
for black borrowers and 2.75 percentage points for Hispanic white borrowers, while it was
2.54 percentage points for non-Hispanic white borrowers and 2.37 percentage points for
Asian borrowers. Gross differences across groups in APOR spreads for refinancings were
about the same as for home-purchase lending. With regard to the gender of applicants, the
2012 data reveal only small differences in the gross APR spreads between single applicants
of different genders.
Denial Rates by Race, Ethnicity, and Sex
HMDA data in previous years have consistently shown that denial rates vary across appli-
cants grouped by race or ethnicity. This continues to be the case in 2012. As in past years,
blacks and Hispanic whites had notably higher gross denial rates in 2012 than non-His-
panic whites, while the differences between Asians and non-Hispanic whites generally were
fairly small by comparison (as shown in tables 13.A and 13.B). For example, the denial
rates for conventional home-purchase loans were 32 percent for blacks, 20.5 percent for
Hispanic whites, 14.5 percent for Asians, and 11.6 percent for non-Hispanic whites. Each of
these rates were little changed from 2011. The pattern was about the same for nonconven-
tional home-purchase lending, although the gap in gross denial rates between blacks or His-
panic whites and non-Hispanic whites was notably smaller than for conventional home-
purchase loans.
Some Limitations of the Data in Assessing Fair Lending Compliance
Previous research and experience gained in the fair lending enforcement process show that
unexplained differences in the incidence of higher-priced lending and in denial rates among
racial or ethnic groups stem, at least in part, from credit-related factors not available in the
HMDA data, such as credit history (including credit scores), loan-to-value ratios, and dif-
ferences in loan characteristics. Differential costs of loan origination and the competitive
environment also may bear on the differences in pricing, as may differences across popula-
tions in credit-shopping activities.
Despite these limitations, the HMDA data play an important role in fair lending enforce-
ment. The data are regularly used by bank examiners to facilitate the fair lending examina-
tion and enforcement processes. When examiners for the federal banking agencies evaluate
an institution’s fair lending risk, they analyze HMDA price data and loan application
outcomes in conjunction with other information and risk factors that can be drawn directly
from loan files or electronic records maintained by lenders, as directed by the Interagency
Fair Lending Examination Procedures.47 The availability of broader information allows the
examiners to draw firm conclusions about institution compliance with the fair lending laws.
It is important to keep in mind that the HMDA data, as currently constituted, can be used
only to detect differences in pricing across groups for loans with APRs above the reporting
47 The Interagency Fair Lending Examination Procedures are available at www.ffiec.gov/PDF/fairlend.pdf.
Mortgage Market Conditions and Borrower Outcomes 31
threshold; pricing differences may exist among loans below the threshold. This gap in the
loan pricing information will be addressed when the CFPB implements the expanded data
reporting requirements set forth in the Dodd-Frank Wall Street Reform and Consumer
Protection Act of 2010 (Dodd-Frank Act), including the provision requiring the reporting
of rate spread information for all loans.
Analysis of Matched HMDA and Credit Bureau Data
In this section, we present the results from an analysis using an enhanced HMDA data set
in which first-lien, owner-occupant home-purchase and refinance mortgages reported in
the HMDA data have been matched to borrowers’ consumer credit record information.48
The matched data set provides an opportunity to explore many aspects of home lending
that the HMDA data alone cannot address. Chief among these are the credit circumstances
(for example, credit scores, nonmortgage debts, and monthly payments on loans) of mort-
gage borrowers prior to and at the time of loan origination and their subsequent payment
performance on their mortgages and other loans.
Neither the HMDA data nor the credit record data include personal identifying informa-
tion, but borrowers in the two data sets can be matched based on the mortgage loan infor-
mation common to both data sets (details of the matching process are provided in appen-
dix B, “Matching HMDA Records with Credit Bureau Records”). For this article, we
present results from the matched 2006 and 2010 HMDA loan records; the process of
matching data for additional years is ongoing. The 2006 matched data reflect lending activ-
ity at the height of the most recent housing boom, while the 2010 data reflect the far more
subdued market conditions that were still largely present in 2012. The advantage of study-
ing the 2010 data is that we are able to track payment performance over the subsequent
24 months.
The credit records available for matching come from the Federal Reserve Bank of New
York Consumer Credit Panel/Equifax (CCP) data.49 The CCP is a 5 percent, nationally
representative sample of all individuals with a credit record and a valid Social Security
number. Furthermore, the CCP data are a quarterly panel, tracking the same individuals
over time.50
Because the credit record data are a 5 percent sample of the full population, only a small
fraction of HMDA loan records will be represented in the CCP. That said, because the
HMDA data consist of several million loan records, the resulting matched data set is still
quite large. For reasons discussed in appendix B, we attempted to match only those mort-
gages for owner-occupied properties in MSAs. Of such loans, we matched about 300,000 in
each year, which is about 4 percent of all eligible HMDA loans and implies a match rate of
about 60 percent (see appendix B for details of the calculation).
48 For further information about credit records, see Robert B. Avery, Paul S. Calem, Glenn B. Canner, andRaphael W. Bostic (2003), “An Overview of Consumer Data and Credit Reporting,” Federal Reserve Bulletin,vol. 89 (February), pp. 47–73, www.federalreserve.gov/pubs/bulletin/2003/0203lead.pdf.
49 For further details, see Donghoon Lee and Wilbert van der Klaauw (2010) “An Introduction to the FRBNYConsumer Credit Panel,” Federal Reserve Bank of New York Staff Reports 479 (New York: Federal ReserveBank of New York, November), www.newyorkfed.org/research/staff_reports/sr479.html.
50 The sampling approach is designed to generate the same entry and exit behavior as is present in the population,with young individuals and immigrants entering the sample and deceased individuals and emigrants leaving thesample each quarter at the same rate as in the U.S. population, such that each quarterly snapshot continues tobe nationally representative.
32 Federal Reserve Bulletin | November 2013
Although the 60 percent implied match rate is well below 100 percent, a comparison of the
characteristics of the matched loans with the characteristics of the full HMDA data indi-
cates that the matched loans provide a good representation of all HMDA records targeted
for matching (table B.1, in appendix B).
Credit Characteristics and Performance by Borrower, Lender,and Loan Type
The HMDA data provide unique information on the race, ethnicity, and income of mort-
gage borrowers; the type of lender and loan purchaser; and loan pricing. Matching to
the credit record data adds information on the credit profiles of borrowers. In addition,
because of the panel nature of the CCP, we are able to track loans over time to measure
performance. We report statistics derived from the credit records by various borrower,
lender, and loan attributes identified from the HMDA data for the 2006 and 2010 sets of
matched home-purchase and refinance loans (tables 14 and 15). Because the CCP samples
individuals rather than mortgages, we weighted the data accordingly to account for the fact
that joint mortgages (mortgages that have more than one borrower) have roughly twice the
likelihood of being sampled in the CCP.
Credit Scores
Credit scores are a summary metric of the relative credit risk posed by current and prospec-
tive borrowers. Generic credit scores (sometimes referred to as bureau or credit history
scores) are derived using credit records to predict the likelihood of default based on indi-
viduals’ past experiences. Notably, credit scores rank-order individuals by the credit risk
they pose within a given economic environment; they do not imply any particular future
probability of default.51
The credit score statistics shown in tables 14 and 15 are measured at the end of the quarter
prior to mortgage origination.52 Credit scores from this date were selected to better align
with the information a loan underwriter may have been considering when evaluating the
home loan application. Overall, the data show that credit scores differ significantly across
various categories of borrowers and loans, and that the average credit scores of borrowers
in 2010 were significantly higher than in 2006.
The first five rows of tables 14.A and 14.B show that in 2006, Asian borrowers had the
highest average scores, while black mortgage borrowers had the lowest scores. Among
home-purchase loans, Asian borrowers had an average score of 723, compared with 640 for
black borrowers, and over 40 percent of black borrowers had a score below 620—a score
threshold often associated with subprime lending—while just 7 percent of Asian borrowers
fell below that level.53 Credit scores also varied by the income and neighborhood character-
51 For a discussion of the reasons that credit scores do not predict the future default rate for any particular score,see Board of Governors of the Federal Reserve System (2007), Report to the Congress on Credit Scoring and ItsEffects on the Availability and Affordability of Credit (Washington: Board of Governors, August), www.federalreserve.gov/boarddocs/rptcongress/creditscore/default.htm.
52 The credit score included in the CCP is generated from the Equifax Risk Score 3.0 model. The Equifax RiskScore 3.0 is a credit score produced from a general-purpose risk model that predicts the likelihood an individualwill become 90 days or more delinquent on any account within 24 months after the score is calculated. TheEquifax Risk Score 3.0 ranges from 280 to 850, with a higher score corresponding to lower relative risk (formore information, see www.equifax.com). Although the lender may have used a different score to underwritethe loan, it is likely that the scores used here are highly correlated with the scores used in underwriting.
53 One drawback of our matched data set is that we observe the credit record information and credit score foronly one of the two borrowers in a joint mortgage. Underwriters may select the lower of the two credit scoresfor the two applicants, whereas we match only one randomly selected applicant. Thus, for joint mortgages, thecredit scores we observe may overstate the credit score used in underwriting to the extent that joint applicants
Mortgage Market Conditions and Borrower Outcomes 33
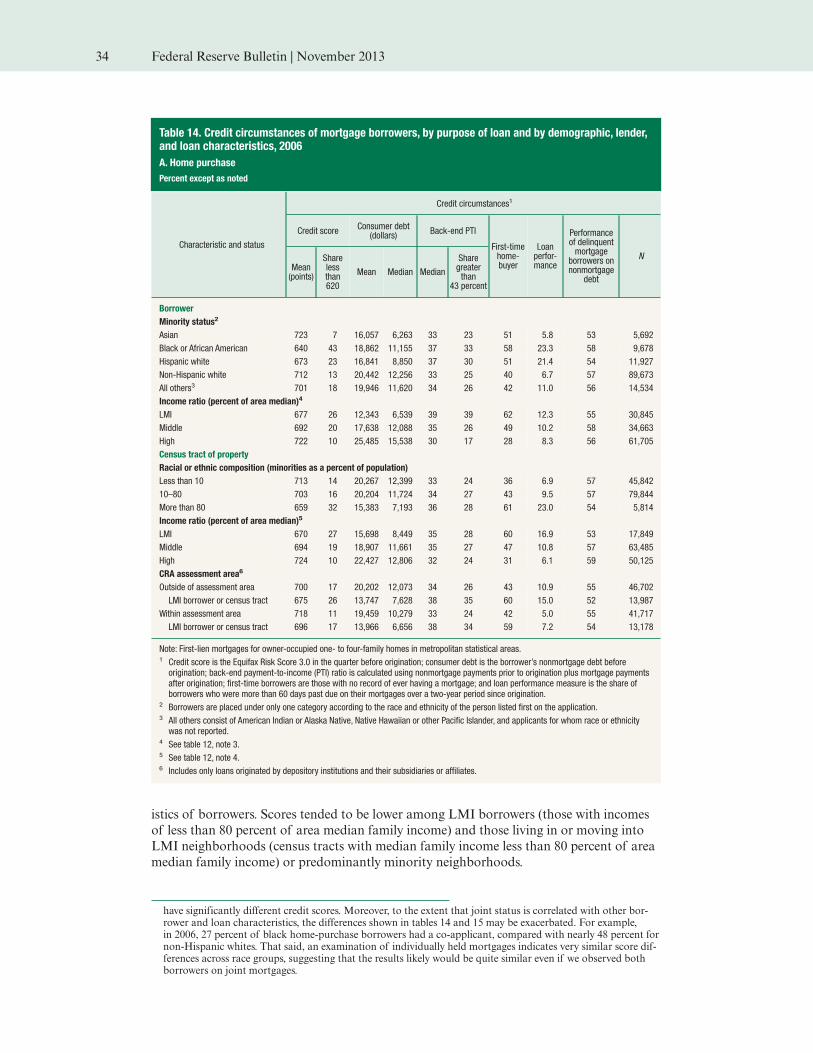
istics of borrowers. Scores tended to be lower among LMI borrowers (those with incomes
of less than 80 percent of area median family income) and those living in or moving into
LMI neighborhoods (census tracts with median family income less than 80 percent of area
median family income) or predominantly minority neighborhoods.
have significantly different credit scores. Moreover, to the extent that joint status is correlated with other bor-rower and loan characteristics, the differences shown in tables 14 and 15 may be exacerbated. For example,in 2006, 27 percent of black home-purchase borrowers had a co-applicant, compared with nearly 48 percent fornon-Hispanic whites. That said, an examination of individually held mortgages indicates very similar score dif-ferences across race groups, suggesting that the results likely would be quite similar even if we observed bothborrowers on joint mortgages.
Table 14. Credit circumstances of mortgage borrowers, by purpose of loan and by demographic, lender,and loan characteristics, 2006
A. Home purchase
Percent except as noted
Characteristic and status
Credit circumstances1
Credit scoreConsumer debt
(dollars)Back-end PTI
First-timehome-buyer
Loanperfor-mance
Performanceof delinquentmortgage
borrowers onnonmortgage
debt
N
Mean(points)
Sharelessthan620
Mean Median Median
Sharegreaterthan
43 percent
Borrower
Minority status2
Asian 723 7 16,057 6,263 33 23 51 5.8 53 5,692
Black or African American 640 43 18,862 11,155 37 33 58 23.3 58 9,678
Hispanic white 673 23 16,841 8,850 37 30 51 21.4 54 11,927
Non-Hispanic white 712 13 20,442 12,256 33 25 40 6.7 57 89,673
All others3 701 18 19,946 11,620 34 26 42 11.0 56 14,534
Income ratio (percent of area median)4
LMI 677 26 12,343 6,539 39 39 62 12.3 55 30,845
Middle 692 20 17,638 12,088 35 26 49 10.2 58 34,663
High 722 10 25,485 15,538 30 17 28 8.3 56 61,705
Census tract of property
Racial or ethnic composition (minorities as a percent of population)
Less than 10 713 14 20,267 12,399 33 24 36 6.9 57 45,842
10–80 703 16 20,204 11,724 34 27 43 9.5 57 79,844
More than 80 659 32 15,383 7,193 36 28 61 23.0 54 5,814
Income ratio (percent of area median)5
LMI 670 27 15,698 8,449 35 28 60 16.9 53 17,849
Middle 694 19 18,907 11,661 35 27 47 10.8 57 63,485
High 724 10 22,427 12,806 32 24 31 6.1 59 50,125
CRA assessment area6
Outside of assessment area 700 17 20,202 12,073 34 26 43 10.9 55 46,702
LMI borrower or census tract 675 26 13,747 7,628 38 35 60 15.0 52 13,987
Within assessment area 718 11 19,459 10,279 33 24 42 5.0 55 41,717
LMI borrower or census tract 696 17 13,966 6,656 38 34 59 7.2 54 13,178
Note: First-lien mortgages for owner-occupied one- to four-family homes in metropolitan statistical areas.1 Credit score is the Equifax Risk Score 3.0 in the quarter before origination; consumer debt is the borrower’s nonmortgage debt beforeorigination; back-end payment-to-income (PTI) ratio is calculated using nonmortgage payments prior to origination plus mortgage paymentsafter origination; first-time borrowers are those with no record of ever having a mortgage; and loan performance measure is the share ofborrowers who were more than 60 days past due on their mortgages over a two-year period since origination.
2 Borrowers are placed under only one category according to the race and ethnicity of the person listed first on the application.3 All others consist of American Indian or Alaska Native, Native Hawaiian or other Pacific Islander, and applicants for whom race or ethnicitywas not reported.
4 See table 12, note 3.5 See table 12, note 4.6 Includes only loans originated by depository institutions and their subsidiaries or affiliates.
34 Federal Reserve Bulletin | November 2013
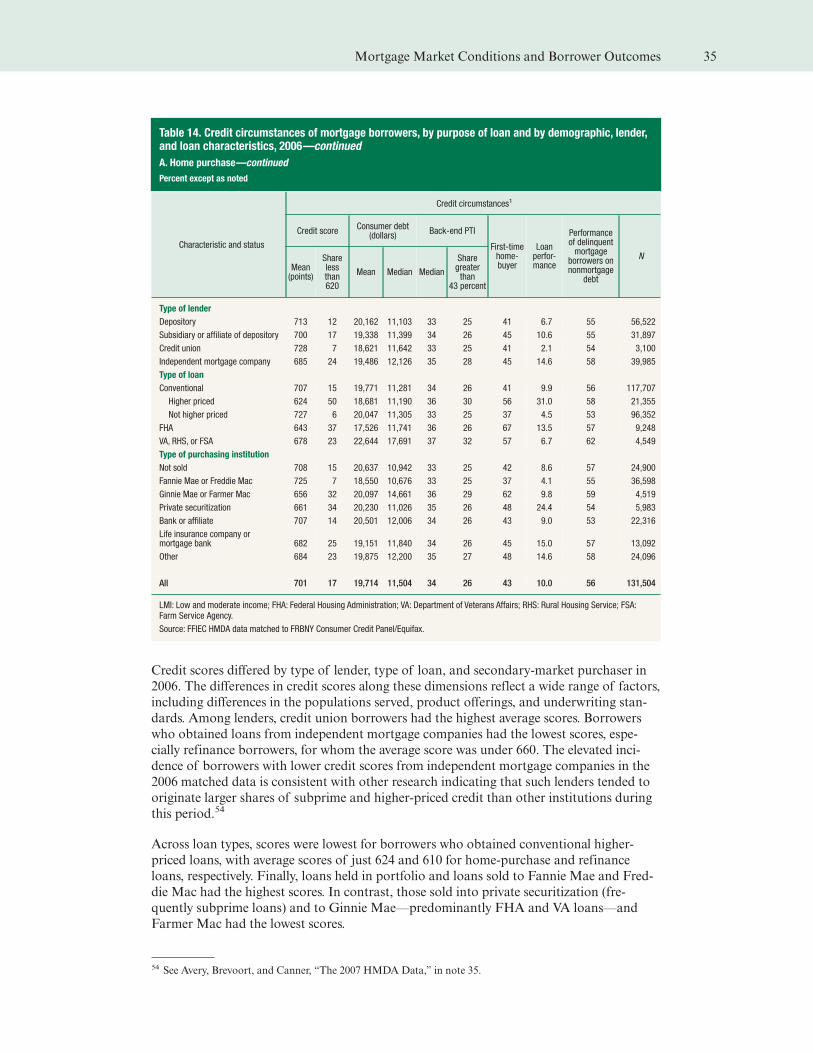
Credit scores differed by type of lender, type of loan, and secondary-market purchaser in
2006. The differences in credit scores along these dimensions reflect a wide range of factors,
including differences in the populations served, product offerings, and underwriting stan-
dards. Among lenders, credit union borrowers had the highest average scores. Borrowers
who obtained loans from independent mortgage companies had the lowest scores, espe-
cially refinance borrowers, for whom the average score was under 660. The elevated inci-
dence of borrowers with lower credit scores from independent mortgage companies in the
2006 matched data is consistent with other research indicating that such lenders tended to
originate larger shares of subprime and higher-priced credit than other institutions during
this period.54
Across loan types, scores were lowest for borrowers who obtained conventional higher-
priced loans, with average scores of just 624 and 610 for home-purchase and refinance
loans, respectively. Finally, loans held in portfolio and loans sold to Fannie Mae and Fred-
die Mac had the highest scores. In contrast, those sold into private securitization (fre-
quently subprime loans) and to Ginnie Mae—predominantly FHA and VA loans—and
Farmer Mac had the lowest scores.
54 See Avery, Brevoort, and Canner, “The 2007 HMDA Data,” in note 35.
Table 14. Credit circumstances of mortgage borrowers, by purpose of loan and by demographic, lender,and loan characteristics, 2006—continued
A. Home purchase—continued
Percent except as noted
Characteristic and status
Credit circumstances1
Credit scoreConsumer debt
(dollars)Back-end PTI
First-timehome-buyer
Loanperfor-mance
Performanceof delinquentmortgage
borrowers onnonmortgage
debt
N
Mean(points)
Sharelessthan620
Mean Median Median
Sharegreaterthan
43 percent
Type of lender
Depository 713 12 20,162 11,103 33 25 41 6.7 55 56,522
Subsidiary or affiliate of depository 700 17 19,338 11,399 34 26 45 10.6 55 31,897
Credit union 728 7 18,621 11,642 33 25 41 2.1 54 3,100
Independent mortgage company 685 24 19,486 12,126 35 28 45 14.6 58 39,985
Type of loan
Conventional 707 15 19,771 11,281 34 26 41 9.9 56 117,707
Higher priced 624 50 18,681 11,190 36 30 56 31.0 58 21,355
Not higher priced 727 6 20,047 11,305 33 25 37 4.5 53 96,352
FHA 643 37 17,526 11,741 36 26 67 13.5 57 9,248
VA, RHS, or FSA 678 23 22,644 17,691 37 32 57 6.7 62 4,549
Type of purchasing institution
Not sold 708 15 20,637 10,942 33 25 42 8.6 57 24,900
Fannie Mae or Freddie Mac 725 7 18,550 10,676 33 25 37 4.1 55 36,598
Ginnie Mae or Farmer Mac 656 32 20,097 14,661 36 29 62 9.8 59 4,519
Private securitization 661 34 20,230 11,026 35 26 48 24.4 54 5,983
Bank or affiliate 707 14 20,501 12,006 34 26 43 9.0 53 22,316
Life insurance company ormortgage bank 682 25 19,151 11,840 34 26 45 15.0 57 13,092
Other 684 23 19,875 12,200 35 27 48 14.6 58 24,096
All 701 17 19,714 11,504 34 26 43 10.0 56 131,504
LMI: Low and moderate income; FHA: Federal Housing Administration; VA: Department of Veterans Affairs; RHS: Rural Housing Service; FSA:Farm Service Agency.
Source: FFIEC HMDA data matched to FRBNY Consumer Credit Panel/Equifax.
Mortgage Market Conditions and Borrower Outcomes 35
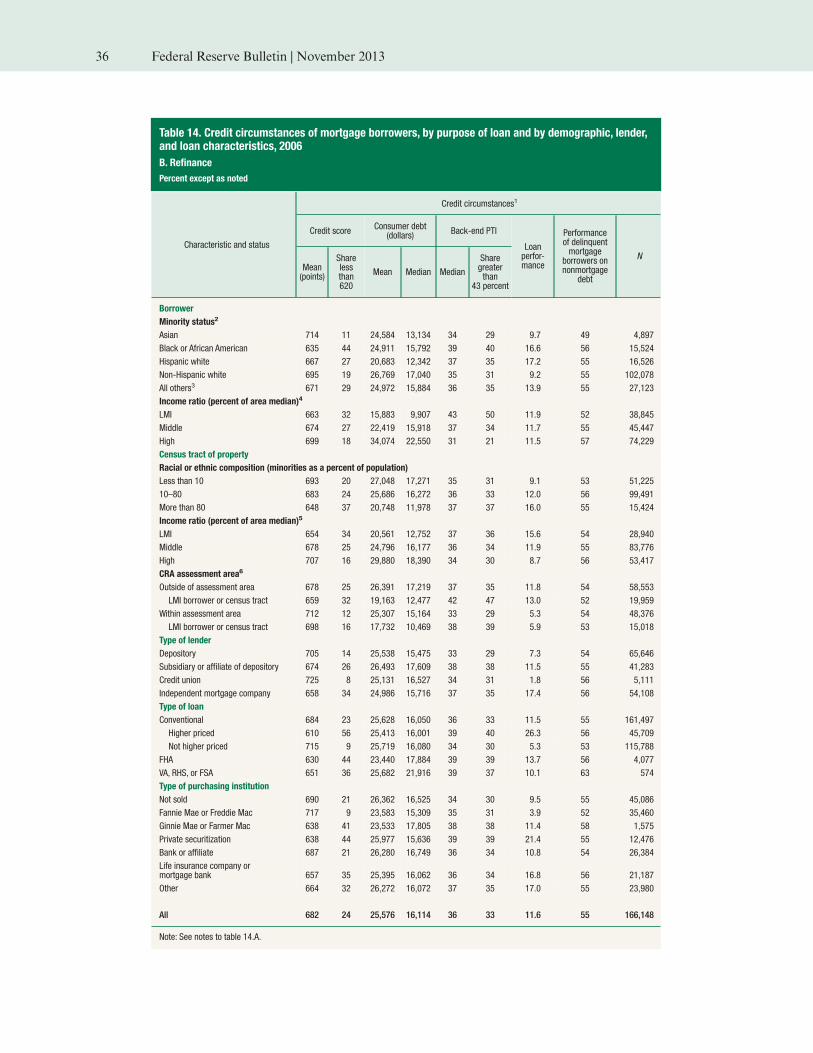
Table 14. Credit circumstances of mortgage borrowers, by purpose of loan and by demographic, lender,and loan characteristics, 2006
B. Refinance
Percent except as noted
Characteristic and status
Credit circumstances1
Credit scoreConsumer debt
(dollars)Back-end PTI
Loanperfor-mance
Performanceof delinquentmortgage
borrowers onnonmortgage
debt
N
Mean(points)
Sharelessthan620
Mean Median Median
Sharegreaterthan
43 percent
Borrower
Minority status2
Asian 714 11 24,584 13,134 34 29 9.7 49 4,897
Black or African American 635 44 24,911 15,792 39 40 16.6 56 15,524
Hispanic white 667 27 20,683 12,342 37 35 17.2 55 16,526
Non-Hispanic white 695 19 26,769 17,040 35 31 9.2 55 102,078
All others3 671 29 24,972 15,884 36 35 13.9 55 27,123
Income ratio (percent of area median)4
LMI 663 32 15,883 9,907 43 50 11.9 52 38,845
Middle 674 27 22,419 15,918 37 34 11.7 55 45,447
High 699 18 34,074 22,550 31 21 11.5 57 74,229
Census tract of property
Racial or ethnic composition (minorities as a percent of population)
Less than 10 693 20 27,048 17,271 35 31 9.1 53 51,225
10–80 683 24 25,686 16,272 36 33 12.0 56 99,491
More than 80 648 37 20,748 11,978 37 37 16.0 55 15,424
Income ratio (percent of area median)5
LMI 654 34 20,561 12,752 37 36 15.6 54 28,940
Middle 678 25 24,796 16,177 36 34 11.9 55 83,776
High 707 16 29,880 18,390 34 30 8.7 56 53,417
CRA assessment area6
Outside of assessment area 678 25 26,391 17,219 37 35 11.8 54 58,553
LMI borrower or census tract 659 32 19,163 12,477 42 47 13.0 52 19,959
Within assessment area 712 12 25,307 15,164 33 29 5.3 54 48,376
LMI borrower or census tract 698 16 17,732 10,469 38 39 5.9 53 15,018
Type of lender
Depository 705 14 25,538 15,475 33 29 7.3 54 65,646
Subsidiary or affiliate of depository 674 26 26,493 17,609 38 38 11.5 55 41,283
Credit union 725 8 25,131 16,527 34 31 1.8 56 5,111
Independent mortgage company 658 34 24,986 15,716 37 35 17.4 56 54,108
Type of loan
Conventional 684 23 25,628 16,050 36 33 11.5 55 161,497
Higher priced 610 56 25,413 16,001 39 40 26.3 56 45,709
Not higher priced 715 9 25,719 16,080 34 30 5.3 53 115,788
FHA 630 44 23,440 17,884 39 39 13.7 56 4,077
VA, RHS, or FSA 651 36 25,682 21,916 39 37 10.1 63 574
Type of purchasing institution
Not sold 690 21 26,362 16,525 34 30 9.5 55 45,086
Fannie Mae or Freddie Mac 717 9 23,583 15,309 35 31 3.9 52 35,460
Ginnie Mae or Farmer Mac 638 41 23,533 17,805 38 38 11.4 58 1,575
Private securitization 638 44 25,977 15,636 39 39 21.4 55 12,476
Bank or affiliate 687 21 26,280 16,749 36 34 10.8 54 26,384
Life insurance company ormortgage bank 657 35 25,395 16,062 36 34 16.8 56 21,187
Other 664 32 26,272 16,072 37 35 17.0 55 23,980
All 682 24 25,576 16,114 36 33 11.6 55 166,148
Note: See notes to table 14.A.
36 Federal Reserve Bulletin | November 2013
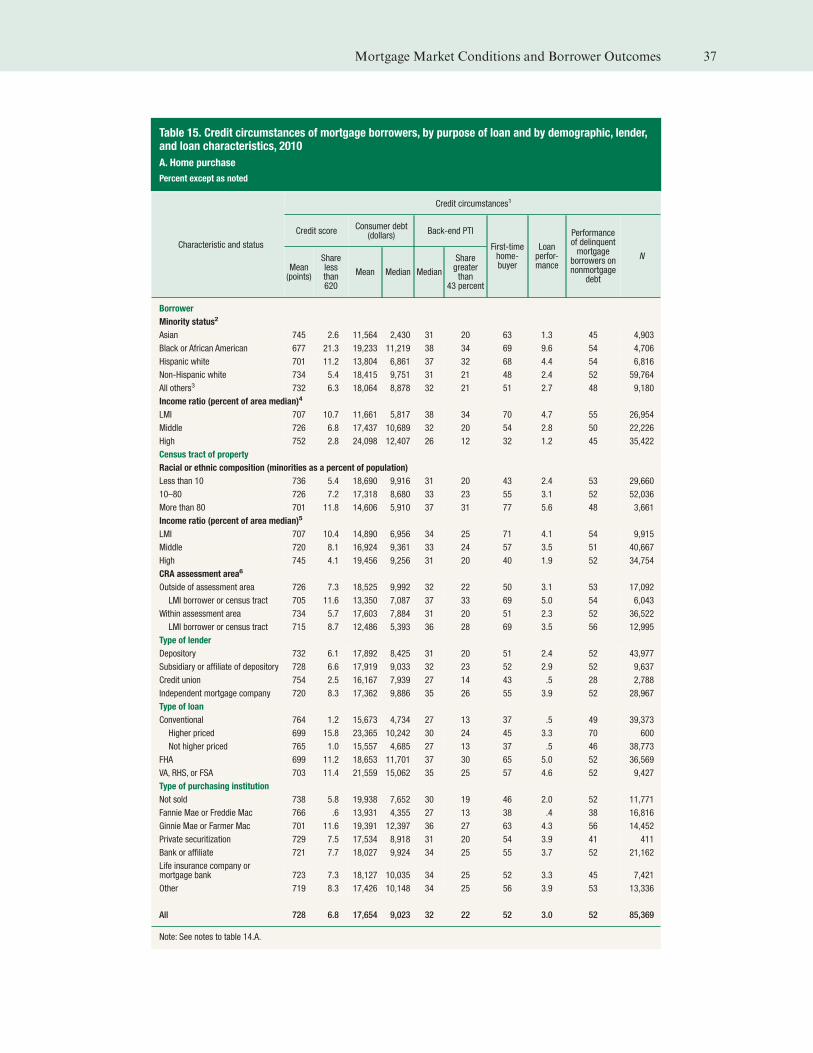
Table 15. Credit circumstances of mortgage borrowers, by purpose of loan and by demographic, lender,and loan characteristics, 2010
A. Home purchase
Percent except as noted
Characteristic and status
Credit circumstances1
Credit scoreConsumer debt
(dollars)Back-end PTI
First-timehome-buyer
Loanperfor-mance
Performanceof delinquentmortgage
borrowers onnonmortgage
debt
N
Mean(points)
Sharelessthan620
Mean Median Median
Sharegreaterthan
43 percent
Borrower
Minority status2
Asian 745 2.6 11,564 2,430 31 20 63 1.3 45 4,903
Black or African American 677 21.3 19,233 11,219 38 34 69 9.6 54 4,706
Hispanic white 701 11.2 13,804 6,861 37 32 68 4.4 54 6,816
Non-Hispanic white 734 5.4 18,415 9,751 31 21 48 2.4 52 59,764
All others3 732 6.3 18,064 8,878 32 21 51 2.7 48 9,180
Income ratio (percent of area median)4
LMI 707 10.7 11,661 5,817 38 34 70 4.7 55 26,954
Middle 726 6.8 17,437 10,689 32 20 54 2.8 50 22,226
High 752 2.8 24,098 12,407 26 12 32 1.2 45 35,422
Census tract of property
Racial or ethnic composition (minorities as a percent of population)
Less than 10 736 5.4 18,690 9,916 31 20 43 2.4 53 29,660
10–80 726 7.2 17,318 8,680 33 23 55 3.1 52 52,036
More than 80 701 11.8 14,606 5,910 37 31 77 5.6 48 3,661
Income ratio (percent of area median)5
LMI 707 10.4 14,890 6,956 34 25 71 4.1 54 9,915
Middle 720 8.1 16,924 9,361 33 24 57 3.5 51 40,667
High 745 4.1 19,456 9,256 31 20 40 1.9 52 34,754
CRA assessment area6
Outside of assessment area 726 7.3 18,525 9,992 32 22 50 3.1 53 17,092
LMI borrower or census tract 705 11.6 13,350 7,087 37 33 69 5.0 54 6,043
Within assessment area 734 5.7 17,603 7,884 31 20 51 2.3 52 36,522
LMI borrower or census tract 715 8.7 12,486 5,393 36 28 69 3.5 56 12,995
Type of lender
Depository 732 6.1 17,892 8,425 31 20 51 2.4 52 43,977
Subsidiary or affiliate of depository 728 6.6 17,919 9,033 32 23 52 2.9 52 9,637
Credit union 754 2.5 16,167 7,939 27 14 43 .5 28 2,788
Independent mortgage company 720 8.3 17,362 9,886 35 26 55 3.9 52 28,967
Type of loan
Conventional 764 1.2 15,673 4,734 27 13 37 .5 49 39,373
Higher priced 699 15.8 23,365 10,242 30 24 45 3.3 70 600
Not higher priced 765 1.0 15,557 4,685 27 13 37 .5 46 38,773
FHA 699 11.2 18,653 11,701 37 30 65 5.0 52 36,569
VA, RHS, or FSA 703 11.4 21,559 15,062 35 25 57 4.6 52 9,427
Type of purchasing institution
Not sold 738 5.8 19,938 7,652 30 19 46 2.0 52 11,771
Fannie Mae or Freddie Mac 766 .6 13,931 4,355 27 13 38 .4 38 16,816
Ginnie Mae or Farmer Mac 701 11.6 19,391 12,397 36 27 63 4.3 56 14,452
Private securitization 729 7.5 17,534 8,918 31 20 54 3.9 41 411
Bank or affiliate 721 7.7 18,027 9,924 34 25 55 3.7 52 21,162
Life insurance company ormortgage bank 723 7.3 18,127 10,035 34 25 52 3.3 45 7,421
Other 719 8.3 17,426 10,148 34 25 56 3.9 53 13,336
All 728 6.8 17,654 9,023 32 22 52 3.0 52 85,369
Note: See notes to table 14.A.
Mortgage Market Conditions and Borrower Outcomes 37
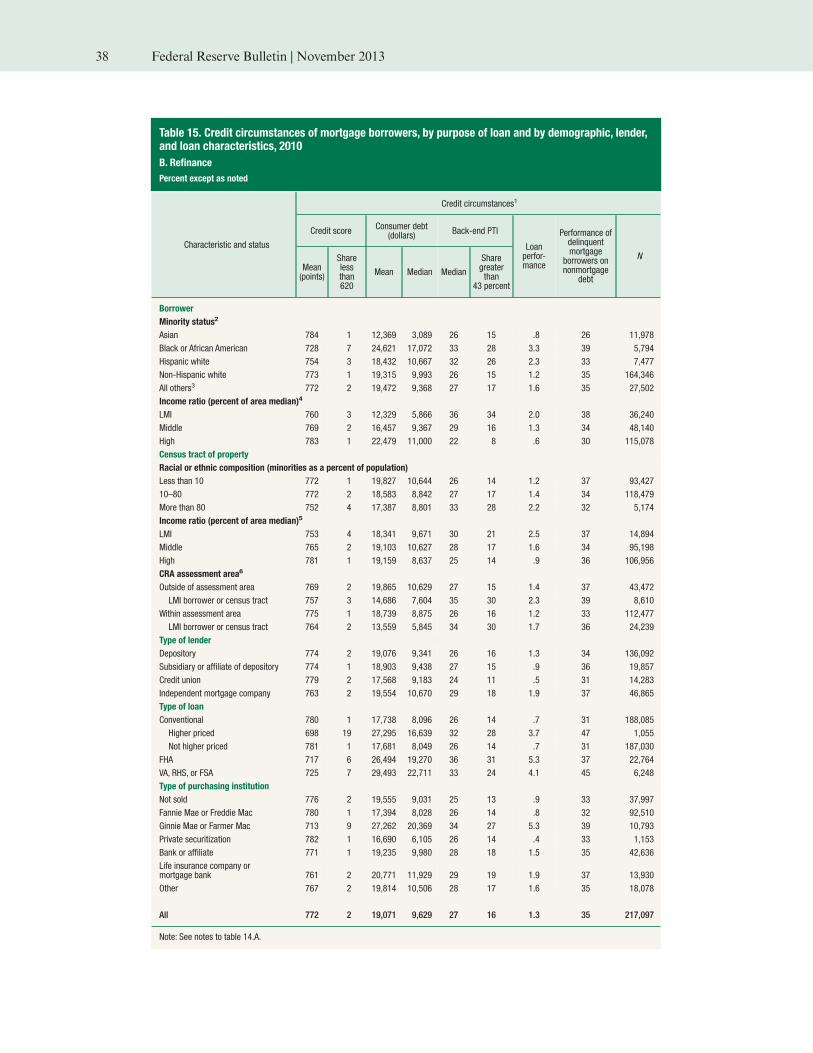
Table 15. Credit circumstances of mortgage borrowers, by purpose of loan and by demographic, lender,and loan characteristics, 2010
B. Refinance
Percent except as noted
Characteristic and status
Credit circumstances1
Credit scoreConsumer debt
(dollars)Back-end PTI
Loanperfor-mance
Performance ofdelinquentmortgage
borrowers onnonmortgage
debt
N
Mean(points)
Sharelessthan620
Mean Median Median
Sharegreaterthan
43 percent
Borrower
Minority status2
Asian 784 1 12,369 3,089 26 15 .8 26 11,978
Black or African American 728 7 24,621 17,072 33 28 3.3 39 5,794
Hispanic white 754 3 18,432 10,667 32 26 2.3 33 7,477
Non-Hispanic white 773 1 19,315 9,993 26 15 1.2 35 164,346
All others3 772 2 19,472 9,368 27 17 1.6 35 27,502
Income ratio (percent of area median)4
LMI 760 3 12,329 5,866 36 34 2.0 38 36,240
Middle 769 2 16,457 9,367 29 16 1.3 34 48,140
High 783 1 22,479 11,000 22 8 .6 30 115,078
Census tract of property
Racial or ethnic composition (minorities as a percent of population)
Less than 10 772 1 19,827 10,644 26 14 1.2 37 93,427
10–80 772 2 18,583 8,842 27 17 1.4 34 118,479
More than 80 752 4 17,387 8,801 33 28 2.2 32 5,174
Income ratio (percent of area median)5
LMI 753 4 18,341 9,671 30 21 2.5 37 14,894
Middle 765 2 19,103 10,627 28 17 1.6 34 95,198
High 781 1 19,159 8,637 25 14 .9 36 106,956
CRA assessment area6
Outside of assessment area 769 2 19,865 10,629 27 15 1.4 37 43,472
LMI borrower or census tract 757 3 14,686 7,604 35 30 2.3 39 8,610
Within assessment area 775 1 18,739 8,875 26 16 1.2 33 112,477
LMI borrower or census tract 764 2 13,559 5,845 34 30 1.7 36 24,239
Type of lender
Depository 774 2 19,076 9,341 26 16 1.3 34 136,092
Subsidiary or affiliate of depository 774 1 18,903 9,438 27 15 .9 36 19,857
Credit union 779 2 17,568 9,183 24 11 .5 31 14,283
Independent mortgage company 763 2 19,554 10,670 29 18 1.9 37 46,865
Type of loan
Conventional 780 1 17,738 8,096 26 14 .7 31 188,085
Higher priced 698 19 27,295 16,639 32 28 3.7 47 1,055
Not higher priced 781 1 17,681 8,049 26 14 .7 31 187,030
FHA 717 6 26,494 19,270 36 31 5.3 37 22,764
VA, RHS, or FSA 725 7 29,493 22,711 33 24 4.1 45 6,248
Type of purchasing institution
Not sold 776 2 19,555 9,031 25 13 .9 33 37,997
Fannie Mae or Freddie Mac 780 1 17,394 8,028 26 14 .8 32 92,510
Ginnie Mae or Farmer Mac 713 9 27,262 20,369 34 27 5.3 39 10,793
Private securitization 782 1 16,690 6,105 26 14 .4 33 1,153
Bank or affiliate 771 1 19,235 9,980 28 18 1.5 35 42,636
Life insurance company ormortgage bank 761 2 20,771 11,929 29 19 1.9 37 13,930
Other 767 2 19,814 10,506 28 17 1.6 35 18,078
All 772 2 19,071 9,629 27 16 1.3 35 217,097
Note: See notes to table 14.A.
38 Federal Reserve Bulletin | November 2013
From 2006 to 2010, average credit scores rose significantly across all categories of borrow-
ers, loans, and lenders. Overall, the average score rose from 701 to 728 for home-purchase
loans and from 682 to 772 for refinance loans. The increase in borrower credit scores may
reflect not only tightening in credit standards since 2006, but also changes in the demand
for mortgage credit. For example, demand among borrowers with lower scores may have
weakened more than that of borrowers with higher scores if lower-score borrowers were
more adversely affected by the recession. The relatively large increase in the scores of refi-
nance borrowers between 2006 and 2010 likely reflects, in part, a change in the composition
of borrowers seeking to refinance. Specifically, in 2006, when the interest rate environment
was relatively unfavorable, evidence suggests that those electing to refinance were doing so
primarily to extract equity, and the matched data indicate that such borrowers had rela-
tively low scores. In contrast, in 2010, the low-interest-rate environment appears to
have attracted a much larger share of the most creditworthy borrowers looking to refinance
simply to reduce their monthly payments.55
Other Debts and Payment Obligations
The merged data set allowed us to measure other debts owed, in addition to the mortgage
matched in the enhanced database. The second and third columns in tables 14 and 15 show
mean and median consumer debt balances reported in the CCP in the quarter prior to
origination of the mortgage. Consumer debt consists of all reported balances owed other
than those associated with mortgage debt, such as bank credit card and retail card bal-
ances, vehicle loans, student loans, and consumer installment loans. The next two columns
provide information on back-end PTI ratios, combining payments data on all types of debt
from the CCP and borrower income data from the HMDA information. The payments
data are based on what lenders and servicers report to Equifax, which typically reflects the
payment-due amount on monthly account statements. For mortgages, this amount may
include payments for property taxes and insurance, if collected by the servicer. We report
median PTI ratios as well as the share of borrowers with a PTI ratio exceeding 43 percent.
Under the Dodd-Frank Act as implemented by the CFPB, loans with a PTI ratio exceeding
43 percent could fall outside the definition of a qualified mortgage, and lenders making
such loans could face heightened legal risk in the event of borrower default.56
It is important to note that the PTI ratios we calculated are likely to understate the PTI
ratios used in underwriting for two main reasons. First, for joint mortgages, because we
matched the credit record information of only one (randomly selected) borrower, the con-
sumer debts and payments we calculated exclude individually held debts of other,
unmatched co-borrowers. Second, nondebt obligations, such as child-support or alimony
payments, may be included by underwriters in PTI calculations, but such obligations are
not available in credit record data and thus could not be included in our calculations.
Although the estimated PTI ratio understates true PTI ratios, over one-fourth of home-
purchase borrowers in 2006 exceeded the 43 percent threshold, as did about one-third of
refinance borrowers.57 In 2010, these numbers were lower, especially for refinance borrow-
55 According to Freddie Mac, nearly 90 percent of the 2006 refinance loans in its portfolio were estimated toinvolve taking cash out, compared with less than 30 percent in 2010. See Freddie Mac, Cash-out RefinanceReport (McLean, Va.: Freddie Mac), www.freddiemac.com/news/finance/refi_archives.htm.
56 Some loans, such as those eligible for FHA insurance, VA guarantees, or purchase by Fannie Mae or FreddieMac, would be exempt from the 43 percent PTI rule. See the final rule of the Consumer Financial ProtectionBureau on ability-to-repay standards under the Truth in Lending Act (Regulation Z), which is available at www.federalregister.gov/articles/2013/06/12/2013-13173/ability-to-repay-and-qualified-mortgage-standards-under-the-truth-in-lending-act-regulation-z.
57 The PTI statistics in tables 14 and 15 reflect nonmortgage payments just before mortgage origination plusmortgage payments just after origination, but we also examined total payments after origination to assess
Mortgage Market Conditions and Borrower Outcomes 39
ers, for whom the proportion was only about 16 percent. For home-purchase loans in 2010,
22 percent had PTI ratios above 43 percent, but about 70 percent of these loans were gov-
ernment backed (data derived from table 15.A), and such loans could still be qualified
mortgages despite exceeding the threshold under the current regulations. Within a given
year and loan purpose, black and Hispanic-white borrowers, LMI borrowers, and those
using FHA or VA loans tend to have the highest likelihoods of having PTI ratios in excess
of 43 percent.
First-Time Homebuyers
Using the CCP data, we can estimate the fraction of home-purchase loans to first-time
homebuyers as the share of home-purchase borrowers who have no record in the credit
bureau data of ever having a mortgage.58 In both 2006 and 2010, the incidence of first-time
homebuying was higher among minority and LMI groups, groups that tend to have lower
credit scores and higher PTI ratios. FHA and VA loans are more likely to be used by first-
time homebuyers than are conventional loans, although in 2006 conventional higher-priced
loans had a higher-than-average incidence of first-time homebuyers. Perhaps surprisingly,
the fraction of home-purchase loans to first-time homebuyers increased markedly from
2006 to 2010. The relative strength of first-time homebuying (home-purchase lending over-
all was very weak in 2010) may reflect several factors, including temporary federal tax
incentives for such activity available in 2010 and the possibility that many potential repeat
buyers were saddled with underwater properties hindering their mobility.59
Loan Performance
Credit record data allow users to construct an array of performance measures ranging from
payments made as scheduled or minor delinquencies (such as payments 30 days in arrears)
to metrics of more-serious payment problems (such as payments 120 or more days past due
or an account in collections or foreclosure). Here we focus on one widely used metric of
performance—the share of mortgage borrowers whose payments fell behind 60 days or
more at any point within two years of taking out their loan. In combination with the
HMDA data, differences in payment experiences can be explored across population and
neighborhood groups, types of loans, and types of lenders.
Varying payment performance across populations can reflect a range of factors, including
differences in employment circumstances after loan closing (for example, a reduction in
hours and earnings), changes in family circumstances (such as divorce or illness), and dif-
ferences in wealth that may be drawn on to make payments when unforeseen events arise.
Home price changes may also affect payment performance, as declines in home values may
alter borrower incentives to continue making scheduled payments, limit refinance opportu-
nities that may allow some borrowers to lower their monthly payments, or hinder the ability
to sell one’s home in the event of financial distress. In addition, payment performance may
depend on the features and pricing of the home loan itself. For example, loans of similar
amounts to similar borrowers that carry higher interest rates impose a higher monthly pay-
ment burden and may place the borrower at greater risk of default.
whether refinance loans were used to consolidate debts and reduce the total payment burden. On average, nosuch effect was found.
58 To the extent that home-purchase borrowers have owned a home in the past that was not financed by a report-able mortgage, our measure will overstate the true share of first-time homebuyers.
59 Home purchases through April 30, 2010, that were closed before September 30, 2010, may have been eligible forthe first-time homebuyer tax credit. See Internal Revenue Service, “First-Time Homebuyer Credit,” webpage,www.irs.gov/uac/First-Time-Homebuyer-Credit-1.
40 Federal Reserve Bulletin | November 2013
The matched data reveal significant differences in the payment performance of different
populations grouped by race or ethnicity, income, and neighborhood demographic charac-
teristics (see the “Loan performance” columns of tables 14 and 15). The data indicate that
black and Hispanic-white borrowers are more likely to fall behind on their payments than
other racial or ethnic groups. In addition, delinquency tends to be negatively correlated
with borrower and neighborhood income, although in 2006, the relationship with borrower
income was less pronounced. For example, in 2006, the difference in delinquency rates
between LMI- and high-income home-purchase borrowers was about 4 percentage points,
while the difference in delinquency rates between those in LMI- and high-income census
tracts was 11 percentage points. One factor that may be pushing up the default rate of
high-income borrowers is misreporting of income on loan applications (by borrowers or
loan officers) at the height of the housing boom, as indicated in previous research.60 In
other words, many borrowers classified as high income in 2006 may actually have had lower
incomes than stated on applications, and these borrowers may have had a relatively high
likelihood of default.
Conventional higher-priced loans posted the worst performance of any category listed in
table 14, at over three times the overall delinquency rate for home-purchase loans (31 per-
cent compared with 10 percent) and more than double the rate for refinance loans (26 per-
cent compared with 12 percent). This outcome may not be surprising given the credit scores
of borrowers in this category; 50 percent of home-purchase borrowers using higher-priced
loans had a score below 620. That said, we later show that the poor performance of higher-
priced loans cannot be explained entirely by credit scores. In other words, the fact that a
loan is higher priced may convey additional information about risk that is not captured by
scores alone.
The performance of loans originated in 2010 improved dramatically compared with those
originated in 2006. The two-year delinquency rate for home-purchase and refinance loans
originated in 2010 was just 3 percent and 1 percent, respectively. FHA and VA loans had
the highest delinquency rates across loan products; conventional loans (all types combined)
experienced delinquencies well below 1 percent, implying almost no risk-taking in the non-
government-backed mortgage market in the aftermath of the financial crisis.
Performance of Delinquent Mortgagors on Other Debt Obligations
As noted, the matched data provide an opportunity to review the performance of mortgage
borrowers on their other credit obligations. For this article, we focus on the share of indi-
viduals who were delinquent on their mortgage at any point during the two-year period
from origination and who were also late on their payments to at least one other debt obli-
gation as of the two-year anniversary of taking out their home loan. Evidence of delin-
quency on multiple accounts speaks to the severity of financial distress that may have led to
mortgage delinquency. For the 2006 cohort of delinquent mortgage borrowers, over half of
them were also delinquent on at least one nonmortgage debt obligation at the two-year
mark after opening their mortgage (however, some borrowers have no other accounts on
which to be delinquent; excluding such borrowers, the fraction of delinquent mortgagors
with a nonmortgage delinquency rises to nearly two-thirds). There is remarkably little
variation in performance across borrower, neighborhood, loan, or lender type. For the 2010
cohort, about half of the home-purchase borrowers were delinquent on at least one of their
other debt obligations, while, among those obtaining a refinance loan, the share was nota-
bly lower at 35 percent. The share of 2010 delinquent mortgage borrowers who were in
arrears on other credit obligations varies to some extent across groups. In particular,
60 See Avery and others, “The Mortgage Market in 2011,” in note 10.
Mortgage Market Conditions and Borrower Outcomes 41
Asians, higher-income borrowers, and borrowers who obtained their home loan from a
credit union or whose loan was purchased by Fannie Mae or Freddie Mac performed bet-
ter on their other debt obligations than other groups.
Borrower Characteristics, Loan Performance, and theCommunity Reinvestment Act
The Congress enacted the CRA to encourage federally insured banking institutions to help
meet the credit needs of their local communities in a manner consistent with safe and
sound lending practices. The CRA-related lending activities of banking institutions have
been closely scrutinized by regulators, researchers, and the general public, especially
recently as questions have been raised about the link between the CRA and the financial
crisis. In previous research, using HMDA data alone, we have shown that in the run-up to
the Great Recession, the share of all higher-priced loans originated by banking institutions
in their assessment areas—the geographic areas of focus in CRA enforcement exams—was
small.61 The matched HMDA–CCP data provide unique, complementary information on
the financial characteristics of borrowers and the performance of loans extended by bank-
ing institutions inside their assessment areas.
In both 2006 and 2010, average credit scores were somewhat higher for loans originated by
banking institutions (and their nondepository subsidiaries) for properties inside their
assessment areas compared with outside, and PTI ratios also tended to be lower for loans
on properties inside such areas than for those on properties outside them. Of course, the
CRA emphasizes lending to LMI populations within assessment areas, and similar patterns
hold for such loans. For example, in 2006, the average credit score for home-purchase loans
to LMI borrowers or neighborhoods inside CRA assessment areas was 21 points higher
than for loans to LMI borrowers outside such areas (696 versus 675). Further, the data also
indicate that the delinquency rate of loans extended to LMI borrowers originated in 2006
by banking institutions for properties outside their assessment areas was more than twice
the rate of loans originated for homes inside their assessment areas. For example, outside-
assessment-area home-purchase loans had a delinquency rate of 15 percent, compared with
just 7 percent for inside-assessment-area loans.
Further analysis (not shown) suggests that the difference in performance of loans inside
and outside of assessment areas seems to largely reflect the likelihood that the banking
organizations that tended to make loans outside of their assessment areas in 2006 also
tended to make riskier loans in general. In other words, the performance of inside- and out-
side-assessment-area loans within a given bank tends to be quite similar.
Finally, the delinquency rates for 2006 home-purchase and refinance loans that the CRA
promotes—those extended to LMI borrowers inside banks’ assessment areas—were signifi-
cantly lower than the 10 percent and 12 percent rates, respectively, for all home-purchase
and refinance loans originated in 2006. Moreover, CRA-targeted loans performed more
than four times better than higher-priced loans originated in 2006. The relatively low delin-
quency rate of loans encouraged by the CRA is inconsistent with the notion that the CRA
was a principal driver of the mortgage and financial crisis.
61 See Neil Bhutta and Glenn B. Canner (2009), “Did the CRA Cause the Mortgage Market Meltdown?” FederalReserve Bank of Minneapolis, Community Dividend (March), www.minneapolisfed.org/publications_papers/pub_display.cfm?id=4136.
42 Federal Reserve Bulletin | November 2013
Explaining Differences in Loan Performance across Groups
As discussed in the previous section, the matched data reveal substantial differences in loan
performance (delinquency rates) across borrowers grouped by their race and ethnicity. For
example, the delinquency rate for Asian homebuyers in 2006 was less than 6 percent,
compared with over 23 percent for black homebuyers (as shown in table 14.A). This section
explores the extent to which the racial and ethnic differences in performance can be
explained by factors such as credit scores, house price declines, and mortgage pricing
(under the assumption that price reflects risk).62 We compare performance across popula-
tion groups within 12 relatively narrow categories defined by higher-priced loan status,
credit score range at origination (under 620, 620–719, and 720 or over), and geography
(whether or not properties were located in “housing bust” counties, where house
prices declined most sharply).63 The analysis also distinguishes between home-purchase
and refinance loans.
Focusing first on home-purchase loans in figure 2.A, we find that the three variables used
to define the 12 categories appear to be highly correlated with loan performance. In each
panel, performance improves dramatically as credit scores rise, conditional on race and eth-
nicity. In addition, performance in housing-bust counties consistently lags that in other
counties, conditional on score, price, and race or ethnicity. Finally, for any given score, geo-
graphic, and racial or ethnic group, the performance of borrowers with non-higher-priced
loans exceeds that of borrowers with higher-priced loans. This finding suggests that price
helps capture information about risk not observed in the matched data, such as down-pay-
ment size or an indication of whether income and assets were fully documented during the
application process. It has also been hypothesized that some lenders extended loans with
higher prices that were not justified on the basis of risk, and that the higher payment bur-
den eventually led to default.
Across racial and ethnic groups, notable differences in performance were found even within
each narrow category. For example, Hispanic white borrowers tended to post higher delin-
quency rates than other groups within each score-by-price category in the housing-bust
counties. In addition, black borrowers with credit scores below 620 in non-housing-bust
counties experienced higher delinquency rates than borrowers in other racial and ethnic
groups. Further research is needed to better understand why differences in loan payment
performance persist after accounting for score, location, and higher-priced status of the
loan. These differences may be due in part to minorities being treated differently in the
marketplace, which has been raised by many as a serious concern, and several legal actions
have alleged discriminatory behavior on the part of lenders during the boom. At the same
time, it is important to keep in mind that the matched data used here exclude some key
variables that might be correlated with both loan performance and minority status, such as
available financial resources and post-origination employment experiences.64
62 For an in-depth analysis, using similar data, of factors affecting mortgage default across racial and ethnicgroups, see Patrick Bayer, Fernando Ferreira, and Stephen L. Ross (2013), “The Vulnerability of MinorityHomeowners in the Housing Boom and Bust,” NBERWorking Paper Series 19020 (Cambridge, Mass.:National Bureau of Economic Research, May).
63 Housing-bust counties are defined as the 25 percent of counties with the steepest house price declines fromDecember 2006 to December 2008 according to data from CoreLogic. The CoreLogic data cover the vastmajority of MSA counties. Those loans for properties in areas not covered by CoreLogic (under 3 percent ofloans) were included in the set of “other counties.” Housing-bust counties consist largely of counties in Ari-zona, California, Florida, and Nevada, as well as a number of counties in Maryland, Michigan, and Minne-sota. See appendix figure C.1 for a map of housing-bust counties.
64 When we account more precisely for location, loan pricing, and credit score in a multivariate regression, we findsizable and statistically significant differences in loan performance for blacks and Hispanic whites relative tonon-Hispanic whites. In future work, we will explore the effect of other factors that may bear on loan perfor-mance.
Mortgage Market Conditions and Borrower Outcomes 43
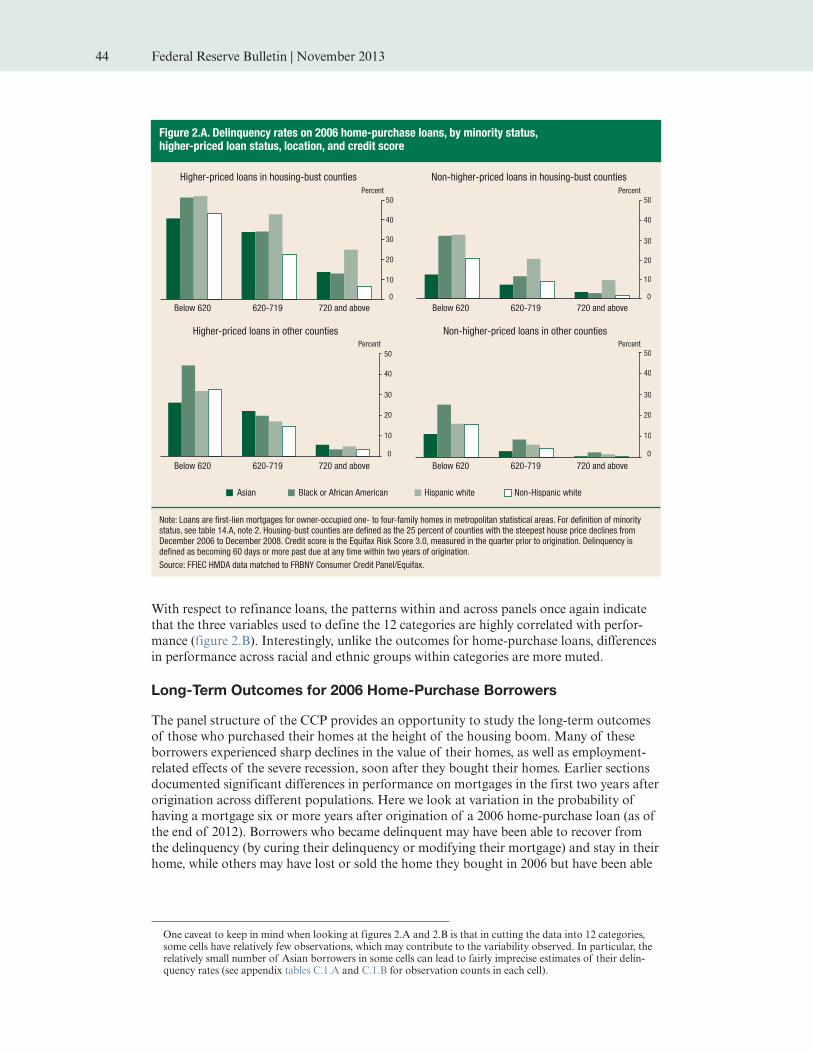
With respect to refinance loans, the patterns within and across panels once again indicate
that the three variables used to define the 12 categories are highly correlated with perfor-
mance (figure 2.B). Interestingly, unlike the outcomes for home-purchase loans, differences
in performance across racial and ethnic groups within categories are more muted.
Long-Term Outcomes for 2006 Home-Purchase Borrowers
The panel structure of the CCP provides an opportunity to study the long-term outcomes
of those who purchased their homes at the height of the housing boom. Many of these
borrowers experienced sharp declines in the value of their homes, as well as employment-
related effects of the severe recession, soon after they bought their homes. Earlier sections
documented significant differences in performance on mortgages in the first two years after
origination across different populations. Here we look at variation in the probability of
having a mortgage six or more years after origination of a 2006 home-purchase loan (as of
the end of 2012). Borrowers who became delinquent may have been able to recover from
the delinquency (by curing their delinquency or modifying their mortgage) and stay in their
home, while others may have lost or sold the home they bought in 2006 but have been able
One caveat to keep in mind when looking at figures 2.A and 2.B is that in cutting the data into 12 categories,some cells have relatively few observations, which may contribute to the variability observed. In particular, therelatively small number of Asian borrowers in some cells can lead to fairly imprecise estimates of their delin-quency rates (see appendix tables C.1.A and C.1.B for observation counts in each cell).
Figure 2.A. Delinquency rates on 2006 home-purchase loans, by minority status,higher-priced loan status, location, and credit score
Asian Black or African American Hispanic white Non-Hispanic white
Percent Percent
PercentPercent
50
40
30
20
10
0
50
40
30
20
10
0
50
40
30
20
10
0
50
40
30
20
10
0
Higher-priced loans in housing-bust counties Non-higher-priced loans in housing-bust counties
Higher-priced loans in other counties Non-higher-priced loans in other counties
Below 620 620-719 720 and above Below 620 620-719 720 and above
Below 620 620-719 720 and above Below 620 620-719 720 and above
Note: Loans are first-lien mortgages for owner-occupied one- to four-family homes in metropolitan statistical areas. For definition of minoritystatus, see table 14.A, note 2. Housing-bust counties are defined as the 25 percent of counties with the steepest house price declines fromDecember 2006 to December 2008. Credit score is the Equifax Risk Score 3.0, measured in the quarter prior to origination. Delinquency isdefined as becoming 60 days or more past due at any time within two years of origination.
Source: FFIEC HMDA data matched to FRBNY Consumer Credit Panel/Equifax.
44 Federal Reserve Bulletin | November 2013
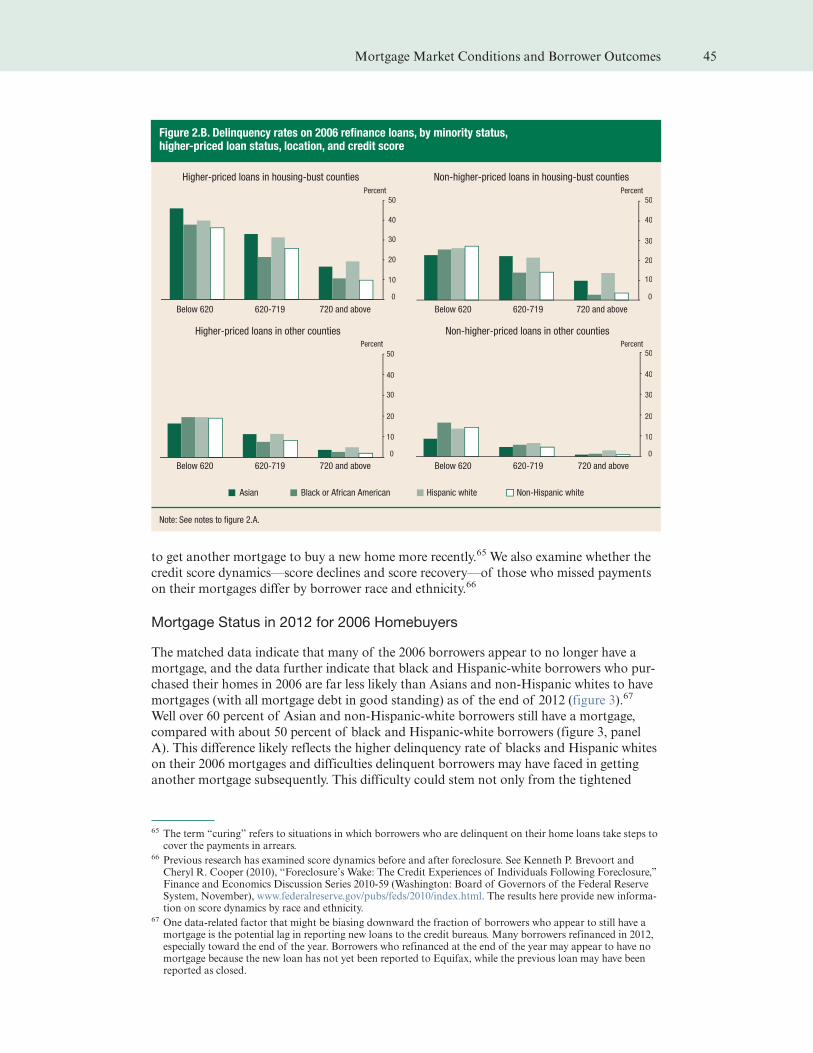
to get another mortgage to buy a new home more recently.65 We also examine whether the
credit score dynamics—score declines and score recovery—of those who missed payments
on their mortgages differ by borrower race and ethnicity.66
Mortgage Status in 2012 for 2006 Homebuyers
The matched data indicate that many of the 2006 borrowers appear to no longer have a
mortgage, and the data further indicate that black and Hispanic-white borrowers who pur-
chased their homes in 2006 are far less likely than Asians and non-Hispanic whites to have
mortgages (with all mortgage debt in good standing) as of the end of 2012 (figure 3).67
Well over 60 percent of Asian and non-Hispanic-white borrowers still have a mortgage,
compared with about 50 percent of black and Hispanic-white borrowers (figure 3, panel
A). This difference likely reflects the higher delinquency rate of blacks and Hispanic whites
on their 2006 mortgages and difficulties delinquent borrowers may have faced in getting
another mortgage subsequently. This difficulty could stem not only from the tightened
65 The term “curing” refers to situations in which borrowers who are delinquent on their home loans take steps tocover the payments in arrears.
66 Previous research has examined score dynamics before and after foreclosure. See Kenneth P. Brevoort andCheryl R. Cooper (2010), “Foreclosure’s Wake: The Credit Experiences of Individuals Following Foreclosure,”Finance and Economics Discussion Series 2010-59 (Washington: Board of Governors of the Federal ReserveSystem, November), www.federalreserve.gov/pubs/feds/2010/index.html. The results here provide new informa-tion on score dynamics by race and ethnicity.
67 One data-related factor that might be biasing downward the fraction of borrowers who appear to still have amortgage is the potential lag in reporting new loans to the credit bureaus. Many borrowers refinanced in 2012,especially toward the end of the year. Borrowers who refinanced at the end of the year may appear to have nomortgage because the new loan has not yet been reported to Equifax, while the previous loan may have beenreported as closed.
Figure 2.B. Delinquency rates on 2006 refinance loans, by minority status,higher-priced loan status, location, and credit score
Asian Black or African American Hispanic white Non-Hispanic white
Percent Percent
PercentPercent
50
40
30
20
10
0
50
40
30
20
10
0
50
40
30
20
10
0
50
40
30
20
10
0
Higher-priced loans in housing-bust counties Non-higher-priced loans in housing-bust counties
Higher-priced loans in other counties Non-higher-priced loans in other counties
Below 620 620-719 720 and above Below 620 620-719 720 and above
Below 620 620-719 720 and above Below 620 620-719 720 and above
Note: See notes to figure 2.A.
Mortgage Market Conditions and Borrower Outcomes 45
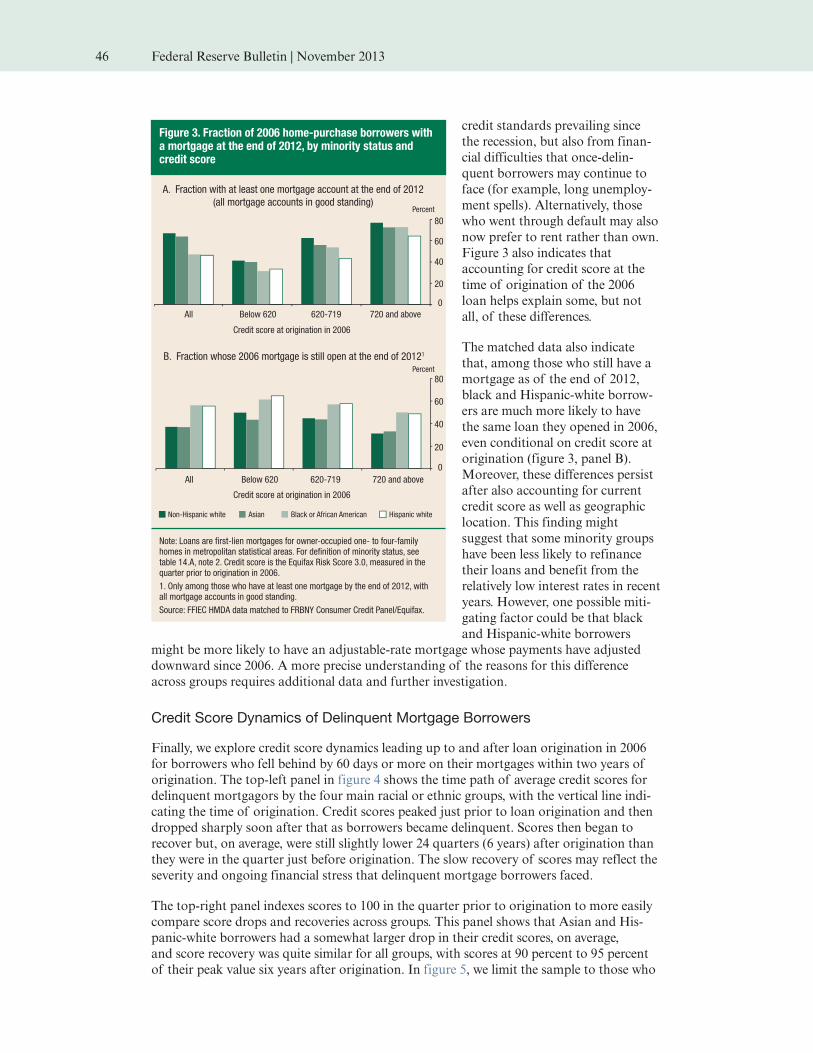
credit standards prevailing since
the recession, but also from finan-
cial difficulties that once-delin-
quent borrowers may continue to
face (for example, long unemploy-
ment spells). Alternatively, those
who went through default may also
now prefer to rent rather than own.
Figure 3 also indicates that
accounting for credit score at the
time of origination of the 2006
loan helps explain some, but not
all, of these differences.
The matched data also indicate
that, among those who still have a
mortgage as of the end of 2012,
black and Hispanic-white borrow-
ers are much more likely to have
the same loan they opened in 2006,
even conditional on credit score at
origination (figure 3, panel B).
Moreover, these differences persist
after also accounting for current
credit score as well as geographic
location. This finding might
suggest that some minority groups
have been less likely to refinance
their loans and benefit from the
relatively low interest rates in recent
years. However, one possible miti-
gating factor could be that black
and Hispanic-white borrowers
might be more likely to have an adjustable-rate mortgage whose payments have adjusted
downward since 2006. A more precise understanding of the reasons for this difference
across groups requires additional data and further investigation.
Credit Score Dynamics of Delinquent Mortgage Borrowers
Finally, we explore credit score dynamics leading up to and after loan origination in 2006
for borrowers who fell behind by 60 days or more on their mortgages within two years of
origination. The top-left panel in figure 4 shows the time path of average credit scores for
delinquent mortgagors by the four main racial or ethnic groups, with the vertical line indi-
cating the time of origination. Credit scores peaked just prior to loan origination and then
dropped sharply soon after that as borrowers became delinquent. Scores then began to
recover but, on average, were still slightly lower 24 quarters (6 years) after origination than
they were in the quarter just before origination. The slow recovery of scores may reflect the
severity and ongoing financial stress that delinquent mortgage borrowers faced.
The top-right panel indexes scores to 100 in the quarter prior to origination to more easily
compare score drops and recoveries across groups. This panel shows that Asian and His-
panic-white borrowers had a somewhat larger drop in their credit scores, on average,
and score recovery was quite similar for all groups, with scores at 90 percent to 95 percent
of their peak value six years after origination. In figure 5, we limit the sample to those who
Figure 3. Fraction of 2006 home-purchase borrowers witha mortgage at the end of 2012, by minority status andcredit score
A. Fraction with at least one mortgage account at the end of 2012
(all mortgage accounts in good standing)
B. Fraction whose 2006 mortgage is still open at the end of 20121
Percent
Percent
Credit score at origination in 2006
Credit score at origination in 2006
80
60
40
20
0
80
60
40
20
0
All Below 620 620-719 720 and above
All Below 620 620-719 720 and above
Non-Hispanic white Asian Black or African American Hispanic white
Note: Loans are first-lien mortgages for owner-occupied one- to four-familyhomes in metropolitan statistical areas. For definition of minority status, seetable 14.A, note 2. Credit score is the Equifax Risk Score 3.0, measured in thequarter prior to origination in 2006.
1. Only among those who have at least one mortgage by the end of 2012, withall mortgage accounts in good standing.
Source: FFIEC HMDA data matched to FRBNY Consumer Credit Panel/Equifax.
46 Federal Reserve Bulletin | November 2013
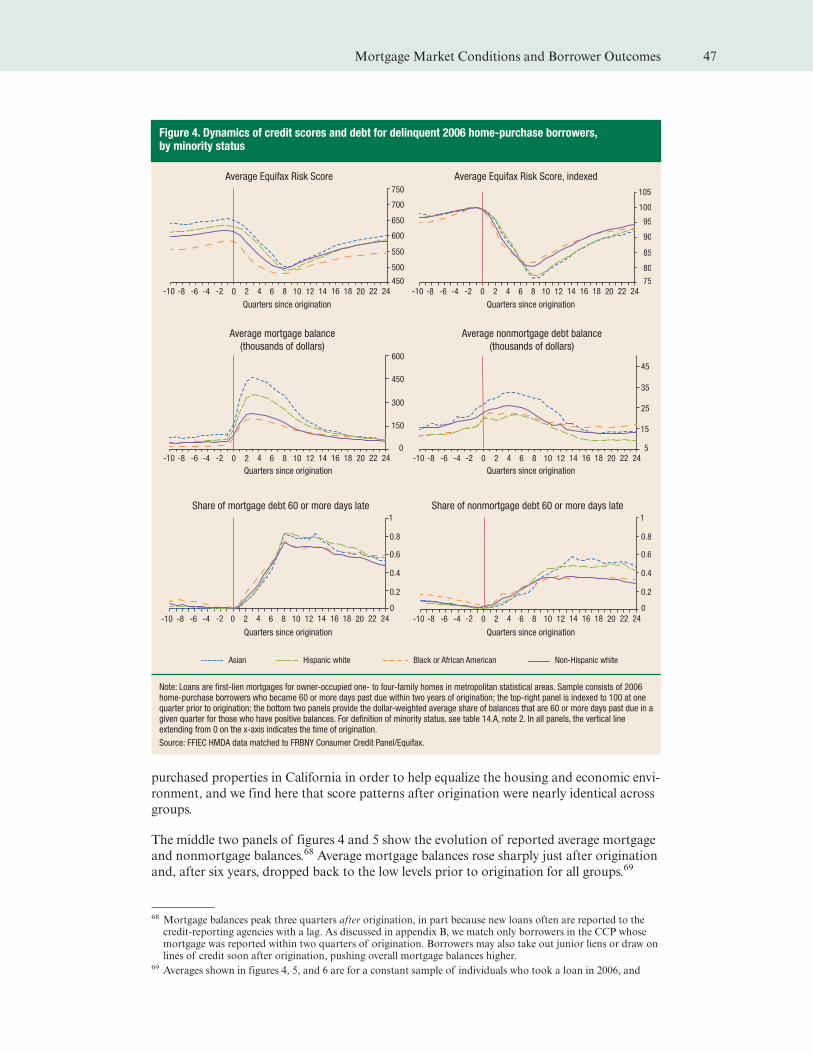
purchased properties in California in order to help equalize the housing and economic envi-
ronment, and we find here that score patterns after origination were nearly identical across
groups.
The middle two panels of figures 4 and 5 show the evolution of reported average mortgage
and nonmortgage balances.68 Average mortgage balances rose sharply just after origination
and, after six years, dropped back to the low levels prior to origination for all groups.69
68 Mortgage balances peak three quarters after origination, in part because new loans often are reported to thecredit-reporting agencies with a lag. As discussed in appendix B, we match only borrowers in the CCP whosemortgage was reported within two quarters of origination. Borrowers may also take out junior liens or draw onlines of credit soon after origination, pushing overall mortgage balances higher.
69 Averages shown in figures 4, 5, and 6 are for a constant sample of individuals who took a loan in 2006, and
Figure 4. Dynamics of credit scores and debt for delinquent 2006 home-purchase borrowers,by minority status
Average Equifax Risk Score Average Equifax Risk Score, indexed
Quarters since origination Quarters since origination
Quarters since origination Quarters since origination
Quarters since origination Quarters since origination
Average mortgage balance
(thousands of dollars)
Average nonmortgage debt balance
(thousands of dollars)
Share of mortgage debt 60 or more days late Share of nonmortgage debt 60 or more days late
Asian Hispanic white Black or African American Non-Hispanic white
105
100
95
90
85
80
75
45
35
25
15
5
1
0.8
0.6
0.4
0.2
0
1
0.8
0.6
0.4
0.2
0
-10 -8 -6 -4 -2 0 2 4 6 8 10 12 14 16 18 20 22 24-10 -8 -6 -4 -2 0 2 4 6 8 10 12 14 16 18 20 22 24
-10 -8 -6 -4 -2 0 2 4 6 8 10 12 14 16 18 20 22 24 -10 -8 -6 -4 -2 0 2 4 6 8 10 12 14 16 18 20 22 24
-10 -8 -6 -4 -2 0 2 4 6 8 10 12 14 16 18 20 22 24-10 -8 -6 -4 -2 0 2 4 6 8 10 12 14 16 18 20 22 24
750
700
650
600
550
500
450
600
450
300
150
0
Note: Loans are first-lien mortgages for owner-occupied one- to four-family homes in metropolitan statistical areas. Sample consists of 2006home-purchase borrowers who became 60 or more days past due within two years of origination; the top-right panel is indexed to 100 at onequarter prior to origination; the bottom two panels provide the dollar-weighted average share of balances that are 60 or more days past due in agiven quarter for those who have positive balances. For definition of minority status, see table 14.A, note 2. In all panels, the vertical lineextending from 0 on the x-axis indicates the time of origination.
Source: FFIEC HMDA data matched to FRBNY Consumer Credit Panel/Equifax.
Mortgage Market Conditions and Borrower Outcomes 47
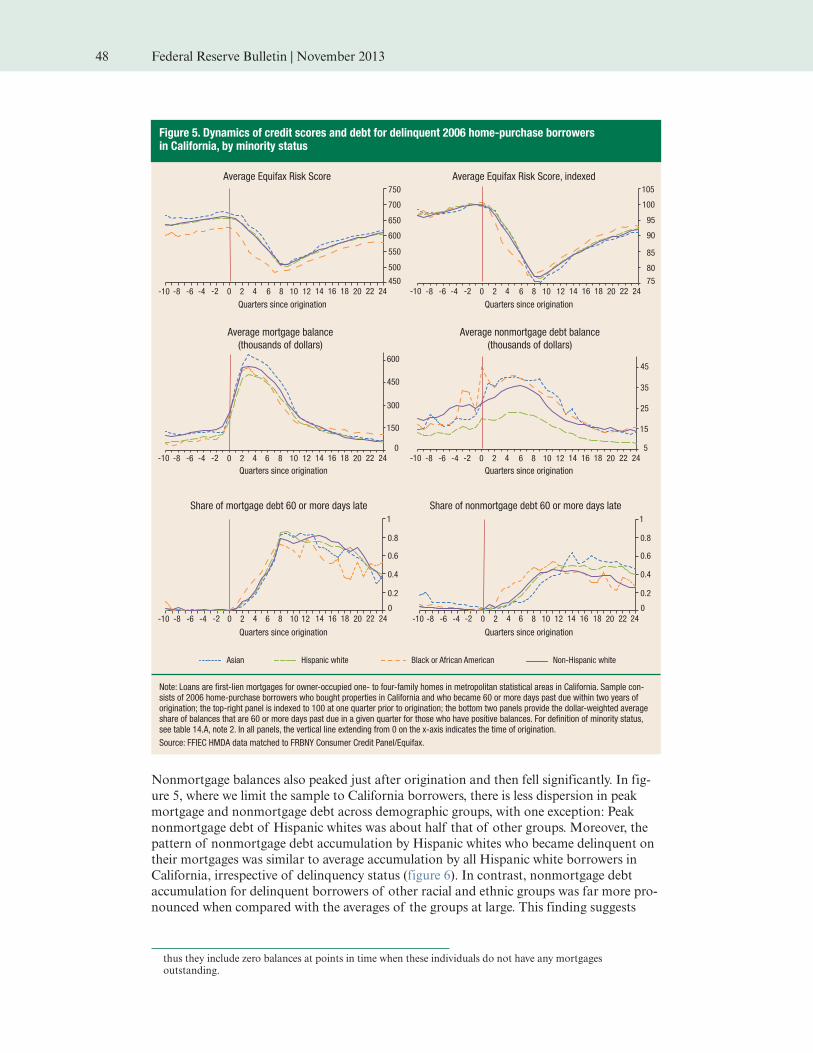
Nonmortgage balances also peaked just after origination and then fell significantly. In fig-
ure 5, where we limit the sample to California borrowers, there is less dispersion in peak
mortgage and nonmortgage debt across demographic groups, with one exception: Peak
nonmortgage debt of Hispanic whites was about half that of other groups. Moreover, the
pattern of nonmortgage debt accumulation by Hispanic whites who became delinquent on
their mortgages was similar to average accumulation by all Hispanic white borrowers in
California, irrespective of delinquency status (figure 6). In contrast, nonmortgage debt
accumulation for delinquent borrowers of other racial and ethnic groups was far more pro-
nounced when compared with the averages of the groups at large. This finding suggests
thus they include zero balances at points in time when these individuals do not have any mortgagesoutstanding.
Figure 5. Dynamics of credit scores and debt for delinquent 2006 home-purchase borrowersin California, by minority status
Average Equifax Risk Score Average Equifax Risk Score, indexed
Quarters since origination Quarters since origination
Quarters since origination Quarters since origination
Quarters since origination Quarters since origination
Average mortgage balance
(thousands of dollars)
Average nonmortgage debt balance
(thousands of dollars)
Share of mortgage debt 60 or more days late Share of nonmortgage debt 60 or more days late
Asian Hispanic white Black or African American Non-Hispanic white
105
100
95
90
85
80
75
45
35
25
15
5
1
0.8
0.6
0.4
0.2
0
1
0.8
0.6
0.4
0.2
0
-10 -8 -6 -4 -2 0 2 4 6 8 10 12 14 16 18 20 22 24-10 -8 -6 -4 -2 0 2 4 6 8 10 12 14 16 18 20 22 24
-10 -8 -6 -4 -2 0 2 4 6 8 10 12 14 16 18 20 22 24 -10 -8 -6 -4 -2 0 2 4 6 8 10 12 14 16 18 20 22 24
-10 -8 -6 -4 -2 0 2 4 6 8 10 12 14 16 18 20 22 24-10 -8 -6 -4 -2 0 2 4 6 8 10 12 14 16 18 20 22 24
750
700
650
600
550
500
450
600
450
300
150
0
Note: Loans are first-lien mortgages for owner-occupied one- to four-family homes in metropolitan statistical areas in California. Sample con-sists of 2006 home-purchase borrowers who bought properties in California and who became 60 or more days past due within two years oforigination; the top-right panel is indexed to 100 at one quarter prior to origination; the bottom two panels provide the dollar-weighted averageshare of balances that are 60 or more days past due in a given quarter for those who have positive balances. For definition of minority status,see table 14.A, note 2. In all panels, the vertical line extending from 0 on the x-axis indicates the time of origination.
Source: FFIEC HMDA data matched to FRBNY Consumer Credit Panel/Equifax.
48 Federal Reserve Bulletin | November 2013
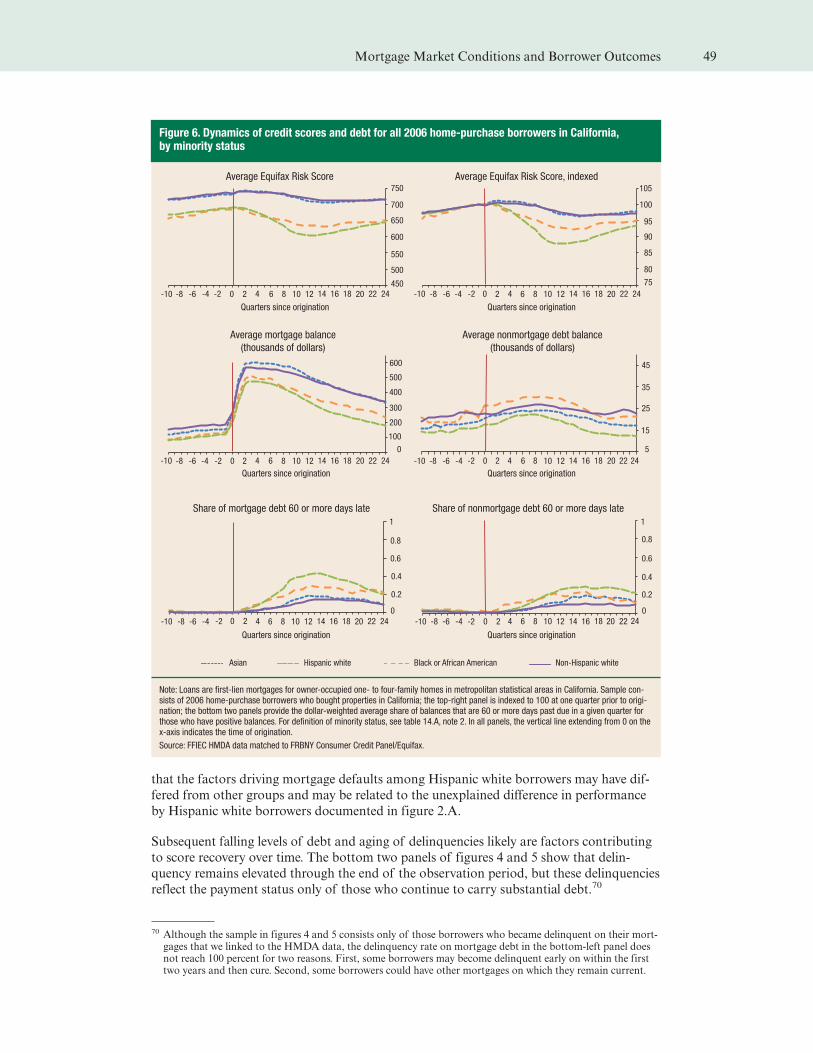
that the factors driving mortgage defaults among Hispanic white borrowers may have dif-
fered from other groups and may be related to the unexplained difference in performance
by Hispanic white borrowers documented in figure 2.A.
Subsequent falling levels of debt and aging of delinquencies likely are factors contributing
to score recovery over time. The bottom two panels of figures 4 and 5 show that delin-
quency remains elevated through the end of the observation period, but these delinquencies
reflect the payment status only of those who continue to carry substantial debt.70
70 Although the sample in figures 4 and 5 consists only of those borrowers who became delinquent on their mort-gages that we linked to the HMDA data, the delinquency rate on mortgage debt in the bottom-left panel doesnot reach 100 percent for two reasons. First, some borrowers may become delinquent early on within the firsttwo years and then cure. Second, some borrowers could have other mortgages on which they remain current.
Figure 6. Dynamics of credit scores and debt for all 2006 home-purchase borrowers in California,by minority status
Average Equifax Risk Score Average Equifax Risk Score, indexed
Quarters since origination Quarters since origination
Quarters since origination Quarters since origination
Quarters since origination Quarters since origination
Average mortgage balance
(thousands of dollars)
Average nonmortgage debt balance
(thousands of dollars)
Share of mortgage debt 60 or more days late Share of nonmortgage debt 60 or more days late
Asian Hispanic white Black or African American Non-Hispanic white
105
100
95
90
85
80
75
45
35
25
15
5
1
0.8
0.6
0.4
0.2
0
1
0.8
0.6
0.4
0.2
0
-10 -8 -6 -4 -2 0 2 4 6 8 10 12 14 16 18 20 22 24-10 -8 -6 -4 -2 0 2 4 6 8 10 12 14 16 18 20 22 24
-10 -8 -6 -4 -2 0 2 4 6 8 10 12 14 16 18 20 22 24 -10 -8 -6 -4 -2 0 2 4 6 8 10 12 14 16 18 20 22 24
-10 -8 -6 -4 -2 0 2 4 6 8 10 12 14 16 18 20 22 24-10 -8 -6 -4 -2 0 2 4 6 8 10 12 14 16 18 20 22 24
750
700
650
600
550
500
450
600
400
500
300
200
100
0
Note: Loans are first-lien mortgages for owner-occupied one- to four-family homes in metropolitan statistical areas in California. Sample con-sists of 2006 home-purchase borrowers who bought properties in California; the top-right panel is indexed to 100 at one quarter prior to origi-nation; the bottom two panels provide the dollar-weighted average share of balances that are 60 or more days past due in a given quarter forthose who have positive balances. For definition of minority status, see table 14.A, note 2. In all panels, the vertical line extending from 0 on thex-axis indicates the time of origination.
Source: FFIEC HMDA data matched to FRBNY Consumer Credit Panel/Equifax.
Mortgage Market Conditions and Borrower Outcomes 49

Future Analysis
As our initial analysis of the matched HMDA–CCP data indicate, these data offer an
opportunity to investigate a wide range of issues related to home lending. Although the
matched data do not include all factors that researchers seek when investigating consumers’
borrowing experiences, merging the credit records with the HMDA data provides a signifi-
cant step forward in this regard and will serve as the basis for future research.
50 Federal Reserve Bulletin | November 2013
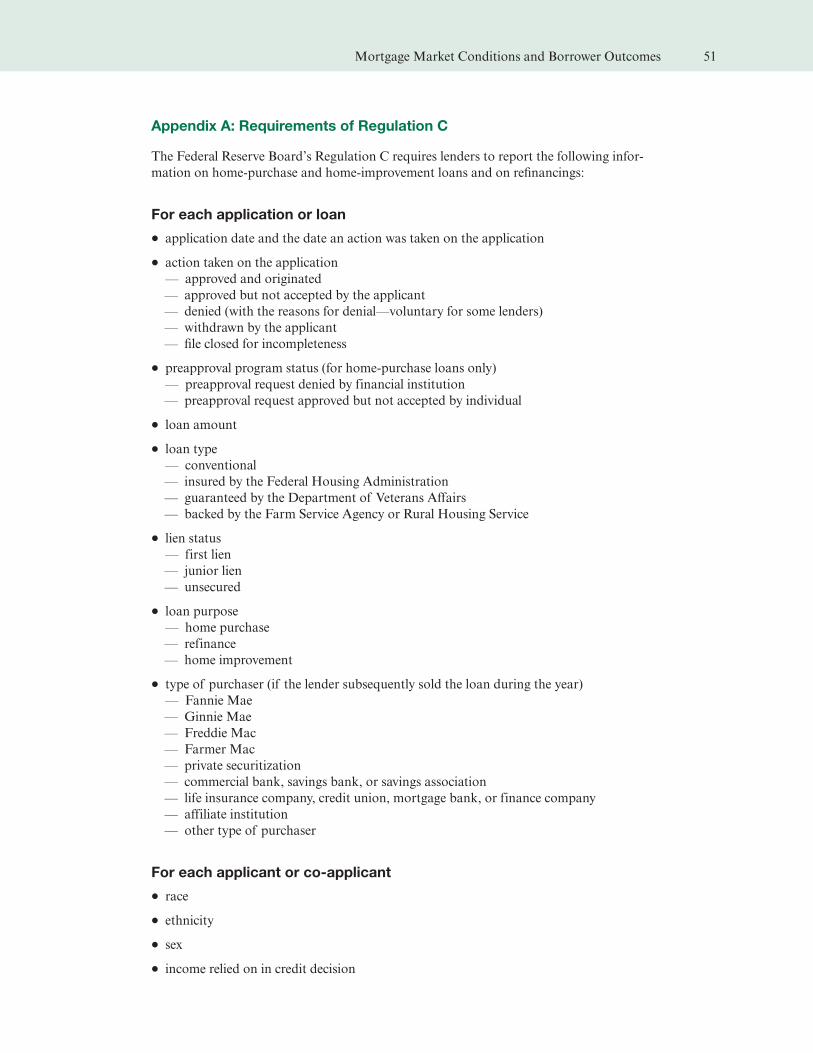
Appendix A: Requirements of Regulation C
The Federal Reserve Board’s Regulation C requires lenders to report the following infor-
mation on home-purchase and home-improvement loans and on re�nancings:
For each application or loan
‰ application date and the date an action was taken on the application
‰ action taken on the application
— approved and originated
— approved but not accepted by the applicant
— denied (with the reasons for denial—voluntary for some lenders)
— withdrawn by the applicant
— �le closed for incompleteness
‰ preapproval program status (for home-purchase loans only)
— preapproval request denied by financial institution
— preapproval request approved but not accepted by individual
‰ loan amount
‰ loan type
— conventional
— insured by the Federal Housing Administration
— guaranteed by the Department of Veterans Affairs
— backed by the Farm Service Agency or Rural Housing Service
‰ lien status
— first lien
— junior lien
— unsecured
‰ loan purpose
— home purchase
— refinance
— home improvement
‰ type of purchaser (if the lender subsequently sold the loan during the year)
— Fannie Mae
— Ginnie Mae
— Freddie Mac
— Farmer Mac
— private securitization
— commercial bank, savings bank, or savings association
— life insurance company, credit union, mortgage bank, or finance company
— affiliate institution
— other type of purchaser
For each applicant or co-applicant
‰ race
‰ ethnicity
‰ sex
‰ income relied on in credit decision
Mortgage Market Conditions and Borrower Outcomes 51

For each property
‰ location, by state, county, metropolitan statistical area, and census tract
‰ type of structure
— one- to four-family dwelling
— manufactured home
— multifamily property (dwelling with �ve or more units)
‰ occupancy status (owner occupied, non-owner occupied, or not applicable)
For loans subject to price reporting
‰ spread above comparable Treasury security for applications taken prior to October 1, 2010
‰ spread above average prime offer rate for applications taken on or after October 1, 2010
For loans subject to the Home Ownership and Equity Protection Act
‰ indicator of whether loan is subject to the Home Ownership and Equity Protection Act
52 Federal Reserve Bulletin | November 2013
Appendix B: Matching HMDA Records with Credit Bureau Records
For this article, we created a new data set that connects borrowers included in the HMDA
loan records—that is, those reported under the Home Mortgage Disclosure Act of
1975—to their credit bureau information from Equifax, one of the three major consumer
credit-reporting agencies in the United States. Specifically, the credit records available to us
for matching come from the Federal Reserve Bank of New York Consumer Credit Panel/
Equifax (CCP) data.71 The CCP is a 5 percent, nationally representative sample of all indi-
viduals with a credit record and a valid Social Security number. Furthermore, the CCP data
are a quarterly panel, tracking the same individuals over time. The sampling approach is
designed to generate the same entry and exit behavior as is present in the population, with
young individuals and immigrants entering the sample and deceased individuals and emi-
grants leaving the sample each quarter at the same rate as in the U.S. population, such that
each quarterly snapshot is nationally representative.
Neither the HMDA data nor the credit record data include personal identifying informa-
tion, but borrowers in the two data sets can be matched based on the mortgage loan infor-
mation common to both data sets—specifically, loan amount, month of loan origination,
and census-tract location. Because we have access to the confidential version of the HMDA
data, we observe origination dates, while the CCP contains detailed trade-line information
on each open mortgage account a consumer has in any given quarter, including the loan
amount and month opened.72 The CCP also provides the census-tract locations of con-
sumers’ reported mailing addresses each quarter. In contrast, the HMDA records provide
the census-tract location of the property securing the mortgage. For this reason, we
attempted to match only borrowers in the HMDA records who obtained loans for owner-
occupied properties—where mailing and property locations are likely to coincide.
In order to match a given year of HMDA records to the credit records, we started with all
first-lien HMDA home-purchase and refinance originations that were for one- to four-fam-
ily owner-occupied properties in metropolitan statistical areas (MSAs). We limited the data
to MSAs because the HMDA data are more fully representative of lending in such areas.73
We also excluded from the HMDA data, prior to matching, the roughly 15 percent of loans
that are not unique in terms of location, origination month, and loan amount. In the CCP
data, we identified all individuals whose most recent closed-end mortgage loan was opened
two quarters ago, as new loans tend to be reported to credit bureaus with a lag. Thus, con-
sumers in the CCP who have a record, as of the third quarter of 2006, of opening a mort-
gage in the first quarter of 2006 would be eligible to be matched to the HMDA records
from the first quarter of 2006; those who have a record, as of the fourth quarter of 2006, of
opening a mortgage in the second quarter of 2006 would be eligible to be matched to the
HMDA records from the second quarter of 2006; and so on. Once we connected a HMDA
record to an individual in the CCP, we could track that individual in the CCP over time.
Because the credit record data are only a 5 percent sample of the full population, only a
fraction of HMDA loan records will be represented in the CCP. Of the HMDA loans eli-
gible to be matched in 2006 and 2010, 4.4 percent were matched, implying a match rate of
about 60 percent. To see this result, first note that about 13.7 million HMDA records were
eligible for matching in the two years (including the roughly 15 percent of non-unique
records). Of these records, 48 percent had co-borrowers, and such loans have twice the
probability (or more, if there are more than two borrowers) of showing up in the CCP as
71 For further details, see note 49 of the main text.72 The term “trade lines” refers to the records of credit accounts that are reflected in credit record files.73 See Robert B. Avery, Kenneth P. Brevoort, and Glenn B. Canner (2007), “Opportunities and Issues in Using
HMDA Data,” Journal of Real Estate Research, vol. 29 (October–December), pp. 351–79.
Mortgage Market Conditions and Borrower Outcomes 53
individual mortgages, since sampling for the CCP is done at the individual level. Thus, the
maximum number of matches we could expect (assuming that all lenders report mortgages
to Equifax) is about 1 million (13.7 million x 0.05 x 1.48). We actually obtained
600,118 matches, or about 60 percent of the maximum possible.
Several factors contributed to the implied match rate being below 100 percent. First, as
noted, about 15 percent of HMDA records were not unique and thus could not be
matched. Second, we used only those mortgages in the CCP that were reported at two
quarters after origination; some mortgages may have been reported after three quarters or
more, and these mortgages were not matched. And, third, although we used only loans
related to owner-occupied properties, property location (from the HMDA data) and mail-
ing location (from the CCP) do not always coincide. For example, some homebuyers use a
post office box that is located in a different census tract than their home.
Our main concern with the matched sample is whether it accurately represents the pool of
mortgage originations. So long as nonmatches occur mostly for random reasons, the
60 percent match rate should not pose a problem. Table B.1 compares summary statistics
from the full 2006 and 2010 HMDA data with the matched samples. In general, the statis-
tics line up quite closely, somewhat more so in 2010 than in 2006. Overall, the matched data
are likely to provide a good representation of first-lien, owner-occupant, one- to four-fam-
ily home-purchase and refinance lending in U.S. metropolitan areas during 2006 and 2010.
54 Federal Reserve Bulletin | November 2013
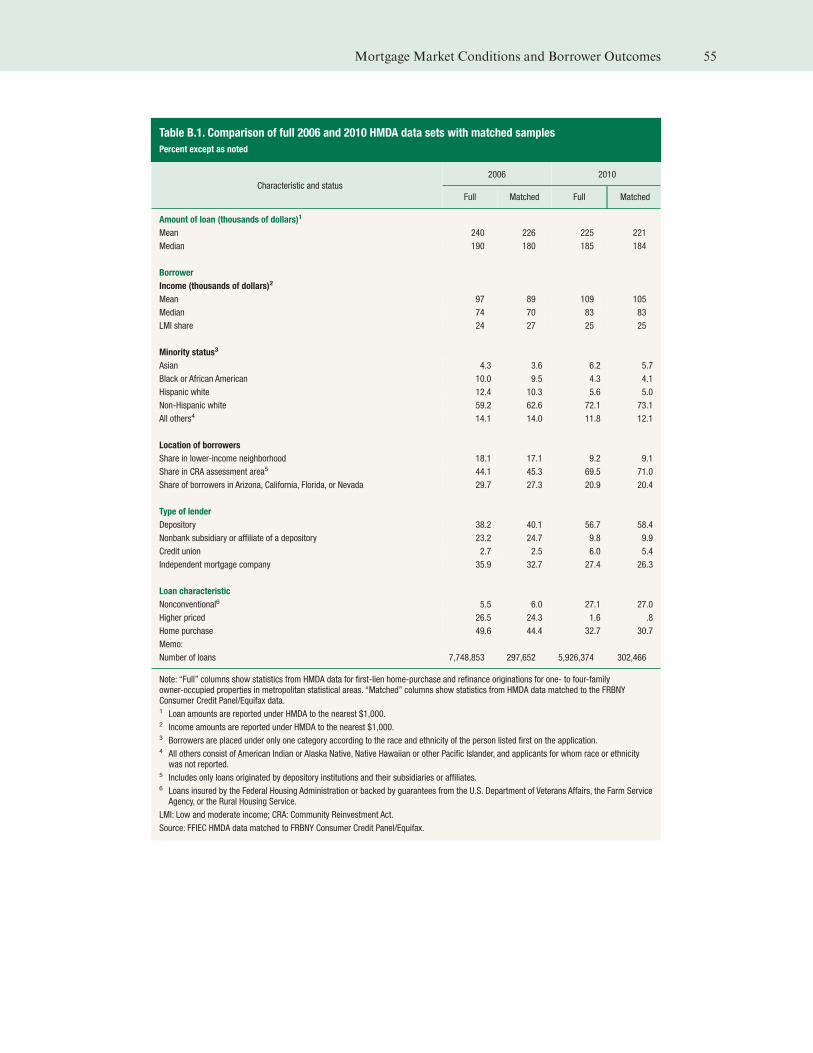
Table B.1. Comparison of full 2006 and 2010 HMDA data sets with matched samples
Percent except as noted
Characteristic and status
2006 2010
Full Matched Full Matched
Amount of loan (thousands of dollars)1
Mean 240 226 225 221
Median 190 180 185 184
Borrower
Income (thousands of dollars)2
Mean 97 89 109 105
Median 74 70 83 83
LMI share 24 27 25 25
Minority status3
Asian 4.3 3.6 6.2 5.7
Black or African American 10.0 9.5 4.3 4.1
Hispanic white 12.4 10.3 5.6 5.0
Non-Hispanic white 59.2 62.6 72.1 73.1
All others4 14.1 14.0 11.8 12.1
Location of borrowers
Share in lower-income neighborhood 18.1 17.1 9.2 9.1
Share in CRA assessment area5 44.1 45.3 69.5 71.0
Share of borrowers in Arizona, California, Florida, or Nevada 29.7 27.3 20.9 20.4
Type of lender
Depository 38.2 40.1 56.7 58.4
Nonbank subsidiary or affiliate of a depository 23.2 24.7 9.8 9.9
Credit union 2.7 2.5 6.0 5.4
Independent mortgage company 35.9 32.7 27.4 26.3
Loan characteristic
Nonconventional6 5.5 6.0 27.1 27.0
Higher priced 26.5 24.3 1.6 .8
Home purchase 49.6 44.4 32.7 30.7
Memo:
Number of loans 7,748,853 297,652 5,926,374 302,466
Note: “Full” columns show statistics from HMDA data for first-lien home-purchase and refinance originations for one- to four-familyowner-occupied properties in metropolitan statistical areas. “Matched” columns show statistics from HMDA data matched to the FRBNYConsumer Credit Panel/Equifax data.1 Loan amounts are reported under HMDA to the nearest $1,000.2 Income amounts are reported under HMDA to the nearest $1,000.3 Borrowers are placed under only one category according to the race and ethnicity of the person listed first on the application.4 All others consist of American Indian or Alaska Native, Native Hawaiian or other Pacific Islander, and applicants for whom race or ethnicitywas not reported.
5 Includes only loans originated by depository institutions and their subsidiaries or affiliates.6 Loans insured by the Federal Housing Administration or backed by guarantees from the U.S. Department of Veterans Affairs, the Farm ServiceAgency, or the Rural Housing Service.
LMI: Low and moderate income; CRA: Community Reinvestment Act.
Source: FFIEC HMDA data matched to FRBNY Consumer Credit Panel/Equifax.
Mortgage Market Conditions and Borrower Outcomes 55
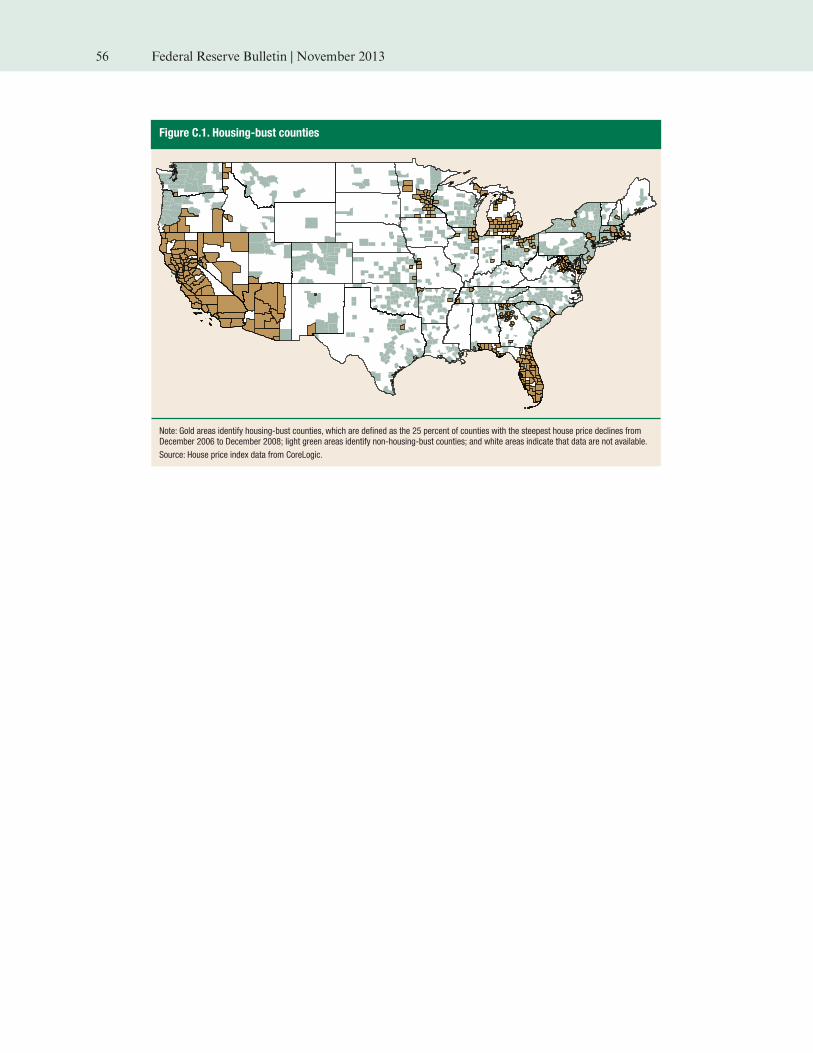
Figure C.1. Housing-bust counties
Note: Gold areas identify housing-bust counties, which are defined as the 25 percent of counties with the steepest house price declines fromDecember 2006 to December 2008; light green areas identify non-housing-bust counties; and white areas indicate that data are not available.
Source: House price index data from CoreLogic.
56 Federal Reserve Bulletin | November 2013
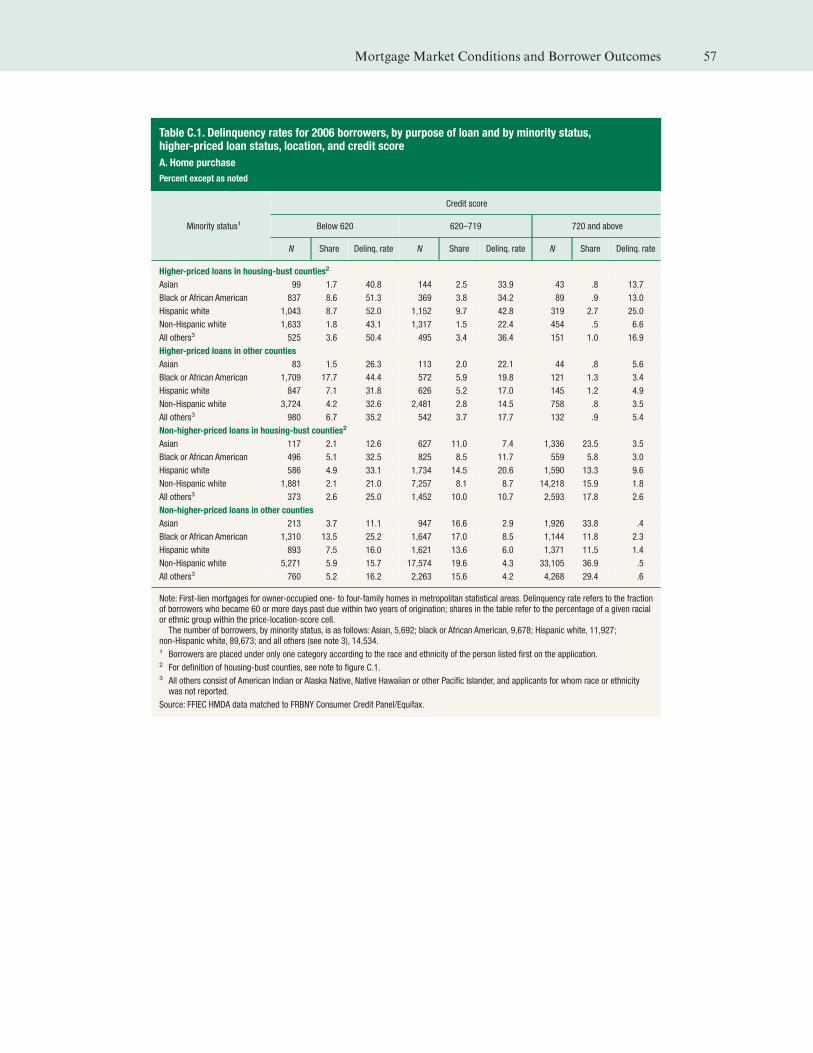
Table C.1. Delinquency rates for 2006 borrowers, by purpose of loan and by minority status,higher-priced loan status, location, and credit score
A. Home purchase
Percent except as noted
Minority status1
Credit score
Below 620 620–719 720 and above
N Share Delinq. rate N Share Delinq. rate N Share Delinq. rate
Higher-priced loans in housing-bust counties2
Asian 99 1.7 40.8 144 2.5 33.9 43 .8 13.7
Black or African American 837 8.6 51.3 369 3.8 34.2 89 .9 13.0
Hispanic white 1,043 8.7 52.0 1,152 9.7 42.8 319 2.7 25.0
Non-Hispanic white 1,633 1.8 43.1 1,317 1.5 22.4 454 .5 6.6
All others3 525 3.6 50.4 495 3.4 36.4 151 1.0 16.9
Higher-priced loans in other counties
Asian 83 1.5 26.3 113 2.0 22.1 44 .8 5.6
Black or African American 1,709 17.7 44.4 572 5.9 19.8 121 1.3 3.4
Hispanic white 847 7.1 31.8 626 5.2 17.0 145 1.2 4.9
Non-Hispanic white 3,724 4.2 32.6 2,481 2.8 14.5 758 .8 3.5
All others3 980 6.7 35.2 542 3.7 17.7 132 .9 5.4
Non-higher-priced loans in housing-bust counties2
Asian 117 2.1 12.6 627 11.0 7.4 1,336 23.5 3.5
Black or African American 496 5.1 32.5 825 8.5 11.7 559 5.8 3.0
Hispanic white 586 4.9 33.1 1,734 14.5 20.6 1,590 13.3 9.6
Non-Hispanic white 1,881 2.1 21.0 7,257 8.1 8.7 14,218 15.9 1.8
All others3 373 2.6 25.0 1,452 10.0 10.7 2,593 17.8 2.6
Non-higher-priced loans in other counties
Asian 213 3.7 11.1 947 16.6 2.9 1,926 33.8 .4
Black or African American 1,310 13.5 25.2 1,647 17.0 8.5 1,144 11.8 2.3
Hispanic white 893 7.5 16.0 1,621 13.6 6.0 1,371 11.5 1.4
Non-Hispanic white 5,271 5.9 15.7 17,574 19.6 4.3 33,105 36.9 .5
All others3 760 5.2 16.2 2,263 15.6 4.2 4,268 29.4 .6
Note: First-lien mortgages for owner-occupied one- to four-family homes in metropolitan statistical areas. Delinquency rate refers to the fractionof borrowers who became 60 or more days past due within two years of origination; shares in the table refer to the percentage of a given racialor ethnic group within the price-location-score cell.The number of borrowers, by minority status, is as follows: Asian, 5,692; black or African American, 9,678; Hispanic white, 11,927;
non-Hispanic white, 89,673; and all others (see note 3), 14,534.1 Borrowers are placed under only one category according to the race and ethnicity of the person listed first on the application.2 For definition of housing-bust counties, see note to figure C.1.3 All others consist of American Indian or Alaska Native, Native Hawaiian or other Pacific Islander, and applicants for whom race or ethnicitywas not reported.
Source: FFIEC HMDA data matched to FRBNY Consumer Credit Panel/Equifax.
Mortgage Market Conditions and Borrower Outcomes 57
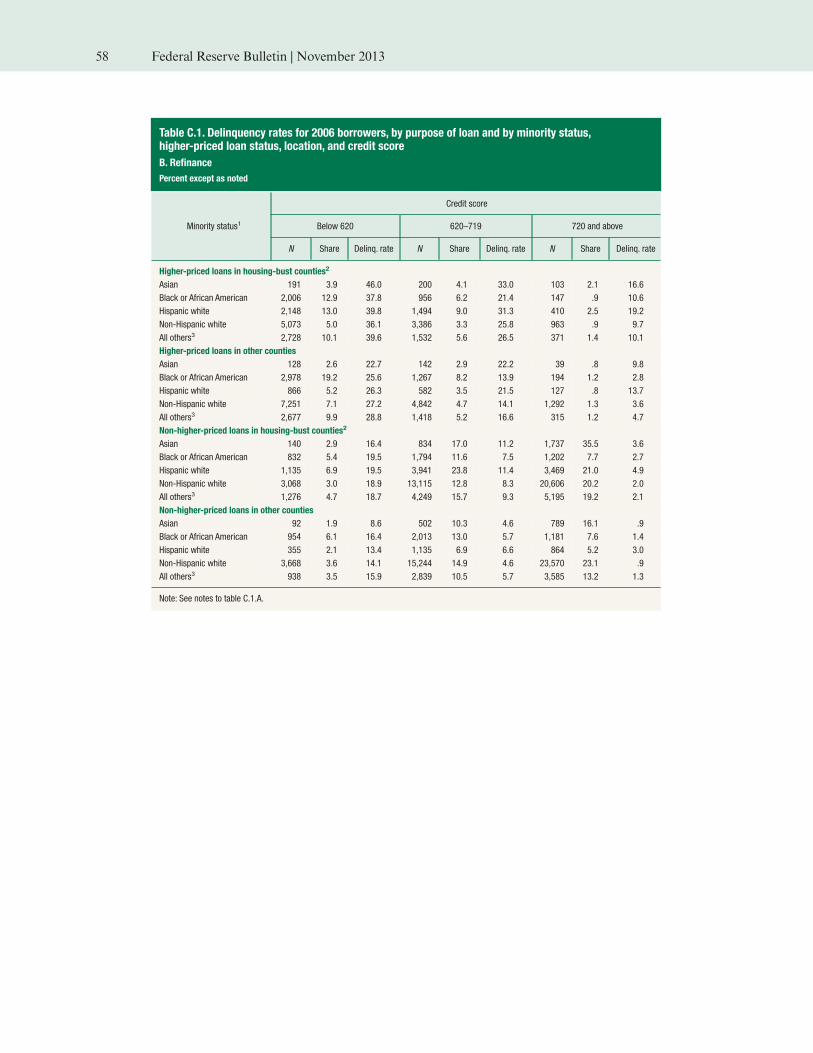
Table C.1. Delinquency rates for 2006 borrowers, by purpose of loan and by minority status,higher-priced loan status, location, and credit score
B. Refinance
Percent except as noted
Minority status1
Credit score
Below 620 620–719 720 and above
N Share Delinq. rate N Share Delinq. rate N Share Delinq. rate
Higher-priced loans in housing-bust counties2
Asian 191 3.9 46.0 200 4.1 33.0 103 2.1 16.6
Black or African American 2,006 12.9 37.8 956 6.2 21.4 147 .9 10.6
Hispanic white 2,148 13.0 39.8 1,494 9.0 31.3 410 2.5 19.2
Non-Hispanic white 5,073 5.0 36.1 3,386 3.3 25.8 963 .9 9.7
All others3 2,728 10.1 39.6 1,532 5.6 26.5 371 1.4 10.1
Higher-priced loans in other counties
Asian 128 2.6 22.7 142 2.9 22.2 39 .8 9.8
Black or African American 2,978 19.2 25.6 1,267 8.2 13.9 194 1.2 2.8
Hispanic white 866 5.2 26.3 582 3.5 21.5 127 .8 13.7
Non-Hispanic white 7,251 7.1 27.2 4,842 4.7 14.1 1,292 1.3 3.6
All others3 2,677 9.9 28.8 1,418 5.2 16.6 315 1.2 4.7
Non-higher-priced loans in housing-bust counties2
Asian 140 2.9 16.4 834 17.0 11.2 1,737 35.5 3.6
Black or African American 832 5.4 19.5 1,794 11.6 7.5 1,202 7.7 2.7
Hispanic white 1,135 6.9 19.5 3,941 23.8 11.4 3,469 21.0 4.9
Non-Hispanic white 3,068 3.0 18.9 13,115 12.8 8.3 20,606 20.2 2.0
All others3 1,276 4.7 18.7 4,249 15.7 9.3 5,195 19.2 2.1
Non-higher-priced loans in other counties
Asian 92 1.9 8.6 502 10.3 4.6 789 16.1 .9
Black or African American 954 6.1 16.4 2,013 13.0 5.7 1,181 7.6 1.4
Hispanic white 355 2.1 13.4 1,135 6.9 6.6 864 5.2 3.0
Non-Hispanic white 3,668 3.6 14.1 15,244 14.9 4.6 23,570 23.1 .9
All others3 938 3.5 15.9 2,839 10.5 5.7 3,585 13.2 1.3
Note: See notes to table C.1.A.
58 Federal Reserve Bulletin | November 2013