Embed Size (px)
Citation preview
RE S E AR C H RE P O R T
Mortgage Denial Rates and Household
Finances among Older Americans Karan Kaul Linna Zhu
October 2021
H O U S I N G F I N A N C E P O L I C Y C E N T E R

AB O U T T H E U R BA N I N S T I T U TE
The nonprofit Urban Institute is a leading research organization dedicated to developing evidence-based insights
that improve people’s lives and strengthen communities. For 50 years, Urban has been the trusted source for
rigorous analysis of complex social and economic issues; strategic advice to policymakers, philanthropists, and
practitioners; and new, promising ideas that expand opportunities for all. Our work inspires effective decisions that
advance fairness and enhance the well-being of people and places.
Copyright © October 2021. Urban Institute. Permission is granted for reproduction of this file, with attribution to the
Urban Institute. Cover photo by Twinsterphoto/Shutterstock.

Contents Acknowledgments iv
Executive Summary v
1. Mortgage Denial Rates for Seniors 1
Older Applicants Face the Highest Denial Rates for Forward Equity Extraction 1
A Third of Senior Refinance Applications Are Denied Because of High DTI Ratios 6
Low Incomes and Deteriorating Credit Scores Partly Explain High DTI Ratios among Seniors 8
Older Applicants Are Denied at Higher Rates across the DTI spectrum 10
Seniors’ Use of Cash-Out Refinances and HECMs Increased from 2018 to 2020 12
2. Trends in Senior Debt, Home Equity, and Net Worth 14
Senior Household Finances Have Deteriorated, and Debt Levels Have Increased 14
Senior Homeowners Have Experienced Increasing Debt Burdens over the Past 30 Years 14
Despite Rising Indebtedness, Seniors Have Stable Net Worth Thanks to Home Equity 21
3. Conclusion 26
Notes 27
References 28
About the Authors 29
Statement of Independence 30

i v A C K N O W L E D G M E N T S
Acknowledgments This report was funded by Finance of America Reverse. We are grateful to them and to all our funders,
who make it possible for Urban to advance its mission.
The views expressed are those of the authors and should not be attributed to the Urban Institute,
its trustees, or its funders. Funders do not determine research findings or the insights and
recommendations of Urban experts. Further information on the Urban Institute’s funding principles is
available at urban.org/fundingprinciples.
Finance of America Reverse (FAR) is one of the largest reverse mortgage lenders in the United
States. Although FAR was given an opportunity to review a draft of this publication, the Urban Institute
was under no obligation to incorporate any feedback.
E X E C U T I V E S U M M A R Y v
Executive Summary Most older Americans rely on their retirement accounts and other savings to make up for the shortfall
between their living expenses and income from Social Security. With retiree households earning less, on
average, than the working-age population, savings become a crucial element of financial security during
retirement. But most adults struggle to adequately save during their working years, reducing their
financial preparedness for retirement.
At the same time, older Americans who are homeowners have accumulated trillions of dollars in
home equity wealth that remains mostly untapped. Given the rapid home price appreciation of the past
several years, especially during the COVID-19 pandemic, this wealth continues to grow, surpassing $9
trillion1 as of July 2021. Despite the shortfall in retirement savings and the booming home equity
wealth, home equity extraction rates remain very low (Moulton et al. 2016). Impediments to equity
extraction are myriad, often reflecting a lack of desire to extract equity (Kaul and Goodman 2017), but
we show that older homeowners find it more difficult than younger homeowners to get approved for
forward equity extraction.
We look at mortgage denial rates from 2018 to 2020 using Home Mortgage Disclosure Act
(HMDA) data. We study trends in denial rates across product types and age groups and explore key
reasons for them. Our main finding is that older applicants are more likely to be denied than younger
applicants and more so for forward equity extraction products such as cash-out refinances and home
equity lines of credit. Specifically, home equity lines of credit had the highest denial rates from 2018 to
2020, followed by slightly lower denial rates for cash-out refinances. This is driven primarily by higher
debt burdens in relation to income and insufficient credit history. On the positive front, we find that
denial rates have trended down in recent years, driven largely by low interest rates, especially in 2020.
Home equity conversion mortgages (HECMs) had substantially lower denial rates than forward
extraction products. Even though homeowners have a better likelihood of getting approved for HECMs,
demand remains subdued. In the past two years, as mortgage interest rates fell to historic lows, home
equity line of credit volumes have declined, while cash-out refinance volumes have registered robust
growth. This likely reflects the convenience of extracting equity and refinancing the primary mortgage
to a lower rate in a single transaction.
We also identify the household financial characteristics that may be driving denial rates higher for
older homeowners. Using the 2019 Survey of Consumer Finances from the Federal Reserve, we study
changes in net worth, home equity, financial assets, and debt to highlight long-term changes in older

v i E X E C U T I V E S U M M A R Y
Americans’ household finances. Our main finding is that the share of homeowners ages 65 and older
that carry debt has increased substantially over the past 20 years. Additionally, the median value of
household debt has increased robustly, driven by primary mortgage debt. We also find generally
stagnating values of median net worth and median home equity, particularly among homeowners ages
75 and older.
As incomes and savings fail to keep up with rising debt levels, it is not surprising that older
homeowners are experiencing high debt-to-income (DTI) ratios and finding it increasingly difficult to
qualify for forward mortgages. Low mortgage interest rates in recent years have been a temporary
mitigating factor by lowering monthly payments and DTI ratios. This has pushed denial rates down for
now, but they will likely increase as interest rates rise. This strongly suggests that older households,
given low incomes but substantial home equity wealth, would benefit from having access to equity
extraction products whose underwriting is less dependent on incomes and debt and more dependent on
the value of assets and household net worth.

1. Mortgage Denial Rates for Seniors
Older Applicants Face the Highest Denial Rates for
Forward Equity Extraction and the Lowest for HECMs
Mortgage applicants ages 65 and older are denied mortgage loans at higher rates than applicants
younger than 65,2 especially applicants ages 75 and older. According to Home Mortgage Disclosure Act
(HMDA) data from 2018 to 2020,3 the overall denial rate for applicants4 ages 75 and older was 18.7
percent in 2020, 25.0 percent in 2019, and 30.1 percent in 2018, compared with 12.1 percent, 15.2
percent, and 17.9 percent for applicants younger than 65 (figure 1).
FIGURE 1
Denial Rates, by Age
All loans
URBAN INSTITUTE
Source: 2018–20 Home Mortgage Disclosure Act data.
Although denial rates for all three age groups declined from 2018 to 2020, older applicants
continued to experience significantly higher denial rates. Falling denial rates likely reflect declines in
mortgage interest rates from 2018 to 2020. According to Freddie Mac, the interest rate for the 30-year
fixed-rate mortgage was approximately 4.50 percent at year-end 2018, compared with 3.75 percent at
year-end 2019 and 2.65 percent at year-end 2020. Lower rates translate into lower monthly payments
17.9%
15.2%
12.1%
24.5%
20.5%
15.4%
30.1%
25.0%
18.7%
2018 2019 2020
Younger than age 65 Ages 65 to 74 Ages 75 and older
2 M O R T G A G E D E N I A L R A T E S A N D H O U S E H O L D F I N A N C E S A M O N G O L D E R A M E R I C A N S
relative to income, thus lowering DTI ratios and making it easier to qualify. Figure 2 shows denial rates
by loan purpose. Purchase loans not only had the lowest denial rates, but the variability in the denial
rates was muted across years and age groups.
In comparison, cash-out refinance loans, which allow seniors to extract home equity, witnessed
both high denial rates and substantial variability in denial rates by age. Specifically, applicants ages 75
and older were denied cash-out refinance loans at a rate of 37.5 percent in 2018, 30.5 percent in 2019,
and 21.2 percent in 2020, compared with 31.7 percent, 25.9 percent, and 17.7 percent for those ages 65
to 74 and 27.6 percent, 22.0 percent, and 14.6 percent for applicants younger than 65. The denial rates
for non-cash-out refinances was higher than for purchase loans but slightly lower than for cash-out
refinances.

M O R T G A G E D E N I A L R A T E S A N D H O U S E H O L D F I N A N C E S A M O N G O L D E R A M E R I C A N S 3
FIGURE 2A
Denial Rates, by Loan Purpose and Borrower Age
Purchase loans
FIGURE 2B
Denial Rates, by Loan Purpose and Borrower Age
Cash-out refinance loans
FIGURE 2C
Denial Rates, by Loan Purpose and Borrower Age
Non-cash-out refinance loans
URBAN INSTITUTE
Source: 2018–20 Home Mortgage Disclosure Act data.
11.4%10.1% 10.0%10.5%
9.3% 8.8%
10.9%9.7%
8.8%
2018 2019 2020
Younger than age 65 Ages 65 to 74 Ages 75 and older
27.6%
22.0%
14.6%
31.7%
25.9%
17.7%
37.5%
30.5%
21.2%
2018 2019 2020
Younger than age 65 Ages 65 to 74 Ages 75 and older
27.0%
15.2%11.4%
31.4%
21.7%
15.6%
35.5%
26.9%
19.6%
2018 2019 2020
Younger than age 65 Ages 65 to 74 Ages 75 and older

4 M O R T G A G E D E N I A L R A T E S A N D H O U S E H O L D F I N A N C E S A M O N G O L D E R A M E R I C A N S
Notably, second-lien home equity lines of credit (HELOCs) experienced the highest denial rates for
all age groups, although the variation by age was small (figure 2D). Unlike cash-out refinance applicants,
HELOC applicants ages 75 and older were only slightly more likely than applicants ages 65 to 74 to be
denied. The HELOC denial rate for applicants ages 75 and older was 36.3 percent in 2020, slightly down
from 39.8 percent in 2019 and 39.5 percent in 2018. These rates were 32.0 percent, 36.2 percent, and
36.0 percent for applicants ages 65 to 74.
Comparing the denial rates for various loan types, we find that unlike cash-out and non-cash-out
refinances, for which denial rates have declined in response to lower interest rates, HELOC denial rates
remain elevated.
Home equity conversion mortgages (HECMs) were the only product category for which seniors had
substantially lower denial rates than younger applicants (figure 2E). In 2020, HECM applicants ages 75
and older had a denial rate of 15.1 percent, those ages 65 to 74 had a denial rate of 11.8 percent, and
those younger than 65 had a denial rate of 23.5 percent. These results show that older homeowners
find it more difficult than younger homeowners to qualify for forward equity extraction products (e.g.,
cash-out refinances and HELOCs) but find it easier to qualify for HECM reverse mortgages.

M O R T G A G E D E N I A L R A T E S A N D H O U S E H O L D F I N A N C E S A M O N G O L D E R A M E R I C A N S 5
FIGURE 2D
Denial Rates, by Loan Purpose and Borrower Age
Home equity lines of credit
FIGURE 2E
Denial Rates, by Loan Purpose and Borrower Age
Home equity conversion mortgages
URBAN INSTITUTE
Source: 2018–20 Home Mortgage Disclosure Act data.
40.8% 40.1%
33.9%36.0% 36.2%
32.0%
39.5% 39.8%
36.3%
2018 2019 2020
Younger than age 65 Ages 65 to 74 Ages 75 and older
27.0%
13.3%
23.5%
14.8%
11.9% 11.8%13.7%
10.4%
15.1%
2018 2019 2020
Younger than age 65 Ages 65 to 74 Ages 75 and older
6 M O R T G A G E D E N I A L R A T E S A N D H O U S E H O L D F I N A N C E S A M O N G O L D E R A M E R I C A N S
A Third of Senior Refinance Applications Are Denied
Because of High DTI Ratios
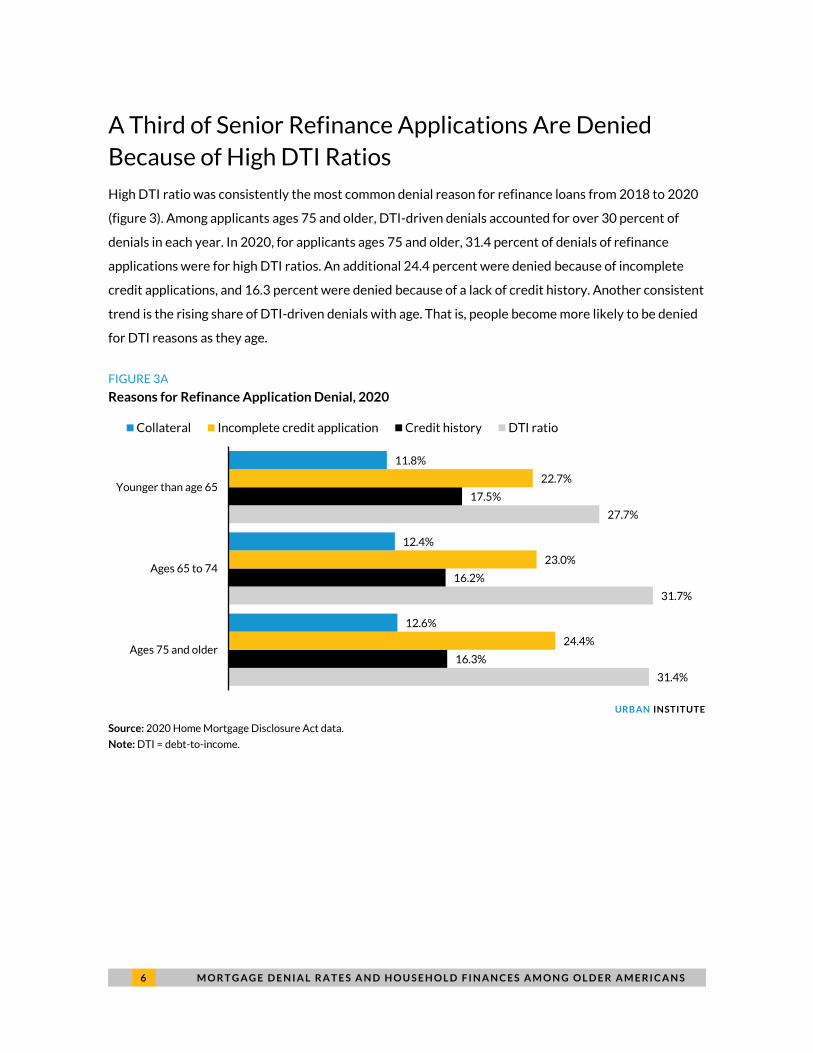
High DTI ratio was consistently the most common denial reason for refinance loans from 2018 to 2020
(figure 3). Among applicants ages 75 and older, DTI-driven denials accounted for over 30 percent of
denials in each year. In 2020, for applicants ages 75 and older, 31.4 percent of denials of refinance
applications were for high DTI ratios. An additional 24.4 percent were denied because of incomplete
credit applications, and 16.3 percent were denied because of a lack of credit history. Another consistent
trend is the rising share of DTI-driven denials with age. That is, people become more likely to be denied
for DTI reasons as they age.
FIGURE 3A
Reasons for Refinance Application Denial, 2020
URBAN INSTITUTE
Source: 2020 Home Mortgage Disclosure Act data.
Note: DTI = debt-to-income.
31.4%
31.7%
27.7%
16.3%
16.2%
17.5%
24.4%
23.0%
22.7%
12.6%
12.4%
11.8%
Ages 75 and older
Ages 65 to 74
Younger than age 65
Collateral Incomplete credit application Credit history DTI ratio

M O R T G A G E D E N I A L R A T E S A N D H O U S E H O L D F I N A N C E S A M O N G O L D E R A M E R I C A N S 7
FIGURE 3B
Reasons for Refinance Application Denial, 2019
URBAN INSTITUTE
Source: 2019 Home Mortgage Disclosure Act data.
Note: DTI = debt-to-income.
FIGURE 3C
Reasons for Refinance Application Denial, 2018
URBAN INSTITUTE
Source: 2018 Home Mortgage Disclosure Act data.
Note: DTI = debt-to-income.
30.9%
29.0%
26.4%
21.0%
21.2%
22.4%
16.9%
16.8%
15.6%
16.9%
18.2%
17.6%
Ages 75 and older
Ages 65 to 74
Younger than age 65
Collateral Incomplete credit application Credit history DTI ratio
31.9%
27.9%
24.8%
19.5%
20.5%
23.4%
17.2%
18.1%
16.3%
16.8%
18.8%
18.0%
Ages 75 and older
Ages 65 to 74
Younger than age 65
Collateral Incomplete credit application Credit history DTI ratio
8 M O R T G A G E D E N I A L R A T E S A N D H O U S E H O L D F I N A N C E S A M O N G O L D E R A M E R I C A N S
Low Incomes and Deteriorating Credit Scores Partly
Explain High DTI Ratios among Seniors
According to Experian, older Americans experienced a 40-point drop5 in their credit score between
2008 and 2018, the sharpest decline among all age groups. Because senior households, on average,
have less income and savings and more debt, they are more vulnerable to becoming financially
burdened. Unexpected expenses, loss of income, or declines in the value of retirement savings can push
DTI ratios higher and credit scores lower, making it harder to qualify for mortgages.
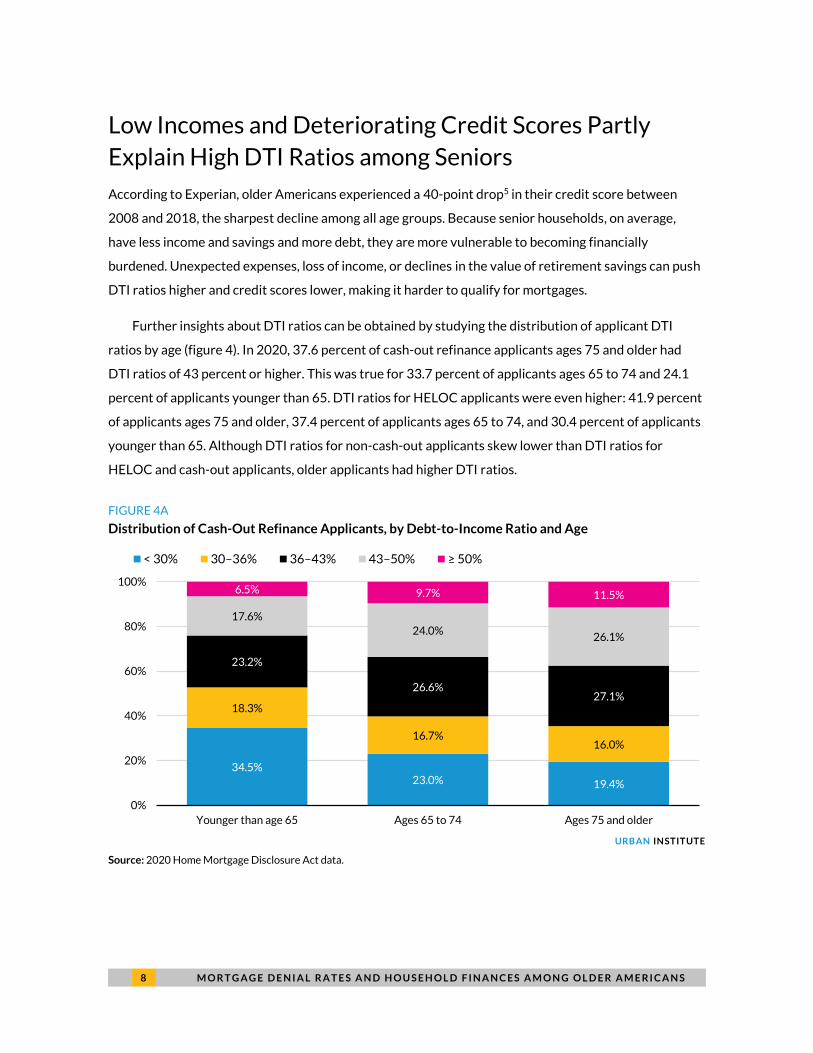
Further insights about DTI ratios can be obtained by studying the distribution of applicant DTI
ratios by age (figure 4). In 2020, 37.6 percent of cash-out refinance applicants ages 75 and older had
DTI ratios of 43 percent or higher. This was true for 33.7 percent of applicants ages 65 to 74 and 24.1
percent of applicants younger than 65. DTI ratios for HELOC applicants were even higher: 41.9 percent
of applicants ages 75 and older, 37.4 percent of applicants ages 65 to 74, and 30.4 percent of applicants
younger than 65. Although DTI ratios for non-cash-out applicants skew lower than DTI ratios for
HELOC and cash-out applicants, older applicants had higher DTI ratios.
FIGURE 4A
Distribution of Cash-Out Refinance Applicants, by Debt-to-Income Ratio and Age
URBAN INSTITUTE
Source: 2020 Home Mortgage Disclosure Act data.
34.5%23.0% 19.4%
18.3%
16.7%16.0%
23.2%
26.6%27.1%
17.6%
24.0%26.1%
6.5% 9.7% 11.5%
0%
20%
40%
60%
80%
100%
Younger than age 65 Ages 65 to 74 Ages 75 and older
< 30% 30–36% 36–43% 43–50% ≥ 50%
M O R T G A G E D E N I A L R A T E S A N D H O U S E H O L D F I N A N C E S A M O N G O L D E R A M E R I C A N S 9
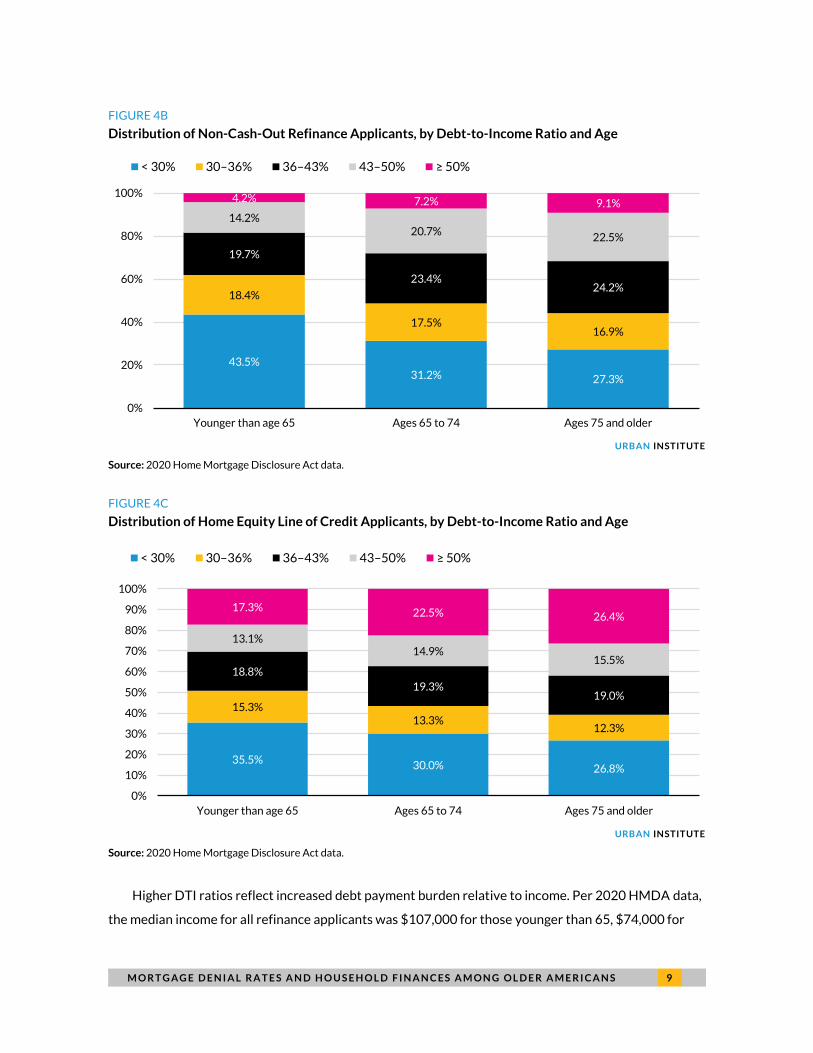
FIGURE 4B
Distribution of Non-Cash-Out Refinance Applicants, by Debt-to-Income Ratio and Age
URBAN INSTITUTE
Source: 2020 Home Mortgage Disclosure Act data.
FIGURE 4C
Distribution of Home Equity Line of Credit Applicants, by Debt-to-Income Ratio and Age
URBAN INSTITUTE
Source: 2020 Home Mortgage Disclosure Act data.
Higher DTI ratios reflect increased debt payment burden relative to income. Per 2020 HMDA data,
the median income for all refinance applicants was $107,000 for those younger than 65, $74,000 for
43.5%31.2% 27.3%
18.4%
17.5%16.9%
19.7%
23.4%24.2%
14.2%20.7%
22.5%
4.2% 7.2% 9.1%
0%
20%
40%
60%
80%
100%
Younger than age 65 Ages 65 to 74 Ages 75 and older
< 30% 30–36% 36–43% 43–50% ≥ 50%
35.5% 30.0% 26.8%
15.3%13.3%
12.3%
18.8%
19.3%19.0%
13.1%14.9%
15.5%
17.3% 22.5% 26.4%
0%
10%
20%
30%
40%
50%
60%
70%
80%
90%
100%
Younger than age 65 Ages 65 to 74 Ages 75 and older
< 30% 30–36% 36–43% 43–50% ≥ 50%
1 0 M O R T G A G E D E N I A L R A T E S A N D H O U S E H O L D F I N A N C E S A M O N G O L D E R A M E R I C A N S
those ages 65 to 74, and $62,000 for those ages 75 and older. The median income was $100,000 for
cash-out refinance applicants younger than 65, $70,000 for those ages 65 to 74, and $59,000 for those
ages 75 and older. The median income for non-cash-out refinance applicants was $110,000 for those
younger than 65, $77,000 for those ages 65 to 74, and $64,000 for those ages 75 and older.
There is a clear gap between incomes for cash-out and non-cash-out refinance applicants and
between younger and older applicants. Cash-out refinance applicants ages 75 and older seeking to
extract equity had the lowest median income at $59,000, contributing to higher DTI ratios.
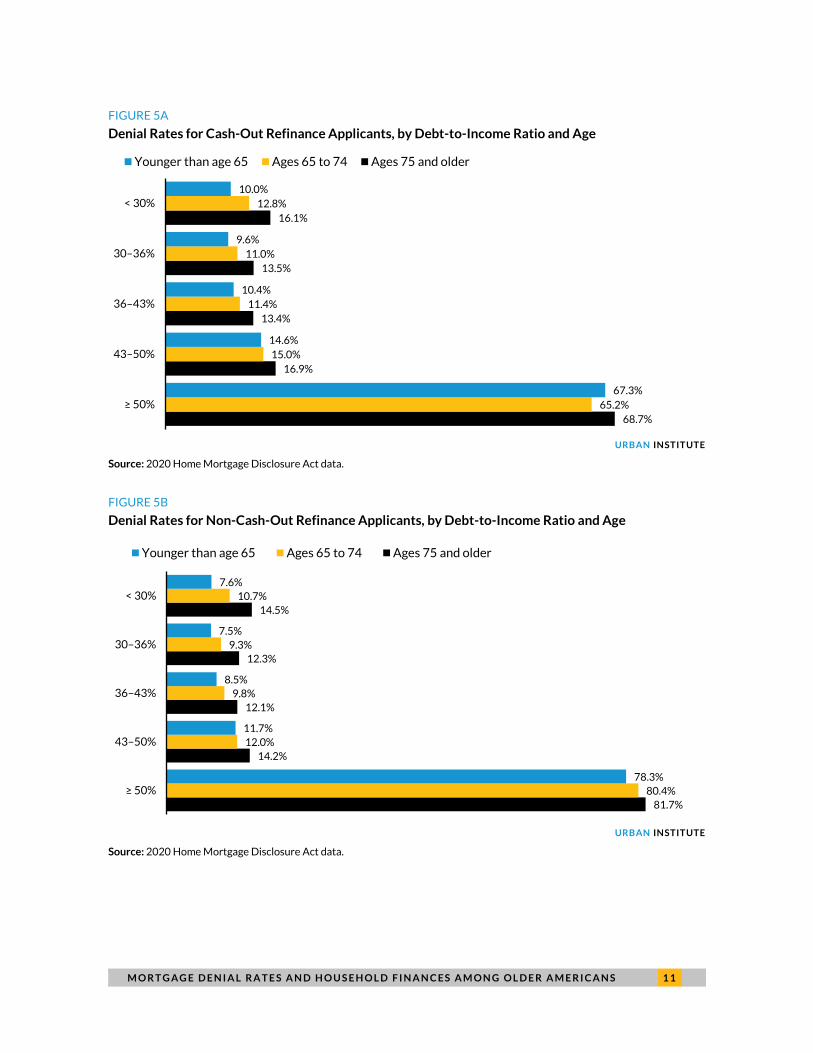
Older Applicants Are Denied at Higher Rates
across the DTI spectrum
Older applicants across the DTI spectrum are denied cash-out refinance loans, non-cash-out refinance
loans, and HELOCs at higher rates than younger applicants (figure 7). Note the skyrocketing increase in
denial rates for DTI ratios of at least 50 percent, regardless of age or product. More than 65 percent of
cash-out refinance applications and roughly 80 percent of non-cash-out refinance and HELOC
applications with DTI ratios of at least 50 percent were denied in 2020, with little variation by age. This
does not bode well for forward mortgage approval rates for seniors in the future because rising debt
levels (discussed later) in relation to incomes will keep pushing DTI ratios higher. As shown in figure 4,
older applicants are more likely than younger applicants to have DTI ratios of at least 50 percent.
M O R T G A G E D E N I A L R A T E S A N D H O U S E H O L D F I N A N C E S A M O N G O L D E R A M E R I C A N S 1 1
FIGURE 5A
Denial Rates for Cash-Out Refinance Applicants, by Debt-to-Income Ratio and Age
URBAN INSTITUTE
Source: 2020 Home Mortgage Disclosure Act data.
FIGURE 5B
Denial Rates for Non-Cash-Out Refinance Applicants, by Debt-to-Income Ratio and Age
URBAN INSTITUTE
Source: 2020 Home Mortgage Disclosure Act data.
68.7%
16.9%
13.4%
13.5%
16.1%
65.2%
15.0%
11.4%
11.0%
12.8%
67.3%
14.6%
10.4%
9.6%
10.0%
≥ 50%
43–50%
36–43%
30–36%
< 30%
Younger than age 65 Ages 65 to 74 Ages 75 and older
81.7%
14.2%
12.1%
12.3%
14.5%
80.4%
12.0%
9.8%
9.3%
10.7%
78.3%
11.7%
8.5%
7.5%
7.6%
≥ 50%
43–50%
36–43%
30–36%
< 30%
Younger than age 65 Ages 65 to 74 Ages 75 and older
1 2 M O R T G A G E D E N I A L R A T E S A N D H O U S E H O L D F I N A N C E S A M O N G O L D E R A M E R I C A N S
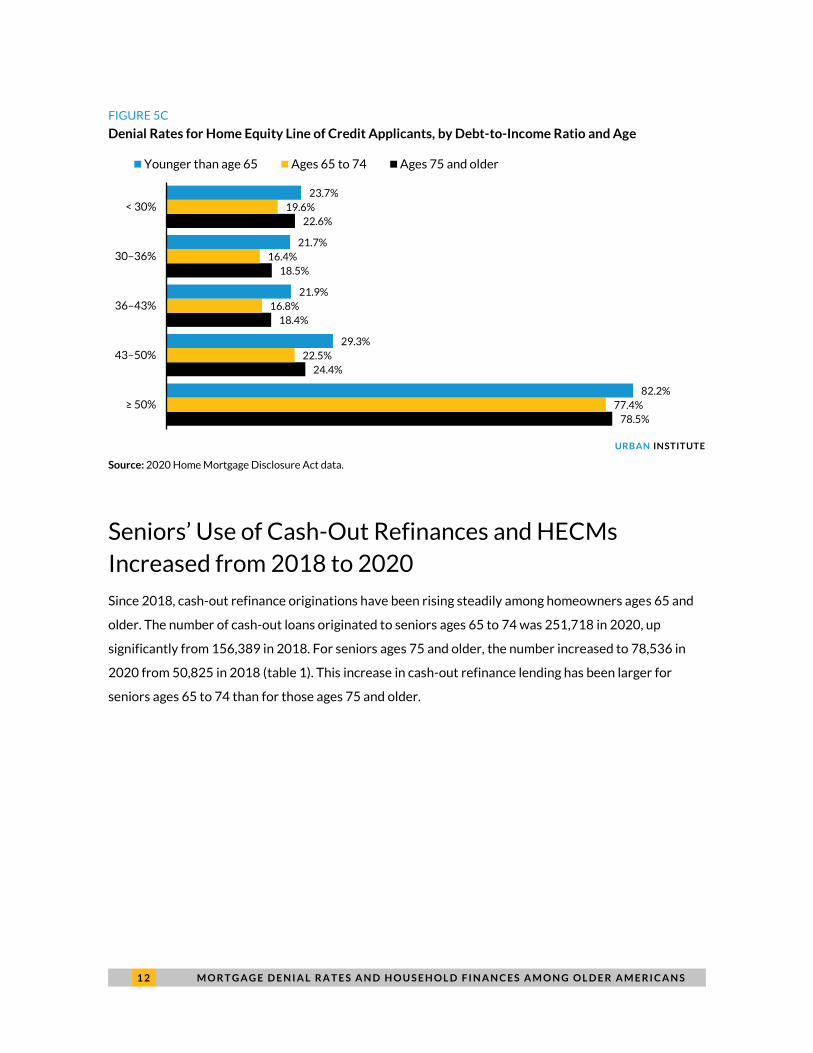
FIGURE 5C
Denial Rates for Home Equity Line of Credit Applicants, by Debt-to-Income Ratio and Age
URBAN INSTITUTE
Source: 2020 Home Mortgage Disclosure Act data.
Seniors’ Use of Cash-Out Refinances and HECMs
Increased from 2018 to 2020
Since 2018, cash-out refinance originations have been rising steadily among homeowners ages 65 and
older. The number of cash-out loans originated to seniors ages 65 to 74 was 251,718 in 2020, up
significantly from 156,389 in 2018. For seniors ages 75 and older, the number increased to 78,536 in
2020 from 50,825 in 2018 (table 1). This increase in cash-out refinance lending has been larger for
seniors ages 65 to 74 than for those ages 75 and older.
78.5%
24.4%
18.4%
18.5%
22.6%
77.4%
22.5%
16.8%
16.4%
19.6%
82.2%
29.3%
21.9%
21.7%
23.7%
≥ 50%
43–50%
36–43%
30–36%
< 30%
Younger than age 65 Ages 65 to 74 Ages 75 and older
M O R T G A G E D E N I A L R A T E S A N D H O U S E H O L D F I N A N C E S A M O N G O L D E R A M E R I C A N S 1 3
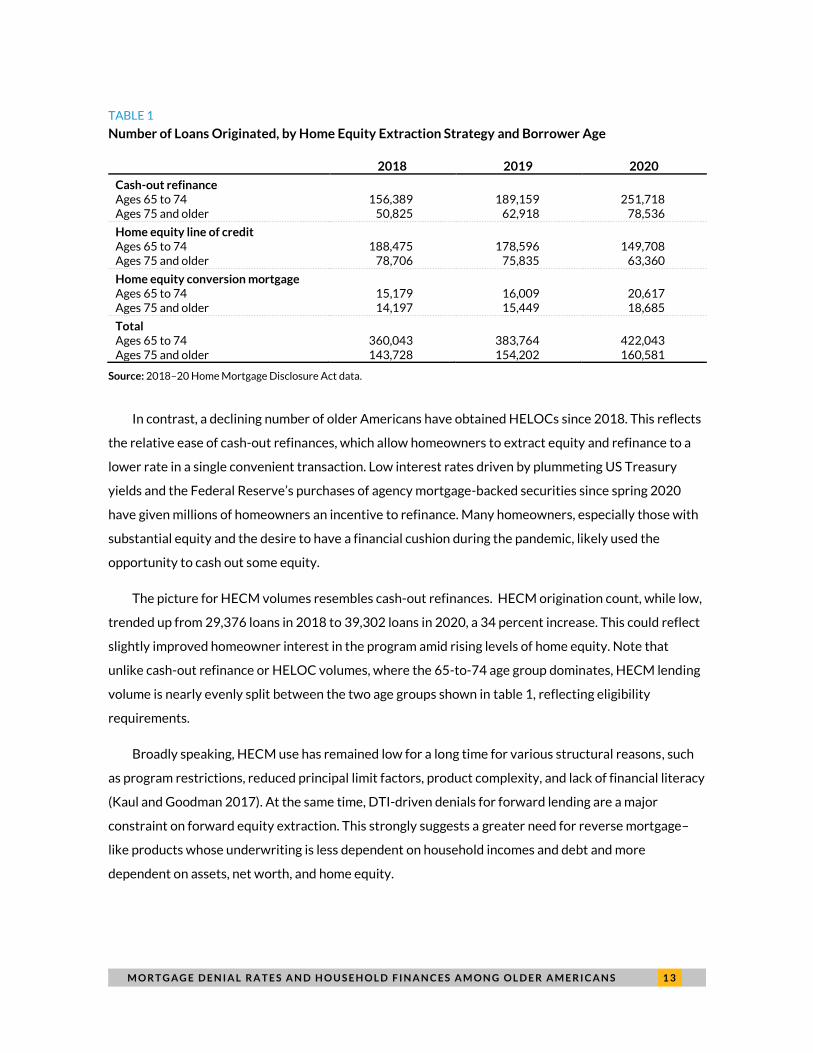
TABLE 1
Number of Loans Originated, by Home Equity Extraction Strategy and Borrower Age
2018 2019 2020
Cash-out refinance
Ages 65 to 74 156,389 189,159 251,718 Ages 75 and older 50,825 62,918 78,536
Home equity line of credit
Ages 65 to 74 188,475 178,596 149,708 Ages 75 and older 78,706 75,835 63,360
Home equity conversion mortgage
Ages 65 to 74 15,179 16,009 20,617 Ages 75 and older 14,197 15,449 18,685
Total
Ages 65 to 74 360,043 383,764 422,043 Ages 75 and older 143,728 154,202 160,581
Source: 2018–20 Home Mortgage Disclosure Act data.
In contrast, a declining number of older Americans have obtained HELOCs since 2018. This reflects
the relative ease of cash-out refinances, which allow homeowners to extract equity and refinance to a
lower rate in a single convenient transaction. Low interest rates driven by plummeting US Treasury
yields and the Federal Reserve’s purchases of agency mortgage-backed securities since spring 2020
have given millions of homeowners an incentive to refinance. Many homeowners, especially those with
substantial equity and the desire to have a financial cushion during the pandemic, likely used the
opportunity to cash out some equity.
The picture for HECM volumes resembles cash-out refinances. HECM origination count, while low,
trended up from 29,376 loans in 2018 to 39,302 loans in 2020, a 34 percent increase. This could reflect
slightly improved homeowner interest in the program amid rising levels of home equity. Note that
unlike cash-out refinance or HELOC volumes, where the 65-to-74 age group dominates, HECM lending
volume is nearly evenly split between the two age groups shown in table 1, reflecting eligibility
requirements.
Broadly speaking, HECM use has remained low for a long time for various structural reasons, such
as program restrictions, reduced principal limit factors, product complexity, and lack of financial literacy
(Kaul and Goodman 2017). At the same time, DTI-driven denials for forward lending are a major
constraint on forward equity extraction. This strongly suggests a greater need for reverse mortgage–
like products whose underwriting is less dependent on household incomes and debt and more
dependent on assets, net worth, and home equity.
1 4 M O R T G A G E D E N I A L R A T E S A N D H O U S E H O L D F I N A N C E S A M O N G O L D E R A M E R I C A N S
2. Trends in Senior Debt, Home
Equity, and Net Worth
Senior Household Finances Have Deteriorated, and Debt
Levels Have Increased
HMDA data help show trends in mortgage denial rates and reasons for them. But because this dataset is
restricted to mortgage applicants, it is of limited use in understanding the financial picture of a broader
cross-section of households. The 2019 Survey of Consumer Finances (SCF), released in fall 2020, is
instrumental in bridging this gap, as it includes data on household assets, debts, incomes, savings, net
worth, and more. This survey is also instrumental for understanding long-term trends in household
finances. These data help us understand in detail, for instance, the types of debt that may be keeping
senior homeowners from qualifying for mortgages. Analysis of these data, discussed below, reveals
several undercurrents that help explain higher denial rates for seniors.
Senior Homeowners Have Experienced Increasing Debt
Burdens over the Past 30 Years
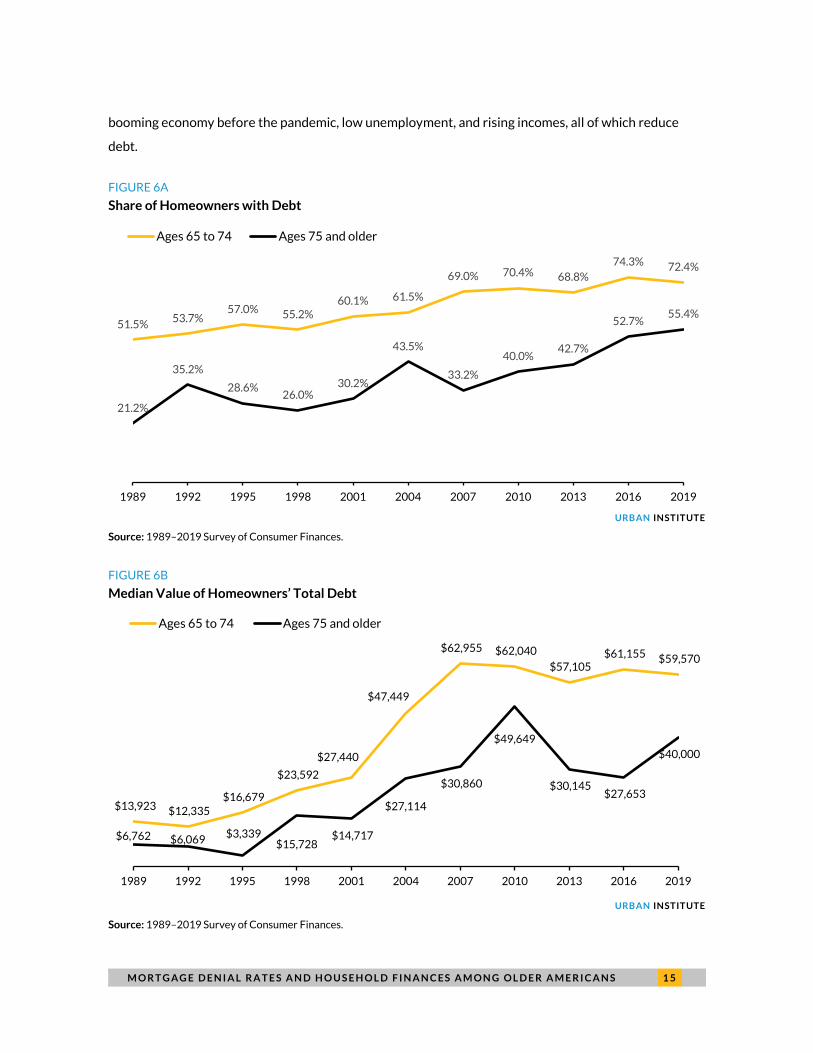
According to the 2019 SCF, the share of US homeowners ages 65 and older that is indebted has been
rising since 1989. Figure 6 shows the share of senior households that carry debt over time. Debt
consists of mortgage debt, credit card balances, installment loans,6 home equity lines of credits, other
lines of credit, and loans against pensions. Fifty-five percent of homeowners ages 75 and older were in
debt in 2019, compared with 21.2 percent in 1989. Although the increase has been less pronounced for
homeowners ages 65 to 74, this age group is more likely to have debt (72.4 percent carried debt in
2019).
Moreover, the median amount of household debt has also increased. For homeowners ages 75 and
older, median debt rose sharply to $40,0007 in 2019, up from $27,653 in 2016, a 45 percent increase in
just three years. In comparison, the median debt for homeowners ages 65 to 74 was flat. It stood at
$59,570 in 2019. Note the small decline from 2016 to 2019 in both the share of households ages 65 to
74 with debt (74.3 percent to 72.4 percent) and median debt ($61,155 to $59,570). This likely reflects a
M O R T G A G E D E N I A L R A T E S A N D H O U S E H O L D F I N A N C E S A M O N G O L D E R A M E R I C A N S 1 5
booming economy before the pandemic, low unemployment, and rising incomes, all of which reduce
debt.
FIGURE 6A
Share of Homeowners with Debt
URBAN INSTITUTE
Source: 1989–2019 Survey of Consumer Finances.
FIGURE 6B
Median Value of Homeowners’ Total Debt
URBAN INSTITUTE
Source: 1989–2019 Survey of Consumer Finances.
51.5%53.7%
57.0% 55.2%60.1% 61.5%
69.0% 70.4% 68.8%
74.3% 72.4%
21.2%
35.2%
28.6%26.0%
30.2%
43.5%
33.2%
40.0%42.7%
52.7%55.4%
1989 1992 1995 1998 2001 2004 2007 2010 2013 2016 2019
Ages 65 to 74 Ages 75 and older
$13,923 $12,335 $16,679
$23,592
$27,440
$47,449
$62,955 $62,040
$57,105 $61,155 $59,570
$6,762 $6,069 $3,339
$15,728 $14,717
$27,114
$30,860
$49,649
$30,145 $27,653
$40,000
1989 1992 1995 1998 2001 2004 2007 2010 2013 2016 2019
Ages 65 to 74 Ages 75 and older
1 6 M O R T G A G E D E N I A L R A T E S A N D H O U S E H O L D F I N A N C E S A M O N G O L D E R A M E R I C A N S
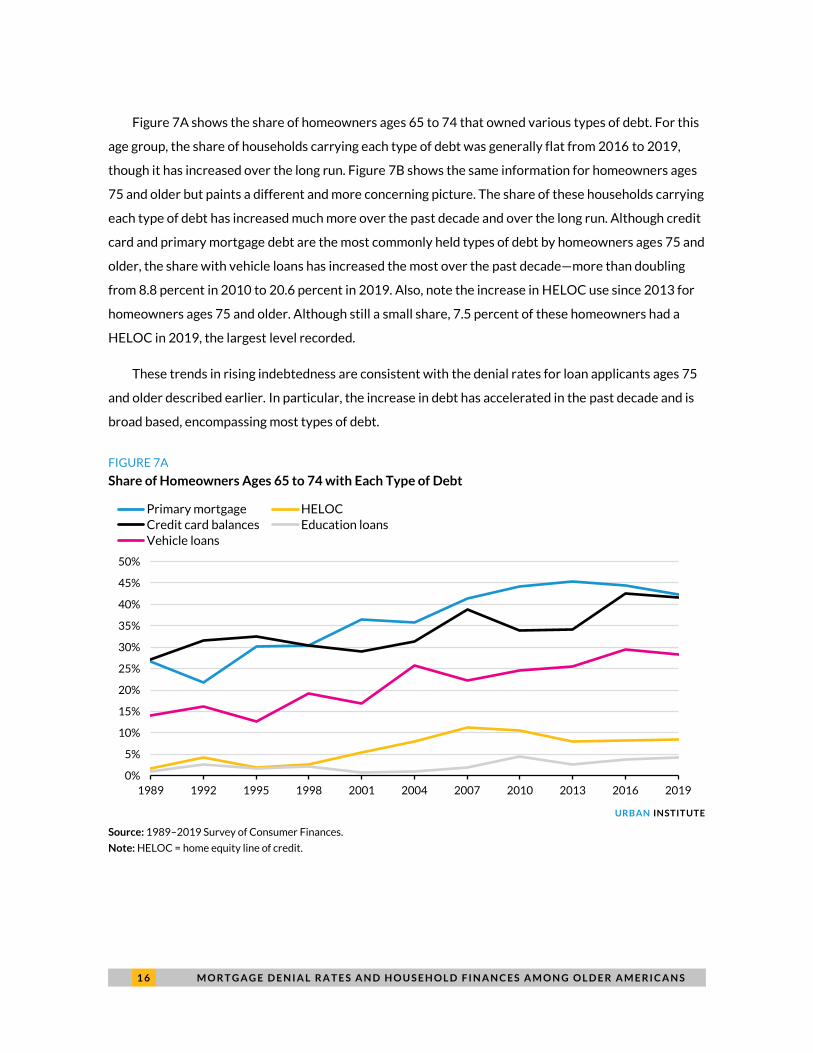
Figure 7A shows the share of homeowners ages 65 to 74 that owned various types of debt. For this
age group, the share of households carrying each type of debt was generally flat from 2016 to 2019,
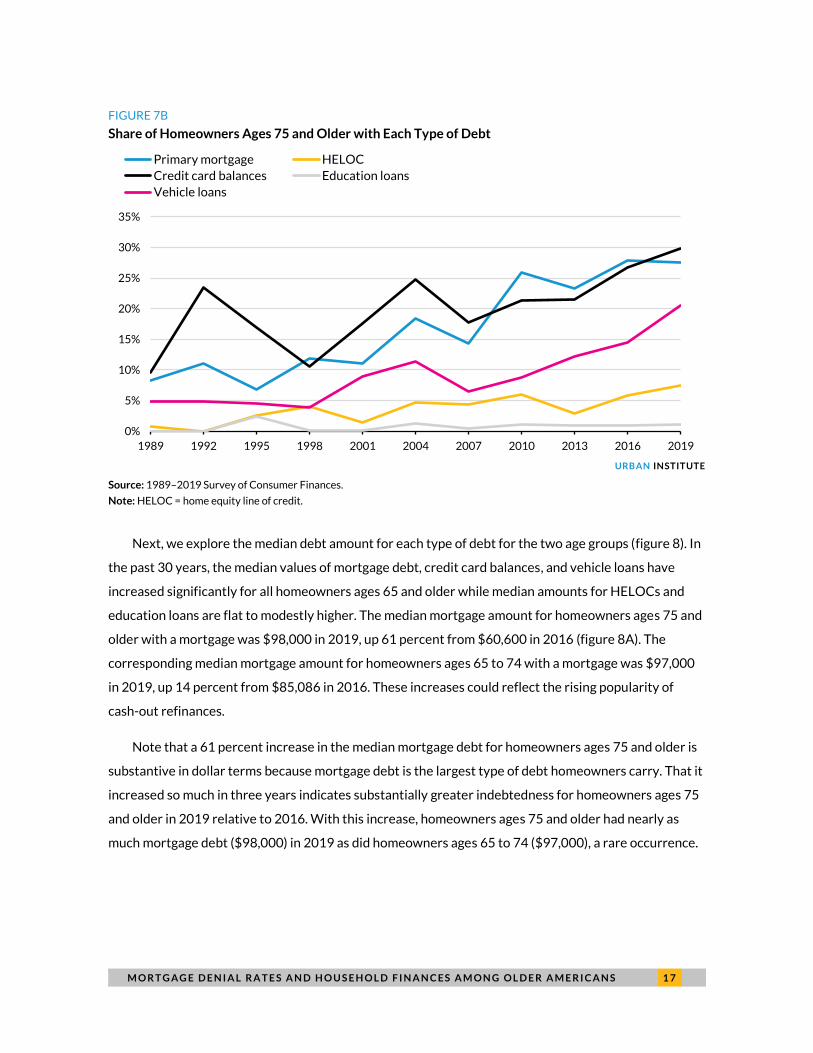
though it has increased over the long run. Figure 7B shows the same information for homeowners ages
75 and older but paints a different and more concerning picture. The share of these households carrying
each type of debt has increased much more over the past decade and over the long run. Although credit
card and primary mortgage debt are the most commonly held types of debt by homeowners ages 75 and
older, the share with vehicle loans has increased the most over the past decade—more than doubling
from 8.8 percent in 2010 to 20.6 percent in 2019. Also, note the increase in HELOC use since 2013 for
homeowners ages 75 and older. Although still a small share, 7.5 percent of these homeowners had a
HELOC in 2019, the largest level recorded.
These trends in rising indebtedness are consistent with the denial rates for loan applicants ages 75
and older described earlier. In particular, the increase in debt has accelerated in the past decade and is
broad based, encompassing most types of debt.
FIGURE 7A
Share of Homeowners Ages 65 to 74 with Each Type of Debt
URBAN INSTITUTE
Source: 1989–2019 Survey of Consumer Finances.
Note: HELOC = home equity line of credit.
0%
5%
10%
15%
20%
25%
30%
35%
40%
45%
50%
1989 1992 1995 1998 2001 2004 2007 2010 2013 2016 2019
Primary mortgage HELOC
Credit card balances Education loans
Vehicle loans
M O R T G A G E D E N I A L R A T E S A N D H O U S E H O L D F I N A N C E S A M O N G O L D E R A M E R I C A N S 1 7
FIGURE 7B
Share of Homeowners Ages 75 and Older with Each Type of Debt
URBAN INSTITUTE
Source: 1989–2019 Survey of Consumer Finances.
Note: HELOC = home equity line of credit.
Next, we explore the median debt amount for each type of debt for the two age groups (figure 8). In
the past 30 years, the median values of mortgage debt, credit card balances, and vehicle loans have
increased significantly for all homeowners ages 65 and older while median amounts for HELOCs and
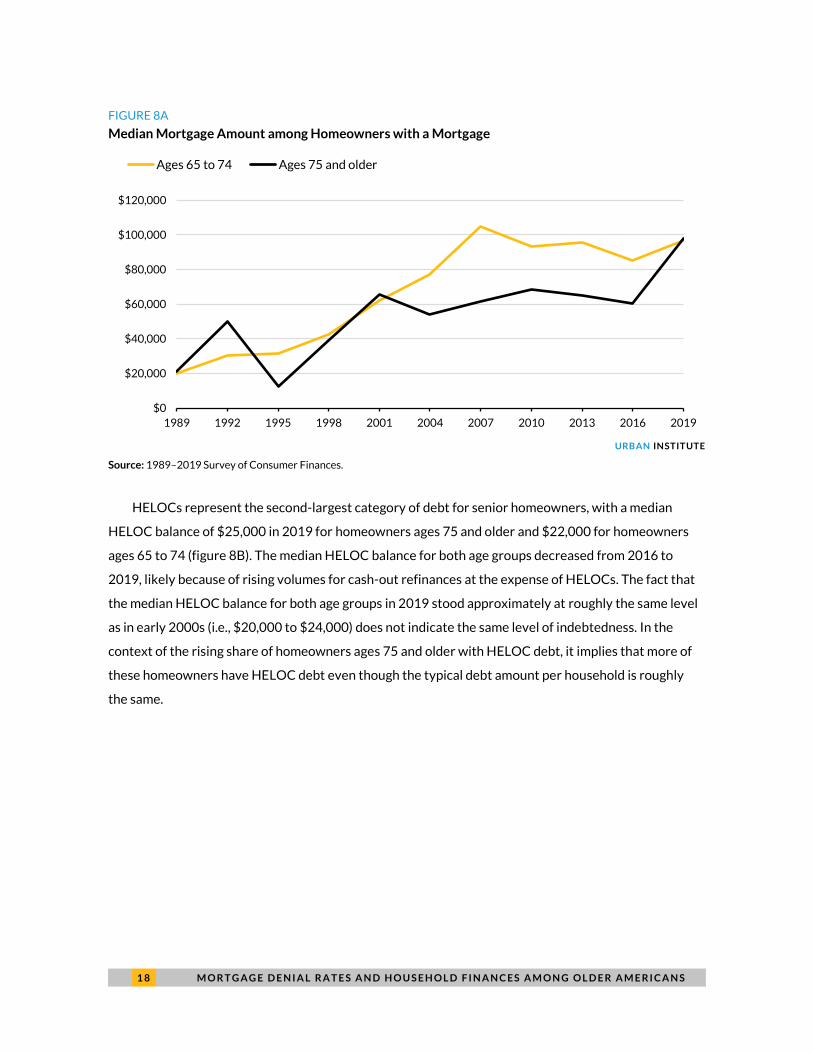
education loans are flat to modestly higher. The median mortgage amount for homeowners ages 75 and
older with a mortgage was $98,000 in 2019, up 61 percent from $60,600 in 2016 (figure 8A). The
corresponding median mortgage amount for homeowners ages 65 to 74 with a mortgage was $97,000
in 2019, up 14 percent from $85,086 in 2016. These increases could reflect the rising popularity of
cash-out refinances.
Note that a 61 percent increase in the median mortgage debt for homeowners ages 75 and older is
substantive in dollar terms because mortgage debt is the largest type of debt homeowners carry. That it
increased so much in three years indicates substantially greater indebtedness for homeowners ages 75
and older in 2019 relative to 2016. With this increase, homeowners ages 75 and older had nearly as
much mortgage debt ($98,000) in 2019 as did homeowners ages 65 to 74 ($97,000), a rare occurrence.
0%
5%
10%
15%
20%
25%
30%
35%
1989 1992 1995 1998 2001 2004 2007 2010 2013 2016 2019
Primary mortgage HELOC
Credit card balances Education loans
Vehicle loans
1 8 M O R T G A G E D E N I A L R A T E S A N D H O U S E H O L D F I N A N C E S A M O N G O L D E R A M E R I C A N S
FIGURE 8A
Median Mortgage Amount among Homeowners with a Mortgage
URBAN INSTITUTE
Source: 1989–2019 Survey of Consumer Finances.
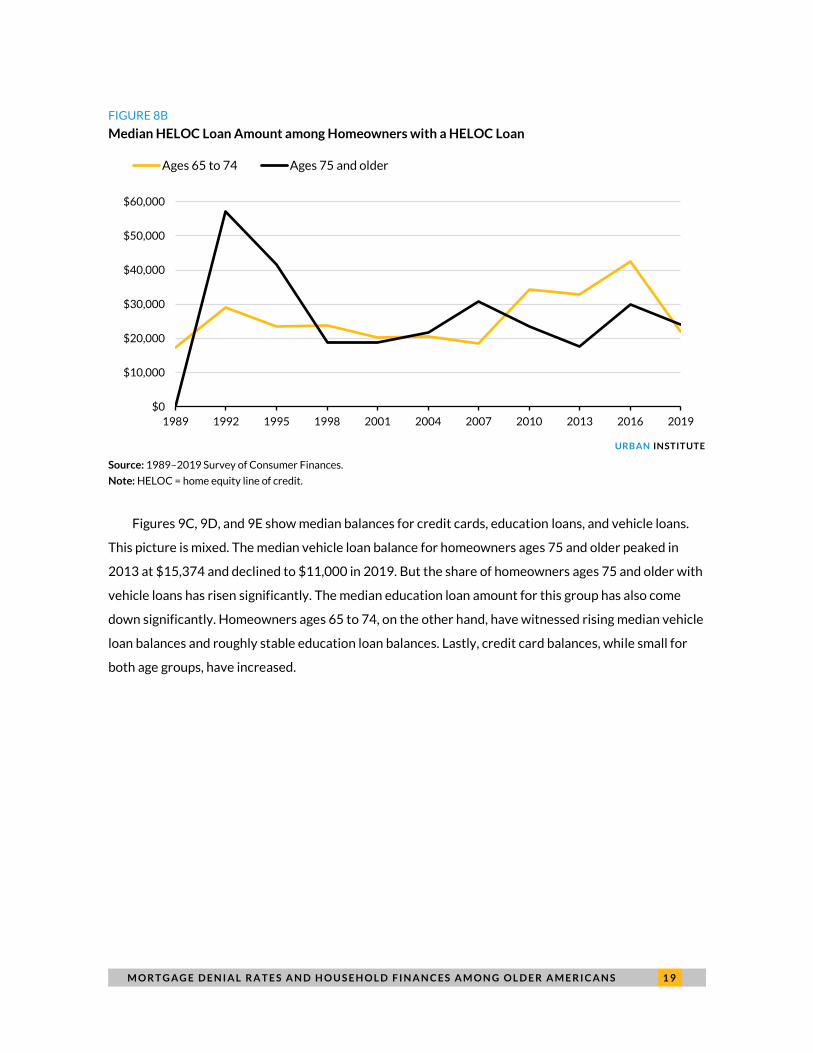
HELOCs represent the second-largest category of debt for senior homeowners, with a median
HELOC balance of $25,000 in 2019 for homeowners ages 75 and older and $22,000 for homeowners
ages 65 to 74 (figure 8B). The median HELOC balance for both age groups decreased from 2016 to
2019, likely because of rising volumes for cash-out refinances at the expense of HELOCs. The fact that
the median HELOC balance for both age groups in 2019 stood approximately at roughly the same level
as in early 2000s (i.e., $20,000 to $24,000) does not indicate the same level of indebtedness. In the
context of the rising share of homeowners ages 75 and older with HELOC debt, it implies that more of
these homeowners have HELOC debt even though the typical debt amount per household is roughly
the same.
$0
$20,000
$40,000
$60,000
$80,000
$100,000
$120,000
1989 1992 1995 1998 2001 2004 2007 2010 2013 2016 2019
Ages 65 to 74 Ages 75 and older
M O R T G A G E D E N I A L R A T E S A N D H O U S E H O L D F I N A N C E S A M O N G O L D E R A M E R I C A N S 1 9
FIGURE 8B
Median HELOC Loan Amount among Homeowners with a HELOC Loan
URBAN INSTITUTE
Source: 1989–2019 Survey of Consumer Finances.
Note: HELOC = home equity line of credit.
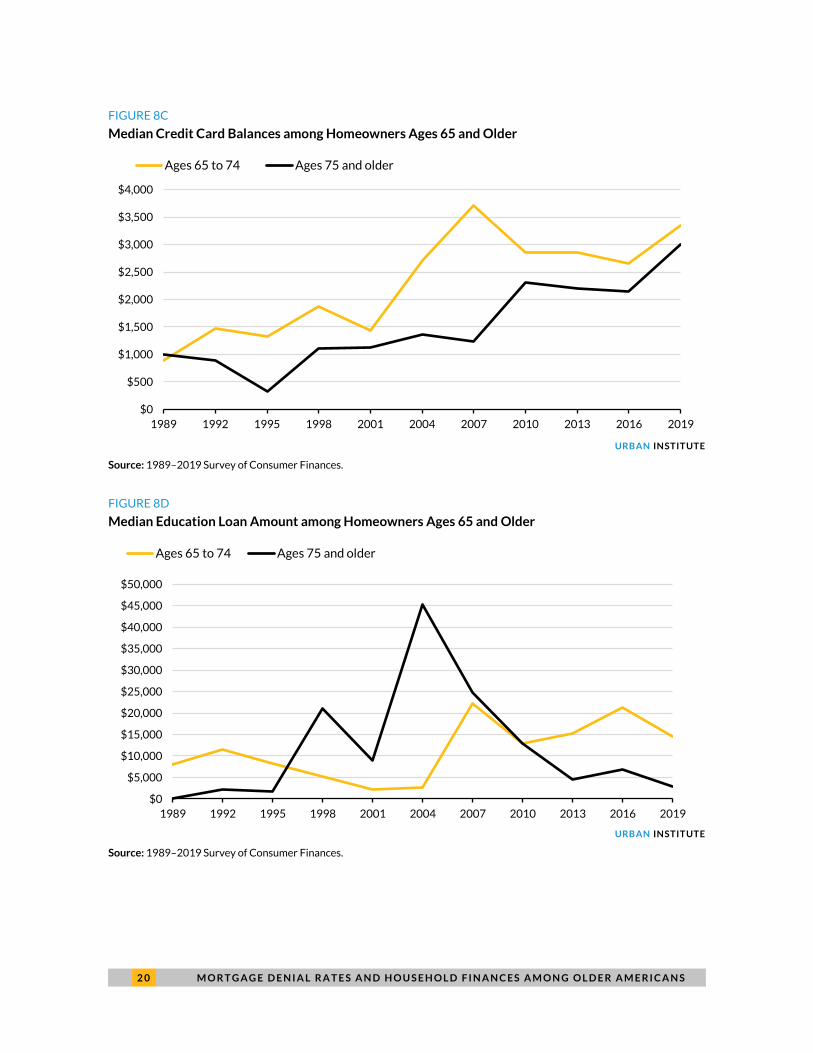
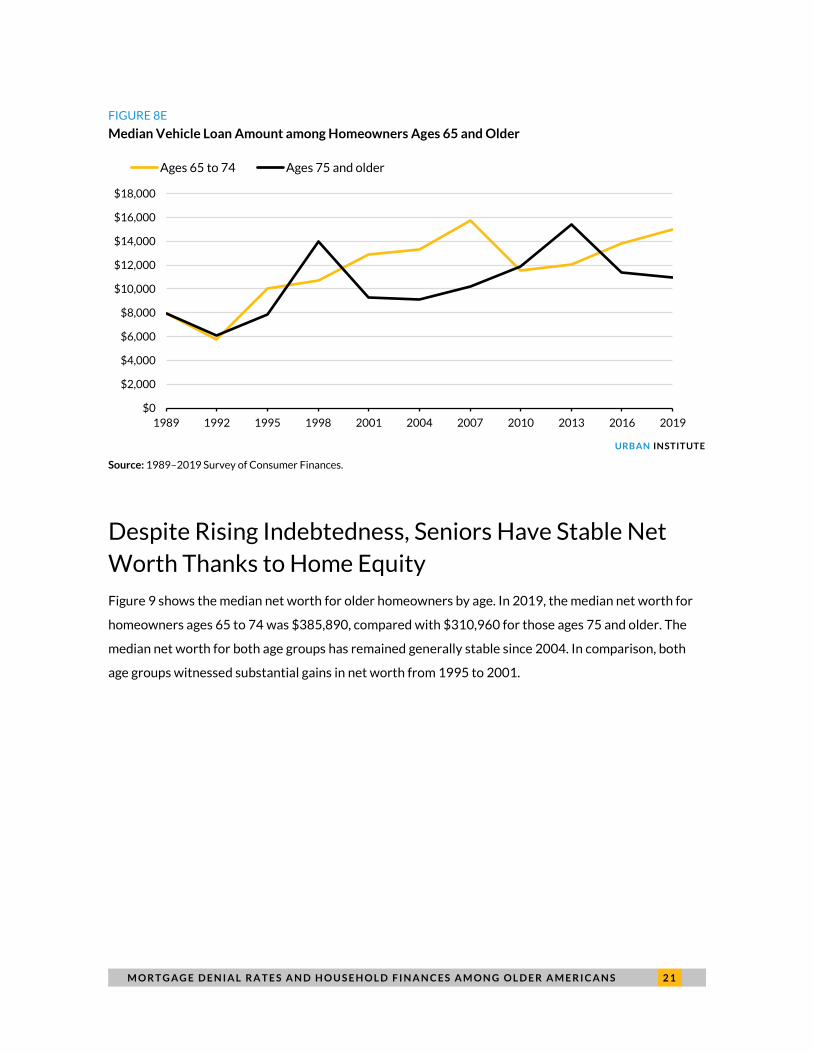
Figures 9C, 9D, and 9E show median balances for credit cards, education loans, and vehicle loans.
This picture is mixed. The median vehicle loan balance for homeowners ages 75 and older peaked in
2013 at $15,374 and declined to $11,000 in 2019. But the share of homeowners ages 75 and older with
vehicle loans has risen significantly. The median education loan amount for this group has also come
down significantly. Homeowners ages 65 to 74, on the other hand, have witnessed rising median vehicle
loan balances and roughly stable education loan balances. Lastly, credit card balances, while small for
both age groups, have increased.
$0
$10,000
$20,000
$30,000
$40,000
$50,000
$60,000
1989 1992 1995 1998 2001 2004 2007 2010 2013 2016 2019
Ages 65 to 74 Ages 75 and older
2 0 M O R T G A G E D E N I A L R A T E S A N D H O U S E H O L D F I N A N C E S A M O N G O L D E R A M E R I C A N S
FIGURE 8C
Median Credit Card Balances among Homeowners Ages 65 and Older
URBAN INSTITUTE
Source: 1989–2019 Survey of Consumer Finances.
FIGURE 8D
Median Education Loan Amount among Homeowners Ages 65 and Older
URBAN INSTITUTE
Source: 1989–2019 Survey of Consumer Finances.
$0
$500
$1,000
$1,500
$2,000
$2,500
$3,000
$3,500
$4,000
1989 1992 1995 1998 2001 2004 2007 2010 2013 2016 2019
Ages 65 to 74 Ages 75 and older
$0
$5,000
$10,000
$15,000
$20,000
$25,000
$30,000
$35,000
$40,000
$45,000
$50,000
1989 1992 1995 1998 2001 2004 2007 2010 2013 2016 2019
Ages 65 to 74 Ages 75 and older
M O R T G A G E D E N I A L R A T E S A N D H O U S E H O L D F I N A N C E S A M O N G O L D E R A M E R I C A N S 2 1
FIGURE 8E
Median Vehicle Loan Amount among Homeowners Ages 65 and Older
URBAN INSTITUTE
Source: 1989–2019 Survey of Consumer Finances.
Despite Rising Indebtedness, Seniors Have Stable Net
Worth Thanks to Home Equity
Figure 9 shows the median net worth for older homeowners by age. In 2019, the median net worth for
homeowners ages 65 to 74 was $385,890, compared with $310,960 for those ages 75 and older. The
median net worth for both age groups has remained generally stable since 2004. In comparison, both
age groups witnessed substantial gains in net worth from 1995 to 2001.
$0
$2,000
$4,000
$6,000
$8,000
$10,000
$12,000
$14,000
$16,000
$18,000
1989 1992 1995 1998 2001 2004 2007 2010 2013 2016 2019
Ages 65 to 74 Ages 75 and older

2 2 M O R T G A G E D E N I A L R A T E S A N D H O U S E H O L D F I N A N C E S A M O N G O L D E R A M E R I C A N S
FIGURE 9A
Median Net Worth among Homeowners
URBAN INSTITUTE
Source: 1989–2019 Survey of Consumer Finances.
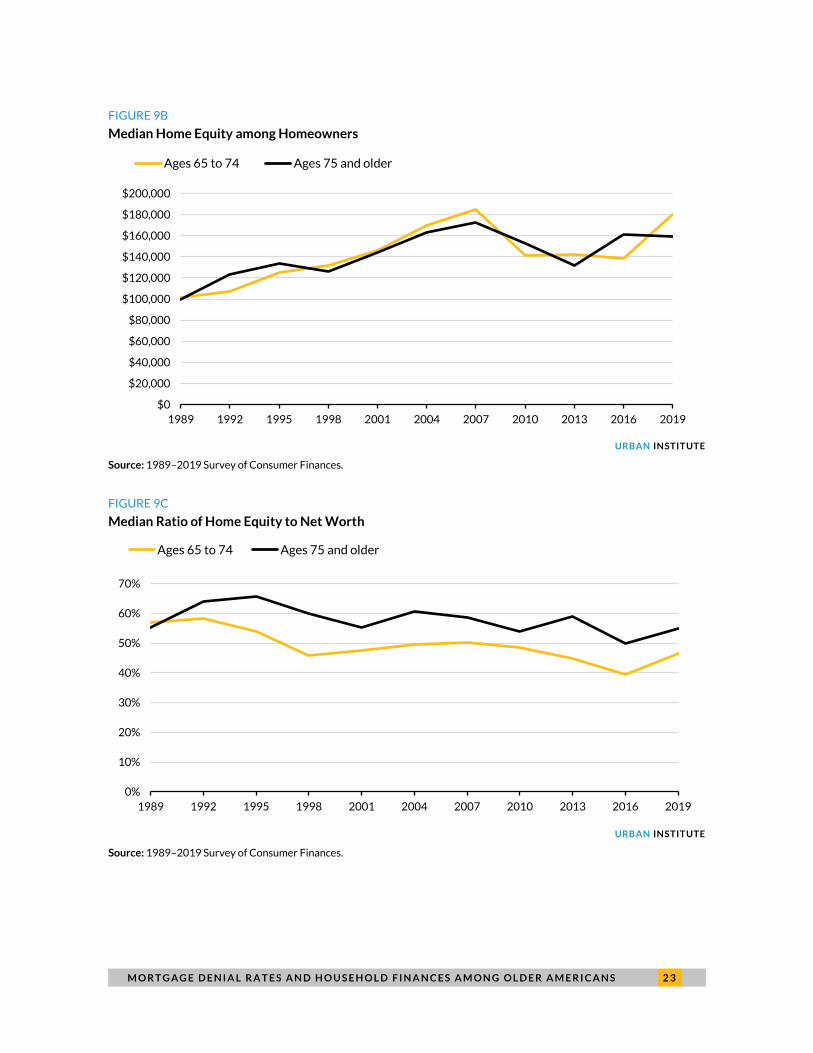
The predominant source of net worth among senior homeowners is home equity. In 2019, the
median home equity was $180,000 for homeowners ages 65 to 74 and $159,000 for homeowners ages
75 and older (figure 9B). These numbers have declined slightly since 2007, even though nationwide
home prices now exceed the housing bubble–era peak levels. Figure 9C shows that home equity
composed 55 percent of total net worth for homeowners ages 75 and older and 46 percent of net worth
for those ages 65 to 74. That said, notice the long-term decline in the home equity share of total net
worth for both age groups. This is driven predominantly by rising median amounts of primary mortgage
debt and the rising share of households ages 65 and older carrying mortgage debt.
$0
$50,000
$100,000
$150,000
$200,000
$250,000
$300,000
$350,000
$400,000
$450,000
1989 1992 1995 1998 2001 2004 2007 2010 2013 2016 2019
Ages 65 to 74 Ages 75 and older
M O R T G A G E D E N I A L R A T E S A N D H O U S E H O L D F I N A N C E S A M O N G O L D E R A M E R I C A N S 2 3
FIGURE 9B
Median Home Equity among Homeowners
URBAN INSTITUTE
Source: 1989–2019 Survey of Consumer Finances.
FIGURE 9C
Median Ratio of Home Equity to Net Worth
URBAN INSTITUTE
Source: 1989–2019 Survey of Consumer Finances.
$0
$20,000
$40,000
$60,000
$80,000
$100,000
$120,000
$140,000
$160,000
$180,000
$200,000
1989 1992 1995 1998 2001 2004 2007 2010 2013 2016 2019
Ages 65 to 74 Ages 75 and older
0%
10%
20%
30%
40%
50%
60%
70%
1989 1992 1995 1998 2001 2004 2007 2010 2013 2016 2019
Ages 65 to 74 Ages 75 and older

2 4 M O R T G A G E D E N I A L R A T E S A N D H O U S E H O L D F I N A N C E S A M O N G O L D E R A M E R I C A N S
Finally, we turn to the second-largest component of older homeowners’ net worth: financial
wealth.8 Figure 10A shows that in 2019, financial wealth composed 27.0 percent and 28.8 percent of
total net worth, respectively, for homeowners ages 75 and older and homeowners ages 65 to 74.
FIGURE 10A
Median Ratio of Financial Wealth to Net Worth, by Age
URBAN INSTITUTE
Source: 1989–2019 Survey of Consumer Finances.
Figure 10B shows that in 2019, homeowners ages 65 to 74 had a higher median value of financial
wealth ($104,000) than homeowners ages 75 and older ($73,531). These numbers are volatile, likely
reflecting changes in market values of retirement savings held in investment accounts. Unlike median
values of home equity, which are similar for the two age groups, homeowners ages 75 and older have
had consistently less financial wealth than homeowners ages 65 to 74 over time. This reflects
drawdowns from retirement savings with age and lack of new contributions to retirement accounts.
Also note that median value of home equity dwarfs the median value of financial assets (Bhutta et al.
2020).
0%
5%
10%
15%
20%
25%
30%
35%
40%
1989 1992 1995 1998 2001 2004 2007 2010 2013 2016 2019
Ages 65 to 74 Ages 75 and older

M O R T G A G E D E N I A L R A T E S A N D H O U S E H O L D F I N A N C E S A M O N G O L D E R A M E R I C A N S 2 5
FIGURE 10B
Median Financial Wealth for Homeowners, by Age
URBAN INSTITUTE
Source: 1989–2019 Survey of Consumer Finances.
Together with home equity, financial wealth accounts for roughly three-quarters of median net
worth for seniors ages 65 and older. Home equity alone accounts for almost half the net worth (figure
9C). But this share is even higher for older homeowners with limited financial wealth (table 2). Home
equity composed 90.5 percent of net worth for homeowners ages 65 and older that owned less than
$3,000 in financial wealth, 63.7 percent for those who owned $20,000 to $50,000 in financial wealth,
and just 25.2 percent for those who owned over $100,000 in financial wealth. This suggests substantial
potential for low-wealth households to use home equity improve their financial security.
TABLE 2
Ratio of Home Equity to Net Worth, by Financial Wealth
Financial wealth Median ratio of home
equity to net worth
≤ $3,000 90.5% $3,000–20,000 72.5% $20,000–50,000 63.7% $50,000–100,000 51.9% > $100,000 25.2%
Source: 1989–2019 Survey of Consumer Finances.
$0
$20,000
$40,000
$60,000
$80,000
$100,000
$120,000
$140,000
1989 1992 1995 1998 2001 2004 2007 2010 2013 2016 2019
Ages 65 to 74 Ages 75 and older
2 6 M O R T G A G E D E N I A L R A T E S A N D H O U S E H O L D F I N A N C E S A M O N G O L D E R A M E R I C A N S
3. Conclusion In this report, we have established several facts about older homeowners. Most important of these are
the rising levels of median debt, especially primary mortgage debt, and the rising share of senior
homeowners that carries debt. The increase in debt load is particularly acute for homeowners ages 75
and older and spans nearly all debt types, with primary mortgages being the main driver in absolute
dollar terms.
Rising debt levels will have adverse long-term consequences for these households. One of these
consequences is already playing out in the form of higher DTI ratios and rising denial rates with age, as
lenders perceive these applicants to be riskier. The extent of the problem has been somewhat masked in
recent years by ultra-low interest rates, which have temporarily pushed applicant DTI ratios and denial
rates lower for cash-out refinances, the dominant equity extraction vehicle in the past three years. But
once interest rates rise, so will DTI ratios and denial rates. This dynamic will not serve older
homeowners well. In the long run, older homeowners, with limited incomes and substantial home
equity, would benefit from having better access to financial products such as reverse mortgages, whose
underwriting is less dependent on applicant incomes and debt and more dependent on the value of
assets, homeowner equity, and net worth.

N O T E S 2 7
Notes1 National Reverse Mortgage Lenders Association, “Senior Housing Wealth Exceeds Record $9.2 Trillion
Q12021,” press release, July 23, 2021, https://www.nrmlaonline.org/about/press-releases/senior-housing-
wealth-exceeds-record-9-2trillion.
2 We excluded incomplete applications, withdrawn applications, and purchase loans from the denial rate
calculation.
3 Age information has been available in HMDA data only since 2018.
4 First-lien mortgages for one-to-four-family owner-occupied homes. We excluded loans with missing age,
income, loan-to-value ratio, and DTI ratio information.
5 Andrew Keshner, “Older Americans Had a 40-Point Drop in Their Credit Score in the 10 Years Since the Great
Recession,” MarketWatch, June 8, 2019, https://www.marketwatch.com/story/these-americans-had-a-40-
point-drop-in-their-credit-score-after-the-great-recession-and-its-yet-to-recover-2019-05-24.
6 Installment loans include education loans, vehicle loans, and other installment loans. We follow the Federal
Reserve’s definition of asset and debt categories. See Federal Reserve (n.d.).
7 All SCF dollar amounts are inflation adjusted, with prior years translated to 2019 dollars.
8 Financial wealth is defined as total financial assets (i.e., retirement account balances, certificates of deposit,
stocks and bonds, pooled investments, and transaction account balances) minus the summation of education
loans, credit card balances, and other nonhousing debt.
2 8 R E F E R E N C E S
References Bhutta, Neil, Jesse Bricker, Andrew C. Chang, Lisa J. Dettling, Sarena Goodman, Joanne W. Hsu, Kevin B. Moore,
Sarah Reber, Alice Henriques Volz, and Richard A. Windle. 2020. Changes in U.S. Family Finances from 2016 to
2019: Evidence from the Survey of Consumer Finances. Washington, DC: Board of Governors of the Federal
Reserve System.
Federal Reserve. n.d. “Definition of SCF Bulletin Asset and Debt Categories in Calculation of Net Worth.”
Washington, DC: Board of Governors of the Federal Reserve.
Kaul, Karan, and Laurie Goodman. 2017. Seniors’ Access to Home Equity: Identifying Existing Mechanisms and
Impediments to Broader Adoption. Washington, DC: Urban Institute.
Moulton, Stephanie, Samuel Dodini, Donald R. Haurin, and Maximilian D. Schmeiser. 2016. “Seniors’ Home Equity
Extraction: Credit Constraints and Borrowing Channels.” New York: SSRN.
A B O U T T H E A U T H O R S 2 9
About the Authors
Karan Kaul is a senior research associate in the Housing Finance Policy Center at the Urban Institute.
He publishes innovative, data-driven research on complex, high-impact policy issues to improve the US
mortgage finance system. A strategic thinker and thought leader with nearly 10 years of experience in
mortgage capital markets, Kaul has published nearly 100 research articles on such topics as mortgage
servicing reforms, efficient access to credit, benefits of alternative credit data and scoring models, and
single-family rentals. He has advocated for efficient industry practices, regulation, and legislation to
make the mortgage market work better for all Americans. Kaul is the lead researcher on the Mortgage
Servicing Collaborative and regularly speaks at housing conferences. Before joining Urban, he spent five
years at Freddie Mac as a senior strategist analyzing the business impact of postcrisis regulatory
reforms. He holds a bachelor’s degree in electrical engineering and a master’s degree in business
administration from the University of Maryland, College Park.
Linna Zhu is a research associate with the Housing Finance Policy Center. Her research centers on
housing economics, aging, and real estate finance. Zhu holds a BA in economics from Renmin University
of China, an MS in finance from Johns Hopkins University, and a PhD in public policy and management
from the University of Southern California.

ST A T E M E N T O F I N D E P E N D E N C E
The Urban Institute strives to meet the highest standards of integrity and quality in its research and analyses and in
the evidence-based policy recommendations offered by its researchers and experts. We believe that operating
consistent with the values of independence, rigor, and transparency is essential to maintaining those standards. As
an organization, the Urban Institute does not take positions on issues, but it does empower and support its experts
in sharing their own evidence-based views and policy recommendations that have been shaped by scholarship.
Funders do not determine our research findings or the insights and recommendations of our experts. Urban
scholars and experts are expected to be objective and follow the evidence wherever it may lead.

500 L’Enfant Plaza SW
Washington, DC 20024
www.urban.org