Embed Size (px)
Citation preview
1
Mortgage Default, Foreclosures and Bankruptcy
Wenli Li Federal Reserve Bank of Philadelphia
Michelle J. White
University of California, San Diego, and NBER
Preliminary draft, August 15, 2009
This draft, October 15, 2009
2
I. Introduction
The financial crisis of 2008 and the current recession were triggered by the bursting of the
housing bubble and the subprime mortgage crisis that began in late 2006/early 2007. In this
paper, we investigate whether personal bankruptcy law also played a role in creating the
mortgage crisis or in making it worse. In particular, we show that there is a strong and
previously unnoticed relationship between homeowners’ decisions to default on their mortgages
and their decisions to file for bankruptcy. In theory, bankruptcy and default could be either
substitutes or complements. They would be substitutes if homeowners use bankruptcy to save
their homes, assuming that they succeed in avoiding default. Alternately, they would be
complements if homeowners use bankruptcy to reduce the cost of defaulting on their mortgages,
in which case they would be observed to do both or neither. In fact we show that the
bankruptcy/default relationship is complementary for most homeowners. We also show that the
relationship between foreclosure and bankruptcy is also complementary. But we find that
homeowners responded to the 2005 bankruptcy reform by treating bankruptcy as a substitute for
default and foreclosure.
The paper argues that these relationships have important public policy implications. In
particular, foreclosures have very high social costs, and some of these costs are external to both
borrowers and lenders. As a result, there is a social gain from discouraging bankruptcy filings,
since fewer bankruptcies would also mean fewer defaults and foreclosures. We show that these
considerations shift optimal bankruptcy law in a pro-creditor direction and shift other policies
that affect the number of bankruptcy filings in a pro-debtor direction.
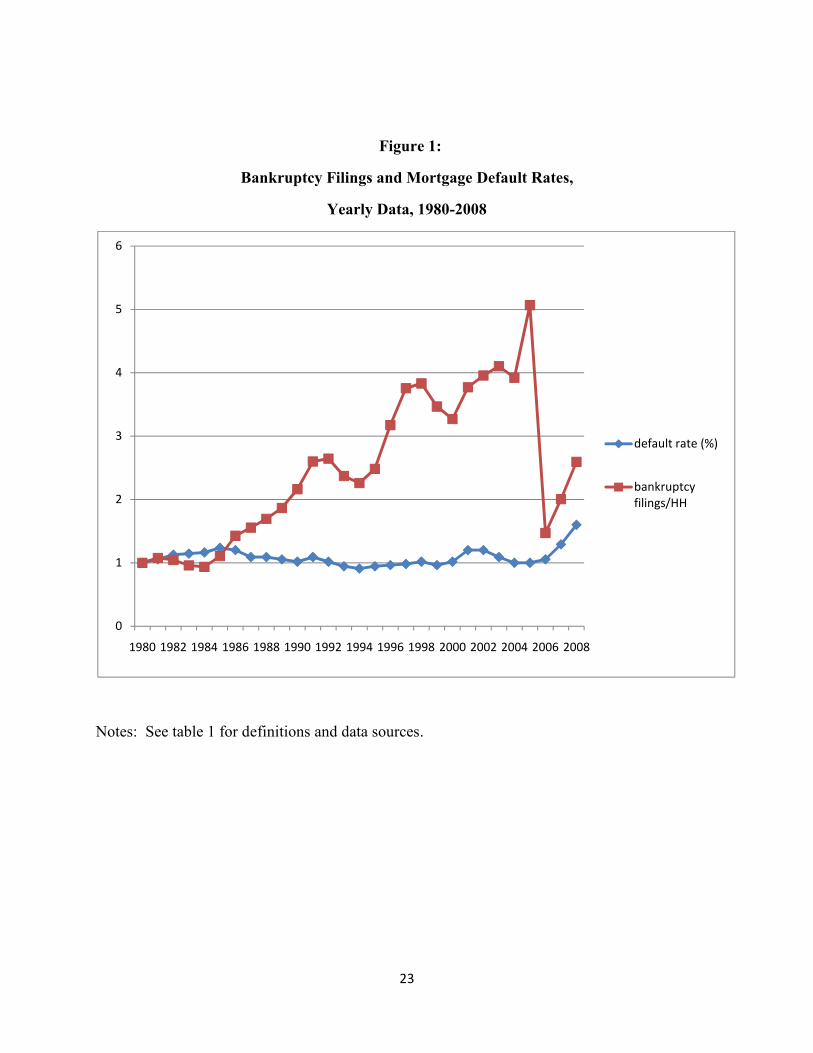
To give some background on why the bankruptcy/mortgage default relationship has not been
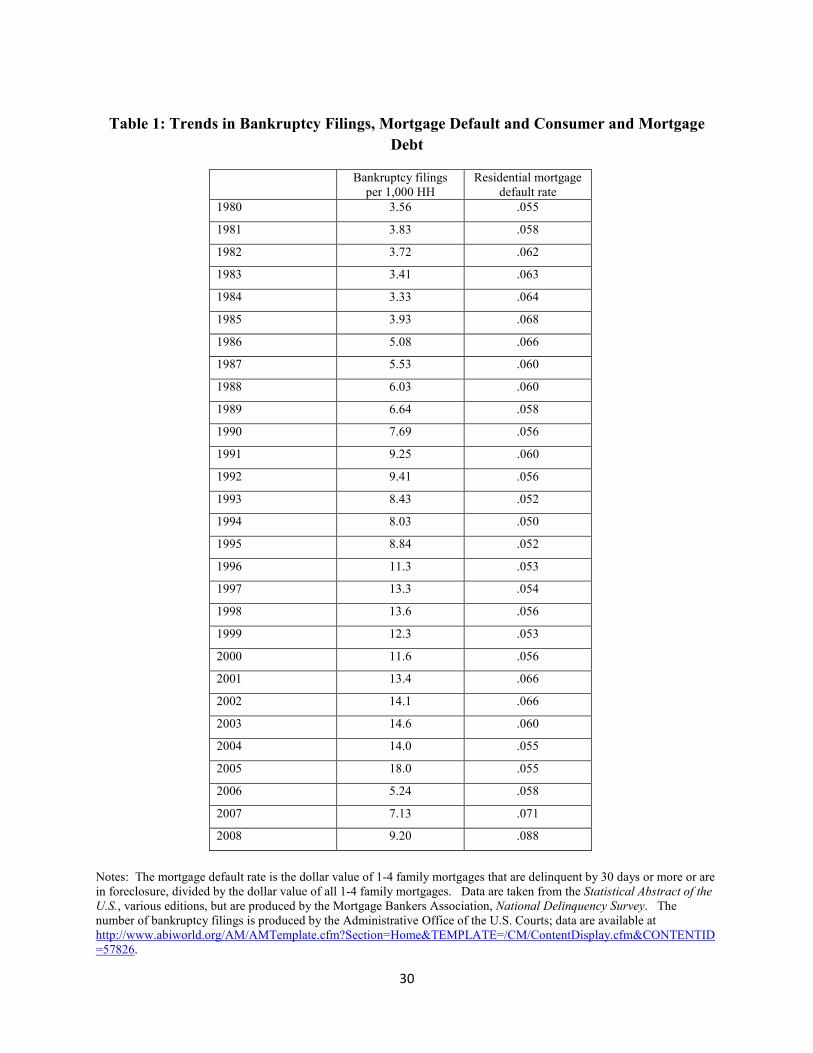
recognized, figure 1 shows the bankruptcy filing and mortgage default rates from 1980 to 2008.
Both are scaled to equal one in 1980. The diagram suggests that the mortgage default rate was
fairly steady over the period—the fraction of mortgage debt that defaulted was around 5% in the
1980s, dropped to 4.5% in the 1990s and early 2000s, and did not begin rising until 2007. In
contrast, the bankruptcy filing rate has risen steadily: between 1980 and 2004, it increased from
3.5 to 14 per 1,000 households. A major bankruptcy reform went into effect in late 2005 that
made bankruptcy law more pro-creditor and the filing rate responded by jumping to 18 per 1,000
3
households in 2005, as debtors rushed to file under the old rules. It then dropped sharply to 5.2
in 2006, but since then has resumed its upward trend in 2007, rising to 9.2 per 1,000 households
in 2008. 1 If we run a regression explaining the bankruptcy filing rate as a function of the
mortgage default rate, the coefficient of the default rate is negative and not statistically
significant. Thus aggregate data over a long time period suggest little relationship between
bankruptcy and mortgage default.
But the picture changes if we examine micro data over a more recent time period. We use
the LPS data, a large dataset of mortgages that are followed every month. Our sample consists
of prime and subprime mortgages that originated in 2004 or 2005 and are followed monthly from
origin until they are paid off, go into foreclosure, or until the end of our sample period in October
2008. 2 Mortgage default is defined to occur when homeowners are delinquent on their
payments by one month or more. We also know when homeowners file for bankruptcy and
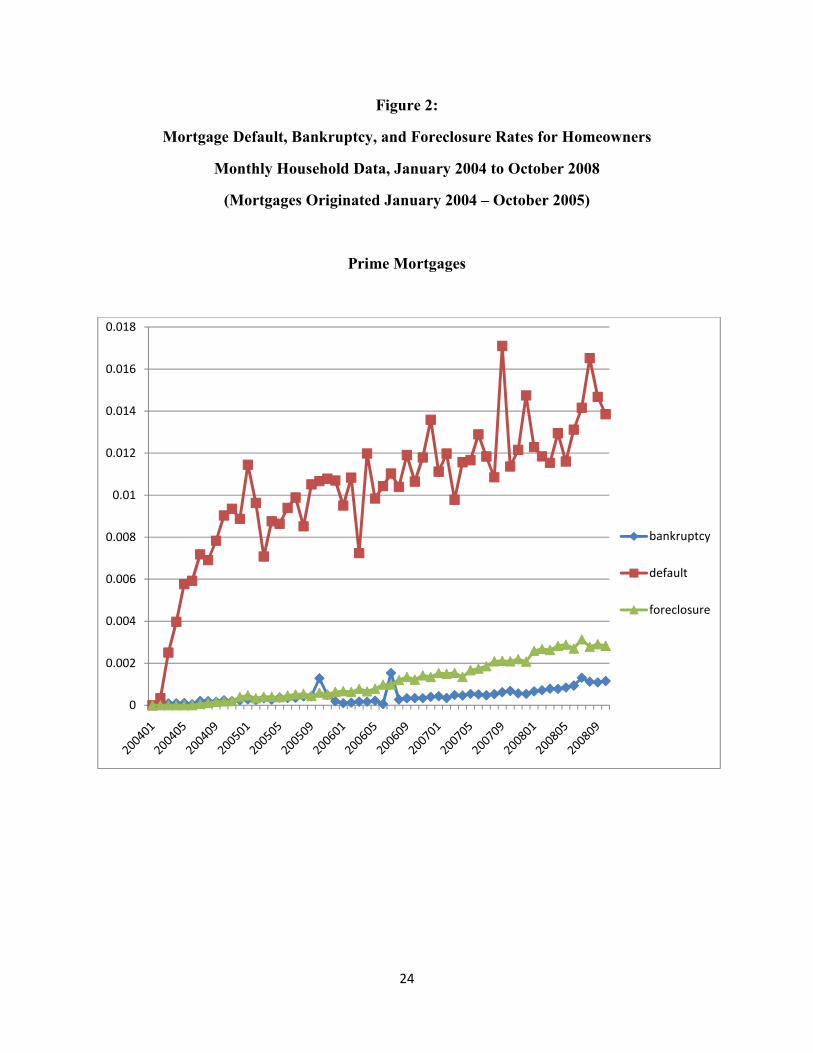
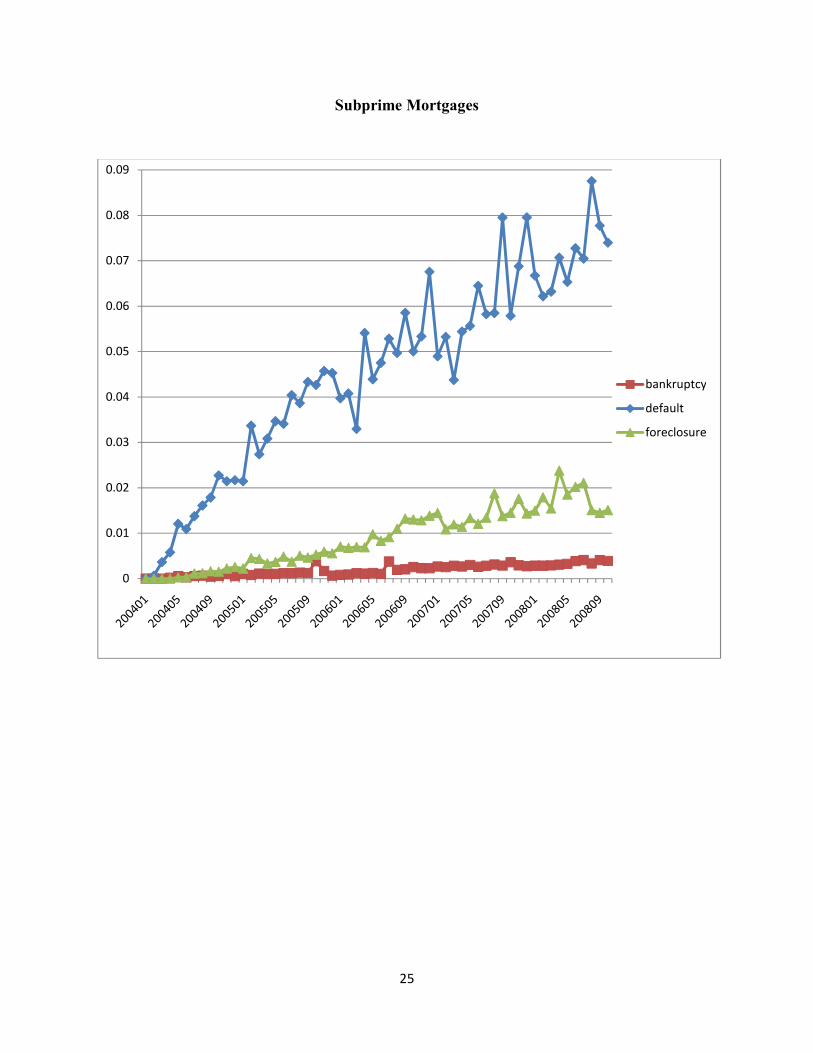
when lenders begin the foreclosure process. Figure 2 shows monthly default rates, foreclosure
rates, and bankruptcy filing rates, with prime and subprime mortgages shown separately. The
period covered includes both the October 2005 bankruptcy reform and the start of the mortgage
crisis. Using this data, the correlation coefficients between bankruptcy and mortgage default
and between bankruptcy and foreclosure are .62 and .87, respectively. For subprime mortgages,
the correlations are .86 and .87, respectively. Thus recent data suggest that homeowners’ default
and bankruptcy decisions are closely related and that homeowners’ bankruptcy decisions are
closely related to the start of foreclosure.
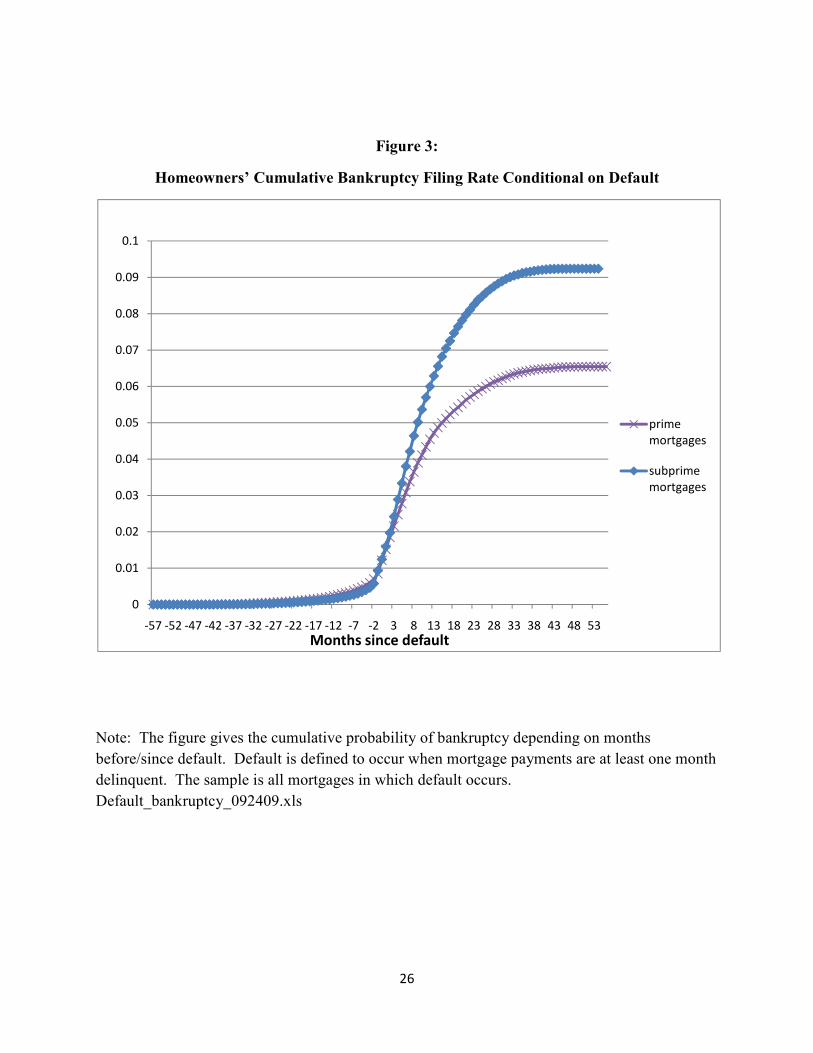
To examine these relationships further, consider the timing of homeowners’ bankruptcy
decisions relative to when they default. For all homeowners in the sample who default, we set
the month of default to zero and calculate the cumulative probability that homeowners file for
bankruptcy each month before and after default. The results are shown in figure 3, with separate
curves for prime and subprime mortgages. Homeowners tend to file for bankruptcy after they
default rather than before, with most homeowners filing within a year after default. Eventually,
1 Table 1 gives these data and data sources. We have not been able to locate any historical data on foreclosures. 2 If homeowners default, then become current and then default again, we include both defaults for purposes of computing the average monthly default rates.
4
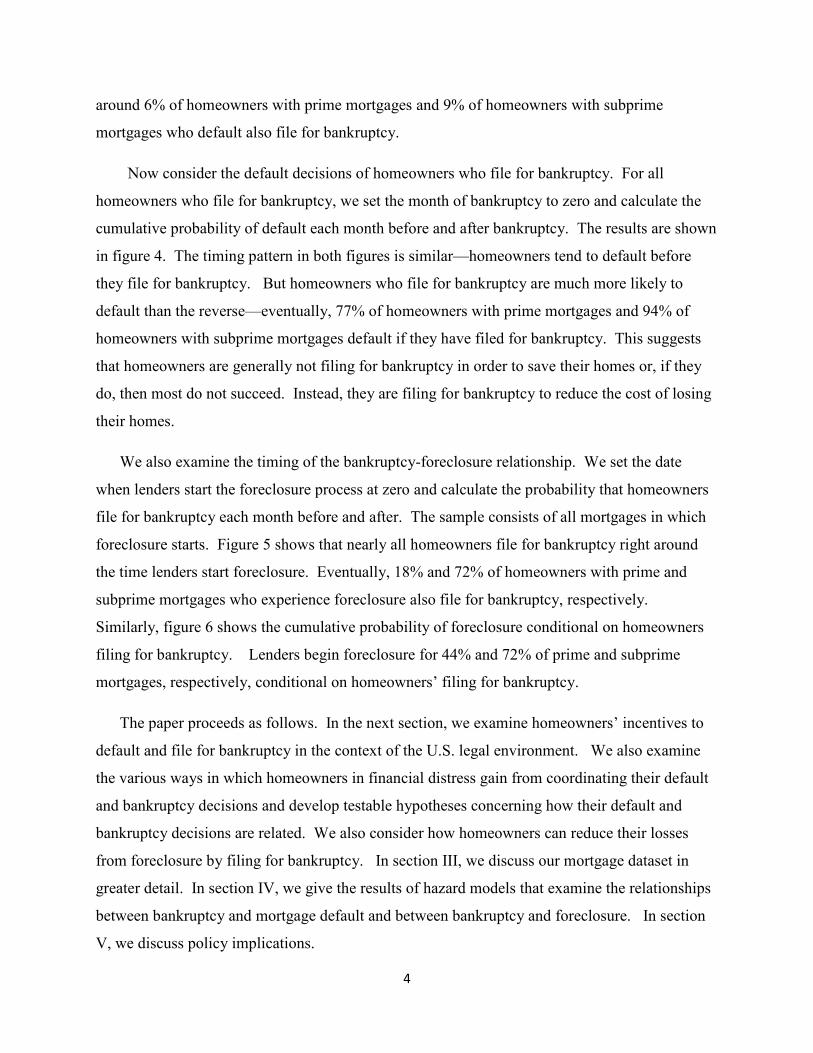
around 6% of homeowners with prime mortgages and 9% of homeowners with subprime
mortgages who default also file for bankruptcy.
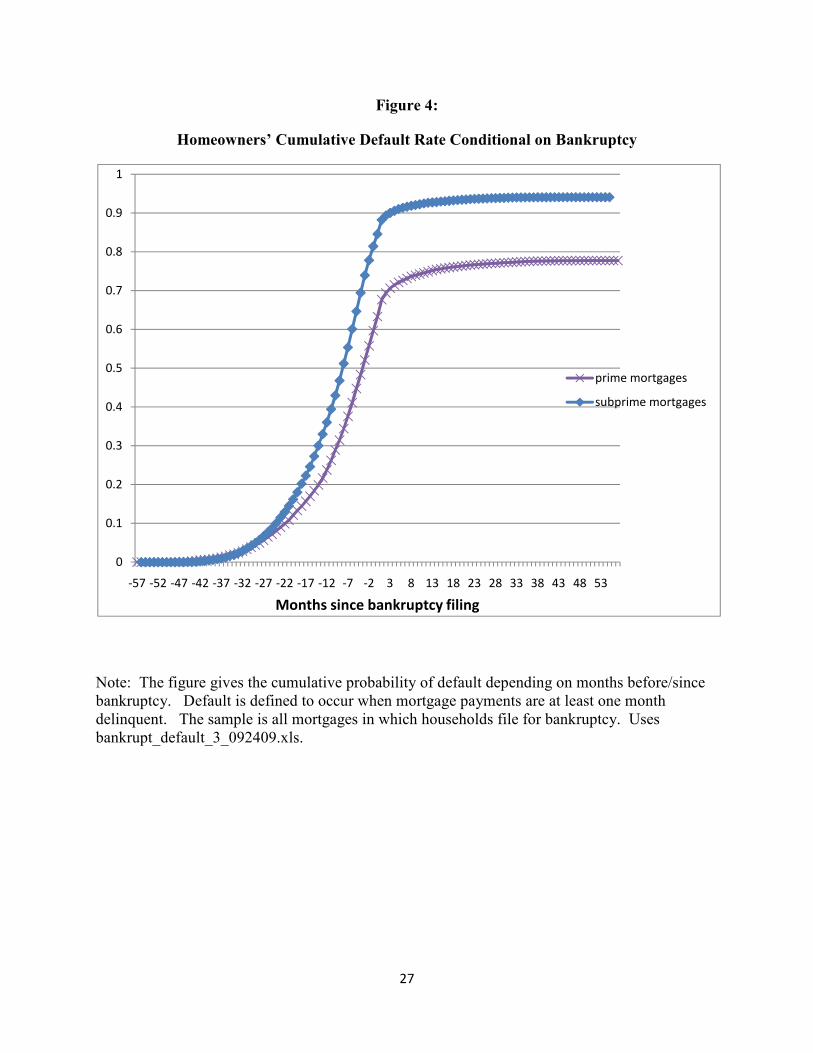
Now consider the default decisions of homeowners who file for bankruptcy. For all
homeowners who file for bankruptcy, we set the month of bankruptcy to zero and calculate the
cumulative probability of default each month before and after bankruptcy. The results are shown
in figure 4. The timing pattern in both figures is similar—homeowners tend to default before
they file for bankruptcy. But homeowners who file for bankruptcy are much more likely to
default than the reverse—eventually, 77% of homeowners with prime mortgages and 94% of
homeowners with subprime mortgages default if they have filed for bankruptcy. This suggests
that homeowners are generally not filing for bankruptcy in order to save their homes or, if they
do, then most do not succeed. Instead, they are filing for bankruptcy to reduce the cost of losing
their homes.
We also examine the timing of the bankruptcy-foreclosure relationship. We set the date
when lenders start the foreclosure process at zero and calculate the probability that homeowners
file for bankruptcy each month before and after. The sample consists of all mortgages in which
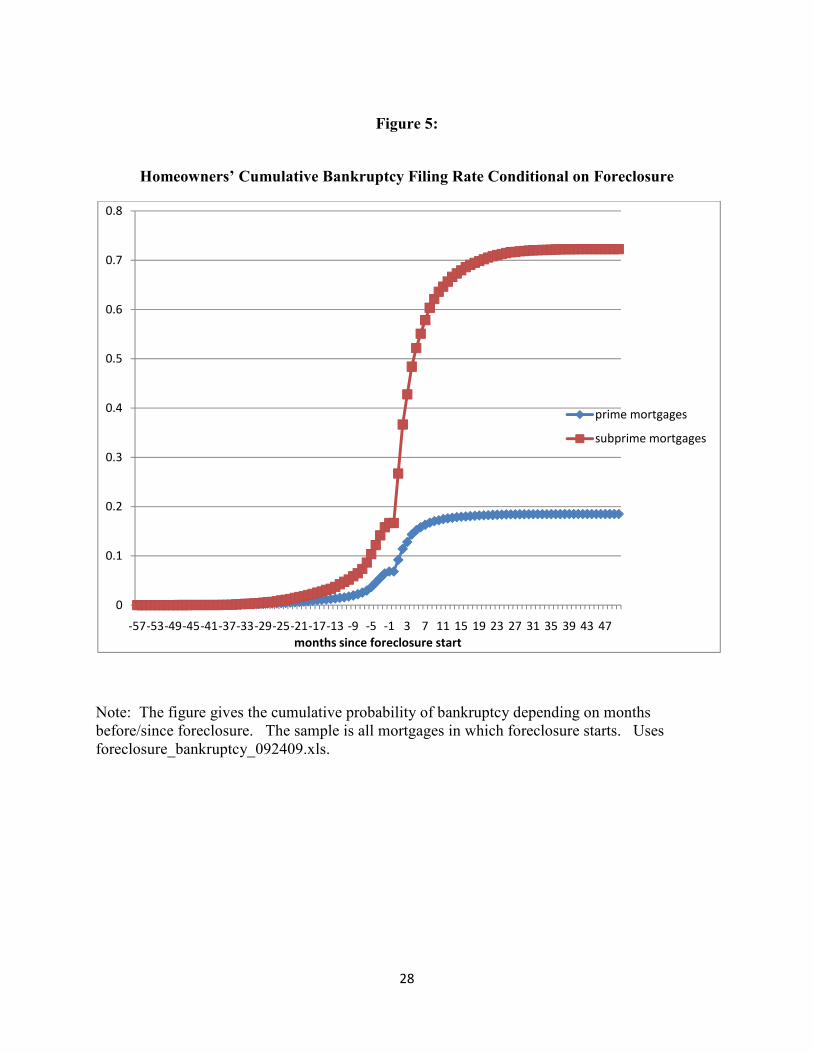
foreclosure starts. Figure 5 shows that nearly all homeowners file for bankruptcy right around
the time lenders start foreclosure. Eventually, 18% and 72% of homeowners with prime and
subprime mortgages who experience foreclosure also file for bankruptcy, respectively.
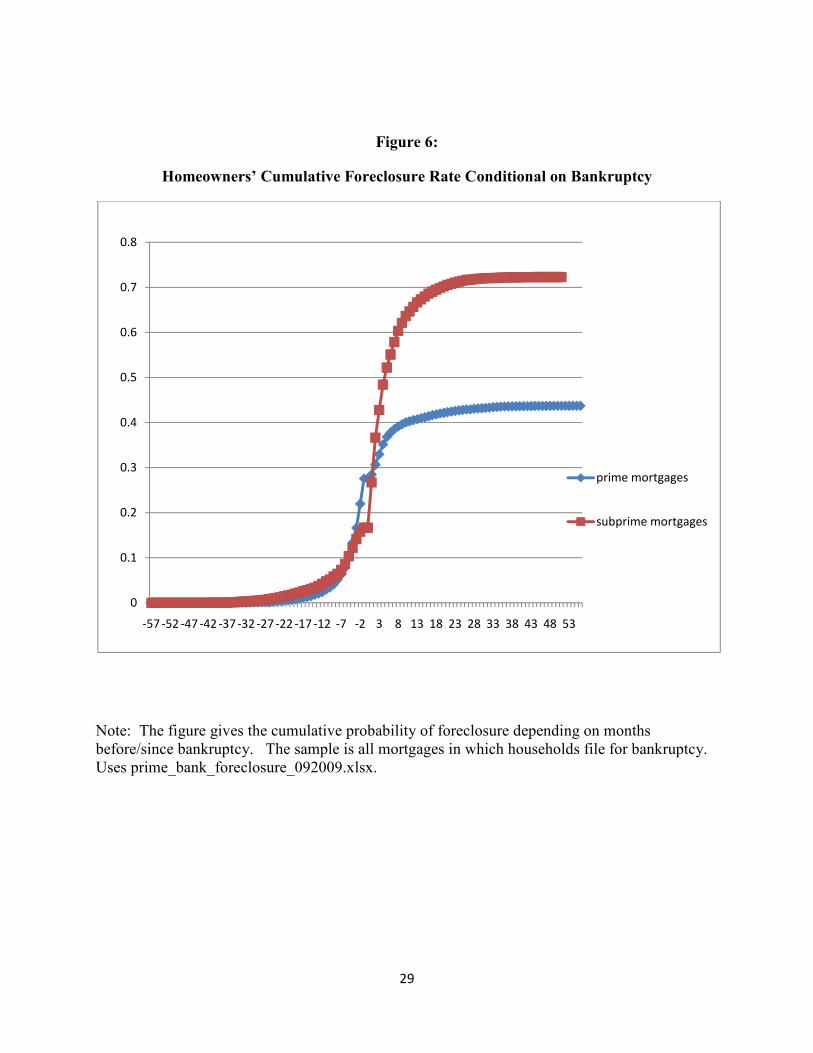
Similarly, figure 6 shows the cumulative probability of foreclosure conditional on homeowners
filing for bankruptcy. Lenders begin foreclosure for 44% and 72% of prime and subprime
mortgages, respectively, conditional on homeowners’ filing for bankruptcy.
The paper proceeds as follows. In the next section, we examine homeowners’ incentives to
default and file for bankruptcy in the context of the U.S. legal environment. We also examine
the various ways in which homeowners in financial distress gain from coordinating their default
and bankruptcy decisions and develop testable hypotheses concerning how their default and
bankruptcy decisions are related. We also consider how homeowners can reduce their losses
from foreclosure by filing for bankruptcy. In section III, we discuss our mortgage dataset in
greater detail. In section IV, we give the results of hazard models that examine the relationships
between bankruptcy and mortgage default and between bankruptcy and foreclosure. In section
V, we discuss policy implications.
5
II. Homeowners’ Decisions to Default and File for Bankruptcy under U.S. Law
In this section, we consider homeowners’ incentives to default and file for bankruptcy in the
U.S. legal environment. We also consider how the 2005 bankruptcy reform and the start of the
mortgage crisis changed homeowners’ incentives.
Suppose homeowners default on their mortgage payments. Lenders generally begin the
foreclosure process once homeowners are delinquent by two or three months. States vary in how
long and how formal the foreclosure process is. In some states mortgage lenders can proceed
without going to court, while in other states they must obtain a court order. Eventually the
lender obtains legal title to the property and sells it. The proceeds after expenses are used, first,
to repay the first mortgage in full, including principal, interest, fees, and penalties. Next, the
second mortgage and home equity loans, if any, are repaid in full in order. Third, homeowners
receive an amount up the state’s homestead exemption. Homestead exemptions vary widely
across states, from zero in a few states to unlimited in seven states. If anything is left, it goes to
unsecured creditors. In most foreclosures, the sale price of the house is insufficient to repay the
mortgage(s)—otherwise homeowners would have sold the house themselves. Some states allow
mortgage lenders to obtain a “deficiency judgment” against the former owner, which is an
unsecured claim for the difference between the amount of the mortgage and the sale price of the
house.3 Most states also allow homeowners to reclaim their houses for a period after foreclosure
by repaying their mortgages in full. These periods can last up to a year.
Homeowners who default can remain in their homes for varying periods. Some states force
them to leave before the transfer of title to the lender. Others allow them to stay, which means
that they become tenants and the new owner must go through an eviction procedure to force
them to leave. During this process, homeowners/former homeowners are not obliged to make
any mortgage or rent payments. The period from default to eviction ranges from a few months to
more than a year—and homeowners can extend it by filing for bankruptcy.
3 To prevent mortgage lenders from selling foreclosed homes for less than market value, many states allow deficiency judgments only if the foreclosure process has gone through the courts. See Elias (2009) for discussion of foreclosure law.
6
Now suppose homeowners default on non-mortgage debt. Credit card lenders use
aggressive collection techniques, including frequently calling the debtor at home and at work and
sending threatening letters. Lenders may also obtain a court order to garnish debtors’ wages if
they can determine where debtors work and to seize debtors’ bank accounts if they can locate
these accounts. Federal law prevents lenders from garnishing more than 25% of debtors’ wages.
Some states restrict garnishment further and a few states prohibit it entirely.4
Now consider homeowners’ decisions to default on their mortgages. Homeowners may
default because their ability-to-pay falls or they may default strategically, because doing so
makes them better off. Suppose PVCO denotes the net present value of the cost of owning a
home, including the value of home equity, expected future capital gains or losses on the house,
and the cost of paying the mortgage. PVCR denotes the net present value of the cost of
alternative housing, which we assumed is rented. Homeowners gain from defaulting if PVCO <
PVCR. They are less likely to default if they have positive home equity, if they expect home
values to rise in the future and/or if they have particularly favorable mortgage terms (such as
below-market interest rates).
Now turn to bankruptcy and consider how filing for bankruptcy affects homeowners’ gain
from defaulting on their mortgages. 5 There are two separate personal bankruptcy procedures in
the U.S., called Chapter 7 and Chapter 13, and most homeowners are allowed to choose between
them. Filing for bankruptcy under either chapter stops creditors’ collection efforts, prevents or
ends wage garnishment, and stops the foreclosure process—at least temporarily. Some or all
unsecured debts—including credit card debts, installment loans, medical bills, and unpaid rent—
are discharged.
Consider Chapter 7 first. In Chapter 7, unsecured debts are quickly discharged, 6 but
mortgage debt cannot be changed or discharged. 7 Debtors are obliged to use assets above their
4 See Mann (2006) for discussion of collection practices by credit card lenders. 5 See White and Zhu (2010) and Lin and White (2001) for detailed discussions of the relationship between homeowners’ default and bankruptcy decisions. Fay, Hurst, and White (2003) show empirically that debtors are more likely to file for bankruptcy when their financial gain from filing is higher. 6 Not all unsecured debts are discharged in bankruptcy—debts that are not discharged include unpaid child support, taxes, debts incurred by fraud, and student loans (the latter can occasionally be discharged under a hardship procedure).
7
state’s exemption level to repay unsecured debt, but they are not obliged to repay from their
future incomes—even if their earnings are high. States have separate exemptions for different
types of assets, but the homestead exemption is generally the largest. In states with high
homestead exemptions, even debtors with high assets do not have to repay any of their unsecured
debt in bankruptcy, as long as they convert their assets into exempt home equity before filing.8
Chapter 7 can help financially distressed homeowners save their homes by discharging some
of their unsecured debts, thus making additional funds available to pay the mortgage. Because
foreclosure is stopped during the bankruptcy proceeding, homeowners also get several extra
months to repay mortgage arrears.9 They are allowed to keep their homes in Chapter 7 as long as
their home equity is less than their state’s homestead exemption and they repay the arrears within
a few months. In terms of the bankruptcy-default relationship, this discussion suggests that
homeowners who wish to save their homes and succeed may be observed in bankruptcy only or
in bankruptcy and in default. But they will not be observed in foreclosure.
However, homeowners also gain from filing under Chapter 7 if they do not intend to save
their homes. If they have positive home equity, then using bankruptcy to delay foreclosure gives
them more time to sell their homes privately, which may bring a higher price. If homeowners do
not have positive home equity, then filing for bankruptcy allows them to live in their homes cost-
free for longer. Homeowners who default also have an incentive to file for bankruptcy because
default lowers their credit scores and this means that the cost of filing for bankruptcy is low. In
addition, homeowners who have already lost their homes and are subject to deficiency judgments
7 The prohibition on changing mortgage terms in bankruptcy is based on the Supreme Court’s decision in Nobleman v. American Savings Bank, 508 US 324 (1993) and on 11 U.S.C. § 1322(b)(2), which prevents bankruptcy judges from discharging mortgage debt that is secured only by a primary residence that is a single-family house, even if the value of the house is below the mortgage principle. But second mortgages are sometimes discharged in bankruptcy—see below. For discussion, see Bourguignon (2007) and Levitin and Goodman (2008).
8 Bankruptcy law in the U.S. is Federal law, so that it is uniform all over the country. But U.S. bankruptcy law allows states to set their own asset exemptions. 9 Berkowitz and Hynes (1999) first suggested that filing for bankruptcy increases debtors’ ability to repay their mortgages by discharging unsecured debt. But see Carroll and Li (2008) for data showing that homeowners who file for bankruptcy to save their homes often fail.
8
gain from filing under Chapter 7 in order to have the deficiency judgments discharged. Thus
homeowners who do not try to save their homes are likely to be observed in default, in
bankruptcy, and in foreclosure.
Homeowners’ gain from filing under Chapter 7 can be expressed as:
7777 ]0,max[7 CXARHUrGainChapte A −−−−+=
7U is the value of unsecured debt discharged in Chapter 7. Homeowners receive this subsidy in
bankruptcy regardless of whether they keep their homes or not. 7H is the change in the present
value of future housing costs when homeowners file under Chapter 7. If homeowners save their
homes in Chapter 7, then 07 =H . But if they give up their homes in Chapter 7, then 7H equals
the reduction in housing costs from becoming renters, or )( 77 PVCRPVCO − . This may include
the gain from having cost-free housing for several months by delaying foreclosure, the gain from
having a deficiency judgment discharged, and/or the gain from moving to rental housing that
costs less. If homeowners make efficient housing choices, then
)](,0max[ 777 PVCRPVCOH −= . ]0,max[ AXA − is the value of non-exempt assets that
homeowners must use to repay unsecured debt in bankruptcy, where A is the value of
homeowners’ assets and AX is the asset exemption (equal to the homestead exemption in most
states). 7C is homeowners’ cost of filing for bankruptcy under Chapter 7.
Overall, the discussion of Chapter 7 bankruptcy suggests that financially distressed
homeowners are likely both to file for bankruptcy and to default. If they fail to save their homes,
then they will also be observed in foreclosure. But homeowners who prefer to give up their
homes are also likely to be observed in default, in bankruptcy and in foreclosure. This suggests
that bankruptcy and default tend to be complements for financially distressed homeowners,
regardless of whether they attempt to save their homes or not, and that bankruptcy and
foreclosure are also complements for homeowners who do not attempt to save their homes or
who try but fail.
Now turn to Chapter 13. It is intended as a procedure for financially distressed homeowners
to save their homes, even if they have large mortgage arrears that they cannot repay in a lump
9
sum. Homeowners must have regular earnings and they must follow a court-supervised
repayment plan for 3 to 5 years. If they succeed in repay their mortgage arrears as part of the
plan and also keep current on their normal mortgage payments, then the original mortgage
contract will be reinstated.10 The terms of first mortgages cannot otherwise be changed in
Chapter 13. But second mortgages and home equity loans can be discharged in Chapter 13 if the
loan is underwater and some car loans can also be reduced in Chapter 13. Bankruptcy trustees
also may challenge fees and penalties that lenders add to mortgages following default. 11 Prior
to the 2005 bankruptcy reform, homeowners were generally not required to repay any of their
unsecured debt in Chapter 13, as long as their assets were entirely exempt.12
To illustrate a Chapter 13 plan, suppose a homeowner owes $8,000 in past due mortgage
payments, plus $2,000 in penalties and late fees. The homeowner’s normal monthly mortgage
payment is $800 per month. The homeowner cannot repay the $10,000 in full immediately. But
under Chapter 13, she is allowed to repay the arrears over 3 to 5 years as part of her repayment
plan. At an interest rate of 6% and with the bankruptcy trustee adding a 10% fee, the cost of
repaying the mortgage arrears over 5 years is $203 per month. She must also make her normal
mortgage payments of $800/month. Thus during the plan, her monthly mortgage costs are
$1,003 per month.
Homeowners’ gain from filing under Chapter 13 can be expressed as:
.]0,max[13 1313131313 CXAEHSUrGainChapte A −−−−++=
Here 13U is the value of unsecured debt discharged in Chapter 13. 13S is the value of non-
housing secured debt (car loans) discharged in Chapter 13. 13H is the reduction in the cost of
10 11 U.S.C. § 1322(c)(1) allows debtors to cure defaults on their mortgages in Chapter 13. 11 See Porter (2009) and Elias (2009) for discussion. 12 Prior to 2005, bankruptcy judges generally approved repayment plans that did not require homeowners to repay any unsecured debt, as long as all of their assets would be exempt in Chapter 7. The justification was that these homeowners could otherwise file under Chapter 7, where their unsecured debts would be completely discharged. If homeowners’ home equity was not completely exempt, then they were also obliged to use their non-exempt home equity to repay unsecured debt. This is because bankruptcy law requires that unsecured creditors receive
at least as much in Chapter 13 as they would in Chapter 7.
10
housing when homeowners file under Chapter 13. If homeowners keep their homes, then
1313 PVCOH ∆= , where 13PVCO∆ equals the value of second mortgage loans, home equity loans,
and/or fees and penalties that are discharged in Chapter 13. If homeowners shift to rental
housing, then 131313 PVCRPVCOH −= , or the reduction in housing costs when homeowners
shift to rental housing. 13E is the present value of future earnings that must be used to repay
unsecured debt in Chapter 13 (if any) and ]0,max[ AXA − is again the value of non-exempt assets
(if any) that must be used to repay unsecured debt. 13C is the cost of filing for bankruptcy under
Chapter 13.
Comparing homeowners’ gain from filing for bankruptcy under Chapters 7 versus 13, both
the costs and benefits of filing are generally higher under Chapter 13. Under Chapter 13, more
types of unsecured debt are discharged than in Chapter 7, some car loans are also discharged, and
the reduction in the cost of owning is larger than in Chapter 7. Thus 713 UU > , 713 HH > , and
013 >S . Prior to the 2005 bankruptcy reform, Chapter 13 filers generally repaid only a token
amount of unsecured debt, so that 13E was small. And prior to bankruptcy reform, debtors
generally did not repay any of their debts from non-exempt assets, so that ]0,max[ AXA − = 0.
But the costs of filing for bankruptcy are higher in Chapter 13, so that 713 CC > . Thus both the
benefits and costs of filing for bankruptcy are larger under Chapter 13 than Chapter 7.
This discussion suggests that our predictions concerning the bankruptcy/default and
bankruptcy/foreclosure associations are similar for homeowners who file under Chapter 7 and
under Chapter 13. Because few debtors choose Chapter 13 unless they are homeowners trying to
save their homes, the discussion suggests that Chapter 13 filers are also likely to be observed
both in bankruptcy and in default. As in Chapter 7, they will not be observed in foreclosure if
they succeed in saving their homes. Thus bankruptcy and default are predicted to be
complements for financially distressed homeowners, but bankruptcy and foreclosure are
predicted to be less strongly complementary as long as some homeowners successfully use
bankruptcy to save their homes. If we find the bankruptcy/foreclosure relationship to be as
strongly complementary as the bankruptcy/default relationship, then this will suggest that
homeowners do not use bankruptcy to save their homes.
11
Now consider the 2005 bankruptcy reform and how it changed homeowners’ gain from
filing for bankruptcy. First, bankruptcy costs 7C and 13C increased substantially, thus
discouraging all homeowners from filing for bankruptcy. Second, a new means test was
introduced that prevents some homeowners with incomes above the median level in their states
from filing for bankruptcy under Chapter 7. Third, Chapter 13 became less attractive because a
new procedure requires some filers with above-median incomes to repay part of their unsecured
debt, thus increasing 13E . Also the criterion for discharging car loans in Chapter 13 was
tightened, thus reducing 13S . Finally, a cap of $125,000 on the homestead exemption was
introduced for homeowners who live in states with high homestead exemptions and have lived in
their homes for less than 3½ years. This raises ]0,max[ AXA − and discourages some high-asset
homeowners from filing. 13
Overall, the 2005 bankruptcy reform is predicted to reduce the number of homeowners who
file for bankruptcy. And because financially distressed homeowners who do not file for
bankruptcy do not receive the debt discharge and mortgage payment delay that bankruptcy
provides, the reform is also predicted to increase default and foreclosure.
The mortgage crisis also affected homeowners’ incentives to default and to file for
bankruptcy, mainly by reducing home values and therefore wiping out many homeowners’ home
equity. The reduction in home equity raises the cost of continuing to own, while leaving
unaffected the cost of renting. It therefore encourages homeowners to default on their mortgages
and give up their homes. But if bankruptcy and mortgage default are complements, then the
reduction in home equity could also cause bankruptcy filings to rise. In the empirical section, we
examine whether more default and foreclosure occur when home equity is negative, which is
more likely after the beginning of the mortgage crisis. We also examine whether homeowners
are more likely to file for bankruptcy when their home equity is completely exempt, which is
also more likely after the beginning of the mortgage crisis. With no non-exempt home equity,
homeowners are more likely to file for bankruptcy because they are allowed to keep their homes.
13 Ten states plus the District of Columbia have homestead exemptions greater than $125,000. See Elias (2007) and earlier editions.
12
In the next section, we estimate regressions explaining default and foreclosure as a function
of past bankruptcy and regressions explaining bankruptcy as a function of past default and past
foreclosure. These regressions allow us to examine whether default and bankruptcy and
foreclosure and bankruptcy are complements or substitutes when we add control variables and
they also allow us to determine how strong the relationships are. We also examine how the
2005 bankruptcy reform and the mortgage crisis affected default rates, bankruptcy filings, and
foreclosures. 14 Finally we test whether default, foreclosure and bankruptcy are more likely in
neighborhoods where more defaults, more foreclosures and more bankruptcies have occurred in
the past.
III. Data and Summary Statistics
Our data, from LPS Applied Analytics, Inc., consist of a large sample of prime and
subprime mortgages that originated in 2004-2005. All mortgages are first liens and have 30
year terms. We follow them monthly until they are repaid in full (including being transferred to
a different mortgage servicer), the mortgage terminates with foreclosure or a short sale, or until
October 2008. We take a 2% random draw of prime mortgages and a 15% random draw of
subprime mortgages. This gives us between 90,000 and 100,000 mortgages of each type and
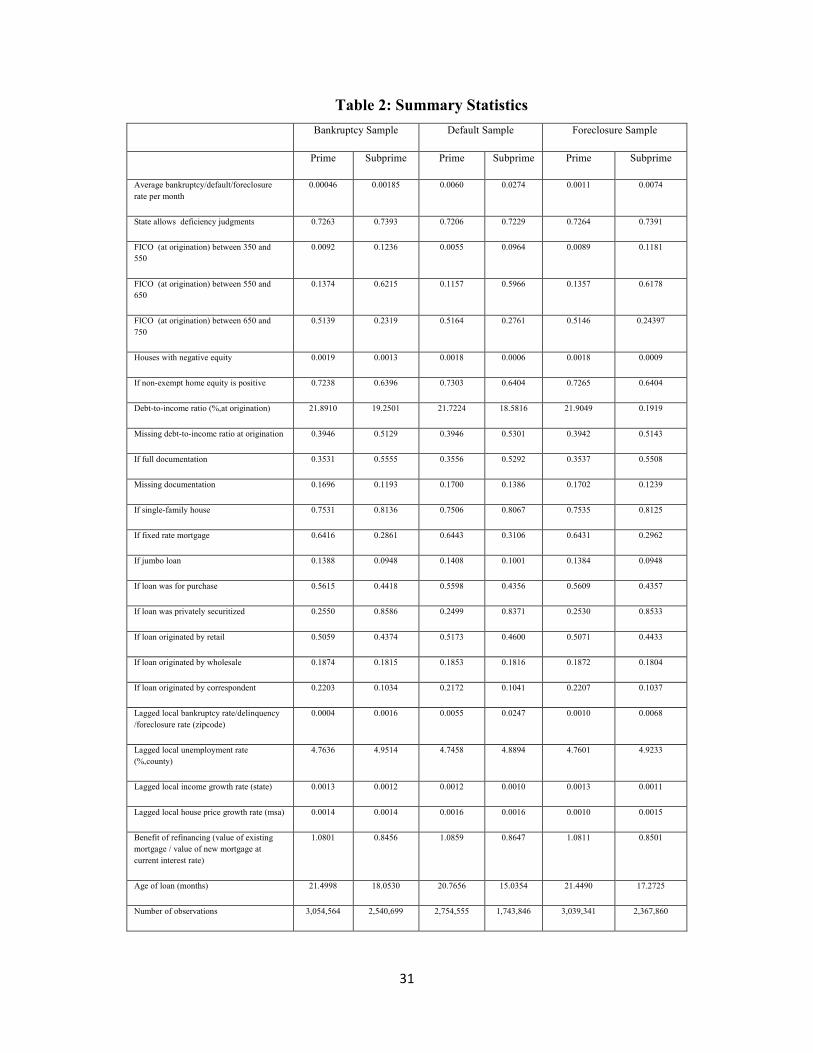
between 2.5 and 3.0 million monthly mortgage observations of each type. 15 All regressions use
the Cox proportional hazard model and we run all regressions separately for prime and subprime
mortgages. Summary statistics are shown in table 2.
It should be noted that we do not interpret these regressions as causal, since homeowners
presumably make both their default and bankruptcy decisions as part of an overall plan to save or
give up their homes, thus raising endogeneity issues. Similarly, although lenders decide whether
to start foreclosure, homeowners anticipate that the start of foreclosure will follow default in a
predictable way. But the regressions indicate the significance and the strength of the
14 See Morgan et al (2008) and Li, White, and Zhu (2009) for discussion of whether bankruptcy reform contributed to the mortgage crisis. 15 We take a larger sample of subprime mortgages because they are underrepresented in the LPS data. The size of the sample is limited by our use of the hazard model, which can handle only smaller samples than models such as probit or OLS. See below for further discussion.
13
default/bankruptcy and foreclosure/bankruptcy relationships and whether these relationships
remain complementary when we introduce controls.
Control variables used in the regressions include the homeowner’s FICO score in bins (the
highest category is omitted), the homeowner’s debt-to-income ratio, a dummy variable for
missing debt-to-income ratio, whether the homeowner provided full documentation of assets and
income at the time the mortgage originated, whether the property is single-family, whether the
loan is a jumbo, whether the interest rate is fixed or adjustable, whether the loan is for purchase
or refinance, whether the lender is private or is one of the U.S. government agencies, and
whether the loan was securitized in the private market (versus securitized by one of the U.S.
government agencies or held by lenders in their portfolios). All of these variables are given at
the time of mortgage origination and are not updated. Variables that are updated each month
include a dummy variable that equals one if the homeowner has negative home equity or a
dummy variable that equals one if the homeowner has no non-exempt home equity,16 the age of
the loan in months, age squared, and a measure of the benefit of refinancing (a higher value
indicates a larger benefit from refinancing).17 We also include the unemployment rate in the
county during the previous month, the rate of growth of house prices in the metropolitan area
during the previous month, the rate of growth of income in the state during the previous month, a
dummy variable for whether the state allows deficiency judgments, and either the average
mortgage default rate, bankruptcy rate or foreclosure rate in the homeowner’s zipcode during the
16 The negative home equity dummy equals one if the market value of the home at the time of origination, corrected by the change in average housing values in the metropolitan area since origination, minus the current mortgage principal is negative. This variable is used in the regressions explaining default and foreclosure. The no non-exempt home equity dummy equals one if home equity minus the homestead exemption is negative. This variable is used in the regressions explaining bankruptcy. Note that we do not have information on second mortgages or home equity loans. This means that our negative home equity and negative non-exempt home equity are both biased downward. 17 Following the literature, we use Principal/Value (PVt) as a measure of the benefit of refinancing (Richard and Roll, 1989). PVt measures the present value of future payments on the existing mortgage relative to the present value of future payments on an alternate mortgage having the currently-available interest rate. PVt={rt[1-(1+r0)
t-M]}/{ r0[1-(1+rt)t-M], where rt and r0
are the currently-available interest rate and the current mortgage interest rate, and M is the number of months to maturity. The mortgage principal and the number of months to maturity are assumed to remain the same over time.
14
previous month.18 We include state and year dummies in all regressions. Standard errors are
clustered by mortgage.
IV. Results
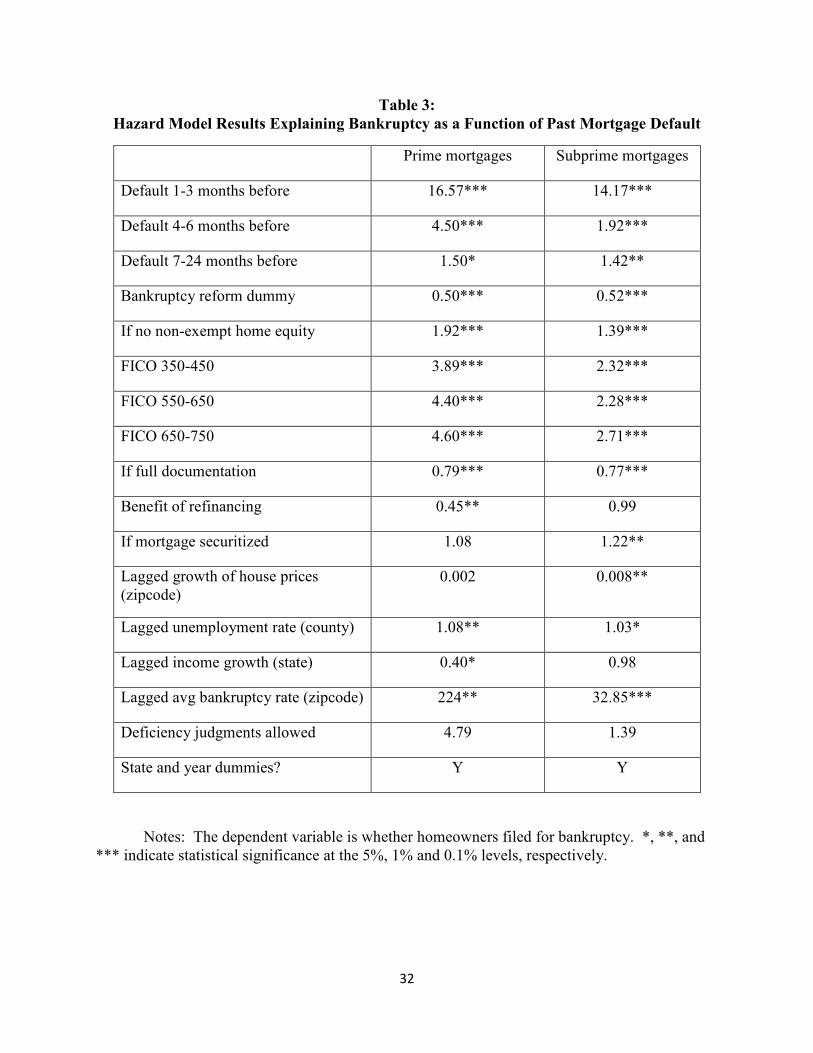
Table 3 shows the results of estimating hazard regressions that explain homeowners’
bankruptcy decisions as a function of whether they previously defaulted on their mortgages and
other variables. Results that are greater than/less than one are interpreted as percentage
increases/decreases in the probability of bankruptcy when right-hand-side dummy variables
change from zero to one or when right-hand-side continuous variables increase by one in value.
Results are shown separately for prime versus subprime mortgages. Only some of the control
variables are shown.
The main result is that defaulting on a mortgage is associated with a statistically significant
increase in homeowners’ probability of filing for bankruptcy. For homeowners with prime
mortgages, the probability of filing for bankruptcy increases 16-fold in the period 1-3 months
after default, or from an average value of .00046 per month to .0074 per month. Their
probability of filing for bankruptcy also increases 4-fold in the period 4-6 months after default
and by 50% in the period 7-24 months after default. For homeowners with subprime mortgages,
the increase in the period 1-3 months after default is 14-fold, or from an average value of .0018
per month to .026 per month. The increases in the periods 4-6 months and 7-24 months after
default are nearly 2-fold, and 42%, respectively. All of these results are strongly statistically
significant. Thus default and bankruptcy are complementary even when control variables are
introduced. We also find that homeowners with prime and subprime mortgages are about half as
likely to file for bankruptcy after the 2005 bankruptcy reform went into effect. Homeowners
who have no non-exempt home equity are 92% more likely to file for bankruptcy if they have
prime mortgages and 39% more likely to file for bankruptcy if they have subprime mortgages.
These relationships are also statistically significant.
18 The lagged mortgage default rates, bankruptcy rates and foreclosure rates by zipcode are calculated from our data. The deficiency judgment is taken from Pence (2006).
15
Among the control variables, homeowners are also more likely to file for bankruptcy if the
lagged bankruptcy filing rate in the zipcode is higher: an increase of one percent in the lagged
bankruptcy filing rate doubles homeowners’ probability of filing for bankruptcy if they have
prime mortgages and raises their probability of filing by 33% if they have subprime mortgages.
Macroeconomic influences also have the predicted effects: both types of homeowners are more
likely to file for bankruptcy if the local unemployment rate is higher, subprime mortgage-holders
are less likely to file for bankruptcy if the rate of house price increase in the local area is higher,
and prime mortgage-holders are less likely to file for bankruptcy if the growth rate of income in
the area is higher. Subprime mortgage-holders are 22% more likely to file for bankruptcy if
their mortgages are investor-owned, i.e., have been securitized, which suggests that these
homeowners are in worse financial condition even after controlling for credit score and other
financial indicators. 19
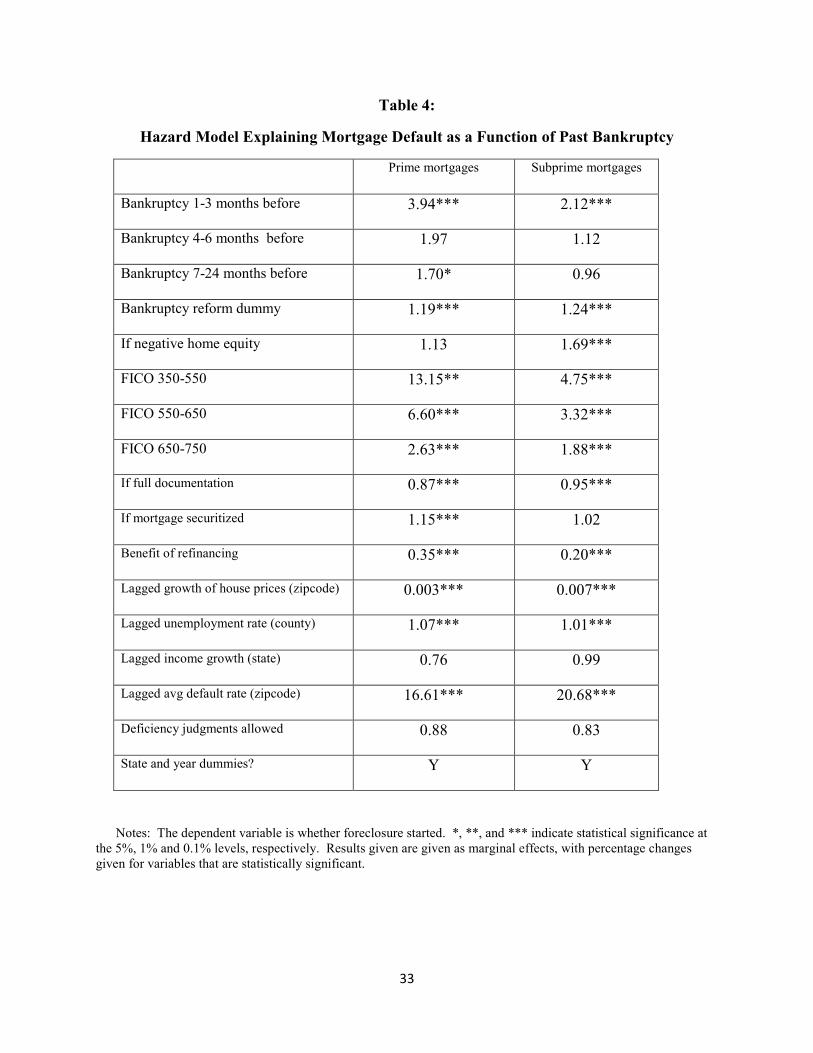
Table 4 gives the results explaining homeowners’ decisions to default on their mortgages.
Again the results show a strong positive relationship between homeowners’ default decisions and
whether they previously filed for bankruptcy. Filing for bankruptcy is associated with a 4-fold
increase in the homeowners’ default rate in the next 1-3 months if they have prime mortgages, or
an increase from an average rate of .0055 to .022 per month. The increase for homeowners with
subprime mortgages is two-fold, or from an average rate of .025 to .052 per month. After 3
months, the relationships are still positive, but insignificant. These results also suggest that
bankruptcy and default are complements. The adoption of bankruptcy reform caused
homeowners to default on their mortgages 19% more often if they have prime mortgages and
24% more often if they have subprime mortgages. Together with the results in table 3, these
results support our predictions that bankruptcy reform caused homeowners both to file for
bankruptcy less often and to default more often. Homeowners with subprime mortgages are also
69% more likely to default if they have negative home equity, but the relationship is not
significant for prime mortgages.
Among the control variables, homeowners are also slightly more likely to default if they live
in an area with a higher unemployment rate and much less likely to default if they live in an area
19 This supports the view that investor-owned mortgages are less likely to be renegotiated. See Piskorski et al (2009).
16
with higher house price growth. The lagged default rate is also a significant determinant of
whether homeowners default. An increase of one percent in the lagged default rate in the
zipcode increases homeowners’ probability of defaulting by 17% if they have prime mortgages
and 21% if they have subprime mortgages. Thus default causes more default for both types of
mortgages.
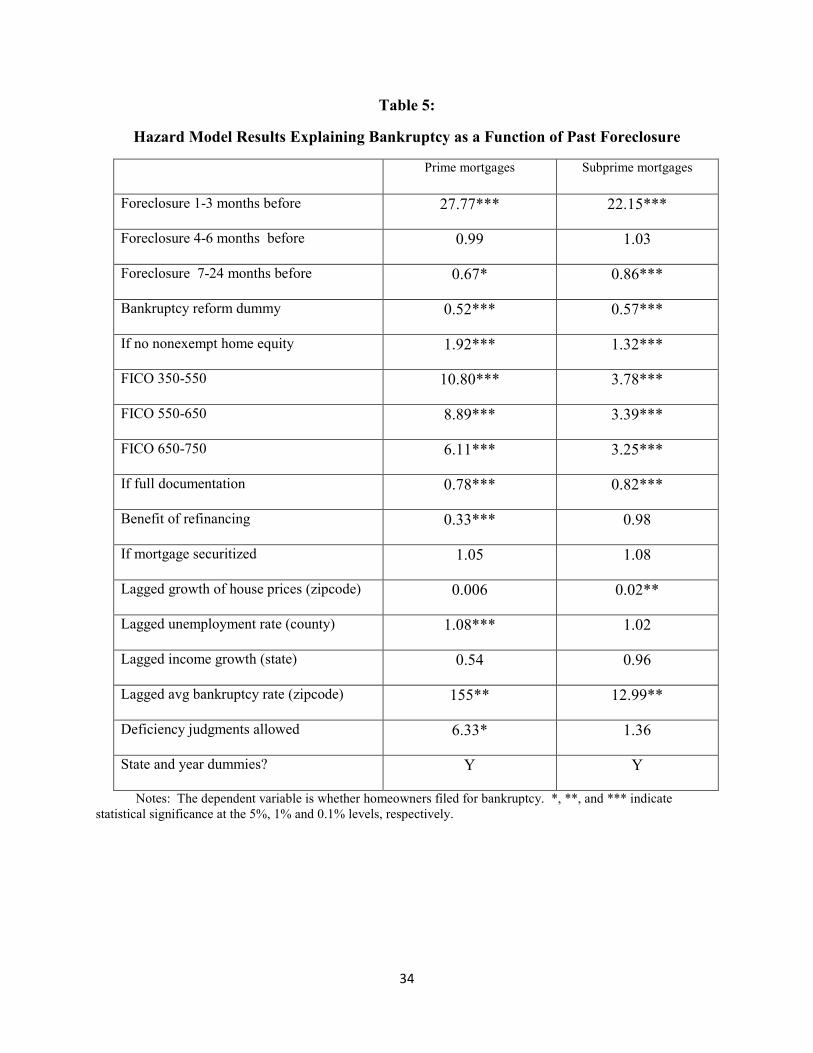
Now turn to the bankruptcy/foreclosure relationship. Table 5 gives the results of regressions
explaining homeowners’ bankruptcy decisions as a function of whether lenders have already
started foreclosure proceedings. The results show a surprisingly strong relationship.
Homeowners with prime and subprime mortgages are 28 times and 22 times as likely to file for
bankruptcy, respectively, if lenders began foreclosure within the previous three months. After
three months, the relationship is either insignificant or has the wrong sign. This compares with
16-fold and 22-fold increases in homeowners’ probabilities of filing for bankruptcy in the same
period after default, respectively. The fact that the bankruptcy/foreclosure relationship is
stronger than the bankruptcy/default relationship for prime mortgage-holders is surprising, since
we predicted the opposite. These results suggest that many homeowners often begin to plan
whether to save versus abandon their homes only when lenders start foreclosure—perhaps
because they consult lawyers at this point.
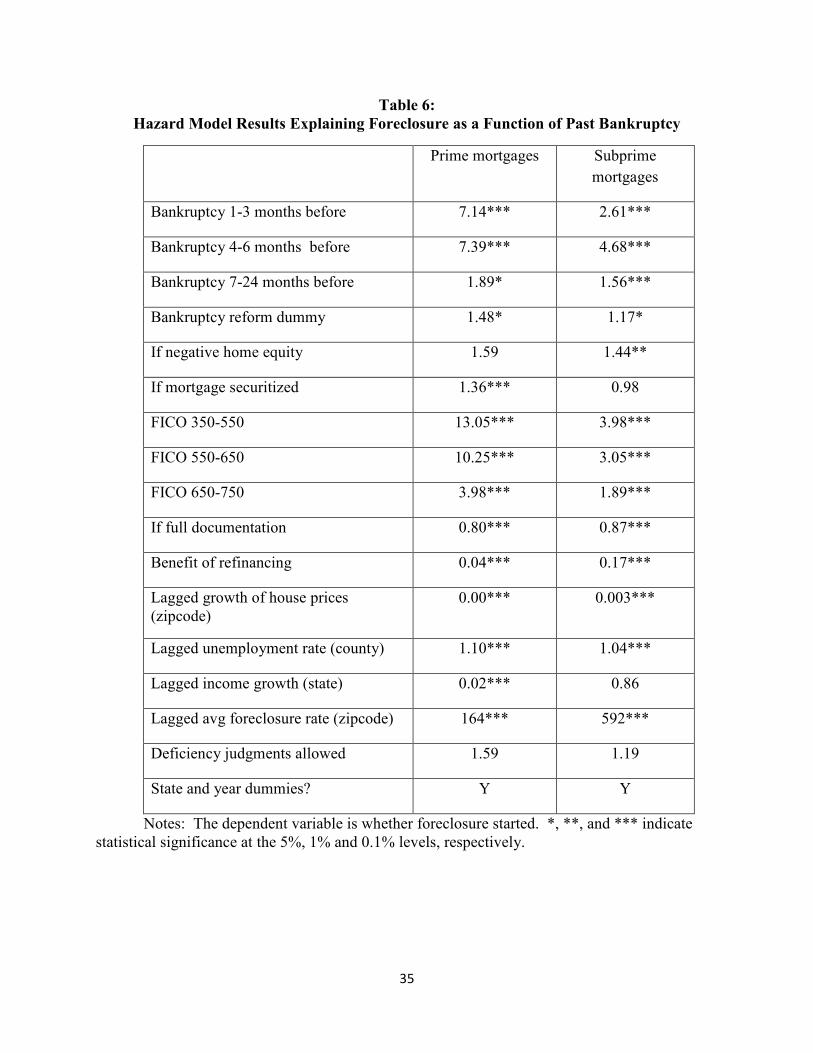
Finally, table 6 gives the results of regressions explaining the foreclosure/bankruptcy
relationship. The results show again that the two are strongly positively related. The probability
of foreclosure increases 7-fold for prime mortgages and 2- to 4-fold for subprime mortgages if
homeowners filed for bankruptcy one to six months earlier. At the average values, the increase
in the probability of foreclosure when bankruptcy occurs is from .001 to .007 per month for
prime mortgages and from .0068 to .024 per month for subprime mortgages. The adoption of
bankruptcy reform also caused foreclosures to increase, by 48% for prime mortgages and by
17% for subprime mortgages. Foreclosure is also more likely when homeowners have negative
home equity, although the relationship is only statistically significant for subprime mortgage-
holders. The increase is 44% for this group. Lastly, the results suggest that foreclosures cause
more foreclosures. The probability of foreclosure rises by 160% for prime mortgages when the
lagged foreclosure rate in the zipcode rises by one percent, or from an average foreclosure rate of
17
.001 to .0016 per month. The increase for subprime mortgages is nearly six-fold, or from an
average of .0068 to .040 per month.
Overall, these results provide strong evidence that mortgage default and bankruptcy are
complements and that bankruptcy and foreclosure are also complements, even when we add
control variables. But they suggest that homeowners responded to the 2005 bankruptcy reform
by treating bankruptcy as a substitute for default and foreclosure. We also found that
homeowners reacted to the mortgage crisis and the fall in housing prices by both defaulting and
filing for bankruptcy more often. Finally we found evidence that default, bankruptcy, and
particularly foreclosure all tend to spread.
V. Policy Implications
Our results suggest that bankruptcy and default are closely related, as are bankruptcy and
foreclosure. Both relationships are complementary, although the 2005 bankruptcy reform
caused bankruptcy filings to drop and defaults and foreclosures to increase—suggesting that
homeowners treated bankruptcy as a substitute for default and foreclosure in responding to the
reform. We also found that the drop in home prices that occurred in 2007 and 2008 caused
homeowners both to default and to file for bankruptcy more often, which suggests that they
treated bankruptcy and default as complements. Finally we found evidence that default,
bankruptcy and foreclosure all spread, i.e., they rise when the lagged default, bankruptcy and
foreclosure rates in the neighborhood are higher.
The fact that bankruptcy is closely related to mortgage default and foreclosure is important
for policy purposes, because foreclosures have very high and negative social costs. Mortgage
lenders lose when foreclosures occur, because by the time foreclosed houses are sold, around
one-third of the value of the loan is lost (Campbell et al, 2008). Nonetheless, lenders bear only
part of the costs of foreclosure. Homeowners who experience foreclosure also lose because they
are forced to move, which destroys their neighborhood ties, leaves some of them homeless, and
18
increases their children’s chance of dropping out of school before graduating.20 Foreclosures
also reduce the value of nearby homes, harming other homeowners and their mortgage lenders.
Sale prices of homes fall by 7-9% when foreclosures occur within one-tenth of a mile and by 1-
2% when foreclosures occur within one-quarter mile (Campbell et al, 2008).21 Renters are also
harmed when landlords default and rental housing units are foreclosed, because leases are
abruptly terminated and renters are forced to bear the costs of unexpected moves. Foreclosures
also harm neighborhoods because vacant homes deteriorate, causing neighborhoods to become
blighted. Foreclosures also harm local governments, because property taxes are their main
source of revenue. When property values fall, tax revenues fall, and local governments are
forced to cut expenditures on schools, police and other local public services. Finally, our
regression results show that defaults lead to more defaults and foreclosures lead to more
foreclosures. Since mortgage lenders bear only a part of these costs, they tend to foreclose too
often.22
The relationship between bankruptcy and mortgage default/foreclosure has a number of
policy implications. First, consider the 2005 bankruptcy reform. Our results suggest that
homeowners responded to the reform by filing for bankruptcy less often and lenders responded
to the reform by foreclosing more often. These results imply that the 2005 reform led to about
250,000 extra foreclosures per year during the past few years.23 Congress is considering new
legislation that would offset some of the pro-creditor changes made in 2005, such as dropping
20 Green and White (1997) show that children are less likely to graduate from high school and more likely to have children as teenagers when their parents move more frequently. 21 See Campbell et al (2008) and Immergluck and Smith (2006). 22
Bankruptcy filings also have some external costs that are not borne by the debtor and the
debtor’s lenders, but these costs are mainly borne by debtors’ families. But we expect debtors to
internalize the cost of bankruptcy to the extent that these costs fall on their families.
23 This figure is based on 32,000,000 mortgage originations in 2004-06, of which approximately 18% were subprime. Using our foreclosure rates of .001 per month for prime mortgages and .0068 per month for subprime mortgages and our estimates that bankruptcy reform was associated with increases in the foreclosure rate of 48% for prime mortgages and 17% for subprime mortgages, this gives us a figure of 32,000,000*(.82*.0011*.48 + .18*.0074*.17)*12 months = 250,000 additional foreclosures due to bankruptcy reform. The number of mortgages originated in 2004-06 and the breakdown of mortgage originations between prime and subprime are taken from Mayer and Pence (2008). Note that Mayer and Pence give a range of figures for the breakdown of mortgages between prime versus subprime, based on different definitions of subprime mortgages. We use the average of their high versus low figures.
19
the means test for debtors who have substantial medical debt.24 To the extent that this change
would increase the number of bankruptcy filings, our results suggest that they would cause
foreclosures to drop.
Now turn to the implications of the foreclosure/bankruptcy nexus for optimal bankruptcy
policy. Bankruptcy policy can be thought of as a set of punishments imposed on debtors for
defaulting and filing for bankruptcy. Sanctions in the past have included enslaving and
imprisoning bankrupts; current sanctions include humiliating them and imposing harsher or more
lenient repayment requirements. U.S. bankruptcy law uses humiliation as a punishment for
bankruptcy by making filers’ names public information, but it has very lenient repayment
requirements since few bankrupts are required to repay from their future incomes. Other
countries have harsher punishments and more onerous repayment requirements than the U.S.—
British law bars bankrupts from managing a business or holding some public offices for three
years and France requires that they use all of their future incomes above a poverty-level
exemption for 8-10 years to repay. Other countries do not allow discharge of debt until the
debtor dies.25 When punishments and repayment requirements in bankruptcy are low, risk-
averse debtors benefit from having partial wealth insurance, since they can file for bankruptcy
and avoid repaying their debts when their ability-to-pay turns out to be low. The lower the
punishments and repayment requirements in bankruptcy, the more wealth insurance bankruptcy
provides to debtors, the more often they file, and the more lenders reduce the supply of credit.26
Optimal bankruptcy law is determined by this trade-off between the debtors’ gain from having
additional wealth insurance and debtors’ losses from having reduced access to credit. 27
Introducing the connection between bankruptcy and foreclosure changes optimal
bankruptcy law, since we have shown that bankruptcy law affects both the number of
bankruptcies and the number of foreclosures. And because foreclosures have high external costs,
bankruptcy law should be set so as to take into account its effect on foreclosures. But deriving
prescriptions for how optimal bankruptcy law should change because of the
bankruptcy/foreclosure relationship is tricky because the two are substitutes in some contexts and 24 The bill is H.R. 901, “Medical Bankruptcy Fairness Act.”
25 See White (2007) for comparison of bankruptcy laws across countries. 26See, for example, Gropp, Scholz, and White (1997) and Lin and White (2003). 27 See Livshits et al (2007) for a calibration model of optimal bankruptcy.
20
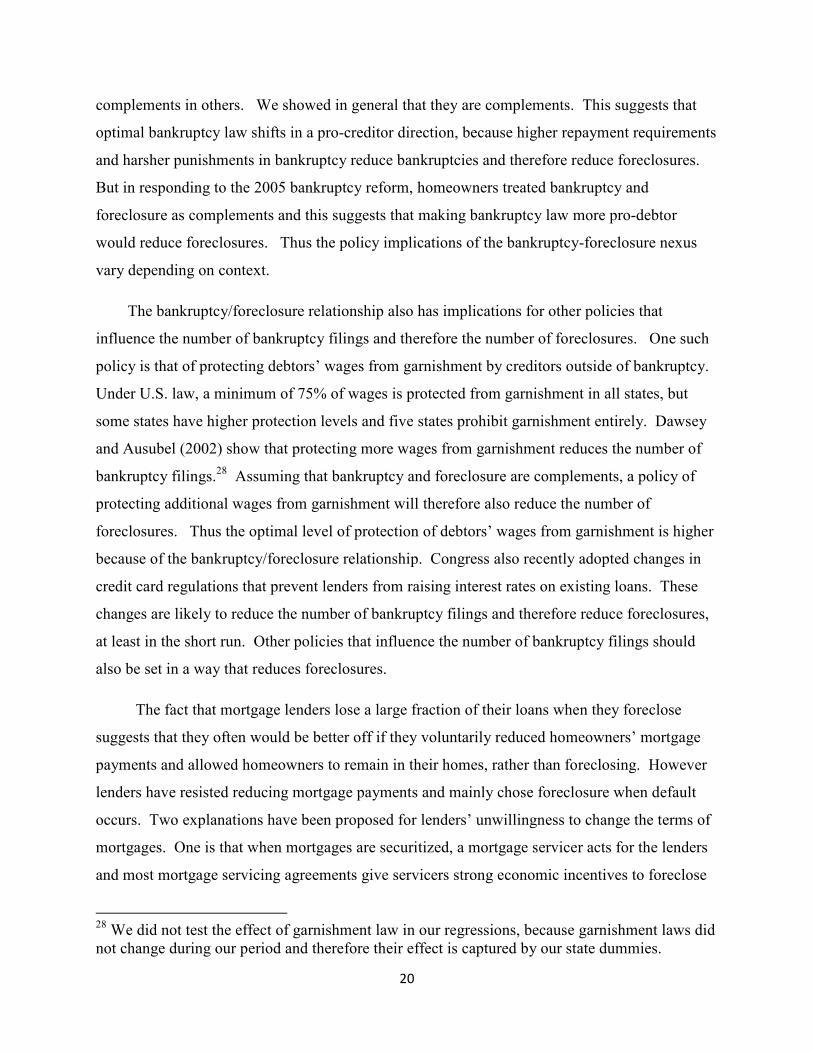
complements in others. We showed in general that they are complements. This suggests that
optimal bankruptcy law shifts in a pro-creditor direction, because higher repayment requirements
and harsher punishments in bankruptcy reduce bankruptcies and therefore reduce foreclosures.
But in responding to the 2005 bankruptcy reform, homeowners treated bankruptcy and
foreclosure as complements and this suggests that making bankruptcy law more pro-debtor
would reduce foreclosures. Thus the policy implications of the bankruptcy-foreclosure nexus
vary depending on context.
The bankruptcy/foreclosure relationship also has implications for other policies that
influence the number of bankruptcy filings and therefore the number of foreclosures. One such
policy is that of protecting debtors’ wages from garnishment by creditors outside of bankruptcy.
Under U.S. law, a minimum of 75% of wages is protected from garnishment in all states, but
some states have higher protection levels and five states prohibit garnishment entirely. Dawsey
and Ausubel (2002) show that protecting more wages from garnishment reduces the number of
bankruptcy filings.28 Assuming that bankruptcy and foreclosure are complements, a policy of
protecting additional wages from garnishment will therefore also reduce the number of
foreclosures. Thus the optimal level of protection of debtors’ wages from garnishment is higher
because of the bankruptcy/foreclosure relationship. Congress also recently adopted changes in
credit card regulations that prevent lenders from raising interest rates on existing loans. These
changes are likely to reduce the number of bankruptcy filings and therefore reduce foreclosures,
at least in the short run. Other policies that influence the number of bankruptcy filings should
also be set in a way that reduces foreclosures.
The fact that mortgage lenders lose a large fraction of their loans when they foreclose
suggests that they often would be better off if they voluntarily reduced homeowners’ mortgage
payments and allowed homeowners to remain in their homes, rather than foreclosing. However
lenders have resisted reducing mortgage payments and mainly chose foreclosure when default
occurs. Two explanations have been proposed for lenders’ unwillingness to change the terms of
mortgages. One is that when mortgages are securitized, a mortgage servicer acts for the lenders
and most mortgage servicing agreements give servicers strong economic incentives to foreclose
28 We did not test the effect of garnishment law in our regressions, because garnishment laws did not change during our period and therefore their effect is captured by our state dummies.
21
rather than to modify mortgage terms. (Mortgage servicing agreements sometimes explicitly
prohibit servicers from making modifications.) The other explanation is that lenders are better
off if they foreclose. This is because many homeowners who default will “self-cure” if their
mortgage terms remain unchanged and many of those whose mortgage payments are reduced end
up re-defaulting quickly, so that foreclosure is only delayed rather than prevented. 29 Both
factors mean that mortgage lenders are better off foreclosing. But even lenders are better off
foreclosing, it may be more economically efficient to modify mortgages so as to avoid the high
external costs of foreclosures.
Both the Bush and Obama Administrations have initiated programs to reduce the number of
foreclosures by encouraging mortgage lenders to lower homeowners’ mortgage payments. The
Bush Administration programs were completely unsuccessful. The Obama Administration’s
programs have been somewhat more successful and the Administration recently announced that
500,000 homeowners have had their mortgage payments reduced (Goodman, 2009). This,
however, is just a small fraction of the number of foreclosures. A problem with both the Bush
and the Obama Administration programs is that while homeowners apply to have their mortgage
payments reduced, mortgage lenders have the right to veto any changes. Lenders obviously have
an interest in approving only a small number of reductions in order to discourage applications by
homeowners who can afford to pay. Because lenders have the right to veto and they ignore the
external costs of foreclosures, these programs prevent too few foreclosures.
An alternative approach would be to allow bankruptcy judges to modify or “cram down”
mortgages. Under current U.S. law, bankruptcy judges are not allowed to change the terms of
residential mortgage contracts if the mortgage is secured by the debtor’s primary residence. But
if bankruptcy judges were given the power to change the terms of residential mortgages, then
additional foreclosures could be prevented. This is because, unlike non-bankruptcy foreclosure-
avoidance programs, mortgage lenders would not have the right to veto changes in mortgage
terms. Legislation making this change was proposed by the Obama campaign in the fall of 2008,
but heavy lobbying by mortgage lenders caused it to be rejected by Congress.30
29 See Piskorski et al (2009) and Adelino et al (2009) for arguments on both sides.
30 See Levitin and Goodman (2008) for discussion of the cramdown proposal.
22
Introducing cram-down of mortgages in bankruptcy would clearly be an additional way of
preventing foreclosures. But would it be economically efficient? Zhu and White (2010)
examined a sample of financially distressed homeowners in Chapter 13 and found that the
average present value of debt reduction if mortgages were reduced to the current market value of
the house would be around $150,000 per homeowner, including reduced mortgage payments of
$140,000 and unsecured debt discharge of $10,000. Because this figure is so large, adopting
cram-down is likely to cause many additional homeowners to file for bankruptcy, including
many who file only to have their mortgages crammed down. The study predicted that five
mortgages would be crammed down in bankruptcy for each foreclosure prevented, so that the
total cost to lenders would be around $750,000 per foreclosure prevented. With so many
mortgage modifications, the supply of mortgage credit would almost certainly fall. Overall,
allowing cram-down in bankruptcy would be very effective, but would probably prevent too
many—rather than too few—foreclosures.
23
Figure 1:
Bankruptcy Filings and Mortgage Default Rates,
Yearly Data, 1980-2008
Notes: See table 1 for definitions and data sources.
0
1
2
3
4
5
6
1980 1982 1984 1986 1988 1990 1992 1994 1996 1998 2000 2002 2004 2006 2008
default rate (%)
bankruptcy
filings/HH
24
Figure 2:
Mortgage Default, Bankruptcy, and Foreclosure Rates for Homeowners
Monthly Household Data, January 2004 to October 2008
(Mortgages Originated January 2004 – October 2005)
Prime Mortgages
0
0.002
0.004
0.006
0.008
0.01
0.012
0.014
0.016
0.018
bankruptcy
default
foreclosure
25
Subprime Mortgages
0
0.01
0.02
0.03
0.04
0.05
0.06
0.07
0.08
0.09
bankruptcy
default
foreclosure
26
Figure 3:
Homeowners’ Cumulative Bankruptcy Filing Rate Conditional on Default
Note: The figure gives the cumulative probability of bankruptcy depending on months
before/since default. Default is defined to occur when mortgage payments are at least one month
delinquent. The sample is all mortgages in which default occurs.
Default_bankruptcy_092409.xls
0
0.01
0.02
0.03
0.04
0.05
0.06
0.07
0.08
0.09
0.1
-57 -52 -47 -42 -37 -32 -27 -22 -17 -12 -7 -2 3 8 13 18 23 28 33 38 43 48 53
Months since default
prime
mortgages
subprime
mortgages
27
Figure 4:
Homeowners’ Cumulative Default Rate Conditional on Bankruptcy
Note: The figure gives the cumulative probability of default depending on months before/since bankruptcy. Default is defined to occur when mortgage payments are at least one month delinquent. The sample is all mortgages in which households file for bankruptcy. Uses bankrupt_default_3_092409.xls.
0
0.1
0.2
0.3
0.4
0.5
0.6
0.7
0.8
0.9
1
-57 -52 -47 -42 -37 -32 -27 -22 -17 -12 -7 -2 3 8 13 18 23 28 33 38 43 48 53
Months since bankruptcy filing
prime mortgages
subprime mortgages
28
Figure 5:
Homeowners’ Cumulative Bankruptcy Filing Rate Conditional on Foreclosure
Note: The figure gives the cumulative probability of bankruptcy depending on months before/since foreclosure. The sample is all mortgages in which foreclosure starts. Uses foreclosure_bankruptcy_092409.xls.
0
0.1
0.2
0.3
0.4
0.5
0.6
0.7
0.8
-57-53-49-45-41-37-33-29-25-21-17-13 -9 -5 -1 3 7 11 15 19 23 27 31 35 39 43 47
months since foreclosure start
prime mortgages
subprime mortgages
29
Figure 6:
Homeowners’ Cumulative Foreclosure Rate Conditional on Bankruptcy
Note: The figure gives the cumulative probability of foreclosure depending on months before/since bankruptcy. The sample is all mortgages in which households file for bankruptcy. Uses prime_bank_foreclosure_092009.xlsx.
0
0.1
0.2
0.3
0.4
0.5
0.6
0.7
0.8
-57 -52 -47 -42 -37 -32 -27 -22 -17 -12 -7 -2 3 8 13 18 23 28 33 38 43 48 53
prime mortgages
subprime mortgages
30
Table 1: Trends in Bankruptcy Filings, Mortgage Default and Consumer and Mortgage
Debt
Bankruptcy filings per 1,000 HH
Residential mortgage default rate
1980 3.56 .055
1981 3.83 .058
1982 3.72 .062
1983 3.41 .063
1984 3.33 .064
1985 3.93 .068
1986 5.08 .066
1987 5.53 .060
1988 6.03 .060
1989 6.64 .058
1990 7.69 .056
1991 9.25 .060
1992 9.41 .056
1993 8.43 .052
1994 8.03 .050
1995 8.84 .052
1996 11.3 .053
1997 13.3 .054
1998 13.6 .056
1999 12.3 .053
2000 11.6 .056
2001 13.4 .066
2002 14.1 .066
2003 14.6 .060
2004 14.0 .055
2005 18.0 .055
2006 5.24 .058
2007 7.13 .071
2008 9.20 .088
Notes: The mortgage default rate is the dollar value of 1-4 family mortgages that are delinquent by 30 days or more or are in foreclosure, divided by the dollar value of all 1-4 family mortgages. Data are taken from the Statistical Abstract of the U.S., various editions, but are produced by the Mortgage Bankers Association, National Delinquency Survey. The number of bankruptcy filings is produced by the Administrative Office of the U.S. Courts; data are available at http://www.abiworld.org/AM/AMTemplate.cfm?Section=Home&TEMPLATE=/CM/ContentDisplay.cfm&CONTENTID=57826.
31
Table 2: Summary Statistics
Bankruptcy Sample Default Sample Foreclosure Sample
Prime Subprime Prime Subprime Prime Subprime
Average bankruptcy/default/foreclosure
rate per month
0.00046 0.00185 0.0060 0.0274 0.0011 0.0074
State allows deficiency judgments 0.7263 0.7393 0.7206 0.7229 0.7264 0.7391
FICO (at origination) between 350 and
550
0.0092 0.1236 0.0055 0.0964 0.0089 0.1181
FICO (at origination) between 550 and
650
0.1374 0.6215 0.1157 0.5966 0.1357 0.6178
FICO (at origination) between 650 and
750
0.5139 0.2319 0.5164 0.2761 0.5146 0.24397
Houses with negative equity 0.0019 0.0013 0.0018 0.0006 0.0018 0.0009
If non-exempt home equity is positive 0.7238 0.6396 0.7303 0.6404 0.7265 0.6404
Debt-to-income ratio (%,at origination) 21.8910 19.2501 21.7224 18.5816 21.9049 0.1919
Missing debt-to-income ratio at origination 0.3946 0.5129 0.3946 0.5301 0.3942 0.5143
If full documentation 0.3531 0.5555 0.3556 0.5292 0.3537 0.5508
Missing documentation 0.1696 0.1193 0.1700 0.1386 0.1702 0.1239
If single-family house 0.7531 0.8136 0.7506 0.8067 0.7535 0.8125
If fixed rate mortgage 0.6416 0.2861 0.6443 0.3106 0.6431 0.2962
If jumbo loan 0.1388 0.0948 0.1408 0.1001 0.1384 0.0948
If loan was for purchase 0.5615 0.4418 0.5598 0.4356 0.5609 0.4357
If loan was privately securitized 0.2550 0.8586 0.2499 0.8371 0.2530 0.8533
If loan originated by retail 0.5059 0.4374 0.5173 0.4600 0.5071 0.4433
If loan originated by wholesale 0.1874 0.1815 0.1853 0.1816 0.1872 0.1804
If loan originated by correspondent 0.2203 0.1034 0.2172 0.1041 0.2207 0.1037
Lagged local bankruptcy rate/delinquency
/foreclosure rate (zipcode)
0.0004 0.0016 0.0055 0.0247 0.0010 0.0068
Lagged local unemployment rate
(%,county)
4.7636 4.9514 4.7458 4.8894 4.7601 4.9233
Lagged local income growth rate (state) 0.0013 0.0012 0.0012 0.0010 0.0013 0.0011
Lagged local house price growth rate (msa) 0.0014 0.0014 0.0016 0.0016 0.0010 0.0015
Benefit of refinancing (value of existing
mortgage / value of new mortgage at
current interest rate)
1.0801 0.8456 1.0859 0.8647 1.0811 0.8501
Age of loan (months) 21.4998 18.0530 20.7656 15.0354 21.4490 17.2725
Number of observations 3,054,564 2,540,699 2,754,555 1,743,846 3,039,341 2,367,860
32
Table 3:
Hazard Model Results Explaining Bankruptcy as a Function of Past Mortgage Default
Prime mortgages Subprime mortgages
Default 1-3 months before 16.57*** 14.17***
Default 4-6 months before 4.50*** 1.92***
Default 7-24 months before 1.50* 1.42**
Bankruptcy reform dummy 0.50*** 0.52***
If no non-exempt home equity 1.92*** 1.39***
FICO 350-450 3.89*** 2.32***
FICO 550-650 4.40*** 2.28***
FICO 650-750 4.60*** 2.71***
If full documentation 0.79*** 0.77***
Benefit of refinancing 0.45** 0.99
If mortgage securitized 1.08 1.22**
Lagged growth of house prices
(zipcode) 0.002 0.008**
Lagged unemployment rate (county) 1.08** 1.03*
Lagged income growth (state) 0.40* 0.98
Lagged avg bankruptcy rate (zipcode) 224** 32.85***
Deficiency judgments allowed 4.79 1.39
State and year dummies? Y Y
Notes: The dependent variable is whether homeowners filed for bankruptcy. *, **, and
*** indicate statistical significance at the 5%, 1% and 0.1% levels, respectively.
33
Table 4:
Hazard Model Explaining Mortgage Default as a Function of Past Bankruptcy
Prime mortgages Subprime mortgages
Bankruptcy 1-3 months before 3.94*** 2.12***
Bankruptcy 4-6 months before 1.97 1.12
Bankruptcy 7-24 months before 1.70* 0.96
Bankruptcy reform dummy 1.19*** 1.24***
If negative home equity 1.13 1.69***
FICO 350-550 13.15** 4.75***
FICO 550-650 6.60*** 3.32***
FICO 650-750 2.63*** 1.88***
If full documentation 0.87*** 0.95***
If mortgage securitized 1.15*** 1.02
Benefit of refinancing 0.35*** 0.20***
Lagged growth of house prices (zipcode) 0.003*** 0.007***
Lagged unemployment rate (county) 1.07*** 1.01***
Lagged income growth (state) 0.76 0.99
Lagged avg default rate (zipcode) 16.61*** 20.68***
Deficiency judgments allowed 0.88 0.83
State and year dummies? Y Y
Notes: The dependent variable is whether foreclosure started. *, **, and *** indicate statistical significance at the 5%, 1% and 0.1% levels, respectively. Results given are given as marginal effects, with percentage changes given for variables that are statistically significant.
34
Table 5:
Hazard Model Results Explaining Bankruptcy as a Function of Past Foreclosure
Prime mortgages Subprime mortgages
Foreclosure 1-3 months before 27.77*** 22.15***
Foreclosure 4-6 months before 0.99 1.03
Foreclosure 7-24 months before 0.67* 0.86***
Bankruptcy reform dummy 0.52*** 0.57***
If no nonexempt home equity 1.92*** 1.32***
FICO 350-550 10.80*** 3.78***
FICO 550-650 8.89*** 3.39***
FICO 650-750 6.11*** 3.25***
If full documentation 0.78*** 0.82***
Benefit of refinancing 0.33*** 0.98
If mortgage securitized 1.05 1.08
Lagged growth of house prices (zipcode) 0.006 0.02**
Lagged unemployment rate (county) 1.08*** 1.02
Lagged income growth (state) 0.54 0.96
Lagged avg bankruptcy rate (zipcode) 155** 12.99**
Deficiency judgments allowed 6.33* 1.36
State and year dummies? Y Y
Notes: The dependent variable is whether homeowners filed for bankruptcy. *, **, and *** indicate
statistical significance at the 5%, 1% and 0.1% levels, respectively.
35
Table 6:
Hazard Model Results Explaining Foreclosure as a Function of Past Bankruptcy
Prime mortgages Subprime
mortgages
Bankruptcy 1-3 months before 7.14*** 2.61***
Bankruptcy 4-6 months before 7.39*** 4.68***
Bankruptcy 7-24 months before 1.89* 1.56***
Bankruptcy reform dummy 1.48* 1.17*
If negative home equity 1.59 1.44**
If mortgage securitized 1.36*** 0.98
FICO 350-550 13.05*** 3.98***
FICO 550-650 10.25*** 3.05***
FICO 650-750 3.98*** 1.89***
If full documentation 0.80*** 0.87***
Benefit of refinancing 0.04*** 0.17***
Lagged growth of house prices
(zipcode) 0.00*** 0.003***
Lagged unemployment rate (county) 1.10*** 1.04***
Lagged income growth (state) 0.02*** 0.86
Lagged avg foreclosure rate (zipcode) 164*** 592***
Deficiency judgments allowed 1.59 1.19
State and year dummies? Y Y
Notes: The dependent variable is whether foreclosure started. *, **, and *** indicate
statistical significance at the 5%, 1% and 0.1% levels, respectively.
36
References
Adelino, Manuel, Kristopher S. Gerardi, and Paul Willen, "Why Don't Lenders Renegotiate More Home Mortgages? Redefaults, Self-Cures, and Securitization," . FRB Boston Public
Policy Discussion Paper Series, paper no. 09-4 (2009)
Berkowitz, Jeremy, and Richard Hynes, “Bankruptcy Exemptions and the Market for Mortgage
Loans,” J. of Law & Economics, 42, 809-830 (1999).
Bourguignon, George, “Interpretation of Bankruptcy Code 1322(c)(1): Arguing for a Bright-Line Approach to the Debtor’s Statutory Right to Cure a Residential Mortgage Default. 7 U.C.
Davis Bus. L.J. 461 (2007), pp. 461-496.
Campbell, John Y., Stefano Giglio, and Parag Pathak, “Forced Sales and House Prices,”
working paper, 2008.
Carroll, Sarah W., and Wenli Li, "The Homeownership Experience of Households in
Bankruptcy," Philadelphia Federal Reserve Bank Working Paper 08-14, August 2008.
Cordell, Larry, et al. “The Incentives of Mortgage Servicers: Myths and Realities,” Federal
Reserve Board, Finance and Economics Discussion Series 2008-46 (2008).
Dawsey, Amanda, and Larry Ausubel, “Informal Bankruptcy.”
http://ssrn.com/abstract=3321161 (2002).
Elias, Stephen, The Foreclosure Survival Guide, Nolo Press, 2009.
Elias, Stephen, Albin Renauer, and Robin Leonard, How to File for Chapter 7 Bankruptcy,
Nolo Press, various editions.
Eraslan, Hulya, Wenli Li, and Pierre-Daniel Sarte, “The Anatomy of U.S. Personal Bankruptcy
Under Chapter 13,” working paper 07-31, Philadelphia Federal Reserve Bank, Sept. 2007.
Fay, Scott, Erik Hurst, and Michelle J. White, "The Household Bankruptcy Decision," American Economic Review, vol. 92:3, June 2002, pp. 708-718. Goodman, Peter S., “Treasury Hails Milestone in Home Loan Modifications,” New York Times,
October 8, 2009.
Green, Richard K., and Michelle J. White, "Measuring the Benefits of Homeowning: Effects on
Children," J. of Urban Economics, vol. 41, 1997, pp. 441-461.
Gropp, Reint, J.Karl Scholz, and Michelle J. White, "Personal Bankruptcy and Credit Supply and
Demand," Quarterly Journal of Economics, vol. 112, pp. 217-251, Feb. 1997.
Government Accountability Office. “Bankruptcy Reform: Dollar Costs Associated with the
Bankruptcy Abuse Prevention and Consumer Protection Act of 2005,” U.S. GAO-08-697 (2008).
37
Immergluck, Dan, and Geoff Smith. 2006. “The External Costs of Foreclosure: The Impact of Single-Family Mortgage Foreclosures on Property Values.” 17 Housing Policy Debate 57
(2006).
Jacoby, Melissa, “Homeownership Risk Beyond a Subprime Crisis: The Role of Delinquency
Management,” Fordham Law Review 76, (2008).
Lawless, Robert M., et al, “Did Bankruptcy Reform Fail? An Empirical Study of Consumer
Debtors,” Am. Bank. L.J., vol. 82, 349-409 (2008).
Levitin, Adam J., and Joshua Goodman, “Mortgage Market Sensitivity to Bankruptcy Modification,” paper presented at the 2008 ALEA Conference, New York,
law.bepress.com/cgi/viewcontent.cgi?article=2485&context=alea.
Lawless, Robert M., et al, “Did Bankruptcy Reform Fail? An Empirical Study of Consumer Debtors,” Am. Bank. L.J., vol. 82, pp. 349-406 (2008). Levitin, Adam J., and Joshua Goodman. 2008. “Mortgage Market Sensitivity to Bankruptcy Modification.” Paper presented at the 2008 ALEA Conference, New York.
http://law.bepress.com/cgi/viewcontent.cgi?article=2485&context=alea
Li, Wenli, Michelle J. White, and Ning Zhu. “Did Bankruptcy Reform Contribute to the
Mortgage Crisis?” working paper, 2009.
Lin, Emily Y., and Michelle J. White, "Bankruptcy and the Market for Mortgage and Home
Improvement Loans," Journal of Urban Economics, vol. 50:1, July 2001 (138-162).
Livshits, Igor, James MacGee, and Michele Tertilt, “Consumer Bankruptcy: A Fresh Start,” The
American Economic Review, March 2007, Vol 97 (1), 402-418
Mann, Ronald, Charging Ahead: The Growth and Regulation of Credit Card Markets.
Mayer, Chris, and Karen Pence, “Subprime Mortgages: What, Where and To Whom?” Federal Reserve Board of Governors, working paper 29, Finance and Economics Discussion Series
(2008).
Morgan, Donald P., Benjamin Iverson, and Matthew Botsch, “Seismic Effects of the Bankruptcy
Reform,” Staff Report no. 358, Federal Reserve Bank of New York (2008).
Pence, Karen. “Foreclosing on Opportunity: State Laws and Mortgage Credit.” Rev. of Econs.
and Stats., 88(1), pp. 177-182 (2006).
Piskorski, T., A. Seru and V. Vig, “Securitization and Distressed Loan Renegotiation: Evidence from the Subprime Mortgage Crisis,” Chicago Booth Schools of Business Working Paper 09-02
(2009).
Porter, Katherine. 2008. “Misbehavior and Mistake in Bankruptcy Mortgage Claims,” 87 Texas Law Review. Available at papers.ssrn.com/sol3/papers.cfm?abstract_id=1027961.
38
Richard, Scott F., and Richard Roll, “Prepayments on Fixed-rate Mortgage-backed Securities,”
Journal of Portfolio Management, vol. 15(3), 73-82 (1989).
White, Michelle J., "Bankruptcy Reform and Credit Cards," J. of Economic Perspectives, Fall
2007, pp. 175-199.
White, Michelle J., and Ning Zhu, “Saving Your Home in Chapter 13 Bankruptcy,” Journal of
Legal Studies, 2010.
Zhu, Ning, “Household Consumption and Personal Bankruptcy,” (2008), Journal of Legal
Studies, forthcoming.