Embed Size (px)
Citation preview

Mortality Improvement Scale MP-2016
October 2016

2
© 2016 Society of Actuaries
Mortality Improvement Scale MP-2016
AUTHOR(S)
Mortality Improvement
Subcommittee of the Retirement
Plans Experience Committee
Caveat and Disclaimer This study is published by the Society of Actuaries (SOA) and contains information from a variety of sources. It may or may not reflect the experience of any individual company. The study is for informational purposes only and should not be construed as professional or financial advice. The SOA does not recommend or endorse any particular use of the information provided in this study. The SOA makes no warranty, express or implied, or representation whatsoever and assumes no liability in connection with the use or misuse of this study. Copyright ©2016 All rights reserved by the Society of Actuaries
3
© 2016 Society of Actuaries
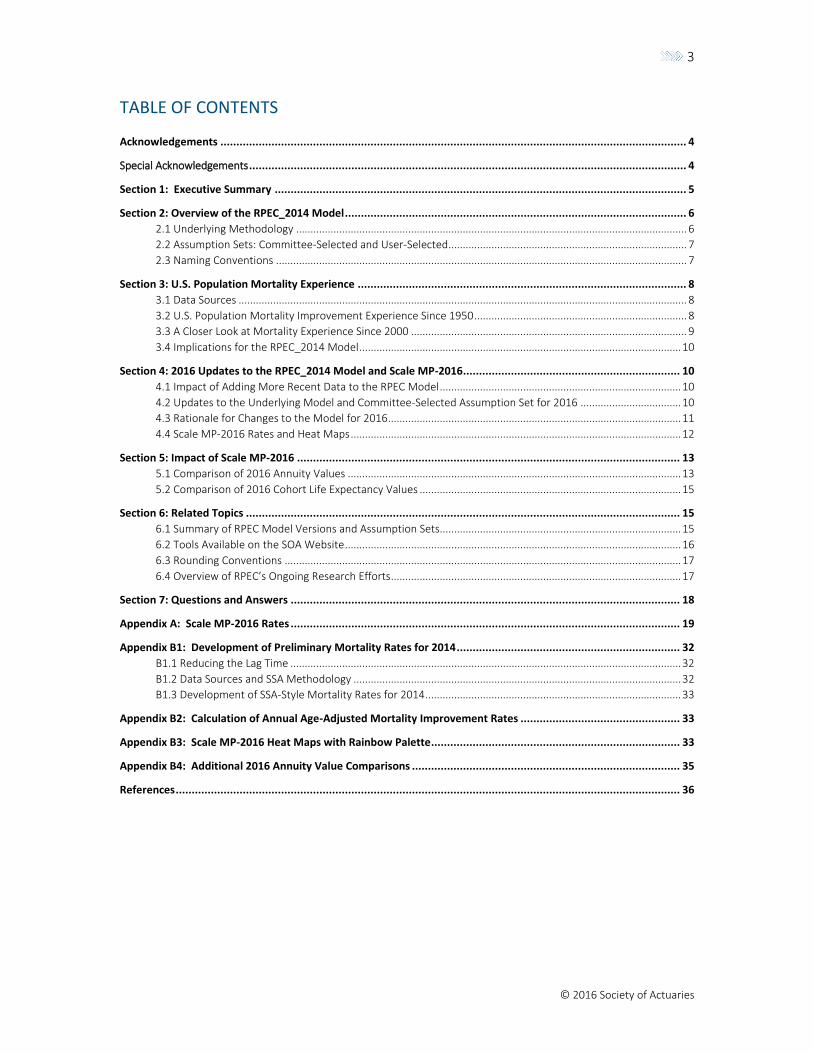
TABLE OF CONTENTS
Acknowledgements .................................................................................................................................................. 4
Special Acknowledgements ......................................................................................................................................... 4
Section 1: Executive Summary ................................................................................................................................. 5
Section 2: Overview of the RPEC_2014 Model ........................................................................................................... 6 2.1 Underlying Methodology ........................................................................................................................................ 6 2.2 Assumption Sets: Committee-Selected and User-Selected ................................................................................... 7 2.3 Naming Conventions ............................................................................................................................................... 7
Section 3: U.S. Population Mortality Experience ....................................................................................................... 8 3.1 Data Sources ............................................................................................................................................................ 8 3.2 U.S. Population Mortality Improvement Experience Since 1950 .......................................................................... 8 3.3 A Closer Look at Mortality Experience Since 2000 ................................................................................................ 9 3.4 Implications for the RPEC_2014 Model ................................................................................................................ 10
Section 4: 2016 Updates to the RPEC_2014 Model and Scale MP-2016 .................................................................... 10 4.1 Impact of Adding More Recent Data to the RPEC Model .................................................................................... 10 4.2 Updates to the Underlying Model and Committee-Selected Assumption Set for 2016 ................................... 10 4.3 Rationale for Changes to the Model for 2016 ...................................................................................................... 11 4.4 Scale MP-2016 Rates and Heat Maps ................................................................................................................... 12
Section 5: Impact of Scale MP-2016 ........................................................................................................................ 13 5.1 Comparison of 2016 Annuity Values .................................................................................................................... 13 5.2 Comparison of 2016 Cohort Life Expectancy Values ........................................................................................... 15
Section 6: Related Topics ........................................................................................................................................ 15 6.1 Summary of RPEC Model Versions and Assumption Sets.................................................................................... 15 6.2 Tools Available on the SOA Website ..................................................................................................................... 16 6.3 Rounding Conventions .......................................................................................................................................... 17 6.4 Overview of RPEC’s Ongoing Research Efforts ..................................................................................................... 17
Section 7: Questions and Answers .......................................................................................................................... 18
Appendix A: Scale MP-2016 Rates .......................................................................................................................... 19
Appendix B1: Development of Preliminary Mortality Rates for 2014 ...................................................................... 32 B1.1 Reducing the Lag Time ........................................................................................................................................ 32 B1.2 Data Sources and SSA Methodology .................................................................................................................. 32 B1.3 Development of SSA-Style Mortality Rates for 2014 ......................................................................................... 33
Appendix B2: Calculation of Annual Age-Adjusted Mortality Improvement Rates .................................................. 33
Appendix B3: Scale MP-2016 Heat Maps with Rainbow Palette .............................................................................. 33
Appendix B4: Additional 2016 Annuity Value Comparisons .................................................................................... 35
References .............................................................................................................................................................. 36

4
© 2016 Society of Actuaries
Mortality Improvement Scale MP-2016
Acknowledgements
The SOA would like to thank the Retirement Plans Experience Committee for their support, guidance,
direction and feedback throughout the project.
Members of the Retirement Plans Experience Committee:
(Members of the Mortality Improvement subcommittee are denoted with an asterisk.)
David T. Kausch,* Chairperson James G. Berberian* Elena V. Black* Feng Ling Chen Andrew D. Eisner Timothy J. Geddes* Robert C.W. Howard* Jeffrey Litwin* Eric John Minute* C. Allen Pinkham IV* Laurence Pinzur* Barthus J. Prien Patricia A. Pruitt Robert A. Pryor William E. Roberts* Charles Kenneth Vogl* Kevin James Woodrich Eva Sau Ying Yum Peter M. Zouras
Cynthia MacDonald, SOA Senior Experience Studies Actuary
Patrick D. Nolan, SOA Experience Studies Actuary
Andrew J. Peterson, SOA Staff Fellow—Retirement
Erika Schulty, SOA Research Associate
Special Acknowledgements
The vast majority of the ongoing research described in this report was performed by members of the
Mortality Improvement subcommittee. The SOA acknowledges the outstanding work performed by this
group and thanks them for their considerable efforts. The SOA would also like to thank the Office of the
Chief Actuary at the Social Security Administration for its assistance with the development of preliminary
mortality rates for 2014.
5
© 2016 Society of Actuaries
Section 1: Executive Summary
As announced in the Mortality Improvement Scale MP-2015 Report (the “MP-2015 Report”) [SOA 2015],
the Retirement Plans Experience Committee of the Society of Actuaries (RPEC) intends to publish annual
updates to the RPEC_2014 model and corresponding mortality improvement scales. The resulting 2016
version of the model presented in this report reflects three additional years of historical U.S. population
mortality data1 (for 2012, 2013 and 2014) and modification of two input values (described in Section 4)
designed to improve the model’s year-over-year stability. Scale MP-2016 is based on this 2016 version of
the RPEC_2014 model along with the committee-selected assumption set for 2016.
For the ten years ending in 2009 the average annual age-adjusted mortality improvement rates2 in the
United States for those between ages 50 and 95 were 1.93% for males and 1.46% for females. The
corresponding averages for the five-year period ended in 2014 were 0.60% and 0.42%, respectively. As a
result of this pattern, the Scale MP-2016 rates presented in this report are generally lower than Scale MP-
2015 rates, which were lower than Scale MP-2014 rates.
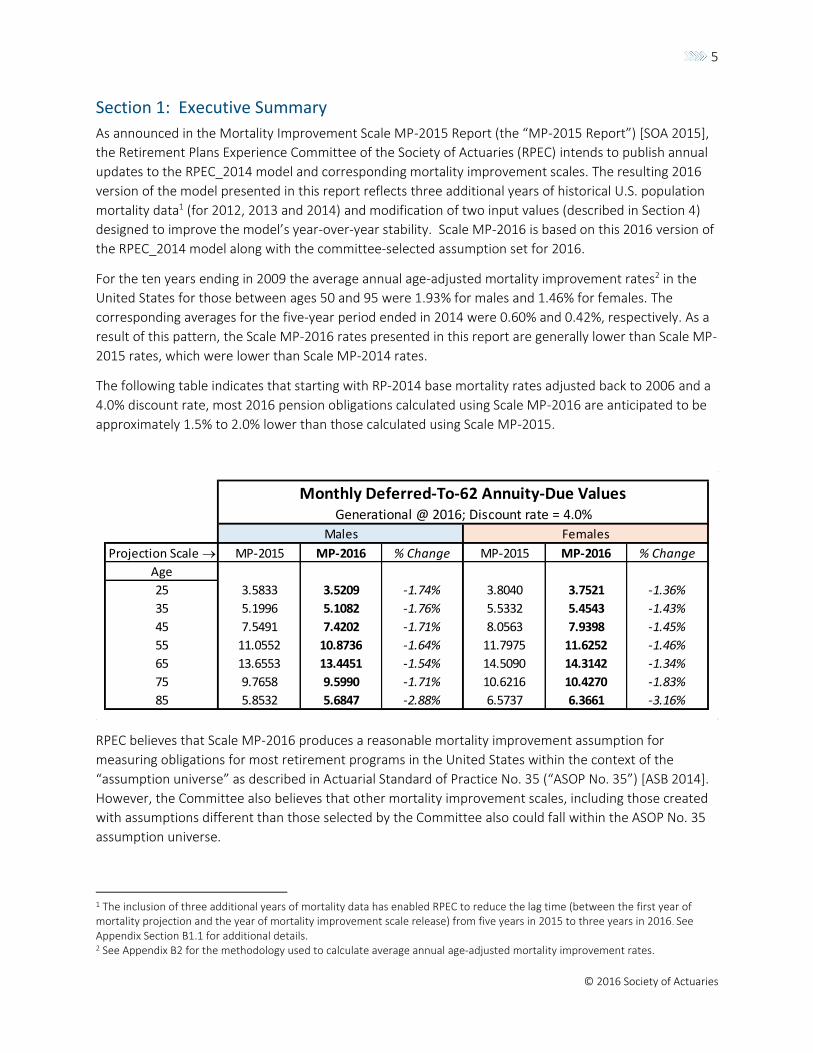
The following table indicates that starting with RP-2014 base mortality rates adjusted back to 2006 and a
4.0% discount rate, most 2016 pension obligations calculated using Scale MP-2016 are anticipated to be
approximately 1.5% to 2.0% lower than those calculated using Scale MP-2015.
RPEC believes that Scale MP-2016 produces a reasonable mortality improvement assumption for
measuring obligations for most retirement programs in the United States within the context of the
“assumption universe” as described in Actuarial Standard of Practice No. 35 (“ASOP No. 35”) [ASB 2014].
However, the Committee also believes that other mortality improvement scales, including those created
with assumptions different than those selected by the Committee also could fall within the ASOP No. 35
assumption universe.
1 The inclusion of three additional years of mortality data has enabled RPEC to reduce the lag time (between the first year of mortality projection and the year of mortality improvement scale release) from five years in 2015 to three years in 2016. See Appendix Section B1.1 for additional details. 2 See Appendix B2 for the methodology used to calculate average annual age-adjusted mortality improvement rates.
Projection Scale MP-2015 MP-2016 % Change MP-2015 MP-2016 % Change
Age
25 3.5833 3.5209 -1.74% 3.8040 3.7521 -1.36%
35 5.1996 5.1082 -1.76% 5.5332 5.4543 -1.43%
45 7.5491 7.4202 -1.71% 8.0563 7.9398 -1.45%
55 11.0552 10.8736 -1.64% 11.7975 11.6252 -1.46%
65 13.6553 13.4451 -1.54% 14.5090 14.3142 -1.34%
75 9.7658 9.5990 -1.71% 10.6216 10.4270 -1.83%
85 5.8532 5.6847 -2.88% 6.5737 6.3661 -3.16%
Generational @ 2016; Discount rate = 4.0%
Males Females
Monthly Deferred-To-62 Annuity-Due Values
6
© 2016 Society of Actuaries
The SOA has made available on its website an Excel-based tool that incorporates the updated mortality
data through 2014, and that permits users to generate alternate two-dimensional mortality improvement
scales based on user-selected assumption sets.
Section 2: Overview of the RPEC_2014 Model
2.1 Underlying Methodology As described in Section 3.1 of the Mortality Improvement Scale MP-2014 Report (the “MP-2014 Report”)
[SOA 2014b], three concepts underpin RPEC’s current mortality improvement methodology:
Short-term mortality improvement rates should be based on recent experience.
Long-term mortality improvement rates should be based on expert opinion.
Short-term mortality improvement rates should blend smoothly into the assumed long-term
rates over an appropriate transition period.
The resulting gender-specific model, denoted RPEC_2014, is developed through the following steps:
1. Two-dimensional Whittaker-Henderson graduation based on the natural logarithm of the
historical U.S. population mortality rates (starting from 1950) published by the Social Security
Administration (SSA) in conjunction with their annual releases of the OASDI Trustees’ Reports.
2. Projection of future mortality improvement rates (after a step-back from the most recent year of
graduated rates to mitigate “edge effects” introduced through the graduation process) using two
sets of interpolating cubic polynomials,3 one set projecting future rates horizontally along fixed
ages and the other projecting future rates diagonally along fixed year-of-birth cohorts. Each of
the cubic polynomials is determined by two specific values and two specific slopes as follows:
o The starting value is the last improvement rate obtained from the graduation, after step-
back.
o The ending value is the assumed long-term rate of mortality improvement for the
corresponding age or year of birth.
o The starting slope is determined from the last two graduated improvement rates (after
step-back) subject to a maximum absolute value, along fixed ages for the horizontal
projection component and along fixed year-of-birth cohorts for the diagonal projection
component.
o The ending slope is zero.
3. Blending the values generated by the horizontal and diagonal interpolating polynomials.
3 The general formulas for the interpolating cubic polynomials can be found in Appendix B of the MP-2014 Report.

7
© 2016 Society of Actuaries
2.2 Assumption Sets: Committee-Selected and User-Selected
The calculation of the specific cubic polynomials described in step 2 of the preceding section requires the
selection of assumptions regarding the long-term rates of future mortality improvement and the
convergence periods for both the horizontal and diagonal interpolating polynomials.4 The third
assumption above specifies the relative weighting of the separate horizontal and diagonal projection
components.
Scale MP-2014 and Scale MP-2015 were both developed using the same set of committee-selected
assumptions:5
Long-term mortality improvement rates equal to 1.00% through age 85 with a linear decrease
from 1.00% at age 85 to 0.85% at age 95, followed by a linear decrease from 0.85% at age 95 to
zero at age 115
Convergence periods of 20 years for both of the horizontal and diagonal interpolations and
An equal (50%/50%) weighting of the resulting horizontal and diagonal projection components.
Alternate mortality improvement scales developed with inputs other than those selected by RPEC could
lie within an appropriate assumptions universe.6 Software is available on the SOA website that enables
users to develop two-dimensional mortality improvement scales based on assumption sets other than
those selected by the Committee; see Section 6.2 for additional details.
2.3 Naming Conventions
With the advent of annual updates to the RPEC mortality improvement model, it has become more
important for actuaries to be very clear in identifying the appropriate version of the model being utilized
in a given application. The Committee requests that the model be referred to with the calendar year of
release;7 specifically:
“RPEC_2014_v2014” for the model underpinning Scale MP-2014
“RPEC_2014_v2015” for the model underpinning Scale MP-2015
“RPEC_2014_v2016” for the model underpinning Scale MP-2016
In this report, these models are generally referred to as the 2014, 2015, and 2016 “versions”,
respectively, of the underlying model.
4 See Section 4 of the Scale MP-2014 Report for a discussion of these assumptions. 5 While not required as part of the underlying methodology, the same assumption sets were used to develop both the male and female mortality improvement rates in Scale MP-2014 and Scale MP-2015. 6 RPEC directs actuaries to the relevant standards of practice, including ASOP No. 35, for guidance on the selection of reasonable assumption sets that could be used in connection with the RPEC_2014 model. 7 This represents a change from the naming convention previously proposed for the 2015 version of the model; compare with footnote # 1 of the MP-2015 Report.

8
© 2016 Society of Actuaries
Section 3: U.S. Population Mortality Experience
3.1 Data Sources
The historical mortality rates published by the SSA in conjunction with the annual release of their
Trustees’ Reports underpin the data component of the RPEC_2014 model. The original model from which
Scale MP-2014 was constructed reflected historical SSA mortality data for the years 1950 through 2009,
and the 2015 version of the model included two additional years (2010 and 2011) of SSA-published
mortality data. The 2016 version presented in this report incorporates two additional years of SSA data
(for 2012 and 2013), along with preliminary mortality rates for 2014 that RPEC has constructed following
procedures described in SSA’s Actuarial Study No. 120 [SSA 2005]; see Appendix B1 of this report for
additional details.
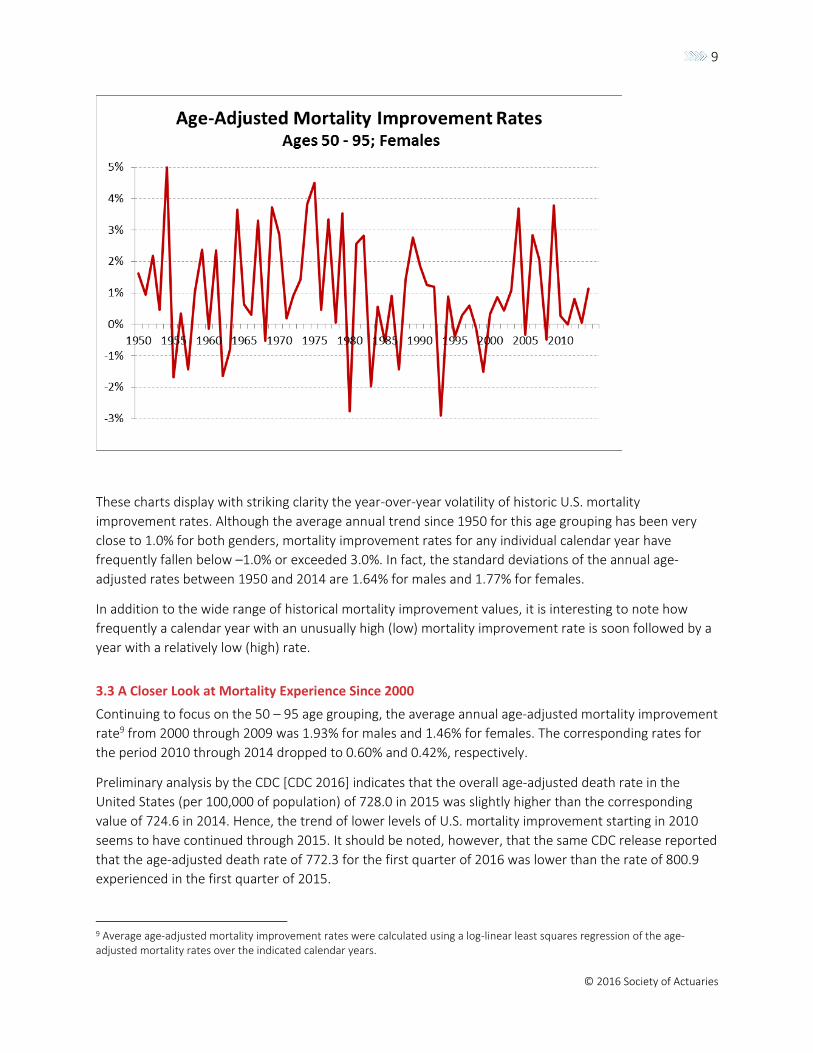
3.2 U.S. Population Mortality Improvement Experience Since 1950
The following two charts display the ungraduated annual age-adjusted mortality improvement rates8 for
males and females (covering ages 50 through 95) for each year starting in 1950 through 2014 based on
the mortality data described in Section 3.1.
8 See Appendix B2 for the methodology used to calculate annual age-adjusted mortality improvement rates.
9
© 2016 Society of Actuaries
These charts display with striking clarity the year-over-year volatility of historic U.S. mortality
improvement rates. Although the average annual trend since 1950 for this age grouping has been very
close to 1.0% for both genders, mortality improvement rates for any individual calendar year have
frequently fallen below –1.0% or exceeded 3.0%. In fact, the standard deviations of the annual age-
adjusted rates between 1950 and 2014 are 1.64% for males and 1.77% for females.
In addition to the wide range of historical mortality improvement values, it is interesting to note how
frequently a calendar year with an unusually high (low) mortality improvement rate is soon followed by a
year with a relatively low (high) rate.
3.3 A Closer Look at Mortality Experience Since 2000
Continuing to focus on the 50 – 95 age grouping, the average annual age-adjusted mortality improvement
rate9 from 2000 through 2009 was 1.93% for males and 1.46% for females. The corresponding rates for
the period 2010 through 2014 dropped to 0.60% and 0.42%, respectively.
Preliminary analysis by the CDC [CDC 2016] indicates that the overall age-adjusted death rate in the
United States (per 100,000 of population) of 728.0 in 2015 was slightly higher than the corresponding
value of 724.6 in 2014. Hence, the trend of lower levels of U.S. mortality improvement starting in 2010
seems to have continued through 2015. It should be noted, however, that the same CDC release reported
that the age-adjusted death rate of 772.3 for the first quarter of 2016 was lower than the rate of 800.9
experienced in the first quarter of 2015.
9 Average age-adjusted mortality improvement rates were calculated using a log-linear least squares regression of the age-adjusted mortality rates over the indicated calendar years.

10
© 2016 Society of Actuaries
3.4 Implications for the RPEC_2014 Model
The significant fluctuations in the annual pattern of historical U.S. mortality improvement present a
challenge to those attempting to model the future pattern of these rates. RPEC’s goal has been to smooth
out the year-by-year fluctuations in a way that neither puts too much emphasis on the most recent
history nor completely ignores it.
More refined backtesting analysis10 performed by RPEC has confirmed that the overall “MP”
methodology (underlying RPEC_2014 model plus committee-selected assumption sets) used in 2014 and
2015 has exhibited a higher degree of year-over-year volatility than the Committee considers desirable
for a long-term demographic assumption. That ongoing research also revealed that modifying two inputs
to the model enhanced the year-over-year stability in backtesting analysis. The 2016 version of the
model and the resulting Scale MP-2016 described in this report incorporate those modifications, as
described in Section 4.2.
Section 4: 2016 Updates to the RPEC_2014 Model and Scale MP-2016 4.1 Impact of Adding More Recent Data to the RPEC Model As presented in Section 3, U.S. population mortality improvement experience over the five-year period
covering 2010 through 2014 was lower than the long-term average since 1950 and considerably lower
than the average over the period 2000 through 2009. The inclusion of two additional years of SSA
mortality data (for 2010 and 2011) to the underlying graduation process resulted in a notable decrease in
the Scale MP-2015 mortality improvement rates relative to those in Scale MP-2014, with a concomitant
reduction in the actuarial present value of retirement program obligations.
The Committee initially developed a set of 2016 mortality improvement rates based on the 2015 version
of the RPEC_2014 model updated to reflect the newly available mortality data for all three calendar years
2012 through 2014, with the same committee-selected assumption set used to develop Scales MP-2014
and MP-2015. This process revealed that the combined impact of (1) the graduation methodology, (2) the
initial slopes of the interpolating polynomials and (3) the length of the convergence periods has produced
an unacceptably high level of volatility, even when a single year of new historical data is reflected, let
alone three years of new data.11
4.2 Updates to the Underlying Model and Committee-Selected Assumption Set for 2016
Since the release of the MP-2014 Report in October 2014, the Committee has been committed to an
ongoing assessment of the RPEC methodology and model inputs. Specifically, RPEC’s Mortality
Improvement subcommittee has been performing extensive backtesting analyses comparing the
effectiveness of the 2014 and 2015 versions of the RPEC model to a number of alternate approaches. The
goal of this activity is to identify mortality improvement models that exhibit year-over-year stability while
10 For additional details on RPEC’s ongoing research efforts, see Section 6.4. 11 A table of deferred-to-age-62 annuity values (calculated at a discount rate of 4.0%) that resulted from this “no changes other than three additional years of historical data” approach can be found in Appendix B4.

11
© 2016 Society of Actuaries
simultaneously satisfying certain historical fit and forecast accuracy criteria. A more detailed summary of
the Committee’s ongoing research is included in Section 6.4.
As a result of the research performed to date, RPEC has been able to identify the following modifications
that are expected to enhance the current RPEC model (and consequently the resulting mortality
improvement scales), particularly with respect to year-over-year stability:
The initial slope constraint (the absolute value of the maximum permitted slope for each
interpolating polynomial at the beginning of the convergence period) was recharacterized from
an internal model parameter (fixed at 0.003) to a user-selected assumption, and the 2016
committee-selected value for this assumption was set equal to zero.
The 2016 committee-selected convergence period for the horizontal interpolation component of
the model was reduced from 20 years to 10 years.12
The impact of each of these changes on 2016 monthly deferred-to-age-62 annuity values can be found in
Appendix B4. Note that constraining the initial slope to zero means that 50% of the difference between
the beginning and ending values of each interpolating polynomial is attained at precisely half way through
the convergence period.
A summary of the RPEC_2014 model versions and committee-selected assumption sets for 2014, 2015
and 2016 can be found in Section 6.1.
4.3 Rationale for Changes to the Model for 2016
In its original development of the RPEC_2014 model, the Committee determined that adding a maximum
absolute value component to the starting slope of the interpolating polynomials moderated the year-
over-year volatility of the model. At that time, the Committee was of the opinion that an initial slope
constraint of 0.003 would produce sufficiently stable mortality improvement scales.
As part of its ongoing research project, RPEC has determined that the initial slopes of the interpolating
cubic polynomials have a more significant impact on the model’s year-over-year volatility than originally
anticipated. In fact, the backtesting analyses performed by the Committee indicated that reducing the
absolute value of initial slope of the interpolating polynomials substantially enhanced the model’s stability
without diminishing its overall forecast accuracy.
Historical analysis of the U.S. mortality data performed by the Committee has suggested that the average
length of the horizontal period of the mortality improvement rates is likely shorter than 20 years.
Moreover, the backtesting analyses revealed that reducing the horizontal (age/period) convergence
period from 20 years to 10 years improved the RPEC_2014 model’s stability and forecast accuracy. The
Committee continues to investigate the persistence of the diagonal (cohort) effects, as well as alternate
cohort component methodologies. Given the ongoing nature of that cohort research, RPEC has decided
to retain a 20-year convergence period for the diagonal component of Scale MP-2016.
12 The 2016 committee-selected convergence period for the diagonal interpolation component remains at 20 years.
12
© 2016 Society of Actuaries
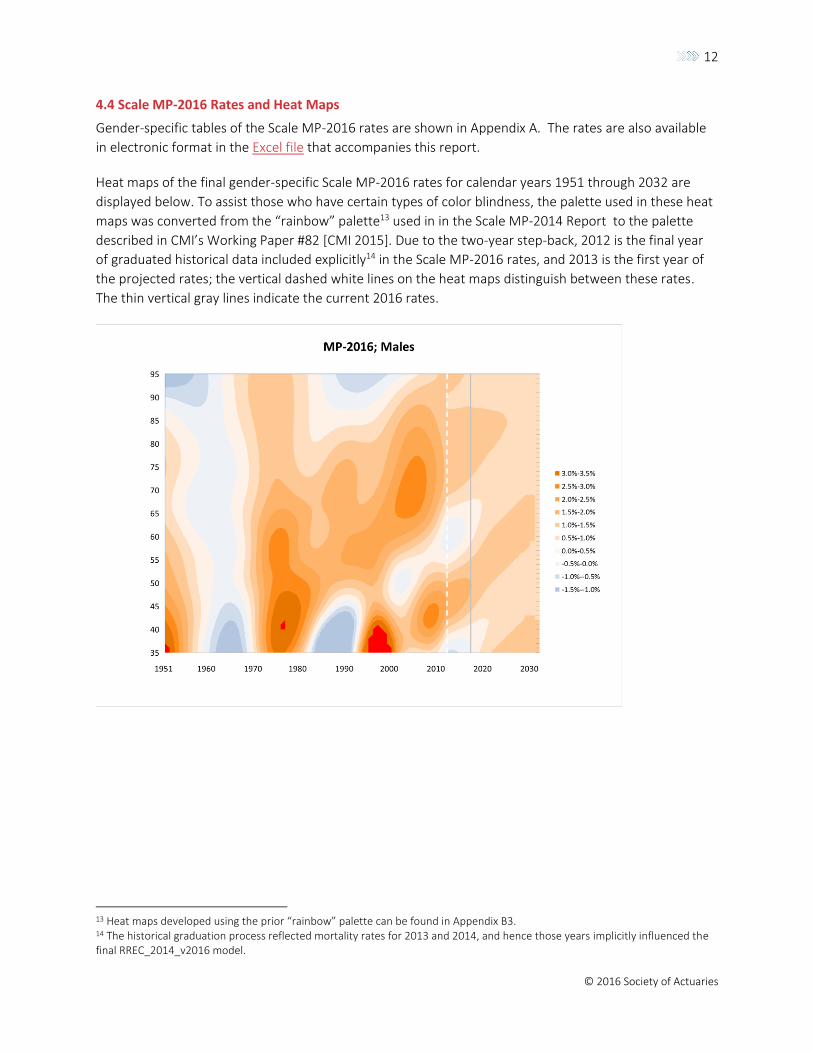
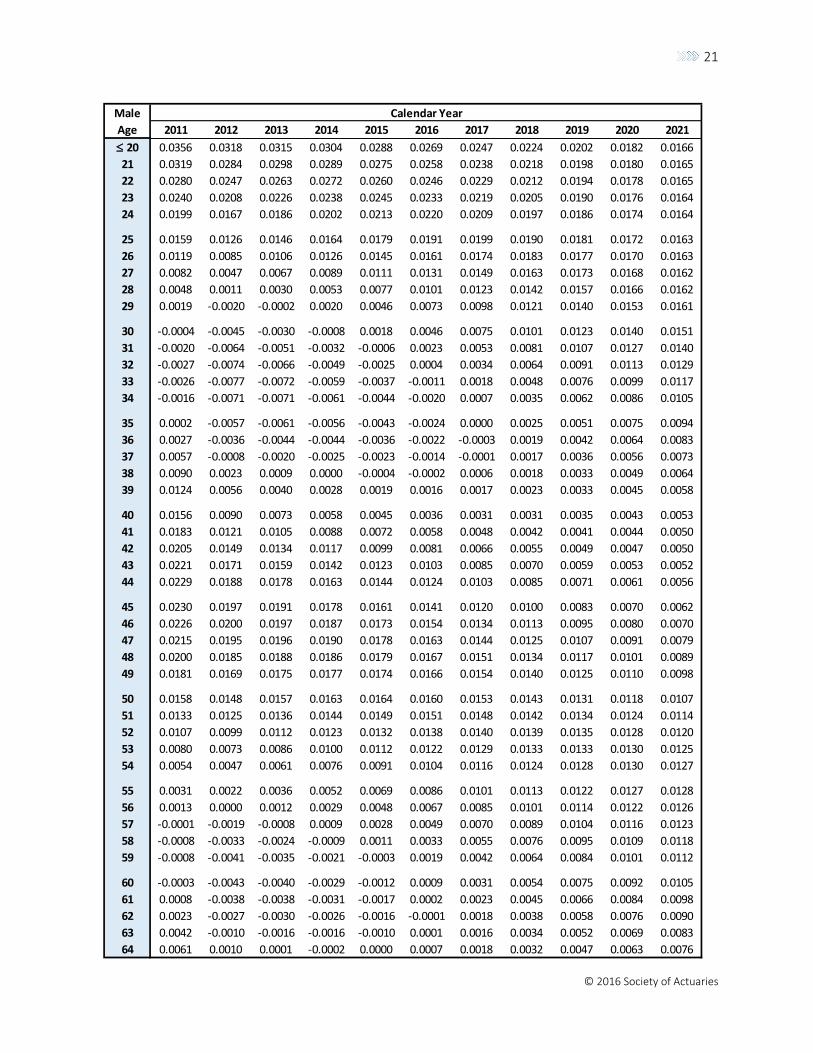
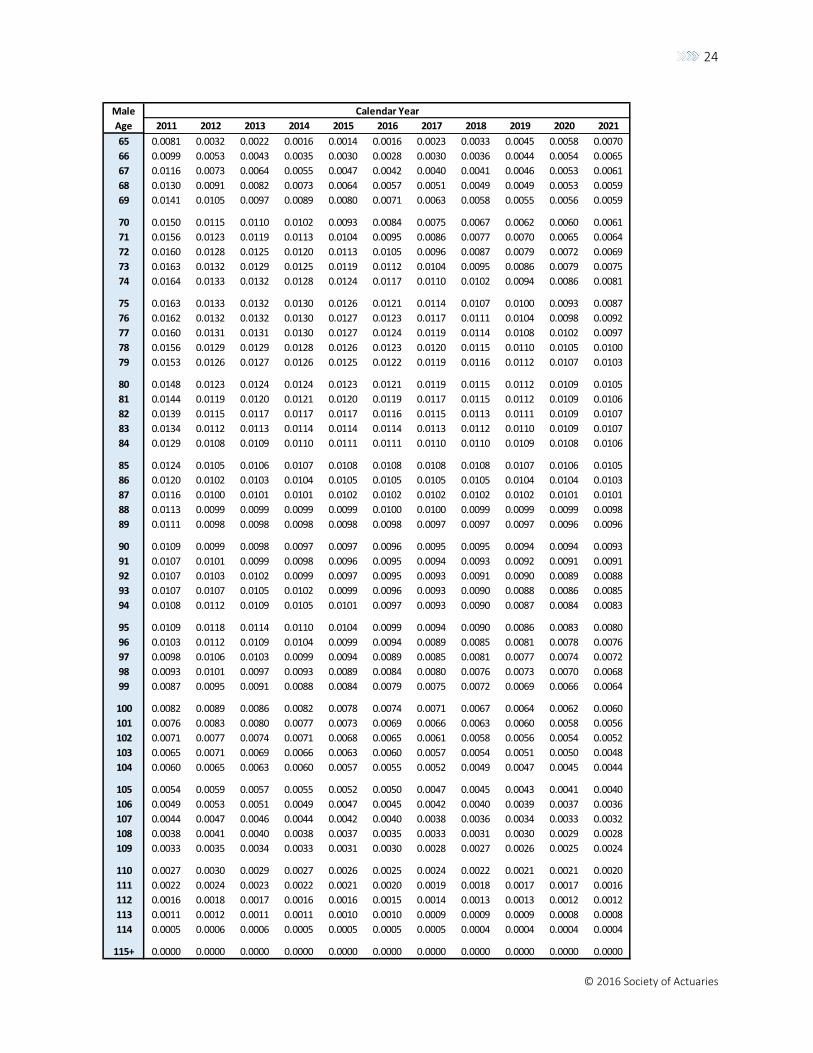
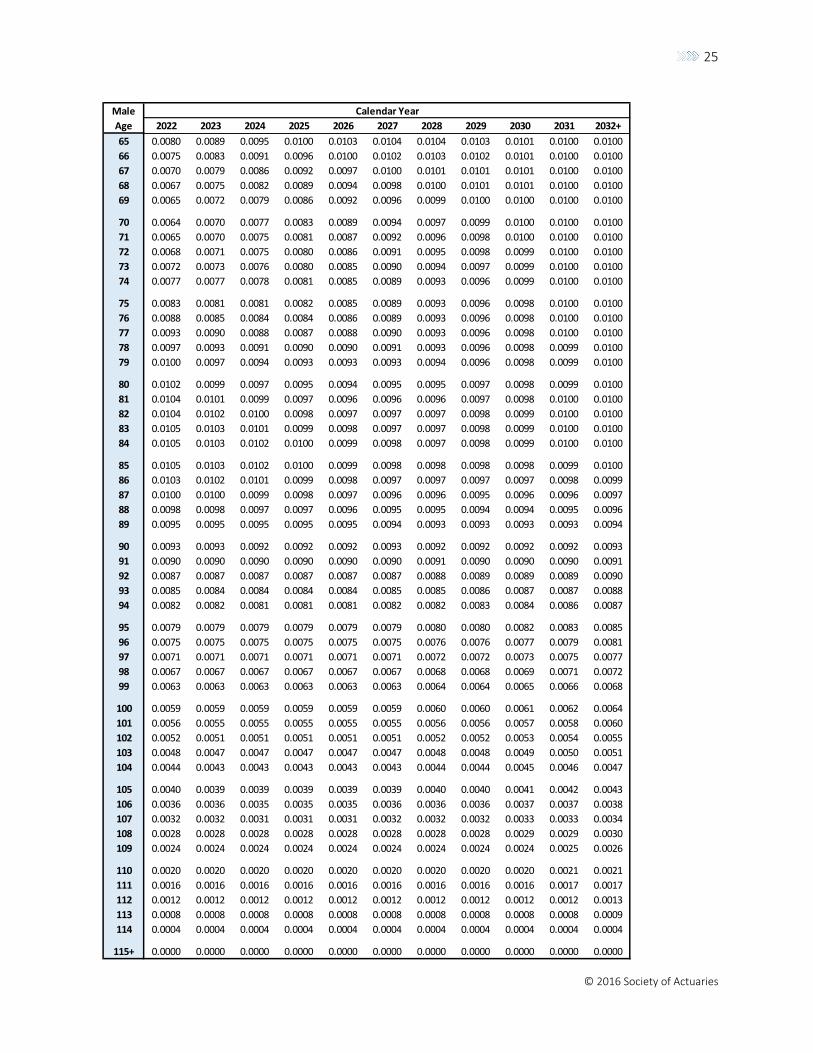
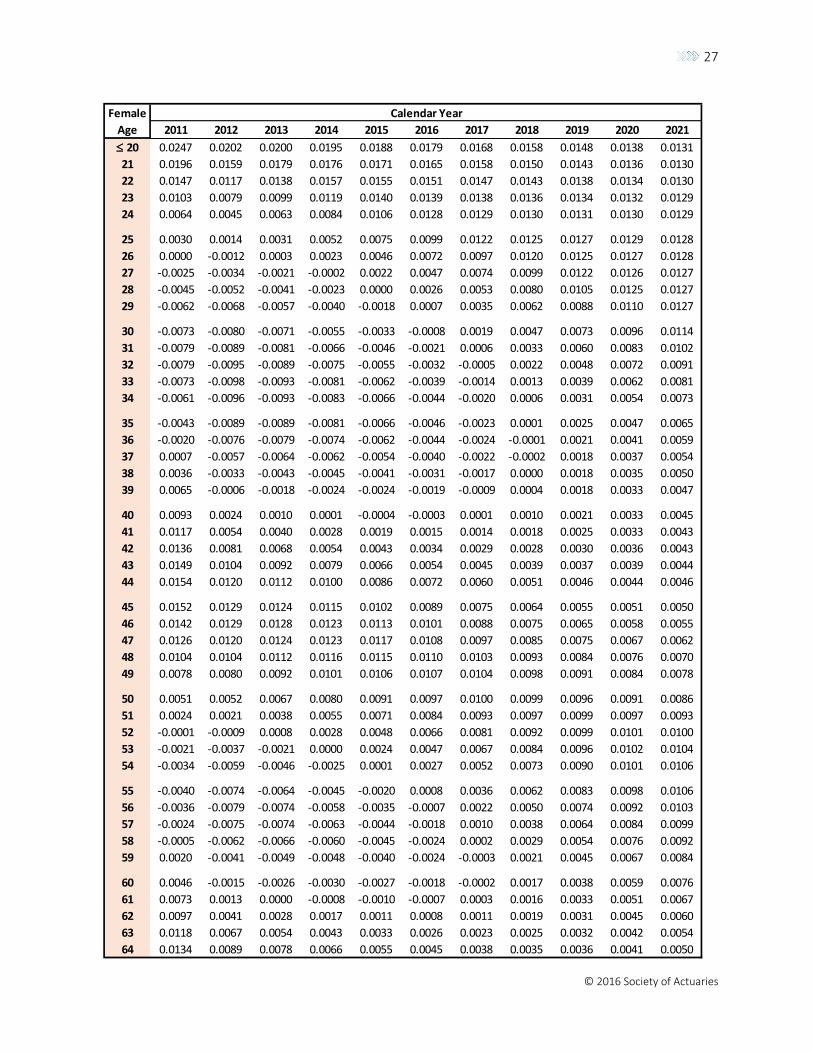
4.4 Scale MP-2016 Rates and Heat Maps
Gender-specific tables of the Scale MP-2016 rates are shown in Appendix A. The rates are also available
in electronic format in the Excel file that accompanies this report.
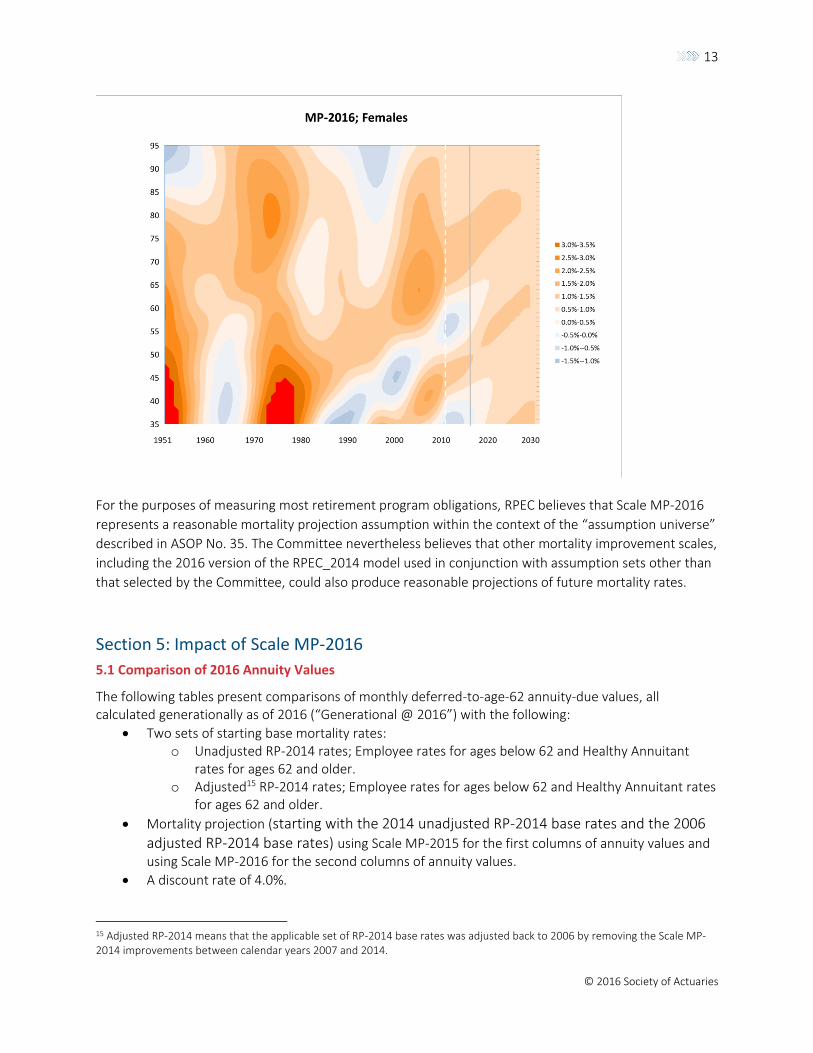
Heat maps of the final gender-specific Scale MP-2016 rates for calendar years 1951 through 2032 are
displayed below. To assist those who have certain types of color blindness, the palette used in these heat
maps was converted from the “rainbow” palette13 used in in the Scale MP-2014 Report to the palette
described in CMI’s Working Paper #82 [CMI 2015]. Due to the two-year step-back, 2012 is the final year
of graduated historical data included explicitly14 in the Scale MP-2016 rates, and 2013 is the first year of
the projected rates; the vertical dashed white lines on the heat maps distinguish between these rates.
The thin vertical gray lines indicate the current 2016 rates.
13 Heat maps developed using the prior “rainbow” palette can be found in Appendix B3. 14 The historical graduation process reflected mortality rates for 2013 and 2014, and hence those years implicitly influenced the final RREC_2014_v2016 model.
13
© 2016 Society of Actuaries
For the purposes of measuring most retirement program obligations, RPEC believes that Scale MP-2016
represents a reasonable mortality projection assumption within the context of the “assumption universe”
described in ASOP No. 35. The Committee nevertheless believes that other mortality improvement scales,
including the 2016 version of the RPEC_2014 model used in conjunction with assumption sets other than
that selected by the Committee, could also produce reasonable projections of future mortality rates.
Section 5: Impact of Scale MP-2016
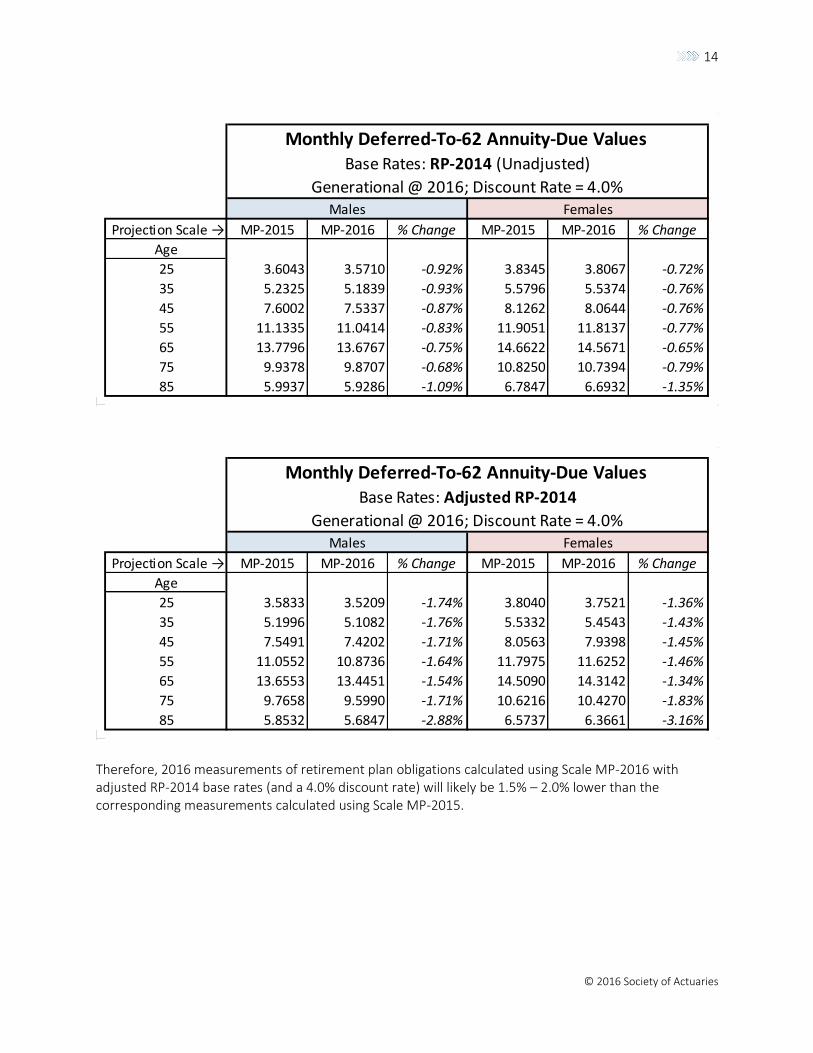
5.1 Comparison of 2016 Annuity Values The following tables present comparisons of monthly deferred-to-age-62 annuity-due values, all calculated generationally as of 2016 (“Generational @ 2016”) with the following:
Two sets of starting base mortality rates: o Unadjusted RP-2014 rates; Employee rates for ages below 62 and Healthy Annuitant
rates for ages 62 and older. o Adjusted15 RP-2014 rates; Employee rates for ages below 62 and Healthy Annuitant rates
for ages 62 and older.
Mortality projection (starting with the 2014 unadjusted RP-2014 base rates and the 2006 adjusted RP-2014 base rates) using Scale MP-2015 for the first columns of annuity values and using Scale MP-2016 for the second columns of annuity values.
A discount rate of 4.0%.
15 Adjusted RP-2014 means that the applicable set of RP-2014 base rates was adjusted back to 2006 by removing the Scale MP-2014 improvements between calendar years 2007 and 2014.
14
© 2016 Society of Actuaries
Therefore, 2016 measurements of retirement plan obligations calculated using Scale MP-2016 with adjusted RP-2014 base rates (and a 4.0% discount rate) will likely be 1.5% – 2.0% lower than the corresponding measurements calculated using Scale MP-2015.
Projection Scale → MP-2015 MP-2016 % Change MP-2015 MP-2016 % Change
Age
25 3.6043 3.5710 -0.92% 3.8345 3.8067 -0.72%
35 5.2325 5.1839 -0.93% 5.5796 5.5374 -0.76%
45 7.6002 7.5337 -0.87% 8.1262 8.0644 -0.76%
55 11.1335 11.0414 -0.83% 11.9051 11.8137 -0.77%
65 13.7796 13.6767 -0.75% 14.6622 14.5671 -0.65%
75 9.9378 9.8707 -0.68% 10.8250 10.7394 -0.79%
85 5.9937 5.9286 -1.09% 6.7847 6.6932 -1.35%
Monthly Deferred-To-62 Annuity-Due Values Base Rates: RP-2014 (Unadjusted)
Generational @ 2016; Discount Rate = 4.0%Males Females
Projection Scale → MP-2015 MP-2016 % Change MP-2015 MP-2016 % Change
Age
25 3.5833 3.5209 -1.74% 3.8040 3.7521 -1.36%
35 5.1996 5.1082 -1.76% 5.5332 5.4543 -1.43%
45 7.5491 7.4202 -1.71% 8.0563 7.9398 -1.45%
55 11.0552 10.8736 -1.64% 11.7975 11.6252 -1.46%
65 13.6553 13.4451 -1.54% 14.5090 14.3142 -1.34%
75 9.7658 9.5990 -1.71% 10.6216 10.4270 -1.83%
85 5.8532 5.6847 -2.88% 6.5737 6.3661 -3.16%
Monthly Deferred-To-62 Annuity-Due Values
Generational @ 2016; Discount Rate = 4.0%Males Females
Base Rates: Adjusted RP-2014

15
© 2016 Society of Actuaries
5.2 Comparison of 2016 Cohort Life Expectancy Values
The following table presents a comparison of 2016 complete cohort life expectancy values16 at the indicated ages, all calculated using the following:
Base mortality rates equal to RP-2014 Employee rates adjusted to 2006 for ages below 62 and RP-2014 Healthy Annuitant rates adjusted to 2006 for ages 62 and older and
Mortality projection starting in 2006 using Scale MP-2015 for the first columns of annuity values and using Scale MP-2016 for the second columns.
Section 6: Related Topics
6.1 Summary of RPEC Model Versions and Assumption Sets
The following table summarizes the features reflected in each of the three versions of the RPEC model.
16 In contrast to the monthly annuity values calculated generationally with a 0.0% discount rate displayed in Appendix D-3 of the RP-2014 Report [SOA 2014a], the life expectancy values presented in this report were calculated as complete cohort life expectancies, which are smaller than the corresponding 0.0% monthly annuity values by a constant 1/24th of a year.
Projection Scale: MP-2015 MP-2016 % Change MP-2015 MP-2016 % Change
Age
25 62.6523 61.9359 -1.14% 65.1696 64.5337 -0.98%
35 51.9097 51.2297 -1.31% 54.3939 53.7593 -1.17%
45 41.2034 40.5796 -1.51% 43.6843 43.0691 -1.41%
55 30.7789 30.2001 -1.88% 33.1765 32.5759 -1.81%
65 21.2662 20.7835 -2.27% 23.2673 22.7703 -2.14%
75 13.2471 12.9353 -2.35% 14.7920 14.4060 -2.61%
85 7.0276 6.7826 -3.49% 8.0648 7.7509 -3.89%
2016 Cohort Life Expectancies (Complete) At the Indicated Ages
Males Females
Model Component RPEC_2014_v2014 RPEC_2014_v2015 RPEC_2014_v2016
Underlying Mortality Data SSA-published through
2009
SSA-published through
2011
SSA-published through
2013, plus preliminary
data for 2014
Graduation Technique
W-H Smoothing Parameters
Edge Effect Step-back
Interpolating Polynomials
Initial Slope Constraint User-selected
2D Whittaker-Henderson; Order 3
2 Years
Cubics, matching the value and initial slope (subject to the initial slope
constraint) at beginning of the interpolation period and matching the
value of the appropriate long-term rate with zero slope at the end of the
interpolation period.
0.003
100 in the calendar year direction; 400 in the age direction

16
© 2016 Society of Actuaries
RPEC_2014_v2016 requires selection of the following four assumptions to produce mortality
improvement rates:
Long-term rates of mortality improvement: This vector of anticipated age-specific average annual
mortality improvement rates beyond the end of the interpolation periods.
Convergence periods: The number of years included in the interpolation periods. The
convergence periods for the horizontal and diagonal components need not be the same.
Initial slope constraint:17 The maximum absolute value of each interpolating polynomial’s slope
at the beginning of the convergence period.
Blending percentages: The two (nonnegative) percentages that determine the relative balance
between anticipated horizontal (implicit age/period) and diagonal (implicit year-of-birth cohort)
components that will be reflected in the final set of mortality improvement rates. The sum of the
blending percentages must equal 100%.
The following table summarizes the committee-selected assumption sets underpinning Scales MP-2014,
MP-2015, and MP-2016.
6.2 Tools Available on the SOA Website
The SOA has made available three Excel workbooks that users may find helpful.
Scale MP-2016 rates can be downloaded in Excel format at
https://www.soa.org/Files/Research/Exp-Study/mortality-improvement-scale-mp-2016-rates.xlsx.
A tool for constructing Scale MP-2016 or other scales based on the same graduated historical
mortality data. This tool is referred to as RPEC_2014_v2016. The workbook implements the
RPEC_2014 model with the data that was available in 2016. Users can vary the inputs to the
model to produce alternate mortality improvement scales; see the workbook for instructions.
A tool for calculating a one-dimensional improvement scale (by attained age) approximately
equivalent to Scale MP-2016 and a corresponding base mortality table can be downloaded at
17 In the Scale MP-2014 and Scale MP-2015 Reports, the initial slope constraint was an internal parameter fixed at 0.003. Starting with this report, the initial slope constraint is an assumption that can be varied by the user.
Assumptions Scale MP-2014 Scale MP-2015 Scale MP-2016
Long-Term Rate
Convergence Period – Horizontal 10 Years
Convergence Period – Diagonal
H/D Blending Percentages
Initial Slope Constraint 0.0
* The initial slope constraint was an internal parameter in the 2014 and 2015 versions of the RPEC model.
0.003*
20 Years
20 Years
Flat 1.0% rate to age 85; decreasing linearly to 0.85% at age 95; then
decreasing linearly to 0.0% at age 115
50% / 50%

17
© 2016 Society of Actuaries
https://www.soa.org/Research/Experience-Study/Pension/2d-to-1d-conversion-tool.aspx. A
similar tool was made available in conjunction with Scales MP-2014 and MP-2015. Please note
that RPEC does not expect to make a similar tool available after 2016.
6.3 Rounding Conventions
Starting with this MP-2016 Report, the values produced by the horizontal and diagonal interpolating
polynomials should be left unrounded until after they have been blended together (step 3 of Section 2.1),
at which point they should be rounded to the nearest four decimal places. This rounding convention
differs slightly from that described in Appendix B of the MP-2014 Report, which stipulated that the pre-
blended interpolated values should first be rounded to the nearest five decimal places before being
rounded to four decimal places after blending.
6.4 Overview of RPEC’s Ongoing Research Efforts
The conceptual framework for and development of the RPEC_2014 mortality improvement model were
presented in Sections 3 and 4, respectively, of the MP-2014 Report. Since that time, RPEC has continued
to review its methodology in an effort to improve the overall effectiveness of the model, especially with
respect to year-over-year stability and forecast accuracy.
RPEC is currently investigating a number of mortality improvement model features, including:
Underlying mortality data used to develop historical MI rates; e.g., rates as published by the SSA, raw SSA rates, or potentially some other source;
Parameters for two-dimensional Whittaker-Henderson graduation (both “order” and “smoothing”);
Number of step-back years;
Methodology used to isolate historical age/period and cohort effects;
Interpolation methodology, including families of interpolating functions and the influence of initial slopes;
Long-term mortality improvement rates and convergence periods (and the interaction between the two); and
The balance between horizontal and diagonal projections.
The primary techniques for assessing model effectiveness have been advanced backtesting tools that
compare alternative mortality improvement models relative to a set of key metrics.
Since the research being performed by the Committee will be continuing beyond the release of this
report, it is possible that RPEC could identify a new model that is more effective at meeting the
Committee’s mortality improvement objectives than RPEC_2014_v2016. Any significant changes to the
underlying RPEC model (other than updates for additional years of historical mortality data or modified
committee-selected assumption sets) that arise as a result of this ongoing research project will be subject
to a full exposure cycle before being published as a final report by the SOA.
18
© 2016 Society of Actuaries
Section 7: Questions and Answers
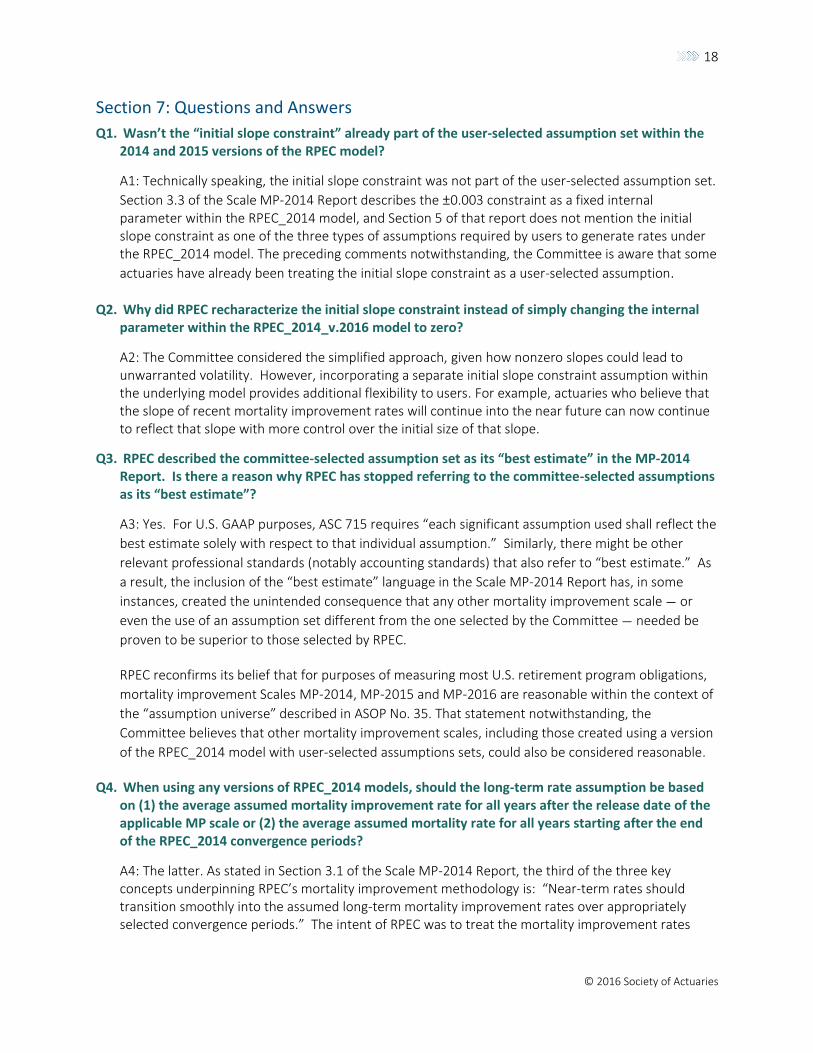
Q1. Wasn’t the “initial slope constraint” already part of the user-selected assumption set within the 2014 and 2015 versions of the RPEC model?
A1: Technically speaking, the initial slope constraint was not part of the user-selected assumption set.
Section 3.3 of the Scale MP-2014 Report describes the ±0.003 constraint as a fixed internal parameter within the RPEC_2014 model, and Section 5 of that report does not mention the initial slope constraint as one of the three types of assumptions required by users to generate rates under the RPEC_2014 model. The preceding comments notwithstanding, the Committee is aware that some
actuaries have already been treating the initial slope constraint as a user-selected assumption.
Q2. Why did RPEC recharacterize the initial slope constraint instead of simply changing the internal parameter within the RPEC_2014_v.2016 model to zero?
A2: The Committee considered the simplified approach, given how nonzero slopes could lead to unwarranted volatility. However, incorporating a separate initial slope constraint assumption within the underlying model provides additional flexibility to users. For example, actuaries who believe that the slope of recent mortality improvement rates will continue into the near future can now continue to reflect that slope with more control over the initial size of that slope.
Q3. RPEC described the committee-selected assumption set as its “best estimate” in the MP-2014 Report. Is there a reason why RPEC has stopped referring to the committee-selected assumptions as its “best estimate”?
A3: Yes. For U.S. GAAP purposes, ASC 715 requires “each significant assumption used shall reflect the
best estimate solely with respect to that individual assumption.” Similarly, there might be other
relevant professional standards (notably accounting standards) that also refer to “best estimate.” As
a result, the inclusion of the “best estimate” language in the Scale MP-2014 Report has, in some
instances, created the unintended consequence that any other mortality improvement scale — or
even the use of an assumption set different from the one selected by the Committee — needed be
proven to be superior to those selected by RPEC.
RPEC reconfirms its belief that for purposes of measuring most U.S. retirement program obligations,
mortality improvement Scales MP-2014, MP-2015 and MP-2016 are reasonable within the context of
the “assumption universe” described in ASOP No. 35. That statement notwithstanding, the
Committee believes that other mortality improvement scales, including those created using a version
of the RPEC_2014 model with user-selected assumptions sets, could also be considered reasonable.
Q4. When using any versions of RPEC_2014 models, should the long-term rate assumption be based on (1) the average assumed mortality improvement rate for all years after the release date of the applicable MP scale or (2) the average assumed mortality rate for all years starting after the end of the RPEC_2014 convergence periods?
A4: The latter. As stated in Section 3.1 of the Scale MP-2014 Report, the third of the three key concepts underpinning RPEC’s mortality improvement methodology is: “Near-term rates should transition smoothly into the assumed long-term mortality improvement rates over appropriately selected convergence periods.” The intent of RPEC was to treat the mortality improvement rates
19
© 2016 Society of Actuaries
interpolated over the convergence period as “select” rates, followed by an “ultimate” set of long-term rates.
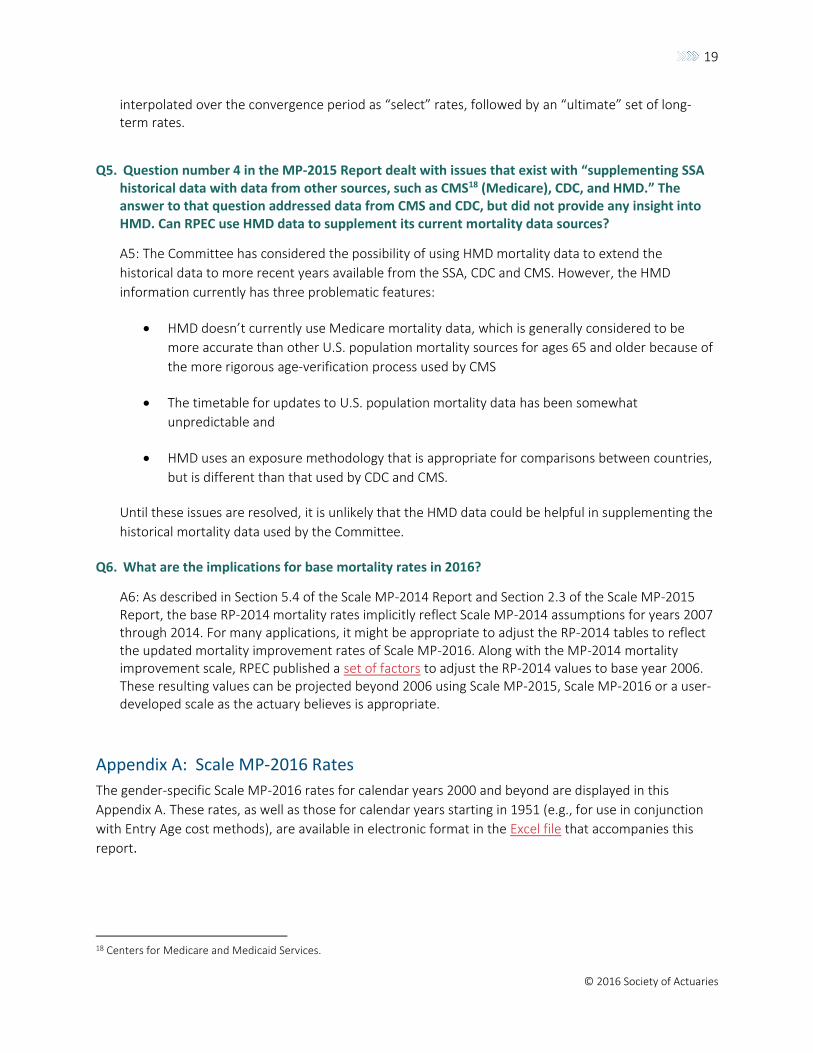
Q5. Question number 4 in the MP-2015 Report dealt with issues that exist with “supplementing SSA historical data with data from other sources, such as CMS18 (Medicare), CDC, and HMD.” The answer to that question addressed data from CMS and CDC, but did not provide any insight into HMD. Can RPEC use HMD data to supplement its current mortality data sources?
A5: The Committee has considered the possibility of using HMD mortality data to extend the
historical data to more recent years available from the SSA, CDC and CMS. However, the HMD
information currently has three problematic features:
HMD doesn’t currently use Medicare mortality data, which is generally considered to be
more accurate than other U.S. population mortality sources for ages 65 and older because of
the more rigorous age-verification process used by CMS
The timetable for updates to U.S. population mortality data has been somewhat
unpredictable and
HMD uses an exposure methodology that is appropriate for comparisons between countries,
but is different than that used by CDC and CMS.
Until these issues are resolved, it is unlikely that the HMD data could be helpful in supplementing the
historical mortality data used by the Committee.
Q6. What are the implications for base mortality rates in 2016?
A6: As described in Section 5.4 of the Scale MP-2014 Report and Section 2.3 of the Scale MP-2015 Report, the base RP-2014 mortality rates implicitly reflect Scale MP-2014 assumptions for years 2007 through 2014. For many applications, it might be appropriate to adjust the RP-2014 tables to reflect the updated mortality improvement rates of Scale MP-2016. Along with the MP-2014 mortality improvement scale, RPEC published a set of factors to adjust the RP-2014 values to base year 2006. These resulting values can be projected beyond 2006 using Scale MP-2015, Scale MP-2016 or a user-developed scale as the actuary believes is appropriate.
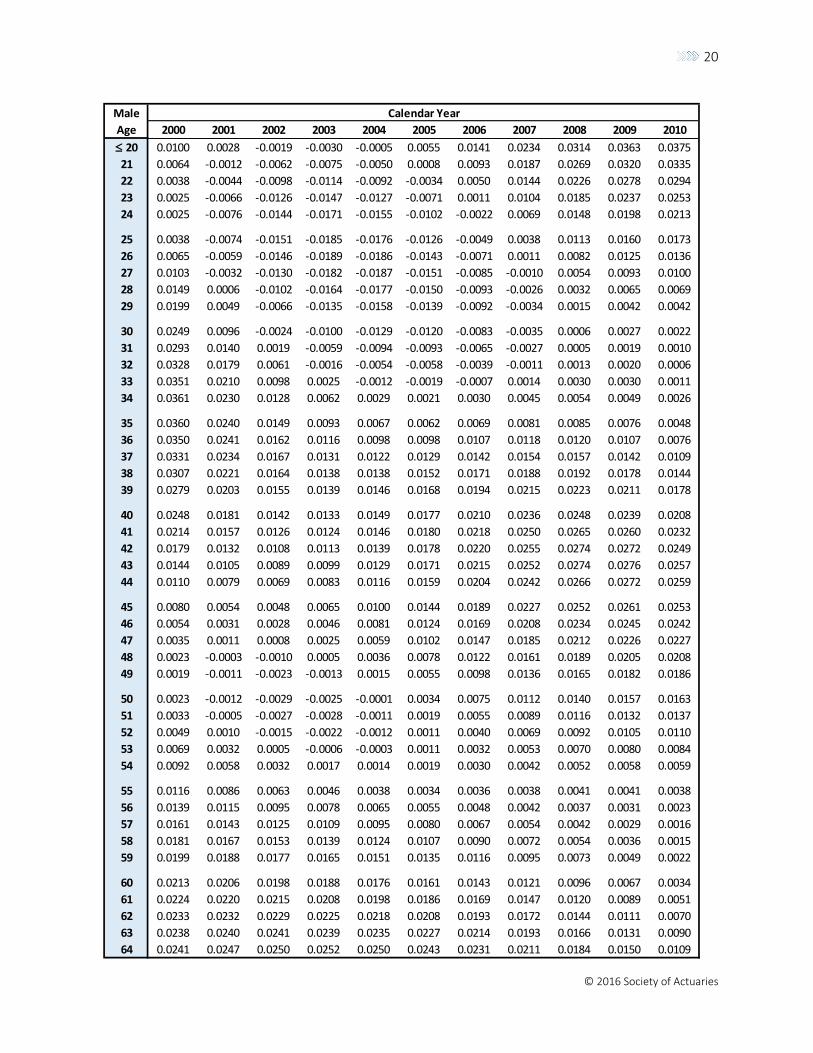
Appendix A: Scale MP-2016 Rates
The gender-specific Scale MP-2016 rates for calendar years 2000 and beyond are displayed in this
Appendix A. These rates, as well as those for calendar years starting in 1951 (e.g., for use in conjunction
with Entry Age cost methods), are available in electronic format in the Excel file that accompanies this
report.
18 Centers for Medicare and Medicaid Services.
20
© 2016 Society of Actuaries
Male
Age 2000 2001 2002 2003 2004 2005 2006 2007 2008 2009 2010
20 0.0100 0.0028 -0.0019 -0.0030 -0.0005 0.0055 0.0141 0.0234 0.0314 0.0363 0.0375
21 0.0064 -0.0012 -0.0062 -0.0075 -0.0050 0.0008 0.0093 0.0187 0.0269 0.0320 0.0335
22 0.0038 -0.0044 -0.0098 -0.0114 -0.0092 -0.0034 0.0050 0.0144 0.0226 0.0278 0.0294
23 0.0025 -0.0066 -0.0126 -0.0147 -0.0127 -0.0071 0.0011 0.0104 0.0185 0.0237 0.0253
24 0.0025 -0.0076 -0.0144 -0.0171 -0.0155 -0.0102 -0.0022 0.0069 0.0148 0.0198 0.0213
25 0.0038 -0.0074 -0.0151 -0.0185 -0.0176 -0.0126 -0.0049 0.0038 0.0113 0.0160 0.0173
26 0.0065 -0.0059 -0.0146 -0.0189 -0.0186 -0.0143 -0.0071 0.0011 0.0082 0.0125 0.0136
27 0.0103 -0.0032 -0.0130 -0.0182 -0.0187 -0.0151 -0.0085 -0.0010 0.0054 0.0093 0.0100
28 0.0149 0.0006 -0.0102 -0.0164 -0.0177 -0.0150 -0.0093 -0.0026 0.0032 0.0065 0.0069
29 0.0199 0.0049 -0.0066 -0.0135 -0.0158 -0.0139 -0.0092 -0.0034 0.0015 0.0042 0.0042
30 0.0249 0.0096 -0.0024 -0.0100 -0.0129 -0.0120 -0.0083 -0.0035 0.0006 0.0027 0.0022
31 0.0293 0.0140 0.0019 -0.0059 -0.0094 -0.0093 -0.0065 -0.0027 0.0005 0.0019 0.0010
32 0.0328 0.0179 0.0061 -0.0016 -0.0054 -0.0058 -0.0039 -0.0011 0.0013 0.0020 0.0006
33 0.0351 0.0210 0.0098 0.0025 -0.0012 -0.0019 -0.0007 0.0014 0.0030 0.0030 0.0011
34 0.0361 0.0230 0.0128 0.0062 0.0029 0.0021 0.0030 0.0045 0.0054 0.0049 0.0026
35 0.0360 0.0240 0.0149 0.0093 0.0067 0.0062 0.0069 0.0081 0.0085 0.0076 0.0048
36 0.0350 0.0241 0.0162 0.0116 0.0098 0.0098 0.0107 0.0118 0.0120 0.0107 0.0076
37 0.0331 0.0234 0.0167 0.0131 0.0122 0.0129 0.0142 0.0154 0.0157 0.0142 0.0109
38 0.0307 0.0221 0.0164 0.0138 0.0138 0.0152 0.0171 0.0188 0.0192 0.0178 0.0144
39 0.0279 0.0203 0.0155 0.0139 0.0146 0.0168 0.0194 0.0215 0.0223 0.0211 0.0178
40 0.0248 0.0181 0.0142 0.0133 0.0149 0.0177 0.0210 0.0236 0.0248 0.0239 0.0208
41 0.0214 0.0157 0.0126 0.0124 0.0146 0.0180 0.0218 0.0250 0.0265 0.0260 0.0232
42 0.0179 0.0132 0.0108 0.0113 0.0139 0.0178 0.0220 0.0255 0.0274 0.0272 0.0249
43 0.0144 0.0105 0.0089 0.0099 0.0129 0.0171 0.0215 0.0252 0.0274 0.0276 0.0257
44 0.0110 0.0079 0.0069 0.0083 0.0116 0.0159 0.0204 0.0242 0.0266 0.0272 0.0259
45 0.0080 0.0054 0.0048 0.0065 0.0100 0.0144 0.0189 0.0227 0.0252 0.0261 0.0253
46 0.0054 0.0031 0.0028 0.0046 0.0081 0.0124 0.0169 0.0208 0.0234 0.0245 0.0242
47 0.0035 0.0011 0.0008 0.0025 0.0059 0.0102 0.0147 0.0185 0.0212 0.0226 0.0227
48 0.0023 -0.0003 -0.0010 0.0005 0.0036 0.0078 0.0122 0.0161 0.0189 0.0205 0.0208
49 0.0019 -0.0011 -0.0023 -0.0013 0.0015 0.0055 0.0098 0.0136 0.0165 0.0182 0.0186
50 0.0023 -0.0012 -0.0029 -0.0025 -0.0001 0.0034 0.0075 0.0112 0.0140 0.0157 0.0163
51 0.0033 -0.0005 -0.0027 -0.0028 -0.0011 0.0019 0.0055 0.0089 0.0116 0.0132 0.0137
52 0.0049 0.0010 -0.0015 -0.0022 -0.0012 0.0011 0.0040 0.0069 0.0092 0.0105 0.0110
53 0.0069 0.0032 0.0005 -0.0006 -0.0003 0.0011 0.0032 0.0053 0.0070 0.0080 0.0084
54 0.0092 0.0058 0.0032 0.0017 0.0014 0.0019 0.0030 0.0042 0.0052 0.0058 0.0059
55 0.0116 0.0086 0.0063 0.0046 0.0038 0.0034 0.0036 0.0038 0.0041 0.0041 0.0038
56 0.0139 0.0115 0.0095 0.0078 0.0065 0.0055 0.0048 0.0042 0.0037 0.0031 0.0023
57 0.0161 0.0143 0.0125 0.0109 0.0095 0.0080 0.0067 0.0054 0.0042 0.0029 0.0016
58 0.0181 0.0167 0.0153 0.0139 0.0124 0.0107 0.0090 0.0072 0.0054 0.0036 0.0015
59 0.0199 0.0188 0.0177 0.0165 0.0151 0.0135 0.0116 0.0095 0.0073 0.0049 0.0022
60 0.0213 0.0206 0.0198 0.0188 0.0176 0.0161 0.0143 0.0121 0.0096 0.0067 0.0034
61 0.0224 0.0220 0.0215 0.0208 0.0198 0.0186 0.0169 0.0147 0.0120 0.0089 0.0051
62 0.0233 0.0232 0.0229 0.0225 0.0218 0.0208 0.0193 0.0172 0.0144 0.0111 0.0070
63 0.0238 0.0240 0.0241 0.0239 0.0235 0.0227 0.0214 0.0193 0.0166 0.0131 0.0090
64 0.0241 0.0247 0.0250 0.0252 0.0250 0.0243 0.0231 0.0211 0.0184 0.0150 0.0109
Calendar Year
21
© 2016 Society of Actuaries
Male
Age 2011 2012 2013 2014 2015 2016 2017 2018 2019 2020 2021
20 0.0356 0.0318 0.0315 0.0304 0.0288 0.0269 0.0247 0.0224 0.0202 0.0182 0.0166
21 0.0319 0.0284 0.0298 0.0289 0.0275 0.0258 0.0238 0.0218 0.0198 0.0180 0.0165
22 0.0280 0.0247 0.0263 0.0272 0.0260 0.0246 0.0229 0.0212 0.0194 0.0178 0.0165
23 0.0240 0.0208 0.0226 0.0238 0.0245 0.0233 0.0219 0.0205 0.0190 0.0176 0.0164
24 0.0199 0.0167 0.0186 0.0202 0.0213 0.0220 0.0209 0.0197 0.0186 0.0174 0.0164
25 0.0159 0.0126 0.0146 0.0164 0.0179 0.0191 0.0199 0.0190 0.0181 0.0172 0.0163
26 0.0119 0.0085 0.0106 0.0126 0.0145 0.0161 0.0174 0.0183 0.0177 0.0170 0.0163
27 0.0082 0.0047 0.0067 0.0089 0.0111 0.0131 0.0149 0.0163 0.0173 0.0168 0.0162
28 0.0048 0.0011 0.0030 0.0053 0.0077 0.0101 0.0123 0.0142 0.0157 0.0166 0.0162
29 0.0019 -0.0020 -0.0002 0.0020 0.0046 0.0073 0.0098 0.0121 0.0140 0.0153 0.0161
30 -0.0004 -0.0045 -0.0030 -0.0008 0.0018 0.0046 0.0075 0.0101 0.0123 0.0140 0.0151
31 -0.0020 -0.0064 -0.0051 -0.0032 -0.0006 0.0023 0.0053 0.0081 0.0107 0.0127 0.0140
32 -0.0027 -0.0074 -0.0066 -0.0049 -0.0025 0.0004 0.0034 0.0064 0.0091 0.0113 0.0129
33 -0.0026 -0.0077 -0.0072 -0.0059 -0.0037 -0.0011 0.0018 0.0048 0.0076 0.0099 0.0117
34 -0.0016 -0.0071 -0.0071 -0.0061 -0.0044 -0.0020 0.0007 0.0035 0.0062 0.0086 0.0105
35 0.0002 -0.0057 -0.0061 -0.0056 -0.0043 -0.0024 0.0000 0.0025 0.0051 0.0075 0.0094
36 0.0027 -0.0036 -0.0044 -0.0044 -0.0036 -0.0022 -0.0003 0.0019 0.0042 0.0064 0.0083
37 0.0057 -0.0008 -0.0020 -0.0025 -0.0023 -0.0014 -0.0001 0.0017 0.0036 0.0056 0.0073
38 0.0090 0.0023 0.0009 0.0000 -0.0004 -0.0002 0.0006 0.0018 0.0033 0.0049 0.0064
39 0.0124 0.0056 0.0040 0.0028 0.0019 0.0016 0.0017 0.0023 0.0033 0.0045 0.0058
40 0.0156 0.0090 0.0073 0.0058 0.0045 0.0036 0.0031 0.0031 0.0035 0.0043 0.0053
41 0.0183 0.0121 0.0105 0.0088 0.0072 0.0058 0.0048 0.0042 0.0041 0.0044 0.0050
42 0.0205 0.0149 0.0134 0.0117 0.0099 0.0081 0.0066 0.0055 0.0049 0.0047 0.0050
43 0.0221 0.0171 0.0159 0.0142 0.0123 0.0103 0.0085 0.0070 0.0059 0.0053 0.0052
44 0.0229 0.0188 0.0178 0.0163 0.0144 0.0124 0.0103 0.0085 0.0071 0.0061 0.0056
45 0.0230 0.0197 0.0191 0.0178 0.0161 0.0141 0.0120 0.0100 0.0083 0.0070 0.0062
46 0.0226 0.0200 0.0197 0.0187 0.0173 0.0154 0.0134 0.0113 0.0095 0.0080 0.0070
47 0.0215 0.0195 0.0196 0.0190 0.0178 0.0163 0.0144 0.0125 0.0107 0.0091 0.0079
48 0.0200 0.0185 0.0188 0.0186 0.0179 0.0167 0.0151 0.0134 0.0117 0.0101 0.0089
49 0.0181 0.0169 0.0175 0.0177 0.0174 0.0166 0.0154 0.0140 0.0125 0.0110 0.0098
50 0.0158 0.0148 0.0157 0.0163 0.0164 0.0160 0.0153 0.0143 0.0131 0.0118 0.0107
51 0.0133 0.0125 0.0136 0.0144 0.0149 0.0151 0.0148 0.0142 0.0134 0.0124 0.0114
52 0.0107 0.0099 0.0112 0.0123 0.0132 0.0138 0.0140 0.0139 0.0135 0.0128 0.0120
53 0.0080 0.0073 0.0086 0.0100 0.0112 0.0122 0.0129 0.0133 0.0133 0.0130 0.0125
54 0.0054 0.0047 0.0061 0.0076 0.0091 0.0104 0.0116 0.0124 0.0128 0.0130 0.0127
55 0.0031 0.0022 0.0036 0.0052 0.0069 0.0086 0.0101 0.0113 0.0122 0.0127 0.0128
56 0.0013 0.0000 0.0012 0.0029 0.0048 0.0067 0.0085 0.0101 0.0114 0.0122 0.0126
57 -0.0001 -0.0019 -0.0008 0.0009 0.0028 0.0049 0.0070 0.0089 0.0104 0.0116 0.0123
58 -0.0008 -0.0033 -0.0024 -0.0009 0.0011 0.0033 0.0055 0.0076 0.0095 0.0109 0.0118
59 -0.0008 -0.0041 -0.0035 -0.0021 -0.0003 0.0019 0.0042 0.0064 0.0084 0.0101 0.0112
60 -0.0003 -0.0043 -0.0040 -0.0029 -0.0012 0.0009 0.0031 0.0054 0.0075 0.0092 0.0105
61 0.0008 -0.0038 -0.0038 -0.0031 -0.0017 0.0002 0.0023 0.0045 0.0066 0.0084 0.0098
62 0.0023 -0.0027 -0.0030 -0.0026 -0.0016 -0.0001 0.0018 0.0038 0.0058 0.0076 0.0090
63 0.0042 -0.0010 -0.0016 -0.0016 -0.0010 0.0001 0.0016 0.0034 0.0052 0.0069 0.0083
64 0.0061 0.0010 0.0001 -0.0002 0.0000 0.0007 0.0018 0.0032 0.0047 0.0063 0.0076
Calendar Year

22
© 2016 Society of Actuaries
Male
Age 2022 2023 2024 2025 2026 2027 2028 2029 2030 2031 2032+
20 0.0155 0.0146 0.0138 0.0131 0.0124 0.0117 0.0111 0.0107 0.0103 0.0101 0.0100
21 0.0155 0.0146 0.0138 0.0131 0.0124 0.0117 0.0111 0.0107 0.0103 0.0101 0.0100
22 0.0155 0.0146 0.0138 0.0131 0.0124 0.0117 0.0111 0.0107 0.0103 0.0101 0.0100
23 0.0155 0.0146 0.0138 0.0131 0.0124 0.0117 0.0111 0.0107 0.0103 0.0101 0.0100
24 0.0155 0.0146 0.0138 0.0131 0.0124 0.0117 0.0111 0.0107 0.0103 0.0101 0.0100
25 0.0155 0.0146 0.0138 0.0131 0.0124 0.0117 0.0111 0.0107 0.0103 0.0101 0.0100
26 0.0155 0.0146 0.0138 0.0131 0.0124 0.0117 0.0111 0.0107 0.0103 0.0101 0.0100
27 0.0155 0.0146 0.0138 0.0131 0.0124 0.0117 0.0111 0.0107 0.0103 0.0101 0.0100
28 0.0155 0.0146 0.0138 0.0131 0.0124 0.0117 0.0111 0.0107 0.0103 0.0101 0.0100
29 0.0155 0.0146 0.0138 0.0131 0.0124 0.0117 0.0111 0.0107 0.0103 0.0101 0.0100
30 0.0155 0.0146 0.0138 0.0131 0.0124 0.0117 0.0111 0.0107 0.0103 0.0101 0.0100
31 0.0146 0.0146 0.0138 0.0131 0.0124 0.0117 0.0111 0.0107 0.0103 0.0101 0.0100
32 0.0137 0.0139 0.0138 0.0131 0.0124 0.0117 0.0111 0.0107 0.0103 0.0101 0.0100
33 0.0127 0.0131 0.0132 0.0131 0.0124 0.0117 0.0111 0.0107 0.0103 0.0101 0.0100
34 0.0117 0.0123 0.0126 0.0126 0.0124 0.0117 0.0111 0.0107 0.0103 0.0101 0.0100
35 0.0107 0.0114 0.0119 0.0121 0.0120 0.0117 0.0111 0.0107 0.0103 0.0101 0.0100
36 0.0096 0.0106 0.0112 0.0115 0.0116 0.0114 0.0111 0.0107 0.0103 0.0101 0.0100
37 0.0087 0.0097 0.0105 0.0109 0.0112 0.0112 0.0110 0.0107 0.0103 0.0101 0.0100
38 0.0078 0.0089 0.0097 0.0104 0.0107 0.0108 0.0108 0.0106 0.0103 0.0101 0.0100
39 0.0070 0.0081 0.0091 0.0098 0.0103 0.0105 0.0106 0.0104 0.0103 0.0101 0.0100
40 0.0064 0.0075 0.0084 0.0092 0.0098 0.0102 0.0103 0.0103 0.0102 0.0101 0.0100
41 0.0059 0.0069 0.0079 0.0087 0.0094 0.0099 0.0101 0.0102 0.0102 0.0101 0.0100
42 0.0056 0.0065 0.0074 0.0083 0.0090 0.0096 0.0099 0.0101 0.0101 0.0100 0.0100
43 0.0056 0.0063 0.0071 0.0080 0.0087 0.0093 0.0097 0.0100 0.0100 0.0100 0.0100
44 0.0057 0.0062 0.0069 0.0077 0.0084 0.0091 0.0095 0.0098 0.0100 0.0100 0.0100
45 0.0061 0.0064 0.0069 0.0075 0.0082 0.0089 0.0094 0.0097 0.0099 0.0100 0.0100
46 0.0066 0.0067 0.0070 0.0075 0.0081 0.0087 0.0092 0.0096 0.0099 0.0100 0.0100
47 0.0073 0.0071 0.0072 0.0076 0.0081 0.0086 0.0091 0.0096 0.0098 0.0100 0.0100
48 0.0081 0.0077 0.0076 0.0078 0.0082 0.0086 0.0091 0.0095 0.0098 0.0100 0.0100
49 0.0089 0.0084 0.0081 0.0081 0.0083 0.0087 0.0091 0.0095 0.0098 0.0099 0.0100
50 0.0097 0.0091 0.0086 0.0085 0.0085 0.0088 0.0091 0.0095 0.0098 0.0099 0.0100
51 0.0105 0.0098 0.0092 0.0089 0.0088 0.0089 0.0092 0.0095 0.0098 0.0099 0.0100
52 0.0112 0.0104 0.0098 0.0094 0.0092 0.0092 0.0093 0.0095 0.0098 0.0099 0.0100
53 0.0118 0.0110 0.0104 0.0099 0.0095 0.0094 0.0094 0.0096 0.0098 0.0099 0.0100
54 0.0122 0.0115 0.0109 0.0103 0.0099 0.0097 0.0096 0.0097 0.0098 0.0099 0.0100
55 0.0124 0.0119 0.0113 0.0107 0.0102 0.0099 0.0098 0.0098 0.0098 0.0100 0.0100
56 0.0125 0.0121 0.0115 0.0110 0.0105 0.0102 0.0099 0.0099 0.0099 0.0100 0.0100
57 0.0124 0.0121 0.0117 0.0112 0.0108 0.0104 0.0101 0.0100 0.0099 0.0100 0.0100
58 0.0121 0.0120 0.0118 0.0114 0.0109 0.0106 0.0103 0.0101 0.0100 0.0100 0.0100
59 0.0117 0.0118 0.0117 0.0114 0.0110 0.0107 0.0104 0.0101 0.0100 0.0100 0.0100
60 0.0112 0.0115 0.0115 0.0113 0.0111 0.0108 0.0105 0.0102 0.0101 0.0100 0.0100
61 0.0106 0.0110 0.0112 0.0112 0.0110 0.0108 0.0105 0.0103 0.0101 0.0100 0.0100
62 0.0100 0.0105 0.0108 0.0110 0.0109 0.0107 0.0105 0.0103 0.0101 0.0100 0.0100
63 0.0093 0.0100 0.0104 0.0107 0.0107 0.0107 0.0105 0.0103 0.0101 0.0100 0.0100
64 0.0087 0.0094 0.0100 0.0103 0.0105 0.0105 0.0104 0.0103 0.0101 0.0100 0.0100
Calendar Year

23
© 2016 Society of Actuaries
Male
Age 2000 2001 2002 2003 2004 2005 2006 2007 2008 2009 2010
65 0.0242 0.0251 0.0258 0.0262 0.0262 0.0257 0.0245 0.0226 0.0199 0.0166 0.0127
66 0.0240 0.0253 0.0263 0.0269 0.0271 0.0267 0.0255 0.0237 0.0211 0.0180 0.0142
67 0.0237 0.0253 0.0266 0.0275 0.0278 0.0274 0.0263 0.0245 0.0221 0.0191 0.0156
68 0.0232 0.0251 0.0266 0.0277 0.0282 0.0279 0.0269 0.0252 0.0228 0.0200 0.0167
69 0.0225 0.0247 0.0265 0.0278 0.0284 0.0282 0.0273 0.0256 0.0234 0.0207 0.0175
70 0.0218 0.0241 0.0261 0.0276 0.0283 0.0283 0.0275 0.0259 0.0238 0.0212 0.0182
71 0.0210 0.0234 0.0256 0.0272 0.0281 0.0282 0.0275 0.0261 0.0241 0.0216 0.0187
72 0.0202 0.0227 0.0249 0.0267 0.0277 0.0279 0.0274 0.0261 0.0242 0.0218 0.0191
73 0.0195 0.0219 0.0242 0.0260 0.0272 0.0276 0.0272 0.0260 0.0242 0.0219 0.0192
74 0.0187 0.0211 0.0234 0.0253 0.0266 0.0271 0.0268 0.0258 0.0241 0.0219 0.0193
75 0.0181 0.0204 0.0226 0.0245 0.0259 0.0265 0.0264 0.0255 0.0239 0.0218 0.0192
76 0.0175 0.0197 0.0218 0.0238 0.0252 0.0259 0.0258 0.0250 0.0235 0.0215 0.0190
77 0.0170 0.0190 0.0212 0.0230 0.0244 0.0252 0.0252 0.0245 0.0231 0.0211 0.0187
78 0.0164 0.0185 0.0205 0.0223 0.0237 0.0245 0.0245 0.0238 0.0225 0.0206 0.0183
79 0.0159 0.0179 0.0199 0.0217 0.0230 0.0237 0.0238 0.0232 0.0219 0.0200 0.0178
80 0.0154 0.0174 0.0193 0.0210 0.0223 0.0230 0.0230 0.0224 0.0212 0.0194 0.0172
81 0.0148 0.0167 0.0186 0.0203 0.0215 0.0222 0.0222 0.0216 0.0204 0.0188 0.0167
82 0.0141 0.0160 0.0179 0.0196 0.0207 0.0214 0.0214 0.0208 0.0197 0.0181 0.0161
83 0.0133 0.0152 0.0171 0.0187 0.0199 0.0205 0.0206 0.0200 0.0189 0.0174 0.0155
84 0.0123 0.0143 0.0162 0.0178 0.0190 0.0196 0.0197 0.0192 0.0181 0.0167 0.0149
85 0.0113 0.0133 0.0152 0.0168 0.0180 0.0187 0.0188 0.0183 0.0173 0.0160 0.0143
86 0.0101 0.0121 0.0140 0.0157 0.0169 0.0176 0.0178 0.0174 0.0165 0.0153 0.0137
87 0.0088 0.0109 0.0128 0.0144 0.0157 0.0165 0.0167 0.0164 0.0157 0.0146 0.0132
88 0.0075 0.0095 0.0114 0.0131 0.0144 0.0152 0.0156 0.0154 0.0148 0.0139 0.0127
89 0.0060 0.0080 0.0099 0.0116 0.0129 0.0138 0.0143 0.0143 0.0139 0.0132 0.0122
90 0.0045 0.0064 0.0083 0.0100 0.0114 0.0124 0.0130 0.0132 0.0130 0.0125 0.0118
91 0.0029 0.0048 0.0066 0.0083 0.0097 0.0108 0.0116 0.0120 0.0120 0.0118 0.0113
92 0.0012 0.0030 0.0048 0.0065 0.0079 0.0092 0.0101 0.0107 0.0110 0.0111 0.0109
93 -0.0005 0.0012 0.0029 0.0046 0.0061 0.0074 0.0085 0.0094 0.0100 0.0104 0.0106
94 -0.0023 -0.0007 0.0009 0.0026 0.0041 0.0056 0.0069 0.0080 0.0089 0.0096 0.0102
95 -0.0042 -0.0027 -0.0011 0.0005 0.0021 0.0037 0.0051 0.0065 0.0077 0.0089 0.0099
96 -0.0040 -0.0026 -0.0011 0.0005 0.0020 0.0035 0.0049 0.0062 0.0074 0.0084 0.0094
97 -0.0038 -0.0024 -0.0010 0.0004 0.0019 0.0033 0.0046 0.0058 0.0070 0.0080 0.0089
98 -0.0036 -0.0023 -0.0010 0.0004 0.0018 0.0031 0.0044 0.0055 0.0066 0.0075 0.0084
99 -0.0034 -0.0022 -0.0009 0.0004 0.0017 0.0029 0.0041 0.0052 0.0062 0.0071 0.0079
100 -0.0032 -0.0020 -0.0009 0.0004 0.0016 0.0027 0.0038 0.0049 0.0058 0.0067 0.0074
101 -0.0029 -0.0019 -0.0008 0.0003 0.0015 0.0026 0.0036 0.0045 0.0054 0.0062 0.0069
102 -0.0027 -0.0018 -0.0007 0.0003 0.0014 0.0024 0.0033 0.0042 0.0050 0.0058 0.0064
103 -0.0025 -0.0016 -0.0007 0.0003 0.0013 0.0022 0.0031 0.0039 0.0046 0.0053 0.0059
104 -0.0023 -0.0015 -0.0006 0.0003 0.0012 0.0020 0.0028 0.0036 0.0043 0.0049 0.0055
105 -0.0021 -0.0014 -0.0006 0.0002 0.0010 0.0018 0.0026 0.0032 0.0039 0.0044 0.0050
106 -0.0019 -0.0012 -0.0005 0.0002 0.0009 0.0016 0.0023 0.0029 0.0035 0.0040 0.0045
107 -0.0017 -0.0011 -0.0005 0.0002 0.0008 0.0015 0.0021 0.0026 0.0031 0.0035 0.0040
108 -0.0015 -0.0010 -0.0004 0.0002 0.0007 0.0013 0.0018 0.0023 0.0027 0.0031 0.0035
109 -0.0013 -0.0008 -0.0003 0.0001 0.0006 0.0011 0.0015 0.0019 0.0023 0.0027 0.0030
110 -0.0011 -0.0007 -0.0003 0.0001 0.0005 0.0009 0.0013 0.0016 0.0019 0.0022 0.0025
111 -0.0008 -0.0005 -0.0002 0.0001 0.0004 0.0007 0.0010 0.0013 0.0015 0.0018 0.0020
112 -0.0006 -0.0004 -0.0002 0.0001 0.0003 0.0005 0.0008 0.0010 0.0012 0.0013 0.0015
113 -0.0004 -0.0003 -0.0001 0.0000 0.0002 0.0004 0.0005 0.0006 0.0008 0.0009 0.0010
114 -0.0002 -0.0001 -0.0001 0.0000 0.0001 0.0002 0.0003 0.0003 0.0004 0.0004 0.0005
115+ 0.0000 0.0000 0.0000 0.0000 0.0000 0.0000 0.0000 0.0000 0.0000 0.0000 0.0000
Calendar Year
24
© 2016 Society of Actuaries
Male
Age 2011 2012 2013 2014 2015 2016 2017 2018 2019 2020 2021
65 0.0081 0.0032 0.0022 0.0016 0.0014 0.0016 0.0023 0.0033 0.0045 0.0058 0.0070
66 0.0099 0.0053 0.0043 0.0035 0.0030 0.0028 0.0030 0.0036 0.0044 0.0054 0.0065
67 0.0116 0.0073 0.0064 0.0055 0.0047 0.0042 0.0040 0.0041 0.0046 0.0053 0.0061
68 0.0130 0.0091 0.0082 0.0073 0.0064 0.0057 0.0051 0.0049 0.0049 0.0053 0.0059
69 0.0141 0.0105 0.0097 0.0089 0.0080 0.0071 0.0063 0.0058 0.0055 0.0056 0.0059
70 0.0150 0.0115 0.0110 0.0102 0.0093 0.0084 0.0075 0.0067 0.0062 0.0060 0.0061
71 0.0156 0.0123 0.0119 0.0113 0.0104 0.0095 0.0086 0.0077 0.0070 0.0065 0.0064
72 0.0160 0.0128 0.0125 0.0120 0.0113 0.0105 0.0096 0.0087 0.0079 0.0072 0.0069
73 0.0163 0.0132 0.0129 0.0125 0.0119 0.0112 0.0104 0.0095 0.0086 0.0079 0.0075
74 0.0164 0.0133 0.0132 0.0128 0.0124 0.0117 0.0110 0.0102 0.0094 0.0086 0.0081
75 0.0163 0.0133 0.0132 0.0130 0.0126 0.0121 0.0114 0.0107 0.0100 0.0093 0.0087
76 0.0162 0.0132 0.0132 0.0130 0.0127 0.0123 0.0117 0.0111 0.0104 0.0098 0.0092
77 0.0160 0.0131 0.0131 0.0130 0.0127 0.0124 0.0119 0.0114 0.0108 0.0102 0.0097
78 0.0156 0.0129 0.0129 0.0128 0.0126 0.0123 0.0120 0.0115 0.0110 0.0105 0.0100
79 0.0153 0.0126 0.0127 0.0126 0.0125 0.0122 0.0119 0.0116 0.0112 0.0107 0.0103
80 0.0148 0.0123 0.0124 0.0124 0.0123 0.0121 0.0119 0.0115 0.0112 0.0109 0.0105
81 0.0144 0.0119 0.0120 0.0121 0.0120 0.0119 0.0117 0.0115 0.0112 0.0109 0.0106
82 0.0139 0.0115 0.0117 0.0117 0.0117 0.0116 0.0115 0.0113 0.0111 0.0109 0.0107
83 0.0134 0.0112 0.0113 0.0114 0.0114 0.0114 0.0113 0.0112 0.0110 0.0109 0.0107
84 0.0129 0.0108 0.0109 0.0110 0.0111 0.0111 0.0110 0.0110 0.0109 0.0108 0.0106
85 0.0124 0.0105 0.0106 0.0107 0.0108 0.0108 0.0108 0.0108 0.0107 0.0106 0.0105
86 0.0120 0.0102 0.0103 0.0104 0.0105 0.0105 0.0105 0.0105 0.0104 0.0104 0.0103
87 0.0116 0.0100 0.0101 0.0101 0.0102 0.0102 0.0102 0.0102 0.0102 0.0101 0.0101
88 0.0113 0.0099 0.0099 0.0099 0.0099 0.0100 0.0100 0.0099 0.0099 0.0099 0.0098
89 0.0111 0.0098 0.0098 0.0098 0.0098 0.0098 0.0097 0.0097 0.0097 0.0096 0.0096
90 0.0109 0.0099 0.0098 0.0097 0.0097 0.0096 0.0095 0.0095 0.0094 0.0094 0.0093
91 0.0107 0.0101 0.0099 0.0098 0.0096 0.0095 0.0094 0.0093 0.0092 0.0091 0.0091
92 0.0107 0.0103 0.0102 0.0099 0.0097 0.0095 0.0093 0.0091 0.0090 0.0089 0.0088
93 0.0107 0.0107 0.0105 0.0102 0.0099 0.0096 0.0093 0.0090 0.0088 0.0086 0.0085
94 0.0108 0.0112 0.0109 0.0105 0.0101 0.0097 0.0093 0.0090 0.0087 0.0084 0.0083
95 0.0109 0.0118 0.0114 0.0110 0.0104 0.0099 0.0094 0.0090 0.0086 0.0083 0.0080
96 0.0103 0.0112 0.0109 0.0104 0.0099 0.0094 0.0089 0.0085 0.0081 0.0078 0.0076
97 0.0098 0.0106 0.0103 0.0099 0.0094 0.0089 0.0085 0.0081 0.0077 0.0074 0.0072
98 0.0093 0.0101 0.0097 0.0093 0.0089 0.0084 0.0080 0.0076 0.0073 0.0070 0.0068
99 0.0087 0.0095 0.0091 0.0088 0.0084 0.0079 0.0075 0.0072 0.0069 0.0066 0.0064
100 0.0082 0.0089 0.0086 0.0082 0.0078 0.0074 0.0071 0.0067 0.0064 0.0062 0.0060
101 0.0076 0.0083 0.0080 0.0077 0.0073 0.0069 0.0066 0.0063 0.0060 0.0058 0.0056
102 0.0071 0.0077 0.0074 0.0071 0.0068 0.0065 0.0061 0.0058 0.0056 0.0054 0.0052
103 0.0065 0.0071 0.0069 0.0066 0.0063 0.0060 0.0057 0.0054 0.0051 0.0050 0.0048
104 0.0060 0.0065 0.0063 0.0060 0.0057 0.0055 0.0052 0.0049 0.0047 0.0045 0.0044
105 0.0054 0.0059 0.0057 0.0055 0.0052 0.0050 0.0047 0.0045 0.0043 0.0041 0.0040
106 0.0049 0.0053 0.0051 0.0049 0.0047 0.0045 0.0042 0.0040 0.0039 0.0037 0.0036
107 0.0044 0.0047 0.0046 0.0044 0.0042 0.0040 0.0038 0.0036 0.0034 0.0033 0.0032
108 0.0038 0.0041 0.0040 0.0038 0.0037 0.0035 0.0033 0.0031 0.0030 0.0029 0.0028
109 0.0033 0.0035 0.0034 0.0033 0.0031 0.0030 0.0028 0.0027 0.0026 0.0025 0.0024
110 0.0027 0.0030 0.0029 0.0027 0.0026 0.0025 0.0024 0.0022 0.0021 0.0021 0.0020
111 0.0022 0.0024 0.0023 0.0022 0.0021 0.0020 0.0019 0.0018 0.0017 0.0017 0.0016
112 0.0016 0.0018 0.0017 0.0016 0.0016 0.0015 0.0014 0.0013 0.0013 0.0012 0.0012
113 0.0011 0.0012 0.0011 0.0011 0.0010 0.0010 0.0009 0.0009 0.0009 0.0008 0.0008
114 0.0005 0.0006 0.0006 0.0005 0.0005 0.0005 0.0005 0.0004 0.0004 0.0004 0.0004
115+ 0.0000 0.0000 0.0000 0.0000 0.0000 0.0000 0.0000 0.0000 0.0000 0.0000 0.0000
Calendar Year
25
© 2016 Society of Actuaries
Male
Age 2022 2023 2024 2025 2026 2027 2028 2029 2030 2031 2032+
65 0.0080 0.0089 0.0095 0.0100 0.0103 0.0104 0.0104 0.0103 0.0101 0.0100 0.0100
66 0.0075 0.0083 0.0091 0.0096 0.0100 0.0102 0.0103 0.0102 0.0101 0.0100 0.0100
67 0.0070 0.0079 0.0086 0.0092 0.0097 0.0100 0.0101 0.0101 0.0101 0.0100 0.0100
68 0.0067 0.0075 0.0082 0.0089 0.0094 0.0098 0.0100 0.0101 0.0101 0.0100 0.0100
69 0.0065 0.0072 0.0079 0.0086 0.0092 0.0096 0.0099 0.0100 0.0100 0.0100 0.0100
70 0.0064 0.0070 0.0077 0.0083 0.0089 0.0094 0.0097 0.0099 0.0100 0.0100 0.0100
71 0.0065 0.0070 0.0075 0.0081 0.0087 0.0092 0.0096 0.0098 0.0100 0.0100 0.0100
72 0.0068 0.0071 0.0075 0.0080 0.0086 0.0091 0.0095 0.0098 0.0099 0.0100 0.0100
73 0.0072 0.0073 0.0076 0.0080 0.0085 0.0090 0.0094 0.0097 0.0099 0.0100 0.0100
74 0.0077 0.0077 0.0078 0.0081 0.0085 0.0089 0.0093 0.0096 0.0099 0.0100 0.0100
75 0.0083 0.0081 0.0081 0.0082 0.0085 0.0089 0.0093 0.0096 0.0098 0.0100 0.0100
76 0.0088 0.0085 0.0084 0.0084 0.0086 0.0089 0.0093 0.0096 0.0098 0.0100 0.0100
77 0.0093 0.0090 0.0088 0.0087 0.0088 0.0090 0.0093 0.0096 0.0098 0.0100 0.0100
78 0.0097 0.0093 0.0091 0.0090 0.0090 0.0091 0.0093 0.0096 0.0098 0.0099 0.0100
79 0.0100 0.0097 0.0094 0.0093 0.0093 0.0093 0.0094 0.0096 0.0098 0.0099 0.0100
80 0.0102 0.0099 0.0097 0.0095 0.0094 0.0095 0.0095 0.0097 0.0098 0.0099 0.0100
81 0.0104 0.0101 0.0099 0.0097 0.0096 0.0096 0.0096 0.0097 0.0098 0.0100 0.0100
82 0.0104 0.0102 0.0100 0.0098 0.0097 0.0097 0.0097 0.0098 0.0099 0.0100 0.0100
83 0.0105 0.0103 0.0101 0.0099 0.0098 0.0097 0.0097 0.0098 0.0099 0.0100 0.0100
84 0.0105 0.0103 0.0102 0.0100 0.0099 0.0098 0.0097 0.0098 0.0099 0.0100 0.0100
85 0.0105 0.0103 0.0102 0.0100 0.0099 0.0098 0.0098 0.0098 0.0098 0.0099 0.0100
86 0.0103 0.0102 0.0101 0.0099 0.0098 0.0097 0.0097 0.0097 0.0097 0.0098 0.0099
87 0.0100 0.0100 0.0099 0.0098 0.0097 0.0096 0.0096 0.0095 0.0096 0.0096 0.0097
88 0.0098 0.0098 0.0097 0.0097 0.0096 0.0095 0.0095 0.0094 0.0094 0.0095 0.0096
89 0.0095 0.0095 0.0095 0.0095 0.0095 0.0094 0.0093 0.0093 0.0093 0.0093 0.0094
90 0.0093 0.0093 0.0092 0.0092 0.0092 0.0093 0.0092 0.0092 0.0092 0.0092 0.0093
91 0.0090 0.0090 0.0090 0.0090 0.0090 0.0090 0.0091 0.0090 0.0090 0.0090 0.0091
92 0.0087 0.0087 0.0087 0.0087 0.0087 0.0087 0.0088 0.0089 0.0089 0.0089 0.0090
93 0.0085 0.0084 0.0084 0.0084 0.0084 0.0085 0.0085 0.0086 0.0087 0.0087 0.0088
94 0.0082 0.0082 0.0081 0.0081 0.0081 0.0082 0.0082 0.0083 0.0084 0.0086 0.0087
95 0.0079 0.0079 0.0079 0.0079 0.0079 0.0079 0.0080 0.0080 0.0082 0.0083 0.0085
96 0.0075 0.0075 0.0075 0.0075 0.0075 0.0075 0.0076 0.0076 0.0077 0.0079 0.0081
97 0.0071 0.0071 0.0071 0.0071 0.0071 0.0071 0.0072 0.0072 0.0073 0.0075 0.0077
98 0.0067 0.0067 0.0067 0.0067 0.0067 0.0067 0.0068 0.0068 0.0069 0.0071 0.0072
99 0.0063 0.0063 0.0063 0.0063 0.0063 0.0063 0.0064 0.0064 0.0065 0.0066 0.0068
100 0.0059 0.0059 0.0059 0.0059 0.0059 0.0059 0.0060 0.0060 0.0061 0.0062 0.0064
101 0.0056 0.0055 0.0055 0.0055 0.0055 0.0055 0.0056 0.0056 0.0057 0.0058 0.0060
102 0.0052 0.0051 0.0051 0.0051 0.0051 0.0051 0.0052 0.0052 0.0053 0.0054 0.0055
103 0.0048 0.0047 0.0047 0.0047 0.0047 0.0047 0.0048 0.0048 0.0049 0.0050 0.0051
104 0.0044 0.0043 0.0043 0.0043 0.0043 0.0043 0.0044 0.0044 0.0045 0.0046 0.0047
105 0.0040 0.0039 0.0039 0.0039 0.0039 0.0039 0.0040 0.0040 0.0041 0.0042 0.0043
106 0.0036 0.0036 0.0035 0.0035 0.0035 0.0036 0.0036 0.0036 0.0037 0.0037 0.0038
107 0.0032 0.0032 0.0031 0.0031 0.0031 0.0032 0.0032 0.0032 0.0033 0.0033 0.0034
108 0.0028 0.0028 0.0028 0.0028 0.0028 0.0028 0.0028 0.0028 0.0029 0.0029 0.0030
109 0.0024 0.0024 0.0024 0.0024 0.0024 0.0024 0.0024 0.0024 0.0024 0.0025 0.0026
110 0.0020 0.0020 0.0020 0.0020 0.0020 0.0020 0.0020 0.0020 0.0020 0.0021 0.0021
111 0.0016 0.0016 0.0016 0.0016 0.0016 0.0016 0.0016 0.0016 0.0016 0.0017 0.0017
112 0.0012 0.0012 0.0012 0.0012 0.0012 0.0012 0.0012 0.0012 0.0012 0.0012 0.0013
113 0.0008 0.0008 0.0008 0.0008 0.0008 0.0008 0.0008 0.0008 0.0008 0.0008 0.0009
114 0.0004 0.0004 0.0004 0.0004 0.0004 0.0004 0.0004 0.0004 0.0004 0.0004 0.0004
115+ 0.0000 0.0000 0.0000 0.0000 0.0000 0.0000 0.0000 0.0000 0.0000 0.0000 0.0000
Calendar Year

26
© 2016 Society of Actuaries
Female
Age 2000 2001 2002 2003 2004 2005 2006 2007 2008 2009 2010
20 0.0020 -0.0003 -0.0009 0.0010 0.0052 0.0110 0.0174 0.0232 0.0274 0.0289 0.0279
21 0.0005 -0.0025 -0.0037 -0.0025 0.0009 0.0059 0.0117 0.0171 0.0210 0.0227 0.0221
22 -0.0001 -0.0037 -0.0057 -0.0053 -0.0027 0.0014 0.0064 0.0113 0.0150 0.0168 0.0166
23 0.0003 -0.0042 -0.0069 -0.0073 -0.0056 -0.0024 0.0018 0.0061 0.0096 0.0115 0.0116
24 0.0015 -0.0037 -0.0072 -0.0085 -0.0077 -0.0054 -0.0021 0.0016 0.0048 0.0068 0.0073
25 0.0034 -0.0025 -0.0067 -0.0089 -0.0090 -0.0076 -0.0051 -0.0020 0.0009 0.0028 0.0035
26 0.0058 -0.0007 -0.0055 -0.0084 -0.0093 -0.0088 -0.0071 -0.0047 -0.0023 -0.0005 0.0003
27 0.0085 0.0017 -0.0036 -0.0071 -0.0088 -0.0090 -0.0081 -0.0064 -0.0045 -0.0030 -0.0023
28 0.0112 0.0043 -0.0013 -0.0052 -0.0075 -0.0084 -0.0081 -0.0071 -0.0059 -0.0049 -0.0044
29 0.0137 0.0070 0.0014 -0.0028 -0.0055 -0.0069 -0.0072 -0.0068 -0.0063 -0.0059 -0.0058
30 0.0157 0.0094 0.0040 -0.0002 -0.0030 -0.0046 -0.0054 -0.0056 -0.0058 -0.0062 -0.0066
31 0.0169 0.0114 0.0065 0.0026 -0.0001 -0.0018 -0.0028 -0.0036 -0.0045 -0.0056 -0.0067
32 0.0173 0.0126 0.0085 0.0053 0.0030 0.0014 0.0002 -0.0009 -0.0024 -0.0042 -0.0061
33 0.0168 0.0131 0.0100 0.0077 0.0060 0.0047 0.0036 0.0022 0.0003 -0.0021 -0.0047
34 0.0155 0.0128 0.0108 0.0096 0.0087 0.0080 0.0071 0.0057 0.0035 0.0006 -0.0026
35 0.0134 0.0117 0.0109 0.0108 0.0109 0.0109 0.0104 0.0092 0.0070 0.0038 0.0000
36 0.0107 0.0099 0.0102 0.0112 0.0124 0.0132 0.0134 0.0126 0.0105 0.0072 0.0030
37 0.0076 0.0076 0.0088 0.0108 0.0131 0.0148 0.0157 0.0155 0.0138 0.0106 0.0062
38 0.0043 0.0048 0.0067 0.0097 0.0129 0.0156 0.0173 0.0178 0.0166 0.0138 0.0094
39 0.0010 0.0018 0.0043 0.0079 0.0119 0.0155 0.0181 0.0193 0.0188 0.0165 0.0123
40 -0.0021 -0.0012 0.0015 0.0056 0.0103 0.0146 0.0180 0.0200 0.0202 0.0185 0.0148
41 -0.0049 -0.0041 -0.0014 0.0030 0.0081 0.0130 0.0171 0.0198 0.0207 0.0197 0.0166
42 -0.0072 -0.0067 -0.0041 0.0002 0.0055 0.0108 0.0154 0.0188 0.0204 0.0201 0.0178
43 -0.0089 -0.0088 -0.0066 -0.0024 0.0028 0.0083 0.0132 0.0170 0.0192 0.0196 0.0181
44 -0.0098 -0.0102 -0.0085 -0.0048 0.0002 0.0055 0.0106 0.0146 0.0172 0.0183 0.0177
45 -0.0098 -0.0109 -0.0097 -0.0066 -0.0022 0.0028 0.0077 0.0118 0.0147 0.0163 0.0165
46 -0.0090 -0.0106 -0.0102 -0.0078 -0.0041 0.0004 0.0049 0.0089 0.0119 0.0139 0.0147
47 -0.0074 -0.0095 -0.0098 -0.0082 -0.0053 -0.0015 0.0024 0.0061 0.0090 0.0112 0.0124
48 -0.0051 -0.0077 -0.0086 -0.0078 -0.0057 -0.0028 0.0005 0.0036 0.0063 0.0084 0.0098
49 -0.0023 -0.0051 -0.0066 -0.0065 -0.0053 -0.0033 -0.0008 0.0017 0.0039 0.0058 0.0071
50 0.0007 -0.0022 -0.0039 -0.0045 -0.0040 -0.0028 -0.0012 0.0005 0.0022 0.0035 0.0045
51 0.0036 0.0010 -0.0009 -0.0018 -0.0019 -0.0015 -0.0006 0.0003 0.0011 0.0018 0.0023
52 0.0064 0.0042 0.0025 0.0014 0.0009 0.0007 0.0008 0.0009 0.0009 0.0008 0.0005
53 0.0088 0.0071 0.0058 0.0049 0.0042 0.0037 0.0031 0.0025 0.0016 0.0006 -0.0007
54 0.0108 0.0098 0.0089 0.0083 0.0078 0.0070 0.0060 0.0047 0.0031 0.0011 -0.0011
55 0.0124 0.0120 0.0118 0.0116 0.0113 0.0105 0.0093 0.0075 0.0052 0.0024 -0.0006
56 0.0135 0.0138 0.0142 0.0145 0.0145 0.0139 0.0126 0.0105 0.0078 0.0044 0.0006
57 0.0143 0.0151 0.0161 0.0169 0.0172 0.0169 0.0157 0.0136 0.0106 0.0068 0.0024
58 0.0148 0.0161 0.0174 0.0187 0.0194 0.0194 0.0184 0.0165 0.0135 0.0095 0.0048
59 0.0150 0.0166 0.0184 0.0200 0.0211 0.0214 0.0207 0.0190 0.0161 0.0123 0.0075
60 0.0150 0.0169 0.0189 0.0208 0.0222 0.0228 0.0225 0.0211 0.0185 0.0149 0.0102
61 0.0148 0.0170 0.0192 0.0213 0.0229 0.0238 0.0238 0.0227 0.0204 0.0170 0.0126
62 0.0145 0.0168 0.0192 0.0215 0.0233 0.0244 0.0246 0.0237 0.0217 0.0187 0.0147
63 0.0139 0.0165 0.0191 0.0215 0.0234 0.0246 0.0250 0.0243 0.0226 0.0199 0.0163
64 0.0133 0.0161 0.0188 0.0213 0.0234 0.0246 0.0251 0.0245 0.0230 0.0206 0.0173
Calendar Year
27
© 2016 Society of Actuaries
Female
Age 2011 2012 2013 2014 2015 2016 2017 2018 2019 2020 2021
20 0.0247 0.0202 0.0200 0.0195 0.0188 0.0179 0.0168 0.0158 0.0148 0.0138 0.0131
21 0.0196 0.0159 0.0179 0.0176 0.0171 0.0165 0.0158 0.0150 0.0143 0.0136 0.0130
22 0.0147 0.0117 0.0138 0.0157 0.0155 0.0151 0.0147 0.0143 0.0138 0.0134 0.0130
23 0.0103 0.0079 0.0099 0.0119 0.0140 0.0139 0.0138 0.0136 0.0134 0.0132 0.0129
24 0.0064 0.0045 0.0063 0.0084 0.0106 0.0128 0.0129 0.0130 0.0131 0.0130 0.0129
25 0.0030 0.0014 0.0031 0.0052 0.0075 0.0099 0.0122 0.0125 0.0127 0.0129 0.0128
26 0.0000 -0.0012 0.0003 0.0023 0.0046 0.0072 0.0097 0.0120 0.0125 0.0127 0.0128
27 -0.0025 -0.0034 -0.0021 -0.0002 0.0022 0.0047 0.0074 0.0099 0.0122 0.0126 0.0127
28 -0.0045 -0.0052 -0.0041 -0.0023 0.0000 0.0026 0.0053 0.0080 0.0105 0.0125 0.0127
29 -0.0062 -0.0068 -0.0057 -0.0040 -0.0018 0.0007 0.0035 0.0062 0.0088 0.0110 0.0127
30 -0.0073 -0.0080 -0.0071 -0.0055 -0.0033 -0.0008 0.0019 0.0047 0.0073 0.0096 0.0114
31 -0.0079 -0.0089 -0.0081 -0.0066 -0.0046 -0.0021 0.0006 0.0033 0.0060 0.0083 0.0102
32 -0.0079 -0.0095 -0.0089 -0.0075 -0.0055 -0.0032 -0.0005 0.0022 0.0048 0.0072 0.0091
33 -0.0073 -0.0098 -0.0093 -0.0081 -0.0062 -0.0039 -0.0014 0.0013 0.0039 0.0062 0.0081
34 -0.0061 -0.0096 -0.0093 -0.0083 -0.0066 -0.0044 -0.0020 0.0006 0.0031 0.0054 0.0073
35 -0.0043 -0.0089 -0.0089 -0.0081 -0.0066 -0.0046 -0.0023 0.0001 0.0025 0.0047 0.0065
36 -0.0020 -0.0076 -0.0079 -0.0074 -0.0062 -0.0044 -0.0024 -0.0001 0.0021 0.0041 0.0059
37 0.0007 -0.0057 -0.0064 -0.0062 -0.0054 -0.0040 -0.0022 -0.0002 0.0018 0.0037 0.0054
38 0.0036 -0.0033 -0.0043 -0.0045 -0.0041 -0.0031 -0.0017 0.0000 0.0018 0.0035 0.0050
39 0.0065 -0.0006 -0.0018 -0.0024 -0.0024 -0.0019 -0.0009 0.0004 0.0018 0.0033 0.0047
40 0.0093 0.0024 0.0010 0.0001 -0.0004 -0.0003 0.0001 0.0010 0.0021 0.0033 0.0045
41 0.0117 0.0054 0.0040 0.0028 0.0019 0.0015 0.0014 0.0018 0.0025 0.0033 0.0043
42 0.0136 0.0081 0.0068 0.0054 0.0043 0.0034 0.0029 0.0028 0.0030 0.0036 0.0043
43 0.0149 0.0104 0.0092 0.0079 0.0066 0.0054 0.0045 0.0039 0.0037 0.0039 0.0044
44 0.0154 0.0120 0.0112 0.0100 0.0086 0.0072 0.0060 0.0051 0.0046 0.0044 0.0046
45 0.0152 0.0129 0.0124 0.0115 0.0102 0.0089 0.0075 0.0064 0.0055 0.0051 0.0050
46 0.0142 0.0129 0.0128 0.0123 0.0113 0.0101 0.0088 0.0075 0.0065 0.0058 0.0055
47 0.0126 0.0120 0.0124 0.0123 0.0117 0.0108 0.0097 0.0085 0.0075 0.0067 0.0062
48 0.0104 0.0104 0.0112 0.0116 0.0115 0.0110 0.0103 0.0093 0.0084 0.0076 0.0070
49 0.0078 0.0080 0.0092 0.0101 0.0106 0.0107 0.0104 0.0098 0.0091 0.0084 0.0078
50 0.0051 0.0052 0.0067 0.0080 0.0091 0.0097 0.0100 0.0099 0.0096 0.0091 0.0086
51 0.0024 0.0021 0.0038 0.0055 0.0071 0.0084 0.0093 0.0097 0.0099 0.0097 0.0093
52 -0.0001 -0.0009 0.0008 0.0028 0.0048 0.0066 0.0081 0.0092 0.0099 0.0101 0.0100
53 -0.0021 -0.0037 -0.0021 0.0000 0.0024 0.0047 0.0067 0.0084 0.0096 0.0102 0.0104
54 -0.0034 -0.0059 -0.0046 -0.0025 0.0001 0.0027 0.0052 0.0073 0.0090 0.0101 0.0106
55 -0.0040 -0.0074 -0.0064 -0.0045 -0.0020 0.0008 0.0036 0.0062 0.0083 0.0098 0.0106
56 -0.0036 -0.0079 -0.0074 -0.0058 -0.0035 -0.0007 0.0022 0.0050 0.0074 0.0092 0.0103
57 -0.0024 -0.0075 -0.0074 -0.0063 -0.0044 -0.0018 0.0010 0.0038 0.0064 0.0084 0.0099
58 -0.0005 -0.0062 -0.0066 -0.0060 -0.0045 -0.0024 0.0002 0.0029 0.0054 0.0076 0.0092
59 0.0020 -0.0041 -0.0049 -0.0048 -0.0040 -0.0024 -0.0003 0.0021 0.0045 0.0067 0.0084
60 0.0046 -0.0015 -0.0026 -0.0030 -0.0027 -0.0018 -0.0002 0.0017 0.0038 0.0059 0.0076
61 0.0073 0.0013 0.0000 -0.0008 -0.0010 -0.0007 0.0003 0.0016 0.0033 0.0051 0.0067
62 0.0097 0.0041 0.0028 0.0017 0.0011 0.0008 0.0011 0.0019 0.0031 0.0045 0.0060
63 0.0118 0.0067 0.0054 0.0043 0.0033 0.0026 0.0023 0.0025 0.0032 0.0042 0.0054
64 0.0134 0.0089 0.0078 0.0066 0.0055 0.0045 0.0038 0.0035 0.0036 0.0041 0.0050
Calendar Year

28
© 2016 Society of Actuaries
Female
Age 2022 2023 2024 2025 2026 2027 2028 2029 2030 2031 2032+
20 0.0125 0.0122 0.0118 0.0114 0.0111 0.0108 0.0105 0.0103 0.0101 0.0100 0.0100
21 0.0125 0.0122 0.0118 0.0114 0.0111 0.0108 0.0105 0.0103 0.0101 0.0100 0.0100
22 0.0125 0.0122 0.0118 0.0114 0.0111 0.0108 0.0105 0.0103 0.0101 0.0100 0.0100
23 0.0125 0.0122 0.0118 0.0114 0.0111 0.0108 0.0105 0.0103 0.0101 0.0100 0.0100
24 0.0125 0.0122 0.0118 0.0114 0.0111 0.0108 0.0105 0.0103 0.0101 0.0100 0.0100
25 0.0125 0.0122 0.0118 0.0114 0.0111 0.0108 0.0105 0.0103 0.0101 0.0100 0.0100
26 0.0125 0.0122 0.0118 0.0114 0.0111 0.0108 0.0105 0.0103 0.0101 0.0100 0.0100
27 0.0125 0.0122 0.0118 0.0114 0.0111 0.0108 0.0105 0.0103 0.0101 0.0100 0.0100
28 0.0125 0.0122 0.0118 0.0114 0.0111 0.0108 0.0105 0.0103 0.0101 0.0100 0.0100
29 0.0125 0.0122 0.0118 0.0114 0.0111 0.0108 0.0105 0.0103 0.0101 0.0100 0.0100
30 0.0125 0.0122 0.0118 0.0114 0.0111 0.0108 0.0105 0.0103 0.0101 0.0100 0.0100
31 0.0115 0.0122 0.0118 0.0114 0.0111 0.0108 0.0105 0.0103 0.0101 0.0100 0.0100
32 0.0104 0.0112 0.0118 0.0114 0.0111 0.0108 0.0105 0.0103 0.0101 0.0100 0.0100
33 0.0095 0.0104 0.0110 0.0114 0.0111 0.0108 0.0105 0.0103 0.0101 0.0100 0.0100
34 0.0086 0.0096 0.0103 0.0108 0.0111 0.0108 0.0105 0.0103 0.0101 0.0100 0.0100
35 0.0079 0.0088 0.0096 0.0102 0.0106 0.0108 0.0105 0.0103 0.0101 0.0100 0.0100
36 0.0072 0.0082 0.0090 0.0097 0.0102 0.0105 0.0105 0.0103 0.0101 0.0100 0.0100
37 0.0067 0.0076 0.0085 0.0092 0.0098 0.0101 0.0103 0.0103 0.0101 0.0100 0.0100
38 0.0062 0.0072 0.0080 0.0088 0.0094 0.0098 0.0101 0.0102 0.0101 0.0100 0.0100
39 0.0058 0.0068 0.0076 0.0084 0.0091 0.0096 0.0099 0.0101 0.0101 0.0100 0.0100
40 0.0055 0.0064 0.0073 0.0081 0.0088 0.0093 0.0097 0.0099 0.0100 0.0100 0.0100
41 0.0053 0.0062 0.0070 0.0079 0.0086 0.0091 0.0096 0.0098 0.0100 0.0100 0.0100
42 0.0051 0.0060 0.0068 0.0076 0.0084 0.0090 0.0094 0.0097 0.0099 0.0100 0.0100
43 0.0051 0.0058 0.0067 0.0075 0.0082 0.0088 0.0093 0.0097 0.0099 0.0100 0.0100
44 0.0051 0.0058 0.0066 0.0073 0.0081 0.0087 0.0092 0.0096 0.0098 0.0100 0.0100
45 0.0053 0.0058 0.0065 0.0072 0.0080 0.0086 0.0091 0.0095 0.0098 0.0100 0.0100
46 0.0056 0.0060 0.0066 0.0072 0.0079 0.0085 0.0091 0.0095 0.0098 0.0100 0.0100
47 0.0061 0.0063 0.0067 0.0072 0.0079 0.0085 0.0090 0.0095 0.0098 0.0099 0.0100
48 0.0067 0.0067 0.0069 0.0073 0.0079 0.0085 0.0090 0.0094 0.0097 0.0099 0.0100
49 0.0074 0.0072 0.0072 0.0075 0.0080 0.0085 0.0090 0.0094 0.0097 0.0099 0.0100
50 0.0081 0.0077 0.0077 0.0078 0.0081 0.0085 0.0090 0.0094 0.0097 0.0099 0.0100
51 0.0088 0.0084 0.0081 0.0081 0.0083 0.0086 0.0090 0.0094 0.0097 0.0099 0.0100
52 0.0095 0.0090 0.0087 0.0085 0.0086 0.0088 0.0091 0.0094 0.0097 0.0099 0.0100
53 0.0101 0.0096 0.0092 0.0089 0.0089 0.0090 0.0092 0.0095 0.0097 0.0099 0.0100
54 0.0105 0.0101 0.0097 0.0093 0.0092 0.0092 0.0093 0.0095 0.0098 0.0099 0.0100
55 0.0107 0.0104 0.0101 0.0097 0.0095 0.0094 0.0094 0.0096 0.0098 0.0099 0.0100
56 0.0107 0.0106 0.0104 0.0101 0.0098 0.0096 0.0096 0.0097 0.0098 0.0099 0.0100
57 0.0105 0.0106 0.0105 0.0103 0.0100 0.0099 0.0098 0.0098 0.0099 0.0100 0.0100
58 0.0101 0.0104 0.0105 0.0104 0.0102 0.0100 0.0099 0.0099 0.0099 0.0100 0.0100
59 0.0095 0.0101 0.0104 0.0104 0.0103 0.0102 0.0100 0.0099 0.0099 0.0100 0.0100
60 0.0088 0.0096 0.0101 0.0103 0.0103 0.0102 0.0101 0.0100 0.0100 0.0100 0.0100
61 0.0080 0.0090 0.0097 0.0101 0.0102 0.0102 0.0102 0.0101 0.0100 0.0100 0.0100
62 0.0073 0.0083 0.0092 0.0097 0.0100 0.0102 0.0102 0.0101 0.0100 0.0100 0.0100
63 0.0066 0.0077 0.0086 0.0093 0.0098 0.0100 0.0101 0.0101 0.0100 0.0100 0.0100
64 0.0060 0.0071 0.0081 0.0089 0.0095 0.0098 0.0100 0.0101 0.0100 0.0100 0.0100
Calendar Year
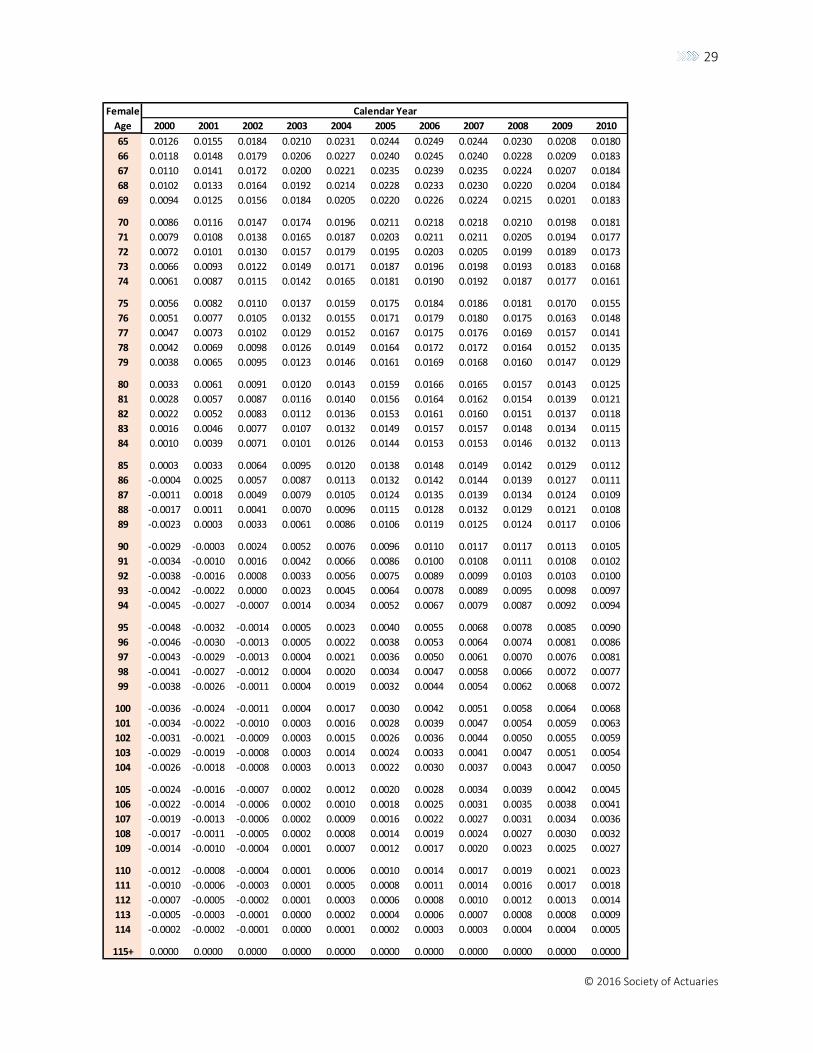
29
© 2016 Society of Actuaries
Female
Age 2000 2001 2002 2003 2004 2005 2006 2007 2008 2009 2010
65 0.0126 0.0155 0.0184 0.0210 0.0231 0.0244 0.0249 0.0244 0.0230 0.0208 0.0180
66 0.0118 0.0148 0.0179 0.0206 0.0227 0.0240 0.0245 0.0240 0.0228 0.0209 0.0183
67 0.0110 0.0141 0.0172 0.0200 0.0221 0.0235 0.0239 0.0235 0.0224 0.0207 0.0184
68 0.0102 0.0133 0.0164 0.0192 0.0214 0.0228 0.0233 0.0230 0.0220 0.0204 0.0184
69 0.0094 0.0125 0.0156 0.0184 0.0205 0.0220 0.0226 0.0224 0.0215 0.0201 0.0183
70 0.0086 0.0116 0.0147 0.0174 0.0196 0.0211 0.0218 0.0218 0.0210 0.0198 0.0181
71 0.0079 0.0108 0.0138 0.0165 0.0187 0.0203 0.0211 0.0211 0.0205 0.0194 0.0177
72 0.0072 0.0101 0.0130 0.0157 0.0179 0.0195 0.0203 0.0205 0.0199 0.0189 0.0173
73 0.0066 0.0093 0.0122 0.0149 0.0171 0.0187 0.0196 0.0198 0.0193 0.0183 0.0168
74 0.0061 0.0087 0.0115 0.0142 0.0165 0.0181 0.0190 0.0192 0.0187 0.0177 0.0161
75 0.0056 0.0082 0.0110 0.0137 0.0159 0.0175 0.0184 0.0186 0.0181 0.0170 0.0155
76 0.0051 0.0077 0.0105 0.0132 0.0155 0.0171 0.0179 0.0180 0.0175 0.0163 0.0148
77 0.0047 0.0073 0.0102 0.0129 0.0152 0.0167 0.0175 0.0176 0.0169 0.0157 0.0141
78 0.0042 0.0069 0.0098 0.0126 0.0149 0.0164 0.0172 0.0172 0.0164 0.0152 0.0135
79 0.0038 0.0065 0.0095 0.0123 0.0146 0.0161 0.0169 0.0168 0.0160 0.0147 0.0129
80 0.0033 0.0061 0.0091 0.0120 0.0143 0.0159 0.0166 0.0165 0.0157 0.0143 0.0125
81 0.0028 0.0057 0.0087 0.0116 0.0140 0.0156 0.0164 0.0162 0.0154 0.0139 0.0121
82 0.0022 0.0052 0.0083 0.0112 0.0136 0.0153 0.0161 0.0160 0.0151 0.0137 0.0118
83 0.0016 0.0046 0.0077 0.0107 0.0132 0.0149 0.0157 0.0157 0.0148 0.0134 0.0115
84 0.0010 0.0039 0.0071 0.0101 0.0126 0.0144 0.0153 0.0153 0.0146 0.0132 0.0113
85 0.0003 0.0033 0.0064 0.0095 0.0120 0.0138 0.0148 0.0149 0.0142 0.0129 0.0112
86 -0.0004 0.0025 0.0057 0.0087 0.0113 0.0132 0.0142 0.0144 0.0139 0.0127 0.0111
87 -0.0011 0.0018 0.0049 0.0079 0.0105 0.0124 0.0135 0.0139 0.0134 0.0124 0.0109
88 -0.0017 0.0011 0.0041 0.0070 0.0096 0.0115 0.0128 0.0132 0.0129 0.0121 0.0108
89 -0.0023 0.0003 0.0033 0.0061 0.0086 0.0106 0.0119 0.0125 0.0124 0.0117 0.0106
90 -0.0029 -0.0003 0.0024 0.0052 0.0076 0.0096 0.0110 0.0117 0.0117 0.0113 0.0105
91 -0.0034 -0.0010 0.0016 0.0042 0.0066 0.0086 0.0100 0.0108 0.0111 0.0108 0.0102
92 -0.0038 -0.0016 0.0008 0.0033 0.0056 0.0075 0.0089 0.0099 0.0103 0.0103 0.0100
93 -0.0042 -0.0022 0.0000 0.0023 0.0045 0.0064 0.0078 0.0089 0.0095 0.0098 0.0097
94 -0.0045 -0.0027 -0.0007 0.0014 0.0034 0.0052 0.0067 0.0079 0.0087 0.0092 0.0094
95 -0.0048 -0.0032 -0.0014 0.0005 0.0023 0.0040 0.0055 0.0068 0.0078 0.0085 0.0090
96 -0.0046 -0.0030 -0.0013 0.0005 0.0022 0.0038 0.0053 0.0064 0.0074 0.0081 0.0086
97 -0.0043 -0.0029 -0.0013 0.0004 0.0021 0.0036 0.0050 0.0061 0.0070 0.0076 0.0081
98 -0.0041 -0.0027 -0.0012 0.0004 0.0020 0.0034 0.0047 0.0058 0.0066 0.0072 0.0077
99 -0.0038 -0.0026 -0.0011 0.0004 0.0019 0.0032 0.0044 0.0054 0.0062 0.0068 0.0072
100 -0.0036 -0.0024 -0.0011 0.0004 0.0017 0.0030 0.0042 0.0051 0.0058 0.0064 0.0068
101 -0.0034 -0.0022 -0.0010 0.0003 0.0016 0.0028 0.0039 0.0047 0.0054 0.0059 0.0063
102 -0.0031 -0.0021 -0.0009 0.0003 0.0015 0.0026 0.0036 0.0044 0.0050 0.0055 0.0059
103 -0.0029 -0.0019 -0.0008 0.0003 0.0014 0.0024 0.0033 0.0041 0.0047 0.0051 0.0054
104 -0.0026 -0.0018 -0.0008 0.0003 0.0013 0.0022 0.0030 0.0037 0.0043 0.0047 0.0050
105 -0.0024 -0.0016 -0.0007 0.0002 0.0012 0.0020 0.0028 0.0034 0.0039 0.0042 0.0045
106 -0.0022 -0.0014 -0.0006 0.0002 0.0010 0.0018 0.0025 0.0031 0.0035 0.0038 0.0041
107 -0.0019 -0.0013 -0.0006 0.0002 0.0009 0.0016 0.0022 0.0027 0.0031 0.0034 0.0036
108 -0.0017 -0.0011 -0.0005 0.0002 0.0008 0.0014 0.0019 0.0024 0.0027 0.0030 0.0032
109 -0.0014 -0.0010 -0.0004 0.0001 0.0007 0.0012 0.0017 0.0020 0.0023 0.0025 0.0027
110 -0.0012 -0.0008 -0.0004 0.0001 0.0006 0.0010 0.0014 0.0017 0.0019 0.0021 0.0023
111 -0.0010 -0.0006 -0.0003 0.0001 0.0005 0.0008 0.0011 0.0014 0.0016 0.0017 0.0018
112 -0.0007 -0.0005 -0.0002 0.0001 0.0003 0.0006 0.0008 0.0010 0.0012 0.0013 0.0014
113 -0.0005 -0.0003 -0.0001 0.0000 0.0002 0.0004 0.0006 0.0007 0.0008 0.0008 0.0009
114 -0.0002 -0.0002 -0.0001 0.0000 0.0001 0.0002 0.0003 0.0003 0.0004 0.0004 0.0005
115+ 0.0000 0.0000 0.0000 0.0000 0.0000 0.0000 0.0000 0.0000 0.0000 0.0000 0.0000
Calendar Year

30
© 2016 Society of Actuaries
Female
Age 2011 2012 2013 2014 2015 2016 2017 2018 2019 2020 2021
65 0.0145 0.0107 0.0098 0.0087 0.0075 0.0063 0.0053 0.0046 0.0043 0.0044 0.0049
66 0.0153 0.0121 0.0114 0.0104 0.0093 0.0080 0.0068 0.0059 0.0052 0.0049 0.0050
67 0.0158 0.0131 0.0125 0.0117 0.0107 0.0095 0.0083 0.0071 0.0062 0.0056 0.0054
68 0.0161 0.0136 0.0133 0.0127 0.0118 0.0107 0.0095 0.0083 0.0073 0.0065 0.0060
69 0.0162 0.0139 0.0137 0.0132 0.0125 0.0116 0.0105 0.0094 0.0083 0.0074 0.0067
70 0.0161 0.0139 0.0138 0.0135 0.0130 0.0122 0.0113 0.0103 0.0092 0.0083 0.0075
71 0.0158 0.0137 0.0137 0.0135 0.0131 0.0125 0.0118 0.0109 0.0100 0.0091 0.0084
72 0.0154 0.0133 0.0134 0.0134 0.0131 0.0127 0.0121 0.0114 0.0106 0.0098 0.0091
73 0.0149 0.0128 0.0130 0.0130 0.0129 0.0126 0.0122 0.0117 0.0110 0.0104 0.0097
74 0.0143 0.0122 0.0125 0.0126 0.0126 0.0124 0.0122 0.0118 0.0113 0.0108 0.0102
75 0.0136 0.0116 0.0119 0.0121 0.0121 0.0121 0.0120 0.0117 0.0114 0.0110 0.0106
76 0.0129 0.0109 0.0112 0.0115 0.0116 0.0117 0.0117 0.0116 0.0114 0.0111 0.0108
77 0.0122 0.0102 0.0106 0.0109 0.0111 0.0113 0.0114 0.0114 0.0113 0.0112 0.0110
78 0.0115 0.0095 0.0099 0.0102 0.0105 0.0108 0.0110 0.0111 0.0111 0.0111 0.0110
79 0.0109 0.0089 0.0092 0.0096 0.0099 0.0103 0.0106 0.0108 0.0109 0.0110 0.0109
80 0.0104 0.0083 0.0086 0.0090 0.0094 0.0098 0.0101 0.0104 0.0107 0.0108 0.0108
81 0.0100 0.0078 0.0081 0.0084 0.0088 0.0093 0.0097 0.0101 0.0104 0.0106 0.0107
82 0.0097 0.0075 0.0077 0.0080 0.0084 0.0088 0.0093 0.0097 0.0101 0.0104 0.0105
83 0.0094 0.0073 0.0074 0.0077 0.0080 0.0085 0.0089 0.0094 0.0098 0.0101 0.0103
84 0.0093 0.0072 0.0073 0.0075 0.0078 0.0081 0.0086 0.0090 0.0094 0.0098 0.0101
85 0.0092 0.0072 0.0072 0.0074 0.0076 0.0079 0.0083 0.0087 0.0091 0.0095 0.0098
86 0.0092 0.0073 0.0073 0.0073 0.0075 0.0077 0.0081 0.0084 0.0088 0.0092 0.0095
87 0.0092 0.0075 0.0074 0.0074 0.0075 0.0077 0.0079 0.0082 0.0085 0.0088 0.0091
88 0.0093 0.0077 0.0076 0.0075 0.0076 0.0076 0.0078 0.0080 0.0082 0.0085 0.0087
89 0.0093 0.0080 0.0078 0.0077 0.0077 0.0077 0.0077 0.0078 0.0080 0.0082 0.0084
90 0.0094 0.0082 0.0081 0.0080 0.0078 0.0078 0.0077 0.0078 0.0078 0.0080 0.0081
91 0.0094 0.0085 0.0084 0.0082 0.0080 0.0079 0.0078 0.0077 0.0077 0.0078 0.0079
92 0.0095 0.0088 0.0086 0.0084 0.0082 0.0080 0.0079 0.0077 0.0076 0.0076 0.0076
93 0.0095 0.0091 0.0089 0.0087 0.0085 0.0082 0.0080 0.0078 0.0076 0.0075 0.0075
94 0.0094 0.0094 0.0092 0.0090 0.0087 0.0084 0.0081 0.0078 0.0076 0.0074 0.0073
95 0.0094 0.0097 0.0095 0.0092 0.0089 0.0085 0.0082 0.0079 0.0076 0.0073 0.0072
96 0.0089 0.0092 0.0090 0.0088 0.0085 0.0081 0.0078 0.0075 0.0072 0.0070 0.0068
97 0.0085 0.0087 0.0086 0.0083 0.0080 0.0077 0.0074 0.0071 0.0068 0.0066 0.0065
98 0.0080 0.0082 0.0081 0.0078 0.0076 0.0073 0.0070 0.0067 0.0064 0.0062 0.0061
99 0.0075 0.0078 0.0076 0.0074 0.0071 0.0068 0.0066 0.0063 0.0061 0.0059 0.0057
100 0.0070 0.0073 0.0071 0.0069 0.0067 0.0064 0.0061 0.0059 0.0057 0.0055 0.0054
101 0.0066 0.0068 0.0067 0.0065 0.0062 0.0060 0.0057 0.0055 0.0053 0.0051 0.0050
102 0.0061 0.0063 0.0062 0.0060 0.0058 0.0056 0.0053 0.0051 0.0049 0.0048 0.0047
103 0.0056 0.0058 0.0057 0.0055 0.0053 0.0051 0.0049 0.0047 0.0045 0.0044 0.0043
104 0.0052 0.0053 0.0052 0.0051 0.0049 0.0047 0.0045 0.0043 0.0042 0.0040 0.0039
105 0.0047 0.0048 0.0048 0.0046 0.0044 0.0043 0.0041 0.0039 0.0038 0.0037 0.0036
106 0.0042 0.0044 0.0043 0.0042 0.0040 0.0038 0.0037 0.0035 0.0034 0.0033 0.0032
107 0.0038 0.0039 0.0038 0.0037 0.0036 0.0034 0.0033 0.0031 0.0030 0.0029 0.0029
108 0.0033 0.0034 0.0033 0.0032 0.0031 0.0030 0.0029 0.0027 0.0026 0.0026 0.0025
109 0.0028 0.0029 0.0029 0.0028 0.0027 0.0026 0.0025 0.0024 0.0023 0.0022 0.0022
110 0.0023 0.0024 0.0024 0.0023 0.0022 0.0021 0.0020 0.0020 0.0019 0.0018 0.0018
111 0.0019 0.0019 0.0019 0.0018 0.0018 0.0017 0.0016 0.0016 0.0015 0.0015 0.0014
112 0.0014 0.0015 0.0014 0.0014 0.0013 0.0013 0.0012 0.0012 0.0011 0.0011 0.0011
113 0.0009 0.0010 0.0010 0.0009 0.0009 0.0009 0.0008 0.0008 0.0008 0.0007 0.0007
114 0.0005 0.0005 0.0005 0.0005 0.0004 0.0004 0.0004 0.0004 0.0004 0.0004 0.0004
115+ 0.0000 0.0000 0.0000 0.0000 0.0000 0.0000 0.0000 0.0000 0.0000 0.0000 0.0000
Calendar Year
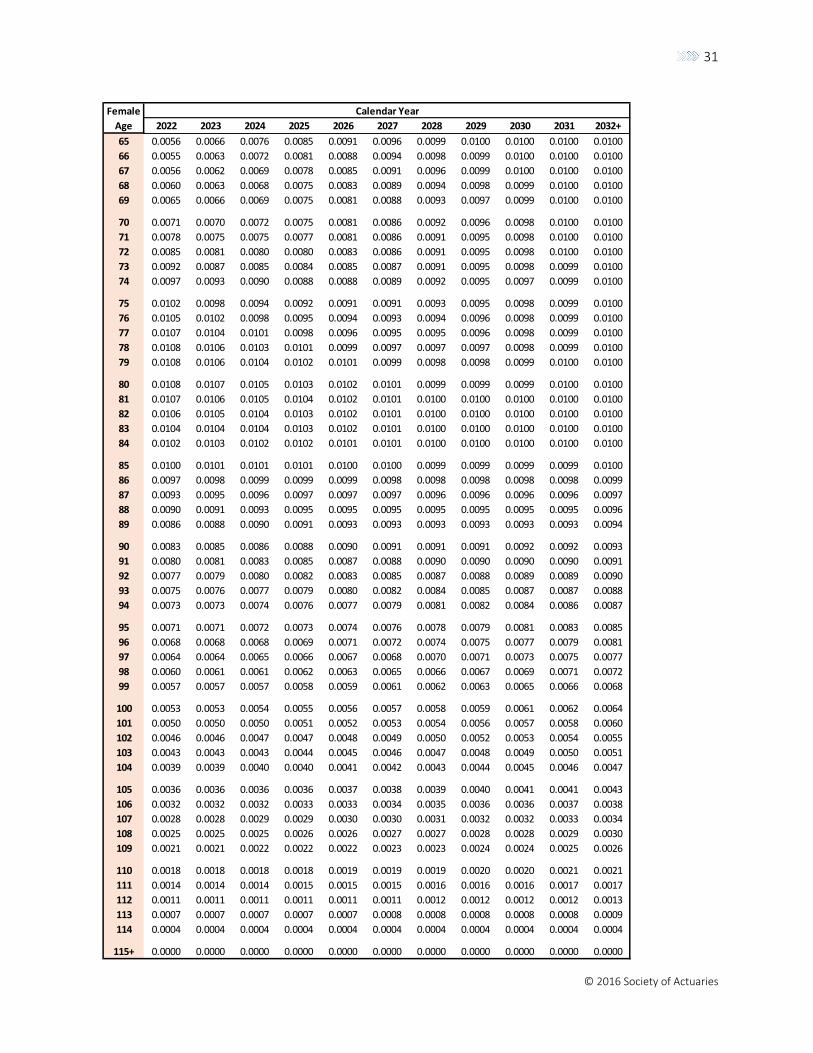
31
© 2016 Society of Actuaries
Female
Age 2022 2023 2024 2025 2026 2027 2028 2029 2030 2031 2032+
65 0.0056 0.0066 0.0076 0.0085 0.0091 0.0096 0.0099 0.0100 0.0100 0.0100 0.0100
66 0.0055 0.0063 0.0072 0.0081 0.0088 0.0094 0.0098 0.0099 0.0100 0.0100 0.0100
67 0.0056 0.0062 0.0069 0.0078 0.0085 0.0091 0.0096 0.0099 0.0100 0.0100 0.0100
68 0.0060 0.0063 0.0068 0.0075 0.0083 0.0089 0.0094 0.0098 0.0099 0.0100 0.0100
69 0.0065 0.0066 0.0069 0.0075 0.0081 0.0088 0.0093 0.0097 0.0099 0.0100 0.0100
70 0.0071 0.0070 0.0072 0.0075 0.0081 0.0086 0.0092 0.0096 0.0098 0.0100 0.0100
71 0.0078 0.0075 0.0075 0.0077 0.0081 0.0086 0.0091 0.0095 0.0098 0.0100 0.0100
72 0.0085 0.0081 0.0080 0.0080 0.0083 0.0086 0.0091 0.0095 0.0098 0.0100 0.0100
73 0.0092 0.0087 0.0085 0.0084 0.0085 0.0087 0.0091 0.0095 0.0098 0.0099 0.0100
74 0.0097 0.0093 0.0090 0.0088 0.0088 0.0089 0.0092 0.0095 0.0097 0.0099 0.0100
75 0.0102 0.0098 0.0094 0.0092 0.0091 0.0091 0.0093 0.0095 0.0098 0.0099 0.0100
76 0.0105 0.0102 0.0098 0.0095 0.0094 0.0093 0.0094 0.0096 0.0098 0.0099 0.0100
77 0.0107 0.0104 0.0101 0.0098 0.0096 0.0095 0.0095 0.0096 0.0098 0.0099 0.0100
78 0.0108 0.0106 0.0103 0.0101 0.0099 0.0097 0.0097 0.0097 0.0098 0.0099 0.0100
79 0.0108 0.0106 0.0104 0.0102 0.0101 0.0099 0.0098 0.0098 0.0099 0.0100 0.0100
80 0.0108 0.0107 0.0105 0.0103 0.0102 0.0101 0.0099 0.0099 0.0099 0.0100 0.0100
81 0.0107 0.0106 0.0105 0.0104 0.0102 0.0101 0.0100 0.0100 0.0100 0.0100 0.0100
82 0.0106 0.0105 0.0104 0.0103 0.0102 0.0101 0.0100 0.0100 0.0100 0.0100 0.0100
83 0.0104 0.0104 0.0104 0.0103 0.0102 0.0101 0.0100 0.0100 0.0100 0.0100 0.0100
84 0.0102 0.0103 0.0102 0.0102 0.0101 0.0101 0.0100 0.0100 0.0100 0.0100 0.0100
85 0.0100 0.0101 0.0101 0.0101 0.0100 0.0100 0.0099 0.0099 0.0099 0.0099 0.0100
86 0.0097 0.0098 0.0099 0.0099 0.0099 0.0098 0.0098 0.0098 0.0098 0.0098 0.0099
87 0.0093 0.0095 0.0096 0.0097 0.0097 0.0097 0.0096 0.0096 0.0096 0.0096 0.0097
88 0.0090 0.0091 0.0093 0.0095 0.0095 0.0095 0.0095 0.0095 0.0095 0.0095 0.0096
89 0.0086 0.0088 0.0090 0.0091 0.0093 0.0093 0.0093 0.0093 0.0093 0.0093 0.0094
90 0.0083 0.0085 0.0086 0.0088 0.0090 0.0091 0.0091 0.0091 0.0092 0.0092 0.0093
91 0.0080 0.0081 0.0083 0.0085 0.0087 0.0088 0.0090 0.0090 0.0090 0.0090 0.0091
92 0.0077 0.0079 0.0080 0.0082 0.0083 0.0085 0.0087 0.0088 0.0089 0.0089 0.0090
93 0.0075 0.0076 0.0077 0.0079 0.0080 0.0082 0.0084 0.0085 0.0087 0.0087 0.0088
94 0.0073 0.0073 0.0074 0.0076 0.0077 0.0079 0.0081 0.0082 0.0084 0.0086 0.0087
95 0.0071 0.0071 0.0072 0.0073 0.0074 0.0076 0.0078 0.0079 0.0081 0.0083 0.0085
96 0.0068 0.0068 0.0068 0.0069 0.0071 0.0072 0.0074 0.0075 0.0077 0.0079 0.0081
97 0.0064 0.0064 0.0065 0.0066 0.0067 0.0068 0.0070 0.0071 0.0073 0.0075 0.0077
98 0.0060 0.0061 0.0061 0.0062 0.0063 0.0065 0.0066 0.0067 0.0069 0.0071 0.0072
99 0.0057 0.0057 0.0057 0.0058 0.0059 0.0061 0.0062 0.0063 0.0065 0.0066 0.0068
100 0.0053 0.0053 0.0054 0.0055 0.0056 0.0057 0.0058 0.0059 0.0061 0.0062 0.0064
101 0.0050 0.0050 0.0050 0.0051 0.0052 0.0053 0.0054 0.0056 0.0057 0.0058 0.0060
102 0.0046 0.0046 0.0047 0.0047 0.0048 0.0049 0.0050 0.0052 0.0053 0.0054 0.0055
103 0.0043 0.0043 0.0043 0.0044 0.0045 0.0046 0.0047 0.0048 0.0049 0.0050 0.0051
104 0.0039 0.0039 0.0040 0.0040 0.0041 0.0042 0.0043 0.0044 0.0045 0.0046 0.0047
105 0.0036 0.0036 0.0036 0.0036 0.0037 0.0038 0.0039 0.0040 0.0041 0.0041 0.0043
106 0.0032 0.0032 0.0032 0.0033 0.0033 0.0034 0.0035 0.0036 0.0036 0.0037 0.0038
107 0.0028 0.0028 0.0029 0.0029 0.0030 0.0030 0.0031 0.0032 0.0032 0.0033 0.0034
108 0.0025 0.0025 0.0025 0.0026 0.0026 0.0027 0.0027 0.0028 0.0028 0.0029 0.0030
109 0.0021 0.0021 0.0022 0.0022 0.0022 0.0023 0.0023 0.0024 0.0024 0.0025 0.0026
110 0.0018 0.0018 0.0018 0.0018 0.0019 0.0019 0.0019 0.0020 0.0020 0.0021 0.0021
111 0.0014 0.0014 0.0014 0.0015 0.0015 0.0015 0.0016 0.0016 0.0016 0.0017 0.0017
112 0.0011 0.0011 0.0011 0.0011 0.0011 0.0011 0.0012 0.0012 0.0012 0.0012 0.0013
113 0.0007 0.0007 0.0007 0.0007 0.0007 0.0008 0.0008 0.0008 0.0008 0.0008 0.0009
114 0.0004 0.0004 0.0004 0.0004 0.0004 0.0004 0.0004 0.0004 0.0004 0.0004 0.0004
115+ 0.0000 0.0000 0.0000 0.0000 0.0000 0.0000 0.0000 0.0000 0.0000 0.0000 0.0000
Calendar Year

32
© 2016 Society of Actuaries
Appendix B1: Development of Preliminary Mortality Rates for 2014
B1.1 Reducing the Lag Time
Since the release of the MP-2014 Report, one of RPEC’s main objectives has been to reduce the lag time
between the first year of post-historical mortality projection and the release date of the corresponding
set of mortality improvement rates. Scale MP-2014 was based on historical SSA-published mortality data
through 2009, which after applying the two-year step-back to 2007, resulted in a lag of six years between
the first projection year of 2008 and 2014. Scale MP-2015 had a lag of five years,19 based on historical
SSA-published mortality data through 2011.
In conjunction with the release of the 2016 OASDI Trustees’ Report [SSA 2016], the SSA published
updated U.S. population mortality rates for 2012 and 2013. Utilizing the same data sources and
smoothing methodology used by the SSA to construct their annual sets of mortality rates, RPEC was able
to develop estimated “SSA-style” mortality rates for 2014; see Section B1.3 below. By reflecting three
additional years of mortality data in this 2016 release, RPEC has been able to reduce the lag time to three
years.20
B1.2 Data Sources and SSA Methodology
The raw mortality data underlying the SSA mortality rates come from two government sources, the
Centers for Disease Control and Prevention (CDC) and the Centers for Medicare and Medicaid Services
(CMS). Death counts and exposure lives21 for ages 0 through 64 come from the CDC’s “Multiple Cause of
Death” databases, which can be found on their WONDER database website.22 Death counts and
exposures for ages 65 and older are based on CMS-produced datasets described as “Number of Aged
Persons with HI or SMI and Covered by SSA or RRB Living” [CMS 2016].
It should be noted that a number of significant differences are evident in the composition and structure
of the CDC and CMS databases. Most importantly:
The CDC database includes the entire U.S. population, whereas the CMS database essentially
includes just the subset covered by Medicare and
The CDC exposures are measured as of July 1 of each calendar year, whereas the CMS
enrollments are as of January 1. In a given calendar year, y, for example, SSA adjusts all exposures
to July 1 by averaging the CMS enrollments on 1/1/y with those on 1/1/y+1.
Due to incomplete Medicare enrollment information, the SSA also adjusts the CMS age-65 deaths by a
factor of 4/3.
19 The first year of projected rates in Scale MP-2015 was 2010. 20 The first year of projected rates in Scale MP-2016 is 2013. 21 CDC exposures are developed from U.S. Census Bureau data. 22 http://wonder.cdc.gov/mcd.html.
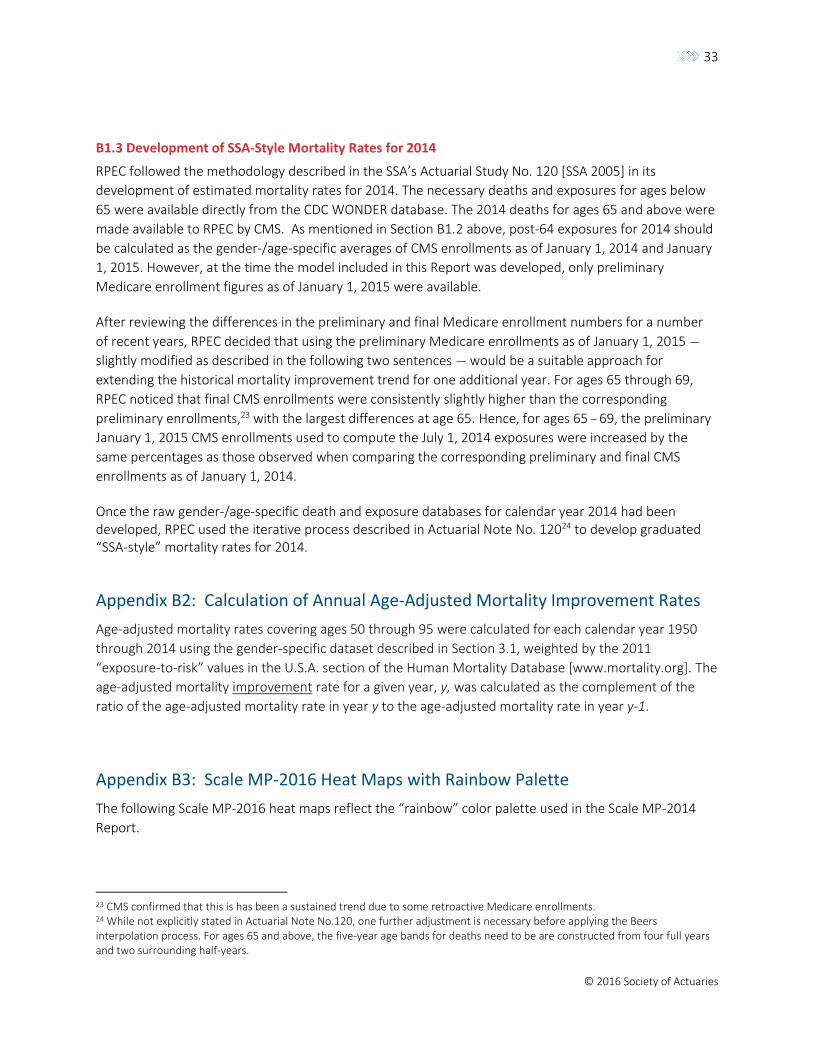
33
© 2016 Society of Actuaries
B1.3 Development of SSA-Style Mortality Rates for 2014
RPEC followed the methodology described in the SSA’s Actuarial Study No. 120 [SSA 2005] in its
development of estimated mortality rates for 2014. The necessary deaths and exposures for ages below
65 were available directly from the CDC WONDER database. The 2014 deaths for ages 65 and above were
made available to RPEC by CMS. As mentioned in Section B1.2 above, post-64 exposures for 2014 should
be calculated as the gender-/age-specific averages of CMS enrollments as of January 1, 2014 and January
1, 2015. However, at the time the model included in this Report was developed, only preliminary
Medicare enrollment figures as of January 1, 2015 were available.
After reviewing the differences in the preliminary and final Medicare enrollment numbers for a number
of recent years, RPEC decided that using the preliminary Medicare enrollments as of January 1, 2015 —
slightly modified as described in the following two sentences — would be a suitable approach for
extending the historical mortality improvement trend for one additional year. For ages 65 through 69,
RPEC noticed that final CMS enrollments were consistently slightly higher than the corresponding
preliminary enrollments,23 with the largest differences at age 65. Hence, for ages 65 – 69, the preliminary
January 1, 2015 CMS enrollments used to compute the July 1, 2014 exposures were increased by the
same percentages as those observed when comparing the corresponding preliminary and final CMS
enrollments as of January 1, 2014.
Once the raw gender-/age-specific death and exposure databases for calendar year 2014 had been developed, RPEC used the iterative process described in Actuarial Note No. 12024 to develop graduated “SSA-style” mortality rates for 2014.
Appendix B2: Calculation of Annual Age-Adjusted Mortality Improvement Rates Age-adjusted mortality rates covering ages 50 through 95 were calculated for each calendar year 1950
through 2014 using the gender-specific dataset described in Section 3.1, weighted by the 2011
“exposure-to-risk” values in the U.S.A. section of the Human Mortality Database [www.mortality.org]. The
age-adjusted mortality improvement rate for a given year, y, was calculated as the complement of the
ratio of the age-adjusted mortality rate in year y to the age-adjusted mortality rate in year y-1.
Appendix B3: Scale MP-2016 Heat Maps with Rainbow Palette The following Scale MP-2016 heat maps reflect the “rainbow” color palette used in the Scale MP-2014
Report.
23 CMS confirmed that this is has been a sustained trend due to some retroactive Medicare enrollments. 24 While not explicitly stated in Actuarial Note No.120, one further adjustment is necessary before applying the Beers interpolation process. For ages 65 and above, the five-year age bands for deaths need to be are constructed from four full years and two surrounding half-years.

34
© 2016 Society of Actuaries

35
© 2016 Society of Actuaries
Appendix B4: Additional 2016 Annuity Value Comparisons
The following table summarizes 2016 deferred-to-age-62 annuity values calculated at various stages of updating the RPEC_2014 model from the 2015 version to the 2016 version. All annuity values were calculated generationally using the following:
Base mortality rates equal to RP-2014 Employee rates adjusted to 2006 for ages below 62 and RP-2014 Healthy Annuitant rates adjusted to 2006 for ages 62 and older, and
A discount rate of 4.0%.
The corresponding impact of the individual changes reflected in this report can be estimated by
comparing the 2016 deferred-to-age-62 annuity values in various columns above. For example:
A comparison of columns (1) and (2) indicates that reflecting three additional years of mortality
data ( for 2012, 2013 and 2014) with no other input changes relative to Scale MP-2015 reduced
2016 annuity values by approximately 3.0% – 4.0%.
A comparison of columns (2) and (3) indicates that after reflecting the three additional years of
data, reducing the horizontal convergence period from 20 years to 10 years increased 2016
annuity values by approximately 0.5% – 1.0%.
(1)* (2) (3) (4) (5)*
Historical Data Through Year 2011 2014 2014 2014 2014
Horizontal Convergence Period 20 Years 20 Years 10 Years 20 Years 10 Years
Initial Slope Constraint 0.003 0.003 0.003 0 0
Male Ages
25 3.5833 3.4444 3.4718 3.5186 3.5209
35 5.1996 4.9926 5.0340 5.1050 5.1082
45 7.5491 7.2458 7.3098 7.4137 7.4202
55 11.0552 10.6337 10.7188 10.8692 10.8736
65 13.6553 13.2060 13.2721 13.4578 13.4451
75 9.7658 9.4036 9.4442 9.6082 9.5990
85 5.8532 5.5996 5.6014 5.6908 5.6847
Female Ages
25 3.8040 3.6921 3.7134 3.7494 3.7521
35 5.5332 5.3628 5.3952 5.4507 5.4543
45 8.0563 7.8021 7.8512 7.9346 7.9398
55 11.7975 11.4347 11.4973 11.6233 11.6252
65 14.5090 14.1077 14.1691 14.3134 14.3142
75 10.6216 10.2335 10.2901 10.4182 10.4270
85 6.5737 6.2706 6.2849 6.3649 6.3661
* Columns (1) and (5) reflect the inputs for Scales MP-2015 and MP-2016, respectively.
Monthly Deferred-To-62 Annuity-Due ValuesGenerational @ 2016; Discount rate = 4.0%

36
© 2016 Society of Actuaries
A comparison of columns (2) and (4) indicates that after reflecting the three additional years of
data and retaining the 20-year horizontal convergence period, reducing the initial slope
constraint from 0.003 to zero increased 2016 annuity values by approximately 1.5% – 2.5%.
A comparison of columns (2) and (5) indicates that after reflecting the three additional years of
data, reducing both the horizontal convergence period and the initial slope constraint increased
2016 annuity values by approximately 1.5% – 2.5%. Note that the percentage changes resulting
from reducing the horizontal convergence period only and reducing the initial slope constraint
only are not additive.
Finally, a comparison of columns (1) and (5) shows the full impact of Scale MP-2016 relative to
Scale MP-2015 discussed earlier in Section 1 and Section 5.1.
References
[ASB 2014] Actuarial Standards Board; Actuarial Standards of Practice No. 35, Selection of Demographic
and Other Noneconomic Assumptions for measuring pension Obligations, Revised Edition, Doc. No. 178
(2014)
[CDC 2016] Centers for Disease Control and Prevention; Ahmad, FB. Quarterly provisional estimates for
selected indicators of mortality, 2014–Quarter 1, 2016; National Center for Health Statistics; National
Vital Statistics System, Vital Statistics Rapid Release Program;
http://www.cdc.gov/nchs/products/vsrr/mortality-dashboard.htm (2016)
[CMI 2015] Continuous Mortality Investigation Working Paper 82; “The CMI format for heatmaps of
mortality improvement”; (Sept. 2015)
[CMS 2016] Centers for Medicare and Medicaid Services; Summary of Medicare Enrollments and Deaths,
2012 – 2014; private communication (2016)
[SOA 2014a] Society of Actuaries; RP-2014 Mortality Tables Report (revised Nov. 2014)
[SOA 2014b] Society of Actuaries; Mortality Improvement Scale MP-2014 Report (Oct. 2014)
[SOA 2015] Society of Actuaries; Mortality Improvement Scale MP-2015 (Oct. 2015)
[SSA 2005] Social Security Administration; Life Tables for the United States Social Security Area 1900-2100; Actuarial Study #120 (Aug. 2005) [SSA 2016] Social Security Administration; The 2016 Annual Report of the Board of Trustees of the Federal Old-Age and Survivors Insurance and Federal Disability Insurance Trust Funds (June 2016)


![· PDF fileMP Marker. -'MP Marker: MP Marker: $4 MP M 03 MP arker: 32 MP 57 P MP MP Marker: 52 MP,M tk M arker:.4 payark MP Market] 45' 44, MP 42 MP Markeižøål](https://img.pdfslide.us/doc/110x75/5a8426c67f8b9ac96a8b63a3/marker-mp-marker-mp-marker-4-mp-m-03-mp-arker-32-mp-57-p-mp-mp-marker-52.jpg)