Embed Size (px)
Citation preview

Morphology of organized convection in tropics and subtropics
Chuntao Liu

Table of content• Differences between land and ocean in the
organized convection.• Where are the organized convection?• Seasonal variation of the organized convection.• Diurnal variation of the organized convection.• Linear shaped organized convection and their
orientations.• Relationship between Wind shear and the shapes
of the organized convection.
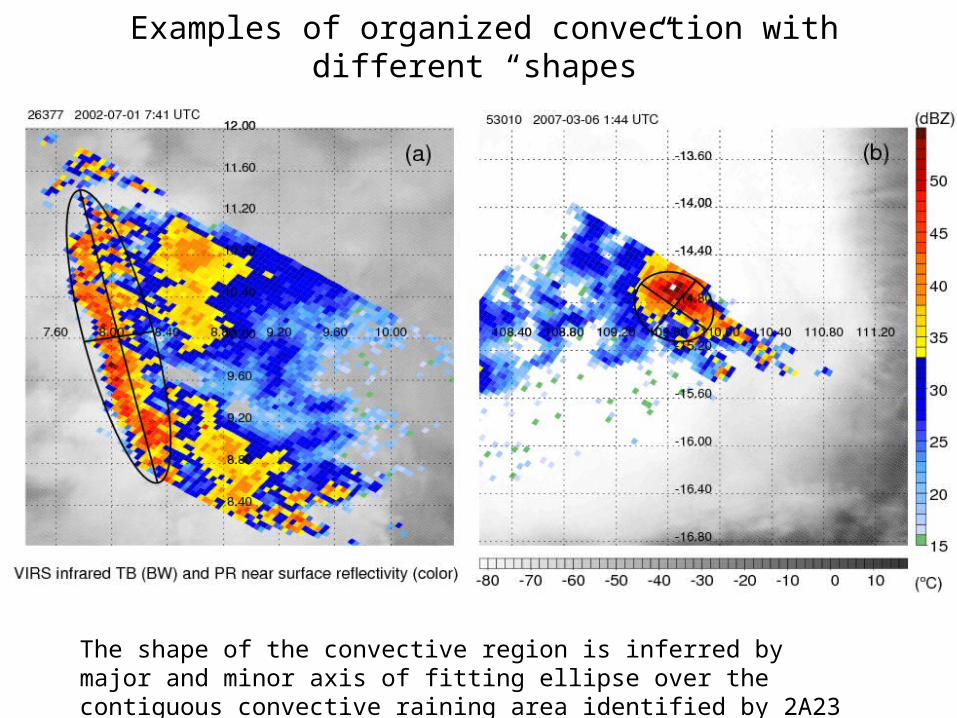
Examples of organized convection with different “shapes”
The shape of the convective region is inferred by major and minor axis of fitting ellipse over the contiguous convective raining area identified by 2A23 algorithm


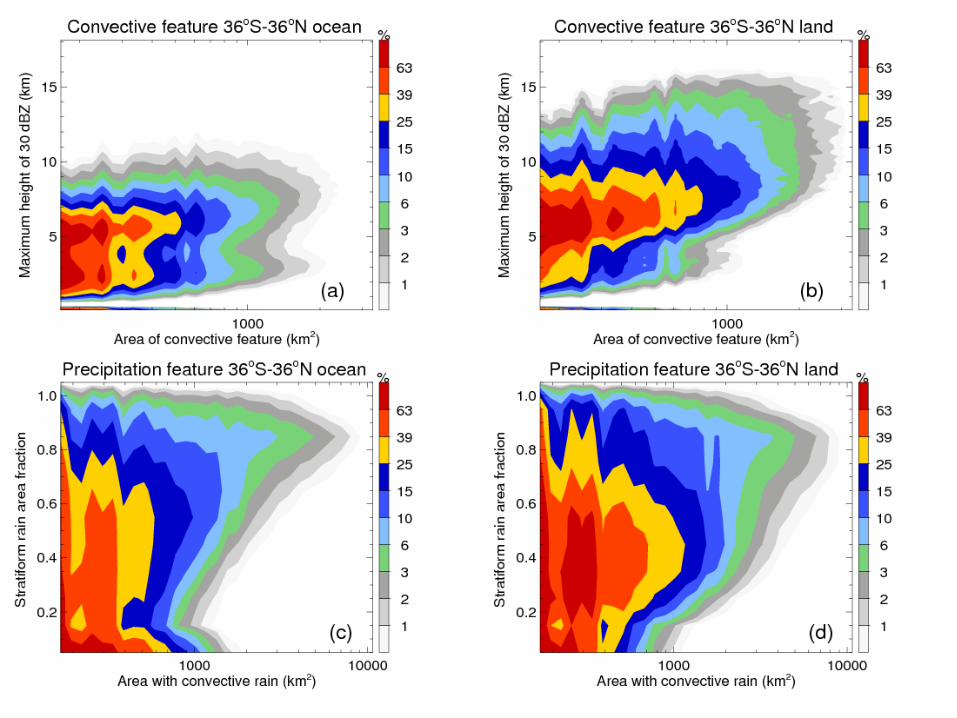

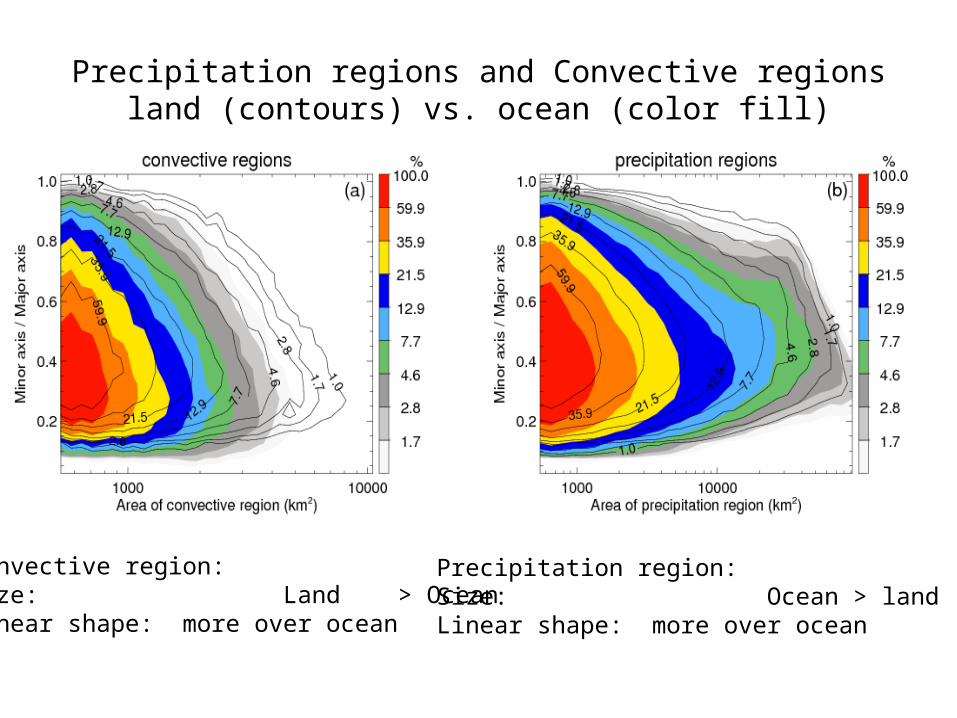
Precipitation regions and Convective regionsland (contours) vs. ocean (color fill)
Precipitation region: Size: Ocean > landLinear shape: more over ocean
Convective region: Size: Land > OceanLinear shape: more over ocean


Samples of the organized convection and precipitation region
Convective regions(21 million > 80 km2)
Precipitation regions(28 million > 80 km2)
Ocean (83%) Land (17%) Ocean (80%) Land (20%)
Regions > 1000 km2 214,8851.2 %
126,2863.4 %
1,622,8117.1 %
641,13811.9 %
Regions > 1000 km2
& linear (Raxis < 0.2) 0.18 % 0.15 % 0.49 % 0.36 %
Linear shape of regions > 1000 km2
15 % 5 % 7 % 3 %
Regions > 1000 km2
& round (Raxis > 0.6) 0.18 % 0.71 % 1.56 % 3.35 %
Round shape of regions > 1000 km2
14 % 21 % 22 % 28 %
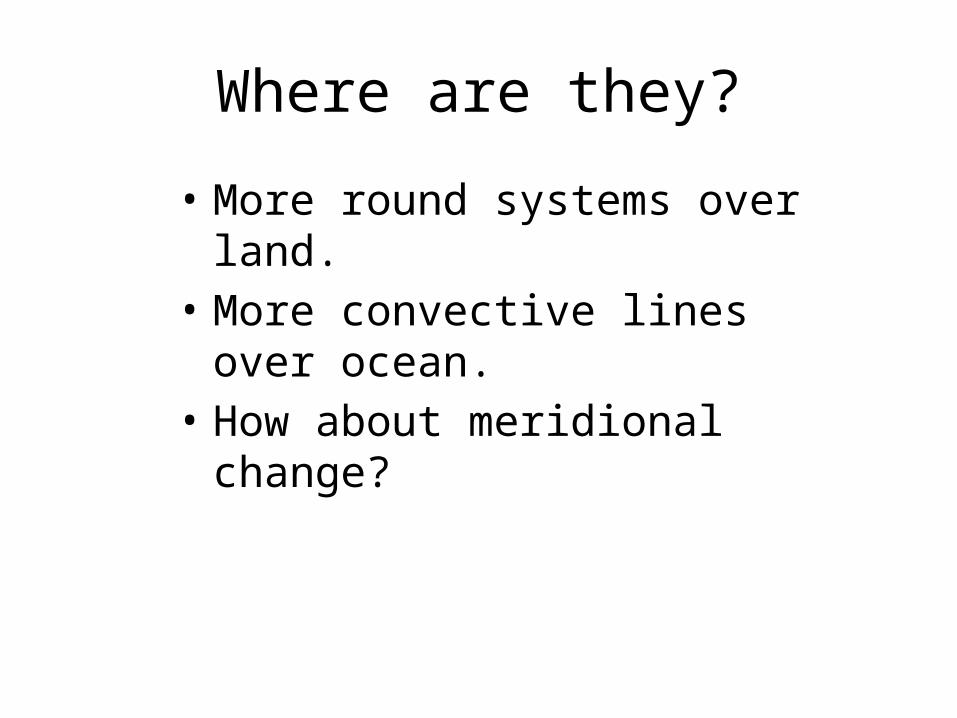
Where are they?
• More round systems over land.• More convective lines over ocean.• How about meridional change?

# of samples
Sample bias is not removed.
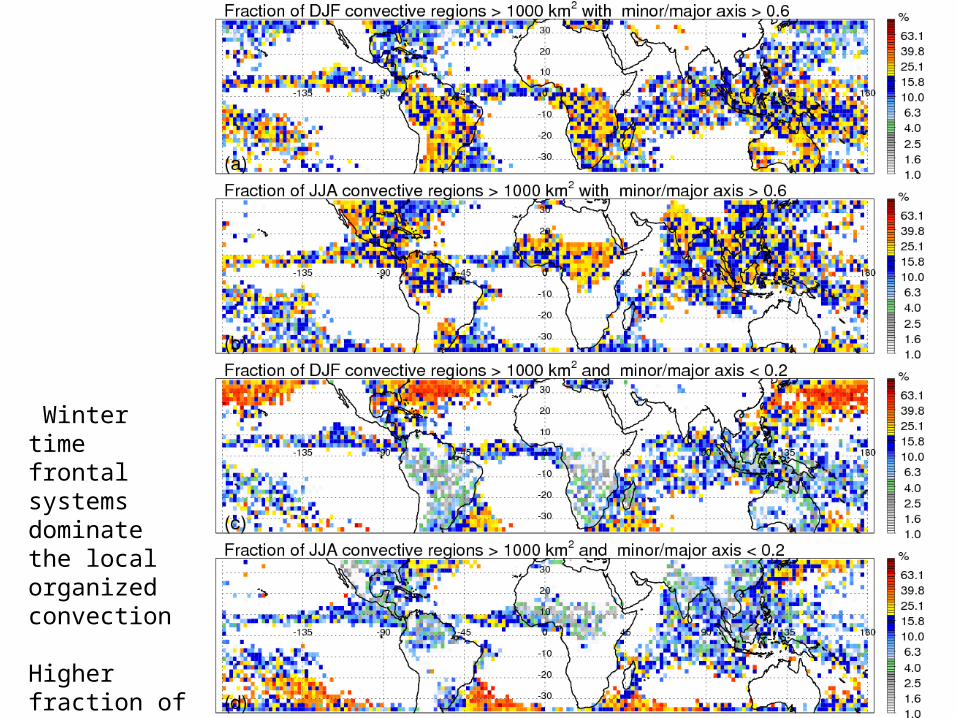
Winter time frontal systems dominate the local organized convection
Higher fraction of linear shape over ocean

For precipitationfeatures
How about the seasonal variation?
Large organized convection (> 1000 km2)
Linear shape organized convection (minor / major axis < 0.2)

After remove the sample bias, there are more organized convection over tropics than subtropics
However, the fraction of the large convective regions is higher over subtropics, especially in winter time over ocean, and spring over land


Orientation of the convective
lines
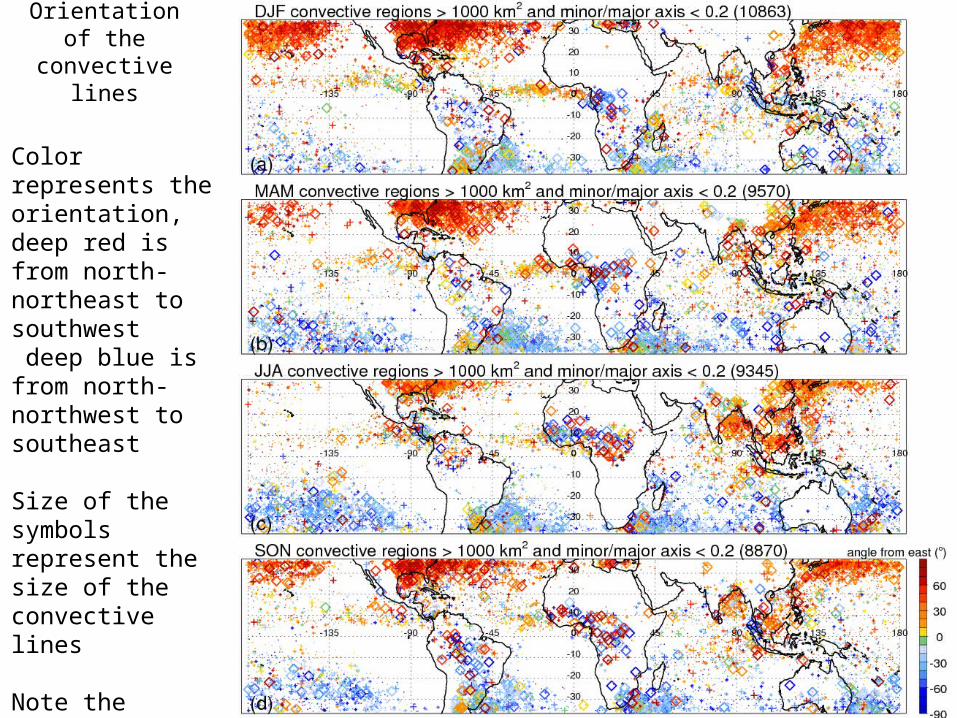
Orientation of the convective
lines
Color represents the orientation, deep red is from north-northeast to southwest deep blue is from north-northwest to southeast
Size of the symbols represent the size of the convective lines
Note the terrain impact to the orientation of the lines over south slope of Himalayas

Orientation transition from land to ocean
Over subtropics, convective lines are more north-south oriented over ocean than over land
East-west Northeast-Southwest North-SouthNorth-South Northwest-Southeast

Orientation of the precipitation regions are more complicated due to the complexity of the trailing stratiform region
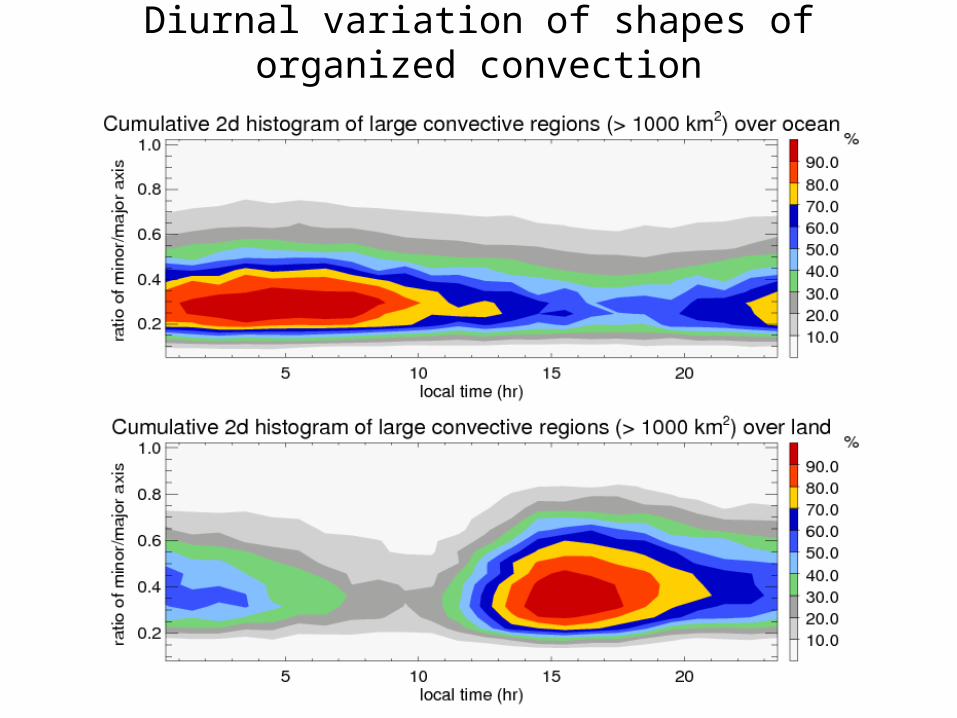
Diurnal variation of shapes of organized convection

Diurnal variation of shapes of organized convection
Convective lines tend to occur a little earlier in the day

Convective intensity differences land (contours) vs. ocean (colorfill)
In addition to the general weaker convective intensity over ocean, there is a group of organized, but shallow convection over ocean (15% compare to 1.5% over land).

Shallow & large convective regions

Shallow & large convective lines

Fraction of shallow
organized convectionwith linear
shape

Why there are different shape of the convection? especially for those linear shape systems?
• Low level wind shear is shown to be important with the squall lines.
• The wind component along the line and cross line are believed to have some roles.
• CAPE?• Mid level moisture.
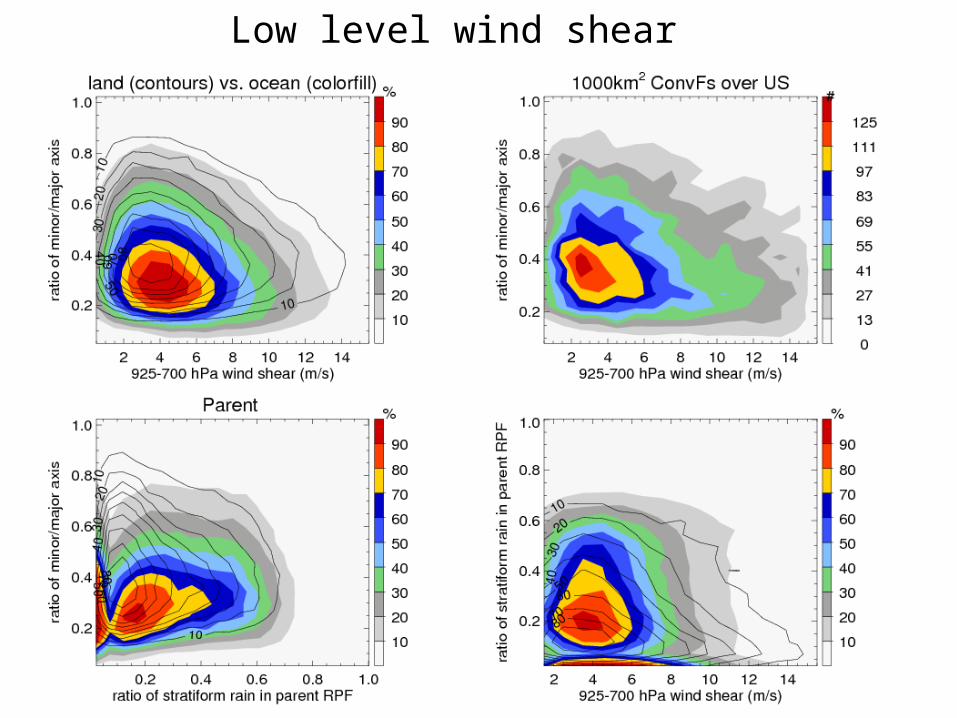
Low level wind shear