Embed Size (px)
Citation preview
MORPHOLOGICAL FILTERING OF EEG
Margarita Kazakeviciute1,* Algimantas Juozapavicius
1, Ruta Samaitiene
2
1 Faculty of Mathematics and Informatics, Vilnius University
Naugarduko st. 24, 03225 Vilnius, Lithuania
2 Department of Child Neurology,
Children Hospital of Vilnius University
Santariskiu st. 7, 08661 Vilnius, Lithuania
* E-mail: [email protected]
Abstract. In the diagnosis of epilepsy long-term monitoring of electroencephalograms (EEG)
data may be required to document and study interictal activities which appear as spikes in
EEG signals. However visual inspection of EEG done by an expert neurologist is much time
consuming. Here an automatic EEG spike detection method that uses morphological filter is
described. The goal is to construct a database with data such as parameters of the detected
spikes, the amount of different waves in EEG signal. The following analysis of the data is
planned to be performed using methods of data mining to find the correlation of spiky signal
areas with brain areas, the influence of amount of different waves and number of spikes in the
signal on the nature of epilepsy. The grid environment is used for calculations.
1. Introduction Biomedical signals are rich information sources about human health. Digital processing of
bio-signals is a key aspect of biomedical research. One of the main subjects of research is the
measurements of the brain activity recorded as electroencephalograms (EEGs). Multichannel
EEG signal of one person usually is the collection of about 12 to 128 signals, which are
recorded with 200Hz or bigger rate and may last from some minutes to some hours.
Electroencephalogram (EEG) is a summation of electrical activities generated by cortical
neurons, and widely used in diagnosis of neurological disorders related to epilepsy. The
seizure of epilepsy leads to transient disturbances of the EEG signal. Thus usually epileptic
EEG data contains transient components and background activities. The epileptic transient
activity usually appears as sharp spikes in signal which occur randomly with short duration of
20-70 ms.
Spike detection is significant for clinical diagnosis of epileptic disorders. In hospitals, a
method of visual/manual detection of spikes in EEG recordings by an experienced neurologist
is widely used. In the case of long EEG recording, this process is much time consuming. Thus
automatic spike detection methods are needed. One of the methods of automatic spike
detection in epileptic EEG is based on the morphological filter. EEG data for analysis are
provided by Vilnius University Children's hospital as files of European Data Format (EDF).
Automatic detection of spikes in the EEG is a complex task due to the variety of
morphology of spikes, different amplitudes and their similarities to waves which are part of
the background noise and to artifacts such as eye blinks. On the other hand there is a demand
to process a big quantity of EDF files in order to produce a data base of signals with their
features expressed, such as frequencies, the parameters of spikes as time of appearance,
amplitude, duration, shape. In the case of rolandic epilepsy it is important to establish the
Materials Physics and Mechanics 9 (2010) 185-193 Received: March 17, 2010
© 2010, Institute of Problems of Mechanical Engineering
number of spikes during the sleep period and wakefulness period. Moreover after spike
detection the following analysis should be performed to establish correlation between signals
which form spiky areas with similar spike shapes, time of appearance and coordinates,
relationship between them, their correspondence to areas in human brain.
We attempt to find some laws of transient signal behavior using data mining methods.
The processing of big amount of EEG data demands hardware and storage resources for input
and output data, which are not sufficient on in-house hardware. The grid calculation
environment is used for these tasks.
2. Benign childhood epilepsy with centrotemporal spikes (rolandic epilepsy)
Benign childhood epilepsy with centrotemporal spikes (BCECS) is placed in the group of
idiopathic localization-related (focal, local, partial) epilepsies in the International
Classification of Epilepsies and Epileptic Syndromes [CoClTe].
Diagnostic criteria. Loiseau and Duche [2] provided five criteria for the diagnosis of
benign childhood epilepsy with centrotemporal spikes:
(1) onset between the ages of 2 and 13;
(2) absence of neurologic or intellectual deficit before the onset;
(3) partial seizures with motor signs, frequently associated with somatosensory symptoms or
precipitated by sleep;
(4) a spike focus located in the centrotemporal (rolandic) area with normal background
activity on the interictal EEG; and
(5) spontaneous remission during adolescence.
Seizure manifestations could be: guttural sounds; drooling, swallowing disturbance;
movements or tonic contractions of a tongue or jaw; unilateral numbness or paresthesia of the
tongue, lips, gums, and cheek; speech arrest, hemifacial convulsions, which may spread to the
arm and the leg or may become secondarily generalized.
The characteristic interictal EEG pattern are centrotemporal spikes and normal
background activity. Spikes are usually high amplitude (100-microvolts to 300-microvolts),
diphasic; they are often followed by a slow wave. These sharp and slow wave complexes or
spikes are often localized to the central (C3/C4) electrodes or midway between the central and
temporal electrodes (C5/C6). They may be unilateral or bilateral, synchronous or
asynchronous. The spikes may occur isolated or in clusters, with a rhythm of about 1.5 Hz to
3 Hz [2]. Focal rhythmic slow activity could be observed in the region where the spikes are
seen [3]. Centrotemporal spikes are activated by sleep. Normal sleep architecture is preserved.
Prognosis. BCECS is considered to have an excellent prognosis. It has spontaneous
recovery during adolescence, with normal global intellectual efficiency. But some children
may suffer during the active phase of the epilepsy from oromotor dysfunction,
neuropsychological deficits, or attention deficits with learning disorders. Many
neuropsychological studies had been performed. Qualitative analysis of 23 adolescents and
young adults suggested a different organizational pattern for cerebral language in remission
from this syndrome [4]. In a study of 32 patients compared to 36 controls, patients performed
significantly worse than controls in spelling, reading aloud, and reading comprehension, and
they presented dyslexic-type errors [5]. In a study of 36 patients no correlation was found
between global IQ and the severity of the centrotemporal spikes. All the children had at least
one specific learning disorder (sometimes long-lasting) [6]. The review addressed to the
effects of subclinical localized epileptiform discharges during sleep in children with BCECS
on cognition and behavior showed a diversity of educational deficits, behavioral impairments,
language delay, and neuropsychological test results. The occurrence of atypical seizure
characteristics seems to be related to language delay, and several atypical EEG characteristics
are related to cognitive or behavioral problems [7]. Several electroencephalogram (EEG)
Margarita Kazakeviciute, Algimantas Juozapavicius, Ruta Samaitiene186
characteristics have been related to the occurrence of learning and behavioral problems. Some
investigators evidenced mainly a significant effect of the persistence of a prolonged slow
focus and a strong activation of night EEG spike and waves on cognitive decline and attention
disorders [8]. In a study of 28 children the presence of
(I) an intermittent slow-wave focus during wakefulness,
(II) a high number of spikes in the first hour of sleep (and during whole night sleep), and
(III) multiple asynchronous bilateral spike-wave foci in the first hour of sleep correlates
significantly with educational or behavioral impairment [9].
3. Electroencephalogram
Electroencephalogram (EEG) is a measurement of voltages generated by neurons of brain.
EEG data is collected by placing a set of electrodes on the scalp or directly on the surface of
brain. EEG signal information is widely used in the diagnosis of neurological disorders such
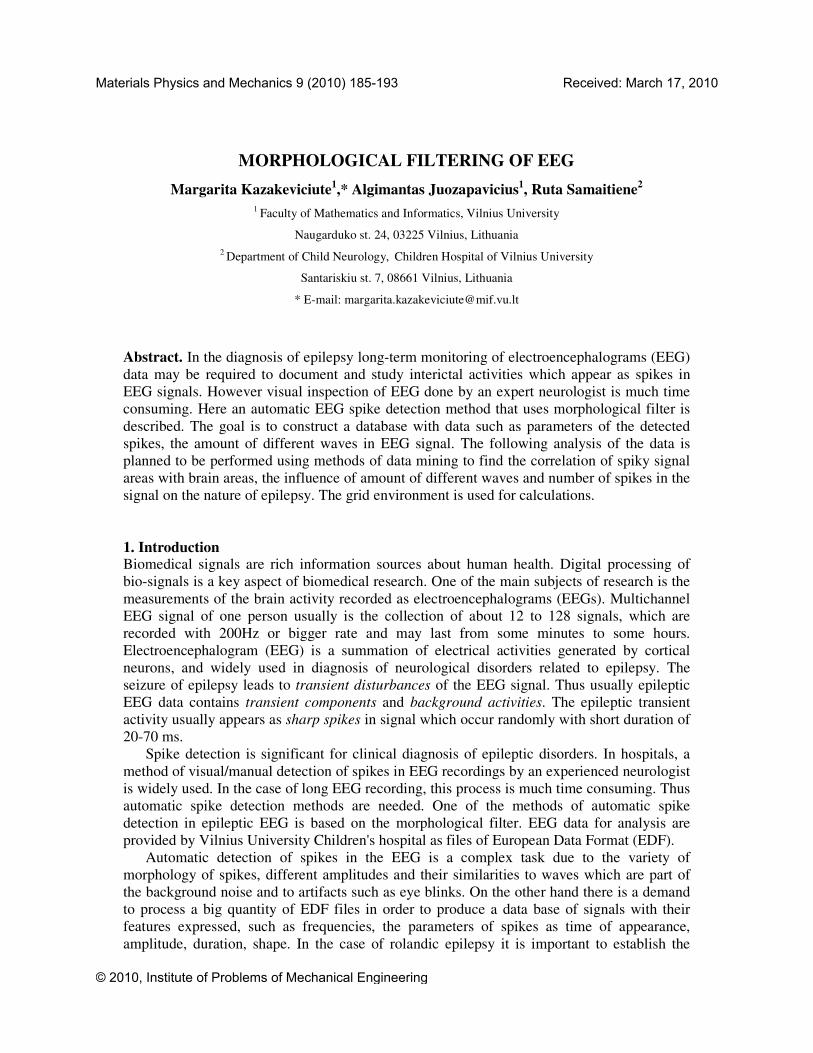
as epilepsy. Fig. 1 shows an example of EEG where 16 electrodes were used for brain signals
recording. Time in milliseconds is presented on x-axis and voltage in micro volts is presented
on y-axis. Each signal corresponds to electrode; the label of electrode is shown on the right.
The effective bandwidth for EEG signals is limited to approximately 100 Hz. Therefore a
minimum frequency of 200 samples/s (to satisfy the Nyquist criterion) is often enough for
sampling the EEG signals. If higher resolution is required, sampling frequencies of up to 2000
sample/s can be used [10].
Each signal sample is usually represented with 16 bits in EEG recording systems. One
hour recording from 128 electrodes EEG sampled at 500 samples/s needs memory:
120x60x60x500x16 = 0.45 Gbyte [10]. In our case, the EEG data was provided by Vilnius
University Children's hospital as files of European data format (EDF) with sample rate of 200
samples per second.
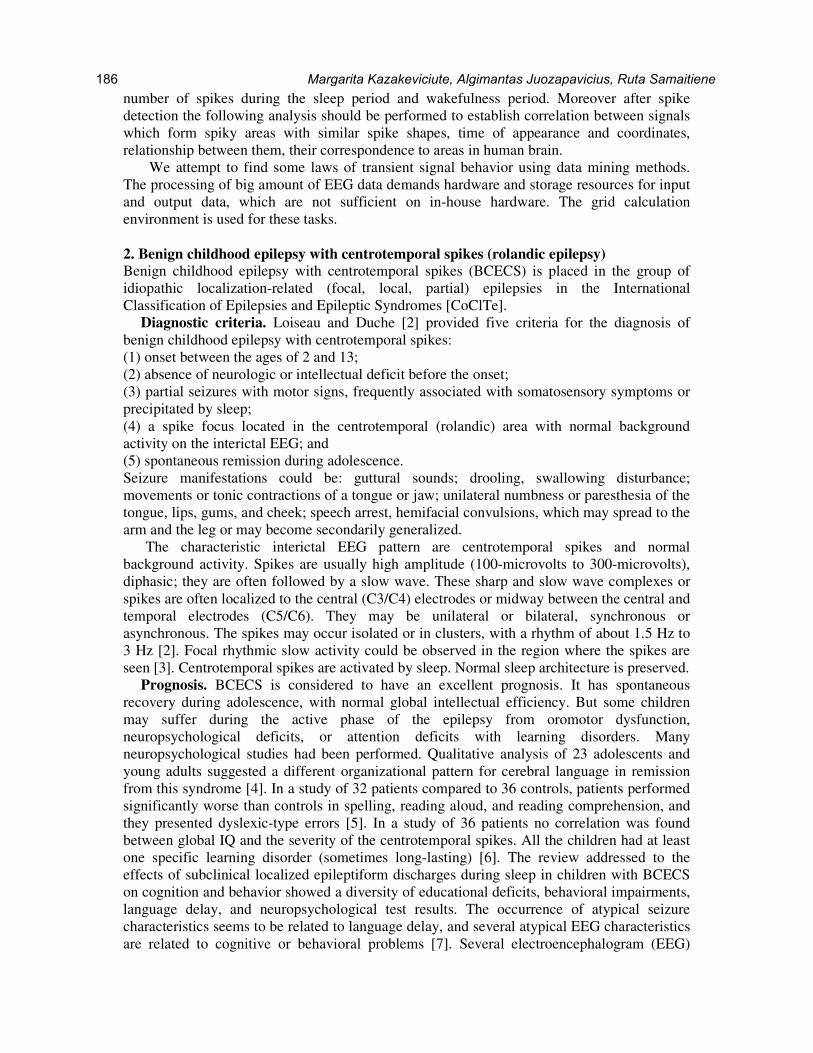
International Federation of Societies for Electroencephalography and Clinical
Neurophysiology has recommended the conventional electrode setting (also called 10–20) for
21 electrodes (Fig. 2). The odd electrodes are on the left and the even ones on the right [10].
Two different modes of recordings, namely bipolar (differential) and mono-polar (referential),
are used. In the bipolar case differential input from two neighbor electrodes is recorded. In
referential case one or two reference electrodes are used, for example one or both ears.
Highpass filters with cut-off frequency of less than 0.5 Hz are used to remove the very
low frequency components such as those of breathing. Lowpass filters with a cut-off
frequency of approximately 50–70 Hz are used to remove system artifacts as power supply
interference, impedance fluctuation, cable defects, and electrical noise.
Fig. 1. Example of recorded EEG signals.
Morphological filtering of EEG 187
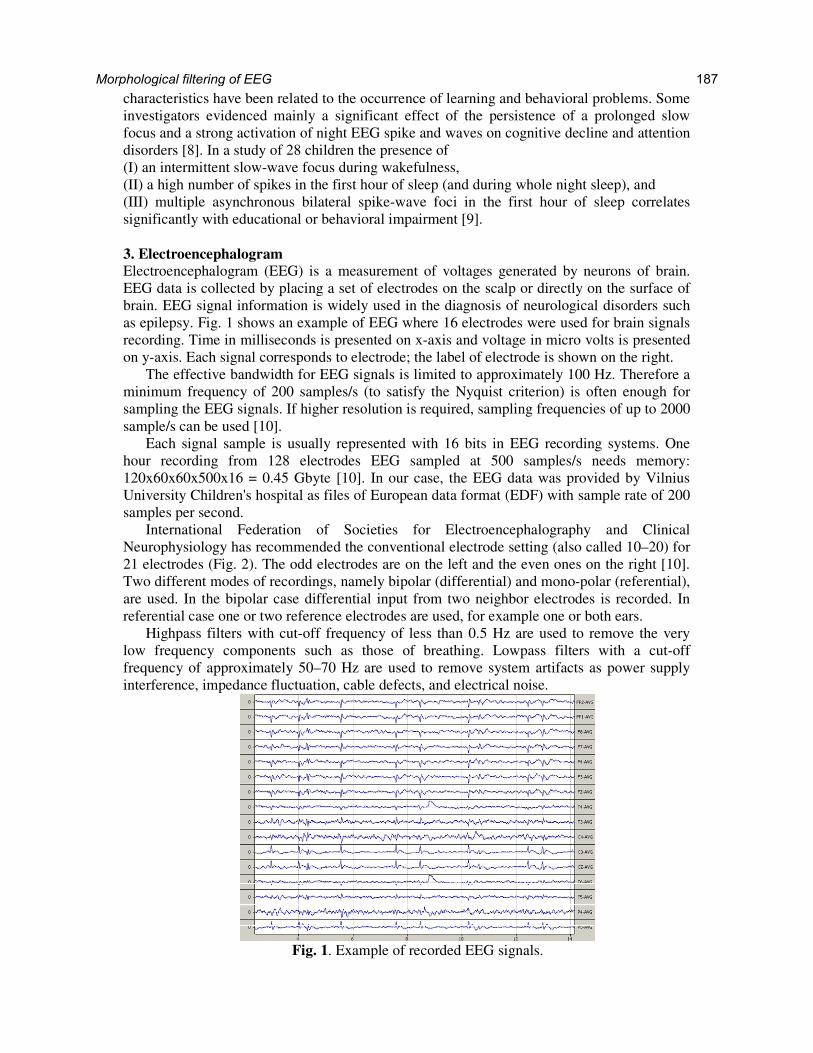
Action potentials and spikes. The information transmitted by a nerve is called an action
potential (AP). AP is a temporary change in the neuron membrane potential that is transmitted
along an axon. It is usually initiated in a cell body and normally travels in one direction. The
membrane potential depolarizes, becomes more positive and produces a spike. Afterwards
membrane repolarizes, i.e. potential becomes more negative than the resting potential and
then returns to normal. The action potentials of most nerves last between 5 and 10
milliseconds. Fig. 3 shows an example of AP [10]. The conduction velocity of action
potentials lies between 1 and 100 m/s. APs are initiated by many different types of stimuli.
Nerves within the brain are mostly stimulated by chemical activity at synapses. When the
stimulus strength goes above some threshold level, an AP appears and travels down the nerve
[10].
Fig. 2. Electrode positioning scheme [10]. Fig. 3. Example of action potential (time in
ms on x-axis, membrane potential in
mV on y-axis) [10]
EEG background and transient activity Often a clinical seizure is characterized by a sudden change of frequency in the EEG
measurement. The transition from the preictal to the ictal state, for a focal epileptic seizure,
consists of a gradual change from chaotic to ordered waveforms. The amplitude of the spikes
does not necessarily represent severity of the seizure. In childhood the occipital spikes are
very common. Rolandic central–midtemporal–parietal spikes are normally benign, whereas
frontal spikes or multifocal spikes are more epileptogenic. The morphology of the spikes
varies significantly with age. However, the spikes may occur in any level of awareness
including wakefulness and deep sleep. Seizure artifacts within an EEG measurement have a
prominent spiky but repetitive (rhythmical) nature, whereas the majority of other artifacts are
noise-like in shape [10].
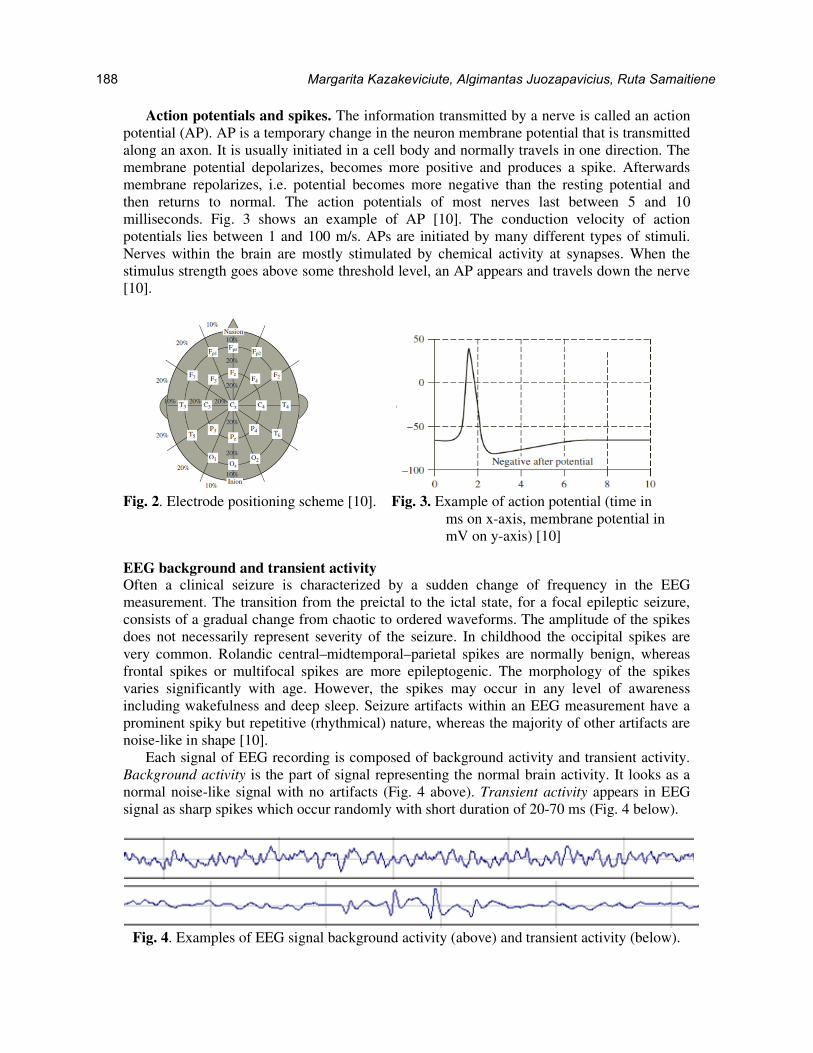
Each signal of EEG recording is composed of background activity and transient activity.
Background activity is the part of signal representing the normal brain activity. It looks as a
normal noise-like signal with no artifacts (Fig. 4 above). Transient activity appears in EEG
signal as sharp spikes which occur randomly with short duration of 20-70 ms (Fig. 4 below).
Fig. 4. Examples of EEG signal background activity (above) and transient activity (below).
Margarita Kazakeviciute, Algimantas Juozapavicius, Ruta Samaitiene188
The epileptic seizure or disturbance of brain activity leads to transient signals. Monitoring
of EEG spikes and rhythms is used for investigation of the following clinical problems:
investigation of epilepsy and location of its origin in brain; testing epilepsy drug effects;
monitoring brain development; investigation of sleep disorder; investigation of mental
disorder; locating damaged areas of brain, location of surgery.
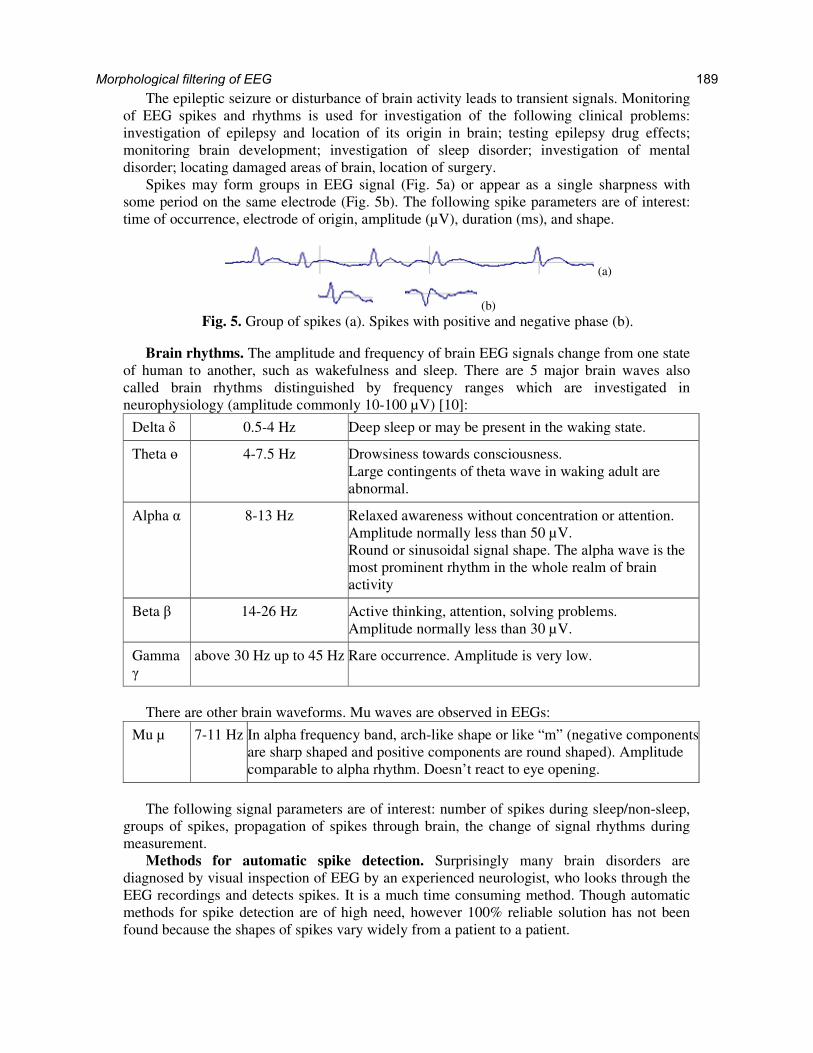
Spikes may form groups in EEG signal (Fig. 5a) or appear as a single sharpness with
some period on the same electrode (Fig. 5b). The following spike parameters are of interest:
time of occurrence, electrode of origin, amplitude (µV), duration (ms), and shape.
(a)
(b)
Fig. 5. Group of spikes (a). Spikes with positive and negative phase (b).
Brain rhythms. The amplitude and frequency of brain EEG signals change from one state
of human to another, such as wakefulness and sleep. There are 5 major brain waves also
called brain rhythms distinguished by frequency ranges which are investigated in
neurophysiology (amplitude commonly 10-100 µV) [10]:
Delta δ 0.5-4 Hz Deep sleep or may be present in the waking state.
Theta ө
4-7.5 Hz Drowsiness towards consciousness.
Large contingents of theta wave in waking adult are
abnormal.
Alpha α 8-13 Hz Relaxed awareness without concentration or attention.
Amplitude normally less than 50 µV.
Round or sinusoidal signal shape. The alpha wave is the
most prominent rhythm in the whole realm of brain
activity
Beta β 14-26 Hz Active thinking, attention, solving problems.
Amplitude normally less than 30 µV.
Gamma
γ
above 30 Hz up to 45 Hz Rare occurrence. Amplitude is very low.
There are other brain waveforms. Mu waves are observed in EEGs:
Mu µ 7-11 Hz In alpha frequency band, arch-like shape or like “m” (negative components
are sharp shaped and positive components are round shaped). Amplitude
comparable to alpha rhythm. Doesn’t react to eye opening.
The following signal parameters are of interest: number of spikes during sleep/non-sleep,
groups of spikes, propagation of spikes through brain, the change of signal rhythms during
measurement.
Methods for automatic spike detection. Surprisingly many brain disorders are
diagnosed by visual inspection of EEG by an experienced neurologist, who looks through the
EEG recordings and detects spikes. It is a much time consuming method. Though automatic
methods for spike detection are of high need, however 100% reliable solution has not been
found because the shapes of spikes vary widely from a patient to a patient.
Morphological filtering of EEG 189

There are some groups of automatic methods for spike detection presented in literature:
temporal approach – EEG is divided into waves and half waves and for each the duration,
amplitude and sharpness is calculated. If all parameters exceed threshold, it is assumed to be a
spike; wavelet based method – spike is detected when a normalized wavelet power is above
threshold; neural networks; morphological filtering; other. The estimation of reliability of
different methods may be found in [11]. Since the morphological filtering has quite high
percentage of detection, this method was chosen to be used for spike detection.
4. Basic operators of mathematical morphology
In this section, we give a brief description on mathematical morphology. Let f(t) and g(t) be
the subsets of the Euclidean space E, where f(t) is the one dimensional time series data, i.e.
the EEG signal needed to be analyzed, and g(t) is the predefined structuring element. Denote
the domains of f(t) and g(t) as F and G respectively. gS(t)=g(-t) is the reflection of g rotated
by 180° degree with respect to the origin. The Minkowski addition and subtraction with
functional structuring element g(t) for one-dimensional time series data f(t) are defined as
follows [12]:
addition: { { })u(g)ut(fmax)t)(gf(
GuFut
+−=⊕
∈∈−
,
subtraction: (f Ө g)(t) { { })u(g)ut(fmin
GuFut
−−=
∈∈−
.
The morphological filter called opening and morphological filter called closing are defined as
follows [12]:
opening: ftgf [())(( =o Ө )]() tgg S⊕ ,
closing: )[())(( Sgftgf ⊕=• Ө )]( tg .
Opening operation smoothes convex peaks of the original signal f(t) and closing operation
smoothes concave peaks of f(t). Thus opening and closing can be applied to detect peaks and
valleys in the signal.
5. Spike detection using morphological filter Different operators smooth or extract different parts of the signal depending on the shape of a
structuring element. Thus one of the tasks is the selection of the structuring element which
separates the spiky areas of the signal. Combination of the morphological operators can
produce a filter which separates an original signal into two signals: one signal is defined by
the structuring element and the other is the residue of the signal. Thus the task is the selection
of morphological filter.
Combination of morphological operators. Spikes exist with positive and negative phase
in an epileptic EEG. In order to detect bi-directional spikes, the morphological filters can be
first applied with the opening operator followed by the closing operator or vice versa [13]:
open-closing operation: )()()())(( 21 tgtgtftfOC •= o ,
close-opening operation: )()()())(( 21 tgtgtftfCO o•= ,
where g1(t) and g2(t) are different structuring elements.
The open-closing filter provides an effect of the low pass filter. Thus, we can also
construct a high-pass filter by taking the difference between the input signal and it’s open-
closing. However the result of open-closing operation has a lower amplitude than the original
signal and the result of close-opening operation has a larger amplitude. If spikes are detected
by selecting some threshold of the amplitude, the distortion of amplitude can cause pseudo
Margarita Kazakeviciute, Algimantas Juozapavicius, Ruta Samaitiene190
positive or missing detection. Thus an average combination of open-closing and close-
opening may be used for more precise extraction of bi-directional spikes [13]:
2/))](())(([))(( tfCOtfOCtfOCCO += .
Then the original EEG signal f(t) can be presented as follows:
))(()()( tfOCCOtxtf += ,
where OCCO represents the background activity, x(t) represents the transient activity or spiky
part of the signal.
Selection of structuring element. According to [14] ‘Spike is a transient, clearly
distinguished from background activity, with pointed peak at conventional paper speeds and a
duration from 20 to under 70 msec, i.e., 1/50 to 1/14 sec, approximately. Main component is
generally negative relative to other areas. Amplitude is variable.’ Generally, an EEG spike is
different from the background activity; has a sharp peak and duration of 20-70ms. Since
different spike waves can have various amplitude and frequency, the structuring elements
should be adjusted to the proper size where the spike component can be best extracted. In
order to separate the spike component and background activity, the structuring element pair g1
(t) and g2 (t) is determined as two parabolas [13]:
iii btatg +=2)( , i=1, 2.
These elements can fit into the shape of background EEG waves but not into the spike waves.
The result of separation of transient and background parts of the original signal f(t) depends
on the selection of an amplitude and a width of g1(t) and g2(t), i.e. the selection of bi and ai,
i=1, 2.
The amplitude and width of spike can vary on the same signal and on all signals of EEG
record for the same person. These parameters are selected according to characteristics of spike
waves. The criterion for structuring elements and optimization process is proposed in [13].
We use different criterions for amplitude and width. The signal is divided into segments and
the parameter calculation and spike detection is performed for each segment individually. The
calculations are not performed for the whole signal since the amplitude and frequency can
vary too much and transient activity is usually detected according to its neighborhood data.
Let us denote the vector of widths of the arcs of the original signal f(t) segment as arcsWidths
and the vector of amplitudes of the signal segment as |f|. Then we use the following
parameters of structuring elements:
w1=0.5*median(arcsWidths), w2=1.5*median(arcsWidths),
h1=median(|f|), h2=2*median(|f|).
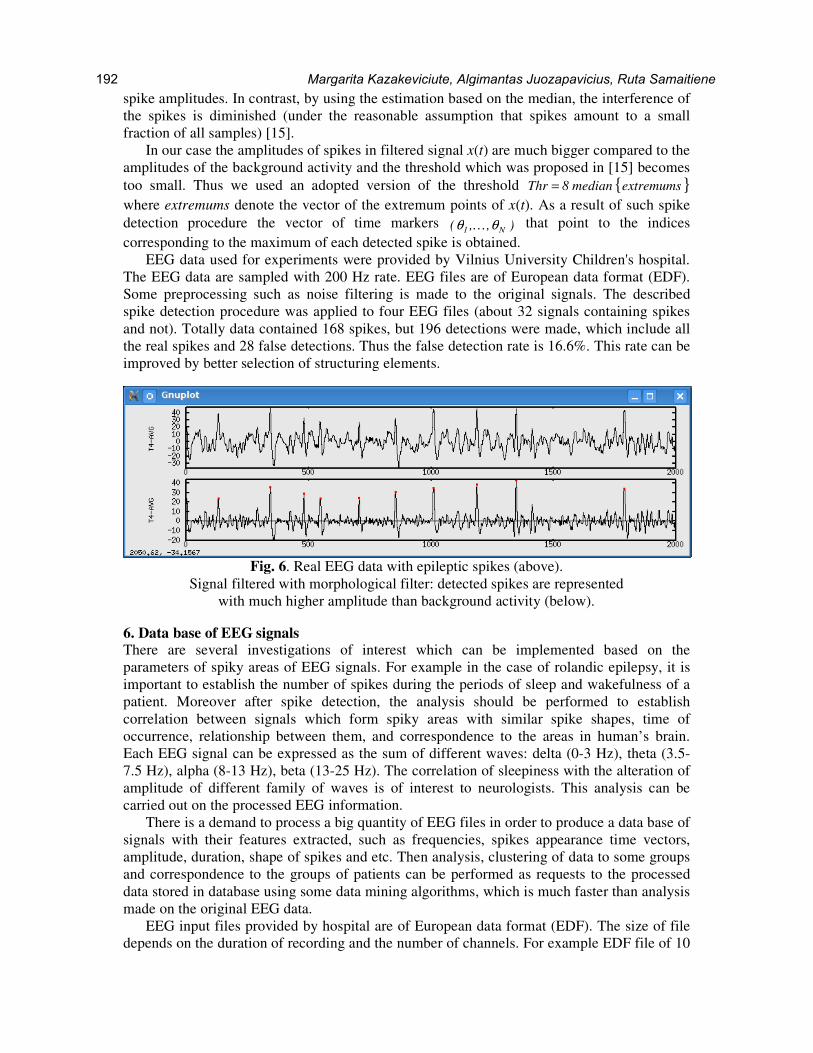
The morphological filter with such structuring elements restrains background activity and
extract spike components of the original signal. The example of application is presented in
Fig. 6 where the original epileptic EEG signal f(t) at electrode T4 with many spikes is showed
above and the result of application of morphological filter ))(()()( tfOCCOtftx −= is
showed below. As a result the background activity is diminished and spikes are exposed with
comparatively high amplitudes.
Spike detection. The task of spikes detection in the original signal f(t) is actually the
problem of localization of spikes occurrence times. Since times of spikes occurrence in
signals f(t) and x(t) coincide, the spike detection is performed by applying amplitude threshold
rule to the filtered signal x(t). In [15] it was proposed to use an automatic threshold
{ }6745.0/xmedian44Thr == σ , where σ is the estimate of standard deviation of the
background noise. Note that taking the standard deviation of the signal (including the spikes)
could lead to very high threshold values, especially in cases with high firing rates and large
Morphological filtering of EEG 191
spike amplitudes. In contrast, by using the estimation based on the median, the interference of
the spikes is diminished (under the reasonable assumption that spikes amount to a small
fraction of all samples) [15].
In our case the amplitudes of spikes in filtered signal x(t) are much bigger compared to the
amplitudes of the background activity and the threshold which was proposed in [15] becomes
too small. Thus we used an adopted version of the threshold { }extremumsmedian8Thr =
where extremums denote the vector of the extremum points of x(t). As a result of such spike
detection procedure the vector of time markers ),,( N1 θθ K that point to the indices
corresponding to the maximum of each detected spike is obtained.
EEG data used for experiments were provided by Vilnius University Children's hospital.
The EEG data are sampled with 200 Hz rate. EEG files are of European data format (EDF).
Some preprocessing such as noise filtering is made to the original signals. The described
spike detection procedure was applied to four EEG files (about 32 signals containing spikes
and not). Totally data contained 168 spikes, but 196 detections were made, which include all
the real spikes and 28 false detections. Thus the false detection rate is 16.6%. This rate can be
improved by better selection of structuring elements.
Fig. 6. Real EEG data with epileptic spikes (above).
Signal filtered with morphological filter: detected spikes are represented
with much higher amplitude than background activity (below).
6. Data base of EEG signals There are several investigations of interest which can be implemented based on the
parameters of spiky areas of EEG signals. For example in the case of rolandic epilepsy, it is
important to establish the number of spikes during the periods of sleep and wakefulness of a
patient. Moreover after spike detection, the analysis should be performed to establish
correlation between signals which form spiky areas with similar spike shapes, time of
occurrence, relationship between them, and correspondence to the areas in human’s brain.
Each EEG signal can be expressed as the sum of different waves: delta (0-3 Hz), theta (3.5-
7.5 Hz), alpha (8-13 Hz), beta (13-25 Hz). The correlation of sleepiness with the alteration of
amplitude of different family of waves is of interest to neurologists. This analysis can be
carried out on the processed EEG information.
There is a demand to process a big quantity of EEG files in order to produce a data base of
signals with their features extracted, such as frequencies, spikes appearance time vectors,
amplitude, duration, shape of spikes and etc. Then analysis, clustering of data to some groups
and correspondence to the groups of patients can be performed as requests to the processed
data stored in database using some data mining algorithms, which is much faster than analysis
made on the original EEG data.
EEG input files provided by hospital are of European data format (EDF). The size of file
depends on the duration of recording and the number of channels. For example EDF file of 10
Margarita Kazakeviciute, Algimantas Juozapavicius, Ruta Samaitiene192
minutes recording with 21 channels is about 6MB size. Recording can last from some minutes
to some hours. The processing of big amount of EEG data demands hardware and storage
resources for input and output data, which are not sufficient on in-house hardware. Thus grid
resources offer a possibility to process big amount of data and make various analyses of it.
Thus further analysis is of interest based on the database of EEG signals:
• Correlation of spike number in EEG and spike parameters with a type of epilepsy and
clinical data;
• Spikes clustering;
• Locating damaged areas of the brain;
• The amount of waves of different rhythms (Hz) and its correlation with the type of
epilepsy, sleepiness.
7. Conclusions A method for automatic spike detection by using morphological filter is described. The
morphological filter is selected as an average of general open - closing and close - opening
operations. The constructed morphological filter is applied to the real EEG data and spikes are
detected using a threshold rule. The parameters of EEG signals are calculated. The goal is to
generate EEG signal database. All calculations are performed on grid environment. The
analysis, using data mining algorithms on collected data and parameters, is planned to be
performed such as the correlation between the number of spikes, shape of spikes, time and
area of spike occurrences, component waves of signal and nature of epilepsy, brain source
localization, detection and classification of event related potentials, sleep signal analysis,
seizure detection and prediction.
References
[1] Commission on Classification and Terminology of the International League against
Epilepsy. Proposal for revised classification of epilepsies and epileptic syndromes. Epilepsia
30 (1989) 389.
[2] P. Loiseau, B. Duche // Cleve Clin. J. Med. 56 (1989) 17.
[3] A. Mitsudome, M. Ohu, S. Yasumoto, A. Ogawa // Clin. Electroencephalogr. 28 (1997)
44.
[4] C. Hommet, C. Billard, J. Motte et al. // Epileptic Disord 3 (2001) 207.
[5] A. Papavasiliou, D. Mattheou et al. // Epilepsy Behav. 6 (2005) 50.
[6] U. Stephani, and G. Carlsson // Epilepsia 47, Suppl 2 (2006)67.
[7] J. Nicolai, A.P. Aldenkamp et al. // Epilepsy Behav. 8 (2006) 56.
[8] A.D. Saint-Martin, C. Seegmuller et al. // Epileptic Disord 3 (2001) SI-59.
[9] J. Nicolai, I. van der Linden et al. // Epilepsia 48 (2007) 2093.
[10] Sanei Saeid and J.A. Chambers // EEG Signal Processing, John Wiley & Sons, 2007.
[11] P. Hese, H. Hallez, B. Vanrumste, Y.D’Asseler, P. Boon // Fifth FTW PhD symposium,
Faculty of Engineering, Ghent University, 2004 – paper nr. 093.
[12] Tomonari Yamaguchi, Mitsuhiko Fujio and Katsuhiro Inoue // 3rd Internat. Conf.
Innovative Computing Information and Control (ICICIC'08), 2008 IEEE.
[13] Guanghua Xu, Jing Wang, Qing Zhang, Junming Zhu // Proceeding of the 2006 IEEE
International Conference on Automation Science and Engineering Shanghai, China, October
7-10, 2006.
[14] G.E. Chatrian, L. Bergamini, M. Dondey, D.W. Klass, M. Lennox, I. Buchthal, I.
Petersen // A Glossary of Terms Most Commonly used by Clinical Electroencephalographers,
Electroencephalography and Clinical Neurophysiology, vol. 37, pp. 538-548, 1974.
[15] R. Quian Quiroga, Z. Nadasdy, Y. Ben-Shaul // Neural Computation, No. 16 (2004)
1661.
Morphological filtering of EEG 193


![NSF Project EEG CIRCUIT DESIGN. Micro-Power EEG Acquisition SoC[10] Electrode circuit EEG sensing Interference](https://img.pdfslide.us/doc/110x75/56649cfb5503460f949ccecd/nsf-project-eeg-circuit-design-micro-power-eeg-acquisition-soc10-electrode.jpg)