Embed Size (px)
Citation preview

Page | 72
www.gcstmr.com.au
International Journal of Engineering,
Construction and Computing
Volume 1 Issue 1, 2019
ISSN: 2209-332X(Print)
Morphological assessment of a selected reach of the Jamuna River
using the Delft3D Model
Orpita Urmi Laz1,*, Umme Kulsum Navera2 1School of Computing, Engineering and Mathematics, Western Sydney University, Australia 2Department of Water Resources Engineering, Bangladesh University of Engineering and Technology,
Bangladesh
*Corresponding author’s email: [email protected]
Peer review history Manuscript submitted: 30 April 2019
Review process completed: 28 August 2019
Manuscript finally accepted: 28 August 2019
Handling Editor: Professor Ataur Rahman
Abstract: The River Jamuna, in Bangladesh, is one
of the greatest alluvial rivers in the world. Almost
every year severe erosion takes place, which
renders tens of thousands of people homeless. In
order to improve the livelihoods of floodplain
dwellers, understanding the morpho-dynamics of
the river is essential. The reach boundaries
considered in this study are 30 km upstream and 20
km downstream of Bangabandhu Bridge. The main
objective of this paper was to look over the
sediment dynamics and the possible changes on riverbed morphology by using the open-source,
Delft3D modelling software. Water level and
discharge were two important hydrological
parameters that were used as the boundary conditions to investigate the erosion and deposition
process. Variation of velocity, erosion and
deposition, sediment transport and bed level
changes of the Jamuna River were studied using
this modeling suite. The frequency of
erosion/deposition and shifting of the riverbank
were predicted for two consecutive years (2011-
2012). Comparisons were made between the
simulated results of Delft3D with the results
obtained from the Mike 21. Shifting of channels
were observed, as erosion and deposition took place simultaneously along the channel bed and
bank line. The knowledge regarding the shifting
direction and magnitude of shifting generated from
the analysis developed herein could be useful in the
future projection of planform changes of braided
rivers around the world that are similar to the
Jamuna river.
Keywords: Morphology; Bangladesh; Jamuna River; Delft 3D; Channel shifting.
1. Introduction
Quantification and prediction of the sediment dynamics and the possible changes on riverbed morphology is one of the
most challenging tasks in river management. In alluvial channels or streams, bed aggradation evolves primarily from the
passage of flood events. It creates a variety of problems such as the rising of riverbeds and increasing flood heights,
meandering and overflows along the banks, choking chocking up of navigation and irrigation canals and depletion of the
capacity of storage reservoir (Hossain, 1997). A stream channel at grade provides the impulsion to carry the supplied
sediment load to maintain a stable bed elevation (Mackin, 1948). Aggradation occurs in a river if the amount of sediment
coming into a given reach of a stream is greater than the amount of sediment going out of the reach. Part of the sediment
load must be deposited and hence, the bed level must rise (Ranga Raju, 1980). Alves and Cardoso (1999) investigated the
effect of overloading on bed forms, resistance to flow, sediment transport rate and average bed profile of aggrading by
overload. Aggradation and degradation phenomenon of alluvial channels beds are also reported by several researchers.
(Jain, 1981; Jaramillo, 1983).
Bangladesh is a riverine country with hundreds of rivers overlaying its landscape. Major portion of Bangladesh is
formed with heavily charged sediment from the river Ganges, the Jamuna and the Meghna and their distributaries and
tributaries. These rivers experience complicated variations of erosion and deposition over time and space due to
instantaneous changes of flow and sedimentation. The Jamuna river originates from Himalayas as the Brahmaputra,
consisting a network of interlacing channels, with numerous sandbars or chars. Some of these chars are often deposited
and destroyed continually, depending upon the sediment-carrying capacity of the flow (Baki et al., 2012). Many poor
people reside in char areas where agriculture is the mainstay of their livelihood. Bank erosion of the river strongly
depends on monsoonal peak discharge, leads bank retreat to hundreds of meters annually causing destruction of the river

International Journal of Engineering, Construction and Computing, ISSN: 2209-332X(Print)
Page | 73
www.gcstmr.com.au
and to public infrastructure (Mosselman, 2006; Mount et al., 2013). Therefore, it is crucial to understand the river’s
dynamic behaviour to mitigate such sufferings.
The Bangabandhu Bridge is a very important hydraulic structure to connect the east and west parts of Bangladesh over the
Jamuna River. Apart from movement of cargo and passenger streams, it promotes conveyance of electricity and natural
gas, and telecommunication links (Jenkins & Shukla, 1997). However, due to construction of the bridge, the hydraulic
environment of the nearby area of the bridge has undergone a severe change (Mohammad et al., 2010). Hence, the
existing hydraulic conditions in the vicinity of the bridge, as well as hydro-morphological forecasts of the river at the
critical locations within the bridge surrounding area are essential.
Several modelling studies have been conducted to understand the different behaviours of the various types of rivers in
Bangladesh, as well as over the world (Jagers, 2003; Kuehl et al., 1989; Goodbred and Kuehl, 2000b). In Bangladesh,
Institute of Water Modelling (IWM) created a mathematical model using Mike 21C to evaluate the hydrodynamics and
sediment transport to20 km upstream and 10 km downstream from Bangabandhu Bridge (IWM, 2011). Most of these
models, including Mike 21C, are very expensive and some are very time consuming. On the other hand, Delft3D flow
(FLOW), morphology (MOR) and wave (WAVE) modules are available as an open source and has proven its capabilities
on many places around the world (Wang et al., 2014). It is a powerful tool for understanding and forecasting river
morpho-dynamic behaviour asit takes into account the most relevant factors involved in this process and gives a broad
range of results, presented in an accessible manner. Though many studies have been conducted on sediment dynamics and
morphology, very little studies have been carried out to investigate the planform change of the rivers of Bangladesh by
using the Delft3D model. Delft 3D has been widely applied in coastal, river and estuarine areas for simulation (Van der
Wegen, & Roelvink, 2008; Crosato et al., 2011; Crosato et al., 2012). Jagers (2003) carried out two-dimensional depth-
averaged morphological simulation of sharp bends to improve the understanding of the physical process of a river. In
order to understand the trends and migration patterns, a 3D model Delft3D was used for simulating the hydrodynamic and
morphological processes in this study.
2. Methodology
2.1 Water level and bed level calculation
The water level data were recorded at 3 hour intervals using the water level gauges by Institute of Water Modeling
(IWM), in 2010 and 2011. These gauges have been fixed to the PWD datum from the benchmark (BM) by direct fly
levelling. A Digital echo sounder, fitted with a DGPS, Laptop computer and HydroPro survey software was used to
survey the water part of the river.
2.1 Numerical Model Description
Hydrodynamic and Morpho-dynamics modules are considered to be coupled in Delft3D model, in which the flow field
adjusts in real time as the bed topography changes (Edmonds & Slingerland, 2007). Conservations of momentum is
followed in Delft3D model by applying equations 1 and 2 in the x and y directions, respectively.
𝜕𝑈
𝜕𝑡+ 𝑈
𝜕𝑈
𝜕𝑥+ 𝑉
𝜕𝑈
𝜕𝑦+
𝜔
𝐻
𝜕𝑈
𝜕𝜎− 𝑓𝑉 = −
1
𝜌0𝑃𝑥 + 𝐹𝑥 + 𝑀𝑥 +
1
𝐻2
𝜕
𝜕𝜎 (𝑣𝑉
𝜕𝑢
𝜕𝜎) (1)
𝜕𝑉
𝜕𝑡+ 𝑈
𝜕𝑉
𝜕𝑥+ 𝑉
𝜕𝑉
𝜕𝑦+
𝜔
𝐻
𝜕𝑉
𝜕𝜎− 𝑓𝑈 = −
1
𝜌0𝑃𝑦 + 𝐹𝑦 + 𝑀𝑦 +
1
𝐻2
𝜕
𝜕𝜎 (𝑣𝑉
𝜕𝑣
𝜕𝜎) (2)
Here, U and V defines the velocity components in the x and y directions, respectively, 𝑣𝑉 is the vertical velocity, ω is the
settling velocity, f is the Coriolis force, 𝑃 is the barotropic pressure gradients for water of specific density, 𝜌0 is the
atmospheric pressure, 𝐹 denotes the horizontal friction (Reynold’s stress). Lastly, 𝑀 represents the discharge or
withdrawal of momentum due to the external sources like discharge of water and wave stresses.
The depth-average continuity equation is maintained in the model by Equation 3 (Lesser et al., 2004). The model in this
study is calibrated for a single layer.
𝜕𝜁
𝜕𝑡+
𝜕[𝐻𝑈]
𝜕𝑥+
𝜕[𝐻𝑉]
𝜕𝑦= 𝑆 (3)

International Journal of Engineering, Construction and Computing, ISSN: 2209-332X(Print)
Page | 74
www.gcstmr.com.au
where, contribution of the discharge of water, evaporation and precipitation per unit area is expressed by S and ζ and H
represent water level and depth, respectively.
2.2 Suspended Transport
Advection-diffusion equation (Equation 4) calculates the transport of suspended particles (Deltares, 2011). 𝜕𝑐
𝜕𝑡+
𝜕𝑈𝑐
𝜕𝑥+
𝜕𝑉𝑐
𝜕𝑦+
𝜕(𝑤− 𝑤𝑠)𝑐
𝜕𝜎−
𝜕
𝜕𝑥(𝜀𝑠,𝑥
𝜕𝑐
𝜕𝑥) −
𝜕
𝜕𝑦(𝜀𝑠,𝑦
𝜕𝑐
𝜕𝑦) −
𝜕
𝜕𝜎(𝜀𝑠,𝑧
𝜕𝑐
𝜕𝜎) = 0 (4)
Where, c is indicating depth averaged mass concentration, 𝑤𝑠 is the hindered sediment settling velocity, 𝜀𝑠,𝑥 ,
𝜀𝑠,𝑦 , and 𝜀𝑠,𝑧 are the sediment eddy diffusivities.
2.3 Bed load Transport
In this model, the Van Rijn (1984) equation was used to compute the bed load as stated in equation 5. The wave effects
were not considered in the model used in this study.
𝑆𝑏 = {0.053 √(𝑠 − 1). 𝑔. 𝐷50
3 𝐷∗−0.3𝑇2.1; 𝑓𝑜𝑟 𝑇 < 3.0
0.1 √(𝑠 − 1). 𝑔. 𝐷503 𝐷∗
−0.3𝑇1.5; 𝑓𝑜𝑟 𝑇 ≥ 3.0 (5)
where, 𝑆𝑏 is bedload transport rate (kg m-1 s-1), S is specific density (𝜌𝑠|𝜌), 𝐷50 is the median particle diameter (m), 𝐷∗ is
dimensionless particle parameter and T is dimensionless transport parameter.
2.4 Profile of the study area
The study reach was selected within two districts of Bangladesh, namely Sirajganj and Tangail, from E463400 m to
E486500 m and N680000 m to N730000 m (BTM coordinate) which approximately covers a 50 km reach of the Jamuna
River, as shown in Figure 1. The reach considered in this study consisted of an upstream boundary at 30 km upstream of
Bangabandhu Bridge and downstream boundary at 20 km downstream of the bridge.
Figure 1. Study Area on the Jamuna River
The number of locations were considered to be crucial in terms of their positions and was specially monitored during the
model simulation within the study reach. Sirajganj and Kazipara are located on the right side and Bhuapur is located on
the left side of the river at the upstream end and Chauhali is situated at the downstream end of the study reach (Figure 1).
Kazipara
Upstream
Boundary
Sirajgan
j
Bangabandhu
Bridge
Chauhali
Downstream Boundary
Subaghacha
Upstream
Boundary
Bhuapur
Har
Kazipara

International Journal of Engineering, Construction and Computing, ISSN: 2209-332X(Print)
Page | 75
www.gcstmr.com.au
Deposition (+)/Erosion(-) in meter.
2.3 Model set up
Delft3D numerical model was set up utilizing reliable and sufficient data obtained from IWM to acquire accurate results.
Three different basic set-ups for the Delft3D model were prepared in this study. Hydrological data of Jamuna River at
April 2010, December 2010 and September 2011 were used for an initial set up to run the model, hydrodynamic
calibration and validation, respectively.
2.4 Grid generation
A curvilinear grid was generated, covering the whole selected reach, extending from the upstream border near Kazipara to
the downstream border close to Chauhali by Delft3D - RGFGRID module to carry out continuous simulation for this
study. The total number of grid cells in x and y directions were 299 and 146, respectively, with dimensions of 124 m ×
171 m. Before proceeding to further development, orthogonality, aspect ratio, courant number, and grid smoothness were
checked to obtain accurate solution. The grid was locally refined to develop high grid resolution in the areas of interest
(i.e., near Sirajgonj Hardpoint, Bangabandhu Bridge) in order to attain results faster with accuracy. Surveyed bathymetric
data was collected from the Institute of Water Modeling (IWM) and interpolated for all mesh nodes to develop
bathymetry by using Delft3D – QUICKIN.
2.5 Boundary setup and Time frame
The flow grid constructed in the model area consists of two open boundaries (upstream & downstream boundaries) and
two closed boundaries (east and west bank lines). Time series discharge data created from rating curve at Bahadurabad,
located close to Kazipara, were used at the upstream inflow, while boundary and water level data from Sirajganj were
applied as downstream boundary near Chauhali. Several simulations were performed by varying time steps and courant
number spatially to check the accuracy and stability of the model. In this study, considering one-minute time step, courant
numbers were found below 20, which indicates that the model was quite stable for simulation (Deltares, 2011).
Figure 2. Selected cross section on the study area of the Jamuna River.
3. Results and Discussion
3.1 Simulation of the model
Initially, a bathymetry of April 2010 was taken as the base for simulation as shown in Figure 2. Simulated bathymetries at
selected cross-sections 1, 2, 3 and 4 in December 2010 have been compared to that of observed bathymetries. The model
Sec 1
Sec 2
Sec 3
Sec 4
Permanent Char
C-1
C-2
C-3
B-1
Sirajganj Hard Point
Bhuapur Hard
Point
Permanent Char
C-5
B-5
C-4
C-6
Sec 1
Sec 2
Sec 3
Sec 4
Permanent Char
C-3
C-2 C-1
B-1
Sirajganj Hard
Point
C-4
Permanent Char
Bhuapur Hard
Point
C-5
B-5
C-6
East Guide
Bund
West Guide
Bund

International Journal of Engineering, Construction and Computing, ISSN: 2209-332X(Print)
Page | 76
www.gcstmr.com.au
was then simulated for predicting the hydraulic and morphologic responses of the river in the years 2011 and 2012. In the
case of morphological simulation, bed levels were computed by upgrading the height of the bed at each time step.
Additional features like morphological switch, morphological delay, and morphological time scale factor was included to
increase the flexibility.
3.2 Model Calibration and Validation
Roughness and eddy viscosity were the parameters used as a trial to achieve a suitable match with the observed field
condition. Manning’s roughness coefficient was adjusted with the varying water depth, n = 0.014, when water depth was
lower than 6 m and n = 0.025, when water depth was higher than 6 m. The value of eddy viscosity was considered 1.
(a) (b)
Figure 3. Simulated and measured water levels of Jamuna River for (a) calibration and (b) validation at Sirajganj.
For hydrodynamic calibration, simulated water level elevation was compared with the observed water level elevation at
Shirajgonj station for the period of April to July 2010 (Figure 3a). Calibration results showed that the simulated values
were within ±0.6 m of the observed value. The model was also validated at Shirajgonj station after the calibration for the
duration of April to August 2011 (Figure 3b) and showed strong agreement conforming the applicability of the model.
3.3 Sensitivity Analysis
A sensitivity analysis was performed to determine the model’s performance and how the model responded to several
parameter settings. Different parameters, mainly the eddy viscosity and Manning’s roughness coefficient, were tested for
inspecting the sensitivity of the model, which is shown in Figure 4. Different values considered for the Manning’s ‘n’
regarding char and channel were (0.1 and 0.014), (0.1 and 0.01), (0.025 and 0.014). The value of eddy viscosity taken was
1, 3 and 10 for testing the best match.
(a) (b)
Figure 4. Influence of (a) Manning parameter and (b) Eddy viscosity on amplitudes of water level
3.4 Observed and Simulated Bed Elevations
For sediment model, a comparison was made between the simulated bathymetry of December 2010 with the observed
bathymetry in December 2010. The median size of bed material was considered 0.20 mm for morphological computation.
Comparison of various sections are shown in Figure 5. Simulated bed elevations adequately matched with the measured
bed elevations.
0
4
8
12
16
03-Mar-10 12-Apr-10 22-May-10 01-Jul-10 10-Aug-10
Wate
r Le
vel (m
)
Time
Simulated Measured
0
4
8
12
16
26-Feb-11 17-Apr-11 06-Jun-11 26-Jul-11 14-Sep-11
Wate
r Le
vel (m
)
Time
Observed Simulated
0
4
8
12
16
13-Mar-10 02-May-10 21-Jun-10 10-Aug-10
Ele
va
tio
n (
mP
WD
)
Time
WL sirajganj Water Board Char_.025_Chnl_.014
Char_.1_Chnl_.014 Char_.1_Chnl_.01
0
4
8
12
16
13-Mar-10 02-May-10 21-Jun-10 10-Aug-10
Wa
ter
Le
ve
l (m
)
Time
Observed WL Sirajganj water level (m)_EV=1
water level (m)_EV=3 water level (m)_EV=10
International Journal of Engineering, Construction and Computing, ISSN: 2209-332X(Print)
Page | 77
www.gcstmr.com.au
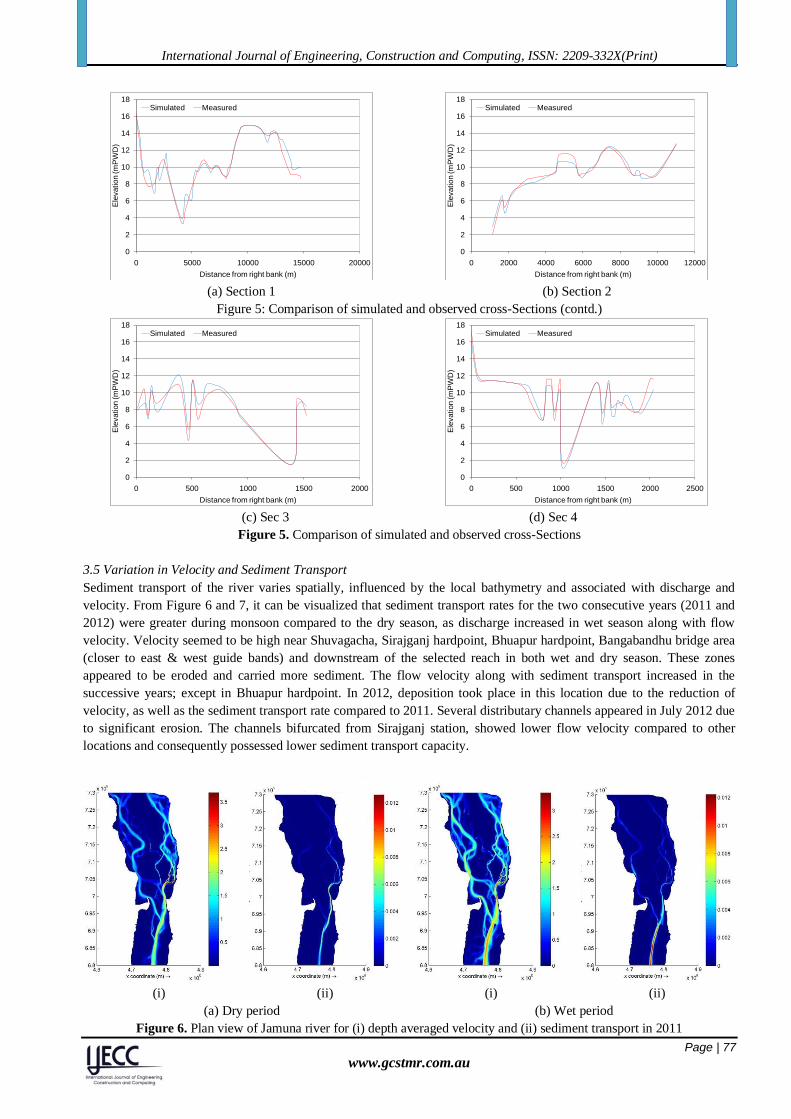
(a) Section 1 (b) Section 2
Figure 5: Comparison of simulated and observed cross-Sections (contd.)
(c) Sec 3 (d) Sec 4
Figure 5. Comparison of simulated and observed cross-Sections
3.5 Variation in Velocity and Sediment Transport
Sediment transport of the river varies spatially, influenced by the local bathymetry and associated with discharge and
velocity. From Figure 6 and 7, it can be visualized that sediment transport rates for the two consecutive years (2011 and
2012) were greater during monsoon compared to the dry season, as discharge increased in wet season along with flow
velocity. Velocity seemed to be high near Shuvagacha, Sirajganj hardpoint, Bhuapur hardpoint, Bangabandhu bridge area
(closer to east & west guide bands) and downstream of the selected reach in both wet and dry season. These zones
appeared to be eroded and carried more sediment. The flow velocity along with sediment transport increased in the
successive years; except in Bhuapur hardpoint. In 2012, deposition took place in this location due to the reduction of
velocity, as well as the sediment transport rate compared to 2011. Several distributary channels appeared in July 2012 due
to significant erosion. The channels bifurcated from Sirajganj station, showed lower flow velocity compared to other
locations and consequently possessed lower sediment transport capacity.
(i) (ii) (i) (ii)
(a) Dry period (b) Wet period
Figure 6. Plan view of Jamuna river for (i) depth averaged velocity and (ii) sediment transport in 2011
0
2
4
6
8
10
12
14
16
18
0 5000 10000 15000 20000
Ele
vation
(m
PW
D)
Distance from right bank (m)
Simulated Measured
0
2
4
6
8
10
12
14
16
18
0 2000 4000 6000 8000 10000 12000
Ele
vation
(m
PW
D)
Distance from right bank (m)
Simulated Measured
0
2
4
6
8
10
12
14
16
18
0 500 1000 1500 2000
Ele
va
tio
n (m
PW
D)
Distance from right bank (m)
Simulated Measured
0
2
4
6
8
10
12
14
16
18
0 500 1000 1500 2000 2500
Ele
va
tio
n (m
PW
D)
Distance from right bank (m)
Simulated Measured

International Journal of Engineering, Construction and Computing, ISSN: 2209-332X(Print)
Page | 78
www.gcstmr.com.au
(i) (ii) (i) (ii)
(a) Dry period (b) Wet period
Figure 7. Plan view of Jamuna river for (i) depth averaged velocity and (ii) sediment transport in 2012
3.6 Estimation of Erosion and Deposition
Cumulative erosion or deposition all over the river reach was estimated by using the Delft3D model, for two consecutive
years, i.e. 2011 and 2012. Figure 8 reveals that the three morphological years had similar types of erosion and deposition
patterns. Deposition near the char areas and development of deep channels were some of the significant morphological
features.
In section 1 (Figure 2), a char existed between channel C-1 and a branch channel, appeared from C-1 which is channel B-
1. Maximum flow and velocity passes through C-1 due to its bending nature relative to B-1. Severe erosion took place on
both of the channels. Superimposed cross-sections indicate both channels shifted westward from their bank lines and
resulted in a deeper and narrower channel, due to velocity increment in C-1 & B-1, from 2.24 m/s to 2.98 m/s and 1.2 m/s
to 2.3 m/s respectively, in September 2011 and 2012. The channels became narrower as some amount of deposition took
place in their respective bank lines (Figure 9(i)).
(i) (ii) (iii) (iv)
Figure 8. Plan view of Jamuna river for (i) Initial bed level in April 2010 and Simulated bed level in
September (ii) 2010 (iii) 2011 (iv) 2012
Section 2 was selected near Sirajganj district, where the channel was wide and shallow in April 2010.In the subsequent
years, the channel experienced severe erosions of about 5 m due to the increase of velocity from 2.38m/s to 3.77 m/s and a
shifting of erosion westwards. Also, in September 2012, erosion and deposition took place on both sides of the permanent
char due to the fluctuation of velocity (Figure 9(ii)). Overall the width of the char decreased andsome shallow and narrow
tributary channels appeared on the erosion areas.
Section 3 lies in the portion of the Bangabandhu Bridge and the channels are indicated as C-4 and C-5. Widths of both
channels reduced during the monsoon period in the year 2010 and 2011 as deposition took place on their banks due to the
International Journal of Engineering, Construction and Computing, ISSN: 2209-332X(Print)
Page | 79
www.gcstmr.com.au
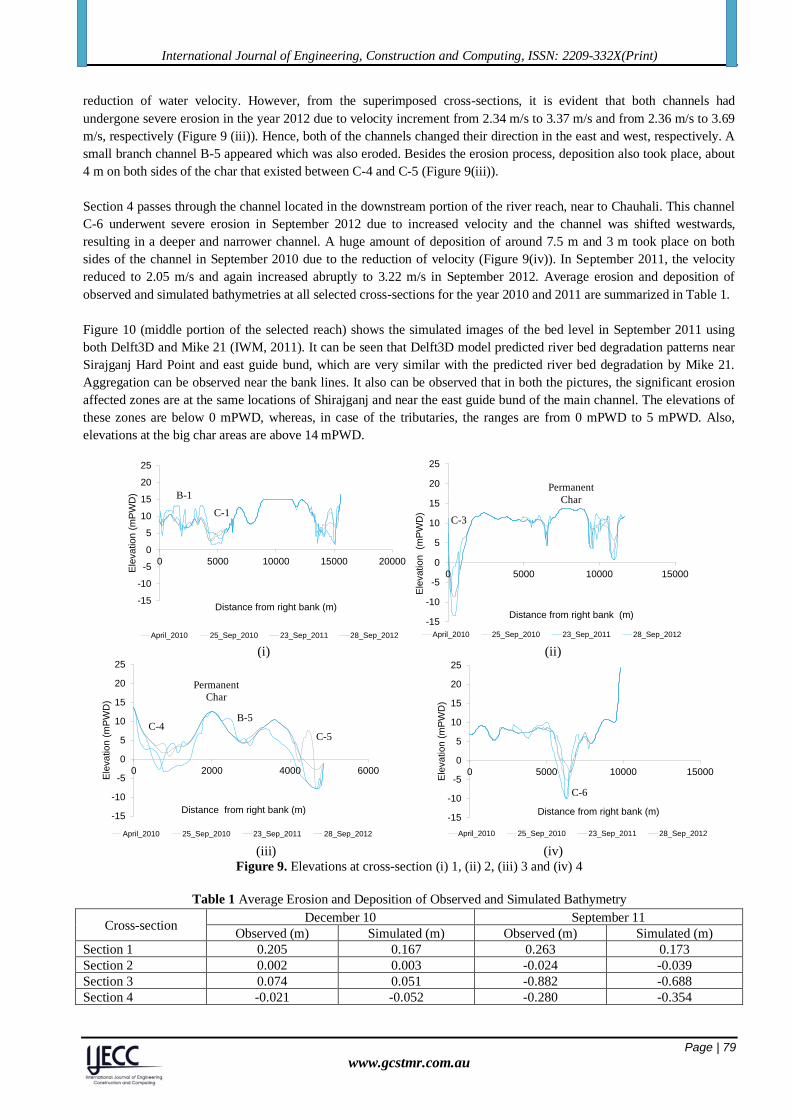
reduction of water velocity. However, from the superimposed cross-sections, it is evident that both channels had
undergone severe erosion in the year 2012 due to velocity increment from 2.34 m/s to 3.37 m/s and from 2.36 m/s to 3.69
m/s, respectively (Figure 9 (iii)). Hence, both of the channels changed their direction in the east and west, respectively. A
small branch channel B-5 appeared which was also eroded. Besides the erosion process, deposition also took place, about
4 m on both sides of the char that existed between C-4 and C-5 (Figure 9(iii)).
Section 4 passes through the channel located in the downstream portion of the river reach, near to Chauhali. This channel
C-6 underwent severe erosion in September 2012 due to increased velocity and the channel was shifted westwards,
resulting in a deeper and narrower channel. A huge amount of deposition of around 7.5 m and 3 m took place on both
sides of the channel in September 2010 due to the reduction of velocity (Figure 9(iv)). In September 2011, the velocity
reduced to 2.05 m/s and again increased abruptly to 3.22 m/s in September 2012. Average erosion and deposition of
observed and simulated bathymetries at all selected cross-sections for the year 2010 and 2011 are summarized in Table 1.
Figure 10 (middle portion of the selected reach) shows the simulated images of the bed level in September 2011 using
both Delft3D and Mike 21 (IWM, 2011). It can be seen that Delft3D model predicted river bed degradation patterns near
Sirajganj Hard Point and east guide bund, which are very similar with the predicted river bed degradation by Mike 21.
Aggregation can be observed near the bank lines. It also can be observed that in both the pictures, the significant erosion
affected zones are at the same locations of Shirajganj and near the east guide bund of the main channel. The elevations of
these zones are below 0 mPWD, whereas, in case of the tributaries, the ranges are from 0 mPWD to 5 mPWD. Also,
elevations at the big char areas are above 14 mPWD.
(i) (ii)
(iii) (iv)
Figure 9. Elevations at cross-section (i) 1, (ii) 2, (iii) 3 and (iv) 4
Table 1 Average Erosion and Deposition of Observed and Simulated Bathymetry
Cross-section December 10 September 11
Observed (m) Simulated (m) Observed (m) Simulated (m)
Section 1 0.205 0.167 0.263 0.173
Section 2 0.002 0.003 -0.024 -0.039
Section 3 0.074 0.051 -0.882 -0.688
Section 4 -0.021 -0.052 -0.280 -0.354
-15
-10
-5
0
5
10
15
20
25
0 5000 10000 15000 20000
Ele
va
tio
n (
mP
WD
)
Distance from right bank (m)
April_2010 25_Sep_2010 23_Sep_2011 28_Sep_2012
-15
-10
-5
0
5
10
15
20
25
0 5000 10000 15000
Ele
vation
(m
PW
D)
Distance from right bank (m)
April_2010 25_Sep_2010 23_Sep_2011 28_Sep_2012
-15
-10
-5
0
5
10
15
20
25
0 2000 4000 6000
Ele
va
tio
n (
mP
WD
)
Distance from right bank (m)
April_2010 25_Sep_2010 23_Sep_2011 28_Sep_2012
-15
-10
-5
0
5
10
15
20
25
0 5000 10000 15000
Ele
va
tio
n (
mP
WD
)
Distance from right bank (m)
April_2010 25_Sep_2010 23_Sep_2011 28_Sep_2012
C-6
C-5 C-4
B-5
Permanent
Char
C-3
Permanent
Char
C-1
B-1

International Journal of Engineering, Construction and Computing, ISSN: 2209-332X(Print)
Page | 80
www.gcstmr.com.au
(i) (ii)
Figure 10. Comparison of the simulated bathymetry in September 2011 by (i) Delft 3D and (ii) Mike21
4. Conclusion
The aim of this research was to determine the morphological changes of the Jamuna river using a Delft3D model.
Calibration and validation were carried out effectively against water surface elevations at Sirajganj. An attempt was made
to calibrate only the high flow data as most of the morphological activities occur during this period, and the result
obtained from the processes adequately matched with the observed values. This analysis was essential to understand the
trends of river shift, as well as to identify the zone of high risks. More materials were deposited adjacent to the char areas
which were surrounded by the channel branches. Considering the changes during the last two years, appreciable
deposition was absent, but a large amount of erosion was observed in the west channel compared to east side of the river.
Relation between the sediment transport and depth average velocity was established. A higher velocity increased the rate
of sediment transport, forms erosion and the shifting of channels. Plan form analysis revealed that the river appreciably
shifted towards the east and west directions in the consecutive years. The shifting activity of the river course, and its
successive erosion, as well as accretion processes, caused the destruction and formation of new land continuously. Also,
the simulated results by Delft3D model was compared with the results obtained from the Mike 21 model, which is a
widely used commercial coastal modelling software. The results obtained from both models showed strong agreement,
which demonstrated the strong acceptability of using Delft3D.
5. Acknowledgements
Authors are grateful to all the officials of the River Engineering Division, IWM, Bangladesh for their help and
cooperation in collecting the required data and information and also to Deltares for making Delft3D an open source
program.
6. References
Baki, A. B. M., & Gan, T. Y. (2012). Riverbank migration and island dynamics of the braided Jamuna River of the
Ganges–Brahmaputra basin using multi-temporal Landsat images. Quaternary International, 263, 148-161.
Bhuiyan, M. A., Rakib, M. A., Takashi, K., Rahman, M. J. J., & Suzuki, S. (2010). Regulation of brahmaputra-jamuna
river around jamuna bridge site, Bangladesh: geoenvironmental impacts. Journal of Water Resource and
Protection, 2(02), 123.
Crosato, A., Desta, F. B., Cornelisse, J., Schuurman, F., & Uijttewaal, W. S. (2012). Experimental and numerical findings
on the long-term evolution of migrating alternate bars in alluvial channels. Water Resources Research, 48(6).
Crosato, A., Mosselman, E., Beidmariam Desta, F., & Uijttewaal, W. S. (2011). Experimental and numerical evidence for
intrinsic nonmigrating bars in alluvial channels. Water Resources Research, 47(3).
Deltares (2011), Delft3D-FLOW User Manual: Simulation of multi-dimensional hydrodynamic flows and transport
phenomena, including sediments. Version 3.15, revision 14499. pp: 373,356.
Sirajganj
Station East Guide
Bund
International Journal of Engineering, Construction and Computing, ISSN: 2209-332X(Print)
Page | 81
www.gcstmr.com.au
Edmonds, D. A., & Slingerland, R. L. (2007). Mechanics of river mouth bar formation: Implications for the
morphodynamics of delta distributary networks. Journal of Geophysical Research: Earth Surface, 112(F2).
Goodbred Jr, S. L., & Kuehl, S. A. (2000). Enormous Ganges-Brahmaputra sediment discharge during strengthened early
Holocene monsoon. Geology, 28(12), 1083-1086.
Hossain, T. B. (1997). Study of aggradation and degradation of the Khowai River.
Hoover Mackin, J. (1948). Concept of the graded river. Geological Society of America Bulletin, 59(5), 463-512.
IWM (2011). Monitoring of Hydraulic and Morphological conditions of Jamuna River for the safety of Bangabandhu
Bridge during the year, IWM, Dhaka.
Jagers, B. (2003). Modelling planform changes of braided rivers, PhD Thesis, Universiteit Twente.
Jenkins, G. P., & Shukla, G. P. (1997). Linking east and west Bangladesh: the Jamuna Bridge project. The Canadian
Journal of Program Evaluation, 12, 121.
Jain, S. C., & Park, I. (1989). Guide for estimating riverbed degradation. Journal of Hydraulic Engineering, 115(3), 356-
366.
Jaramillo, W. F., & Jain, S. C. (1984). Aggradation and degradation of alluvial-channel beds. Journal of hydraulic
engineering, 110(8), 1072-1085.
Kuehl, S. A., Hariu, T. M., & Moore, W. S. (1989). Shelf sedimentation off the Ganges-Brahmaputra river system:
Evidence for sediment bypassing to the Bengal fan. Geology, 17(12), 1132-1135.
Lesser, G. R., Roelvink, J. V., Van Kester, J. A. T. M., & Stelling, G. S. (2004). Development and validation of a three-
dimensional morphological model. Coastal engineering, 51(8-9), 883-915.
Mount, N. J., Tate, N. J., Sarker, M. H., & Thorne, C. R. (2013). Evolutionary, multi-scale analysis of river bank line
retreat using continuous wavelet transforms: Jamuna River, Bangladesh. Geomorphology, 183, 82-95.
Mosselman, E. (2006). Bank protection and river training along the braided Brahmaputra-Jamuna River,
Bangladesh. Braided rivers: Process, deposits, ecology and management, 36, 279-287.
Rijn, L. C. V. (1984). Sediment transport, part II: suspended load transport. Journal of hydraulic engineering, 110(11),
1613-1641.
Raju, K. G. R., (1980). “Aggradation and Degradation”, Proceedings of the International Workshop on Alluvial River
Problems held at Roorkee, India, pp. 18-20.
Thorne, C. R., Russell, A. P., & Alam, M. K. (1993). Planform pattern and channel evolution of the Brahmaputra River,
Bangladesh. Geological Society, London, Special Publications, 75(1), 257-276.
Van der Wegen, M., & Roelvink, J. A. (2008). Long-term morphodynamic evolution of a tidal embayment using a two-
dimensional, process-based model. Journal of Geophysical Research: Oceans, 113(C3).
Wang, L., Zimmermann, N., Trouw, K., De Maerschalck, B., & Vanlede, J. (2014). Numerical modelling of long-term
morphology in the surf zone of the Belgian coast. Coastal Engineering Proceedings, 1(34), 42.