Embed Size (px)
Citation preview
Morphological and Genetic Divergence of Hoplias microlepis
(Characiformes: Erythrinidae) in Rivers and Artificial Impoundments of
Western Ecuador
Windsor E. Aguirre1, Virginia R. Shervette2, Ronald Navarrete3, Paola Calle4, andStergiani Agorastos5
Little is known about the freshwater fishes of western Ecuador despite serious environmental threats, including thecreation of large artificial impoundments. Phenotypic and genetic divergence of populations of a large predatory fish,Hoplias microlepis, is examined in rivers and artificial impoundments of the Guayas River drainage in western Ecuador.Despite the recent formation of the impoundments (,20 years prior to the sampling), H. microlepis in these habitatsdiverged morphologically from river populations. Impoundment fish tended to have larger eyes, longer dorsal andcaudal fins, and thinner bodies than river fish. Classification rates for habitat of origin based on morphometricmeasures were relatively high (71.7–83.3%), and the magnitude of morphological divergence was substantial whencontrasted with divergence from H. malabaricus, a congener from eastern Ecuador. Frequencies of mtDNA d-loophaplotypes differed significantly among samples. Genetic divergence between river samples implies that the geneticstructure in the drainage predates the formation of the impoundments. The genetic analysis also indicates that themorphological divergence between fish in different habitat types is not likely due to shared ancestry. Genetic diversitytended to be higher in the river samples, and the percentage of private alleles was higher in the impoundmentpopulations, which is consistent with rapid population expansion from a limited number of founders in impoundments.
CONCERNS over the impacts of humans on theenvironment have a long history in biology (Leo-pold, 1949; Elton, 1958; Carson, 1962). Increases in
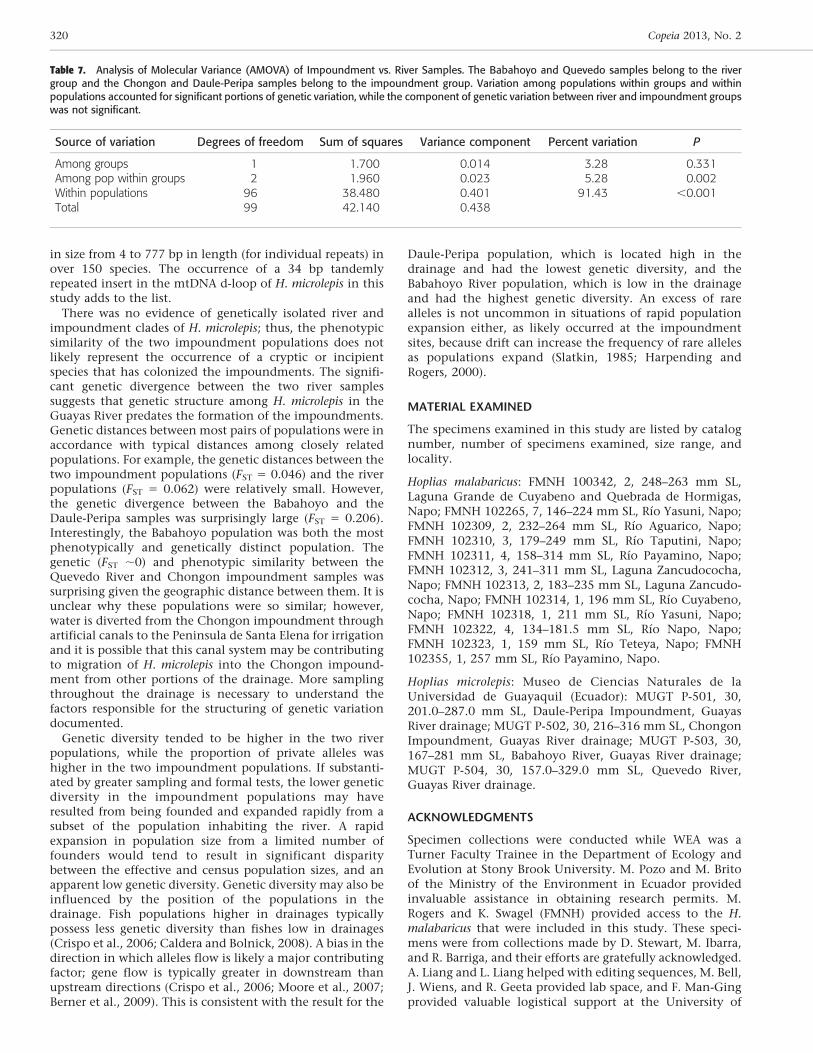
human population sizes combined with technologicaladvances have resulted in enormous impacts on ecosystemswith few portions of Earth left to their natural state(Vitousek et al., 1997). Many of the most severely impactedareas remain poorly studied. This is the case for westernEcuador, a strip of land west of the Andes Mountains innorthwestern South America (Fig. 1). Because of its relativeisolation, western Ecuador exhibits significant levels ofendemism of plants and animals, including fishes (Eigen-mann, 1921a, 1921b; Roberts, 1973; Vari, 1989; Barriga,1991; Albert and Crampton, 2003). However, this regionalso harbors the densest human populations in the country.As a consequence of human activities, the region is highlydisturbed. For example, Wilson (1988) highlighted theregion as an example of rapid deforestation because of thedevelopment of agricultural plantations. In addition, nu-merous dams and impoundments have been built, a majorform of habitat transformation that is known to have largeecological impacts (Baxter, 1977; World Commission onDams, 2000; Anderson et al., 2006).
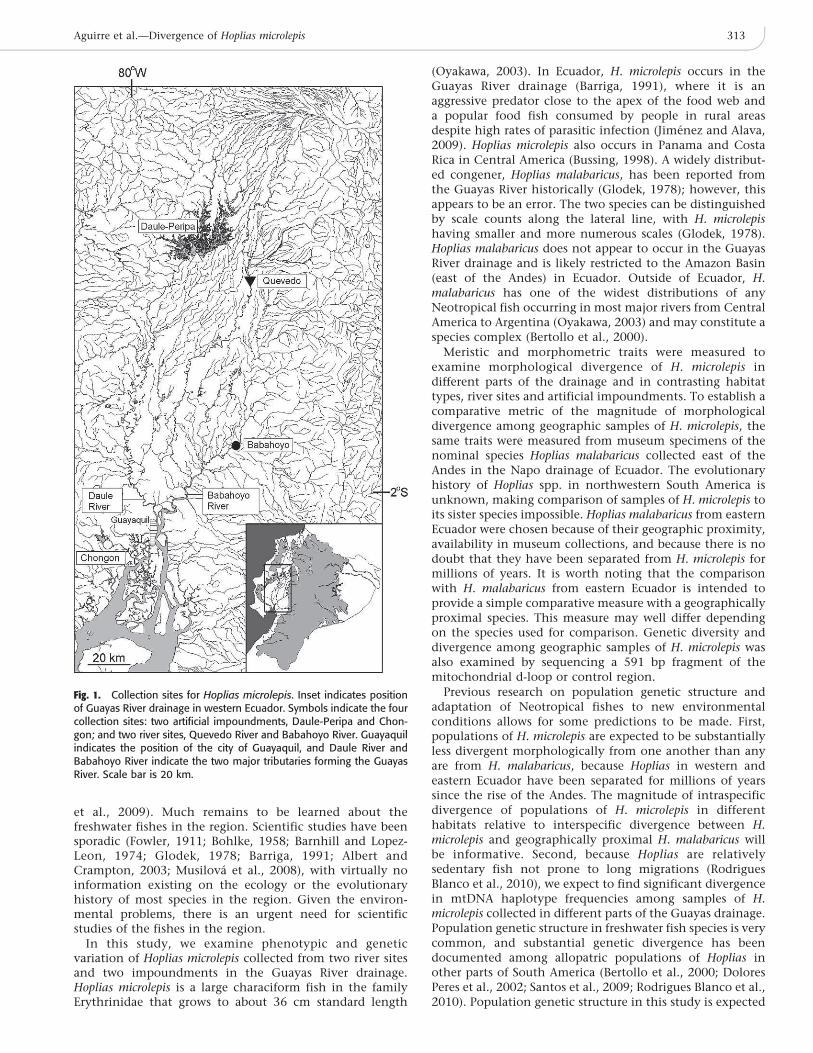
The Guayas River drainage is the largest drainage systemin western Ecuador and is representative of the region. Itdrains an area of approximately 32,214 km2 between theCoastal Mountain Range and the Andes Mountains south tothe Gulf of Guayaquil (Fig. 1). Precipitation in the regionvaries seasonally with rain falling most heavily betweenJanuary and April and relatively dry conditions occurring
the rest of the year. The drainage basin includes severalartificial impoundments resulting from the recent construc-tion of dams. Two of the more important impoundmentsare the Daule-Peripa impoundment and the Chongonimpoundment. The Daule-Peripa impoundment is thelargest lake in western Ecuador and was built in thenorthernmost part of the Guayas River drainage primarilyfor the generation of hydroelectric power. It has a surfacearea of 270 km2, contains about 5.4 billion m3 of water, andhas a maximum depth of 75.8 m. Construction of the damwas completed in 1987. The Chongon impoundment islocated in the southernmost portion of the Guayas Riverdrainage, approximately 26 km from Guayaquil. Theimpoundment is much smaller than the Daule-Peripaimpoundment and has a surface area of 25.76 km2, contains273.6 million m3 of water, and has a maximum depth of35 m. Construction of the dam ended in 1990. Its primarypurpose is to serve as a water reservoir for use in agriculturein the Peninsula of Santa Elena, a dry coastal zone to thewest of the impoundment.
The fish fauna of the Guayas drainage basin, and westernEcuador in general, is depauperate compared to othertropical freshwater systems in South America, likely becauseof the small size of most rivers. Its relative isolation alsoinhibits immigration of species from other regions into thearea. Barriga (1991) listed approximately 150 species offreshwater fishes from western Ecuador, including second-ary freshwater fishes; however, the fish fauna includes manyendemic species (Albert et al., 2011) and serves as a majorsource of protein for the inhabitants of the region (Laaz
1 Department of Biological Sciences, 2325 North Clifton Avenue, DePaul University, Chicago, Illinois 60614; E-mail: [email protected] reprint requests to this address.
2 Department of Biology and Geology, 471 University Parkway, University of South Carolina, Aiken, South Carolina 29801; E-mail:[email protected].
3 Direccion de Investigacion, Universidad Agraria del Ecuador, Guayaquil, Ecuador; E-mail: [email protected] Facultad de Ingenieria Marıtima, Ciencias Biologias Oceanicas y Recursos Naturales, Escuela Superior Politecnica del Litoral, Guayaquil,
Ecuador; E-mail: [email protected] Department of Ecology and Evolution, 650 Life Sciences Building, Stony Brook University, Stony Brook, New York 11794; E-mail:
[email protected]: 10 July 2012. Accepted: 20 November 2012. Associate Editor: D. Buth.F 2013 by the American Society of Ichthyologists and Herpetologists DOI: 10.1643/CI-12-083
Copeia 2013, No. 2, 312–323
et al., 2009). Much remains to be learned about thefreshwater fishes in the region. Scientific studies have beensporadic (Fowler, 1911; Bohlke, 1958; Barnhill and Lopez-Leon, 1974; Glodek, 1978; Barriga, 1991; Albert andCrampton, 2003; Musilova et al., 2008), with virtually noinformation existing on the ecology or the evolutionaryhistory of most species in the region. Given the environ-mental problems, there is an urgent need for scientificstudies of the fishes in the region.
In this study, we examine phenotypic and geneticvariation of Hoplias microlepis collected from two river sitesand two impoundments in the Guayas River drainage.Hoplias microlepis is a large characiform fish in the familyErythrinidae that grows to about 36 cm standard length
(Oyakawa, 2003). In Ecuador, H. microlepis occurs in theGuayas River drainage (Barriga, 1991), where it is anaggressive predator close to the apex of the food web anda popular food fish consumed by people in rural areasdespite high rates of parasitic infection (Jimenez and Alava,2009). Hoplias microlepis also occurs in Panama and CostaRica in Central America (Bussing, 1998). A widely distribut-ed congener, Hoplias malabaricus, has been reported fromthe Guayas River historically (Glodek, 1978); however, thisappears to be an error. The two species can be distinguishedby scale counts along the lateral line, with H. microlepishaving smaller and more numerous scales (Glodek, 1978).Hoplias malabaricus does not appear to occur in the GuayasRiver drainage and is likely restricted to the Amazon Basin(east of the Andes) in Ecuador. Outside of Ecuador, H.malabaricus has one of the widest distributions of anyNeotropical fish occurring in most major rivers from CentralAmerica to Argentina (Oyakawa, 2003) and may constitute aspecies complex (Bertollo et al., 2000).
Meristic and morphometric traits were measured toexamine morphological divergence of H. microlepis indifferent parts of the drainage and in contrasting habitattypes, river sites and artificial impoundments. To establish acomparative metric of the magnitude of morphologicaldivergence among geographic samples of H. microlepis, thesame traits were measured from museum specimens of thenominal species Hoplias malabaricus collected east of theAndes in the Napo drainage of Ecuador. The evolutionaryhistory of Hoplias spp. in northwestern South America isunknown, making comparison of samples of H. microlepis toits sister species impossible. Hoplias malabaricus from easternEcuador were chosen because of their geographic proximity,availability in museum collections, and because there is nodoubt that they have been separated from H. microlepis formillions of years. It is worth noting that the comparisonwith H. malabaricus from eastern Ecuador is intended toprovide a simple comparative measure with a geographicallyproximal species. This measure may well differ dependingon the species used for comparison. Genetic diversity anddivergence among geographic samples of H. microlepis wasalso examined by sequencing a 591 bp fragment of themitochondrial d-loop or control region.
Previous research on population genetic structure andadaptation of Neotropical fishes to new environmentalconditions allows for some predictions to be made. First,populations of H. microlepis are expected to be substantiallyless divergent morphologically from one another than anyare from H. malabaricus, because Hoplias in western andeastern Ecuador have been separated for millions of yearssince the rise of the Andes. The magnitude of intraspecificdivergence of populations of H. microlepis in differenthabitats relative to interspecific divergence between H.microlepis and geographically proximal H. malabaricus willbe informative. Second, because Hoplias are relativelysedentary fish not prone to long migrations (RodriguesBlanco et al., 2010), we expect to find significant divergencein mtDNA haplotype frequencies among samples of H.microlepis collected in different parts of the Guayas drainage.Population genetic structure in freshwater fish species is verycommon, and substantial genetic divergence has beendocumented among allopatric populations of Hoplias inother parts of South America (Bertollo et al., 2000; DoloresPeres et al., 2002; Santos et al., 2009; Rodrigues Blanco et al.,2010). Population genetic structure in this study is expected
Fig. 1. Collection sites for Hoplias microlepis. Inset indicates positionof Guayas River drainage in western Ecuador. Symbols indicate the fourcollection sites: two artificial impoundments, Daule-Peripa and Chon-gon; and two river sites, Quevedo River and Babahoyo River. Guayaquilindicates the position of the city of Guayaquil, and Daule River andBabahoyo River indicate the two major tributaries forming the GuayasRiver. Scale bar is 20 km.
Aguirre et al.—Divergence of Hoplias microlepis 313
to be associated with geographic distance (that is, the easewith which genes can be exchanged) and not habitat type.The latter would be suggestive of the presence of incipient orcryptic species. Third, the formation of artificial impound-ments is known to have major impacts on aquaticcommunities, and we suspect that the morphology of H.microlepis inhabiting the impoundments may be divergingfrom those inhabiting more natural river sites. This is inaccordance with several recent studies that have document-ed both morphological and genetic shifts of fish populationsin impoundments (Bessert and Ortı, 2008; Palkovacs et al.,2008; Haas et al., 2010). Although the impacts of dams onfish community structure has been relatively well docu-mented, how river fish adapt morphologically and physio-logically to life in artificial impoundments has not been wellstudied and is a major direction for future research.
MATERIALS AND METHODS
Samples and field sites.—Samples of 30 specimens of H.microlepis were purchased in July of 2008 from fishermen atfour sites in the Guayas River drainage (Fig. 1): the Daule-Peripa impoundment, the Quevedo River at the city ofQuevedo, the Chongon impoundment, and the BabahoyoRiver at the city of Babahoyo. With the exception of theQuevedo site, the purchase of the fish was pre-arranged withfishermen to ensure that the specimens were collectedlocally. The specimens from the Quevedo site were freshlycaught (not frozen or on ice) and purchased from fishermenselling the specimens on the side of the road who indicatedthat the fishes were of local origin. The four sites were chosento be broadly distributed throughout the drainage (north tosouth) and include river and artificial impoundment habitat.The specimens were deposited in the University of Guaya-quil’s Natural History Museum (MUGT). Thirty specimens persite were used in the morphological analysis and 25specimens per site were used in the genetic analysis. Thirty-one specimens of the nominal species H. malabaricus fromnortheastern Ecuador included for comparative analysis weremeasured at the Field Museum of Natural History (FMNH).The specimens were collected from different sites in the NapoRiver drainage covering a geographical area that is compara-ble to that of the Guayas River drainage.
Morphological analyses.—Five meristic traits were scored: thenumber of dorsal-fin rays, the number of anal-fin rays, thenumber of pectoral-fin rays, the number of scales along thelateral line, and the number of scales in a dorsal series fromone lateral line to the other counted posterior to the dorsalfin (Glodek, 1978). Counts were tested for significantdivergence among the four geographic samples of H.microlepis and H. malabaricus with an R 3 C test ofindependence (Sokal and Rohlf, 1995) as performed inBIOMstat 3.30o (Exeter Software, Setauket, NY; http://www.exetersoftware.com/cat/biomstat/biomstat.html). Williams’correction for the G statistic (Gw) was employed.
Twenty morphometric measures were taken along the leftside of the body with Fowler digital calipers to tenths of amillimeter, and were ln-transformed and centered (meanssubtracted) for analysis. The measures taken follow Hubbsand Lagler (2004) unless otherwise specified: standardlength (SL), head length (HL), eye length (EL), snout length(SNTL), length of upper jaw (LUJ), predorsal length (PDL),pectoral fin to pelvic fin (PCT-PLV)—origin of the pectoralfin to origin of the pelvic fin, pelvic fin to anal fin (PLV-
AF)—origin of the pelvic fin to insertion of the anal fin,length of the pectoral fin (LPCTF), length of the pelvic fin(LPLVF), length of longest dorsal ray (LLDR), length ofdorsal base (LDB), length of anal base (LAB), length oflongest anal ray (LAR), length of caudal peduncle (LCP),body depth (BD)—measured from the insertion of the firstdorsal-fin ray, depth of caudal peduncle (DCP), caudal finlength (CFL)—end of the last caudal vertebra to theposterior tip of the caudal fin along the long axis of thebody, body width (BW)—measured dorsally between theorigins of the pectoral fins, interorbital width (IOW).
A principal component analysis (PCA) was carried out inMATLAB 6.5 (MathWorks Inc., Natick, MA; http://www.mathworks.com/products/matlab/) to explore body shapevariation among the samples. Principal component analysisis an ordination technique commonly used to reduce thedimensionality of multivariate data sets by searching forpatterns of covariation among the original variables. It hasbeen routinely applied to explore patterns of morphologicalvariation in fishes (Bookstein et al., 1985). We alsoconducted a discriminant function analysis (DFA) asimplemented in SPSS 11.0.0 (IBM, Armonk, NY; http://www-01.ibm.com/software/analytics/spss/) to specificallyexamine morphological divergence between predefinedgroups. The DFA was conducted to examine morphologicaldivergence between H. microlpeis from western Ecuador andH. malabaricus from eastern Ecuador, and between H.microlepis from river and impoundment sites. To control fordifferences in size among samples, the morphometricmeasures were size corrected using Burnaby’s method(Burnaby, 1966; Rohlf and Bookstein, 1987). Principalcomponent 1 (PC1) was used as the size vector. PC1 exhibitedhigh positive correlations with all the original variables(range 5 88.88–98.49%, average 5 94.72%) and accountedfor 92.51% of the variance in the data, which is typical for sizevectors. Prior probabilities were obtained from group sizesand a leave-one-out classification was implemented. Theleave-one-out classification classifies each specimens withfunctions derived from all specimens except the one beingclassified. To examine the magnitude of morphologicaldivergence among geographic samples, pairwise Euclideanand Mahalanobis distances (Zelditch et al., 2004) betweensize-corrected sample means were calculated. The pooledwithin-group covariance matrix for the Mahalanobis distancewas calculated in NTSYSpc 2.11W (Exeter Software, Setauket,NY; http://www.exetersoftware.com/cat/ntsyspc/ntsyspc.html). A test of homogeneity of covariance matrices indicat-ed that these differed significantly among geographicsamples (X2
corr 5 1005.938, P , 0.001), so Euclidean distancesare emphasized in the results and discussion.
Genetic analyses.—Fin clips from 25 specimens per popula-tion of H. microlepis were preserved in 95% ethanol in thefield. In the lab, pectoral-fin clips were placed in a mixtureof tissue digestion buffer (10 mM Tris, pH 8.0, 100 mMNaCl, 10 mM EDTA, 0.5% SDS) and proteinase K (20 mg/ml),and incubated at 55uC overnight. The next day, the DNAwas isolated using a 25:24:1 phenol:chloroform:isoamylalcohol solution. The mixture was centrifuged (13,750 gfor 10 min) to separate the DNA, which was then washed in100% and 70% ethanol. DNA was re-suspended in 100 ml ofTE and diluted to a 1:50 working stock in water.
The mitochondrial d-loop was chosen because of its highmutation rate and because it has been commonly used to
314 Copeia 2013, No. 2
study divergence among populations. The primers used toamplify a 591 bp region of the d-loop were: PRO5-ST-F: 59—TCA CCC TTA ACT CCC AAA GC—39 and WCR3-R: 59—GAA CGC CTT GGC ATG GTG—39. The PRO5-ST-F primer isin the threonine tRNA flanking the 59 portion of the d-loopand was taken from Palumbi (1996). The WCR3-R primerwas designed in a conserved sequence block of aligned d-loop sequences from seven characiform fishes (Chalceusmacrolepidotus [NC_004700], Phenacogrammus interruptus[AB054129], Myloplus planquettei [EF601861], Pristobryconstriolatus [AF284463], Pygocentrus nattereri [DQ384770], Ser-rasalmus sp. [EF492141], and Tometes lebaili [EF601859])downloaded from GenBank.
PCR reactions were carried out in 30 ml volumes consistingof 1X PCR buffer (20 mM Tris-HCl, pH 8.4, 50 mM KCl),2 mM MgCl2, 0.25 mM dNTP (Invitrogen), 0.35 mM primers,1 unit of Taq DNA polymerase (Invitrogen), and approxi-mately 50 ng of template DNA. PCR conditions consisted ofone cycle at 95uC for 1 min 45 s, 55uC for 45 s, and 72uC for45 s; followed by four cycles of 94uC for 45 s, 55uC for 45 s,and 72uC for 45 s; then 30 cycles of 92uC for 30 s, 55uC for45 s, and 72uC for 45 s; and a final extension of 72uC for7 min. PCR products were purified using ExoSAP-IT (USBCorporation). Forward and reverse strands were sequencedon a capillary sequencer at the High-Throughput GenomicsUnit at the Department of Genome Sciences, University ofWashington. Forward and reverse sequences were aligned,checked for errors, and contigs were constructed withChromas Lite (Technelysium, Pty Ltd., South Brisbane,Queensland, Australia; http://www.technelysium.com.au/chromas_lite.html). Haplotype sequences were depositedin GenBank under the accession numbers HQ234918–HQ235017.
Sequences were aligned with ClustalW as implemented inBioEdit 7.0.9.0 (Hall, 1999) and alignments were manuallyinspected to correct alignment errors associated with thelarge indels. A maximum parsimony median jsoining treedepicting relationships among haplotypes was constructedusing Network 4.5.1.6 (Fluxus Technology Ltd., Suffolk,England; http://www.fluxus-engineering.com/sharenet.
htm). Transversions were weighted three times over transi-tions, indels were not weighted, the default ConnectionCost distance calculation method and the post-processingMP calculation were used, and epsilon values of 0 to 50 wereevaluated and a value of 50 was employed. Zero to threelarge tandemly repeating indels 34 bp in length occurred inthe sequences (see Results), resulting in four highlydivergent haplotype classes. For convenience, each of thesehaplotype classes was assumed to have a single evolutionaryorigin and not down-weighted in the Network analysis. Thisprovided a classification scheme for the haplotypes andaside from the visual display of the haplotype network, theweighting scheme for the indels does not have a majorimpact on the results because the other analyses are basedon differences in allele frequencies, not the magnitude ofthe difference between alleles. Allelic diversity (A, thenumber of alleles per population) and the effective numberof alleles (Ne, calculated as 1*(gpi
2)21, where pi is thefrequency of the ith allele) were calculated for eachpopulation (Frankham et al., 2002), as were the percentageof private alleles (the number of alleles exclusively found inthe ith sample divided by the total number of alleles in the ith
sample multiplied by 100) and haplotype diversity (H,calculated as N(1–Spi
2)*(N–1)21, where pi is the frequencyof the ith allele and N is the number of individuals in thesample). Tests of sample divergence and calculation ofgenetic distances among populations were conducted in inArlequin 3.5.1.2 (Excoffier et al., 2005). Exact tests ofpopulation divergence between pairs of geographic sampleswere carried out with values for the number of steps in theMarkov chain and the number of dememorization steps setto 100,000 and 10,000, respectively. Pairwise FST values werealso calculated. AMOVA was employed to examine thecomponents of genetic variation associated with divergenceamong individuals within sites, divergence among sites, anddivergence between impoundment and river sites.
RESULTS
Morphological divergence.—The meristic traits exhibitedvariation among the H. microlepis sampled (Table 1), but
Table 1. Counts for Hoplias microlepis and H. malabaricus. Babahoyo and Quevedo are river sites; Chongon and Daule-Peripa are impoundmentsites.
Fin counts Dorsal rays Anal rays Pectoral rays
Species Site 13 14 15 9 10 11 11 12 13 14 15 16
H. microlepis Babahoyo 4 24 2 0 29 1 0 1 6 17 6 0H. microlepis Chongon 5 25 0 0 30 0 0 1 5 9 15 0H. microlepis Quevedo 1 29 0 2 27 1 0 0 1 18 10 1H. microlepis Daule-Peripa 1 28 1 0 30 0 0 1 1 14 14 0H. malabaricus Napo 9 22 0 2 29 0 1 3 18 9 0 0
Scale counts Lateral line scalesScales in a
dorsal series
Species Site 38 39 40 41 42 43 44 45 46 9 11
H. microlepis Babahoyo 0 0 0 0 0 6 12 11 1 0 30H. microlepis Chongon 0 0 0 0 0 1 15 12 2 3 27H. microlepis Quevedo 0 0 0 0 0 4 15 8 3 0 30H. microlepis Daule-Peripa 0 0 0 0 0 2 14 12 2 1 29H. malabaricus Napo 3 18 7 3 0 0 0 0 0 31 0
Aguirre et al.—Divergence of Hoplias microlepis 315

the differences among sites were not statistically significantfor any of the meristic traits (R 3 C test of independence,P . 0.05 in all cases). Significant differences between H.microlepis and H. malabaricus were documented for three ofthe five meristic traits, pectoral fin counts, lateral line scalecounts, and transverse (dorsal) series scale counts, whichwere all greater in H. microlepis (P , 0.001 for all tests).Difference in body shape among geographic samples of H.microlepis were subtle when morphometric measures wereexamined individually, but divergence became more appar-ent under the multivariate analysis. Size (PC 1) accountedfor the vast majority of the variation in the data (92.51%) asis typically the case when analyses include specimensdiffering considerably in size (the size range of thespecimens included in this study was 134–329 mm SL).
PCs 2, 3, 4, and 5, accounted for 1.65, 1.16, 0.80, and 0.52%
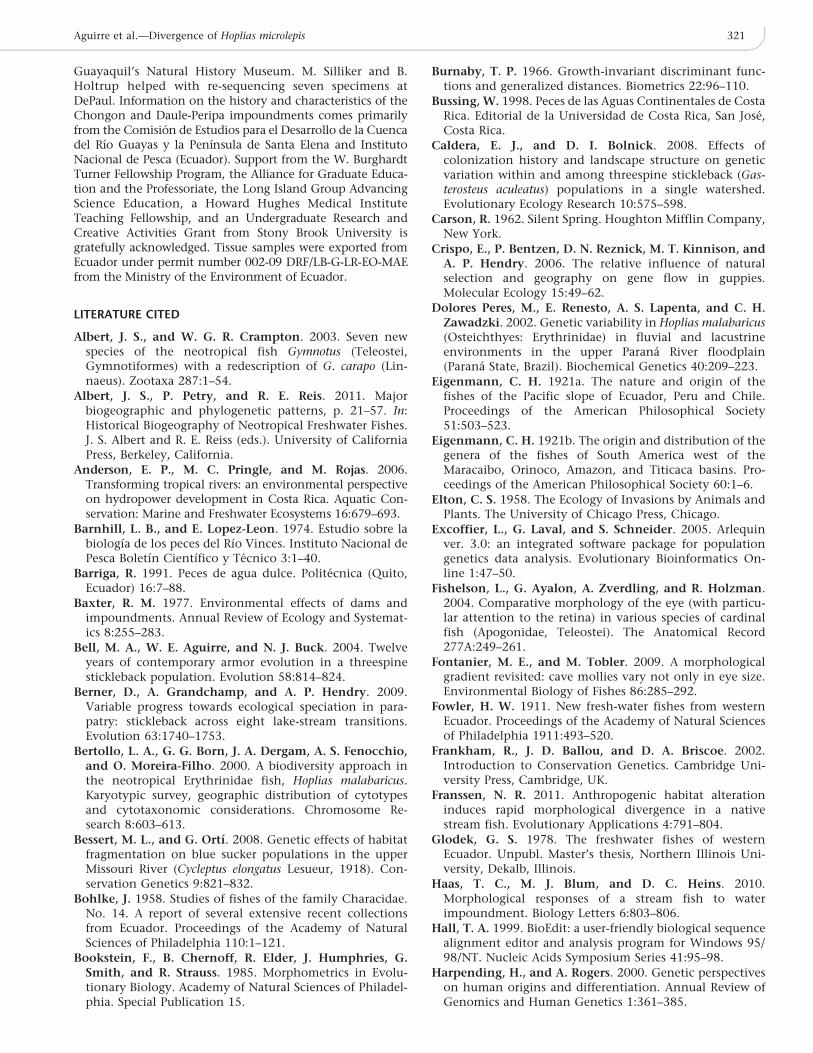
of the variance respectively, which translated to 22.0, 15.4,10.7, and 6.9% of the shape variation (total variation—variation due to size as inferred from PC 1). Because onlyPCs 2 and 3 accounted for over 1% of the original variationin the data, we restrict our analyses to these principalcomponents. Hoplias malabaricus occupied a different por-tion of the morphospace formed by PCs 2 and 3 than H.microlepis (Fig. 2A). Scores along PC2 largely overlappedwith those of H. microlepis, especially H. microlepis fromimpoundments, but H. malabaricus tended to have higherscores on PC 3. As a consequence, there was relatively littleoverlap between species. Overlap was much greater amongsamples of H. microlepis. However, samples tended tosegregate by habitat, in a direction that was diagonal to PC
Fig. 2. Morphometric analysis of samples of H. microlepis and H. malabaricus. (A) Principal component analysis (PCA) of all samples indicating thedistribution of the samples along the two major axes of body shape variation. Percentages are the amount of shape variation accounted for by eachPC. Inset shows sample means, and error bars are 95% confidence intervals of the mean. (B) Discriminant Function Analysis (DFA) of river H.microlepis, impoundment H. microlepis, and Amazonian H. malabaricus. (C) DFA of river and impoundment H. microlepis. DF2 is plotted againststandard length to highlight morphological divergence among river and impoundment H. microlepis in relation to body size.
316 Copeia 2013, No. 2
I. Most specimens from the river sites tended to have higherscores along both PCs 2 and 3 than specimens fromimpoundment sites. The means for the Babahoyo andDaule-Peripa specimens were at the extremes of the morpho-space, specimens from the Quevedo River and Chongonimpoundment sites were more intermediate.
The DFA yielded similar results, with the divergenceamong geographic samples accentuated. As was the case inthe PCA, specimens of Hoplias microlepis and H. malabaricussegregated almost completely along DF1, with only a fewspecimens overlapping (Fig. 2B). Using the leave-one-outclassification method, 97.5% of the H. microlepis and 80.6%
of the H. malabaricus were classified correctly. The threemisclassified H. microlepis were from three different sites(Babahoyo, Quevedo, and Daule-Peripa) and none werespecimens with nine scales in a dorsal series. The divergenceamong river and impoundment H. microlepis was muchstronger than was the case in the PCA and specimensexhibited little overlap along DF2 (Fig. 2C). Using the leave-one-out classification method, 71.7% of the river fish and83.3% of the impoundment fish could be classified correct-ly. The percentage of specimens that could correctly beclassified to site of origin varied between 46.7% (Quevedo)and 66.7% (Babahoyo), with an average of 59.2% (Table 2).For three of the four sites, the highest percent of misclas-sified specimens was assigned to the site from the samehabitat type. The exception was the Quevedo River sample,for which the highest percentage of misclassified specimens(26.7%) were assigned to the Chongon impoundmentsample.
A correlation analysis between the size-corrected morpho-metric variables and the discriminant function scores wasused to identify the variables most strongly associated withbody shape divergence between samples (Table 3). Themorphometric variables that were most strongly correlated(r . 0.45) with the main axis of divergence between H.malabaricus and H. microlepis (discriminant function I) wereeye length, snout length, length of upper jaw, and length ofthe pectoral fin, all smaller in H. microlepis than H.malabaricus, and pectoral fin to pelvic fin and length ofcaudal peduncle, all greater in H. microlepis than in H.malabaricus. The morphometric traits that were moststrongly associated with the axis of divergence betweenriver and impoundment H. microlepis were a different set ofvariables with the exception of eye length. Eye length,length of longest dorsal ray, and caudal fin length werelarger in impoundment fish than in river fish, while thelength of the pelvic fin to anal fin, body width, andinterorbital width were smaller in impoundment fish.
Euclidean distances (De) among size-corrected mean traitsfor geographic samples of H. microlepis indicate that theBabahoyo sample was the most phenotypically distinct(average Euclidean distance from the other sites 5 0.151)and the Quevedo sample was the least phenotypicallydistinct (average De 5 0.102) from the other samples(Table 4). Euclidean distances indicated that the impound-ment samples were a bit more similar to H. malabaricus(average De 5 0.172) than the river samples (average De 5
0.193). The two impoundment samples were also moresimilar to one another than to either of the river samples,although the De between the Chongon and Quevedosamples was very close (De for CH-DP 5 0.095, De for CH-QU 5 0.101). Finally, the phenotypic divergence betweenthe two impoundments sites and the two river sites (averageDe 5 5 0.142) was large when compared to the averagedivergence between the two river samples and the sample ofH. malabaricus (average De 5 0.193), constituting about73.6% of the latter. The overall pattern of divergence wassimilar when Mahalanobis distances were used (Table 4),except that the Quevedo sample was slightly closer to theChongon sample than the Daule-Peripa sample was (2.001vs. 2.187).
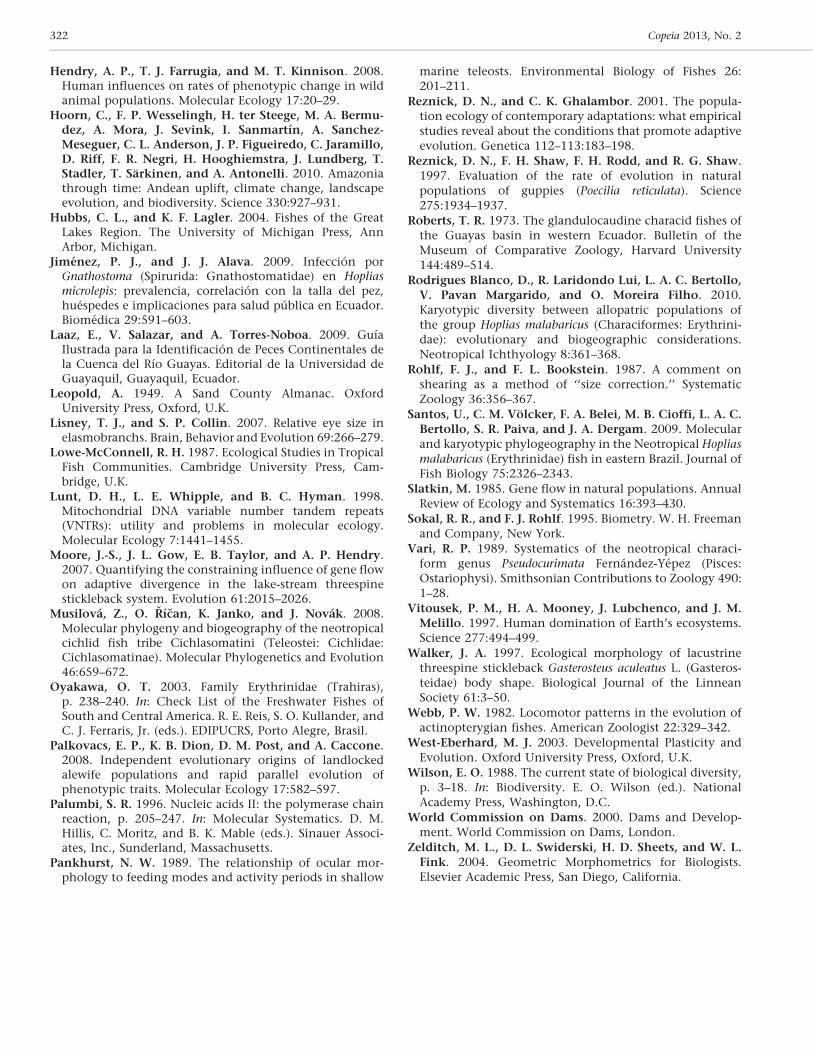
Genetic diversity and divergence.—There were 30 haplotypesamong the 100 specimens sequenced. These fell into fourclasses (A–D) based on the occurrence of a 34 bp repeatingindel (Fig. 3). The sequence of the indel was: 59–TTT ACATTA TGG TGT AAT ACA TAT TAT GTA TAA T–39 andspecimens had 0 to 3 tandemly repeated inserts in theanterior portion of the d-loop. Class A haplotypes had 0inserts, Class B had one insert, Class C had two inserts, andClass D had three inserts. Class B and C were the mostdiverse with 12 and 14 haplotypes respectively, while classesA and D included only two haplotypes each. The mostcommon haplotype, A1, was present in 37 individuals from
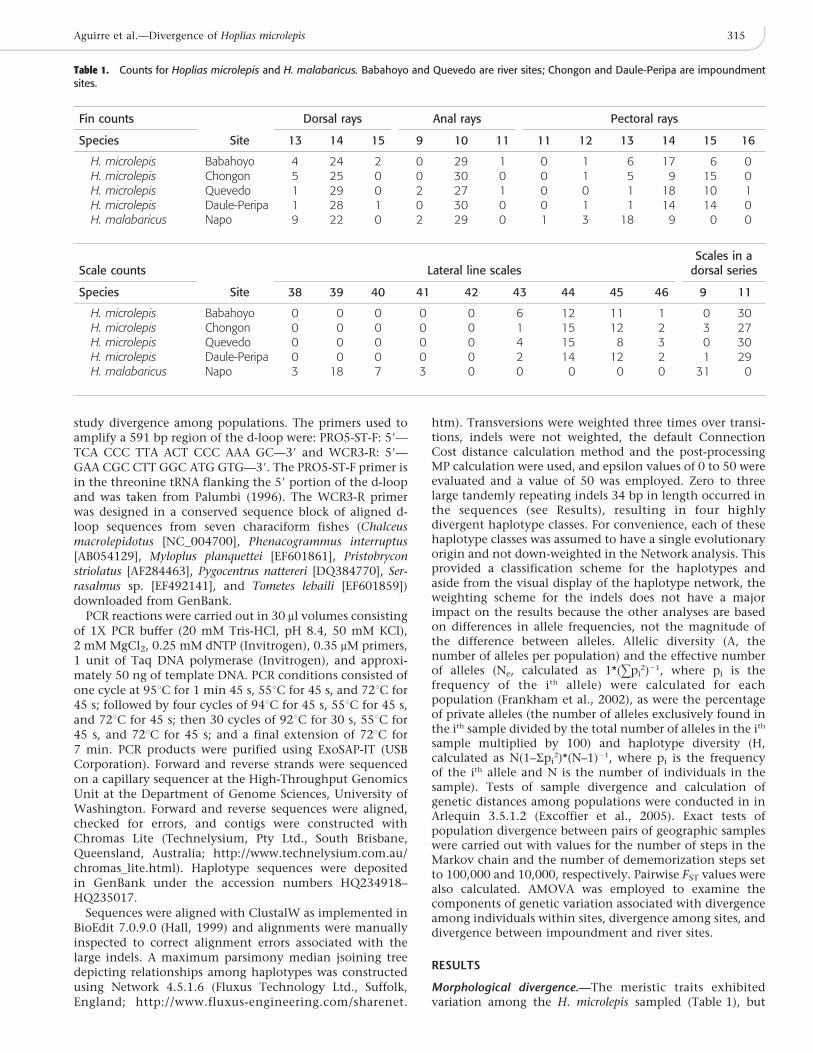
Table 3. Correlations Between Discriminant Function Scores and SizeCorrected Morphometric Variables. Discriminant Function 1 (DF1)distinguishes H. microlepis from H. malabaricus. DiscriminantFunction 2 (DF2) distinguishes H. microlepis from river andimpoundment sites. Correlations greater than 0.45 are in bold.
Variable DF1 DF2
HL 20.121 20.050EL 0.571 0.503SNTL 0.474 20.263LUJ 0.592 20.027PDL 20.400 0.026PCT-PLV 20.483 20.120PLV-AF 20.293 20.540LPCTF 0.602 0.287LPLVF 0.357 0.296LLDR 20.025 0.463LDB 20.062 0.197LAB 20.294 0.341LAR 20.252 0.292LCP 20.490 20.047BD 20.041 20.187DCP 0.251 20.339CFL 0.323 0.690BW 20.025 20.544IOW 0.158 20.491
Table 2. Discriminant Function Analysis Classification of Hopliasmicrolepis. Numbers are percentages based on the leave-one-outmethod. Bold indicates the percentage of correct classification in thesite of origin.
Site classified as:
Site of origin: Babahoyo Chongon Quevedo Daule-Peripa
Babahoyo 66.7 10.0 16.7 6.7Chongon 10.0 60.0 13.3 16.7Quevedo 13.3 26.7 46.7 13.3Daule-Peripa 6.7 23.3 6.7 63.3
Aguirre et al.—Divergence of Hoplias microlepis 317

all four sites, although it occurred in only one individualfrom the Babahoyo site (Appendix 1). Haplotype A1’saverage frequency in the other three sites was 48% with arange of 40–64%. Other haplotypes were generally rare andthe greatest proportion of haplotypes (13) occurred in singleindividuals. Besides the indels, there were 18 transitions and1 transversion.
There were differences in genetic diversity and significantgenetic divergence among samples. The river populations,Babahoyo and Quevedo, tended to be more diverse genet-ically than the impoundment populations, with the Baba-hoyo and Daule-Peripa samples again being at the extremes(Table 5). The impoundment populations had substantiallymore private alleles than the river populations. The exacttest of genetic divergence indicated that there was signifi-cant genetic divergence in haplotype frequencies betweenall pairs of populations (P , 0.001). However, the magnitudeof genetic divergence was not homogeneous. Pairwise FST
values indicated that besides being the most diverse,the Babahoyo sample was the most genetically distinct(Table 6). The average pairwise FST value between theBabahoyo population and the other three populations was
0.118, with a maximum of 0.206 between it and the Daule-Peripa population. Surprisingly, the smallest genetic dis-tance was between the Quevedo and Chongon populations(FST ,0). Consistent with the results of the exact tests ofgenetic divergence and pairwise FST values, the populationsdid not fall genetically into river and impoundment groups(AMOVA, Table 7). Most genetic variation (91.43%) oc-curred among individuals within populations and only3.28% of the genetic variation was between river andimpoundment groupings. Genetic divergence among popu-lations within habitat types accounted for 5.28% of thevariance and was significant.
DISCUSSION
Patterns of morphological divergence.—Populations of H.microlepis inhabiting rivers and artificial impoundments inthe Guayas River drainage differ significantly in morphol-ogy. The magnitude of divergence between morphometricmeans for river and impoundment populations was surpris-ingly large when H. malabaricus was included for compar-ison. Hoplias microlepis and the specimens of H. malabaricus
Table 4. Pairwise Phenotypic Distances Among Samples Calculated from Mean Size-Corrected Morphometric Measurements. Euclidean distancesare below the diagonal and Mahalanobis distances are above the diagonal.
Locations
Babahoyo Chongon Quevedo Daule-Peripa H. malabaricus
Babahoyo — 3.140 2.663 3.190 4.109Chongon 0.159 — 2.001 2.187 3.931Quevedo 0.109 0.101 — 2.377 3.882Daule-Peripa 0.185 0.095 0.122 — 3.834H. malabaricus 0.203 0.164 0.182 0.179 —
Fig. 3. Haplotype network constructed using Network 4.5.1.6. Panels A–D are close-ups of haplotype classes A–D, modified to facilitate visualization.Haplotype classes are defined based on the presence of a tandemly repeating 34 bp insert and differ by having 0, 1, 2, and 3 tandemly repeatedinserts, respectively. For convenience, each of these haplotype classes was assumed to have a single evolutionary origin, which provided a convenientclassification of haplotypes. Shading indicates haplotype frequencies in each population. The size of the circles is proportional to haplotypefrequencies. (E) Complete haplotype network.
318 Copeia 2013, No. 2

measured from eastern Ecuador have been separated since atleast ten million years ago when the Andes Mountains rosein the region (Hoorn et al., 2010). Despite this ancientdivergence, impoundment H. microlepis are ,67–74% asdistinct from river populations as the river populations arefrom H. malabaricus. The divergence between river andimpoundment H. microlepis is most likely due to phenotypicplasticity or contemporary evolution.
Phenotypic plasticity is non-genetic change in pheno-types that can arise when organisms develop under differentenvironmental conditions (West-Eberhard, 2003). Pheno-typic plasticity may be common during the early stages ofadaptation to new environmental conditions because itprovides a mechanism for organisms to respond almostinstantaneously to environmental changes, increasing thechances of survival (West-Eberhard, 2003). Phenotypicplasticity has been commonly documented in fishes andmay well be the cause of the differences observed betweenriver and impoundment fish.
Contemporary evolution is change in allele frequenciesoccurring over measurable time scales (a few hundred yearsor less). Although the artificial impoundments in theGuayas River system are relatively new (,20 years old priorto sampling), contemporary evolution of species on similartime scales is not uncommon. Documented examplesinclude the evolution of multiple traits in guppies inresponse to an experimental transplantation to a newpredation regime (Reznick et al., 1997), and the evolutionof lateral (armor) plates in oceanic stickleback after coloniz-ing a small Alaskan lake (Bell et al., 2004), among others(Reznick and Ghalambor, 2001; Hendry et al., 2008). Inaddition, a recent paper documented changes in geneticstructure of the blue sucker, Cycleptus elongatus, associatedwith the construction of impoundments (Bessert and Ortı,2008), and three other recent studies have documentedmorphological changes in fish species inhabiting artificialimpoundments (Palkovacs et al., 2008; Haas et al., 2010;Franssen, 2011). Future research involving common gardenexperiments or similar approaches will be necessary toconfirm whether the morphological differences document-ed in H. microlepis are genetically based or due to phenotypicplasticity. The possibility that this and other species aregenetically adapting to the novel conditions occurring in
artificial impoundments is worth exploring further givenhow common impoundments have become and howdramatically they can affect aquatic ecosystems.
The traits that were most strongly correlated with themajor axis of divergence between river and impoundmentpopulations of H. microlepis were generally a different subsetthan those correlated with the axis divergence betweenspecies (with the exception of eye length). Impoundmentpopulations thus appear to differ in a novel direction to thatdistinguishing the two species. Eye length was the onlymorphometric variable that was also strongly associatedwith divergence between H. malabaricus and H. microlepis.Eye length is greater in impoundment than in river H.microlepis and also is greater in H. malabaricus than H.microlepis. Differences in eye size are not uncommon amongclosely related fish (Fishelson et al., 2004; Fontanier andTobler, 2009), and species with relatively larger eyesgenerally have better visual sensory capabilities (Pankhurst,1989; Lisney and Collin, 2007). The larger size of the eyes inthe impoundment populations suggests selection for im-proved vision in impoundments. This could be related toreduced light availability caused by eutrophication, theavailability of less light in deeper waters or increasedturbidity at impoundment sites. Changes in the distributionof prey size between habitats (Lowe-McConnell, 1987) couldalso select for increased eye size because smaller or lessconspicuous prey would be harder to detect visually.Changes in fin lengths and body shape are often linked todivergent hydrodynamic demands (Webb, 1982; Walker,1997), and elongation of the caudal fin, the greater length ofdorsal-fin rays, and the decrease in body width andinterorbital width of impoundment fish may be a morpho-logical response to divergence in hydrodynamic demandsbetween impoundment and river habitats. More research onthe ecology and swimming performance of fish in thesehabitats is necessary to understand the significance of thedifferences observed.
Patterns of genetic divergence.—The mitochondrial d-loopdoes not code for a protein so indels (insertions/deletions) inthis region are common. Longer tandemly repeating insertshave also been reported in the mitochondrial d-loop ofanimals. Lunt et al. (1998) reported tandem repeats varying
Table 6. Pairwise FST Values Between Geographic Samples of Hoplias microlepis. Pairwise FST values are below the diagonal and P values forsignificance of pairwise FST values are above the diagonal. Negative FST values are approximately 0. * indicates P values that remain significant aftersequential Bonferroni correction.
Babahoyo Chongon Quevedo Daule-Peripa
Babahoyo — 0.00001* 0.00901* 0.00001*Chongon 0.085 — 0.66667 0.06306Quevedo 0.062 20.009 — 0.03604Daule-Peripa 0.206 0.046 0.035 —
Table 5. Genetic Diversity of Hoplias microlepis by Sampling Site. Data based on 25 specimens per site.
Sample Allelic diversity Effective number of alleles Haplotype diversity Percentage of private alleles
Babahoyo 16 10.96 0.95 31.25Chongon 11 4.92 0.83 63.64Quevedo 13 5.17 0.84 23.08Daule-Peripa 7 2.31 0.59 57.14
Aguirre et al.—Divergence of Hoplias microlepis 319
in size from 4 to 777 bp in length (for individual repeats) inover 150 species. The occurrence of a 34 bp tandemlyrepeated insert in the mtDNA d-loop of H. microlepis in thisstudy adds to the list.
There was no evidence of genetically isolated river andimpoundment clades of H. microlepis; thus, the phenotypicsimilarity of the two impoundment populations does notlikely represent the occurrence of a cryptic or incipientspecies that has colonized the impoundments. The signifi-cant genetic divergence between the two river samplessuggests that genetic structure among H. microlepis in theGuayas River predates the formation of the impoundments.Genetic distances between most pairs of populations were inaccordance with typical distances among closely relatedpopulations. For example, the genetic distances between thetwo impoundment populations (FST 5 0.046) and the riverpopulations (FST 5 0.062) were relatively small. However,the genetic divergence between the Babahoyo and theDaule-Peripa samples was surprisingly large (FST 5 0.206).Interestingly, the Babahoyo population was both the mostphenotypically and genetically distinct population. Thegenetic (FST ,0) and phenotypic similarity between theQuevedo River and Chongon impoundment samples wassurprising given the geographic distance between them. It isunclear why these populations were so similar; however,water is diverted from the Chongon impoundment throughartificial canals to the Peninsula de Santa Elena for irrigationand it is possible that this canal system may be contributingto migration of H. microlepis into the Chongon impound-ment from other portions of the drainage. More samplingthroughout the drainage is necessary to understand thefactors responsible for the structuring of genetic variationdocumented.
Genetic diversity tended to be higher in the two riverpopulations, while the proportion of private alleles washigher in the two impoundment populations. If substanti-ated by greater sampling and formal tests, the lower geneticdiversity in the impoundment populations may haveresulted from being founded and expanded rapidly from asubset of the population inhabiting the river. A rapidexpansion in population size from a limited number offounders would tend to result in significant disparitybetween the effective and census population sizes, and anapparent low genetic diversity. Genetic diversity may also beinfluenced by the position of the populations in thedrainage. Fish populations higher in drainages typicallypossess less genetic diversity than fishes low in drainages(Crispo et al., 2006; Caldera and Bolnick, 2008). A bias in thedirection in which alleles flow is likely a major contributingfactor; gene flow is typically greater in downstream thanupstream directions (Crispo et al., 2006; Moore et al., 2007;Berner et al., 2009). This is consistent with the result for the
Daule-Peripa population, which is located high in thedrainage and had the lowest genetic diversity, and theBabahoyo River population, which is low in the drainageand had the highest genetic diversity. An excess of rarealleles is not uncommon in situations of rapid populationexpansion either, as likely occurred at the impoundmentsites, because drift can increase the frequency of rare allelesas populations expand (Slatkin, 1985; Harpending andRogers, 2000).
MATERIAL EXAMINED
The specimens examined in this study are listed by catalognumber, number of specimens examined, size range, andlocality.
Hoplias malabaricus: FMNH 100342, 2, 248–263 mm SL,Laguna Grande de Cuyabeno and Quebrada de Hormigas,Napo; FMNH 102265, 7, 146–224 mm SL, Rıo Yasuni, Napo;FMNH 102309, 2, 232–264 mm SL, Rıo Aguarico, Napo;FMNH 102310, 3, 179–249 mm SL, Rıo Taputini, Napo;FMNH 102311, 4, 158–314 mm SL, Rıo Payamino, Napo;FMNH 102312, 3, 241–311 mm SL, Laguna Zancudococha,Napo; FMNH 102313, 2, 183–235 mm SL, Laguna Zancudo-cocha, Napo; FMNH 102314, 1, 196 mm SL, Rıo Cuyabeno,Napo; FMNH 102318, 1, 211 mm SL, Rıo Yasuni, Napo;FMNH 102322, 4, 134–181.5 mm SL, Rıo Napo, Napo;FMNH 102323, 1, 159 mm SL, Rıo Teteya, Napo; FMNH102355, 1, 257 mm SL, Rıo Payamino, Napo.
Hoplias microlepis: Museo de Ciencias Naturales de laUniversidad de Guayaquil (Ecuador): MUGT P-501, 30,201.0–287.0 mm SL, Daule-Peripa Impoundment, GuayasRiver drainage; MUGT P-502, 30, 216–316 mm SL, ChongonImpoundment, Guayas River drainage; MUGT P-503, 30,167–281 mm SL, Babahoyo River, Guayas River drainage;MUGT P-504, 30, 157.0–329.0 mm SL, Quevedo River,Guayas River drainage.
ACKNOWLEDGMENTS
Specimen collections were conducted while WEA was aTurner Faculty Trainee in the Department of Ecology andEvolution at Stony Brook University. M. Pozo and M. Britoof the Ministry of the Environment in Ecuador providedinvaluable assistance in obtaining research permits. M.Rogers and K. Swagel (FMNH) provided access to the H.malabaricus that were included in this study. These speci-mens were from collections made by D. Stewart, M. Ibarra,and R. Barriga, and their efforts are gratefully acknowledged.A. Liang and L. Liang helped with editing sequences, M. Bell,J. Wiens, and R. Geeta provided lab space, and F. Man-Gingprovided valuable logistical support at the University of
Table 7. Analysis of Molecular Variance (AMOVA) of Impoundment vs. River Samples. The Babahoyo and Quevedo samples belong to the rivergroup and the Chongon and Daule-Peripa samples belong to the impoundment group. Variation among populations within groups and withinpopulations accounted for significant portions of genetic variation, while the component of genetic variation between river and impoundment groupswas not significant.
Source of variation Degrees of freedom Sum of squares Variance component Percent variation P
Among groups 1 1.700 0.014 3.28 0.331Among pop within groups 2 1.960 0.023 5.28 0.002Within populations 96 38.480 0.401 91.43 ,0.001Total 99 42.140 0.438
320 Copeia 2013, No. 2
Guayaquil’s Natural History Museum. M. Silliker and B.Holtrup helped with re-sequencing seven specimens atDePaul. Information on the history and characteristics of theChongon and Daule-Peripa impoundments comes primarilyfrom the Comision de Estudios para el Desarrollo de la Cuencadel Rıo Guayas y la Penınsula de Santa Elena and InstitutoNacional de Pesca (Ecuador). Support from the W. BurghardtTurner Fellowship Program, the Alliance for Graduate Educa-tion and the Professoriate, the Long Island Group AdvancingScience Education, a Howard Hughes Medical InstituteTeaching Fellowship, and an Undergraduate Research andCreative Activities Grant from Stony Brook University isgratefully acknowledged. Tissue samples were exported fromEcuador under permit number 002-09 DRF/LB-G-LR-EO-MAEfrom the Ministry of the Environment of Ecuador.
LITERATURE CITED
Albert, J. S., and W. G. R. Crampton. 2003. Seven newspecies of the neotropical fish Gymnotus (Teleostei,Gymnotiformes) with a redescription of G. carapo (Lin-naeus). Zootaxa 287:1–54.
Albert, J. S., P. Petry, and R. E. Reis. 2011. Majorbiogeographic and phylogenetic patterns, p. 21–57. In:Historical Biogeography of Neotropical Freshwater Fishes.J. S. Albert and R. E. Reiss (eds.). University of CaliforniaPress, Berkeley, California.
Anderson, E. P., M. C. Pringle, and M. Rojas. 2006.Transforming tropical rivers: an environmental perspectiveon hydropower development in Costa Rica. Aquatic Con-servation: Marine and Freshwater Ecosystems 16:679–693.
Barnhill, L. B., and E. Lopez-Leon. 1974. Estudio sobre labiologıa de los peces del Rıo Vinces. Instituto Nacional dePesca Boletın Cientıfico y Tecnico 3:1–40.
Barriga, R. 1991. Peces de agua dulce. Politecnica (Quito,Ecuador) 16:7–88.
Baxter, R. M. 1977. Environmental effects of dams andimpoundments. Annual Review of Ecology and Systemat-ics 8:255–283.
Bell, M. A., W. E. Aguirre, and N. J. Buck. 2004. Twelveyears of contemporary armor evolution in a threespinestickleback population. Evolution 58:814–824.
Berner, D., A. Grandchamp, and A. P. Hendry. 2009.Variable progress towards ecological speciation in para-patry: stickleback across eight lake-stream transitions.Evolution 63:1740–1753.
Bertollo, L. A., G. G. Born, J. A. Dergam, A. S. Fenocchio,and O. Moreira-Filho. 2000. A biodiversity approach inthe neotropical Erythrinidae fish, Hoplias malabaricus.Karyotypic survey, geographic distribution of cytotypesand cytotaxonomic considerations. Chromosome Re-search 8:603–613.
Bessert, M. L., and G. Ortı. 2008. Genetic effects of habitatfragmentation on blue sucker populations in the upperMissouri River (Cycleptus elongatus Lesueur, 1918). Con-servation Genetics 9:821–832.
Bohlke, J. 1958. Studies of fishes of the family Characidae.No. 14. A report of several extensive recent collectionsfrom Ecuador. Proceedings of the Academy of NaturalSciences of Philadelphia 110:1–121.
Bookstein, F., B. Chernoff, R. Elder, J. Humphries, G.Smith, and R. Strauss. 1985. Morphometrics in Evolu-tionary Biology. Academy of Natural Sciences of Philadel-phia. Special Publication 15.
Burnaby, T. P. 1966. Growth-invariant discriminant func-tions and generalized distances. Biometrics 22:96–110.
Bussing, W. 1998. Peces de las Aguas Continentales de CostaRica. Editorial de la Universidad de Costa Rica, San Jose,Costa Rica.
Caldera, E. J., and D. I. Bolnick. 2008. Effects ofcolonization history and landscape structure on geneticvariation within and among threespine stickleback (Gas-terosteus aculeatus) populations in a single watershed.Evolutionary Ecology Research 10:575–598.
Carson, R. 1962. Silent Spring. Houghton Mifflin Company,New York.
Crispo, E., P. Bentzen, D. N. Reznick, M. T. Kinnison, andA. P. Hendry. 2006. The relative influence of naturalselection and geography on gene flow in guppies.Molecular Ecology 15:49–62.
Dolores Peres, M., E. Renesto, A. S. Lapenta, and C. H.Zawadzki. 2002. Genetic variability in Hoplias malabaricus(Osteichthyes: Erythrinidae) in fluvial and lacustrineenvironments in the upper Parana River floodplain(Parana State, Brazil). Biochemical Genetics 40:209–223.
Eigenmann, C. H. 1921a. The nature and origin of thefishes of the Pacific slope of Ecuador, Peru and Chile.Proceedings of the American Philosophical Society51:503–523.
Eigenmann, C. H. 1921b. The origin and distribution of thegenera of the fishes of South America west of theMaracaibo, Orinoco, Amazon, and Titicaca basins. Pro-ceedings of the American Philosophical Society 60:1–6.
Elton, C. S. 1958. The Ecology of Invasions by Animals andPlants. The University of Chicago Press, Chicago.
Excoffier, L., G. Laval, and S. Schneider. 2005. Arlequinver. 3.0: an integrated software package for populationgenetics data analysis. Evolutionary Bioinformatics On-line 1:47–50.
Fishelson, L., G. Ayalon, A. Zverdling, and R. Holzman.2004. Comparative morphology of the eye (with particu-lar attention to the retina) in various species of cardinalfish (Apogonidae, Teleostei). The Anatomical Record277A:249–261.
Fontanier, M. E., and M. Tobler. 2009. A morphologicalgradient revisited: cave mollies vary not only in eye size.Environmental Biology of Fishes 86:285–292.
Fowler, H. W. 1911. New fresh-water fishes from westernEcuador. Proceedings of the Academy of Natural Sciencesof Philadelphia 1911:493–520.
Frankham, R., J. D. Ballou, and D. A. Briscoe. 2002.Introduction to Conservation Genetics. Cambridge Uni-versity Press, Cambridge, UK.
Franssen, N. R. 2011. Anthropogenic habitat alterationinduces rapid morphological divergence in a nativestream fish. Evolutionary Applications 4:791–804.
Glodek, G. S. 1978. The freshwater fishes of westernEcuador. Unpubl. Master’s thesis, Northern Illinois Uni-versity, Dekalb, Illinois.
Haas, T. C., M. J. Blum, and D. C. Heins. 2010.Morphological responses of a stream fish to waterimpoundment. Biology Letters 6:803–806.
Hall, T. A. 1999. BioEdit: a user-friendly biological sequencealignment editor and analysis program for Windows 95/98/NT. Nucleic Acids Symposium Series 41:95–98.
Harpending, H., and A. Rogers. 2000. Genetic perspectiveson human origins and differentiation. Annual Review ofGenomics and Human Genetics 1:361–385.
Aguirre et al.—Divergence of Hoplias microlepis 321
Hendry, A. P., T. J. Farrugia, and M. T. Kinnison. 2008.Human influences on rates of phenotypic change in wildanimal populations. Molecular Ecology 17:20–29.
Hoorn, C., F. P. Wesselingh, H. ter Steege, M. A. Bermu-dez, A. Mora, J. Sevink, I. Sanmartın, A. Sanchez-Meseguer, C. L. Anderson, J. P. Figueiredo, C. Jaramillo,D. Riff, F. R. Negri, H. Hooghiemstra, J. Lundberg, T.Stadler, T. Sarkinen, and A. Antonelli. 2010. Amazoniathrough time: Andean uplift, climate change, landscapeevolution, and biodiversity. Science 330:927–931.
Hubbs, C. L., and K. F. Lagler. 2004. Fishes of the GreatLakes Region. The University of Michigan Press, AnnArbor, Michigan.
Jimenez, P. J., and J. J. Alava. 2009. Infeccion porGnathostoma (Spirurida: Gnathostomatidae) en Hopliasmicrolepis: prevalencia, correlacion con la talla del pez,huespedes e implicaciones para salud publica en Ecuador.Biomedica 29:591–603.
Laaz, E., V. Salazar, and A. Torres-Noboa. 2009. GuıaIlustrada para la Identificacion de Peces Continentales dela Cuenca del Rıo Guayas. Editorial de la Universidad deGuayaquil, Guayaquil, Ecuador.
Leopold, A. 1949. A Sand County Almanac. OxfordUniversity Press, Oxford, U.K.
Lisney, T. J., and S. P. Collin. 2007. Relative eye size inelasmobranchs. Brain, Behavior and Evolution 69:266–279.
Lowe-McConnell, R. H. 1987. Ecological Studies in TropicalFish Communities. Cambridge University Press, Cam-bridge, U.K.
Lunt, D. H., L. E. Whipple, and B. C. Hyman. 1998.Mitochondrial DNA variable number tandem repeats(VNTRs): utility and problems in molecular ecology.Molecular Ecology 7:1441–1455.
Moore, J.-S., J. L. Gow, E. B. Taylor, and A. P. Hendry.2007. Quantifying the constraining influence of gene flowon adaptive divergence in the lake-stream threespinestickleback system. Evolution 61:2015–2026.
Musilova, Z., O. Rıcan, K. Janko, and J. Novak. 2008.Molecular phylogeny and biogeography of the neotropicalcichlid fish tribe Cichlasomatini (Teleostei: Cichlidae:Cichlasomatinae). Molecular Phylogenetics and Evolution46:659–672.
Oyakawa, O. T. 2003. Family Erythrinidae (Trahiras),p. 238–240. In: Check List of the Freshwater Fishes ofSouth and Central America. R. E. Reis, S. O. Kullander, andC. J. Ferraris, Jr. (eds.). EDIPUCRS, Porto Alegre, Brasil.
Palkovacs, E. P., K. B. Dion, D. M. Post, and A. Caccone.2008. Independent evolutionary origins of landlockedalewife populations and rapid parallel evolution ofphenotypic traits. Molecular Ecology 17:582–597.
Palumbi, S. R. 1996. Nucleic acids II: the polymerase chainreaction, p. 205–247. In: Molecular Systematics. D. M.Hillis, C. Moritz, and B. K. Mable (eds.). Sinauer Associ-ates, Inc., Sunderland, Massachusetts.
Pankhurst, N. W. 1989. The relationship of ocular mor-phology to feeding modes and activity periods in shallow
marine teleosts. Environmental Biology of Fishes 26:201–211.
Reznick, D. N., and C. K. Ghalambor. 2001. The popula-tion ecology of contemporary adaptations: what empiricalstudies reveal about the conditions that promote adaptiveevolution. Genetica 112–113:183–198.
Reznick, D. N., F. H. Shaw, F. H. Rodd, and R. G. Shaw.1997. Evaluation of the rate of evolution in naturalpopulations of guppies (Poecilia reticulata). Science275:1934–1937.
Roberts, T. R. 1973. The glandulocaudine characid fishes ofthe Guayas basin in western Ecuador. Bulletin of theMuseum of Comparative Zoology, Harvard University144:489–514.
Rodrigues Blanco, D., R. Laridondo Lui, L. A. C. Bertollo,V. Pavan Margarido, and O. Moreira Filho. 2010.Karyotypic diversity between allopatric populations ofthe group Hoplias malabaricus (Characiformes: Erythrini-dae): evolutionary and biogeographic considerations.Neotropical Ichthyology 8:361–368.
Rohlf, F. J., and F. L. Bookstein. 1987. A comment onshearing as a method of ‘‘size correction.’’ SystematicZoology 36:356–367.
Santos, U., C. M. Volcker, F. A. Belei, M. B. Cioffi, L. A. C.Bertollo, S. R. Paiva, and J. A. Dergam. 2009. Molecularand karyotypic phylogeography in the Neotropical Hopliasmalabaricus (Erythrinidae) fish in eastern Brazil. Journal ofFish Biology 75:2326–2343.
Slatkin, M. 1985. Gene flow in natural populations. AnnualReview of Ecology and Systematics 16:393–430.
Sokal, R. R., and F. J. Rohlf. 1995. Biometry. W. H. Freemanand Company, New York.
Vari, R. P. 1989. Systematics of the neotropical characi-form genus Pseudocurimata Fernandez-Yepez (Pisces:Ostariophysi). Smithsonian Contributions to Zoology 490:1–28.
Vitousek, P. M., H. A. Mooney, J. Lubchenco, and J. M.Melillo. 1997. Human domination of Earth’s ecosystems.Science 277:494–499.
Walker, J. A. 1997. Ecological morphology of lacustrinethreespine stickleback Gasterosteus aculeatus L. (Gasteros-teidae) body shape. Biological Journal of the LinneanSociety 61:3–50.
Webb, P. W. 1982. Locomotor patterns in the evolution ofactinopterygian fishes. American Zoologist 22:329–342.
West-Eberhard, M. J. 2003. Developmental Plasticity andEvolution. Oxford University Press, Oxford, U.K.
Wilson, E. O. 1988. The current state of biological diversity,p. 3–18. In: Biodiversity. E. O. Wilson (ed.). NationalAcademy Press, Washington, D.C.
World Commission on Dams. 2000. Dams and Develop-ment. World Commission on Dams, London.
Zelditch, M. L., D. L. Swiderski, H. D. Sheets, and W. L.Fink. 2004. Geometric Morphometrics for Biologists.Elsevier Academic Press, San Diego, California.
322 Copeia 2013, No. 2

APPENDIX 1.MtDNA Control Region Haplotype Frequencies in Hoplias microlepis. Letters A–D depict haplotype classes varying in the number of inserts withhaplotypes A, B, C, and D having 0, 1, 2, and 3 inserts, respectively. Numbers beside the haplotype class indicate variants differing by one or morenucleotide mutations.
Haplotype Babahoyo Chongon Quevedo Daule-Peripa Total
A1 1 10 10 16 37A2 — — — 2 2B1 — 2 — — 2B2 2 — 1 — 3B3 — 1 — — 1B4 — — 1 — 1B5 3 — 2 — 5B6 5 1 2 — 8B7 — 1 — — 1B8 1 — 1 — 2B9 1 3 2 — 6B10 — — — 1 1B11 1 — — — 1B12 1 — — — 1C1 2 — — — 2C2 — — — 1 1C3 1 — 1 — 2C4 1 — — 2 3C5 — 2 — — 2C6 — — 1 — 1C7 — — — 1 1C8 1 1 1 2 5C9 1 — — — 1C10 — — 1 — 1C11 1 — — — 1C12 — 1 — — 1C13 2 — 1 — 3C14 — 1 — — 1D1 1 — 1 — 2D2 — 2 — — 2
Aguirre et al.—Divergence of Hoplias microlepis 323


![Dactylogyrids (Platyhelminthes, Hoplias …2017] Journal of Helminthology...Dactylogyrids (Platyhelminthes, Monogenoidea) from the gills of Hoplias malabaricus (Characiformes: Erythrinidae)](https://img.pdfslide.us/doc/110x75/5e3059a33a45f37d292b74eb/dactylogyrids-platyhelminthes-hoplias-2017-journal-of-helminthology-dactylogyrids.jpg)