Embed Size (px)
Citation preview

Morphological analysis of pores in directionally freeze-cast titanium foams
J.L. Fife, J.C. Li, D.C. Dunand,a) and P.W. VoorheesDepartment of Materials Science and Engineering, Northwestern University,Evanston, Illinois 60208-3108
(Received 9 July 2008; accepted 16 September 2008)
Synchrotron x-ray tomography was performed on titanium foams with aligned, elongatedpores, initially created by sintering directionally freeze-cast preforms using two differentpowder sizes. Three-dimensional reconstructions of the pore structures were analyzedmorphologically using interface shape and interface normal distributions. A smallerpowder size leads to more completely sintered titanium walls separating the dendriticpores, which in turn created a more compact distribution of pore shapes as well asstronger pore directionality parallel to the ice growth direction. The distribution of poreshapes is comparable to trabecular bone reported in the literature, indicating the foam’spotential as a bone replacement material.
I. INTRODUCTION
Metallic foams have an interesting combination ofproperties, such as high specific strength and stiffnesswhen incorporated into sandwiches and high gas perme-ability with high thermal conductivity. This makes themuseful in low-weight structural applications, filtration,battery electrodes, and acoustic damping.1 Titanium-basedfoams, in particular, also combine the advantages ofoutstanding mechanical strength with low density, highcorrosion resistance, and surface oxide biocompatibility,which make them especially promising for use in medicalimplants as a bone replacement material.2–5 Thus, it is ofgreat interest to create titanium foams that exhibit thesame aligned, elongated pore architecture as bone, whichgives it both its structural and mechanical anisotropy.
Directional freeze-casting is a method that relies ondirectional solidification to create aligned pores in cera-mics6–10 and, recently, in titanium.11 First, a liquid, usuallywater, is mixed with solid powders to make slurry. Theslurry is then subjected to directional solidification so thatthe porous structure is determined by the growth of thesolid ice crystals, rejecting the powders to the interden-dritic space. After solidification, the structure is freeze-dried, sublimating the ice out of the sample, leaving largealigned, elongated pores separated by walls of lightlybound solid powders, corresponding respectively to thedendritic and interdendritic regions. These powders arethen sintered to create dense walls separating the pores.
X-ray tomography has been used previously to visu-alize ice crystals in the fields of food science and gla-ciology.12–16 For instance, directional solidification of
ice into meat was studied using tomography, but theinformation was not used to create three-dimensional(3D) reconstructions.16 A more comprehensive studyanalyzed the microstructural evolution of snow in threedimensions, over time, while holding temperature con-stant,15 calculating porosity, specific surface area, anisot-ropy, and curvature distribution of the snow crystals.Optical and x-ray tomography have also been used tocreate reconstructions of soap foams and to study the indi-vidual cell shapes of the foam.17,18 In the field of metallicfoams, tomography has been used to study deformationand yield mechanisms during tensile and compressivetesting and for cell size and shape characterization.19–22
The present study quantitatively characterizes thestructure of porous titanium foams created by directionalfreeze-casting and sintering of titanium powders of twodifferent sizes. The calculations are performed on 3Dfoams reconstructed from two-dimensional (2D) tomog-raphy data to determine pore interconnectivity, inversesurface area per unit volume, pore volume fraction,interface shape distributions, as well as interface normaldistributions. This analysis is useful both for under-standing the structure of the metallic foam and how itcompares to bone, and for investigating the dendriticsolidification of water slurries. To our knowledge, itis the first time these characterization techniques havebeen used to study metallic foams produced usingdirectional freeze-casting.
II. EXPERIMENTAL PROCEDURE
Unalloyed titanium powder with an average particlesize of <20 mm was procured from Atlantic EquipmentEngineers (Bergenfield, NJ) and will be referred toas the coarse powder. Unalloyed titanium powderwith average particle size of 10 mm was purchased from
a)Address all correspondence to this author.e-mail: [email protected]
DOI: 10.1557/JMR.2009.0023
J. Mater. Res., Vol. 24, No. 1, Jan 2009 © 2009 Materials Research Society 117
Phelly Materials Inc. (Bergenfield, NJ) and will bereferred to as the fine powder. Titanium foam is createdfrom each of these powders using the directional freeze-casting process.
The 22 vol% Ti slurry is made by mixing 3.9 g oftitanium powder with 3 mL of vacuum degassed watercontaining 0.2 wt% agar (Eden Foods, Inc., Clinton,MI). Agar is used as a binder preventing powder col-lapse after ice removal. The slurry is then poured into acylindrical glass vessel with an inner diameter of 13 mm,a height of 38 mm, and a thickness of approximately1 mm. The vessel is placed in a freezer, with its flat,bottom surface in direct contact with a copper block,which has been cooled to 268 K. All other surfaces ofthe vessel are insulated with polystyrene foam to inducedirectional solidification of the slurry. The vessel is keptin the freezer for at least 3 h to ensure complete solidi-fication of the ice. Experimental measurement of theaverage solid–liquid interface growth velocity is 3.0 �0.2 mm/s (n = 3).
The ice in the solidified ice/titanium billet is thensublimated under a 7.4 Pa vacuum at 233 K for 24 h.This resulted in a porous titanium powder preform,which is sintered under vacuum (<5.6 � 10�6 Torr) at1273 K for 2 h and then at 1423 K for 7.75 h. Fromthe two resulting foams, one from each powder size,approximately rectangular specimens, 4 mm � 4 mm �8 mm, are cut in preparation for tomography. The speci-men is taken from the center of the billet, approximately1 cm from the top and bottom surfaces. Multiple speci-mens are cut from this area, such that the tomographyspecimen does not contain any of the billets’ originaloutside surfaces and far from the cylindrical billet sur-faces. A total of 5 � 9 = 45 contiguous 300� magnifica-tion optical micrographs are used to determine pore sizein material adjacent to the tomography samples.
The x-ray tomography is performed at the AdvancedPhoton Source (APS), at the DND-CAT 5BMC beam-line at Argonne National Laboratory (Argonne, IL). Abending magnet is used to deliver the synchrotron x-raybeam at energy of 45 keV. The x-ray image is created ona cryo-cooled charge-coupled device (CCD) camerathrough a 4� objective. A resolution of 6 mm/pixel isused, which creates a 7 mm objective. The tomographyreconstructions are then carried out on a 16-node Linuxcluster using filtered back-projection techniques. These2D images are then segmented to create binary images,and 3D reconstructions are generated and used for thequantitative measurements.
After tomography, the specimen closed porosity isdetermined by helium pycnometry. The total porosity isdetermined using the Archimedes method, which is per-formed in deionized water after coating the sample in athin layer of grease to prevent water infiltration. Fromthese two porosity values, the open porosity is calculated.
III. ANALYSIS
The inverse surface area per unit volume, Sv�1, of the
3D microstructure is used as the characteristic lengthscale. Once the reconstruction is generated, the surfacearea per unit volume, Sv, is calculated as the sum of theinterfacial surface patches divided by the total volume ofthe reconstruction. The inverse of this value is taken toprovide an average length scale of the structure (inmicrometers).Furthermore, the surface can be completely character-
ized by its two principal radii of curvature, R1 and R2.The principal curvatures, k1 and k2, are inverselyrelated to the principal radii of curvature. These princi-pal curvatures form the diagonal elements in the 2 �2 curvature tensor matrix, which has two importantinvariants: the mean and Gaussian curvatures. The meancurvature, H, is defined as half the sum of the twoprincipal curvatures:
H ¼ k1 þ k22
� �¼ 1
2
1
R1
þ 1
R2
� �: ð1Þ
The Gaussian curvature, K, is the product of the twoprincipal curvatures:
K ¼ k1k2 ¼ 1
R1R2
: ð2Þ
Both mean and Gaussian curvatures are necessary tofully define interface evolution.23 For example, a flatinterface and a saddle-shaped interface both have a meancurvature of zero but differ in Gaussian curvatures.Thus, once the 3D reconstructions are created, the meanand Gaussian curvatures are calculated using the mixedfinite element/finite volume method established byGuillaume et al.24 Then, k1 and k2 are calculated fromEqs. (3) and (4) as
k1 ¼ H �ffiffiffiffiffiffiffiffiffiffiffiffiffiffiffiH2 � K
p: ð3Þ
k2 ¼ H þffiffiffiffiffiffiffiffiffiffiffiffiffiffiffiH2 � K
p: ð4Þ
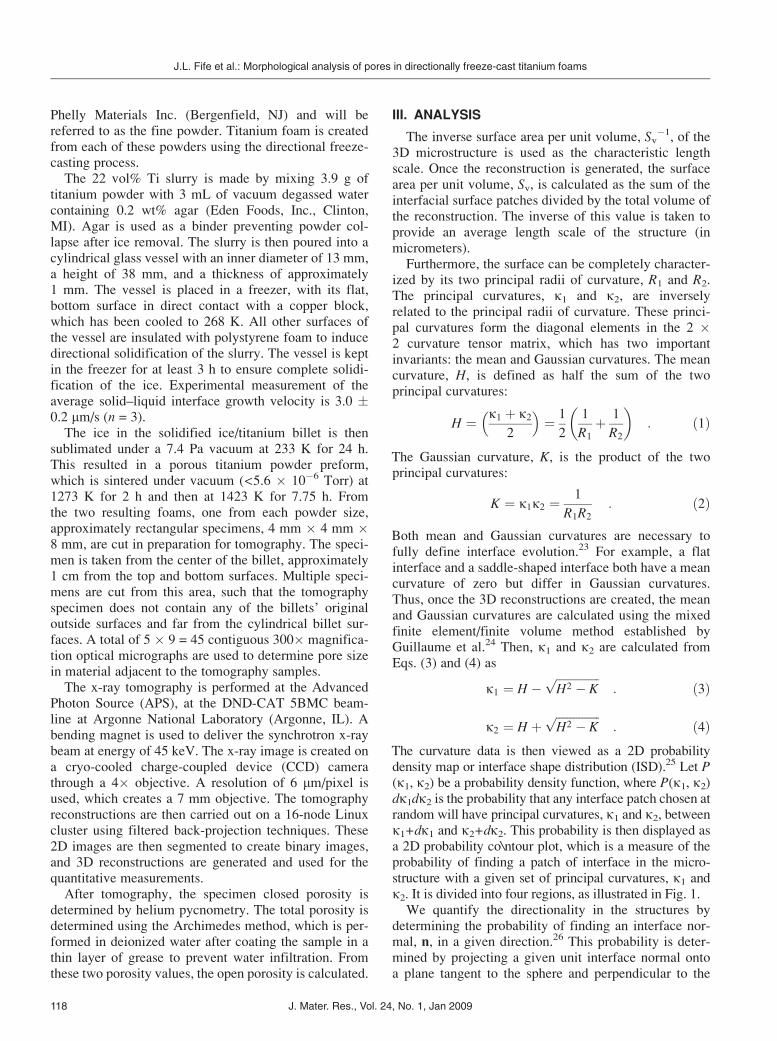
The curvature data is then viewed as a 2D probabilitydensity map or interface shape distribution (ISD).25 Let P(k1, k2) be a probability density function, where P(k1, k2)dk1dk2 is the probability that any interface patch chosen atrandom will have principal curvatures, k1 and k2, betweenk1+dk1 and k2+dk2. This probability is then displayed asa 2D probability co\ntour plot, which is a measure of theprobability of finding a patch of interface in the micro-structure with a given set of principal curvatures, k1 andk2. It is divided into four regions, as illustrated in Fig. 1.We quantify the directionality in the structures by
determining the probability of finding an interface nor-mal, n, in a given direction.26 This probability is deter-mined by projecting a given unit interface normal ontoa plane tangent to the sphere and perpendicular to the
J.L. Fife et al.: Morphological analysis of pores in directionally freeze-cast titanium foams
J. Mater. Res., Vol. 24, No. 1, Jan 2009118
projection axis. The normals originate in the center of thesphere and end on the surface of the sphere. The data isbinned prior to the projection, which removes potentialartifacts from binning after the projection is complete, asis typical of 2D polar plots. Thus, each bin encompassesthe same 3D area of the sphere, and as a result, a contourplot of the probability distributions of interface normalorientations is created.26
Because experimental data is most often asymmetric,there are two views generated: a near-hemisphere and afar-hemisphere. The near-hemisphere view represents thenormals along the positive axis, and the far-hemisphereview represents the normals along the negative axis withthe center of the sphere at the origin. The two plots shouldappear qualitatively similar with the peak probabilitycontained on one of the two plots. The peak locationindicates the hemisphere that should be used to representthe structure, regardless of the direction of the projection.
There are also two types of projections used in inter-face normal distributions (INDs): equal-area and stereo-graphic. Equal-area projections enhance features nearthe center of the plot, while stereographic projectionsenhance features at the edges of the plot. In this work,stereographic projections are used.
IV. RESULTS AND DISCUSSION
Figure 2 shows optical micrographs of polished crosssections of the two samples. Surfaces parallel to thefreezing direction clearly show aligned, elongated pores,resulting from the growth of ice dendrites during thedirectional freeze-casting process. These will be referred
to as macropores. Surfaces perpendicular to the freezingdirection indicate that the ice dendrites grow as plates,not as needles, as expected from literature.8,27,28 Theplates show various orientations in the plane, althoughthere are small groups of parallel plates corresponding tograins, indicating there is no preferred growth orienta-tion for the ice crystals in the plane perpendicular to themain ice growth direction that is visible in two dimen-sions. Because the pores are planar, there is one dimen-sion in which the pores are much smaller, and thisdimension is used for the pore width measurements.
Visual comparison of the micrographs for the twofoams with two different powder sizes shows that whilethere is variation within each image, the foam madefrom the fine powders seems to have narrower macro-pores. Measurements on cross sections reveal thatthe fine- and coarse-powder foams have pore widths ofapproximately 50 and 61 mm, respectively. In addition tothe macropores caused by the ice dendrites, microporesare visible in the titanium walls in all four images. Thesemicropores are due to incomplete sintering between theindividual titanium powders. In addition to causingmicropores, incomplete sintering leads to surface rough-ness on the titanium walls, as illustrated in Fig. 3, whereindividual titanium powders are clearly visible. The insetof Fig. 3 shows necks between two adjacent titaniumpowders, a clear indication of incomplete sintering.
Helium pycnometry measurements reveal both sam-ples have zero closed porosity to within the large experi-mental error due to the small sample size: 3.2 � 5.5%and 1.6 � 6.0%, for the fine- and coarse-powder billets,respectively. The total porosities, measured by theArchimedes method, for the fine- and coarse-powderbillets are 41.4 � 0.8% and 44.6 � 0.6%, respectively,and are assumed to be fully open.
Figure 4 shows the 3D reconstructions of the twofoams. It is apparent that the reconstructed cross sectionsvisible in Fig. 4 are generally similar to the experimental2D optical micrographs of cross sections shown in Fig. 2.However, while the dendritic macropores are well cap-tured by the reconstruction, the micropores are poorlyrepresented; this is expected because the spatial resolutionof the structure is 6 mm/pixel. Ideally, any feature shouldbe represented by no less than five pixels; thus, featuressuch as the micropores that are less than 30 mm are poorlyor not at all resolved. From Figs. 2 and 3, it is clear thatthe micropores in each foam are on the order of the initialtitanium powder sizes, and thus either too small to bereconstructed, or on the same order of the resolution, sothat they are represented in the reconstruction, but likelynot accurately. Nevertheless, these reconstructions are, toour knowledge, the first rendering of directionally freeze-cast foam structures in three dimensions and provide newinsights into the structure of the highly anisotropic macro-pores produced by the ice dendrites.
FIG. 1. Map of the local interface shapes possible in an interface
shape distribution.25 In this case, solid represents the pores and liquid
represents the titanium.
J.L. Fife et al.: Morphological analysis of pores in directionally freeze-cast titanium foams
J. Mater. Res., Vol. 24, No. 1, Jan 2009 119

From these reconstructions, the inverse surface areaper unit volume is calculated as Sv
�1 = 48 mm for thefoam created with the fine powder, and Sv
�1 = 42 mm forthe coarse-powder foam. For comparison, image analysisof transverse cross sections resulted in pore widths of 50and 61 mm, respectively, for the two foams. While bothmeasurement methods are relevant to the size of thedendritic macropores, they should be interpreted differ-ently. The image analysis technique is a 2D measure, soit is an accurate measure of pore widths perpendicular tothe section plane. Because Sv
�1 is a 3D measure, it betterrepresents the average size scale of all the features pre-sent in the foams. Also, the image analyses are per-formed on a section of the billet adjacent to the volumeused for tomography at a shared surface, not on thetomography samples themselves. It has been previouslyshown that in these directionally freeze-cast titanium
structures, pore width varies with distance from the heatsink.11 Finally, Fig. 2 shows that pore width can alsovary at the same distance from the heat sink.The pore volume fractions differ significantly be-
tween the Archimedes and reconstruction measurements:41.4% and 52% for the fine-powder foams and 44.6%and 63% for the coarse-powder foams. It is likely thatthis discrepancy is due to the resolution problem dis-cussed earlier. It might also be due to varying porevolume fractions within the samples. Archimedes datais taken on a larger portion of the billet, so this value is amore accurate measure because it averages local varia-tions. The 3D reconstructions are confined to a smallervolume—a volume of approximately 8 mm3 is recon-structed here—compared to the billet’s 62 mm3 volume;therefore, it cannot provide the same averaging of data.Furthermore, the long dimensions of the macropores are
FIG. 2. Optical micrographs of titanium foams: (a, b) for fine powders (c, d) for coarse powders. Cross sections are parallel (a and c) and
perpendicular (b and d) to the main temperature gradient direction.
J.L. Fife et al.: Morphological analysis of pores in directionally freeze-cast titanium foams
J. Mater. Res., Vol. 24, No. 1, Jan 2009120

likely greater than the size of the tomography sectionleading to further inaccuracies.
The interconnectivity for the pore structures is alsocalculated and found to be 99.93% for both foams. Thisindicates that nearly all of the porosity within the recon-structed volumes is open porosity, in agreement with thepycnometric results.
Figures 5(a) and 5(b) show the ISDs for the two foamsin this study. Two important features of the ISDs are thecolor bar and the axes of the plot. First, the minimumand maximum values of the color bar are fixed so thatany differences in peak probability are clearly visible.Second, the principal curvatures shown on the axes arescaled by the characteristic length, Sv, to eliminateeffects caused by a difference in the length scale due tovarying powder sizes and pore volume fractions.
Two general observations can be drawn from theseISDs. First, the distributions, in both cases, are broadrelative to Sv, which indicates a significant variation inthe sizes of the pores in the structure. This can beexplained by the fact that there are two different lengthscales in the foams: one corresponds to the dendritic,platelike macropores and the other corresponding to theequiaxed, closed micropores. Because the size scale ofthese micropores is on the same order as the resolutionof the images, it most likely corresponds to the regionsof small probability (purple) in both ISDs. Simplybecause of the small size scale of the micropores, andlack of spatial resolution used in the x-ray tomographytechnique, curvatures of |k/Sv| > 2 are probably notadequately reconstructed and therefore an estimate atbest. Second, both ISDs reside predominantly in regions2 and 3, which encompass saddle-shaped or hyperbolic
interfaces. This corresponds directly with the roughnessof the titanium walls caused from partially sintered indi-vidual powders. Almost all the surface patches have atleast one negative principal curvature, k1, which is aresult of the fact that over 75% of the surface patcheshave negative Gaussian curvature. This measure is com-parable to what has been previously observed by Jinnaiet al.29,30 for trabecular bone microarchitecture, indicat-ing that the processing technique used here could pro-vide porous metallic implants that mimic bone withrespect to distributions and percentages of curvatures inthe microstructure.
FIG. 3. SEM image of the parallel cross section of a macropore in
titanium foam created by directional freeze-casting of coarse pow-
ders. Roughness and variation in curvature of the titanium walls are
clearly visible at the scale of individual powders, and reflect the
partially sintered state of the powders. Inset: Higher magnification
SEM image showing partially sintered powder with ridges.
FIG. 4. Three-dimensional reconstructions of titanium foams: (a) for
the fine powder and (b) for the coarse powder. To highlight the pore
volumes, the titanium is transparent and the pores are displayed. The
pore volume fractions for the samples are 52% and 63% for (a) and
(b), respectively. The main ice growth direction is along the z axis.
J.L. Fife et al.: Morphological analysis of pores in directionally freeze-cast titanium foams
J. Mater. Res., Vol. 24, No. 1, Jan 2009 121

Comparing both ISDs, several observations can bemade. The fine-powder foam has a well-defined peakwhose center is located close to k1/Sv = k2/Sv = 0, indi-cating a higher probability of near-planar or flat inter-faces in the microstructure. This corresponds to theplatelike, titanium walls separating the pores producedby directional solidification. The distribution is alsosymmetrically located about the line H = 0, which is
also a defining feature of the trabecular bone mentionedpreviously30 and other bicontinuous structures.31 Thecoarse-powder foam, on the other hand, does not exhibitas strong a peak as the fine-powder foam, and the centerof its peak is located in region 3. The reason for theweaker peak is likely related to the degree of sintering.Assuming the ice dendrites grow identically with fineand coarse powders, the titanium walls between the icedendrites should initially be the same width for eachfoam. However, because this width is not much largerthan the powder size, the powder size can significantlyaffect how well the titanium packs into the interdendriticspace during solidification, with the packing of the finepowders expected to be tighter. The improved initialpacking and the increased driving force for sinteringassociated with the smaller powders then reduces themicroporosity and the wall roughness in the sinteredfoam. This is supported by Fig. 2, which shows thefine-powder foam displaying fewer micropores andsmoother, more well-defined titanium walls. By contrast,the coarse powders did not sinter as well, because oflooser initial packing and lower driving force for sinter-ing, resulting in titanium walls with more roughness andhigher microporosity. Because ISDs are local measure-ments, the roughness in the walls may hide the overallplanar structure present in the foam, resulting in apeak that is both weaker and shifted away from the lineH = 0 and from the origin (k1/Sv = k2/Sv = 0).To quantify preferential directionality in the titanium
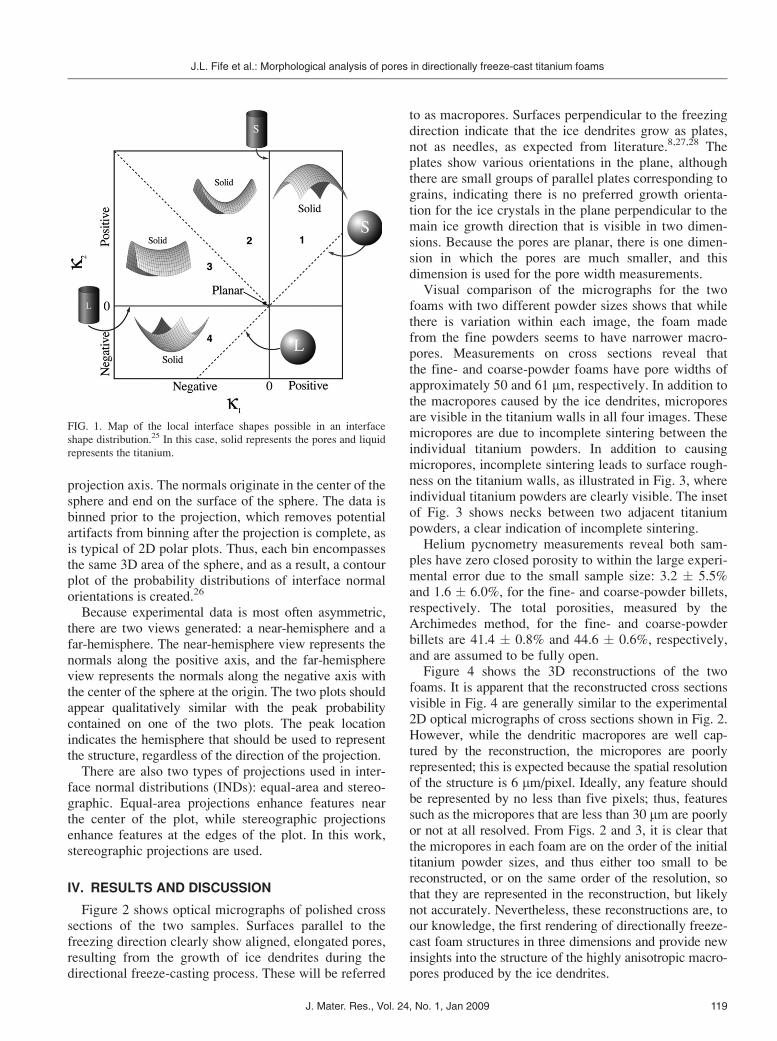
foams, we examine INDs (see Fig. 6). The near-hemisphere projection is provided for the fine-powderfoam and the far-hemisphere projection is provided forthe coarse-powder foam because the location of the indi-vidual peak values appears strongest in these projections.Because the results are qualitatively similar whetherviewing the near- or far-hemisphere projections, it isimportant to use the hemisphere that contains the peakprobability when comparing different structures. Thez axis is chosen as the projection axis because it bestdisplays the planar interfaces located in both structures.The minimum and maximum values of the color bars inthe INDs are fixed based on the strongest directionality,observed in the fine-powder foam.As a general observation, there is a significant distri-
bution of normals surrounding the circumference of bothINDs. In an ideal case, this would be representative of aperfect cylinder parallel to the projection axis, where theIND would reveal a thin stripe of equal probabilityencircling the outside of the projection. In the presentcase, it is representative of the platelike macropores par-allel to the projection axis. The normals to the interfacesof these macropores are oriented randomly in the x-yplane but are still perpendicular to the solidification di-rection, z. Thus, the spread of probabilities is related tothe imperfect alignment of the plates themselves, but the
FIG. 5. Interface shape distributions of titanium foam samples created
from: (a) a fine powder and (b) a coarse powder. (color online)
J.L. Fife et al.: Morphological analysis of pores in directionally freeze-cast titanium foams
J. Mater. Res., Vol. 24, No. 1, Jan 2009122
location of the probabilities on the circumferences of theINDs indicate interfaces parallel to, or, equivalently,normals perpendicular to the growth direction, whichresults from the directional solidification process usedto produce the samples. The two peaks located 180�
apart in the IND for the fine-powder foam correspondto the more distinct platelike macropores in the micro-structure that are apparent from general observations ofthe 2D micrographs and 3D reconstructions. The INDfor the coarse-powder foam appears more isotropic incomparison to the IND for the fine-powder foam. Thisagain can be explained by the degree of sintering in thestructure. We would expect that the same directionalsolidification technique would produce a similar degreeof anisotropy in the structure, but the wall roughnesscaused by incomplete sintering is most likely maskingthis anisotropy.
V. CONCLUSIONS
Two titanium foams, created by directional freeze-casting of two different sizes of titanium powders, wereanalyzed using synchrotron x-ray tomography to create3D reconstructions. A quantitative morphological analy-sis was performed on these reconstructions, with themain results as follows:
(1) Aligned, elongated, platelike macropores, result-ing from the removal of the directionally solidified icedendrites, are easily resolved and reconstructed in threedimensions. Equiaxed micropores within the titaniumwalls separating macropores, which are due to incom-plete sintering of the original powders, are close to theresolution of the present technique.
(2) The morphological differences of the pores in thetwo foams can be quantified by interfacial shape distri-butions (describing interfacial curvatures) and interfacenormal distributions (describing preferential directional-ity). These are useful tools in assessing variations in poreshape or orientation between the foams due to differ-ences in processing conditions, e.g., powder size. In par-ticular, it is apparent that the foams produced with thesmaller powder size show more complete sintering,resulting in reduction of the undesirable microporositywithout affecting the desirable dendritic macroporosity.
(3) Directional freeze-casting is a first step towardcreating aligned, elongated pores mimicking the ani-sotropic pore structure of bone. Despite differences be-tween this porous macrostructure and that of trabecularbone macroarchitecture, the morphology of the titaniumfoams shows similarities with bone on a local level.
ACKNOWLEDGMENTS
This research is supported by the Department ofEnergy Office of Basic Energy Science (GrantCNV0037736) and the National Science Foundation(Grant DMR0505772). J.L. Fife also gratefully acknowl-edges a National Science Foundation Graduate ResearchFellowship. Part of this work was performed at theDuPont-Northwestern-Dow Collaborative Access Team
FIG. 6. Interface normal distributions of titanium foams formed with:
(a) a fine powder and (b) a coarse powder. (color online)
J.L. Fife et al.: Morphological analysis of pores in directionally freeze-cast titanium foams
J. Mater. Res., Vol. 24, No. 1, Jan 2009 123

(DND-CAT) located at Sector 5 of the Advanced PhotonSource (APS). DND-CAT is supported by E.I. DuPont deNemours & Co., The Dow Chemical Company and theState of Illinois. Use of the APS was supported by theUnited States Department of Energy, Office of Science,Office of Basic Energy Sciences, under ContractNo. DEAC0206CH11357. The authors thank Dr. DenisT. Keane for his invaluable assistance during the x-raytomography experiments at APS.
REFERENCES
1. J. Banhart: Manufacture, characterisation and application of
cellular metals and metal foams. Prog. Mater. Sci. 46, 559 (2001).2. V. Shapovalov: Porous metals. MRS Bull. 19, 24 (1994).
3. E.D. Spoerke, N.G.D. Murray, H. Li, L.C. Brinson, D.C. Dunand,
and S.I. Stupp: Titanium with aligned, elongated pores for
orthopedic tissue engineering applications. J. Biomed. Mater.Res., A 84, 402 (2008).
4. D.C. Dunand: Processing of titanium foams. Adv. Eng. Mater. 6,369 (2004).
5. A. Schuh, J. Luyten, R. Vidael, W. Honle, and T. Schmickal:
Porous titanium implant materials and their potential in ortho-
pedic surgery. Materialwiss. Werkstofftech. 38, 1015 (2007).
6. H. Zhang and A.I. Cooper: Aligned porous structures by direc-
tional freezing. Adv. Mater. 19, 1529 (2007).
7. S.I. Deville: Freeze-casting of porous ceramics: A review of cur-
rent achievements and issues. Adv. Eng. Mater. 10, 155 (2008).8. D. Koch, L. Andresen, T. Schmedders, and G. Grathwohl: Evolu-
tion of porosity by freeze casting and sintering of sol-gel derived
ceramics. J. Sol-Gel Sci. Technol. 26, 149 (2003).
9. S.W. Sofie and F. Dogan: Freeze casting of aqueous alumina
slurries with glycerol. J. Am. Ceram. Soc. 84, 1459 (2001).
10. K. Araki and J.W. Halloran: Room-temperature freeze casting for
ceramics with nonaqueous sublimable vehicles in the naphthalene-
camphor eutectic system. J. Am. Ceram. Soc. 87, 2014 (2004).11. Y. Chino and D.C. Dunand: Directionally freeze-cast titanium
with aligned, elongated pores. Acta Mater. 56, 105 (2008).
12. C. Coleou, B. Lesaffre, J.B. Brzoska, and F. Flin: Three-dimen-
sional snow images by x-ray microtomography. Ann. Glaciol.32, 75 (2001).
13. G.S. Do, Y. Sagara, M. Tabata, K. Kudoh, and T. Higuchi: Three-
dimensional measurement of ice crystals in frozen beef with a
micro-slicer image processing system. Int. J. Refrig. 27, 184
(2004).
14. F. Flin, J.B. Brzoska, D. Coeurjolly, R.A. Pieritz, B. Lesaffre,
C. Coleou, P. Lamboley, O. Teytaud, G.L. Vignoles, and
J.F. Delesse: Adaptive estimation of normals and surface area for
discrete 3D objects: Application to snow binary data from x-ray
tomography. IEEE Trans. Image Process. 14, 585 (2005).
15. F. Flin, J.B. Brzoska, B. Lesaffre, C. Coleou, and R.A. Piertitz:
Three-dimensional geometric measurements of snow micro-
structural evolution under isothermal conditions. Ann. Glaciol.38, 39 (2004).
16. R. Mousavi, T. Miri, P.W. Cox, and P.J. Fryer: Imaging food
freezing using x-ray microtomography. Int. J. Food Sci. Technol.42, 714 (2007).
17. J. Lambert, I. Cantat, R. Delannay, A. Renault, F. Graner,
H.A. Glazier, I. Veretennikov, and P. Cloetens: Extraction of
relevant physical parameters from 3D images of foams
obtained by x-ray tomography. Colloids Surf., A: Physico-chem. Eng. Aspects 263, 295 (2005).
18. C. Monnereau and M. Vignes-Adler: Optical tomography of real
three-dimensional foams. J. Colloid Interface Sci. 202, 45
(1998).
19. H. Bart-Smith, A.F. Bastawros, D.R. Mumm, A.G. Evans,
D.J. Sypeck, and H.N.G. Wadley: Compressive deformation
and yielding mechanisms in cellular Al alloys determined
using x-ray tomography and surface strain mapping. ActaMater. 46, 3583 (1998).
20. T. Dillard, F. N’guyen, E. Maire, L. Salvo, S. Forest,
Y. Bienvenu, J.D. Bartout, M. Croset, R. Dendievel, and
P. Cloetens: 3D quantitative image analysis of open-cell nickel
foams under tension and compression loading using x-ray micro-
tomography. Philos. Mag. 85, 2147 (2005).
21. S.A. McDonald, P.M. Mummery, G. Johnson, and P.J. Withers:
Characterization of the three dimensional structure of a metallic
foam during compressive deformation. J. Microsc. 223, 150
(2006).
22. A.H. Benouali, L. Froyen, T. Dillard, S. Forest, and F. N’guyen:
Investigation on the influence of cell shape anisotropy on
the mechanical performance of closed cell aluminium foams
using microcomputed tomography. J. Mater. Sci. 40, 5801
(2005).
23. D.A. Drew: Evolution of geometric statistics. J. Appl. Math. 50,649 (1990).
24. L. Guillaume, D. Florent, and B. Atilla: Constant curvature
region decomposition of 3D-meshes by a mixed approach ver-
tex-triangle. J. WSCG 12, 245 (2004).
25. R. Mendoza, J. Alkemper, and P.W. Voorhees: The morpho-
logical evolution of dendritic microstructures during coarsening.
Metall. Mater. Trans. A 34, 481 (2003).
26. D. Kammer and P.W. Voorhees: The morphological evolution of
dendritic microstructures during coarsening. Acta Mater. 54,1549 (2006).
27. S. Deville, E. Saiz, and A.P. Tomsia: Freeze casting of hydroxy-
apatite scaffolds for bone tissue engineering. Biomaterials 27,5480 (2006).
28. J.W. Moon, H.J. Hwang, M. Awano, and K. Maeda: Preparation
of NiO–YSZ tubular support with radially aligned pore channels.
Mater. Lett. 57, 1428 (2003).
29. H. Jinnai, H. Watashiba, T. Kajihara, Y. Nishikawa, M. Takahashi,
and M. Ito: Surface curvatures of trabecular bone microarchitecture.
Bone 30, 191 (2002).30. H. Jinnai, Y. Nishikawa, M. Ito, S.D. Smith, D.A. Agard, and R.
J. Spontak: Topological similarity of sponge-like bicontinuous
morphologies differing in length scale. Adv. Mater. 14, 1615 (2002).31. Y. Kwon, K. Thornton, and P.W. Voorhees: Coarsening of bicontin-
uous structures via nonconserved and conserved dynamics. Phys.Rev. E: Stat., Nonlinear, Soft Matter Phys. 75, 021120 (2007).
J.L. Fife et al.: Morphological analysis of pores in directionally freeze-cast titanium foams
J. Mater. Res., Vol. 24, No. 1, Jan 2009124